the 2013 post-high school follow-up survey - · pdf fileresults of the 2013 post-high school...
TRANSCRIPT

Results of the 2013 Post-High School Follow-
Up Survey
August 30, 2013
Prepared for the Indiana Department of Education by:
Terry Spradlin, Director for Education Policy & Project Manager
Rachel Peterson, Graduate Research Assistant

Page ii
Center for Evaluation & Education Policy John Hitchcock, Ph.D.
Director
1900 East Tenth Street
Bloomington, IN 47406-7512
812-855-4438
More about the Center for Evaluation & Education Policy
and our publications can be found on our website:
http://ceep.indiana.edu

The 2013 Post-High School Follow-Up Survey
Page iii
Acknowledgements
The Center for Evaluation & Education Policy would like to acknowledge its business partners in
the completion of this report. First, we extend our appreciation to Briljent, LLC, who provided
the print and mail services for the survey. In particular, we are grateful to Theresa Walker, Vice
President of Procurement, for the coordination and management of the printing and mailing of
the survey.
Next, we extend our gratitude to staff from Stone Research Services, the business partner that
completed the phone surveys to compile extensive youth respondent records for this report. Key
staff from Stone Research Services included Jason Anderson, Account Manager. Jason was
responsible for the operational execution and completion of phase 2 of the research project.
Jason communicated project status to the CEEP management team, and relayed project
information from CEEP to the Bloomington Call Center. In addition we thank, Jeff Shull, Data
Processing Manager, Michelle Marks, Programmer, and Lorraine Lovig, Bloomington Call
Center Director. Jeff monitored data throughout fielding to ensure responses were being captured
correctly. Once fielding was completed Jeff merged the telephone, mail-in, and online data files
to create an overall data set. This data set was used in the creation of cross-tabulated results using
weighted tabulations. Jeff was also responsible for the text editing and coding of files used by
Stone Research Services for this project. Michelle created the CATI (Computer Assisted
Telephone Interviewing) program for interviewers to use while dialing. Michelle also processed
the sample file and loaded into the CATI software. Lorraine was responsible for the management
of the Bloomington Call Center and enforcing standard interviewing practices and quality
controls. Lorraine trained and managed interviewers and supervisory staff so that all study
specifications were met.
Finally, we would also like to thank John Hill, former Special Education Specialist, and Andrea
Lakin, Special Education Specialist, Nicole Norvell, former Director of Special Education, and
Becky Bowman, Director of Special Education, of the Indiana Department of Education, for
their guidance and collaboration on this report, especially in helping secure student contact
information from school corporations and charter high schools in the state.
The 2013 Post-High School Follow-Up Survey
Page iv
Table of Contents
Results of the Indiana Department of Education’s 2013 Post-High School Follow-Up Survey . 1
Objectives of Study Methodology ................................................................................................................................. 2
Survey Development ......................................................................................................................................................... 2
Phase 1: Mail Survey .......................................................................................................................................................... 3
Phase 2: Phone Survey...................................................................................................................................................... 3
Sample Statistics ................................................................................................................................................................. 5
Margin of Error .................................................................................................................................................................... 5
Respondent Selection and Sample Control .............................................................................................................. 6
Response Rate ...................................................................................................................................................................... 6
Survey Results ........................................................................................................................................................ 7
Statewide Aggregate Data Analysis............................................................................................................. 10
Data on Mutually Exclusive Categories of “Leavers” .......................................................................................... 10
Data for Measures/Indicators ..................................................................................................................................... 11
Weighted Geographic Data Analysis ........................................................................................................... 13
Survey Challenges and Areas for Improvement ..................................................................................... 19
Appendix A: Survey Document ..................................................................................................................... 20
Appendix B: Mutually Exclusive Categories of Leavers by District ................................................ 23

The 2013 Post-High School Follow-Up Survey
Page 1
Results of the Indiana Department of Education’s
2013 Post-High School Follow-Up Survey
In fulfillment of its contract with the Indiana Department of Education (IDOE), the Center for
Evaluation & Education Policy (CEEP) at Indiana University conducted a multi-stage survey of
young adults who are no longer in an Indiana public high school, and who had individualized
education programs (IEPs) in effect at the time they left school during or at the end of the 2011-
12 school year, to determine whether they were enrolled in post-secondary education or
employed within one year of leaving high school. In accordance with U.S. Department of
Education, Office of Special Education Programs, performance and reporting mandates
(Indicator 14), CEEP worked collaboratively with IDOE staff to develop a survey to examine the
effectiveness of Indiana’s special education services in enabling IEP students’ success after they
had exited the K-12 educational system. This study is a fact-based effort to collect post-high
school follow-up data and prepare the results for federal reporting by the Indiana Department of
Education’s Office of Special Education. The questions were adapted from federal guidelines
with the goal of determining the employment and/or educational status of former IEP students
(per 20 U.S.C. 1416(a)(3)(B)), regardless of whether they had received their high school diploma
or not. The IDOE 2013 Post-High School Follow-Up Survey represents the fourth year CEEP has
conducted this survey on behalf of the IDOE.
To initiate work on this project in 2013, staff from the IDOE ran a query of its longitudinal data
system to retrieve and compile the following information into a student contact list for this
project:
o STN
o Student Name
o Corporation of Legal Settlement Number
o Corporation of Legal Settlement Name
o Corporation of Service Number
o Corporation of Service Name
o Special Education Eligibility Category
Once a comprehensive list of approximately 9,000 names was generated, the IDOE requested
that PCG, a vendor, run an Indiana IEP report for the last known address and phone numbers of
the students. This subsequent list provided by IDOE via PCG contained approximately 5,000
student names and contact records. The CEEP Project Team proceeded to identify school
corporations and charter schools for which no student records were included in the data file and
then requested via e-mail the contact information for their former students meeting the
participation criteria for the survey. In addition, the CEEP Project Team created and sent
individual spreadsheets to the 241 school corporations and charter schools that were included in
the IDOE/PCG list to ask the school corporations to verify and update their list as needed.

The 2013 Post-High School Follow-Up Survey
Page 2
Working with school corporations CEEP finalized the master student contact list for the state in
the month of May.
Concurrently with the development of the survey instrument, and in collaboration with IDOE
staff, the CEEP Project Team ultimately requested that all 338 school corporations and charter
high schools in the state forward contact information on former IEP high school students via e-
mail to CEEP (charter high schools with no students exiting or graduating in the 2011-12 school
year did not need to submit student contact data). Contact information requested included the
student’s first and last name, home address, and telephone number. The final aggregate contact
list contained 8,899 student records.
As the survey’s target population was former high school students there was a fairly high
probability that a significant percentage of contact information would be inaccurate, and with it
some risk of sample bias. Student phone number information did prove to be inaccurate with
2,764 phone numbers, of 8,899 student contacts, identified as unusable by subcontractor Stone
Research Services. However, student mailing address information submitted by school
corporations proved to be highly accurate information. Only approximately 23 survey envelopes
of 8,899 mailed were returned as undeliverable.
Objectives of Study Methodology
This research study has three primary methodological objectives:
Serve as a standardized approach for reliable measurement of special needs students who
have exited an Indiana high school and entered the workplace and/or postsecondary
education within one year of leaving high school;
Allow for reliable comparisons to results of similar survey research projects;
Provide a research methodology that facilitates replication in the future and comparison
of results.
Survey Development History
Dr. Nathan Burroughs, former Visiting Research Associate at the Center for Evaluation &
Education Policy, developed the 2010 survey questionnaire using questions similar to those of
other post-education surveys and with the expert input of Teresa Grossi, Director of the Center
for Community Living and Careers at the Indiana Institute on Disability and Community (IIDC).
In particular, information and a data collection protocol developed by the National Post-School
Outcomes Center were carefully reviewed in preparation of the survey questionnaire. Questions
were reviewed by John Hill, former Office of Special Education Specialist with the Indiana
Department of Education. The 2010 survey questionnaire was reused in 2011, 2012, and once
again in 2013 with only minor modifications to the wording as determined by Terry Spradlin,
Project Manager, and based on prior-year data and response patterns (see Appendix A for a
sample of the 2013 survey instrument).

The 2013 Post-High School Follow-Up Survey
Page 3
Phase 1: Mail Survey
The implementation of the survey was organized into two phases. The first phase included an
online and a mail survey, and the second, a phone survey. In phase 1, a paper copy of the survey
was mailed by CEEP subcontractor Briljent, LLC, to the last known address of the entire
population of 8,899 former IEP students. Due to some delays in the receipt of student contact
information from school corporations, the mailing was issued in three waves according to when
the contact information was received. A bulk of the surveys was mailed on May 16, 2013, with
the remainder of the surveys mailed on May 23, 2013 and June 6, 2013, as additional student
contact lists were obtained from school corporations and charter high schools. Recipients were
invited to either complete the paper copy of the survey (and return it to CEEP via a pre-paid
postage envelope included with the survey), or to fill out a web version of the survey. The results
of the web and hard copy surveys were compiled by CEEP staff, who entered responses into a
central database. Data entry was cross-checked to guarantee accuracy. A total of 604 responses
were received (590 by mail and 14 online) and validated in phase 1 (any received surveys which
indicated that the respondent had neither graduated nor exited high school were excluded).
Seven surveys were received after final data analysis for the project was completed on August 6,
2013, and were excluded from the data analysis.
Phase 2: Phone Survey
In phase 2, the remaining students (those who had yet to respond to the survey) were contacted
through the phone survey. The phone survey was conducted by CEEP subcontractor Stone
Research Services. Stone Research Services provided suggestions for survey introduction and
screening and qualifying questions. The original project design called for a “census” approach in
an attempt to gather information from the largest possible number of former IEP students.
However, due to the low response rate to the mailing survey it was decided to interview a sample
of all students who had not replied to the mailing.
An initial attempt and up to six additional attempts were made to complete a contact. Sample
records were classified as exhausted after the seventh attempt. Successful contacts occurred in
two ways: contact with the specified individual or contact with a household member when the
specified individual was not available and would not be available during the duration of the
study. (In cases of contacts with household members when the individual would be available in
the future, additional attempts were scheduled to reach her/him at an agreeable time. Such
contacts with other household members were classified as unsuccessful.)
Successful contacts with the former students resulted in one of three possible outcomes:
Initial refusal to begin interview;
Interview initiated but not completed – individual refused to complete during the time
frame of the project;
Completed interview with individual.

The 2013 Post-High School Follow-Up Survey
Page 4
Successful contacts with other household members resulted in three possible outcomes:
Initial refusal to begin interview;
Interview initiated but not completed – respondent refused to complete during the time
frame of the project;
Completed interview with household member.
Unsuccessful contacts were classified as “live sample - further action” and “dead sample – no
further action.” Live samples were eligible for additional attempts if the maximum of seven
attempts was not yet met. Live sample dispositions included callbacks, no answers, answering
machines, and busy signals. Dead sample dispositions were not eligible for additional attempts.
Dead sample dispositions include operator intercepts for disconnected numbers, fax numbers,
and specified graduate no longer available at that number with no replacement telephone
number.
Telephone surveys were conducted in a controlled environment to ensure consistency of
questionnaire administration among all respondents. Operational controls employed:
Professional, experienced market research interviewers;
CATI (Computer-Assisted Telephone Interviewing) questionnaire administration;
CATI sample administration.
The CATI sample administration managed scheduling of attempts so that second and subsequent
attempts on each sample record were made during different “day parts” and on different days of
the week. “Day parts” were classified as “Day Time” (9:00 a.m. to 5:00 p.m.) and
“Weekend/Evening” (Saturday noon to 5:00 p.m.; Sunday 5:00 p.m. to 9:00 p.m.; weekday
evenings 5:00 p.m. to 9:00 p.m.). All times were based on the respondent’s local time. Field
status reports were prepared each day to summarize interviewing activity on a daily and
cumulative basis.
Data from all survey methods (mailing, phone, and online) were compiled and aggregated to a
single master data file. A data file of close-ended responses for each respondent was prepared in
a mutually agreed upon format (Excel). Text responses to any open-ended questions were coded,
edited, and formatted in an Excel file with one record per respondent. Survey results were
tabulated on a question-by-question basis with up to 18 cross-tabulations per banner. Both un-
weighted and weighted tabulation banners were provided. The weighted banner was created
using the most recent U.S. Census population counts for each of Indiana’s 92 counties. Tabulated
tables were annotated with results of statistical testing between sub-sets of specified sample
segments and with mean scores and standard deviations for rating questions. Responses were
weighted, as appropriate, by geographic classification to replicate the proportional distribution of
special education students graduating in each region and county of the state. However, only the
regional classifications (defined as northern, southern, and central Indiana) possess substantial

The 2013 Post-High School Follow-Up Survey
Page 5
validity – county-level data carry a much higher risk of sample bias due to smaller sample sizes
and the response rate.
A total of 1,528 telephone interviews were completed from a pre-identified list of respondents
assembled by CEEP staff.
Sample Statistics
Table 1. Sample Statistics from Phase 2
Sample Statistics Number Percent
Unusable records (disconnect/wrong number/fax
number)
2,764
Useable records 4,659 100%
Total separate telephone numbers dialed 7,423
Respondents Not Screened
Initial refusal 627 13%
No contact made/No contact with eligible respondent
(no answer/answering machine/busy/callback/more
than six attempts)
2,340 50%
Communication barrier/language barrier 27 <1%
Respondents Screened
Respondents not qualified (still in high school) 137 3%
Respondent qualified and interview completed 1,528 33%
Total dialings 29,641
Total dialings of useable number 26,887
Average dialings per useable number 5.77
Maximum attempts per useable number 10
Screening interviews were completed with 1,665 respondents resulting in 1,528 respondents
qualified to complete a survey and 137 respondents not qualified (still in high school).
The ratio of initial refusals to completed screening interviews (627/1,665) was 0.4:1 which is
well below the average random digit dialing ratio of 2.5:1 and the 1:1 ratio generally seen for
pre-identified sample files.
Margin of Error
Statistical accuracy of survey findings based on a 1,528 pre-identified but randomly interviewed
sample is approximately plus or minus three percentage points at the 95% confidence level. This
means that if the survey was replicated 100 times, the results of this survey will fall within plus
or minus three percentage points of the average results in 95 out of 100 times.

The 2013 Post-High School Follow-Up Survey
Page 6
Respondent Selection and Sample Control
Participants were asked for by name listed on the sample file.
Participants were screened to be out of high school.
The sample file was randomly sorted to ensure young adults from a mix of school
corporations were interviewed.
Overall Response Rate
When combining all survey responses (paper, online, phone), approximately 24 percent (2,132 of
8,899) of the former IEP students completed the survey. This relatively high response rate can be
attributed in part to working directly with local education authorities (LEAs) and parent
advocacy organizations. Before the survey was distributed, both the Indiana Department of
Education and CEEP informed schools and parents about the upcoming survey and the
importance of participation. Parents were informed that it would be an opportunity for them to
provide feedback to the state in regards to the quality of special education services that their
child had received. The statewide parent advocacy organization helped increase awareness by
including information via their website and newsletters regarding the importance of completing
the surveys.

The 2013 Post-High School Follow-Up Survey
Page 7
Survey Results
(n=2,132 respondents; includes phase 1 and 2 responses combined)
*Percentages are based on the total number of responses per question. Not all 2,132 survey
respondents were required to answer each question. A total of 12 respondents submitted
incomplete surveys and the responses they did provide are not included in the results; however,
the distribution of those incomplete responses had a negligible statistical effect on the survey
results and data analysis.
1. Have you graduated from high school or left high school for some other reason? 0% answered NO (individuals who indicated that they were still in high school were
excluded from the sample and the subsequent survey results.)
100% (2,132) answered YES
2. In the 12 months after leaving high school, have you enrolled and participated in
any school, job training, college or other education program?
40.1% (854) answered NO (these respondents were then directed to question 5)
59.9% (1,278) answered YES
3. (If yes to previous question) Did you complete an entire term? (A term can be
quarter, semester, inter-session, summer, or on-line)
16.1% (206) answered NO
83.6 % (1,069) answered YES
0.2% (3) answered DON’T KNOW
4. Describe the kind of school or job training program in which you were enrolled.
a. High school completion program (e.g., adult basic education, GED)
93.0% (1,189) answered NO
7.0% (89) answered YES
b. Short-term education or employment training program (WIA, Job
Corps)
91.9% (1,174) answered NO
8.1% (104) answered YES
c. Vocational, technical, trade school
86.6% (1,104) answered NO
13.6% (174) answered YES
d. 2-or 4-year college or university
34.4% (442) answered NO
65.4% (836) answered YES

The 2013 Post-High School Follow-Up Survey
Page 8
e. Religious or church sponsored mission
99.1% (1,266) answered NO
0.9% (12) answered YES
f. Other (specify)_________________
95.1% (1,215) answered NO
4.9% (63) answered YES
Table 2. Analysis of Question 4F
“Other” Category Number of
Respondents
Army/National Guard 15
Don't Know 20
Special Needs Program 13
Apprenticeship/Internship 11
A life skills program 2
Alternative school program 1
Home schooled 1
Total 63
5. In the 12 months after leaving high school, have you ever worked?
29.8 % (636) said NO (note: the survey was completed for anyone answering “no”)
70.1% (1,494) said YES
0.1% (2) said DON’T KNOW
6. Since leaving high school, have you worked for a total of 3 months (about 90
days)? (Days do not need to be in a row)
15.2% (227) said NO
84.8% (1,267) said YES
7. Did you work an average 20 or more hours per week? (Hours may vary from
week to week)
17.1% (255) said NO
82.9 % (1,239) said YES
8. Were you paid at least the minimum wage of $7.25 an hour?
5.4% (81) said NO
94.6% (1,413) said YES
9. Describe the job you have or have had.
a. In a company, business, or service with people with and without
disabilities

The 2013 Post-High School Follow-Up Survey
Page 9
21.4% (320) said NO
78.6% (1,174) said YES
b. In the military
97.8% (1,461) said NO
2.2% (33) said YES
c. In supported employment (paid work with support services to you and
the employer)
95.3% (1,424) said NO
4.7% (70) said YES
d. Self-employed
96.9% (1,448) said NO
3.1% (46) said YES
e. In your family’s business (farm, store, fishing, ranching, catering)
94.4% (1,411) said NO
5.6% (83) said YES
f. In sheltered employment (where most workers have disabilities)
99.0% (1,479) said NO
1.0% (15) said YES
g. Other (specify)________________
95.1% (1,421) said NO
4.9% (73) said YES
Table 3. Analysis of Question 9H
“Other” Category Number of
Respondents
Babysitting/child care 13
Working through my university/school 13
Landscaping 8
Farm work (other than family farm) 6
Government 6
Camp counselor/Boys and Girls Club 3
Cleaning houses 3
Volunteer 2
Volunteer firefighter 1
Refused 2
Don’t know 16
Total 73 * Coding by subcontractor, Stone Research Services, indicated that some “Other” responses were, in fact, one of the
pre-set responses.

The 2013 Post-High School Follow-Up Survey
Page 10
Statewide Aggregate Data Analysis
Data on Mutually Exclusive Categories of “Leavers”
1. Enrolled in Higher Education:
A total of 836, or 39.2%, of all survey respondents were enrolled in a 2- or 4-year college or
university within one year of leaving high school. Of those, 766, or 35.9%, of all respondents
were enrolled in higher education for at least one complete term. This figure represents
respondents who replied with “2- or 4-year college or university” in Question 4 (including the
four from the “Other” responses coded as “2- or 4-year college or university”) and also replied
“yes” to Question 3.
2. Competitively Employed:
A total of 1,494, or 70.1%, of respondents were employed. Of those, 946, or 44.4%, of all
respondents were employed at or above minimum wage and worked 20 hours per week or more
for at least 90 days, excluding respondents who were self-employed, working in a family
business, working in sheltered employment, or working while in jail (competitively employed).
Of those, 595, or 27.9%, of the 2,132respondents were competitively employed but were not
enrolled in higher education as defined in category #1.
3. Enrolled in Some Other Form of Post-Secondary Education or Training:
A total of 287, or 13.5%, of all respondents were enrolled in some other form of post-secondary
education for at least one term, excluding 2- or 4-year college or university. Of those, 162, or
7.6% of all respondents, were enrolled in some other form of post-secondary education or
job training for at least one semester but not competitively employed.
4. Some Other Employment:
A total of 1,267, or 59.4%, of all respondents were employed for at least 90 days at any time in
the previous year (some other employment). Of those, 321, or 15.1%, of all respondents were in
some other form of employment but not enrolled in higher education. Of those, 148, or 6.9%, of
all respondents were in some other form of employment but not enrolled in higher
education (#1), not competitively employed (#2), nor in some other form of post-secondary
education or job training (#3).

The 2013 Post-High School Follow-Up Survey
Page 11
Table 4. Summary of Data on Mutually Exclusive Categories of “Leavers”*
Category Number of Respondents Percent of All Respondents
(n=2,132)
Enrolled in Higher Education 766 35.9%
Competitively Employed 595 27.9%
Enrolled in Some Other Form
of Education or Training 162 7.6%
Some Other Employment 148 6.9%
*463, 21.7 % of all respondents, do not fit into these mutually exclusive categories of leavers. For example, a
respondent not enrolled at least one term or not employed at least 90 days would be excluded from these categories.
Data for Measures/Indicators
Further analysis generates a number of findings. Measurement A as described by 20 U.S.C.
1416(a)(3)(B) asks for the percentage of young adults enrolled in a 2- or 4-year college. A total
of 821 respondents indicated they were enrolled in such a school, while 15 responses in the
“other” category also indicated this type of enrollment, for a total of 836 or 39.2% of the 2,132
responses. Measurement A also specifies that students should be enrolled for at least one full
term. Of the 836 responses, 766, or 35.9%, of all 2,132 respondents were enrolled for at least
one full term.
Measurement B of 20 U.S.C. 1416(a)(3)(B) asks for the number of youth enrolled in higher
education (as described in Measurement A) or competitively employed. Competitive
employment includes pay at or above the minimum wage for 20 hours a week or more for at least
90 days during the year since leaving high school. Military employment and other settings with
others who are nondisabled are included. Family business, self-employment, and employment in
jail or in a sheltered workshop are excluded.
A total of 1,054, or 49.4%, of all respondents indicated that they were employed at or above the
minimum wage for 20 hours per week for at least 90 days in the previous year since leaving high
school. Once students working in family business, self-employment, and employment while in
jail or in a sheltered workshop are excluded, 946, or 44.4% of all respondents, are considered
“competitively employed.” Of these, 595 were not also enrolled in higher education as described
by Measurement A. Adding these to Measure A, 1,361, or 63.8%, of all respondents were
competitively employed or enrolled in higher education (this number also includes those that
were both competitively employed and enrolled in higher education).
Measurement C computes the percentage of young adults who were enrolled in higher
education or some other postsecondary education or training program, or competitively
employed or held some other employment during the year after leaving high school. Any “yes”
response to Question 3 was included as the type of education specified (as both definitions of

The 2013 Post-High School Follow-Up Survey
Page 12
enrollment in higher education and enrollment in some other form of post-secondary education
or job training program was limited to those enrolled for at least one complete term) . Likewise,
any “yes” response to Question 6 was considered as being competitively employed or holding
employment of some form (as both definitions are limited to those employed for at least 90
days). To prevent double-counting respondents, any persons who responded “yes” to both
questions were subtracted from the total employed (as they are already counted in the enrolled
total). Of the 2,132 total respondents, 1,664, or 78.0%, were enrolled in higher education or
some other postsecondary education or training program or competitively employed or
held some other employment during the year after leaving high school.
Of the 2,132 respondents to the post-graduate survey, 672, or 31.5%, indicated that they were
both enrolled in higher education or some other form of post-secondary education or job training
and competitively employed or in some other form of employment.
Table 5. Summary of Data for Measures/Indicators
Category Number of Respondents Percent of All Respondents
Measurement A 766 35.9%
Measurement B 1,361 63.8%
Measurement C 1,664 78.0%

The 2013 Post-High School Follow-Up Survey
Page 13
Weighted Geographic Data Analysis
In surveys of this type it is important to weight the data by region so as to adjust for any regional
skew in the response rate. If there are significant differences in the answers given by respondents
by region, and respondents from some regions happen to be more likely to respond, the overall
estimates can be quite misleading. In this particular study, the differences in the response rates
and the answers to questions between regions were relatively modest, so that weighting by
region had only a very small effect on the overall results (less than 0.1% for each region). Note
that some numbers in the following tables will not sum to the amount noted in the “total” column
due to the discrepancies from multiplying by the percentage used for weighting and due to some
respondents answering with “Don’t know.”
1. Have you graduated from high school or left high school for some other reason?
Total North Central South
Yes* 2,132 727 1,072 333
No - - - - *Individuals who indicated that they were still in high school were excluded from the sample and the subsequent
survey results.
2. In the 12 months after leaving high school, have you enrolled and participated in any school, job
training, or education program?
Total North Central South
Yes 1,278 431 658 189
No 854 296 414 145
3. If you went to college or a job training program, did you complete an entire term?
Total North Central South
Yes 1,068 359 565 143
No 207 71 92 44
0
200
400
600
800
1,000
1,200
1,400
Total North Central South
Yes
No

The 2013 Post-High School Follow-Up Survey
Page 14
4. Please describe the kind of school or job training program you were enrolled
Total North Central South
2-or 4-year college or university 838 276 434 128
Vocational, technical, trade school 172 66 79 27
High school completion program 88 31 48 9
Short-term education or employment
training program 103 35 61 7
Don’t Know 20 6 10 5
Army/National Guard 16 2 12 2
A life skills program 2 1 - 1
Apprenticeship/internship 11 3 6 1
Alternative school program 2 1 - 1
Special needs program 14 3 5 5
Home schooled 1 1 - -
Religious or church sponsored mission 12 6 3 2
None - - - -
Other - - - -
0
200
400
600
800
1,000
1,200
Total North Central South
Yes
No

The 2013 Post-High School Follow-Up Survey
Page 15
5. In the 12 months after leaving high school, have you ever worked?
Total North Central South
Yes 1,495 506 753 236
No 635 219 319 97
6. Since leaving high school, have you worked for a total of 3 months (about 90 days)? (days do not
need to be in a row)
Total North Central South
Yes 1,271 417 652 203
No 224 89 101 33
0
100
200
300
400
500
600
700
800
900
Total North Central South
2-or 4-year college or university
Vocational, technical, tradeschool
High school completion program
Short-term education oremployment training program
0
200
400
600
800
1,000
1,200
1,400
1,600
Total North Central South
Yes
No
The 2013 Post-High School Follow-Up Survey
Page 16
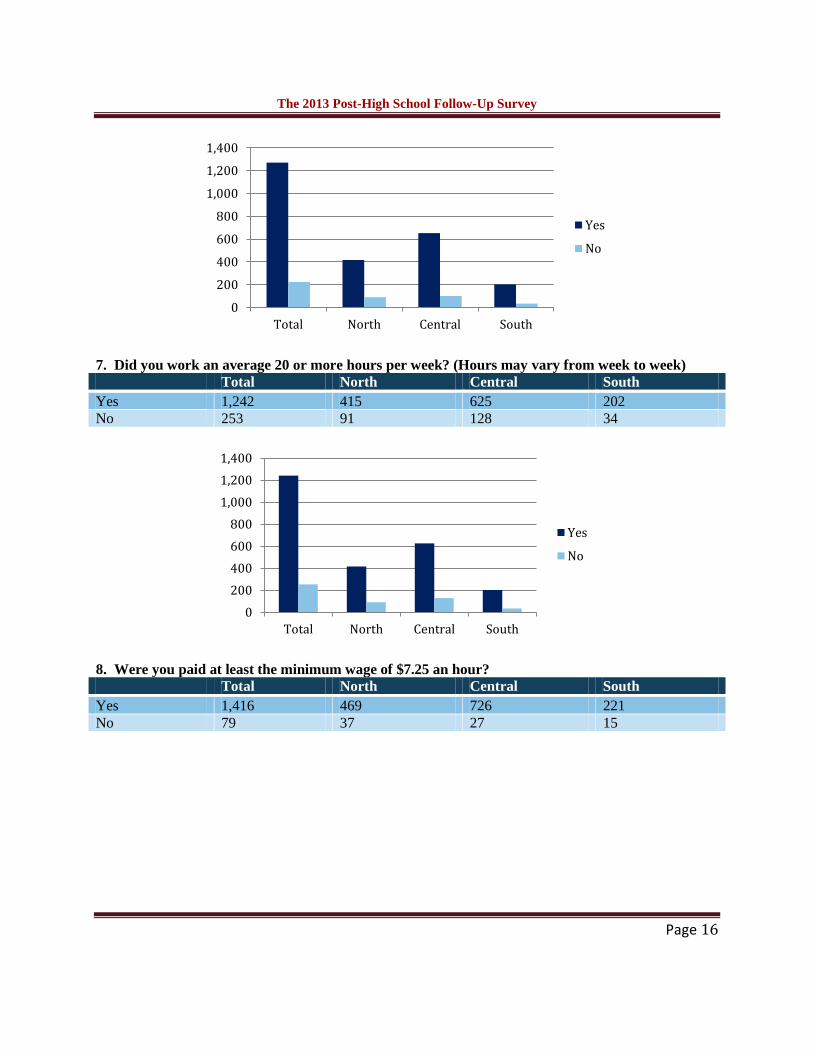
7. Did you work an average 20 or more hours per week? (Hours may vary from week to week)
Total North Central South
Yes 1,242 415 625 202
No 253 91 128 34
8. Were you paid at least the minimum wage of $7.25 an hour?
Total North Central South
Yes 1,416 469 726 221
No 79 37 27 15
0
200
400
600
800
1,000
1,200
1,400
Total North Central South
Yes
No
0
200
400
600
800
1,000
1,200
1,400
Total North Central South
Yes
No

The 2013 Post-High School Follow-Up Survey
Page 17
9. Describe the job you have or have had.
Total North Central South
In a company, business, or
service with people with and
without disabilities
1,177 392 592 193
In your family’s business 81 35 33 13
In supported employment 70 23 39 7
Self-employed 46 15 22 8
In the military 34 7 25 2
Don’t Know 15 9 6 -
Working through my
university/school 14 2 11 1
In sheltered employment 16 3 7 5
Babysitting/child care 13 4 5 4
Farm work 6 3 3 -
Camp counselor/Boys and Girls
club 3 2 1 -
Other - - - -
Volunteer 2 2 - -
Landscaping 7 5 2 -
Cleaning houses 3 2 - 1
Volunteer firefighter 1 1 - -
Farm work 6 3 3 -
None - - - -
Refused 2 1 - 1
0
200
400
600
800
1,000
1,200
1,400
1,600
Total North Central South
Yes
No

The 2013 Post-High School Follow-Up Survey
Page 18
0
200
400
600
800
1,000
1,200
1,400
In a company,business, orservice with
people with andwithout
disabilities
In your family’s business
In supportedemployment
Self-employed In the military
Total
North
Central
South

The 2013 Post-High School Follow-Up Survey
Page 19
Survey Challenges and Areas for Improvement
Two key challenges continued during the implementation of the 2013 survey. Some school
corporations were very slow to respond to IDOE and CEEP requests for student contact
information. School corporations were provided with multiple notifications and a template in
which to enter and return the data. In addition, several school corporations did not use the
template provided and failed to provide certain requested information (though these situations
were remedied relatively quickly by the school corporations). Further, some school corporations
provided contact information for people who did not qualify as former IEP students, such as
currently enrolled K-12 IEP students, although this was reduced from the previous year through
more explicit instructions provided to the school corporations. To remedy this for the 2014 Post-
High School Survey, the preliminary plan is for the IDOE to supply necessary student contact
information directly to CEEP from the state’s STN and electronic IEP student database and for
CEEP to only contact school corporations and charter high schools as needed to acquire all of the
necessary information to contact former students. Staff from the IDOE Office of Special
Education have indicated that the list they generate for CEEP should be more complete in 2014
as more school corporations and special education cooperatives use the electronic IEP system
hosted by the state.
The second difficulty during the survey administration was the seemingly low response rate,
although higher than in previous years and a realistically good number for surveys of this nature.
For the survey, the response rate was approximately 24%. However, this increased from last
year’s survey response rate of approximately 20%. This increase in the overall response rate is
primarily due to the decrease in the overall number of former IEP students reported by school
corporations from 11,766 in last year’s survey administration to 8,899 in this year’s survey
administration. The number of disconnected or otherwise inaccurate telephone numbers reduced
the response rate for the phone survey. While the nature of the target population creates inherent
challenges to data quality, the results of the survey likely have some degree of sample bias.

The 2013 Post-High School Follow-Up Survey
Page 20
Appendix A: Survey Document

The 2013 Post-High School Follow-Up Survey
Page 21
Name Address City, State, Zip Please take a moment to complete the Indiana Post-High School Outcome Survey, which is being conducted for the Indiana Department of Education. This survey is to be completed by or for former students who completed or left high school during or at the end of the 2011-12 school year (including summer school in 2012). Your information will be used to measure how well Indiana is preparing students who had Individualized Education Plans before leaving or finishing high school. The results of this survey will be given to the U.S. Department of Education. Your answers will be kept private and the results will be combined with others taking the survey so that your information will remain confidential. You may either fill out the survey and return it in the self-addressed and postage-paid envelope included with this letter OR fill it out on the web at http://ceep.indiana.edu/post/. If completing the survey on the web, please use the following school corporation #: (insert here). Please return the survey as soon as possible. Thank you for your help in completing the survey!
POST-HIGH SCHOOL OUTCOME SURVEY 1. Have you graduated from high school or left high school for some other reason? __ YES GO TO QUESTION 2 __ NO STOP: THE SURVEY IS FINISHED 2. In the 12 months after leaving high school, have you enrolled and participated in any school, job training, or education program? __ YES GO TO QUESTIONS 3 AND 4 __ NO GO TO QUESTION 5 3. Did you complete an entire term? (A term can be quarter, semester, inter-session, summer, or on-line) __ YES __ NO 4. Describe the kind of school or job training program in which you were enrolled. (CHECK ONE OPTION ONLY! If you enrolled in multiple programs, check only your primary one, or the one you were enrolled in the longest.) __ High school completion program (e.g., Adult Basic Education, GED) __ Short-term education or employment training program (e.g., WIA, Job Corps) __ Vocational, technical, trade school __ 2- or 4-year college or university

The 2013 Post-High School Follow-Up Survey
Page 22
__ Religious or church sponsored mission
__ Other (Specify): ___________________________________
5. In the 12 months after leaving high school, have you ever worked? __YES GO TO QUESTIONS 6, 7, 8, & 9 __NO STOP: THE SURVEY IS FINISHED 6. Since leaving high school, have you worked for a total of 3 months (about 90 days)? (Days do not need to be in a row) __YES __NO 7. Did you work an average 20 or more hours per week (or about half time of a 40-hour week)? (Hours may vary week to week) __YES __NO 8. Were you paid at least the minimum wage of $7.25 an hour? __YES __NO 9. Describe the job you have or have had. (CHECK ONE OPTION ONLY! If you have held more than one job, please select only your primary or most recent job.) ___ In a company, business, or service with people with and without disabilities ___ In the military ___ In supported employment (paid work with services and wage support to the employer) ___ Self-employed ___ In your family’s business (e.g., family farm, store, fishing, ranching, catering) ___ In sheltered employment (where most workers have disabilities) ___ Employed while in jail or prison ___ Other (Specify) __________________________________ Thank you very much for your participation in this survey. If you have any questions, please contact Terry Spradlin at [email protected] or call 812-855-4438.

The 2013 Post-High School Follow-Up Survey
Page 23
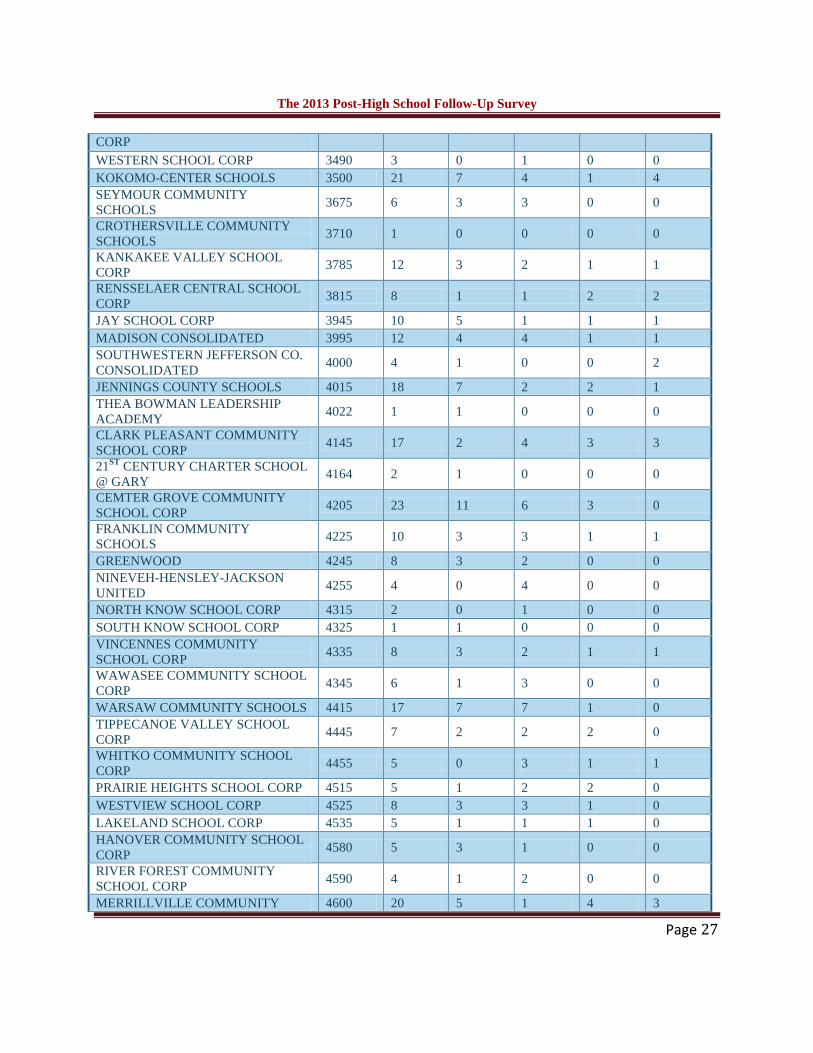
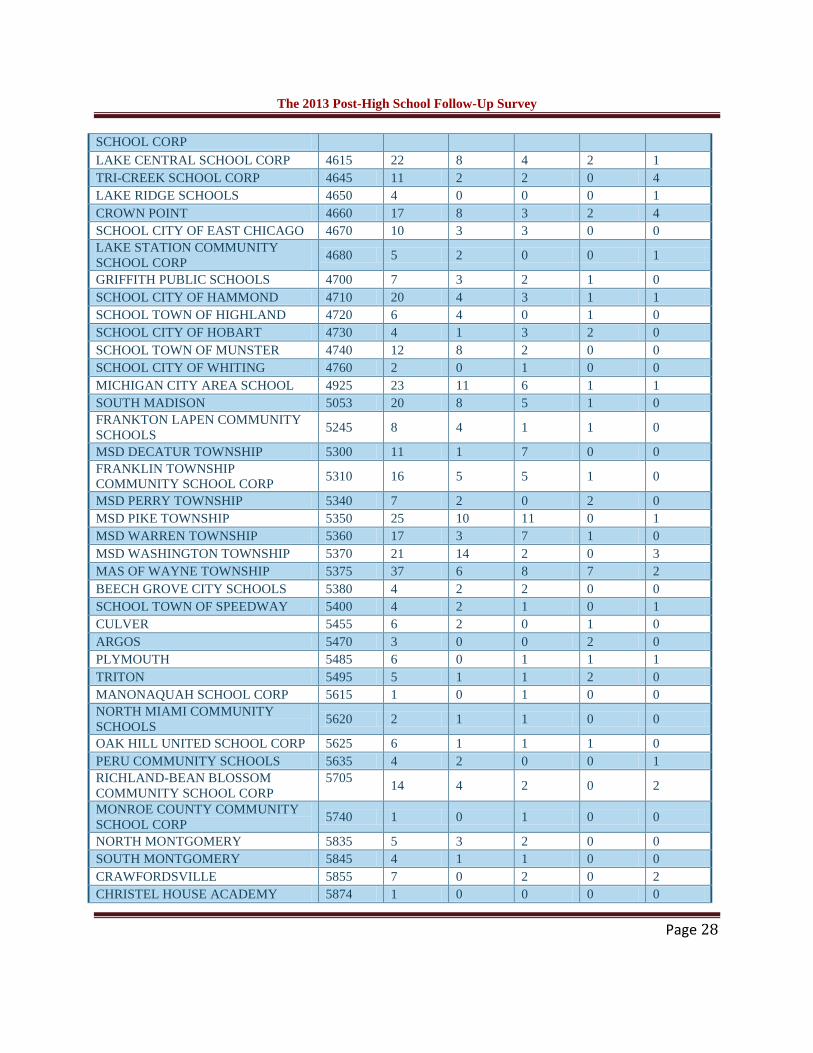
Appendix B: Mutually Exclusive Categories of Leavers by District

The 2013 Post-High School Follow-Up Survey
Page 24
Note: School corporations and charter schools are sorted by their school corporation number.
SCHOOL CORP
SC
HO
OL
CO
RP
NU
MB
ER
TO
TA
L
RE
SP
ON
DE
NT
S
EN
RO
LL
ED
IN
HIG
HE
R E
D
CO
MP
ET
ITIV
EL
Y
EM
PL
OY
ED
SO
ME
OT
HE
R
ED
UC
AT
ION
O
R
TR
AIN
ING
SO
ME
OT
HE
R
EM
PL
OY
ME
NT
ADAM CENTRAL COMMUNITY
SCHOOLS 0015 3 1 1 0 1
NORTH ADAMS COMMUNITY
SCHOOLS 0025 10 3 2 1 1
SOUTH ADAMS 0035 3 0 2 0 0
MSD SOUTHWEST ALLEN
COUNTY SCHOOLS 0125 16 10 3 2 1
CRAWFORD COUNTY
COMMUNITY SCHOOLS 130 7 1 5 0 1
NORTHWEST ALLEN COUNTY
SCHOOLS 0225 8 4 2 0 1
FT. WAYNE COMMUNITY
SCHOOLS 235 76 30 19 6 6
EAST ALLEN COUNTY SCHOOLS 0255 17 5 3 1 2
BARTHOLOMEW CON SCHOOL
CORP 0365 22 8 6 4 1
FLAT ROCK-HAWCREEK SCHOOL
CORP 370 3 1 2 0 0
BENTON COMMUNITY SCHOOL
CORP 395 8 2 4 2 0
BLACKFORD COUNTY SCHOOLS 0515 7 1 2 0 0
ZIONSVILLE COMMUNITY
SCHOOLS 630 15 9 2 2 1
LEBANON COMMUNITY SCHOOL
CORP 665 3 1 1 0 0
BROWN COUNTY SCHOOLS 670 15 3 8 1 1
CARROLL CONSOLIDATED
SCHOOL CORP 0750 3 1 2 0 0
PIONEER REGIONAL SCHOOL
CORP 0775 1 0 0 0 1
SOUTHEASTERN SCHOOL CORP 0815 3 2 1 0 0
WEST CLARK COMMUNITY
SCHOOLS 0940 10 5 4 0 0
CLARKSVILLE COMMUNITY
SCHOOL CORP 1000 5 1 2 1 1
GREATER CLARK COUNTY
SCHOOLS 1010 19 5 4 2 1
CLINTON CENTRAL SCHOOL
CORP 1150 2 0 1 1 0

The 2013 Post-High School Follow-Up Survey
Page 25
CLINTON PRAIRIE SCHOOL CORP 1160 4 1 3 0 0
COMMUNITY SCHOOLS OF
FRANKFORT 1170 8 2 1 1 1
ROSSVILLE CONSOLIDATED
SCHOOL DISTRICT 1180 3 0 2 0 0
IRVINGTON COMMUNITY
SCHOOL, INC. 1537 1 1 0 0 0
SUNMAN-DEARBORN 1560 21 10 8 0 0
SOUTH DEARBORN 1600 11 4 5 1 0
LAWRENCEBURG 1620 7 4 1 1 1
DECATUR COUNTY COMMUNITY
SCHOOLS 1655 4 2 0 0 1
GREENSBURG COMMUNITY
SCHOOL CORP 1730 6 1 2 0 1
DEKALB COUNTY EASTERN
COMMUNITY SCHOOL DISTRICTS 1805 5 0 3 0 1
GARRETT-KEYSER-BUTLER 1820 3 2 0 0 0
DEKALB COUNTY CENTRAL
UNITED SCHOOL DISTRICT 1835 5 0 4 0 0
DELAWARE COMMUNITY
SCHOOL CORP 1875 12 3 4 0 1
WES-DEL COMMUNITY SCHOOLS 1885 2 1 0 0 0
LIBERTY PERRY COMMUNITY
SCHOOLS 1895 6 2 3 0 1
COWAN COMMUNITY SCHOOL
CORP 1900 1 0 2 0 0
YORKTOWN COMMUNITY
SCHOOLS 1910 5 1 1 0 1
MUNCIE COMMUNITY SCHOOLS 1970 20 10 3 2 1
FAIRFIELD COMMUNITY
SCHOOLS 2155 5 0 1 1 2
BAUGO COMMUNITY SCHOOLS 2260 7 1 3 1 0
CONCORD COMMUNITY
SCHOOLS 2270 10 4 2 1 2
MIDDLEBURY COMMUNITY
SCHOOLS 2275 19 7 8 1 0
WANEE COMMUNITY SCHOOLS 2285 8 7 0 0 0
ELKHART COMMUNITY SCHOOLS 2305 40 12 12 3 3
GOSHEN COMMUNITY SCHOOLS 2315 17 7 3 3 1
ATTICA 2435 3 1 0 0 1
SOUTHEAST FOUNTAIN 2455 2 0 1 0 1
SOUTHERN HANCOCK 2565 12 6 4 2 0
MOUNT VERNON 2569 6 3 2 0 0
EASTERN HANCOCK 2585 4 0 1 0 0
GREENFIELD CENTRAL 2595 12 4 4 2 0
ROCHESTER COMMUNITY
SCHOOL CORP 2645 8 2 4 0 0

The 2013 Post-High School Follow-Up Survey
Page 26
CASTON 2650 2 1 0 1 0
EAST GIBSON SCHOOL CORP 2725 2 1 0 0 0
NORTH GIBSON 2735 3 1 2 0 0
SOUTH GIBSON SCHOOL CORP 2765 16 10 2 2 0
EASTBROOK SCHOOL CORP 2815 7 3 2 0 1
MADISON-GRANT UNITED
SCHOOL CORP 2825 4 1 2 1 0
MISSISSINEWA COMMUNITY
SCHOOLS 2855 8 2 4 0 1
MARION COMMUNITY SCHOOLS 2865 6 5 0 0 0
BLOOMFIELD SCHOOL DISTRICT 2920 1 0 1 0 0
MSD SHAKAMAK SCHOOLS 2960 3 1 1 0 0
WHITE RIVER VALLEY 2980 1 0 1 0 0
HAMILTON SOUTHEASTERN
SCHOOLS 3005 33 20 5 4 1
HAMILTON HEIGHTS SCHOOL
CORP 3025 6 0 4 0 0
WESTFIELD-WASHINGTON
SCHOOLS 3030 22 9 8 0 2
SHERIDAN COMMUNITY
SCHOOLS 3055 5 0 0 3 1
CARMEL CLAY SCHOOLS 3060 32 24 5 1 0
HUNTINGTON COUNTY
COMMUNITY SCHOOL CORP 3065 18 6 8 0 1
NOBLESVILLE SCHOOLS 3070 31 11 9 3 2
LANESVILLE COMMUNITY
SCHOOL CORP 3160 2 0 0 0 1
NORTH HARRISON COMMUNITY
SCHOOL CORP 3180 6 0 2 1 1
SOUTH HARRISON COMMUNITY
SCHOOLS 3190 6 1 2 0 0
NORTH WEST HENDRICKS
COMMUNITY SCHOOL CORP 3295 2 1 1 0 0
BROWNSBURG COMMUNITY
SCHOOL CORP 3305 22 12 6 1 1
AVON COMMUNITY SCHOOL
CORP 3315 20 9 8 2 0
DANVILLE COMMUNITY SCHOOL
CORP 3325 4 3 1 0 0
PLAINFIELD COMMUNITY
SCHOOL CORP 3330 3 1 1 0 1
MILL CREEK COMMUNITY
SCHOOL CORP 3335 3 3 0 0 0
BLUE RIVER VALLEY SCHOOLS 3405 3 1 0 0 0
TAYLOR COMMUNITY SCHOOL
CORP 3460 7 4 2 0 1
NORTHWESTERN SCHOOL CORP 3470 3 1 0 1 0
EASTERN HOWARD SCHOOL 3480 5 1 3 0 1
The 2013 Post-High School Follow-Up Survey
Page 27
CORP
WESTERN SCHOOL CORP 3490 3 0 1 0 0
KOKOMO-CENTER SCHOOLS 3500 21 7 4 1 4
SEYMOUR COMMUNITY
SCHOOLS 3675 6 3 3 0 0
CROTHERSVILLE COMMUNITY
SCHOOLS 3710 1 0 0 0 0
KANKAKEE VALLEY SCHOOL
CORP 3785 12 3 2 1 1
RENSSELAER CENTRAL SCHOOL
CORP 3815 8 1 1 2 2
JAY SCHOOL CORP 3945 10 5 1 1 1
MADISON CONSOLIDATED 3995 12 4 4 1 1
SOUTHWESTERN JEFFERSON CO.
CONSOLIDATED 4000 4 1 0 0 2
JENNINGS COUNTY SCHOOLS 4015 18 7 2 2 1
THEA BOWMAN LEADERSHIP
ACADEMY 4022 1 1 0 0 0
CLARK PLEASANT COMMUNITY
SCHOOL CORP 4145 17 2 4 3 3
21ST
CENTURY CHARTER SCHOOL
@ GARY 4164 2 1 0 0 0
CEMTER GROVE COMMUNITY
SCHOOL CORP 4205 23 11 6 3 0
FRANKLIN COMMUNITY
SCHOOLS 4225 10 3 3 1 1
GREENWOOD 4245 8 3 2 0 0
NINEVEH-HENSLEY-JACKSON
UNITED 4255 4 0 4 0 0
NORTH KNOW SCHOOL CORP 4315 2 0 1 0 0
SOUTH KNOW SCHOOL CORP 4325 1 1 0 0 0
VINCENNES COMMUNITY
SCHOOL CORP 4335 8 3 2 1 1
WAWASEE COMMUNITY SCHOOL
CORP 4345 6 1 3 0 0
WARSAW COMMUNITY SCHOOLS 4415 17 7 7 1 0
TIPPECANOE VALLEY SCHOOL
CORP 4445 7 2 2 2 0
WHITKO COMMUNITY SCHOOL
CORP 4455 5 0 3 1 1
PRAIRIE HEIGHTS SCHOOL CORP 4515 5 1 2 2 0
WESTVIEW SCHOOL CORP 4525 8 3 3 1 0
LAKELAND SCHOOL CORP 4535 5 1 1 1 0
HANOVER COMMUNITY SCHOOL
CORP 4580 5 3 1 0 0
RIVER FOREST COMMUNITY
SCHOOL CORP 4590 4 1 2 0 0
MERRILLVILLE COMMUNITY 4600 20 5 1 4 3
The 2013 Post-High School Follow-Up Survey
Page 28
SCHOOL CORP
LAKE CENTRAL SCHOOL CORP 4615 22 8 4 2 1
TRI-CREEK SCHOOL CORP 4645 11 2 2 0 4
LAKE RIDGE SCHOOLS 4650 4 0 0 0 1
CROWN POINT 4660 17 8 3 2 4
SCHOOL CITY OF EAST CHICAGO 4670 10 3 3 0 0
LAKE STATION COMMUNITY
SCHOOL CORP 4680 5 2 0 0 1
GRIFFITH PUBLIC SCHOOLS 4700 7 3 2 1 0
SCHOOL CITY OF HAMMOND 4710 20 4 3 1 1
SCHOOL TOWN OF HIGHLAND 4720 6 4 0 1 0
SCHOOL CITY OF HOBART 4730 4 1 3 2 0
SCHOOL TOWN OF MUNSTER 4740 12 8 2 0 0
SCHOOL CITY OF WHITING 4760 2 0 1 0 0
MICHIGAN CITY AREA SCHOOL 4925 23 11 6 1 1
SOUTH MADISON 5053 20 8 5 1 0
FRANKTON LAPEN COMMUNITY
SCHOOLS 5245 8 4 1 1 0
MSD DECATUR TOWNSHIP 5300 11 1 7 0 0
FRANKLIN TOWNSHIP
COMMUNITY SCHOOL CORP 5310 16 5 5 1 0
MSD PERRY TOWNSHIP 5340 7 2 0 2 0
MSD PIKE TOWNSHIP 5350 25 10 11 0 1
MSD WARREN TOWNSHIP 5360 17 3 7 1 0
MSD WASHINGTON TOWNSHIP 5370 21 14 2 0 3
MAS OF WAYNE TOWNSHIP 5375 37 6 8 7 2
BEECH GROVE CITY SCHOOLS 5380 4 2 2 0 0
SCHOOL TOWN OF SPEEDWAY 5400 4 2 1 0 1
CULVER 5455 6 2 0 1 0
ARGOS 5470 3 0 0 2 0
PLYMOUTH 5485 6 0 1 1 1
TRITON 5495 5 1 1 2 0
MANONAQUAH SCHOOL CORP 5615 1 0 1 0 0
NORTH MIAMI COMMUNITY
SCHOOLS 5620 2 1 1 0 0
OAK HILL UNITED SCHOOL CORP 5625 6 1 1 1 0
PERU COMMUNITY SCHOOLS 5635 4 2 0 0 1
RICHLAND-BEAN BLOSSOM
COMMUNITY SCHOOL CORP
5705
14 4 2 0 2
MONROE COUNTY COMMUNITY
SCHOOL CORP 5740 1 0 1 0 0
NORTH MONTGOMERY 5835 5 3 2 0 0
SOUTH MONTGOMERY 5845 4 1 1 0 0
CRAWFORDSVILLE 5855 7 0 2 0 2
CHRISTEL HOUSE ACADEMY 5874 1 0 0 0 0

The 2013 Post-High School Follow-Up Survey
Page 29
EMINENCE COMMUNITY SCHOOL
CORP 5910 1 0 0 0 0
MSD OF MARTINSVILLE 5925 14 3 2 2 3
MOORESVILLE CONSOLIDATED
SCHOOLS 5930 14 4 9 1 0
NORTH NEWTON SCHOOL CORP 5945 5 0 3 0 0
SOUTH NEWTON SCHOOL CORP 5995 4 0 3 1 1
CENTRAL NOBLE SCHOOL CORP 6055 6 2 3 0 0
EAST NOBLE SCHOOL CORP 6060 14 4 6 0 1
WEST NOBLE SCHOOL CORP 6065 3 0 1 1 0
RISING SUN 6080 3 1 0 1 0
PAOLI COMMUNITY SCHOOL
CORP 6155 4 1 2 0 0
SPRINGS VALLEY COMMUNITY
SCHOOL CORP 6160 3 1 2 0 0
SPENCER-OWEN COMMUNITY
SCHOOL CORP 6195 11 5 3 0 0
SOUTHWEST PARKE COMMUNITY
SCHOOL CORP 6260 3 0 2 1 0
ROCKVILLE COMMUNITY
SCHOOL CORP 6300 1 1 0 0 0
TURKEY RUN 6310 5 1 1 1 0
MONROE-GREGG 6321 3 0 2 0 1
PIKE COUNTY SCHOOL CORP 6445 2 1 0 0 0
PORTER COUNTY EDUCATION
SERVICES 6455 45 16 11 2 10
MSD OF BOONE TOWNSHIP 6460 1 0 0 0 0
DUNELAND SCHOOL CORP 6470 10 6 1 1 0
EAST PORTER COUNTY SCHOOL
CORP 6510 3 2 1 0 0
PORTWE TOWNSHIP SCHOOLS 6520 2 1 0 0 0
UNION TOWNSHIP SCHOOL CORP 6530 1 1 0 0 0
PORTAGE TOWNSHIP SCHOOLS 6550 8 1 2 0 2
VALPARAISO COMMUNITY
SCHOOLS 6560 7 3 1 1 0
MSD MT. VERNON 6590 6 2 1 0 0
MSD OF NORTH POSEY COUNTY 6600 4 2 1 1 0
NEW HARMONY TOWN AND
TOWNSHIP CONSOLIDATED
SCHOOLS
6610 1 1 0 0 0
EASTERN PULASKI 6620 1 0 1 0 0
WEST CENTRAL SCHOOL CORP 6630 3 3 0 0 0
SOUTH PUTNAM COMMUNITY
SCHOOLS 6705 5 0 2 0 1
NORTH PUTNAM COMMUNITY
SCHOOLS 6715 11 2 7 0 0
CLOVERDALE COMMUNITY 6750 4 0 1 0 0

The 2013 Post-High School Follow-Up Survey
Page 30
SCHOOL CORP
GREENCASTLE COMMUNITY
SCHOOLS 6755 8 1 5 0 1
UNION SCHOOL CORP 6795 1 0 0 1 0
RANDOLPH SOUTHERN 6805 1 0 1 0 0
MONROE CENTRAL 6820 5 2 2 1 0
RANDOLPH CENTRAL SCHOOL
CORP 6825 5 3 0 0 0
RANDOLPH EASTERN SCHOOL
CORP 6835 3 1 0 0 1
JOHN GLENN 7150 6 0 3 1 0
SOUTH BEND 7205 50 18 10 3 3
UNION NORTH 7215 2 1 0 0 0
SHELBY EASTERN 7285 3 1 1 1 0
SOUTHWESTERN CONSOLIDATED
OF SHELBY COUNTY 7360 2 1 1 0 0
SHELBYVILLE CENTRAL
SCHOOLS 7365 8 1 1 0 2
OREGON-DAVIS 7495 1 0 0 1 0
NORTH JUDSON-SAN PIERRE 7515 6 2 1 0 1
KNOX 7525 4 1 2 1 0
FREMONT COMMUNITY SCHOOLS 7605 3 2 1 0 0
HAMILTON COMMUNITY
SCHOOLS 7610 1 0 1 0 0
MSD OF STEUBEN COUNTY 7615 5 2 2 1 0
NORTHEAST SCHOOL CORP 7645 3 0 2 0 0
NORTHWEST SHELBY COUNTY 7689 7 2 2 0 2
SOUTHWEST SCHOOL CORP 7715 7 2 3 0 2
SWITZERLAND COUNTY SCHOOL
CORP 7775 2 1 1 0 0
LAFAYETTE SCHOOL CORP 7855 30 13 6 1 2
TIPPECANOE SCHOOL CORP 7865 27 13 8 0 1
WEST LAFAYETTE SCHOOL CORP 7875 8 8 0 0 0
TRI-CENTRAL COMMUNITY
SCHOOLS 7935 2 1 1 0 0
TIPTON COMMUNITY SCHOOL
CORP 7945 9 6 2 0 1
EVANSVILLE VANDERBURGH 7995 61 20 13 3 7
NORTH VERMILLION 8010 2 0 1 0 0
SOUTH VERMILLION
COMMUNITY SCHOOL CORP 8020 5 2 3 0 0
VIGO COUNTY SCHOOL CORP 8030 52 16 19 4 2
MANCHESTER COMMUNITY
SCHOOLS 8045 4 2 1 0 0
WABASH CITY SCHOOLS 8060 5 3 1 0 0
WARRICK COUNTY SCHOOL 8130 36 13 9 2 0

The 2013 Post-High School Follow-Up Survey
Page 31
CORP
SALEM COMMUNITY SCHOOLS 8205 6 0 0 1 0
EAST WASHINGTON SCHOOL
CORP 8215 3 1 1 0 1
WEST WASHINGTON SCHOOL
CORP 8220 1 0 0 1 0
RICHMOND COMMUNITY
SCHOOLS 8385 14 5 5 1 0
SOUTHERN WELLS 8425 1 0 1 0 0
NORTHERN WELLS COMMUNITY
SCHOOLS 8435 13 4 4 2 2
NORTH WHITE 8515 3 1 1 0 0
FRONTIER SCHOOL CORP 8525 3 1 0 0 0
TRI COUNTY SCHOOL CORP 8535 3 1 1 1 0
TWIN LAKES 8565 6 1 3 0 1
SMITH-GREEN COMMUNITY
SCHOOLS 8625 3 1 1 0 0
WHITLEY CO. CONSOLIDATED
SCHOOLS 8665 8 4 1 1 0
COMMUNITY MONTESSORI , INC 9320 2 1 0 0 0
FOUNTAIN SQUARE ACADEMY 9480 2 1 0 0 1
INDIANA SCHOOL FOR THE
BLIND AND VISUALLY IMPAIRED 9605 9 4 1 1 0
BURRIS LABORATORY SCHOOL 9620 2 0 1 0 0
INDIANA ACADEMY FOR
SCIENCE, MATHEMATICS, AND
HUMANITIES
9625 2 2 0 0 0
HERRON HIGH SCHOOL 9650 4 2 2 0 0
HOPE ACADEMY 9655 3 1 1 0 1
INDIANAPOLIS METROPOLITAN
HIGH SCHOOL 9670 4 2 0 0 1
HOOSIER ACADEMY VIRTUAL
SCHOOL 9865 4 2 1 0 0
ROCK CREEK COMMUNITY
ACADEMY 9875 1 1 0 0 0
DAMAR CHARTER ACADEMY 9920 1 0 1 0 0
TOTALS 2,132 766 595 161 151