table of contents - nettmagasinet om det grønne...
TRANSCRIPT


PL 018 – Power from Shore to the Ekofisk Area NOT. 14417800
Study Report May 2012 ______________________________________________________________________________________________________
Table of Contents
1 Executive Summary ...................................................................5
2 Introduction ..............................................................................8 2.1 Purpose of Study............................................................................ 8 2.2 Greater Ekofisk Area....................................................................... 9 2.3 Ula Field and Facilities..................................................................... 9 2.4 Study Basis and Background............................................................ 9
3 Power from Shore Technical Solution ......................................11 3.1 Potential for Electrification ..............................................................11 3.2 Premised Power from Shore Concept................................................11 3.3 Work Scope and Cost Estimate........................................................13 3.4 Power Transmission Losses.............................................................13 3.5 Project Implementation..................................................................14
4 Evaluation................................................................................16 4.1 Partial Electrification of Ekofisk and Eldfisk – Case 1...........................18 4.2 Partial Electrification of Ekofisk and Eldfisk including Near Term
Potential Projects – Case 2 .............................................................19 4.2.1 Case 2 Sensitivities........................................................................... 20
4.3 Impact of the Inclusion of the Ula Field in the Partial Electrification Scope – Case 3 .............................................................................21
4.3.1 Case 3 Sensitivities........................................................................... 23 4.4 Potential Future Power Requirement Example – Case 4.......................24 4.5 Uncertainties and Risks ..................................................................26
5 Conclusion ...............................................................................28
6 Abbreviations...........................................................................29
7 Attachments ............................................................................30
Attachment A – PFS Concept Identification Summary ...................31
Attachment B – Power from Shore Work Scope.............................34
Attachment C – Overview of Power Generation and Main Direct Driven Equipment in GEA...............................................................38
Attachment D – Assumptions and Premises ..................................40
References ....................................................................................44
Page iii

PL 018 – Power from Shore to the Ekofisk Area NOT. 14417800
Study Report May 2012 ______________________________________________________________________________________________________
Page iv
This report contains information received from third party fields. Such information is included herein in good faith and the PL 018 license holders make no representation or warranty as to the accuracy, interpretation or completeness thereof. Any use or reliance upon such information by readers of this report shall be at the sole risk of the reader.

PL 018 – Power from Shore to the Ekofisk Area NOT. 14417800
Study Report May 2012 ______________________________________________________________________________________________________
1 Executive Summary
In June 2011 Plans for Development and Operation (PDO) were approved for both Eldfisk II and Ekofisk South. As part of the Impact Assessment emission reduction options, electrification and partial electrification of the Ekofisk area fields were evaluated. The study showed that partial electrification is the most viable solution for the Ekofisk area due to the high Abatement Costs and extended shutdown implications of the full electrification. Partial electrification showed negative Net Present Value (NPV) for all of the evaluated scenarios, and an Abatement Cost which was no lower than 2376 NOK per tonne (discounted at 10% after tax). As a result none of the options were deemed economic and therefore were not recommended. As a condition for PDO approval of the Eldfisk II and Ekofisk South projects, an updated study of the partial electrification option for the Ekofisk area was requested. The study was to include an implementation plan, execution costs, and description of a technical solution. This report is the response to that request. Changes since the last study include the addition of a near-term Ekofisk debottlenecking project, and updates to; the Tor Redevelopment base case concept, the Ekofisk 2/4 K electrical power generator operational lifetime, the cost of CO2 as in the proposed Climate White Paper, and the onshore to offshore cable installation concept. Main conclusions are as follows:
• All cases have negative after tax NPV at a 10% real discount rate, and also at 5% and 7% real discount rates pre tax. Abatement Costs are between NOK 1499 and 6656 NOK per tonne (10% after tax and for full field life). Partial Electrification can therefore not be justified on economic merits.
• Economic merits within the 2028 license period result in a higher Abatement Cost and lower NPV than shown above.
• Based on current indicative schedules, the Ula field and possibly a Tor redevelopment may require a power solution in place by as early as 2017. For an electrification project to succeed, timely onshore regulatory approvals and early commitments in a tight market for cable procurement and cable installation vessels would be required.
The Greater Ekofisk Area has three main power generation installations, Ekofisk 2/4 J, Ekofisk 2/4 K and Eldfisk 2/7 E. The Ekofisk field was redeveloped in 1998 by use of state of the art gas turbine technology on 2/4 J. The Eldfisk field was expanded with the building of a combined water injection and gas processing platform, 2/7 E, in 2001. Here exhaust is taken from three gas turbines to generate electricity from steam (combined cycle), which was state of art technology and yields a high efficiency. The Ula field currently has three gas turbine power generators which have exceeded their original design life. A project to identify the best future power solution for the Ula facilities will shortly be initiated by the Ula license. For both Ekofisk and Eldfisk, most turbines directly drive the gas compressors or water injection pumps. Of the average 180 MW power used in the Ekofisk area, approximately 140 MW is used to directly drive equipment, i.e. not produce electricity. The remaining, approximately 40 MW, is used for producing electricity and would as such represent the
Page 5

PL 018 – Power from Shore to the Ekofisk Area NOT. 14417800
Study Report May 2012 ______________________________________________________________________________________________________
Ekofisk area’s electricity demand from a partial electrification project. The corresponding demand from Ula is 28 MW. Partial electrification for the Ekofisk, Eldfisk, and Ula fields, would replace the offshore electricity generators with power from a cable and drive all of the installed electrically operated equipment. This arrangement is the basis for the evaluations presented here. The Power from Shore concept is based on a converter station at Lista, a DC (Direct Current) cable system to Ekofisk, and power reception and distribution facilities installed on the Ekofisk 2/4 Z platform. Distribution to other fields in the area is by AC (Alternating Current) cable. The 2/4 Z platform at Ekofisk is being prepared for electrification, and is designed to have space and capacity for a 120 MW converter station, with J-tubes for pulling cables. Cost elements included are a converter station onshore, a cable connection to Ekofisk, a converter station built and lifted onboard 2/4 Z, and necessary modifications at 2/4 Z and other Ekofisk platforms. Total cost is estimated at 6528 million NOK, including investments made in 2/4 Z. This cost is partially offset against investments in power upgrades depending on the particular case. In addition, for some of the cases, AC cables and transformers for connection to nearby installations are included. Economic premises used for the evaluation are similar to those used for other PL 018 evaluations, and the Power price forecast has been provided by an external consultant. This evaluation assumes that the consumed electrical power from shore is generated without CO2 emissions (100% green power) which may not be the case. Emissions saved from the reduction in offshore fuel gas consumption may not impact global CO2 emissions, as the gas will be exported for use in continental Europe.
Several electrification cases have been evaluated. Cases have been built up showing electrification as function of maturity of fields or projects. All cases are based on a 120 MW converter which is in line with the 2/4 Z platform design. In addition, a sensitivity has been performed based on an 80 MW system for one of the lower power demand cases. The three main cases are:
1. Partial electrification of Ekofisk and Eldfisk (“Eko + Eld”)
2. Case 1 above, plus near term potential developments such as Tor Redevelopment (“GEA”)
3. Case 2 above, plus an Ula partial electrification scope (“GEA+Ula”)
In addition, a hypothetical scenario has been developed to illustrate the impact of a highly utilized 120 MW system:
4. Case 3 above, plus a potential processing hub installed in the area which would be large enough to allow several field developments to be produced, for example Tommeliten Alpha, Butch, and King Lear. (“GEA+Ula+Hub”)
This hypothetical case is highly uncertain and depends on future exploration/appraisal success (e.g. Butch and King Lear) and would therefore not be ready in time for the investment decisions for a 2017 implementation of a power from shore solution.
Page 6

PL 018 – Power from Shore to the Ekofisk Area NOT. 14417800
Study Report May 2012 ______________________________________________________________________________________________________
The table below summarizes the results of the various main cases:
Power from Shore May 2012
PFS capacity
Incremental Capex Lifetime
Total CO2 Emission Reduction
NPV 10% After Tax
Abatement Costs
NPV 7% Pre Tax
Abatement Costs
MW Million NOK
2012 Real thousand tonnes
Million 2012 NOK
2012 NOK/tonne
Million 2012 NOK
2012 NOK/tonne
2028 1638 -1585 10209 -4631 6452 Case 1 Eko + Eld 120 6528
2049 4547 -1524 6656 -4687 3770
2028 2125 -1469 7440 -4218 4673 Case 2 GEA 120 6176
2049 5936 -1400 4904 -3886 2754
2028 2125 -1115 5757 -3082 3541 Case 2 sensitivity
GEA 80MW 80 4713
2049 5936 -1047 3785 -2750 2086
2028 3792 -925 2924 -2254 1726 Case 3 GEA + Ula 120 4466
2049* 9341 -823 1997 -1704 1064
2028 5579 -913 2208 -2086 1291 Case 4 GEA + Ula+ Hub 120 4857
2049* 13633 -779 1499 -1319 792
*Ula field life is assumed to be 2040 in these cases
The results above show that a 120 MW power from shore solution does not have positive economics for any of the cases considered. Extension of the project beyond the currently approved license period improves the economics, but not enough to result in a positive Net Present Value. A sensitivity to evaluate a reduced 80 MW system scope did not yield positive economics either.
Results from a scenario that would require exploration and appraisal drilling success (Case 4) show the best economics, however, the NPV is still negative. Because this hypothetical scenario is predicated on future drilling success, it would not be ready for a 2017 installation.
Page 7

PL 018 – Power from Shore to the Ekofisk Area NOT. 14417800
Study Report May 2012 ______________________________________________________________________________________________________
2 Introduction
2.1 Purpose of Study
As part of the approval of the Plan for Development and Operation (PDO) for Ekofisk South and Eldfisk II in June 2011, a reevaluation of power from shore to the fields in the Ekofisk area was requested. The deadline for this reevaluation was set to June 1, 2012. This report provides the results and conclusions of the study that has been performed in response to the request given with the PDO approval. This work builds on previous studies related to electrification of fields in the area, with updated information regarding both the power needs and the technology basis for a Power from Shore (PFS) system. The study considers the possible partial electrification of the Ekofisk and Eldfisk fields (PL 018), partial electrification of the BP operated Ula field (PL 019A), and electricity demand from the potential redevelopment of the Tor field (PL 018 and PL 006). In addition, as requested by Authorities, the study considers possible future 3rd party opportunities in the area, including Tommeliten Alpha (PL 044) and the Butch discovery by Centrica (PL 405). Figure 2.1 below shows the location of the licenses covered by this study.
PL044
Tommeliten A
PL019A
Ula
PL405
“Butch”
PL018
Ekofisk Area fields
PL146
“King Lear”
Figure 2.1 – Area map with Ekofisk and surrounding fields
Page 8

PL 018 – Power from Shore to the Ekofisk Area NOT. 14417800
Study Report May 2012 ______________________________________________________________________________________________________
2.2 Greater Ekofisk Area
The blocks 2/4 and 2/7, which include the Ekofisk, Eldfisk, Embla and Tor fields are collectively called the “Greater Ekofisk Area” (GEA). The oil production from the fields is exported via the Norpipe oil pipeline to Teesside, UK and gas is exported via the Gassled Norpipe gas pipeline to Emden, Germany. The facilities within GEA, including the approved development projects Ekofisk South, Eldfisk II, and the Ekofisk 2/4 L Accommodation project are self supplied with power. These new development projects will include measures that will facilitate a potential future partial electrification of the GEA facilities. The Ekofisk 2/4 Z wellhead platform, part of the Ekofisk South development, has provisions in the design to house a future reception facility for receiving 120 MW of power from shore. The Eldfisk II project includes a cable connection that ties Ekofisk and Eldfisk into one common electrical grid. Information on the Ekofisk and Eldfisk power generation facilities can be found in Attachment C.
2.3 Ula Field and Facilities
The Ula field is developed with three fixed platforms. The Tambar, Blane, and Oselvar fields have been tied back to Ula. Oil from Ula is exported via Ekofisk and onwards through the Norpipe oil pipeline to UK. All gas is currently re-injected at Ula. The Ula facilities, along with the field tie-backs, are self supplied with electrical power. Ula is equipped with a power plant with three gas turbine generators. The power generators at Ula have been in operation since 1986 and the Ula License will shortly initiate a project to evaluate the alternatives for long term power supply to Ula and its connected fields. The reference concept for this evaluation is an upgrade of existing gas turbine generators and auxiliary systems. Alternative concepts will be new turbines or connection to a Power from Shore (PFS) system. In addition to the power generation turbines, Ula also has approximately 10 MW of gas turbine driven compressor trains which were installed in 2008. The indicative project schedule for an Ula power upgrade assumes that the long term power supply solution for Ula is in operation Q4 2017, and requires to be in place no later than 2020.
2.4 Study Basis and Background
A study was carried out in 2009 and 2010 in cooperation with BP, evaluating a combined PFS solution for the Ula field and the PL 018 fields. Conclusions from the study were provided in the Ekofisk South and Eldfisk II PDO documents. The study now performed is an update of the study completed in 2010, with updated premises and technical basis. The PFS solution has been matured through technical studies in cooperation with various power transmission vendors and the implementation plan has been updated accordingly. Power demand assessments have been updated, and also include sensitivities for possible future development opportunities in the area.
Page 9

PL 018 – Power from Shore to the Ekofisk Area NOT. 14417800
Study Report May 2012 ______________________________________________________________________________________________________
Main updates since the last study include:
• Updated maintenance costs to reflect Ekofisk 2/4 K power generation being in operation through to 2028
• Addition of a near-term Ekofisk Debottlenecking project for the gas lift system with a 3 MW power requirement
• Update of the Tor Redevelopment base case concept, increasing power demand
• Update of the cost of CO2 as in proposed Climate White Paper
• Update of the onshore to offshore cable installation concept to reflect qualified installation methods; resulting in two separate trenched cables
This study has evaluated solutions based on technical feasibility, cost, and schedule, in accordance with ConocoPhillips project execution process. This process is outlined in Figure 2.2 below, and covers Appraise & Select (FEL 1), Optimize (FEL 2), and Define (FEL 3), before the final investment decision (at AFE).
AFF AFD AFE _________▼_______________▼____________________▼____________________ FEL 1 FEL 2 FEL 3 Execution
Figure 2.2 – Schematic overview of ConocoPhillips project execution process Study deliverables for the base case technical solution (120 MW High Voltage Direct Current (HVDC) radial) and the base scenario assessed (i.e. partial electrification of Ekofisk and Eldfisk) have been prepared and detailed as per the Company standard for the Appraise & Select phase, also named FEL 1. The execution plan for this possible project is developed accordingly. BP has provided input to the evaluation for the Ula field and Centrica has provided input for the Butch discovery, see reference 1, 2, 3. Evaluations have been performed to the end of the current license periods for PL 018, and PL 019A which is 2028. A potential field life case has also been evaluated, and is assumed to be 2049 for Ekofisk and either 2028 or 2040 for Ula.
Page 10

PL 018 – Power from Shore to the Ekofisk Area NOT. 14417800
Study Report May 2012 ______________________________________________________________________________________________________
3 Power from Shore Technical Solution
The following section provides the basis for and a description of the technical solution premised for connecting fields in the vicinity of the GEA to the onshore power grid, with associated cost estimates and implementation plan.
3.1 Potential for Electrification
In the GEA, an average of 180 MW is currently utilized on a daily basis. From this total, approximately 140 MW is used for direct driven gas compressors or water injection pumps, where the gas power generation is connected directly to the process equipment and cannot easily be modified. The remaining, approximately 40 MW, is an electrical power demand that is supplied by the offshore power generation equipment. Further details on the installed power generation equipment and direct drive gas turbine equipment can be found in Attachment C. A full electrification would imply taking out all the gas turbines and replacing them with electrical motors which has an enormous scope with high cost and extended shut downs. This level of disruption means that it is not practical to perform full electrification on the Ekofisk, Eldfisk or Ula facilities. This level of modification will only make sense if a major redevelopment is needed, where the equipment in question would already require replacement. New build facilities which have not yet been constructed can be designed with electrical drives and power distribution to suit power from shore. See Ekofisk South and Eldfisk II PDO documents for results and conclusion of studies performed on full electrification. A partial electrification of the Ekofisk, Eldfisk, and Ula fields considers reduction in the use of the offshore gas turbine driven electrical generation systems and replacement with a power supply from a cable from shore. This scope does not require the same level of offshore modification as for full electrification, and will not require an extensive area-wide production outage to implement. Due to the issues with the implementation of full electrification, as detailed above, it has been concluded that the only practical electrification solution for the Ekofisk, Eldfisk, and Ula fields is for partial electrification. The remainder of this report covers a partial electrification concept.
3.2 Premised Power from Shore Concept
From evaluations performed, it has been concluded that the optimum concept for a potential Power from Shore solution for the areas under consideration, is a HVDC power transmission system (radial concept) with a so-called “symmetrical monopolar” configuration. See Attachment A for further details regarding the performed concept identification process. The concept includes the following main elements:
• Onshore power converter station (for conversion from AC to DC for transmission)
• Two parallel subsea DC cables from onshore to Ekofisk, both of approximately 300 km length
Page 11

PL 018 – Power from Shore to the Ekofisk Area NOT. 14417800
Study Report May 2012 ______________________________________________________________________________________________________
• Offshore facilities for receiving power from shore and distribution to offshore users, including a converter station (for conversion from DC back to AC) and distribution transformers (for AC supply to users)
• AC cable connections to offshore users
Lista has been premised in this study as the site for connection to the onshore power grid and for location of onshore facilities based on a recommendation from Statnett. It may be possible to site the onshore facilities at Feda, however this alternative could represent both cost and schedule implications. The premised offshore site for power reception and distribution facilities is the new Ekofisk 2/4 Z, utilizing available space and capacities as included for in the platform design. A PFS system rating of 120 MW has been set based on the expected maximum size of a module that will result in full utilization of the allowances included in the 2/4 Z platform design. 120 MW is assessed to be the maximum feasible to import over 2/4 Z, and will require a higher power rating onshore to account for power losses in the HVDC cable and converter stations. See Figure 3.1 below for a schematic overview of the premised concept.
1
Ekofisk
Eldfisk
Sothern Norway
2/7S
2/4K
2/4J
2/4M 2/4Z
Possible future 3rd party connections
Possible AC cable to Tor (Part of Tor
Redevelopment)
AC cable to Ula
(70 km)
2/4 Z reception & distribution facilities
Modifications at Ekofisk, incl. cable connection to 2/4J
Onshorestation
DC cable arrangement
(300 km)
Figure 3.1 – Schematic overview of premised PFS concept
Page 12

PL 018 – Power from Shore to the Ekofisk Area NOT. 14417800
Study Report May 2012 ______________________________________________________________________________________________________
3.3 Work Scope and Cost Estimate
The work required to enable partial electrification of Ekofisk and Eldfisk fields, plus installing a cable to Ula, is expected to be executed as one integrated project. The work scope and associated estimates for this project have been established based on the premised concept and in accordance with ConocoPhillips standard for an Appraise & Select phase (FEL1). The defined work scope is presented in Attachment B. The following gives the estimated costs for implementation of this work scope:
• Partial electrification of Ekofisk and Eldfisk, including PFS facilities and associated modifications at Ekofisk; 5917 million NOK, of which the onshore scope is 542 million NOK and the offshore scope is 5375 million NOK
• Power cable to Ula (excluding pull-in to Ula platform); 600 million NOK
• Pre-funding for study and FEED costs; 205 million NOK, which includes 111 million NOK of capital expenditure
The above estimates have an accuracy range of -20% to +40%. In addition to the costs above, 500 million NOK for investments made in Ekofisk 2/4 Z (i.e. space and capacity for potential PFS facilities) has been included in the economical evaluation. Modifications required at Ula for PFS implementation (including cable pull-in) is estimated to 315 million NOK. (Reference is made to BP provided estimate from 2010 escalated to 2012, see reference 1.) The Ula modifications have not been included within the integrated project, mentioned above, due to the different operating entity. All costs given above are in 2012 real figures (i.e. current day cost). The costs are laid out in time in accordance with the established project implementation plan, ref. Section 3.5 below. Tasks required for electrification of longer term potential developments, which are expected to be executed as individual projects at a later stage, are not addressed here. However, cost estimates required for the economic evaluations have also been developed for these tasks and presented under the evaluation given in Section 4.
3.4 Power Transmission Losses
Power transmission losses have been assessed based on the specific systems and arrangements premised for the PFS work scope and associated cost estimates. The following system losses have been included for in this study:
• HVDC system (transmission from onshore to offshore); 8% total based on 3% for converter stations (onshore and offshore) and 5% for the cable system
• AC transmission to Ula: 6% total
Page 13

PL 018 – Power from Shore to the Ekofisk Area NOT. 14417800
Study Report May 2012 ______________________________________________________________________________________________________
Power losses within the cables will vary with throughput. However, for simplicity, the cable loss premises are kept the same for all cases assessed as part of this study.
3.5 Project Implementation
It has been assessed that implementation of the work scope for PFS to Ekofisk with connection to Ula (ref. Section 3.2) can be implemented by 2017, as per the premised target for both Ula and the possible Tor redevelopment project. However, a 2017 implementation will require a continuous development from today to project completion, early agreements between several licenses, an efficient concession process and most likely early placement of orders for long lead items and critical resources. The deterministic schedule developed for this possible project is shown in Figure 3.2 below, and conclude on a project completion date of Q4 2017. This schedule does not include the activities to be undertaken by BP at the Ula field. However, the Ula related activities are not on the critical path and thus deemed feasible to complete within the timeframe set by this schedule. Possible issues related to alignment with the BP project process and execution plan have not been addressed in this respect. The critical path for this project follows activities related to the onshore to offshore cable connection. The project will include for fabrication and installation of 600 km of cable (2 cables each 300 km) of a total weight of approximately 17000 tonnes. Delivery times for cables are set based on information provided by vendors, but considered at risk considering the foreseen market situation with several competing projects. An extensive program for marine activities will be required, where the cable laying operation itself will require installation over two seasons (years). The installation market is especially challenging, with limited number of suited and qualified installation vessels. On this basis early commitments for cable procurement and installation vessels will most likely be required. However, the deterministic schedule shown in Figure 3.2 does not include for such. The schedule premise placements of orders at sanction and project implementation in an ordinary market environment. Other project execution activities, like onshore site construction, module fabrication and offshore modifications are not deemed critical and includes float in the schedule. Concession handling related to the onshore facilities is critical. A 22 months concession period is premised in the schedule. Given a continuation of the PFS opportunity, an immediate start of this process will be required to reach concession prior to project sanction (AFE). Implementation of this opportunity according to ConocoPhillips project execution process, will require approvals at two decision gates (AFF and AFD) prior to project sanction (final investment decision), ref. Section 2.4. Premising immediate continuation of the development work, it has been assessed that the first gate AFF can be reached by year end 2012 and AFD in Q3 2013. The estimated date for final project sanction (AFE) is mid (summer) 2014. It is assumed that a PAD (Plan for Anlegg og Drift) will be required for this possible project, and this has been included for in the schedule.
Page 14

PL 018 – Power from Shore to the Ekofisk Area NOT. 14417800
Study Report May 2012 ______________________________________________________________________________________________________
It should be noted that schedule risking has not been performed as part of this study. Inclusion of the risks mentioned above may result in a change to the project completion date.
Figure 3.2 – Deterministic schedule
Page 15

PL 018 – Power from Shore to the Ekofisk Area NOT. 14417800
Study Report May 2012 ______________________________________________________________________________________________________
4 Evaluation
For this study, the average electrical power load has been calculated by using historical power consumption data from the period 2009 to 2011. This load data has been broken down to specific consumer groups which are used for the future power demand forecast. The future production forecast, approved projects, future drilling program, future well service program, and decommissioning schedules have been utilized as the basis for assessment of the future demand for power on the GEA. See Power from Shore Evaluation - Power Demand Basis for further details of the power demand premises, reference 7. In order to evaluate the value of PFS, several representative scenarios have been performed. From the potential users of power, four cases have been developed which can be evaluated to determine the value of the potential initial PFS investment decision: 1. Partial electrification of Ekofisk and Eldfisk (“Eko + Eld”)
2. Case 1 above, plus near term potential developments such as Tor Redevelopment (“GEA”)
3. Case 2 above, plus an Ula partial electrification scope (“GEA+Ula”)
4. Case 3 above, plus a potential processing hub installed in the area which would be large enough to allow several field developments to be produced. (“GEA+Ula+Hub”)
The three main scenarios are cases 1 to 3 above, as these are based on defined projects. An additional hypothetical scenario, case 4, has been developed to illustrate the impact of a highly utilized 120 MW system based on potential discoveries and future decisions. The average offshore power demand that would be supplied through a cable from shore for the main scenarios can be seen in Figure 4.1 below, with the evaluation results given in the following sections. The power demand assumptions for the hypothetical case 4 can be found in Section 4.4. The quantity of electricity purchased will be higher than utilized offshore due to system transmission losses, ref. Section 3.4, and this purchased quantity can be seen in Figure 4.2 below. The capital cost for the PFS system used in this analysis is shown in Section 3, and applies to scenario 1 (i.e. partial electrification of Ekofisk and Eldfisk). Any additional costs and offsets applicable for the other scenarios and sensitivities are described in the relevant sections that follow. Operating costs have been included as applicable for each scenario, and details of the applied premises can be found in Attachment D. The emissions resulting from the power demand, and volume of fuel gas used which otherwise could be sold has been calculated for each scenario based on calculations derived from the current operating conditions. Details of these calculations can be found in Attachment D. For the economic evaluation, a set of price assumptions has been used which has been agreed within the PL 018 partnership. It is also premised that a PFS solution will not have
Page 16

PL 018 – Power from Shore to the Ekofisk Area NOT. 14417800
Study Report May 2012 ______________________________________________________________________________________________________
an impact on the total facilities regularity, and hence has no production implications. More details on these premises can be found in Attachment D.
Electrical Power Utilized Offshore From Partial Electrification
0.0
10.0
20.0
30.0
40.0
50.0
60.0
70.0
80.0
2015 2020 2025 2030 2035 2040 2045 2050
Ave
rage
Pow
er D
eman
d (M
W)
Partial Electrification of Ekofisk and EldfiskPartial Electrification of Ekofisk and Eldfisk including near term projects (GEA)Partial Electrification of GEA + Ula (to 2040)
Figure 4.1 – Offshore power demand covered by electricity through a cable from shore
Electricity Purchased Onshore To Supply Offshore Demand
0.0
10.0
20.0
30.0
40.0
50.0
60.0
70.0
80.0
2015 2020 2025 2030 2035 2040 2045 2050
Ave
rage
Pow
er D
eman
d (M
W)
Partial Electrification of Ekofisk and EldfiskPartial Electrification of Ekofisk and Eldfisk including near term projects (GEA)Partial Electrification of GEA + Ula (to 2040)
Figure 4.2 – Electricity purchased onshore to supply the required offshore demand
Page 17

PL 018 – Power from Shore to the Ekofisk Area NOT. 14417800
Study Report May 2012 ______________________________________________________________________________________________________
4.1 Partial Electrification of Ekofisk and Eldfisk – Case 1
The GEA facilities currently consume around 40 MW of electrical power demand, which
tion at
30-32 MW of power being taken through a potential power cable
and on Ekofisk 2/4 K, will be taken out
ic results for the PFS can be seen in Table 4.1 below.
increases to 50 MW when the new planned projects are included. Evaluations have concluded that this level of power is available within the existing infrastructure, and hence continued operations will not require any additional facilities for power generation. Details of the currently installed power generation systems can be found in Attachment C. f a PFS solution was implemented, it is premised that the steam power generaI
Eldfisk would still be operated, as this is supplied from waste heat and has zero emissions. On the Ekofisk 2/4 J platform, the gas turbine power generators include a waste heat recovery system to provide heat which is required as part of the offshore oil and gas processing. Due to the distributed nature and the modification scope required to electrify the heaters, it has been concluded that it is justified to operate one of the offshore gas generators at the minimum generation rate to provide sufficient heat, which has been estimated at 10 MW. This results in aroundfrom shore, and the profile of this demand can be seen in Figure 4.1, represented by the “Partial Electrification of Ekofisk and Eldfisk” line. he gas turbine power generators on Eldfisk 2/7 ET
of service and decommissioned if Power from Shore is installed, resulting in savings in operating cost (see Attachment D for details). The reduction in the power generated offshore will also result in fuel gas savings, and these are premised to be incremental sales gas. he economT
Power from Shore Case 1: Eko + Eld to license 2012 Case 1: Eko + Eld to 2049 expiry (2028)
Million NOK 2012 Incremental Capex Real 6528 6528
Total CO2 Emission Red ction thous nnes u and to 1638 4547
NPV 10% After Tax Million 2012 NOK -1585 -1524
Ab ts atement Cos(10 x) % After Ta 2012 NOK/tonne 10209 6656
NPV 7% Pre Tax Incl. Cost of CO 2 Tax Million 2012 NOK -4631 -4359
Abatement Costs (7% Pre Tax) 2012 NOK/tonne 6452 3770
NPV 5% Pre Tax Million 2012 NOK -4946 -4528 Incl. Cost of CO x 2 Ta
Abatement Costs (5% Pre Tax) 2012 NOK/tonne 5697 2995
Table onomic se 1 4.1 – Ec results for Ca
Page 18

PL 018 – Power from Shore to the Ekofisk Area NOT. 14417800
Study Report May 2012 ______________________________________________________________________________________________________
From the results in Table 4.1 above, it can be seen that for Case 1, the scenarios have a
4.2 Partial Electrification of Ekofisk and Eldfisk including Near
As well A, several near term opportunities
• Tor Redevelopment
ttlenecking
he Tor Redevelopment opportunity has a base case which utilizes multiphase pumping for
he Ekofisk system debottlenecking is to overcome some of the capacity constraints on
his results in an increase in demand for power through the potential cable from shore of
o provide power for these potential projects, it is assumed that a power upgrade would
ased on these premises, economics have been evaluated to determine the impact of the
negative NPV at all evaluated discount rates, and an Abatement Cost at 10% after tax of over 10000 NOK/tonne within the license period. If the project is based on full life economics, the NPV is still negative, but the Abatement Cost reduces to 6778 NOK/tonne (10% discount after tax).
Term Potential Projects – Case 2
as the current and planned projects in the GEhave been identified that will impact the power demand. These items are not yet approved, but are the most mature of the future power needs. The elements that have been identified are:
• Ekofisk System Debo
Tproduction enhancement, and based on the project load list, requires around 5 MW. Tthe Ekofisk complex to enhance production, and based on the assumption of an increase in gas lift, will require an additional 3 MW. Tapproximately 8 MW to around 40 MW, and can be seen in Figure 4.1, represented by the line “Partial Electrification of Ekofisk and Eldfisk including near term projects (GEA)”. Tbe required to increase the GEA power generation capability to cover these additional users. For this evaluation, it has been assumed that the additional power would be supplied with a new 10 MW gas turbine, including waste heat recovery, installed on the 2/4 K platform at a cost of 352 million NOK (2012 real). In the event of PFS being installed, this upgrade would not be required, and hence results in a lower incremental cost for PFS implementation. Bnear term potential projects on the base case economics. The results can be seen in Table 4.2 below.
Page 19

PL 018 – Power from Shore to the Ekofisk Area NOT. 14417800
Study Report May 2012 ______________________________________________________________________________________________________
Power from Shore Case 2: GEA to license 2012 Case 2: GEA to 2049 expiry (2028)
Million NOK 2012 Incremental Capex Real 6176 6176
Total CO2 Emission Reduction thous nnes and to 2125 5936
NPV 10% After Tax Million 2012 NOK -1469 -1400
Aba sts tement Co(10% After Tax) 2012 NOK/tonne 7440 4904
NPV 7% Pre Tax Million 2012 NOK -4218 -3886 I x ncl. Cost of CO2 Ta
Abatement Costs (7% Pre Tax) 2012 NOK/tonne 4673 2754
NPV 5% Pre Tax Million 2012 NOK -4484 -3968 In cl. Cost of CO2 Tax
Abatement Costs (5% Pre Tax) 2012 NOK/tonne 4124 2182
able 4 c results for Case 2
he results show that the addition of the near term potential projects does not bring the
.2.1 Case 2 Sensitivities
lectrical power demand is only 40 MW, a 120 MW system
or this scenario, the capital cost for the 80 MW “asymmetrical monopolar” PFS system
he economics have been performed for this sensitivity case, and the results can be seen
T .2 – Economi TNPV of the scenario to above zero at any discount rate, and has an Abatement Cost of over 7000 NOK/tonne (10% after tax) within the license period. Again, extension of the evaluation to cover the life of field improves the economics, but does not yield a positive economic project.
4
s the aA verage Case 2 offshore eis larger than may be required. Installation of a smaller capacity unit would allow an alternative concept, which would be physically too large for the platform in a 120 MW case, to be installed on the Ekofisk 2/4 Z platform. This alternative concept would use an “asymmetrical monopolar” system, with a single coaxial cable which can lead to a saving in cable installation cost. This is the same type of solution that is installed on the BP Valhall platform. An 80 MW system is thought to be sufficient to cover the average demand for Case 2 and will also allow the peak loads, which may be up to 30% higher, to be covered. An 80 MW system would be able to cover the average load for Case 3, however the peak load for this case could not be completely covered, and hence this sensitivity is only performed for Case 2. This 80 MW case can also be valid for Case 1, however due to the lower electrical demand and emissions savings, this will have lower NPV and higher Abatement Costs than the Case 2 80 MW sensitivity. Fwould be 4454 Million NOK compared to a cost for a 120 MW “symmetrical monopolar” system of 5917 million NOK, ref. Section 3.3. Tin Table 4.3 below.
Page 20

PL 018 – Power from Shore to the Ekofisk Area NOT. 14417800
Study Report May 2012 ______________________________________________________________________________________________________
Power from Shore Case 2 Sensitivity: GEA to Case 2 Sensitivity: GEA to 2012 license expiry (2028) 2049
Sensitivities 80 MW asymmetrical monopolar system
80 MW etrical asymmmonopolar system
Million NOK 2012 Incremental Capex Real 4713 4713
T 2otal CO Emission Reduction thousa nes nd ton 2125 5936
NPV 10% After Tax Million 2012 NOK -1115 -1047
Aba sts tement Co(10% After Tax) 2012 NOK/tonne 5757 3785
NPV 7% Pre Tax Million 2012 NOK -3082 -2750 In cl. Cost of CO2 Tax
Abatement Costs (7% Pre Tax) 2012 NOK/tonne 3541 2086
NPV 5% Pre Tax Million 2012 NOK -3250 -2734 In cl. Cost of CO2 Tax
Abatement Costs (5% Pre Tax) 2012 NOK/tonne 3118 1649
able Economic results for Case 2 sensitivities with an 80 MW
he economic results show that this case would improve the NPV by around 350 Million
4.3 Impact of the Inclusion of the Ula Field in the Partial
Due to ing turbines and auxiliary systems, work
la’s current license to operate is approved until 2028, and further technical studies will
etails of the information provided by BP for the Ula operating unit can be found in the
T 4.3 –“asymmetrical monopolar” system TNOK (10% after tax), but will not result in a positive economic project at any of the evaluated discount rates. Installation of a system of this size would provide sufficient power for the Ekofisk, Eldfisk, and Near Term Project needs, but would eliminate the possibility that future large facilities could be supplied through the same system.
Electrification Scope – Case 3
the ageing of the Ula Power System, includis ongoing in the Ula license to evaluate the alternative solutions for long term power supply. All alternatives are based on an average demand of 28 MW and the indicative schedule assumes operation by end of 2017 (and no later than 2020). Ube required to verify the ultimate lifetime and license to operate. Thus, two scenarios are used to estimate the potential effect of a PFS solution after 2028. DTable 4.4 below and in reference 1, 2.
Page 21
PL 018 – Power from Shore to the Ekofisk Area NOT. 14417800
Study Report May 2012 ______________________________________________________________________________________________________
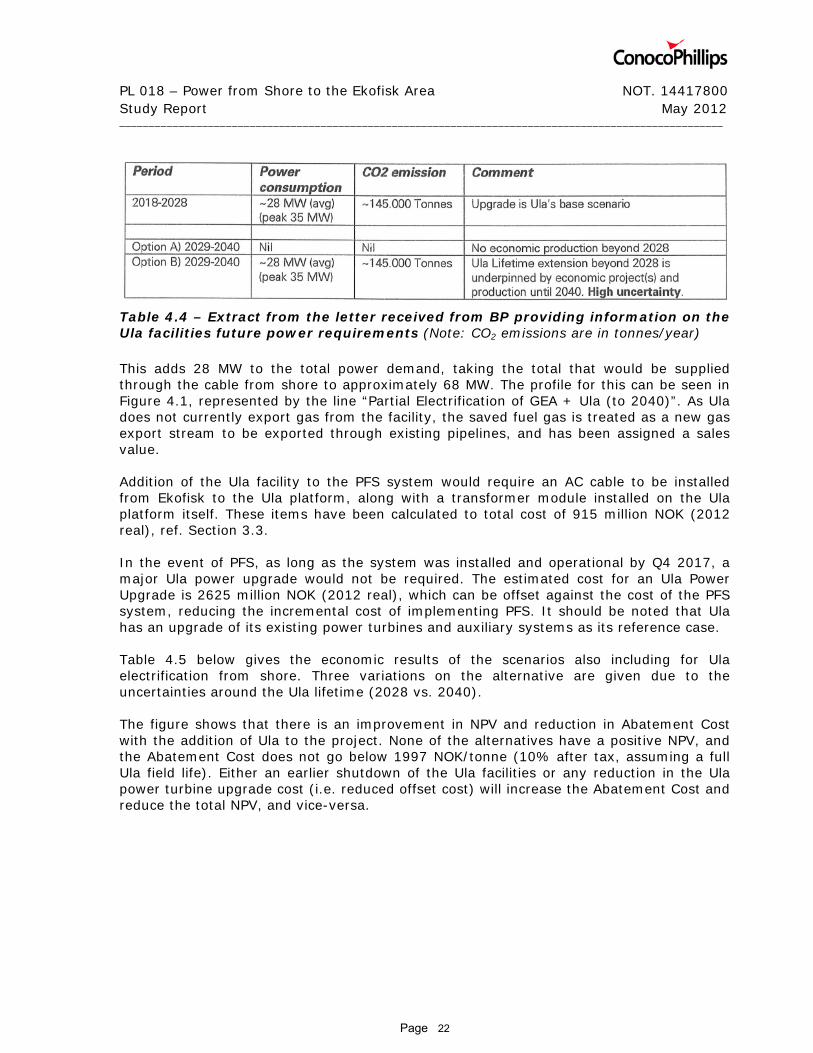
Table 4.4 – Extract from the letter received from BP providing information on the
his adds 28 MW to the total power demand, taking the total that would be supplied
ddition of the Ula facility to the PFS system would require an AC cable to be installed
the event of PFS, as long as the system was installed and operational by Q4 2017, a
able 4.5 below gives the economic results of the scenarios also including for Ula
he figure shows that there is an improvement in NPV and reduction in Abatement Cost
Ula facilities future power requirements (Note: CO2 emissions are in tonnes/year) Tthrough the cable from shore to approximately 68 MW. The profile for this can be seen in Figure 4.1, represented by the line “Partial Electrification of GEA + Ula (to 2040)”. As Ula does not currently export gas from the facility, the saved fuel gas is treated as a new gas export stream to be exported through existing pipelines, and has been assigned a sales value. Afrom Ekofisk to the Ula platform, along with a transformer module installed on the Ula platform itself. These items have been calculated to total cost of 915 million NOK (2012 real), ref. Section 3.3. Inmajor Ula power upgrade would not be required. The estimated cost for an Ula Power Upgrade is 2625 million NOK (2012 real), which can be offset against the cost of the PFS system, reducing the incremental cost of implementing PFS. It should be noted that Ula has an upgrade of its existing power turbines and auxiliary systems as its reference case. Telectrification from shore. Three variations on the alternative are given due to the uncertainties around the Ula lifetime (2028 vs. 2040). Twith the addition of Ula to the project. None of the alternatives have a positive NPV, and the Abatement Cost does not go below 1997 NOK/tonne (10% after tax, assuming a full Ula field life). Either an earlier shutdown of the Ula facilities or any reduction in the Ula power turbine upgrade cost (i.e. reduced offset cost) will increase the Abatement Cost and reduce the total NPV, and vice-versa.
Page 22

PL 018 – Power from Shore to the Ekofisk Area NOT. 14417800
Study Report May 2012 ______________________________________________________________________________________________________
Power from Shore 2012
Case 3: GEA + Ula to license expiry
(2028) Case 3: GEA to
2049 + Ula to 2028 Case 3: GEA to
2049 + Ula to 2040
Incremental Capex Million NOK 2012 Real 4466 4466 4466
Total CO2 Emission Reduction
thousand tonnes
3792 7602 9341
NPV 10% After Tax
Million 2012 NOK -925 -856 -823
Abatement Costs (10% After Tax)
2012 NOK/tonne
2924 2246 1997
NPV 7% Pre Tax Incl. Cost of CO2 Tax
Million 2012 NOK -2254 -1922 -1704
Abatement Costs (7% Pre Tax)
2012 NOK/tonne 1726 1241 1064
NPV 5% Pre Tax Incl. Cost of CO2 Tax
Million 2012 NOK -2280 -1764 -1432
Abatement Costs (5% Pre Tax)
2012 NOK/tonne 1510 1007 841
Table 4.5 – Economic results with variations on Case 3
4.3.1 Case 3 Sensitivities
Three sensitivity cases have been performed on the combined Ekofisk and Ula demand case (ref. Section 4.3 above), to cover the sensitivity to capital cost and to the economic premises. These results can be seen in Table 4.6 below.
Power from Shore 2012
Case 3: GEA to 2049 + Ula to 2040
Case 3: GEA to 2049 + Ula to 2040,
Case 3: GEA to 2049 + Ula to 2040
Sensitivities Reduced Capex 1000 million NOK
1000 million NOK Increased Capex or
reduced offset Klimakur
Assumptions
Incremental Capex Million NOK 2012 Real 3466 5466 4466
Total CO2 Emission Reduction
thousand tonnes 9341 9341 9341
NPV 10% After Tax
Million 2012 NOK -586 -1071 -1036
Abatement Costs (10% After Tax)
2012 NOK/tonne 1557 2458 2491
NPV 7% Pre Tax Incl. Cost of CO2 Tax
Million 2012 NOK -926 -2505 -2779
Abatement Costs (7% Pre Tax)
2012 NOK/tonne 793 1344 1577
NPV 5% Pre Tax Incl. Cost of CO2 Tax
Million 2012 NOK -587 -2292 -2817
Abatement Costs (5% Pre Tax)
2012 NOK/tonne 621 1065 1368
Table 4.6 – Economic results for Case 3 sensitivities
Page 23

PL 018 – Power from Shore to the Ekofisk Area NOT. 14417800
Study Report May 2012 ______________________________________________________________________________________________________
From these sensitivities, it can be seen that a reduction in Capex by 1000 million NOK will result in an improvement in NPV of around 240 million NOK (at 10% after tax), and reduction of the Abatement Cost (by approximately 440 NOK/tonne at 10%), however the project remains uneconomic. If the incremental cost increases by 1000 million NOK, either by an increase in installation or procurement cost, or through a reduction in the offset costs (i.e. a lower reference case upgrade cost), the NPV is reduced by over 240 million NOK (at 10% after tax). Usage of the Klimakur premises for gas price, electricity price, and CO2 quota price, results in a reduction in NPV by around 200 million NOK and a large increase in Abatement Cost (by around 500 NOK/t at 10%).
4.4 Potential Future Power Requirement Example – Case 4
Over and above the ongoing and planned developments, several potential future power demands have been identified within the vicinity of the Ekofisk complex. The items that have been identified are:
• Future Ekofisk Area debottlenecking/production optimization; 5-25 MW depending on method and scope.
• Replacement of diesel users at GEA; 1-5 MW depending on scope • Tommeliten Alpha; between 1.5 MW and 25 MW depending on development
concept • Centrica operated Butch discovery (PL 405/405B); between 1.5 MW and 25 MW
depending on the development concept and further exploration success • Exploration success (e.g. the Statoil operated King Lear prospect); between
1.5 MW and 25 MW depending on development concept • Regional hub (including Tommeliten Alpha + other potential developments)
(30-45 MW depending on the field developments) All of these potential developments are currently unproven and will require further evaluation to determine viability. Due to the large uncertainties in the development scopes, the required power can also change significantly, as a new field tie-back to an existing facility may only require 1.5 MW, while a standalone processing facility may take 25 MW. If any of these potential developments are found economic enough to be justified, they will also have long approval timeframes for their investment decisions. These decisions will not be completed until after the investment decision for a 2017 PFS project is required. Any large development, requiring significant electrical power, will also require a long construction period and would likely not be a demand before 2020. As the basis for the defined PFS concept is 120 MW, there is spare capacity beyond the cases shown in the previous sections. This spare capacity can be utilized for some of the potential future development options shown above. In order to evaluate the potential upside from a 120 MW system, a hypothetical case has been calculated based on high utilization of the capacity of the PFS unit. In order to fill this capacity, the hypothetical case has been defined assuming a new future processing platform being installed in the area with initial capacity for two major fields, and with additional fields being phased-in over time. This hypothetical case would result in
Page 24
PL 018 – Power from Shore to the Ekofisk Area NOT. 14417800
Study Report May 2012 ______________________________________________________________________________________________________
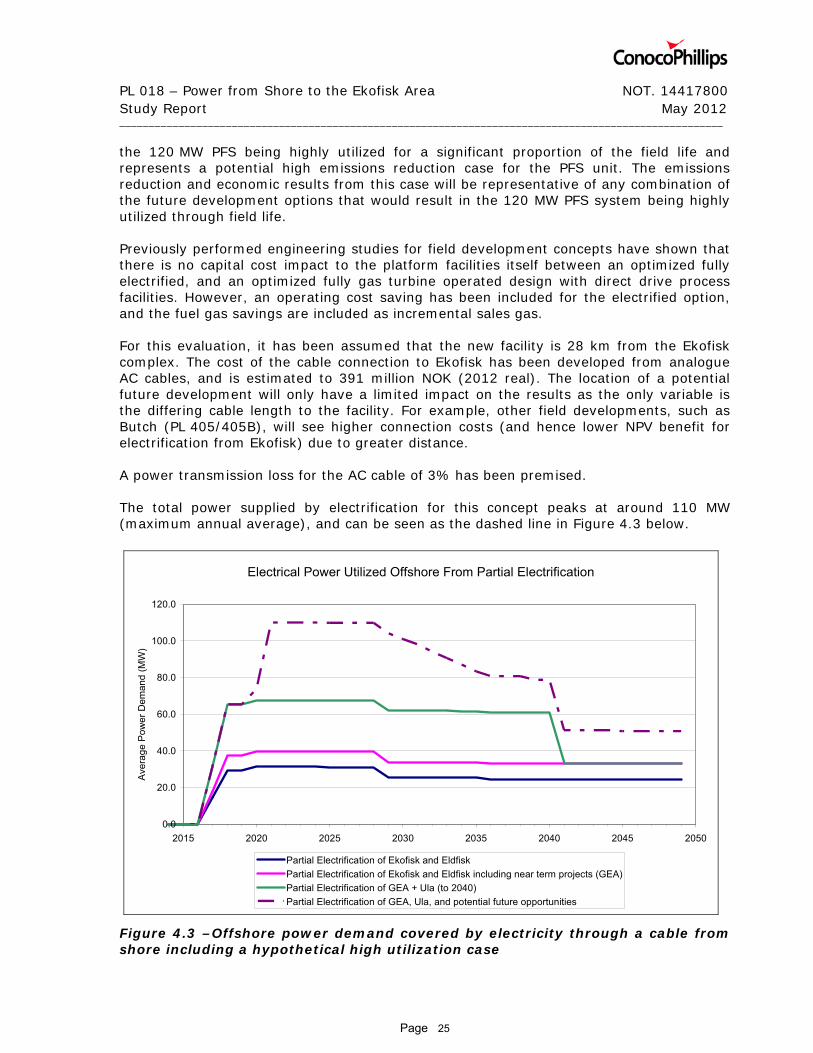
the 120 MW PFS being highly utilized for a significant proportion of the field life and represents a potential high emissions reduction case for the PFS unit. The emissions reduction and economic results from this case will be representative of any combination of the future development options that would result in the 120 MW PFS system being highly utilized through field life. Previously performed engineering studies for field development concepts have shown that there is no capital cost impact to the platform facilities itself between an optimized fully electrified, and an optimized fully gas turbine operated design with direct drive process facilities. However, an operating cost saving has been included for the electrified option, and the fuel gas savings are included as incremental sales gas. For this evaluation, it has been assumed that the new facility is 28 km from the Ekofisk complex. The cost of the cable connection to Ekofisk has been developed from analogue AC cables, and is estimated to 391 million NOK (2012 real). The location of a potential future development will only have a limited impact on the results as the only variable is the differing cable length to the facility. For example, other field developments, such as Butch (PL 405/405B), will see higher connection costs (and hence lower NPV benefit for electrification from Ekofisk) due to greater distance. A power transmission loss for the AC cable of 3% has been premised. The total power supplied by electrification for this concept peaks at around 110 MW (maximum annual average), and can be seen as the dashed line in Figure 4.3 below.
Electrical Power Utilized Offshore From Partial Electrification
0.0
20.0
40.0
60.0
80.0
100.0
120.0
2015 2020 2025 2030 2035 2040 2045 2050
Ave
rage
Pow
er D
eman
d (M
W)
Partial Electrification of Ekofisk and EldfiskPartial Electrification of Ekofisk and Eldfisk including near term projects (GEA)Partial Electrification of GEA + Ula (to 2040)Partial Electrification of GEA, Ula, and potential future opportunities
Figure 4.3 –Offshore power demand covered by electricity through a cable from shore including a hypothetical high utilization case
Page 25

PL 018 – Power from Shore to the Ekofisk Area NOT. 14417800
Study Report May 2012 ______________________________________________________________________________________________________
The economics for the example case have been evaluated for the approved license period to 2028 along with a full field life 2049 basis, and can be seen in Table 4.7 below.
Power from Shore 2012 Case 4: GEA + Ula+ future hub to license expiry (2028)
Case 4: GEA and future hub to 2049 + Ula to 2040
Incremental Capex Million NOK 2012 Real 4857 4857
Total CO2 Emission Reduction thousand tonnes 5579 13633
NPV 10% After Tax Million 2012 NOK -913 -779
Abatement Costs (10% After Tax) 2012 NOK/tonne 2208 1499
NPV 7% Pre Tax Incl. Cost of CO2 Tax Million 2012 NOK -2086 -1319
Abatement Costs (7% Pre Tax) 2012 NOK/tonne 1291 792
NPV 5% Pre Tax Incl. Cost of CO2 Tax Million 2012 NOK -2036 -849
Abatement Costs (5% Pre Tax) 2012 NOK/tonne 1118 622
Table 4.7 – Economic results for Case 4 The economics for this case show that even with high utilization of a 120 MW PFS facility to full field life and extended Ula operation, there is still no alternative with a positive NPV. The lowest Abatement Cost scenario does not go much below 1500 NOK/tonne (at 10%).
4.5 Uncertainties and Risks
There are several categories of risk/uncertainty that affect the evaluation of a PFS system. The first category is around the cost and price premises that underpin the economic evaluation. There are uncertainties around Capex, gas price, and electrical power cost. The uncertainties related to the cost of carbon and power price have a particularly large impact and may affect the result significantly. The cost of the Ula power system lifetime extension is also a large uncertainty, as the different concept options result in a large difference in the economic results, with any potential for a lower upgrade cost resulting in a higher Abatement Cost, and lower NPV for PFS (and vice versa). The second area is around the electrical power demand profile for the evaluation. Only the currently installed Ekofisk and Eldfisk power demands are known with a high confidence level. The power demand from Ula beyond 2028 is subject to the ultimate lifetime of Ula facilities which is not yet concluded, and can vary from 28 MW down to 0 MW depending on the potential economic lifetime of the field. The third area of risk and uncertainty is around the project implementation. A major risk element for the concept is cable production capacity and the suppliers’ ability to deliver and lay the AC and DC cable within the required time-frame. As this is a conceptual level evaluation, the start-up date for the module is uncertain, and schedule risks, such as the cable procurement and installation mentioned above, may affect the timing. The emissions
Page 26

PL 018 – Power from Shore to the Ekofisk Area NOT. 14417800
Study Report May 2012 ______________________________________________________________________________________________________
calculations have been calculated based on a mid-year start-up of the PFS module, however the latest schedule evaluation shows that this is likely to be overoptimistic, and hence the Abatement Cost may increase compared to the values shown earlier in Section 4. Although it has been premised that there is no regularity impact between the current operational mode and PFS, commercial issues, e.g. electrical power availability and regularity implications of the cable solution may still result in a value implication for the electrification scenario. This factor is especially critical as a 1% reduction in GEA on-time due to power outages would represent a significant revenue loss or deferment for PL 018 and 3rd party fields. Ekofisk and Eldfisk are partially mitigated against this risk, due to their installed offshore electricity generation. However, any fields without their own offshore electricity generation, for example an electrified Ula solution or potentially a new processing hub platform, will be subject to a production shutdown during a PFS outage. This additional production outage risk would reduce the on-time and therefore would have a negative economic impact to the fields in question. Full utilization of a PFS facility has improved economics compared to the known demand; however, to achieve this level of utilization will require additional exploration success in the area. If this is not achieved there will be an increase in the scenario’s Abatement Cost. Due to this uncertainty, the investment decision for a PFS solution cannot be justified premising economic benefit from these potential fields. The level of utilization may also be lower than premised, as the system will be required to cover for peak demands. Hence, the high level of utilization premised in Case 4 may not be achievable if the peak demand for the configuration is greater than 120 MW.
Page 27

PL 018 – Power from Shore to the Ekofisk Area NOT. 14417800
Study Report May 2012 ______________________________________________________________________________________________________
5 Conclusion
The level of electrification that is practical for the Ekofisk area has been evaluated. It is concluded that partial electrification is the only practical scenario due to the complexity of the modifications required to replace the non-electric equipment on the existing platforms, and the extended production shutdown requirements (including 3rd party production shutdowns). The below economic results is based on 10% discount rate, after tax. 1. Partial electrification of the Ekofisk and Eldfisk fields alone is not economic and has
negative NPV and Abatement Cost above 6500 NOK/tonne, even assuming operation until end of field life. If a Tor redevelopment and Ekofisk system debottlenecking are included, the Abatement Cost is still in excess of 4900 NOK/tonne. Use of a smaller 80 MW system for this power demand does not change the cost sufficiently to result in a positive NPV project.
2. Partial electrification of the Ekofisk fields, Tor redevelopment, and adding the Ula field
(BP operated) to the end of its approved license to operate (2028), brings the Abatement Cost to 2246 NOK/tonne. A potential extension of the Ula license to operate and lifetime may bring this Abatement Cost lower, but this scenario is not yet technical verified and/or concluded by Ula license.
3. A hypothetical scenario where a high utilization of a 120 MW system is premised takes
the Abatement Cost to just under 1500 NOK/tonne, and has a negative NPV. To obtain this high level of utilization will require three additional "large" fields to be developed within the GEA, which will require two additional exploration/ appraisal successes.
4. All the scenarios evaluated have negative NPV and high Abatement Cost and can not
be justified on economic merits. In the case where the Klimakur power price, gas price and quota price was assumed, the Abatement Cost and NPV are significantly worsened.
5. Based on the current indicative schedules the Ula field and possibly the Tor
redevelopment may require a power solution in place by 2017. For such a project to succeed, it will require early agreements between several licenses, timely achievement of onshore concession and success in a tight market for cable and cable installation vessels.
Page 28

PL 018 – Power from Shore to the Ekofisk Area NOT. 14417800
Study Report May 2012 ______________________________________________________________________________________________________
6 Abbreviations
AC Alternating Current AFD Authority for Development AFE Authority for Expenditure AFF Authority for FEED Capex Capital Expenditure CO2 Carbon Dioxide DC Direct Current Eko Ekofisk Complex Eld Eldfisk Complex FEL Front End Loading – early stages of engineering for a project GEA Greater Ekofisk Area HVDC High Voltage Direct Current Hz Hertz kV kilovolts MW Megawatt MWh Megawatt Hour NOK Norwegian Kroner NOX Nitrous Oxides NPV Net Present Value PAD Plan for Anlegg og Drift PDO Plans for Development and Operation PFS Power from Shore PL 006 Production License 006 PL 018 Production License 018 PL 019A Production License 019A PL 044 Production License 044 PL 405 Production License 405 QX Quarter X (3 month period within the year) Sm3 Standard cubic meter (at 25°C and 1 atmosphere pressure)
Page 29

PL 018 – Power from Shore to the Ekofisk Area NOT. 14417800
Study Report May 2012 ______________________________________________________________________________________________________
7 Attachments
Attachment A: PFS Concept Identification Summary
Attachment B: Power from Shore Work Scope
Attachment C: Overview of Power Generation and Main Direct Driven Equipment in GEA
Attachment D: Assumptions and Premises
Page 30

PL 018 – Power from Shore to the Ekofisk Area NOT. 14417800
Study Report May 2012 ______________________________________________________________________________________________________
Attachment A – PFS Concept Identification Summary
To determine the optimum way of configuring a Power from Shore system for Ekofisk area applications, multiple concepts have been evaluated. The concepts considered were:
• Connection to the Statnett premised interconnector between Norway and UK • High Voltage DC (HVDC) radial concept, including various alternative configurations • AC radial concept
From evaluations performed, it has been concluded that the optimum concept for a potential Power from Shore solution for the Ekofisk area, is an HVDC power transmission system (radial concept) with a so-called “symmetrical monopolar” configuration. The following provides the basis behind the concept premised for the Power from Shore evaluation. A1 - Interconnector Concept vs. Radial Concept Two options exist for the main configuration of a Power from Shore system; an interconnector concept and a radial concept. A radial concept is a term used for a direct power connection from a site (here an offshore facility) to the onshore power grid. An interconnector concept is the term for the taking of power from a cable system spanning between countries, and distributing it from a connection point in this system to the various users. Statnett has tentative plans to install a HVDC interconnector between Norway and UK, with a premised completion between 2018 and 2021, dependent on how this concept is prioritized against other Statnett cable projects. Even with the earliest premised timing, this concept will not be able to provide power to meet the premised target of project completion by 2017. It has been concluded by Statnett, that a connection to Ekofisk as an integrated part of the project scope is not currently deemed feasible; however a later connection may be technically feasible. This connection would require the installation of a conversion and distribution platform at the connection point, and installation of such will result in a shutdown of the interconnector. The latest route plan for the interconnector is also further North than previous revisions, providing technical and economic challenges for an Ekofisk connection. Considering the issues around implementation and timing, along with the commercial complexity of setting up such a system, it is concluded that such a strategy is likely not viable. On this basis, it has been concluded that a direct radial connection is the only concept that can meet the Power from Shore demand timing, and is therefore the premised system configuration.
Page 31

PL 018 – Power from Shore to the Ekofisk Area NOT. 14417800
Study Report May 2012 ______________________________________________________________________________________________________
A2 - Radial Concept Power transmission from onshore to offshore through a radial system can either be achieved by a High Voltage DC (HVDC) or an AC system, and the system itself can be configured in several different arrangements. HVDC vs. AC Radial Concept The HVDC concept is particularly convenient for transmitting large amounts of power over long distances. AC transmission systems are primarily applied when distance is limited to 100-120 km, mainly due to high power losses for long transmission distances. The Total operated Martin Linge field will use AC transmission for up to 170 km. Theoretically, both AC and DC concepts are technically feasible for Ekofisk applications. However, considering the approximate 300 km distance from onshore to Ekofisk and the voltage frequency difference between onshore and offshore (50 Hz vs. 60 Hz), an AC system for Ekofisk will always be more expensive than a HVDC concept. A concept based on AC power transmission will require more and larger facilities than a HVDC concept, and will also include technology qualification programs that will jeopardize the implementation plan for the project. Thus, an AC system is not considered viable for this PFS application. HVDC Concept Configurations A HVDC system can be provided in different configurations, dependent on required functionality. In general the industry distinguishes between what are named “monopolar” and “bipolar” configurations. A “bipolar” system can be considered when maximizing on power availability and regularity, but this is at the expense of equipment size and installation cost. Such a system will require offshore equipment far larger that what will be feasible to install on the new Ekofisk 2/4 Z platform, which is the premised host platform for possible future power intake from shore, ref. Ekofisk South PDO. For the "monopolar" system, there are two configuration alternatives:
• A "symmetrical" system alternative is operated with the voltage being equal and opposite in each cable (+/- system).
• An "asymmetrical" system alternative has operation with a positive and a zero voltage cable (+/0 system).
These options have been evaluated, in cooperation with two power transmission system vendors, to determine the optimum solution for the Ekofisk area. Both vendors proposed a “symmetrical” system aiming for as small and compact offshore platform arrangement as possible, so that this can be accommodated within the space and capacity available on the premised host platform 2/4 Z. It has been concluded that 120 MW is the largest rating for such a system that can be installed on 2/4Z. A “symmetrical” system will require a cable arrangement with two identical single core cables, operating at same voltage level but opposite in each cable (e.g. ±80 kV). See also Attachment B3 for further details regarding cables. For an “asymmetrical” system, there can be reductions in the cable scope and cost, due to the potential use of either combined (co-axial) cables or a simpler dual cable
Page 32

PL 018 – Power from Shore to the Ekofisk Area NOT. 14417800
Study Report May 2012 ______________________________________________________________________________________________________
arrangement. However, this is at the expense of a larger offshore converter module. The larger module is due to an “asymmetrical” system requiring a voltage level of approximately double that of a “symmetrical” system (e.g. +150/0 kV). This results in larger equipment than is required for a “symmetrical” system with same system power rating. Therefore, a 120 MW “asymmetrical” unit can not be accommodated on the 2/4 Z platform. Based on the premise of power reception and distribution facilities installed on the 2/4 Z platform and a system rating of 120 MW, a “symmetrical monopolar” HVDC system is recommended for Ekofisk applications. Such a system require lesser and smaller platform equipment than other alternatives. However, two power cables will be required. A system based on an “asymmetrical monopolar” configuration, as is the installed solution for Power from Shore to the Valhall field, is an alternative that could be considered for systems with lower power rating (60 – 80 MW). Such a system has been included for in a sensitivity case for a smaller 80 MW PFS system. See Technology Evaluation Summary Report - Power from Shore to Ekofisk for further details, reference 4. A3 - Premised Concept The premised concept for a potential Power from Shore solution for Ekofisk is an HVDC power transmission system (radial concept) with a so-called “symmetrical monopolar” configuration as per arguments given above. The concept is based on partial electrification of Ekofisk and Eldfisk fields plus supply to third party users. The concept includes the following main elements:
• Onshore power converter station (for conversion from AC to DC for transmission)
• Two parallel subsea DC cables from onshore to Ekofisk, both of approximately 300 km length
• Offshore facilities for receiving power from shore and distribution to offshore users, including a converter station (for conversion from DC back to AC) and distribution transformers (for AC supply to users)
• AC cable connections to offshore users
Two potential locations for the onshore station are identified; Lista or Feda. Lista has been premised in this study as the site for connection to the onshore power grid and for location of onshore facilities based on a recommendation from Statnett. This recommendation was based on the availability of power in the area, and spare capacity in existing transmission lines. The Feda location has not been evaluated as part of the study and selection of this location could represent both cost and schedule implications. The premised offshore site for power reception and distribution facilities is the new Ekofisk 2/4 Z, utilizing available space and capacities as included for in the platform design. The concept is based on a system rating of 120 MW, which is assessed to be the maximum feasible to import over 2/4 Z.
Page 33

PL 018 – Power from Shore to the Ekofisk Area NOT. 14417800
Study Report May 2012 ______________________________________________________________________________________________________
Attachment B – Power from Shore Work Scope
The scope of work for Power from Shore to Ekofisk has been defined based on the premised concept (HVDC radial concept with “symmetrical monopolar configuration), and in accordance with ConocoPhillips standard for the Appraise & Select phase (FEL1). The scope presented here includes the project tasks to be implemented to enable partial electrification of Ekofisk and Eldfisk fields and also connection to Ula, expected to be executed as one integrated project. B1 - Overall Design Premises The project scope is based on the following key premises:
• HVDC system design rating; 120 MW
• HVDC system voltage level; ±80 to ±92 kV dependent on selected vendor
• Connection to the onshore grid and location of converter station at Lista
• HVDC cable tie-in to Ekofisk 2/4 Z through preinstalled risers
• Power reception and distribution facilities on 2/4 Z as per provisions and limitations provided for in the platform functional specification
• Power distribution facilities on 2/4 Z to include transformer facilities for AC distribution to Ekofisk 2/4 J, Eldfisk 2/7 S and Ula, plus allowances for supply to possible future developments
• System design rating for AC connection to Ula; 40 MW
B2 - Onshore Facilities and Tasks The onshore work scope comprises power converter station facilities and equipment to be provided by system vendors, civil work and buildings and various other tasks. The converter station facilities and equipment scope element has been defined based on data provided by HVDC system vendors engaged in the study and also information and data provided by BP related to the Valhall Power from Shore project. The basis for the cost estimate for civil work and buildings has been established based on vendor provider data and own assessments. In addition to the above the onshore work scope includes a variety of other smaller and larger tasks, including:
• Concession handling; which is deemed as a critical task for to the execution plan
• Land acquisition
• Connection and integration with onshore power grid, water supply and sewage
• Control and telecommunication facilities and integration with onshore and offshore control centers
Page 34
PL 018 – Power from Shore to the Ekofisk Area NOT. 14417800
Study Report May 2012 ______________________________________________________________________________________________________
See Ekofisk Power from Shore - Work Scope for Onshore and Offshore Platform Facilities for further details, reference 5. B3 - Onshore to Offshore Cable Connection The concept premised requires installation of two parallel submarine cables; each of approximately 300 km. Based on initial assessments performed a cable conductor cross sectional area in the range of 630 to 1000 mm2 will be required, given the premised system rating and voltage level. The work scope defined as the basis for the cost estimate is based on a cable with conductor cross sectional area of 670 mm2, specified by a system vendor. Premising such a cable, the project will include for procurement and installation of approximately 17 000 metric tonnes of DC cable. Alternative schemes for the cable system has been evaluated; fabrication and installation of one extruded cable with two cores, simultaneous laying of two bundled cables and installation of two separate cables. The only alternative deemed qualified, considering available technology, the market for suited installation vessels, and system reliability, is installation of two separate cables. The established cost estimate is based on installation of two cables with approximately 50 m separation. An extensive program for marine activities will be required for this project. The cable laying operation itself will require installation over two seasons (years). In addition come pre and post installation activities, including pre-lay survey, debris removal and rock dumping of cable and pipeline crossings. Further, the cable scope includes cable pull-in to station onshore and to Ekofisk 2/4 Z. The HVDC cable work scope is considered the most critical element in the Power from Shore project, both in terms of cost and schedule. The market situation is challenging, both in terms of cable manufacturing and availability of qualified installation vessels. Early placement of orders, with the risks that represent, may be required. See Ekofisk Power from Shore – Subsea Cable – FEL-1 Report & Cost Estimate for further details, reference 6. B4 - Offshore Facilities and Modifications The offshore facilities work scope includes the following elements:
• New module with power reception and distribution facilities, including converter and transformers; to be fabricated at onshore yard and installed offshore by a heavy lift vessel
• Modifications on Ekofisk 2/4 Z, including preparations for module installation and module hook-up and integration
• Modifications on other Ekofisk installations related to Power from Shore implementation
The scope of the new module has been defined based on data provided by HVDC system vendors engaged in the study and also information and data provided by BP related to the
Page 35

PL 018 – Power from Shore to the Ekofisk Area NOT. 14417800
Study Report May 2012 ______________________________________________________________________________________________________
Valhall Power from Shore project. The module has been estimated to approximately 1500 metric tonnes (dry weight). The 2/4 Z modification scope comprises a variety of preparatory tasks for execution prior to module installation. This includes demolition and relocation of various facilities obstructing the module landing area, structural reinforcements and installation of new equipment, such as new cooling water pumps. The new module requires the platform crane pedestal to be extended. This task will be completed in conjunction with the module installation supported by the heavy lift vessel. The module hook-up and integration scope includes various connections with platform utility and control systems and commissioning of the new systems and facilities. The 2/4 Z modification scope is estimated to approximately 500 metric tonnes handled weight. Figure B.1 below, shows the 2/4 Z platform. The new module is premised installed on the deck area shown under the platform crane boom.
Figure B.1 – Ekofisk 2/4 Z with PFS module area
Page 36

PL 018 – Power from Shore to the Ekofisk Area NOT. 14417800
Study Report May 2012 ______________________________________________________________________________________________________
The work scope for other modifications required to facilitate for power from shore includes:
• Connection to Ekofisk 2/4 J, with installation of new high voltage cables from 2/4 Z on bridges over to 2/4 J
• Installation of electrical heaters on Ekofisk 2/4 K as a consequence of shutting down the waste heat recovery units associated with decommissioning of platform generators
This scope on 2/4 J and 2/4 K is estimated to approximately 70 metric tonnes handled weight. See Ekofisk Power from Shore - Work Scope for Onshore and Offshore Platform Facilities for further details, reference 5. B5 – Ula Platform Connection The work scope for the AC cable to Ula has been developed based on a cable suggested by vendor, in accordance with the premised system rating, a cable length of 70 km and an assumed voltage level applicable for this application. Installation of the AC cable is premised executed as an integrated program with the HVDC cable from shore. The cable work scope and estimate includes cable pull-in to Ekofisk 2/4 Z. The pull-in to Ula is premised to be executed by BP, and is part of the cost provided by BP for modifications required for electrification of Ula, ref. Letter from BP dated 20th January 2012, reference 1. See Ekofisk Power from Shore – Subsea Cable – FEL-1 Report & Cost Estimate for further details related to the AC cable installation, reference 6.
Page 37

PL 018 – Power from Shore to the Ekofisk Area NOT. 14417800
Study Report May 2012 ______________________________________________________________________________________________________
Attachment C – Overview of Power Generation and Main Direct Driven Equipment in GEA
C1 - Power Generation Setup for Greater Ekofisk Area
The arrangement of electrical power generation for the Ekofisk and Eldfisk fields will be modified in the coming years to account for the Ekofisk South, Eldfisk II, and Ekofisk 2/4 L Accommodation projects. This modification will also include an electrical cable between the Ekofisk and Eldfisk complexes which will allow power transfer between the two platforms. After the system is modified, there will be two main sources of power; Ekofisk 2/4 J with 2 x 20 MW gas turbine power generators, and Eldfisk 2/7 E with 1 x 5.2 MW gas turbine power generator and 1 x 10.3 MW steam turbine generator. It is not expected that these machines will need to be replaced within the premised full field life. The Ekofisk 2/4 K platform also has operating gas turbine power generation (3 x 3.8 MW), however this is used to cover peak and maintenance loads rather than being in full time operation. The Eldfisk 2/7 B and Tor 2/4 E platforms are self supplied with power from small diesel generators, and the 2/4 L and 2/7 S platforms have back-up diesel power generators. A list of the Power Generation equipment items can be seen in Section C2 below. Figure C.1 below provides an overview of the electrical power generation infrastructure at Greater Ekofisk Area, following implementation of approved project.
Gas turbines 2 x 20MW LM2500
Diesel Generators 2 x 2MW
Gas turbines 3 x 3.76 MW Centrax
Diesel Generators 2 x 2.16 MW
Gas turbines 5.2MW
Steam turbine 10.3MW
Diesel Generator
2 x 1,5 MW
Diesel Generator
2 x 1,5 MW
Figure C.1– Main and back-up electrical generation at Greater Ekofisk Area There are additional gas turbines in GEA that are connected directly to the process equipment for mechanical drive of gas compressors and water injection pumps. These are located on Ekofisk 2/4 J (4 x 23.3 MW turbines powering compression), Ekofisk 2/4 K (3 x 23.3 MW turbines powering water injection pumps), and Eldfisk 2/7 E (4 x 14 MW turbines powering water injection pumps and 1 x 23.3 MW turbine powering gas compression). Of this installed capacity, approximately 140 MW is used on a daily basis. A list of the Gas Turbines which used for direct drive of process equipment is given in Section C3 below.
Page 38

PL 018 – Power from Shore to the Ekofisk Area NOT. 14417800
Study Report May 2012 ______________________________________________________________________________________________________
C2 - List of Electrical Power Generation Equipment
Ekofisk 2/4 J: - 2 x 20 MW generators driven by two Gas turbines
Ekofisk 2/4 K: - 3 x 3.76 MW generators driven by three Gas turbines
Ekofisk 2/4 L: - 2 x 2 MW back-up diesel generators. (EKOL can “only” be self supplied with power
when disconnected from the grid, which means that it can not feed other platforms)
Tor 2/4 E: - 1 x 1.5 MW diesel generator - 3 x 1 MW diesel generators
Eldfisk 2/7 S: - 2 x 2 MW back-up diesel generators
Eldfisk 2/7 B: - 2 x 1.5 MW diesel generators - 4 x 1 MW diesel generators drilling (used today to power the living quarter) Eldfisk 2/7 E: - 1 x 10.3 MW generator driven by one steam turbine on waste heat - 1 x 5.2 MW generator driven by one Gas turbine C3 - List of Mechanical Direct Driven Equipment
Ekofisk 2/4 J: - 23.3 MW - Compression - Gas Pipeline / LM2500 GJ / PGT 25 - 23.3 MW - Compression - Gas Pipeline / LM2500 GJ / PGT 25 - 23.3 MW - Compression - Flash Gas / LM2500 GJ / PGT 25 - 23.3 MW - Compression - Flash Gas / LM2500 GJ / PGT 25
Ekofisk 2/4 K:
- 23.3 MW - Water Injection / LM2500 GB/IR GT61 - 23.3 MW - Water Injection / LM2500 GE/IR GT61R - 23.3 MW - Water Injection / LM2500 GE/IR GT61R
Tor 2/4 E:
- 4.1 MW - Compression - Gas Lift / Centaur 50 T-5502
Eldfisk 2/7 E: - 14 MW - Water Injection / LM1600PD DLE - 14 MW - Water Injection / LM1600PD DLE - 14 MW - Water Injection / LM1600PD DLE - 14 MW - Water Injection / LM1600PD DLE - 23.3 MW - Compression - Fuel Gas, Gas Lift, Gas Injection / LM2500 DLE / PGT25
Page 39

PL 018 – Power from Shore to the Ekofisk Area NOT. 14417800
Study Report May 2012 ______________________________________________________________________________________________________
Attachment D – Assumptions and Premises D1 - Calculation of CO2 and NOX Emissions In this study, generation of 1 MW of electrical power for 1 year (8760 hours/year) emits 5175 tonnes CO2 and 4.2 tonnes of NOX. These premises are based on shutting down gas powered electrical generation. Reference is made to Ekofisk, which uses fuel gas with a burn value of 10.689 MWh/1000Sm3 fuel. Each 1000Sm3 of fuel used results in emissions of 2.21 tonnes CO2 and 0.0018 tonnes NOX. This is based on a turbine efficiency of 35%. D2 - Calculation of Fuel Reduction In this study, generation of 1 MW for 1 year (8760 hours/year) uses 2341500 Sm3 fuel gas, based on the same burn value and efficiency premises as detailed in section 6.1. The resulting fuel gas reduction from electrification is premised to be exported as sales gas. D3 – Operating Costs The annual cost for operation and maintenance of the Power from Shore facilities connecting Ekofisk to the onshore power grid has been estimated to 7.8 million NOK. In addition, a cost of 2.2 million per year is forecasted for the first three years in operation to cover for subsea inspections of the cable system. Premised savings from a Power from Shore implementation are as follows:
• Reduced use and phase out of gas turbine power generators at Greater Ekofisk Area (ref. Section 4.1): 20.2 million NOK per year
• Partial electrification of Ula: 36 million NOK per year An additional saving of 95 million NOK in total has been identified for Ekofisk. This relates to spare parts for gas turbine generators on Ekofisk 2/4 K, that will be cancelled in the case of Power from Shore. All costs given above are in 2012 real figures (i.e. current day cost). The above costs do not include costs of power and emission costs (quota and tax). D4 – Regularity and Security of Supply Premises When operating with a Power from Shore system, the offshore facility is affected by the regularity of the supply from the onshore power grid. Evaluations have shown that the Lista onshore location, as premised in this study, has a dual connection, providing redundancy should one of the connections to that plant be lost. Due to the cable configuration that has been identified as optimum for the Ekofisk Area concept, loss of either of the cables would result in an outage of power to offshore. The need for continued operation of limited offshore generation at Ekofisk to supply heat to
Page 40

PL 018 – Power from Shore to the Ekofisk Area NOT. 14417800
Study Report May 2012 ______________________________________________________________________________________________________
the processing plant provides a level of redundancy, as the facility will be able to remain operational even in an extended shut-down from the onshore grid, or cable issues. The current electrical power generation system offshore utilizes gas turbine driven electricity generators for the majority of the electrical generation, and these units are subject to maintenance downtime. However the configuration of the total system, which includes back-up generation capacity and power management systems, results in only a minimal regularity impact from any individual generator outages. On this basis, it is concluded that there is no impact to the offshore regularity for Ekofisk and Eldfisk due to implementation of a Power from Shore system. It is therefore premised that there is no production impact from operation with a Power from Shore solution compared to the current operating mode. For fields connected to the system that do not have installed offshore generation (such as an electrified Ula solution, or potentially a future processing hub), any loss of cable power would result in a loss of production. This potential loss has not been accounted for in the evaluations. D5 – Economic Premises For the economic evaluation of Power from Shore, power and gas price assumptions have been used which are consistent with those used for other PL 018 evaluations. As for the 2011 PDO submission, the current power price has been provided by an external consultant (reference 8) based on the gas price and CO2 quota price forecast. Power transmission fees are included in all cases in this evaluation, and are based upon the Klimakur 2020 Report Attachment 1 “Energipriser” (see public report). A long term Carbon emission cost (tax + quota price) of 469 NOK/tonne has been used, taking into account increases discussed in the proposed Climate White Paper (April 2012). This has been calculated as current CO2 tax of 209 NOK/tonne plus the increase proposed in Climate White Paper of 200 NOK/tonne, in addition to current quota level of around 60 NOK/tonne. Any change in CO2 quota price is hence assumed to offset against CO2 tax going forward, in line with the intended predictability of CO2 costs in the Climate White Paper. NOX tax rate included in the evaluation is 22.8 NOK/kg. The price assumptions used for gas price, power price (including transmission fees), and Carbon emission cost in this evaluation can be seen in figure D.1 below.
Page 41

PL 018 – Power from Shore to the Ekofisk Area NOT. 14417800
Study Report May 2012 ______________________________________________________________________________________________________
2012 PfS Evaluation Price Deck
0.00
0.50
1.00
1.50
2.00
2.50
2017
2019
2021
2023
2025
2027
2029
2031
2033
2035
2037
2039
2041
2043
2045
2047
2049
Year
Pow
er (N
OK
/kW
h) a
nd G
as (N
OK
/SM
^3)
0
100
200
300
400
500
600
700
800
900
1000
Pric
e Q
uota
(NO
K/to
n)
Power price (2012 NOK/kWh) Gasprice (2012 NOK/SM^3)Co2 Quota price (2012 NOK/ton)
Figure D.1– Economic premises used in the 2012 PFS evaluation A sensitivity case has also been performed using the full price premises as given in the Klimakur 2020 report, and these can be seen in the in figure D.2 below.
Klimakur Price Deck
0.00
0.50
1.00
1.50
2.00
2.50
2017
2019
2021
2023
2025
2027
2029
2031
2033
2035
2037
2039
2041
2043
2045
2047
2049
Year
Pow
er (N
OK
/kW
h) a
nd G
as (N
OK
/SM
^3)
0
100
200
300
400
500
600
700
800
900
1000
Pric
e Q
uota
(NO
K/to
n)
Power price (2009 NOK/kWh) Klimakur Gasprice (2009 NOK/SM^3)Co2 Quota price (2009 NOK/ton)
Figure D.2– Klimakur economic premises used in the 2012 PFS evaluation sensitivity case
Page 42

PL 018 – Power from Shore to the Ekofisk Area NOT. 14417800
Study Report May 2012 ______________________________________________________________________________________________________
Onshore taxation is included for the onshore plant costs at Lista and the cost of the cable from the plant to the shoreline. BP has confirmed that declining balance depreciation of 5% is used for the Valhall field onshore costs depreciation, which is also used in this Power from Shore economic evaluation. BP Norge AS received on the 4th of February, 2005 an advanced binding ruling from the Oil Taxation Board to treat the future onshore plant for the Valhall Field DC cable connection as an asset falling under the special tax regime, with a calculated rental fee for a transfer price between onshore and offshore taxation. Also note that the economics do not reflect the fact that if the CO2 quota cost were to increase to levels substantially higher than today, e.g. approaching 500 NOK/tonne, the power prices would likely also increase as a consequence of the link between CO2 quota price and power price in the European market combined with the market link between Norway and the European power markets through current and future power cables. This would make economics even more challenging, and this negative effect is not included in this report.
Page 43

PL 018 – Power from Shore to the Ekofisk Area NOT. 14417800
Study Report May 2012 ______________________________________________________________________________________________________
Page 44
References
All references are available in License 2 Share. 1 Letter from BP dated 20th January 2012: Ekofisk South & Eldfisk II PDO Condition for Re- evaluation of Potential Power-from-Shore to Ekofisk Area 2 Letter from BP dated 20th April 2012: Ekofisk South & Eldfisk II PDO Condition for Re- evaluation of Potential Power-from-Shore to Ekofisk Area 3 Letter from Centrica dated 20th February 2012: PL 405 Butch – Power from shore 4 Technology Evaluation Summary Report - Power from Shore to Ekofisk (NCP-PP-G-00196, rev. 03) 5 Ekofisk Power from Shore - Work Scope for Onshore and Offshore Platform Facilities (NCP-PP-G-00197, rev. 01) 6 Ekofisk Power from Shore – Subsea Cable – FEL-1 Report & Cost Estimate (NCP-PP-L-00003, rev. 02) 7 Power from Shore Evaluation - Power Demand Basis (NCP-PP-G-00198, rev. 01) 8 Wholesale Power and Transmission Cost Forecast (R-2012-015)