sustainability trends and the automotive industry
TRANSCRIPT
SUSTAINABILITY TRENDS AND THE AUTOMOTIVE INDUSTRY: TRUCKIFICATION AND ELECTRIFICATION How did the world’s major automakers compare on climate impact management over the past decade?September 2020

ContentsBackground...........................................................................3
Climate risk analysis model .......................................... 5
Stage 1: Initial engagement on climate change impact .................................................................. 9
Stage 2: Building the capacity for systematic management of climate change impacts ............... 10
Stage 3: Transforming the core ..................................12
Stage 4: Competitive differentiation on decarbonization ........................................................21
Integrating the stages to reveal maturity and momentum .............................................................22
Refinitiv ESG and climate change impact maturity scores ..............................................................24

With the truckification story as the backdrop, we now turn to a broader analysis of how the major global automakers are positioned to decarbonize their fleets during this decade. This transformation will be more challenging. Greater technical and financial risks will need to be taken and even greater rewards for leaders will accrue to those automakers that come out on top.
We take a comprehensive look at the climate impact management performance of the major automakers over the previous decade.
Background
3/25

What’s needed to compare company climate change impact management capability
The approach must include change over time in company goals and intent, as well as execution on the central ESG challenge – in this case decarbonization.
The data must be granular, fact-based and product-level because in the automobile sector the most
material climate impacts (and potential improvements)result from product use and product innovations.
The analysis must be forward-looking that takes past performance, rate of change and future commitments
into a comprehensive assessment.
1
2
3
4/25
Background
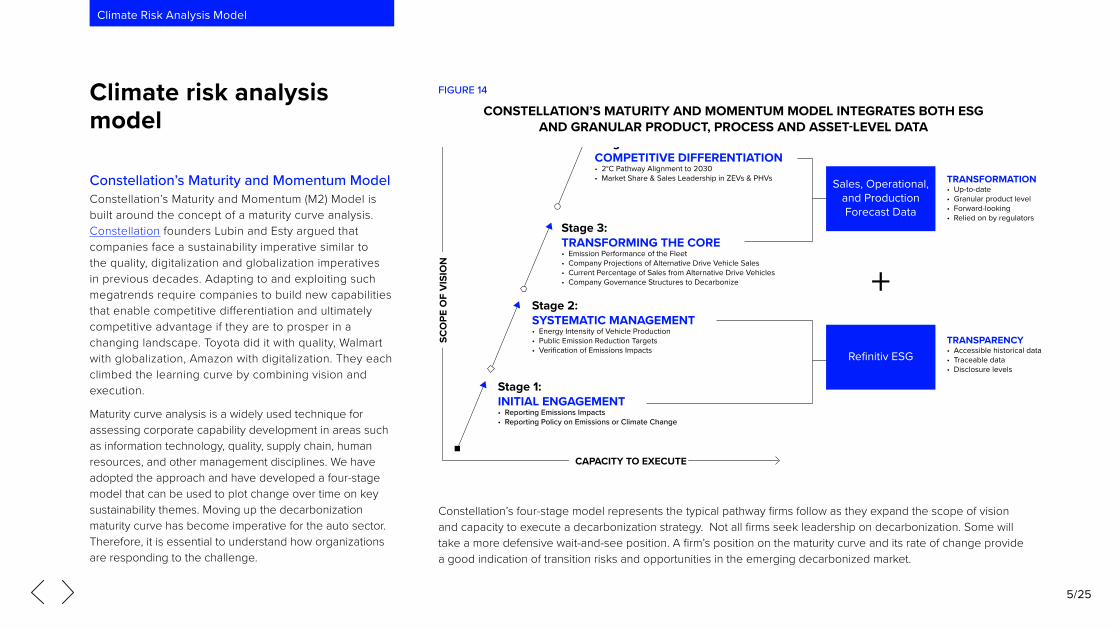
Constellation’s Maturity and Momentum ModelConstellation’s Maturity and Momentum (M2) Model is built around the concept of a maturity curve analysis. Constellation founders Lubin and Esty argued that companies face a sustainability imperative similar to the quality, digitalization and globalization imperatives in previous decades. Adapting to and exploiting such megatrends require companies to build new capabilities that enable competitive differentiation and ultimately competitive advantage if they are to prosper in a changing landscape. Toyota did it with quality, Walmart with globalization, Amazon with digitalization. They each climbed the learning curve by combining vision and execution.
Maturity curve analysis is a widely used technique for assessing corporate capability development in areas such as information technology, quality, supply chain, human resources, and other management disciplines. We have adopted the approach and have developed a four-stage model that can be used to plot change over time on key sustainability themes. Moving up the decarbonization maturity curve has become imperative for the auto sector. Therefore, it is essential to understand how organizations are responding to the challenge.
Constellation’s four-stage model represents the typical pathway firms follow as they expand the scope of vision and capacity to execute a decarbonization strategy. Not all firms seek leadership on decarbonization. Some will take a more defensive wait-and-see position. A firm’s position on the maturity curve and its rate of change provide a good indication of transition risks and opportunities in the emerging decarbonized market.
Climate risk analysis model
CAPACITY TO EXECUTE
SCO
PE O
F V
ISIO
N
Stage 1:INITIAL ENGAGEMENT• Reporting Emissions Impacts• Reporting Policy on Emissions or Climate Change
Stage 2:SYSTEMATIC MANAGEMENT• Energy Intensity of Vehicle Production• Public Emission Reduction Targets• Verification of Emissions Impacts
Stage 3:TRANSFORMING THE CORE• Emission Performance of the Fleet• Company Projections of Alternative Drive Vehicle Sales• Current Percentage of Sales from Alternative Drive Vehicles• Company Governance Structures to Decarbonize
Stage 4:COMPETITIVE DIFFERENTIATION• 2°C Pathway Alignment to 2030• Market Share & Sales Leadership in ZEVs & PHVs TRANSFORMATION
• Up-to-date• Granular product level• Forward-looking• Relied on by regulators
TRANSPARENCY• Accessible historical data• Traceable data• Disclosure levels
+
Sales, Operational,and ProductionForecast Data
Refinitiv ESG
CONSTELLATION’S MATURITY AND MOMENTUM MODEL INTEGRATES BOTH ESG AND GRANULAR PRODUCT, PROCESS AND ASSET-LEVEL DATA
FIGURE 14
5/25
Climate Risk Analysis Model

The automobile sector transformation
Stages 1 and 2 of the model reflect a firm’s initial engagement and systematic management of climate impacts, assessing the level of commitment, transparency and external reporting on these factors. Refinitiv’s ESG key performance indicators (KPIs) and relevant data points provide the information necessary to define if and when the transparency milestones in Stages 1 and 2 were disclosed by each of the automakers, with the data tracked and updated annually.
CAPACITY TO EXECUTE
SCO
PE O
F V
ISIO
N
Stage 1:INITIAL ENGAGEMENT• Reporting Emissions Impacts• Reporting Policy on Emissions or Climate Change
Stage 2:SYSTEMATIC MANAGEMENT• Energy intensity of Vehicle Production• Public Emission Reduction Targets• Verification of Emissions Impacts
Intensity
Stage 3:TRANSFORMING THE CORE• Emission Performance of the Fleet• Company Projections of Alternative Drive Vehicle Sales• Current Percentage of Sales from Alternative Drive Vehicles• Company Governance Structures to Decarbonize
Stage 4:COMPETITIVE DIFFERENTIATION• 2°C Pathway Alignment to 2030• Market Share & Sales Leadership in ZEVs & PHVs
• Estimated CO2 equivalents emission total• CO2 equivalent emission indirect, scope 3• CO2 equivalent emission indirect, scope 2• CO2 equivalent emission direct, scope 1• Target emissions• Policy emissions
Refinitiv ESG
+
Sales, Operational,and ProductionForecast Data
Refinitiv ESG
STAGES 1 AND 2 OF CONSTELLATION’S MATURITY CURVE MODEL FOCUS ON ENGAGEMENT AND TRANSPARENCY
FIGURE 15
6/25
Climate Risk Analysis Model

Historical climate data is easily extracted from Eikon, building the base for Constellation’s M2 Model
Refinitiv ESG’s climate metrics
EXTRACTION OF CLIMATE DATA FROM EIKONFigure 16
Source: Refinitiv Eikon, June 2020
The automobile sector transformation
FIGURE 16
7/25
Climate Risk Analysis Model

The automobile sector transformation
Stages 3 and 4 of the Constellation M2 Model focus on granular sales and operational data on the current and planned fleet of cars and light-duty vehicles in the automobile sector and the emissions they produce – the source of nearly 90% of total greenhouse gas (GHG) emissions impacts in the automobile sector.
Current and historical data reflecting the scope of product transformation, alignment with the 2°C Pathway, and leadership in ultra-low and zero-emission production and sales are captured for each of the automobile majors.
In this way, we can assess both current firm-level maturity and momentum in transitioning to a decarbonized fleet, and each firm’s exposure to transition risk and opportunity. The M2 Model was designed to assess how incumbents in a sector - in this case, the major ICE automobile manufacturers - progress over time to take their large-scale operations on the innovation pathway to decarbonization. In the analysis, we include the sector disruptors, such as Tesla, BYD and BAIC, which already demonstrate product innovation but must now progress on their journey to scale up production. CAPACITY TO EXECUTE
SCO
PE O
F V
ISIO
N
Stage 1:INITIAL ENGAGEMENT• Reporting Emissions Impacts• Reporting Policy on Emissions or Climate Change
Stage 2:SYSTEMATIC MANAGEMENT• Energy Intensity of Vehicle Production• Public Emission Reduction Targets• Verification of Emissions Impacts
Stage 3:TRANSFORMING THE CORE• Emission Performance of the Fleet• Company Projections of Alternative Drive Vehicle Sales• Current Percentage of Sales from Alternative Drive Vehicles• Company Governance Structures to Decarbonize
Stage 4:COMPETITIVE DIFFERENTIATION• 2°C Pathway Alignment to 2030• Market Share & Sales Leadership in ZEVs & PHVs
• MarkLines• Transition Pathway Initiative• Urgentem• Constellation
Refinitiv ESG
+
Sales, Operational,and ProductionForecast Data
Refinitiv ESG
STAGES 3 AND 4 OF CONSTELLATION’S MATURITY CURVE MODEL FOR THE AUTO SECTOR FOCUS ON THE MANAGEMENT OF TRANSITION RISKS AND OPPORTUNITIES
FIGURE 17
8/25
Climate Risk Analysis Model

The Refinitiv data for Stage 1 – Initial engagement on climate change – indicates the first year in which the company disclosed information relevant to each transparency milestone. For each column, the year indicates when reporting began and the green color signifies that disclosure continues to the current period. As shown in figure 18, having a policy (Step 1) is now and has been table stakes for all major developed and almost all emerging economy automakers.
Step 2 – Reporting GHG emissions is now and has been standard procedure for all developed economy incumbents.
Of note, electric vehicle “disruptors” such as Tesla in the U.S. and Geely in China, are just getting started on the reporting and transparency agenda, despite their product innovations. This may reflect their relative management maturity, as well as emerging governance practices in the APEC region.
Stage 1 of the transition journey: Initial engagement on climate change impact
Source: Constellation, Refinitiv ESG, and Urgentem 2020
FIGURE 18
THE FIRST STEP ON THE JOURNEYStage 1 - Initial Engagement on Climate Impact
Rank Company Step 1 Step 2
Reported Policy on Emissions – Refinitiv ESG data
Reporting Emissions Impacts – Refinitiv ESG data
1 Toyota 2015 or Earlier 2015 or Earlier1 Volkswagen 2015 or Earlier 2015 or Earlier1 Daimler 2015 or Earlier 2015 or Earlier1 Hyundai 2015 or Earlier 2015 or Earlier1 Honda 2015 or Earlier 2015 or Earlier1 Renault 2015 or Earlier 2015 or Earlier1 Kia 2015 or Earlier Partial 2016 / Complete 20171 Peugeot 2015 or Earlier 2015 or Earlier1 Nissan 2015 or Earlier 2015 or Earlier1 Mazda 2015 or Earlier 2015 or Earlier1 BMW 2015 or Earlier 2015 or Earlier1 Suzuki 2015 or Earlier Partial 2015 or Earlier1 GM 2015 or Earlier 2015 or Earlier1 Ford 2015 or Earlier 2015 or Earlier1 Mitsubishi 2015 or Earlier 20161 FCA 2015 or Earlier 2015 or Earlier1 Isuzu 2015 or Earlier 2015 or Earlier1 Tata 2015 or Earlier 2015 or Earlier1 Subaru 2015 or Earlier 2015 or Earlier1 Mahindra 2015 or Earlier 2015 or Earlier21 Tesla 2015 or Earlier Partial 201821 Geely 2015 or Earlier Partial 201621 BAIC 2016 Partial 201721 BYD 2015 or Earlier No Reporting21 Dongfeng 2015 or Earlier No Reporting21 GAC 2015 or Earlier Partial 201827 Great Wall No Policy No Reporting
Stage 1:INITIAL ENGAGEMENT• Reporting Emissions Impacts – Refinitiv data• Reporting Policy on Emissions or Climate Change – Refinitiv data
Stage 2:SYSTEMATIC MANAGEMENT• Energy Intensity of Vehicle Production• Public Emission Reduction Targets• Verification of Emissions Impacts
Stage 3:TRANSFORMING THE CORE• Emission Performance of the Fleet• Company Projections of Alternative Drive Vehicle Sales• Current Percentage of Sales from Alternative Drive Vehicles• Company Governance Structures to Decarbonize
Stage 4:COMPETITIVE DIFFERENTIATION• 2°C Pathway Alignment to 2030• Market Share & Sales Leadership in ZEVs & PHVs
CAPACITY TO EXECUTE
SCO
PE O
F V
ISIO
N
Best Worst
9/25
Climate Risk Analysis Model - Stage 1

As companies mature into Stage 2, they recognize and respond to the need for greater transparency on key issues including external verification of complete emissions reporting, publicly announced improvement targets, and progress on becoming more energy-efficient operators.
As the data indicate, Verification of emissions impacts (Step 3) has also become a sector norm among the automobile majors. Figure 19 reports the year verification began and the color reflects the current status, with those in green having complete and verified scopes 1, 2 and 3 emissions reported.
Stage 2: Building the capacity for systematic management of climate change impacts
Source: Constellation, Refinitiv ESG, and Urgentem 2020
FIGURE 19
THE NEXT STEP UP THE CURVEStage 2 - Building the Capacity for Systematic Management of Climate Impacts
Rank Company Step 3 Step 4 Step 5
Verification of Emissions Impacts – Refinitiv ESG data
Public Emissions Reduction Targets – Refinitiv ESG data
Emissions Intensity of Vehicle Production
1 Peugeot Partial 2015 / Complete 2017 2015 or Earlier 100
2 Renault 2015 or Earlier 2015 or Earlier 97
3 Tata 2015 or Earlier 2015 or Earlier 95
4 BMW 2015 or Earlier 2015 or Earlier 95
5 Kia 2018 2015 or Earlier 94
6 Mahindra 2015 or Earlier 2015 or Earlier 93
7 Mazda Partial Pre 2015 / Complete 2017 2015 or Earlier 91
8 Isuzu 2016 2015 or Earlier 89
9 Nissan 2015 or Earlier 2015 or Earlier 81
10 Hyundai Partial Pre 2015 / Complete 2017 2015 or Earlier 80
11 GM 2015 or Earlier 2015 or Earlier 78
12 VW 2015 or Earlier 2015 or Earlier 73
13 Toyota 2015 or Earlier 2015 or Earlier 71
14 FCA 2015 or Earlier 2015 or Earlier 70
15 Ford Partial Pre 2015 / Complete 2017 2015 or Earlier 66
16 Honda 2015 or Earlier 2015 or Earlier 52
17 Daimler 2015 or Earlier 2015 or Earlier 51
18 Subaru Partial 2018 2015 or Earlier 78
19 Suzuki No Verification 2015 or Earlier 96
20 Mitsubishi No Verification 2015 or Earlier 93
21 BAIC No Verification No Targets 50
22 Geely No Verification 2015 or Earlier 0
22 BYD No Verification 2017 0
22 Dongfeng No Verification 2017 0
25 Tesla No Verification No Targets 39
26 GAC No Verification No Targets 0
26 Great Wall No Verification No Targets 0
Stage 1:INITIAL ENGAGEMENT• Reporting Emissions Impacts• Reporting Policy on Emissions or Climate Change
Stage 2:SYSTEMATIC MANAGEMENT• Energy Intensity of Vehicle Production• Public Emission Reduction Targets• Verification of Emissions Impacts
Stage 3:TRANSFORMING THE CORE• Emission Performance of the Fleet• Company Projections of Alternative Drive Vehicle Sales• Current Percentage of Sales from Alternative Drive Vehicles• Company Governance Structures to Decarbonize
Stage 4:COMPETITIVE DIFFERENTIATION• 2°C Pathway Alignment to 2030• Market Share & Sales Leadership in ZEVs & PHVs
CAPACITY TO EXECUTE
SCO
PE O
F V
ISIO
N
- Stage 2
Best Worst
10/25
Climate Risk Analysis Model - Stage 2

On Step 4 – Public emissions reduction targets – all major original equipment manufacturers (OEMs) have at least near-term targets. Here too, APEC firms and disruptors such as Tesla are generally less mature in their reporting, despite the disruptors’ obvious market-leading emissions performance.
While energy consumption and related manufacturing emissions, Step 5 – Emissions intensity of vehicle production, only account for approximately 10% of the total automobile sector footprint, some OEMs, such as BMW, have invested in reducing their energy intensity. Other OEMs’ products simply require less energy to produce on a unit basis, such as Tata and Mahindra. Others have low-emissions intensities due to production location, such as Renault and Peugeot in France which utilizes low-carbon electricity. While accurate performance on this factor may not represent a real difference in management maturity, the data are useful to see the range in intensity.
As Schroder’ Global Head of Sustainable Investment Andrew Howard points out, transparency and disclosure are the starting points for firms making the journey to a sustainable future, but the challenge has now shifted to transformation. For Howard, getting a read on transformation is critical. Read the full interview with Andrew Howard here.
“ Transparency was the starting point but managing climate impact is about transformation”
Andrew Howard Global Head of Sustainable Investment, Schroders
11/25
Climate Risk Analysis Model - Stage 2
Prospects for the future
Stage 3: Transforming the core – strategy becomes execution in the drive to decarbonize
Source: Constellation, 2020
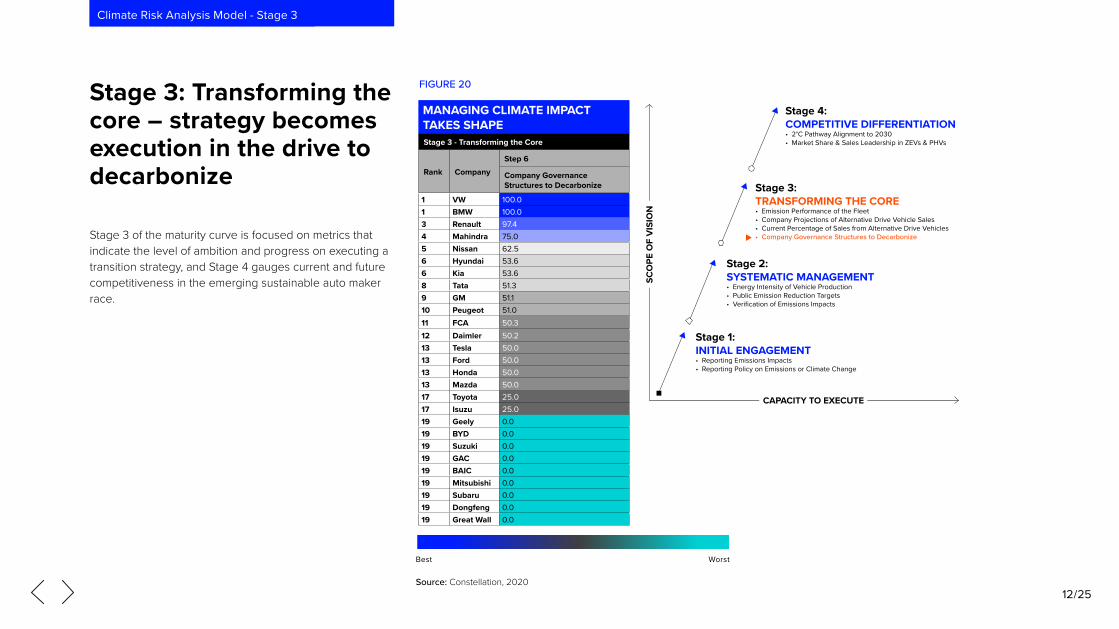
Stage 3 of the maturity curve is focused on metrics that indicate the level of ambition and progress on executing a transition strategy, and Stage 4 gauges current and future competitiveness in the emerging sustainable auto maker race.
FIGURE 20
CAPACITY TO EXECUTE
SCO
PE O
F V
ISIO
N
Stage 1:INITIAL ENGAGEMENT• Reporting Emissions Impacts• Reporting Policy on Emissions or Climate Change
Stage 2:SYSTEMATIC MANAGEMENT• Energy Intensity of Vehicle Production• Public Emission Reduction Targets• Verification of Emissions Impacts
Stage 3:TRANSFORMING THE CORE• Emission Performance of the Fleet• Company Projections of Alternative Drive Vehicle Sales• Current Percentage of Sales from Alternative Drive Vehicles• Company Governance Structures to Decarbonize
Stage 4:COMPETITIVE DIFFERENTIATION• 2°C Pathway Alignment to 2030• Market Share & Sales Leadership in ZEVs & PHVs
MANAGING CLIMATE IMPACT TAKES SHAPEStage 3 - Transforming the Core
Rank Company Step 6
Company Governance Structures to Decarbonize
1 VW 100.01 BMW 100.03 Renault 97.44 Mahindra 75.05 Nissan 62.56 Hyundai 53.66 Kia 53.68 Tata 51.39 GM 51.110 Peugeot 51.011 FCA 50.312 Daimler 50.213 Tesla 50.013 Ford 50.013 Honda 50.013 Mazda 50.017 Toyota 25.017 Isuzu 25.019 Geely 0.019 BYD 0.019 Suzuki 0.019 GAC 0.019 BAIC 0.019 Mitsubishi 0.019 Subaru 0.019 Dongfeng 0.019 Great Wall 0.0
Best Worst
12/25
Climate Risk Analysis Model - Stage 3

Step 6: Evolving governance to support changing prioritiesProgress on climate impact management in the automobile sector requires the transformation of core processes, including supplier networks, manufacturing processes, and most importantly, product innovation to achieve decarbonization.
Stage 3 metrics reveal the scope of progress and contribute to understanding the transition risks and opportunities for each firm. The major automakers performing well on Stage 3 metrics, as a whole, likely will have less transition risk and increased exposure to business benefits from the decarbonization opportunity.
Step 6 – Company governance structures to decarbonize
An early and important signal to the organization regarding the case for change among the traditional ICE automakers is changes in corporate governance that reflect the strategic priority of managing climate impacts. While the disruptors (companies challenging the incumbents with product innovation) may have less need for these change management tools, the incumbents need to drive change.
It is becoming standard practice among the major automakers to establish governance policy that supports the decarbonization agenda by:
1. Linking executive compensation to achieving climate goals.
2. Using an internal price on carbon as a planning mechanism.
3. Supporting a strong climate policy.
Among the organizations that now stand at the top of the sector on climate-related governance are:
1. VW, making a comeback from diesel-gate, along with BMW and Renault.
2. Toyota and most Japanese OEMs have historically not reported utilizing (or have not utilized) these change mechanisms, aside from Nissan showing moderate performance.
Like emissions transparency, many companies in emerging markets do not have as strong or transparent governance structures despite leadership on decarbonization.
13/25
Climate Risk Analysis Model - Stage 3

Prospects for the future
Step 7: Gaining experience in building and selling alternative drive vehiclesTransforming the core in the auto sector is about product innovation – and in the next step up the maturity curve, we observe the degree to which each automaker is delivering product innovation that reduces climate impacts. The Stage 3, Step 7 metric measures current sales of alternative drive vehicles, including HVs, PHVs and ZEVs, by assessing the degree to which the automakers have successfully integrated alternative drive vehicles into their product lines and built an experience base with these vehicles. The scoring generates points for each automaker based on the percentage of 2019 production among ZEVs, PHVs and HVs, with the highest unit value given to ZEV, then PHVs and HVs, respectively. Not surprisingly, the disruptors are in the lead. Tesla and BMW are the only makers outside of the APEC companies to be among the top 10 leaders on delivering alternative drive vehicles.
1. Except for Tesla, EVs have been largely produced and sold in APEC.
2. Toyota, though the long-term leader in HVs, has sold relatively few EV products.
3. Chinese automobile makers – BYD, BAIC, GAC and Geely – are positioned to become major alternative drive vehicle producers.
4. Among the majors, Ford, GM, VW, Daimler and FCA are still selling very small numbers of alternative drive vehicles.
Source: Constellation, 2020
FIGURE 21
CAPACITY TO EXECUTE
SCO
PE O
F V
ISIO
N
Stage 1:INITIAL ENGAGEMENT• Reporting Emissions Impacts• Reporting Policy on Emissions or Climate Change
Stage 2:SYSTEMATIC MANAGEMENT• Energy Intensity of Vehicle Production• Public Emission Reduction Targets• Verification of Emissions Impacts
Stage 3:TRANSFORMING THE CORE• Emission Performance of the Fleet• Company Projections of Alternative Drive Vehicle Sales• Current Percentage of Sales from Alternative Drive Vehicles• Company Governance Structures to Decarbonize
Stage 4:COMPETITIVE DIFFERENTIATION• 2°C Pathway Alignment to 2030• Market Share & Sales Leadership in ZEVs & PHVs
MANAGING CLIMATE IMPACT TAKES SHAPEStage 3 - Transforming the Core
Rank Company Step 7
Current Percentage of Sales from Alternative Drive Vehicles
1 Tesla 100.01 BYD 100.03 BAIC 49.14 GAC 33.35 Toyota 10.16 Geely 7.57 BMW 6.58 Great Wall 5.79 Nissan 5.410 Dongfeng 5.011 Kia 4.512 Mitsubishi 4.013 Honda 3.714 Hyundai 3.515 Tata 3.016 Renault 2.917 Suzuki 2.118 GM 2.018 Subaru 2.020 Daimler 1.921 VW 1.622 Ford 0.923 Peugeot 0.624 FCA 0.225 Mazda 0.126 Mahindra 0.026 Isuzu 0.0
Best Worst
14/25
Climate Risk Analysis Model - Stage 3

While disruptors such as Tesla, BYD, BAIC and GAC have material alternative drive vehicles sales, and a few of the incumbents have significant hybrid production experience, the market remains overwhelmingly dominated by ICE vehicles. Figure 22 shows where the transformation journey is and how far there is to go. Companies are ranked based on their scoring for Step 7, the current percentage of sales from alternative drive vehicles. In this step, ZEV sales are weighted greater than PHV sales, which in turn are weighted greater than HV sales.
A closer look at production breakouts
= ZEV= HV= PHV= ICE
Tesla#1 BYD#2 BAIC#3 GAC#4 Toyota#5 Geely#6 BMW#7
100.0%
53.1%
15.4% 84.6%
10.5%
0.5%
84.4%
15.1%
0.05%0.5%
93.9%
3.5%
94.3%
4.0%1.7%2.6%
89.0%
15.4%
31.5%
Great Wall#8 Nissan#9 Dongfeng#10 Kia#11 Mitsubishi#12 Honda#13 Hyundai#14
96.84%
1.0%
94.8%
0.9% 1.8% 1.3%0.2%
96.7%94.3%
0.2%
0.1%5.4%
95.8%
3.6%0.1%0.5%3.3%0.02%3.13%
94.2%
1.8%4.1%
96.4%
3.5% 0.1%
Ford#22 Peugeot#23 FCA#24 Mazda#25 Mahindra#26 Isuzu#27
99.84% 99.9%
0.1%
100.0%99.9%
0.01%
99.79%
0.20% 0.04%0.12%0.01%
98.6%
1.2%
0.0002%
0.2%
Tata#15 Renault#16 Suzuki#17 GM#18 Subaru#19 Daimler#20 VW#21
96.8%
0.01%3.2%
98.7%
0.1%1.1%0.1%
98.8%
0.001% 0.5%0.7%
98.4%
0.9%0.7%0.1%
97.0%
0.3%2.7%1.8%
98.2%97.9%
0.1% 0.4%1.6%
Source: MarkLines Data; Constellation Analysis
A CLOSER LOOK AT SOME OF THE ACTUAL PRODUCTION BREAKOUTS
FIGURE 22
15/25
Climate Risk Analysis Model - Stage 3

Step 8: Emissions performance of the sold fleet – where the rubber meets the roadThe critical indicator of progress is what comes out of the aggregate tailpipes of each automaker’s fleet. This calculation is made up of the grams of CO2 per kilometer of the 2019 sold fleet of each automaker (Step 8), which provides the most relevant benchmark to assess the size of the gap between where companies are today and where they will need to go to meet the decarbonization challenge.
Key observations:
1. The disruptors (EV leader Tesla, plus the group of APEC innovators including BYD, BAIC and Geely) are as expected at the top of the chart.
2. Most of the top 10 leaders on emissions performance of the sold fleet achieve their results by building a large percentage of smaller, fuel-efficient ICE vehicles. Suzuki, Peugeot and Renault do not have significant current sales of alternative drive vehicles and may have difficulty extending fleet emissions gains without significant technology advances.
3. Toyota’s long success with hybrids puts it towards the top of the major automakers, but will the company’s dominance and commitment to this older technology be a help or barrier to true EV leadership?
4. Near the bottom are well-known brands such as Subaru, Ford and FCA that generally lack the technology and production experience with alternative vehicles. Without significant new investments and partnerships with innovators, they have a long, steep climb ahead.
Source: Constellation, 2020
FIGURE 23
CAPACITY TO EXECUTE
SCO
PE O
F V
ISIO
N
Stage 1:INITIAL ENGAGEMENT• Reporting Emissions Impacts• Reporting Policy on Emissions or Climate Change
Stage 2:SYSTEMATIC MANAGEMENT• Energy Intensity of Vehicle Production• Public Emission Reduction Targets• Verification of Emissions Impacts
Stage 3:TRANSFORMING THE CORE• Emission Performance of the Fleet• Company Projections of Alternative Drive Vehicle Sales• Current Percentage of Sales from Alternative Drive Vehicles• Company Governance Structures to Decarbonize
Stage 4:COMPETITIVE DIFFERENTIATION• 2°C Pathway Alignment to 2030• Market Share & Sales Leadership in ZEVs & PHVs
MANAGING CLIMATE IMPACT TAKES SHAPEStage 3 - Transforming the Core
Rank Company Step 8
Emissions Performance of the Fleet
1 Tesla 100.01 BYD 100.01 BAIC 100.01 Geely 100.05 Suzuki 92.96 Peugeot 80.47 GAC 75.08 Toyota 74.49 Renault 72.410 Hyundai 63.211 Kia 59.412 Honda 58.113 Mazda 54.914 Nissan 54.615 VW 52.716 Daimler 52.317 BMW 46.718 Mitsubishi 36.419 GM 36.220 Subaru 22.421 Ford 16.022 Great Wall 1.823 Dongfeng 1.624 Tata 0.925 Mahindra 0.025 FCA 0.025 Isuzu 0.0
Best Worst
16/25
Climate Risk Analysis Model - Stage 3

Step 9: Setting future targets for alternative vehicle production – where the rubber meets the skyStep 9 – Company projections for future alternative drive vehicle sales
A clear indicator of increasing maturity in managing climate risk is the strength and clarity of publicly disclosed plans to shift production of alternative drive vehicles (Step 9). We have developed a rule-based quantitative method to assess the announced plans from the automakers for production and sales of new and existing alternative drive vehicles. As previously calculated, the ranking considers the type of vehicles being forecast (HV, PHV and ZEV), the specificity of volumes and time frame of the forecast. The highest weight is given to ZEVs, PHVs and HVs, respectively, while shorter timelines of production and sales are also weighted higher than long-term projections.
Source: Constellation, 2020
FIGURE 24
MANAGING CLIMATE IMPACT TAKES SHAPEStage 3 - Transforming the Core
Rank Company Step 9
Current Projections For Alternative Drive Production
1 Tesla 100.01 BAIC 100.01 VW 100.04 Daimler 77.85 Geely 68.16 Honda 57.67 Toyota 56.58 Mazda 41.79 Hyundai 37.610 Kia 36.911 Ford 30.512 BMW 29.713 Renault 22.714 GAC 22.315 Nissan 20.616 Dongfeng 18.717 Peugeot 13.518 FCA 13.419 GM 11.820 Mahindra 7.121 Subaru 4.622 Mitsubishi 4.423 Tata 3.224 Suzuki 2.425 BYD 0.025 Isuzu 0.025 Great Wall 0.0
CAPACITY TO EXECUTE
SCO
PE O
F V
ISIO
N
Stage 1:INITIAL ENGAGEMENT• Reporting Emissions Impacts• Reporting Policy on Emissions or Climate Change
Stage 2:SYSTEMATIC MANAGEMENT• Energy Intensity of Vehicle Production• Public Emission Reduction Targets• Verification of Emissions Impacts
Stage 3:TRANSFORMING THE CORE• Emission Performance of the Fleet• Company Projections of Alternative Drive Vehicle Sales• Current Percentage of Sales from Alternative Drive Vehicles• Company Governance Structures to Decarbonize
Stage 4:COMPETITIVE DIFFERENTIATION• 2°C Pathway Alignment to 2030• Market Share & Sales Leadership in ZEVs & PHVs
Best Worst
17/25
Climate Risk Analysis Model - Stage 3

#1
VW
Daimler
Honda Geely
DongfengBMW
KIAHyundai
Mazda
Ford Renault
NissanGM
Mitsubishi
Tata
FCAPeugeot
Suzuki
SuburuMahindra
Isuzu
GAC
Great Wall
BYD
#2
#5
#4
#3
CURRENT PERCENTAGE OF SALES FROM ALTERNATIVE DRIVE VEHICLES
CO
MPA
NY
PRO
JEC
TIO
NS
OF
ALT
ERN
ATIV
ED
RIV
E V
EHIC
LE S
ALE
S
100
80
60
40
20
0
2 4 6 8 10 35// // //
50 1000
CHINA FRANCE GERMANY INDIA JAPAN SOUTH KOREA ITALY/U.S. U.S.
BAIC Tesla
ALTERNATIVE DRIVE VEHICLES: 2019 PROJECTIONS & SALES
Toyota
Figure 25
Source: MarkLines Data; Constellation Analysis
Looking at the relationship between planned versus actual sales of alternative drive vehicles, we can make some key observations:
1. Among the ICE majors, VW and Daimler are making the strongest commitment to a relatively rapid fleet-wide transformation, but are starting from a relatively low base of alternative drive experience. Given the recent market turmoil due to the COVID-19 pandemic shutdown, careful attention should be paid to plan changes from these would-be alternative drive leaders.
2. Tesla and BAIC are fully committed to ZEV, but can they profitably scale up production?
3. Toyota, the most experienced alternative drive automobile major, has not yet asserted its future leadership strategy and plans in the ZEV market.
4. Among the incumbents, FCA, GM, Subaru and Mitsubishi are near the bottom of the laggard quadrant in terms of both current sales of alternative drive vehicles and announced plans for fleet transformation, posing especially significant transition risks. While some are beginning to invest more heavily (e.g., Ford), there is a big gap to close on decarbonization execution.
5. Disruptors like BYD are already bringing many alternative drive vehicles to market, but their projections are unknown.
FIGURE 25
18/25
Climate Risk Analysis Model - Stage 3

As figure 26 shows, petrol and diesel ICE vehicles emit much greater CO2 than electric vehicles, but how much greater depends heavily on the carbon intensity of the electricity that charges an EV. Taking battery production into account, a vehicle charged in Poland is emitting 3.5 times more CO2 than one charged on the cleaner energy grid in Sweden.
Realizing the full potential benefit of electrification will require transforming our electricity generation and distribution system. Progress on this front varies significantly within and across country boundaries.
As automakers begin to execute on their projections, increasing their sales of alternative drive vehicles, it is important to understand the total life cycle emissions of their fleets
-65%-62%-58%-57%-56%
-29%*
300
200
100
0
-67%
-77% -79%
-63%
TODAY PETROL AND DIESEL CARS EMIT ALMOST 3 TIMESMORE CO₂ THAN THE AVERAGE EU ELECTRIC CAR
PETROLDIESEL
Poland
German
y
Italy UK
Spain
Sweden
Netherlands
BelgiumFran
ce
EU-27
Driving (fuel/electricity production and use)
Car production
Battery production
CO₂ emissions in 2030
SCENARIO WHERE AVERAGE EU ELECTRICITY IS USED TO PRODUCE THE BATTERIES AND THE CARS
*CO₂ savings compared to the average of both diesel and petrol emissions
Figure 26
Source: Transport & Environment, 2020 – transenv.eu/lca
FIGURE 26
19/25
Climate Risk Analysis Model - Stage 3

EV performance standards usually require batteries to retain 80% of their total usable capacity. Once they fall below this threshold, they can still be reused to provide significant value for stationary energy storage markets where less-frequent cycling is required. From grid storage to data center backup power to EV charging stations, second-life applications for EV batteries will continue to expand alongside the EV market. Current estimates have second-life batteries lasting for an additional 7-10 years. For batteries that cannot be reused, recycling is the next best thing. Though current recycling rates are only at 50%, new innovative processes, such as the one developed by Fortum with a recovery rate of 80%, show promise for the future.1
As EV, PHV and HV growth continues, so will battery recovery, reuse and recycling
Source: McKinsey & Company, 2020
1 Eg, improve grid performance, integrate renewables, charge EVs, etc.Source: Expert interviews; market research reports; McKinsey analysis
ELECTRIC-VEHICLE (EV) BATTERY LIFE CYCLE, ILLUSTRATIVE
Recycling Packs can be processed to extract valuable rare-earth materials.
Recycling Packs can be repurposed for a second-life application in energy-storage services that is suitable to their reduced performance capabilities.
Disposal If packs are damaged or in regions without proper market structures or regulations, packs may be thrown away.
When an EV battery can no longer meet its performance requirement, it is replaced by a new battery pack. The used battery pack is removed from the car for one of three destinations.
New batterypack
Used batterypack
Batterymanufacturing
Raw-materialextraction andreprocessing
Batteryrefurbishing
company
second-life applicationin stationary strorage1
Junkyard
Electricvehicle
1 https://www.fortum.com/products-and-services/fortum-battery-solutions/recycling/lithium-ion-battery-recycling-solution
FIGURE 27
20/25
Climate Risk Analysis Model - Stage 3

Companies that score well on the Stage 4 criteria are positioned to realize enhanced business value as the vehicle marketplace decarbonizes.
Step 10: Capturing market share and sales growth from ZEVs and PHVs While company market share and sales rankings (Step 10) are important indicators of the ability to compete, they represent leadership in the currently small market for PHVs and ZEVs. Also, they may not indicate whether firms have the capacity to scale up production as the alternative drive market grows to become a major component of total sales.
Step 11: Alignment with the 2°C PathwayThe top 10 companies in green are on or will be on the pathway to 2°C GHG emissions alignment if publicly announced plans are successfully executed.
1. Step 11 measures fleet emissions alignment with the goals of the Paris accord’s 2°C pathway, assessing whether each company’s sold fleet is decarbonizing over time in a manner consistent a 2°C world. It is a critical barometer of company performance against planetary boundaries.
2. Step 11 utilizes the trend in emissions levels of sold fleets. Companies in yellow, and even more so in red, will need to increase their commitment to decarbonization to make the transition to alignment with the 2°C pathway.
3. Peugeot is an outlier in the green category in that its trajectory on a 2°C pathway is based on its high MPG ICE fleet, not their success with alternative drive vehicles. It remains to be seen whether it can develop the competency in alternative drive vehicles to remain on a 2°C pathway.
Stage 4: Competitive differentiation on decarbonization – realizing sustainable value
Source: Constellation, 2020
FIGURE 28
REALIZING SUSTAINABLE VALUEStage 4 - Competitive Differentiation on Decarbonization
Rank Company
Step 10 Step 11
Market Share & Sales Leadership in ZEVs & PHVs
2°C Pathway Alignment to 2030
1 Tesla 100.0 100.02 BYD 100.0 100.03 BAIC 47.7 100.04 Geely 37.3 100.05 VW 30.1 92.86 GAC 20.6 100.07 Daimler 12.5 100.08 Hyundai 16.0 96.19 Renault 14.0 94.410 Peugeot 1.8 100.011 Nissan 19.9 83.412 Mazda 0.0 97.713 Kia 13.8 84.014 Toyota 14.5 82.815 BMW 38.5 57.716 Honda 4.4 85.717 Suzuki 0.0 74.818 GM 21.5 40.419 Mitsubishi 15.2 29.520 Subaru 1.0 19.121 Dongfeng 10.1 3.522 Great Wall 12.2 1.823 Tata 6.7 1.024 FCA 1.9 4.025 Ford 2.7 0.026 Mahindra 0.0 0.027 Isuzu 0.0 0.0
CAPACITY TO EXECUTE
SCO
PE O
F V
ISIO
N
Stage 1:INITIAL ENGAGEMENT• Reporting Emissions Impacts• Reporting Policy on Emissions or Climate Change
Stage 2:SYSTEMATIC MANAGEMENT• Energy Intensity of Vehicle Production• Public Emission Reduction Targets• Verification of Emissions Impacts
Stage 3:TRANSFORMING THE CORE• Emission Performance of the Fleet• Company Projections of Alternative Drive Vehicle Sales• Current Percentage of Sales from Alternative Drive Vehicles• Company Governance Structures to Decarbonize
Stage 4:COMPETITIVE DIFFERENTIATION• 2°C Pathway Alignment to 2030• Market Share & Sales Leadership in ZEVs & PHVs
Best Worst
21/25
Climate Risk Analysis Model - Stage 4

Figure 29 brings the M2 analysis together into one view. Looking at overall M2 scores, many of the disruptors are at the top of the chart because of the extremely strong decarbonization performance factors in Stages 3 and 4 of the maturity curve. While the challenge for the Incumbents is to climb up the maturity curve, the disruptors start with the decarbonized product innovation and will need to work their way down the curve as they add policy, disclosure, and governance to their capability set.
Integrating the stages to reveal Maturity and Momentum
Climate Risk Analysis Model - Stage 4
22/25

Source: Constellation, 2020
CONSTELLATION’S COMPLETE AUTOMOBILE SECTOR MATURITY CURVEFIGURE 29
CONSTELLATION’S AUTOMOBILE SECTOR MATURITY MODEL 2019Stage 3 – Transforming the Core
Stage 1 – Initial Engagement on Climate Change
Stage 2 – Building the Capacity for Systematic Management of Climate Impacts
Stage 3 – Transforming Business Operations/Products to Drive Fundamental Changes in Climate Impacts
Stage 4 – Competitive Differentiation on Decarbonization
Rank Company
Step 1 Step 2 Step 3 Step 4 Step 5 Step 6 Step 7 Step 8 Step 9 Step 10 Step 11 Maturity Score
Momentum Score
Reported Policy on Emissions or Climate Change – Refinitiv ESG data
Reporting Emissions Impacts – Refinitiv ESG data
Verification of Emissions Impacts – Refinitiv ESG data
Public Emissions Reduction Targets – Refinitiv ESG data
Emissions Intensity of Vehicle Production
Company Governance Structures to Decarbonize
Current Percentage of Sales from Alternative Drive Vehicles
Emissions Performance of the Fleet
Company Projections for Alternative Drive Production
Market Share & Sales Leadership in ZEVs and PHVs
2°C Pathway Alignment to 2030
1 Tesla 100 25 0 0 39 50.0 100 100 100 100 100 83.8 1.82 BYD 100 0 0 100 0 0 100 100 0 100 100 70.0 03 BAIC 100 25 0 0 50 0 49.1 100 100 47.7 100 65.2 3.64 VW 100 100 100 100 73 100 1.6 52.7 100 30.1 92.8 62.2 8.05 Renault 100 100 100 100 97 97.4 2.9 72.4 22.7 14.0 94.4 57.8 6.26 Toyota 100 100 100 100 71 25.0 10.1 74.4 56.5 14.5 82.8 54.5 5.77 Peugeot 100 100 100 100 100 51.0 0.6 80.4 13.5 1.8 100 54.1 5.08 Daimler 100 100 100 100 51 50.2 1.9 52.3 77.8 12.5 100 54.0 6.19 Hyundai 100 100 100 100 80 53.6 3.5 63.2 37.6 16.0 96.1 53.9 8.510 Geely 100 25 0 100 0 0 7.5 100 68.1 37.3 100 53.4 6.211 Kia 100 100 100 100 94 53.6 4.5 59.4 36.9 13.8 84.0 51.9 10.112 BMW 100 100 100 100 95 100 6.5 46.7 29.7 38.5 57.7 51.6 3.713 Mazda 100 100 100 100 91 50.0 0.1 54.9 41.7 0 97.7 50.6 7.114 Honda 100 100 100 100 52 50.0 3.7 58.1 57.6 4.4 85.7 50.3 7.715 Nissan 100 100 100 100 81 62.5 5.4 54.6 20.6 19.9 83.4 50.2 4.316 GAC 100 25 0 0 0 0 33.3 75.0 22.3 20.6 100 43.8 20.017 Suzuki 100 100 0 100 96 0 2.1 92.9 2.4 0 74.8 42.7 4.418 GM 100 100 100 100 78 51.1 2.0 36.2 11.8 21.5 40.4 37.8 1.919 Mitsubishi 100 100 0 100 93 0 4.0 36.4 4.4 15.2 29.5 26.9 1.520 Ford 100 100 100 100 66 50.0 0.9 16.0 30.5 2.7 0 26.3 2.421 Mahindra 100 100 100 100 93 75.0 0 0 7.1 0 0 23.5 0.722 Tata 100 100 100 100 95 51.3 3.0 0.9 3.2 6.7 1.0 23.1 1.423 FCA 100 100 100 100 70 50.3 0.2 0 13.4 1.9 4.0 22.0 1.524 Subaru 100 100 25 100 78 0 2.0 22.4 4.6 1.0 19.1 20.9 2.725 Isuzu 100 100 100 100 89 25.0 0 0 0 0 0 18.8 0.326 Dongfeng 100 0 0 100 0 0 5.0 1.6 18.7 10.1 3.5 9.8 0.827 Great Wall 0 0 0 0 0 0 5.7 1.8 0 12.2 1.8 3.2 1.6
Best Worst
23/25
Maturity and momentum

MEASURING DIFFERENT ASPECTS OF SUSTAINABILITY PERFORMANCERefinitiv ESG and climate
change impact maturity scores
Source: Constellation and Refinitiv ESG, 2020
Assessing how overall ESG scores align with climate impact analytics, we see an interesting complementarity. The M2 analytics, focused on climate impact management, give a different view of company performance from the Refinitiv overall ESG scores. Though the disruptors’ lack of transparency yields low Refinitiv ESG scores, many with top ESG ratings, such as FCA, Ford, and GM, are not among the M2 Leaders. It may be that the general management capabilities of the ESG Leaders will rapidly advance the climate risk strategies, but it is not yet observable in our analysis.
FIGURE 30
Rank Company Climate Impact Maturity Scores
Refinitiv ESG Scores
1 Tesla 83.8 51.22 BYD 70.0 55.23 BAIC 65.2 46.44 VW 62.2 83.75 Renault 57.8 81.06 Toyota 54.5 76.67 Peugeot 54.1 82.98 Daimler 54.0 92.09 Hyundai 53.9 67.310 Geely 53.4 60.311 Kia 51.9 59.412 BMW 51.6 86.413 Mazda 50.6 65.014 Honda 50.3 88.315 Nissan 50.2 75.416 GAC 43.8 54.717 Suzuki 42.7 60.018 GM 37.8 90.319 Mitsubishi 26.9 71.420 Ford 26.3 87.321 Mahindra 23.5 78.322 Tata 23.1 74.923 FCA 22.0 90.324 Subaru 20.9 48.325 Isuzu 18.8 65.526 Dongfeng 9.8 59.127 Great Wall 3.2 28.3 Best Worst
24/25
ESG and climate change impact

Acronyms:• CO2 – carbon dioxide• GHG – greenhouse gas • EV – electric vehicle• ZEV – zero-emission vehicle • PHV – plug-in hybrid vehicle• HV – hybrid vehicle• APEC – Asia-Pacific Economic Cooperation • KPI – key performance indicator• ESG – environmental, social and governance • ICE – internal combustion engine• MPG – miles per gallon• M2 – Maturity and Momentum • OEM – original equipment manufacturer
Summary
This is chapter 2 of the Sustainability Trends and The Automotive Industry: Truckification and Electrification report. Discover more in this series:
Overview of the Sustainability Trends and The Automotive Industry report
Chapter 1: How have recent trends in market demand complicated decarbonization for automakers?
Chapter 3: How are automakers positioned to manage the sustainability imperative and associated transition risk and opportunity in the coming decade?
25/25
Summary

refinitiv.com/esg
RE1333208/12-20
Refinitiv data and solutionsAt Refinitiv, we strive to be the trusted and preferred partner for environmental, social and governance (ESG) data and solutions, and are committed to bringing to the market an array of best-in-class data, analytics and fully integrated workflow solutions.
Refinitiv ESG DataWe understand the increasingly critical need for ESG information, and the solutions we offer enable customers to act with confidence on consistently captured and standardized transparent information and insights.
We have deep domain expertise and have been providing ESG solutions to the financial industry since the early 2000s. Designed to help you make sound, sustainable investment decisions, our ESG data covers 80% of global market cap and over 450 metrics.
Our ESG data is available through Eikon®, Excel® add-in, Datastream®, Datastream Data Loader (DDL), QA Direct® and the Elektron Data Platform Cloud API.
For more information, visit us online at refinitiv.com/esg
This research report was conducted in partnership with Constellation Research