sustainability in semiconductor facilities (material, exhaust and water...
TRANSCRIPT

E n a b l i n g N e w H o r i z o n s
Integrated Waste Reduction Programfor Semiconductor Facilities
Hartmut Schneider & Peter Csatáry
High-Tech Facility International Forum, Semicon Taiwan, 8th September 2016

Source: M+W Group2 September 2016
M+W Group at a Glance
Mission Statement:
“M+W creates customer value through a unique combination of
lean and sustainable, high-technology engineering and
project management solutions in an injury-free environment.”
Mission Statement
Leading global engineering and construction company
Unique skillset in the delivery of complex technology-intensive
factories and facilities
Special expertise in cleanroom technology and controlled
environments
Established in Germany in 1912
Figures 2015
Order Intake: € 3 bn
Sales: € 3 bn
Employees: 6,000
Source: M+W Group3 September 2016
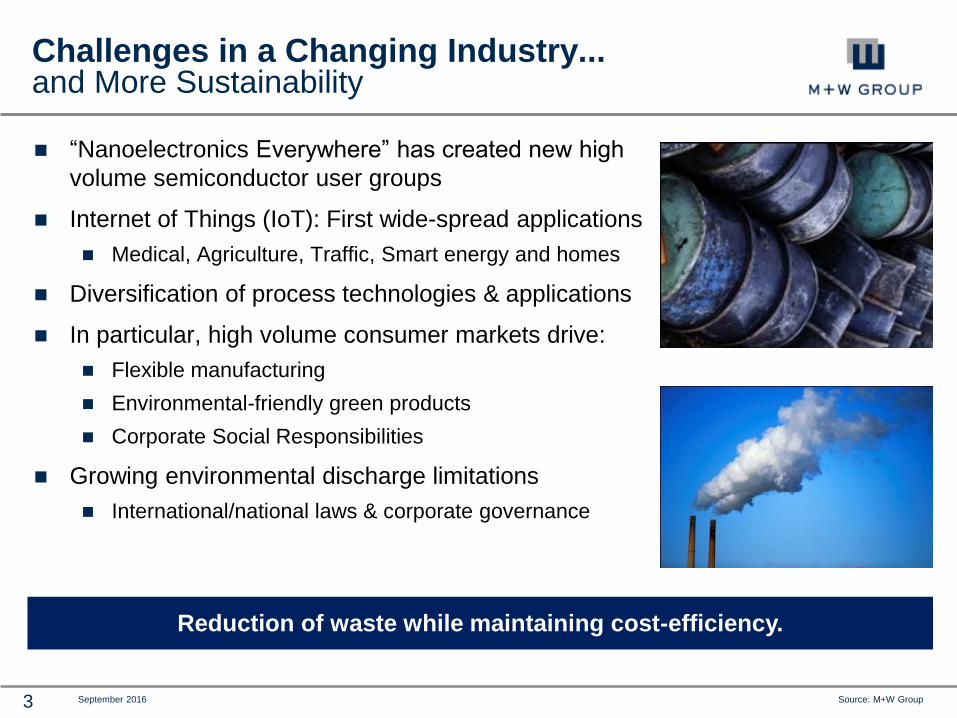
Challenges in a Changing Industry... and More Sustainability
“Nanoelectronics Everywhere” has created new high
volume semiconductor user groups
Internet of Things (IoT): First wide-spread applications
Medical, Agriculture, Traffic, Smart energy and homes
Diversification of process technologies & applications
In particular, high volume consumer markets drive:
Flexible manufacturing
Environmental-friendly green products
Corporate Social Responsibilities
Growing environmental discharge limitations
International/national laws & corporate governance
Reduction of waste while maintaining cost-efficiency.

Source: M+W Group4 September 2016
Evaluation of Waste Reduction Measures Life Cycle Assessment (LCA) Modeling
Defined in ISO 14040 and ISO 14044
LCA is a systematic technique for the evaluation of (potential) environmental
impacts associated with products, processes or services over their entire life cycle.
Calculate the environmental performance
• How big is the carbon footprint?
• How much water is used?
• What are my KEPIs?
Identify environmental hotspots
• Where is the environmental impact coming from?
• What is the biggest impact?
Assess, compare, optimize design options
• Which option is more sustainable?
• How can I improve my environmental performance?
LCA enables one to make environmentally sound decisions.
Source: M+W Group5 September 2016
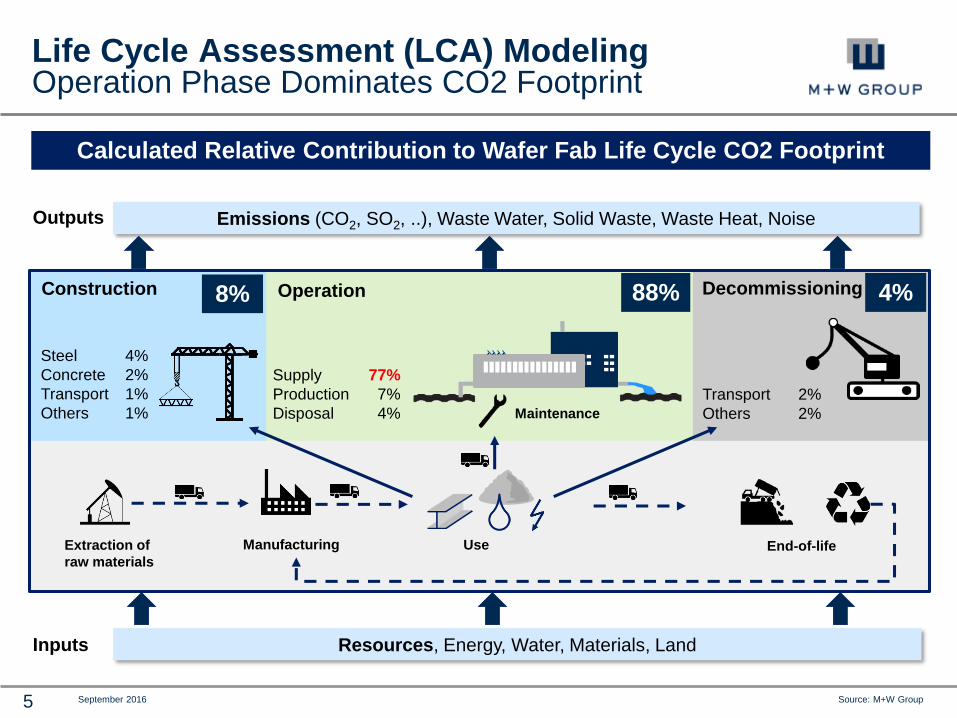
Life Cycle Assessment (LCA) ModelingOperation Phase Dominates CO2 Footprint
Outputs
Operation Decommissioning
Extraction of
raw materials
Manufacturing
Maintenance
Use End-of-life
Construction
Inputs Resources, Energy, Water, Materials, Land
Emissions (CO2, SO2, ..), Waste Water, Solid Waste, Waste Heat, Noise
88%
Supply 77%
Production 7%
Disposal 4%
Steel 4%
Concrete 2%
Transport 1%
Others 1%
8%
Transport 2%
Others 2%
4%
Calculated Relative Contribution to Wafer Fab Life Cycle CO2 Footprint

Source: M+W Group7 September 2016
Integrated Waste Reduction for Facility SystemsGeneral Overview & Examples
Abbreviations:
MAHU = Make-up air handling unit,
RAHU = Recirc air handling unit
GEX = General exhaust,
ACEX = Acid exhaust,
CAEX = Caustic exhaust
PCW = Process cooling water,
UPW = Ultra pure water,
WWT = Wastewater
Energy
Efficiency
Water
Efficiency
Materials / Chemicals / Consumables Efficiency
MAHU Cooling
Optimization
Exhaust recycling
GEX-MAHU
Energy RecoveryLow Chemistry
Scrubber
Concrete
Cooling
Decentralized
RAHU
High Temperature
PCWChilled Water
Temperature
Optimization
Ground
(Water)
Cooling
Solar Cooling
Photovoltaic
N2 Storage
Heat Exchanger
Temperature
Optimization
WW Treatment
Heat Recovery
UPW
Recycling
Solvent Waste
Treatment
Water re- &
down cycling
UPW
Production
Drain
Segregation
Advanced
HF-Treatment
Cu-WW
Treatment
Cu Reclaim
Slurry Treatment
Ammonia
Reclaim
TMAH Reclaim
Organic
Sanitary WW
Building MaterialsSEMI-Product
Materials
Cogeneration
Trigeneration
Solar
Heating
Building
Tightness
Free
Cooling
Cooling Water
Heat Recovery
Facility
Consumables
Source: M+W Group8 September 2016
Po
st-
filt
ere
d C
on
de
nsate
Sub-Fab
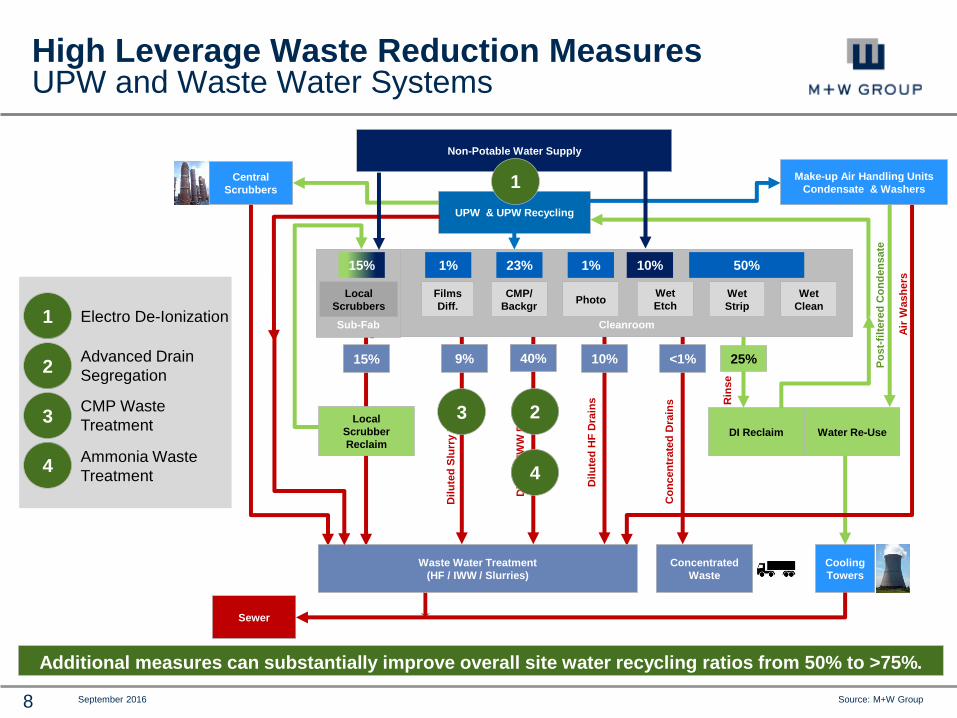
High Leverage Waste Reduction MeasuresUPW and Waste Water Systems
UPW & UPW Recycling
Make-up Air Handling Units
Condensate & WashersCentral
Scrubbers
Cleanroom
Films
Diff.
CMP/
Backgr
Local
ScrubbersPhoto
Wet
EtchWet
Strip
Wet
Clean
DI Reclaim
Local
Scrubber
Reclaim
Cooling
Towers
Water Re-Use
Waste Water Treatment
(HF / IWW / Slurries)
Concentrated
Waste
Dil
ute
d S
lurr
y D
rain
s
Dil
ute
d IW
W D
rain
s
Co
ncen
trate
d D
rain
s Rin
se
Dil
ute
d H
F D
rain
s
9% 40% 10% 25%<1%
23%1% 50%15%
Non-Potable Water Supply
1%
Air
Wash
ers
10%
15%
Sewer
Additional measures can substantially improve overall site water recycling ratios from 50% to >75%.
1
2
4
Electro De-Ionization1
Advanced Drain
Segregation 2
Ammonia Waste
Treatment4
CMP Waste
Treatment3 3

Source: M+W Group9 September 2016
Low-Chem UPW Make-UpElectro De-Ionization
Comparison based on installed systems for a major semiconductor facility,
similar raw water inlet quality and UPW specifications
UPW RO / UPW Polishing / DI Water Recycling
DI Reclaim
To MAHU Washer
To Central Scrubber
To Cleanroom /
Sub-Fab
Raw Water
To IWW
Description Standard Low Chem Pros & Cons
Chemical Usage Higher Lower 80% Reduction
Energy Cons. Lower Higher 35% Increase
Water Demand Higher Lower 10% Reduction
Footprint Larger Smaller 25% Reduction
CAPEX Higher Lower 5% Reduction
OPEX Higher Lower 3.5% Reduction
Source: Waterworld, April 2016Source: M+W Group. Actual comparison for a semiconductor facility based on
same raw water inlet quality and UPW specifications
1
Source: M+W Group10 September 2016
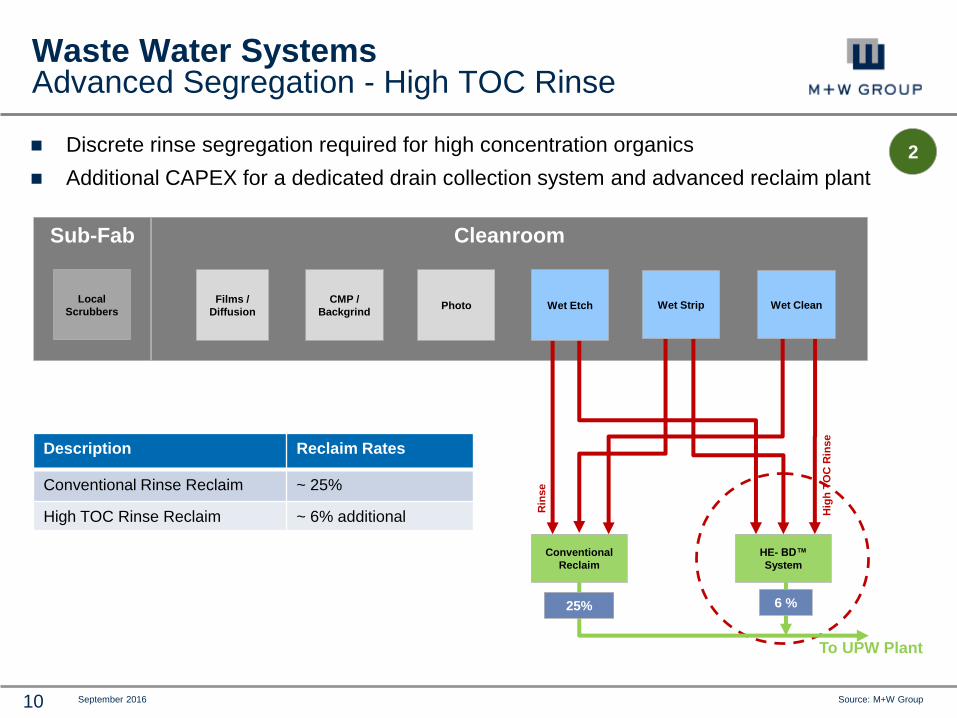
Cleanroom
Discrete rinse segregation required for high concentration organics
Additional CAPEX for a dedicated drain collection system and advanced reclaim plant
Waste Water SystemsAdvanced Segregation - High TOC Rinse
Sub-Fab
Films /
Diffusion
CMP /
Backgrind
Local
ScrubbersPhoto Wet Etch Wet Strip Wet Clean
Rin
se
Hig
h T
OC
Rin
se
HE- BD™
System
Conventional
Reclaim
To UPW Plant
Description Reclaim Rates
Conventional Rinse Reclaim ~ 25%
High TOC Rinse Reclaim ~ 6% additional
6 %25%
2
Source: M+W Group11 September 2016
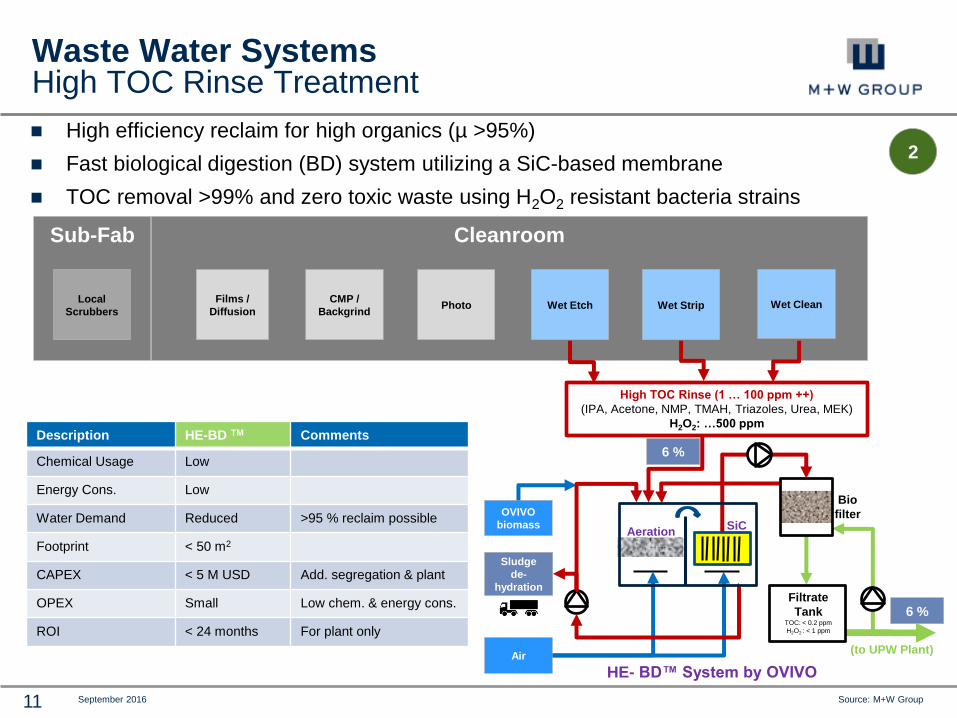
High efficiency reclaim for high organics (µ >95%)
Fast biological digestion (BD) system utilizing a SiC-based membrane
TOC removal >99% and zero toxic waste using H2O2 resistant bacteria strains
Waste Water SystemsHigh TOC Rinse Treatment
OVIVO
biomass
Sludge
de-
hydration
HE- BD™ System by OVIVO
High TOC Rinse (1 … 100 ppm ++)
(IPA, Acetone, NMP, TMAH, Triazoles, Urea, MEK)
H2O2: …500 ppm
Air
Sub-Fab Cleanroom
Films /
Diffusion
CMP /
Backgrind
Local
ScrubbersPhoto Wet Etch Wet Strip Wet Clean
Bio
filter
Filtrate
TankTOC: < 0.2 ppm
H2O2 : < 1 ppm
(to UPW Plant)
AerationSiC
6 %
6 %
Description HE-BD TM Comments
Chemical Usage Low
Energy Cons. Low
Water Demand Reduced >95 % reclaim possible
Footprint < 50 m2
CAPEX < 5 M USD Add. segregation & plant
OPEX Small Low chem. & energy cons.
ROI < 24 months For plant only
2

Source: M+W Group12 September 2016
Cleanroom
Waste Water SystemsDiscrete Oxide/Tungsten CMP Drain Segregation
CMP buffing and cleaning waste water can be reclaimed for UPW
Discrete drain segregation required at CMP Polisher & Cleaner Mainframe
Sub-Fab
Films /
Diffusion
Ox/W CMP
Polisher
& Cleaner
Local
ScrubbersPhoto Wet Etch Wet Strip Wet Clean
Ultra Filtration
/ Ion Exchange
Slurry Drain
Bu
ffin
g D
rain
Cleaner Drain
WW
Treatment
(to UPW Plant)
(to reuse)
Concept Proposal by OVIVO
3.4 %
5.6 %
Description CMP Segr. Comments
Chemical Usage Neutral
Energy Cons. Low
Water Demand Reduced >95 % reuse possible
Footprint < 60 m2
CAPEX < 8 M USD Add. segregation & plant
OPEX Small Low chem. & energy cons.
ROI < 24 months For plant only
3
9 %
Source: M+W Group14 September 2016
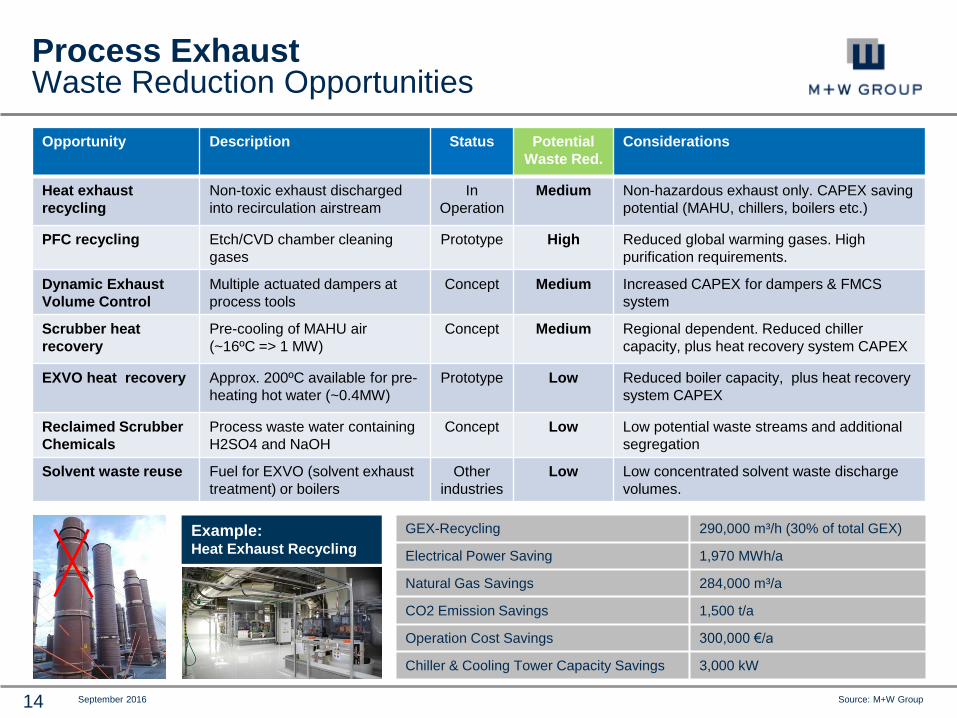
Process ExhaustWaste Reduction Opportunities
GEX-Recycling 290,000 m³/h (30% of total GEX)
Electrical Power Saving 1,970 MWh/a
Natural Gas Savings 284,000 m³/a
CO2 Emission Savings 1,500 t/a
Operation Cost Savings 300,000 €/a
Chiller & Cooling Tower Capacity Savings 3,000 kW
Example: Heat Exhaust Recycling
Opportunity Description Status Potential
Waste Red.
Considerations
Heat exhaust
recycling
Non-toxic exhaust discharged
into recirculation airstream
In
Operation
Medium Non-hazardous exhaust only. CAPEX saving
potential (MAHU, chillers, boilers etc.)
PFC recycling Etch/CVD chamber cleaning
gases
Prototype High Reduced global warming gases. High
purification requirements.
Dynamic Exhaust
Volume Control
Multiple actuated dampers at
process tools
Concept Medium Increased CAPEX for dampers & FMCS
system
Scrubber heat
recovery
Pre-cooling of MAHU air
(~16ºC => 1 MW)
Concept Medium Regional dependent. Reduced chiller
capacity, plus heat recovery system CAPEX
EXVO heat recovery Approx. 200ºC available for pre-
heating hot water (~0.4MW)
Prototype Low Reduced boiler capacity, plus heat recovery
system CAPEX
Reclaimed Scrubber
Chemicals
Process waste water containing
H2SO4 and NaOH
Concept Low Low potential waste streams and additional
segregation
Solvent waste reuse Fuel for EXVO (solvent exhaust
treatment) or boilers
Other
industries
Low Low concentrated solvent waste discharge
volumes.
Source: M+W Group15 September 2016
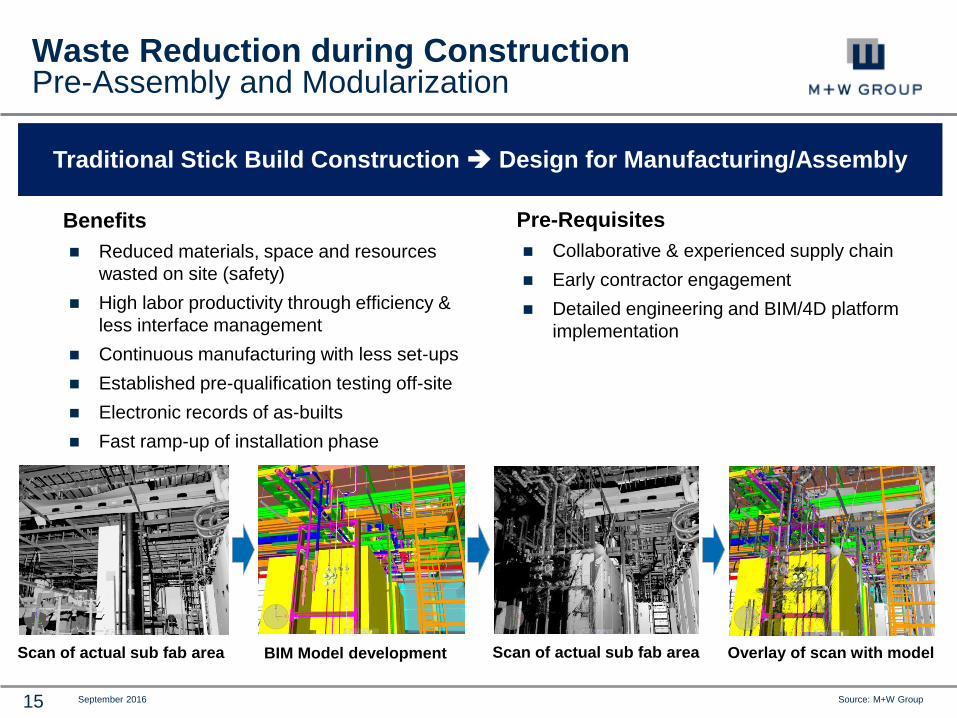
Waste Reduction during ConstructionPre-Assembly and Modularization
Pre-Requisites
Collaborative & experienced supply chain
Early contractor engagement
Detailed engineering and BIM/4D platform
implementation
Benefits
Reduced materials, space and resources
wasted on site (safety)
High labor productivity through efficiency &
less interface management
Continuous manufacturing with less set-ups
Established pre-qualification testing off-site
Electronic records of as-builts
Fast ramp-up of installation phase
Traditional Stick Build Construction Design for Manufacturing/Assembly
Scan of actual sub fab area Overlay of scan with modelScan of actual sub fab area BIM Model development
Source: M+W Group16 September 2016
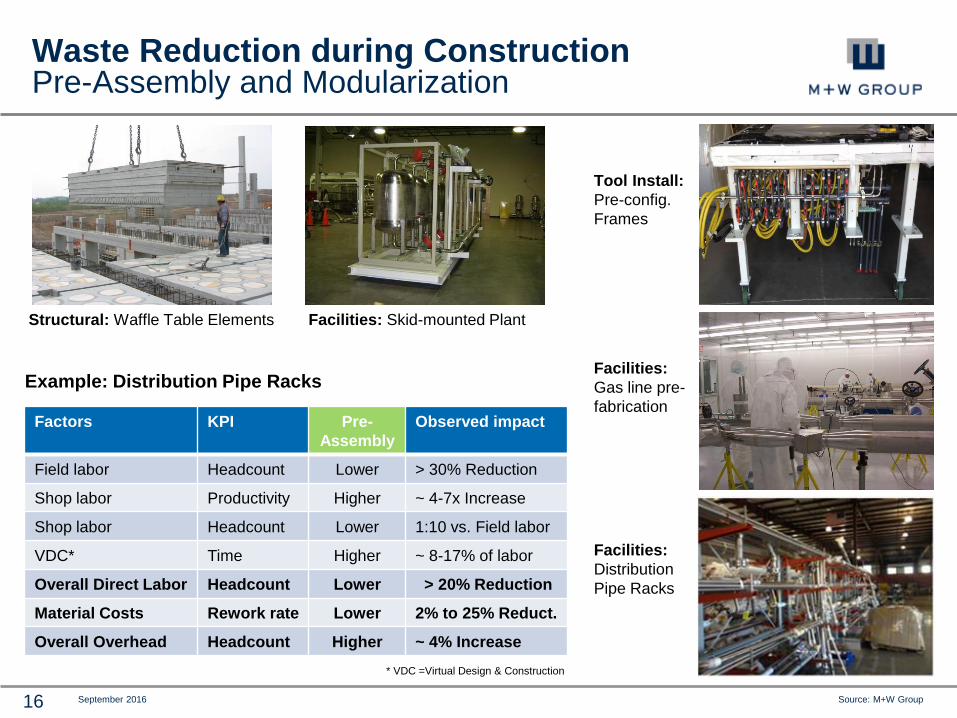
Example: Distribution Pipe Racks
Waste Reduction during ConstructionPre-Assembly and Modularization
Factors KPI Pre-
Assembly
Observed impact
Field labor Headcount Lower > 30% Reduction
Shop labor Productivity Higher ~ 4-7x Increase
Shop labor Headcount Lower 1:10 vs. Field labor
VDC* Time Higher ~ 8-17% of labor
Overall Direct Labor Headcount Lower > 20% Reduction
Material Costs Rework rate Lower 2% to 25% Reduct.
Overall Overhead Headcount Higher ~ 4% Increase
* VDC =Virtual Design & Construction
Structural: Waffle Table Elements
Facilities:
Distribution
Pipe Racks
Facilities: Skid-mounted Plant
Tool Install:
Pre-config.
Frames
Facilities:
Gas line pre-
fabrication

Source: M+W Group18 September 2016
Sustainable Energy Supply Options Renewable Energy
Renewable energy sources are site-dependent
100% renewable energy supply to a fab is unlikely
Space requirements
Remote locations inevitable
Energy storage required for high quality power supply
Wind Park 22x 6 MW units
15 to 20 km² **
Potential CO2 reduction in
case of 100% utilization of
renewable energies is
approx. 540,000 t/a*
** Depending on annual and maximum wind conditions
PV Park 350 MWp
5 km² *
Photovoltaic Wind Biomass
* Related to global irradiation of 1,300 kWh/m²/a
Agriculture Area Short Turnover Plantation 330 km²
Crop Straw 700 km²
* Assumes CO2 emission of 0.578 kg/kWh elec. For a
25k m² Fab with power demand of 420 GWh/a

Source: M+W Group19 September 2016
Sustainable Energy Supply Options Cogeneration & Trigeneration Plant Scenarios
Scenario Type Scope
Base Load Cogeneration Provision of base load of hot water (summer)
& corresponding electrical power capacity
Extended
Load
Trigeneration Provision of higher load of hot & chilled water
& corresponding electrical power capacityWinter: Hot Water (up to 100%)
Summer: Base Load of Hot Water & Share of Chilled
Water
Full Load Trigeneration Provision of full load of electrical power
& hot and chilled waterWinter: 100% Hot Water & Share of Chilled Water
Summer: Base Load of Hot Water & 100% Chilled
Water
Alternative sustainable energy supply strategies effect CAPEX and ROI periods
Example: 25k m² Wafer Fab in Asia, Electrical Power 80 €/MWh, Natural Gas 25 €/MWh(LHV)
0
100,000
200,000
300,000
400,000
500,000
600,000
0%
20%
40%
60%
80%
100%
120%
Conventional Base Load Extended Load Full Load HQ Power
CO
2 E
mis
sio
n in
to
ns/
year
Ene
rgy
Co
st &
Fac
ility
Sys
tem
Inve
stm
en
t
Additional Maintenance Natural Gas Electrical Power CO2 Emission Investment Facilities
+0.3% +0.7%+7.1%
-1.0% -3.0%
-29.5%
-1.3%
-3.6%
-35.1%
No Power Plant
ROI
2.7 years
ROI
6.0 yearsROI
6.5 years
Additional
Investment*
Annual
Savings
CO2
Saving
Cogeneration Trigeneration
0
100,000
200,000
300,000
400,000
500,000
600,000
0%
20%
40%
60%
80%
100%
120%
Conventional Base Load Extended Load Full Load HQ Power
CO
2 E
mis
sio
n in
to
ns/
year
Ene
rgy
Co
st &
Fac
ility
Sys
tem
Inve
stm
en
t
Additional Maintenance Natural Gas Electrical Power CO2 Emission Investment Facilities

Source: M+W Group20 September 2016
Integrated Waste ReductionSummary
An Integrated Waste Reduction Program considers multiple
interactions and dependencies by utilizing LCA methods
Waste reduction focuses on fab operations
New water treatment technologies and advanced drain
segregation can improve a site’s overall reclaim ratio >75%
A reduction in process exhaust treatment volumes has a
significant leverage on fab power and water demand.
Improvements during fab construction include modular or
pre-assembled building & facility systems or elements.
Alternative energy supply concepts can further reduce
energy demand and the CO2 footprint of the wafer fab.
Tri-generation requires acceptance of ROI periods > 6 years,
pending power to gas price ratio
Resource efficiency and waste reduction have become
major considerations for wafer fab design / operation.

M+W Group
Lotterbergstraße 30
70499 Stuttgart, Germany www.mwgroup.net
Hartmut Schneider
Phone: +49 711 8804-1431
Mail: [email protected]
T H A N K Y O U