summer 2005 medallion success formula
TRANSCRIPT

A Report to the Vermont Business Roundtable
& the Vermont Principals’ Association
MEDALLION SUCCESS FORMULA:
Summer 2005
Examining Special Case Schools
By Marc Patry, Ph.D., M.L.S. and Brian T. O'Connell, M.A.
Castleton State College

1
Table of Contents
Acknowledgements................................................................................................................2
Introduction............................................................................................................................3
Executive Summary ...............................................................................................................4
Background............................................................................................................................5
Method ...................................................................................................................................7
Results....................................................................................................................................10
Discussion..............................................................................................................................19
Recommendations..................................................................................................................21
Conclusion .............................................................................................................................22
References..............................................................................................................................23

2
Acknowledgements
This report has benefited from the leadership of the Vermont Business Roundtable’s
(Roundtable) Education Working Group, which was instrumental in helping to frame the nature
of this inquiry and research questions. Members of the Working Group include: Chairman, Tim
Volk, Kelliher Samets Volk; Phil Benoit, Middlebury College; Julie Boucher, Marsh
Management Services Inc.; Bob Clarke, Vermont State Colleges; Staige Davis (ex-officio),
Lang Associates; Chris Dutton, Green Mountain Power Corporation; Jim Hester, MVP
Health Care, Vermont Region; Rick Manahan, Peoples Trust Company; Mary McLaughlin,
Adelphia; John O’Kane, IBM Systems and Technology Group; Carl Pinkham, Norwich
University; Alan Port, Paul Frank + Collins P.C.; Chris Robbins, EHV-Weidmann Industries,
Inc.; Myron Sopher, Sopher Investment Management, Inc.; Jim Stillman, S.T. Griswold &
Co., Inc.; Fran Voigt, New England Culinary Institute; and, Steve Voigt, King Arthur Flour
Company, Inc.
Appreciation is also given to the principals, administrators, and faculty of the schools who
participated in this study and who welcomed the opportunity to share their formulas for success.
Finally, we wish to thank the staff of the Roundtable and the Vermont Principals’ Association
(VPA) for supporting this work.
Researchers Marc Patry, Principal Investigator, Ph.D., M.L.S Castleton State College, Department of Psychology Brian O’Connell, Co-Investigator, M.A. Forensic Psychology Castleton State College, Department of Psychology

3
Introduction
For 13 years, the Roundtable has formally recognized high academic achievement by students
and overall school performance through its Medallion Awards Program, which lauds schools at
the elementary, middle, and high school levels. Gold Medallion Awards are given to one school
in each category that stands above its peers, as determined by an independent team of judges
comprised of Roundtable members. Final determinations are made after evaluation of both
quantitative and qualitative variables.
Vermont, as a state, has historically not experienced high academic achievement by schools from
communities with poor socio-economic indicators. This pattern is generally the case across the
country as well. However, the Roundtable has observed during this timeframe that some schools
do an excellent job at supporting all their students to achieve, regardless of the community
factors that otherwise might contraindicate academic success.
This study, conducted by researchers at Castleton State College, and funded jointly by the
Roundtable and VPA, examines a number of high-poverty, high-performing schools to determine
their formulas for success. It is hoped that information gleaned from this experience will be
useful to other educators who face similar challenges.

4
Executive Summary
In the summer of 2004, the Roundtable conducted a research study to investigate the academic
environments surrounding schools that had received Medallion Awards. In the course of that
investigation, four schools were identified as special case schools. These schools were deemed
special because they ranked in the top 15% of schools in the state academically, however, the
communities in which they were located were similar to the communities of schools that were
ranked in the bottom 15% of schools.
In order to investigate how these four special case schools might have been able to overcome
community barriers to academic success, this study was launched. Specifically, the sponsors of
this study sought to compare the academic culture of the four special case schools with the
academic culture of four top 15% schools and four bottom 15% schools. Ultimately, due to low
response rates, the actual comparison was between just two of the four special case schools and
two of the top 15% schools, with some qualitative data obtained from a third special case school.
The results indicated that:
• Special case schools and top 15% schools both demonstrate a high level of
involvement, and are similar on all dimensions of academic culture;
• Program development and staff development are particularly important to academic
success for schools; and,
• Both categories of schools were similar in their job satisfaction levels, even though
those working in special case schools were less satisfied with their salaries than were
those working in the top 15% schools.
5
Medallion Success Formula: Examining Special Case Schools
Background
In the summer of 2004, the Roundtable conducted a research study to investigate the
environments surrounding schools that had received a Medallion Award. In order to adequately
investigate these environments, schools that had received a Medallion Award (schools that
ranked in the top 15% of schools in the state based on standardized test scores) were compared
with schools that were not as successful academically (schools that ranked in the bottom 15% of
schools academically based on standardized test scores). These two academic groups were
compared on 14 different school and community related variables. The results revealed that
differences between schools in the top 15% and schools in the bottom 15% could be reduced to
differences based on community income level and education level. Schools ranked in the top
15% academically were found in communities with significantly higher income levels and
education levels than those schools ranked in the bottom 15%.
In addition to finding differences based on income and education, the Roundtable study in 2004
identified four special case schools. These four schools were ranked in the top 15% of schools
academically; however, their school and community-related variables were akin to those of the
schools ranked in the bottom 15% academically. In other words, these four schools were in
communities with income and education levels similar to those communities containing schools
in the bottom 15%. The difference, however, was that they were in the top 15% academically.

6
In addition to identifying the schools as special for 2004, researchers examined their Medallion
history as well. Two of the schools had received their first nomination for a Medallion Award in
2004. However, two other schools had both demonstrated some history or pattern of academic
success; and those same schools seemed to have exceptionally high test scores in some areas.
The purpose of this current study was to further investigate what might be driving the success of
the special case schools despite community-related variables that would be expected to hinder
that success. More specifically, three research goals were formulated:
Goal 1
• To measure the academic culture of the four special case schools to determine areas of
strength that may be driving success.
Goal 2
• To measure the academic culture of four schools in the top 15% of schools and four
schools in the bottom 15% in order to compare them to the special case schools.
Goal 3
• To identify new ways to measure school success and recommend ways for engendering
success in schools.

7
Method
Participants
A total of 12 schools were invited to participate in this study, including the four special case
schools, in order to measure the culture of their schools. To have a basis for comparison, four
schools, which ranked in the top 15% academically in the 2004 study, were selected at random
and invited to participate Also, for the purpose of comparison, four schools, which ranked in the
bottom 15% in the 2004 study, were invited to participate.
From each of these 12 schools, all administrators and faculty were contacted by representatives
of the Roundtable and VPA and invited to participate. Initial letters and follow-up requests were
made by means of both written and verbal communications. Unfortunately, the response rate
from the schools was quite low; only two special case schools and two top 15% schools
participated. None of the bottom 15% schools participated in the study.
From the four participating schools, a total of 24 administrators and faculty members took part in
the surveys. However, because a number of participant surveys had missing data, the total
number of complete data sets available for the analysis in this study was 16. The sample was
comprised of 69% faculty; 13% principals; 6% assistant principals; 6% other administrators; and,
6% did not report. Self-reported gender of participants was 81% female and 19 % male.
Educational attainment was reported as: 56% bachelor’s degree; 25% master’s degree; 13%
doctorate degree; and 6% did not report.

8
In addition to these schools, one of the other special case schools declined to participate in the
structured questionnaire format of the study, but did agree to provide the research team with
qualitative data through an interview. That school’s interview data is included in the results
section.
Materials
In order to assess school culture, participants were asked to complete the School Work Culture
Profile (SWCP) that was developed by Snyder and Snyder (1998). The SWCP is designed to
measure the strength of school involvement (Snyder, Acker-Hocevar, & Snyder, 2000) by
measuring one factor of schoolwork culture, which is divided into four higher order factors that
measure interdependent functions. The four factors are the following: (a) school-wide planning
and organization; (b) staff development; (c) program development; and (d) school-wide
assessment.
The SWCP is composed of 60 items that are rated on a scale from 1-5, thereby making the
overall scale range 60-300. Snyder et al. (2000) reported large differences in the amount of
involvement schools had in their work culture with scale score differences of only 50 points.
Therefore, the scale is broken into 50-point sections for rankings of school involvement. The
scoring scheme can be seen in Table 1.

9
Table 1
Scoring Scale for the SWCP
Point Total School Involvement
250-300 High Involvement School
200-249 Moderately High Involvement School
150-199 Moderately Low Involvement School
100-149 Low Involvement School
In addition to the SWCP, a small scale was added to the end of this measure that asked some
demographic questions relating to participants’ age, gender, years of education, highest degree
earned, current position in their school, and length of employment with their school. Participants
were also asked to rate on a 5-point bipolar scale their satisfaction with their current employment
and salary, as well as the quality of their professional relationship with administrators and
faculty.
Procedure
As described above, 12 schools were invited to participate based on their academic standing in
the 2004 study. A letter was sent to the principal of each of the invited schools by the
Roundtable and the VPA to solicit their participation. Two weeks after the initial letter was sent,
a telephone call was made to each of the schools by a member of the research team to again
solicit participation. Two weeks subsequent to the telephone calls, a second letter was sent by
the project sponsors to remind schools of the study and solicit participation. Finally, two weeks

10
following the second round of letters, telephone calls were placed to each of the schools by the
VPA.
In order to complete the questionnaire, participants were asked to go to a link on the Internet that
was provided to them in the solicitation letters. Here they first read instructions on completing
the SWCP and supplemental questions. Participants then completed the questionnaire and
clicked a submit button when they were finished, which automatically entered their data into a
database.
Results
First, due to the unexpected and disappointingly low sample size, researchers suggest that it is
worthy to note the source of response rates. In doing so, we find that 87% of the sample is
comprised of responses from special case schools. It is also important to recognize that the two
schools in the top 15% each have a response rate of one. Therefore, responses presented for
those schools are not necessarily representative of the entire school culture, since they represent
the opinion of only one individual.
Total Scores
The total scores for the schools place each of them in the range of a “moderately high
involvement” school (200-249) except for one of the top 15% schools, which ranks in the “high
involvement” category (250-300). Table 2 lists total scores for the schools by rank.

11
Table 2
Total School Scores on the SWCP by Academic Rank
Special Case Schools Top 15%
234.38 231.00
227.67 268.00
Total Scores Mean Comparison
50
100
150
200
250
300
Special Case Schools Top 15%
Below are the results for each of the four dimensions included in the SWCP. The subheadings
denote each one of those scales. In addition to overall scores, we have identified specific items of
that dimension that seem to be important to these schools. Those items were identified as
important when each of the four schools ranked it as a “4 or above” on a 5-point scale.
School Wide Planning and Organization
School Wide Planning and Organization is one of the four dimensions within the SWCP. It
measures the involvement of the school faculty and administrators, as well as parents, in
12
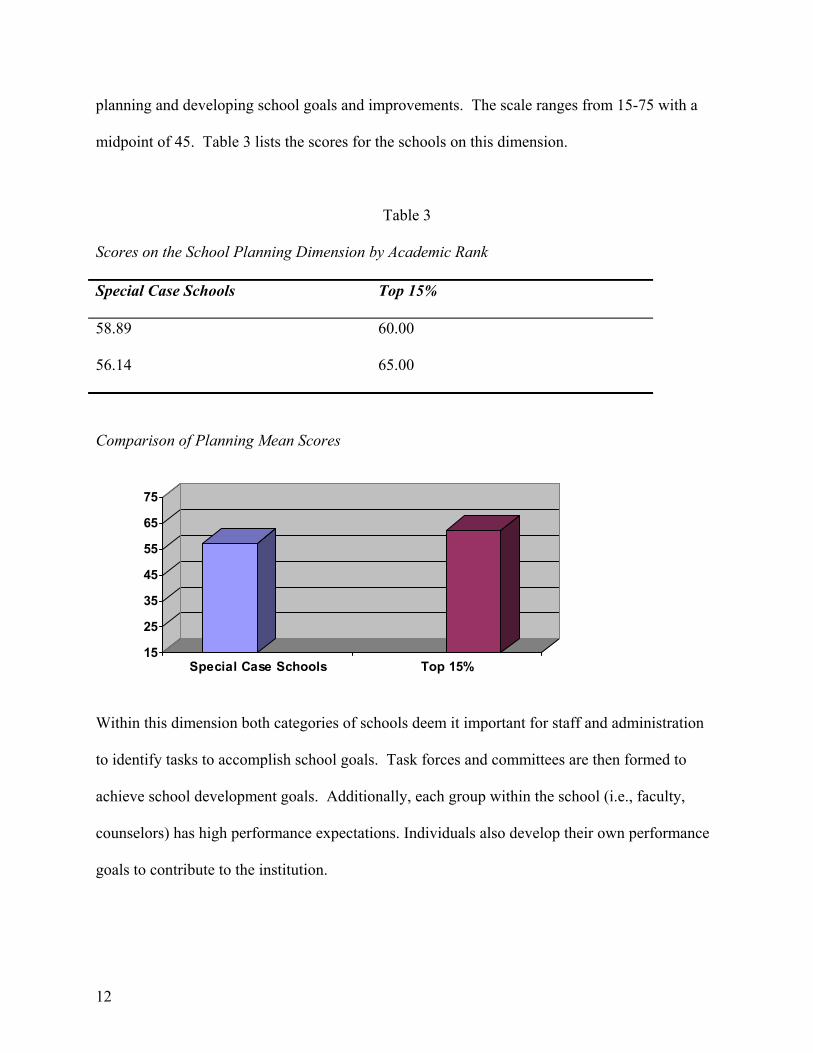
planning and developing school goals and improvements. The scale ranges from 15-75 with a
midpoint of 45. Table 3 lists the scores for the schools on this dimension.
Table 3
Scores on the School Planning Dimension by Academic Rank
Special Case Schools Top 15%
58.89 60.00
56.14 65.00
Comparison of Planning Mean Scores
15
25
35
45
55
65
75
Special Case Schools Top 15%
Within this dimension both categories of schools deem it important for staff and administration
to identify tasks to accomplish school goals. Task forces and committees are then formed to
achieve school development goals. Additionally, each group within the school (i.e., faculty,
counselors) has high performance expectations. Individuals also develop their own performance
goals to contribute to the institution.

13
Staff Development
Staff development is the second of the four dimensions on the SWCP and it is designed to
measure the level of involvement that the school has in developing the skill set of its staff. The
scale ranges from 15-75 with a midpoint of 45. Table 4 lists the scores for the schools on this
dimension.
Table 4
Scores on the Staff Development Dimension by Academic Rank
Special Case Schools Top 15%
55.73 59.00
58.75 73.00
Comparison of Staff Development Mean Scores
15
25
35
45
55
65
75
Special Case Schools Top 15%
The attributes of staff development that emerge as being important to all schools alike, are those
programs that provide an opportunity to gain new knowledge; also, the supervision of teaching,
which is based on cooperatively identified goals; and, collaborative staff work to solve problems
and make decisions in productive ways.

14
Program Development
The third dimension of the SWCP, program development, is designed to measure overall school
involvement in the planning of instructional development for the students. The scale ranges
from 15-75 with a midpoint of 45. Table 5 displays the scores for the schools on this dimension.
Table 5
Scores on the Program Development Dimension by Academic Rank
Special Case Schools Top 15%
62.80 61.00
61.87 68.00
Comparison of Program Development Mean Scores
15
25
35
45
55
65
75
Special Case Schools Top 15%
Within this dimension all schools appear to find it important to guide instructional programs by
learning objectives. In this way, teachers identify learning objectives for students, and then
students are provided with reinforcement and feedback on their performance. Students engage in

15
cooperative learning and are provided sufficient time to succeed in learning new tasks.
Community resources are also used in the instructional program and the available resources are
used to meet school goals. Finally, staff members use one another as resources in instruction.
School-Wide Assessment
School-wide assessment is the fourth and final dimension of the SWCP. It is designed to
measure the level of involvement of the school in assessing its progress toward school goals and
assessing the performance of its staff members. The scale ranges from 15-75 with a midpoint of
45. Table 6 displays the scores on the dimension.
Table 6
Scores on the School-Wide Assessment Dimension by Academic Rank
Special Case Schools Top 15%
56.11 51.00
53.57 62.00
Comparison of School-Wide Assessment Mean Scores
15
25
35
45
55
65
75
Special Case Schools Top 15%

16
Data from each of the four schools indicated participants’ views that it is important to assess
student achievement in relation to the school’s development goals and emerging challenges.
Participants from all four schools also find it beneficial to include student achievement data in
the overall assessment of the school.
Comparing Dimensions
In order to determine if these schools deem one dimension more important than the other, we
compared each of the dimensions to each other. The data show that program development is
most important to both school types and that school assessment carries the least amount of
weight. Staff development is rated as the next most important focus of involvement for these
schools after program development.
Comparison of Dimensions on the SWCP for all Schools
15
25
35
45
55
65
75
SchoolPlanning
StaffDevelopment
ProgramDevelopment
SchoolAssessment
Job Satisfaction
Participants were asked to rate four dimensions of their position that relate to job satisfaction on
a scale from 1-5, with higher scores representing more satisfaction or better relationships. The

17
four dimensions were as follows: (a) professional relationships with faculty; (b) professional
relationships with administration; (c) level of satisfaction with their current position; and (d) how
fair they believe their salary is compared to other educators in similar positions in the state of
Vermont. The graph below displays the comparison of these ratings between the special case
schools and the top 15% schools.
0
1
2
3
4
5
FacultyRelationships
AdminRelationships
JobSatisfaction
SalarySatisfaction
Special Case SchoolsTop 15%
Qualitative Interview Data
As previously mentioned, one of the special case schools declined to participate in the structured
survey format of this study, but the principal did offer to explain his educational philosophy in an
interview format. The interview was conducted via telephone with one of the members of the
research team. The following is the information gleaned from that interview.
In the late 1990’s when the current accountability system started to go into effect, this school
began by ignoring some of the standards because it was felt that they were unfair to their
students. However, after achievement scores began to fall, the school was labeled as a failing
school. This labeling upset the school staff and the community and caused a change of course
within the school administration. The school staff continued to accept their students for who
18
they were, and understood the fact that they came from families without a record of educational
success. However, the school also began to hold students to a standard. This combination of
accepting ability yet holding students to a standard, was referred to by the principal as “hard
softness”.
In this same school, teachers also began to change their teaching style to incorporate preparation
for the New Standards Reference Exam (NSRE) tests. For example, students would spend time
in school writing for one hour straight, so that they would be prepared for that task on the NSRE
and not become fatigued. Additionally, first and second grade teachers were trained as reading
teachers in order to advance the reading level of students. Teachers are now continually sent to
workshops to be trained on Vermont rubrics in order to sufficiently prepare their students for
standardized tests, and the school as a whole now strives for consistency in instruction
throughout grades K-5.
The school makes an effort to function cooperatively within the community in which it is
located. School staff members are direct with parents about making sure their children get their
homework done, but they are respectful in that request. School officials try to be practical about
the future for their students and, therefore, they do not push all of their students toward college.
The school feels that the financial burden of college is too great for some of their students, so
they are encouraged to pursue other avenues.
The structure of the school itself de-emphasizes the dichotomy between administration and
faculty/staff. Everyone who works at the school is invested in it. Faculty/staff and

19
administration all pitch in to do their part, to the point that the principal will serve lunch in the
cafeteria if need be. The principal’s philosophy is that everyone must feel important, he said,
“Teachers are like pitchers of water pouring out water all day, someone has to fill up the
pitchers. That’s my job.”
Discussion
As demonstrated by the response rates, two special case schools appear to have very high levels
of involvement compared to other schools. The Roundtable study in 2004 identified these two
schools as the greatest achievers despite income and educational barriers to academic success in
their communities. In the present study, these two schools have outshined others again by
simply responding to a survey that was designed to further success in Vermont schools. This
indicates to the research team a high level of investment in the school by the staff and a
willingness to improve the school.
The SWCP revealed that the special case schools are quite similar to the top 15% schools on the
total score as well as on each of the four dimensions. The top 15% schools do score slightly
higher on the total score and the dimensions, but as mentioned before, the small sample size for
the top 15% schools is quite possibly inflating their scores. A larger sample might very well
result in lower SWCP scores.
From each of the four dimensions it seems as though some common themes can be inferred
among these four successful schools:
20
• The development of school goals is a priority;
• Teamwork and task oriented organization is vital to achievement of those goals;
• Assessing progress toward school goals is taken seriously;
• High standards for students and staff are articulated in the culture; and,
• Continual learning for staff is a priority.
Admittedly, due to the statistically insignificant sample size, there is danger in building up too
much in these results. It is recognized that this discussion could be an oversimplification of the
four dimensions, and so we encourage the reader to focus on the important items within each
dimension when making recommendations to schools. At the same time, however, we believe it
is helpful to look at this very broad and simplified view to see from which sources the successful
schools draw their strengths.
What was surprising in the results was that the role of parental involvement did not stand out as a
common element among these four schools. However, the schools did rank the use of
community resources for instruction as high. Consequently, it seems possible to have a
successful school even if parental involvement is not high, as long as the community at large is
supportive of the school in some way.
In regard to job satisfaction, the only real difference that seems to exist between the two groups
is in their relative level of satisfaction with their salaries. By itself, salary dissatisfaction does
not seem to be affecting overall job satisfaction. Also, by the demonstrated academic success of
the school, discontent with salary does not seem to be affecting the instruction of the students.
21
Limitations
Unfortunately, the small sample size in this study prohibited any statistical comparisons that
would allow us to assign probabilities. Additionally, the small sample size of the two top 15%
schools causes us to question the accuracy of comparisons made between these two groups.
And, the lack of any participants from the bottom 15% totally prohibits us from making any
conclusions about what truly sets these schools apart from those schools that are unsuccessful.
With the small sample size we also undoubtedly have a selection bias. Those individuals that
chose to respond are the most motivated and involved individuals in the school. Therefore, all
scores must be assumed to be higher than they would be if the entire school was sampled.
Recommendations
Currently, the Medallion Awards Program recognizes schools that have obtained a certain level
of academic success. While it is appropriate to recognize the achievers and encourage others to
seek that level, it may also serve to discourage some schools that face larger challenges.
We would recommend a new structure for the awards. One class of awards could be given to
schools that have obtained academic success in the same way that they are now. A second class
of awards could be given to schools that have made a significant improvement from one year to
the next. These awards would encourage the road to success for those schools that face great
challenges in getting to the top 15% of schools.

22
Within this dichotomous award scheme, based on the findings of this study, it seems most
appropriate to reward schools that can provide evidence of a significant effort at program
development and staff development since these seem to be important in the recipe for a
successful school. Perhaps any monetary award given could be specified as a contribution to
program and staff development, particularly to schools that are given an award based on
improvement. This might then assist these schools in obtaining even more improvement and
reaching a level of success.
In identifying schools that have reached an appropriate level of success, it might also be wise to
rethink using the top 15% of schools. If only the top 15% is considered successful, then success
is limited to a finite number of schools in the state. Those schools that have the greatest amount
of built in keys to success are likely to dominate that 15%. Similarly, some schools may
continually reach the top 16% or 18% without recognition. What might serve more is setting a
bar of achievement such as 90% of students passing a particular test. Then, the number of
schools that achieve that bar are eligible for an award regardless of whether that may be 30% of
schools.
Conclusion
This study does provide some insight as to the ingredients of a successful school. Teamwork,
cohesion, and an investment by the staff are important as well as program and staff development.
The question we now face is: how does a school engender a sense of teamwork and investment
in order to achieve adequate program and staff development? That question would be a worthy
focus of the next phase of research in this medallion research series.

23
References
Kannapel, P.J., Clements, S.K., et al (2005). Inside the Black Box of High-Performing High-
Poverty Schools: A Report from the Pritchard Committee for Academic Excellence.
Lexington, KY.
Snyder, K.J., Acker-Hocevar, & Snyder, K. M. (2000). Living on the Edge of Chaos: Leading
Schools into the Global Age. Milwaukee: ASQ The Quality Press.
Snyder, K.J., Acker-Hocevar, & Snyder, K. M. (1998). The School Work Culture Profile.
International School Connection, Inc. Tampa, FL.
Vermont Business Roundtable. (2004). Medallion Success Formula. South Burlington, VT:
O’Connell, B. T.
For additional information regarding this report, please contact the Vermont Business Roundtable or the Vermont Principals’ Association.
The Vermont Business Roundtable is composed of 120 CEOs of Vermont's top private and nonprofit employers dedicated to making Vermont the best place in America to do business, be educated, and live life through
collaboration, research and analysis, and communication and advocacy. Member businesses employ over 47,000 employees and are represented in virtually every county across Vermont.
69 Swift Street, Suite 300 • So. Burlington, VT 05403 • Phone: 802-865-0410 • Fax: 802-865-0662President: Lisa Ventriss: [email protected] • Website: www.vtroundtable.org
The Vermont Principals’ Association is a nonprofit alliance of education leaders collaborating on mentoring, professional development and networking while overseeing Vermont’s co-curricular activities. The Vermont Principals'Association exists to coordinate the collective interests and needs of school leaders and to enhance their professional
growth and competency for the purpose of improving the quality of educational opportunities for the youth of Vermont.
2 Prospect Street, Suite 3 • Montpelier, VT 05602 • Phone: 802-229-0547 • Fax: 802-229-4801Executive Director: Ray Pellegrini: [email protected] • Website: www.vpaonline.org