summary of the c. elegans lifespan experiments all rnai feeding conditions and different treatments...
TRANSCRIPT
Supplementary information
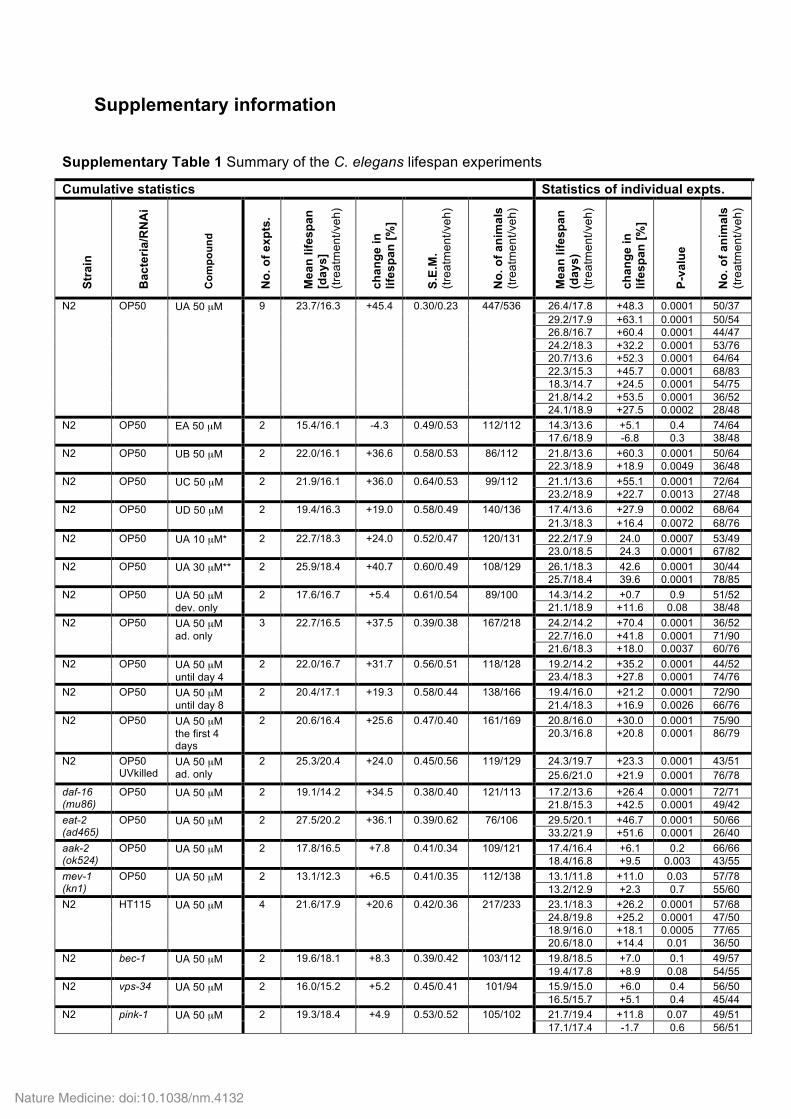
Supplementary Table 1 Summary of the C. elegans lifespan experiments
Cumulative statistics Statistics of individual expts.
Stra
in
Bac
teria
/RN
Ai
Com
poun
d
No.
of e
xpts
.
Mea
n lif
espa
n [d
ays]
(tr
eatm
ent/v
eh)
chan
ge in
lif
espa
n [%
]
S.E.
M.
(trea
tmen
t/veh
)
No.
of a
nim
als
(trea
tmen
t/veh
)
Mea
n lif
espa
n (d
ays)
(tr
eatm
ent/v
eh)
chan
ge in
lif
espa
n [%
]
P-va
lue
No.
of a
nim
als
(trea
tmen
t/veh
)
N2 OP50 UA 50 µM 9 23.7/16.3 +45.4 0.30/0.23 447/536 26.4/17.8 +48.3 0.0001 50/37 29.2/17.9 +63.1 0.0001 50/54
26.8/16.7 +60.4 0.0001 44/47 24.2/18.3 +32.2 0.0001 53/76 20.7/13.6 +52.3 0.0001 64/64 22.3/15.3 +45.7 0.0001 68/83 18.3/14.7 +24.5 0.0001 54/75 21.8/14.2 +53.5 0.0001 36/52 24.1/18.9 +27.5 0.0002 28/48
N2 OP50 EA 50 µM 2 15.4/16.1 -4.3 0.49/0.53 112/112 14.3/13.6 +5.1 0.4 74/64 17.6/18.9 -6.8 0.3 38/48
N2 OP50 UB 50 µM 2 22.0/16.1 +36.6 0.58/0.53 86/112 21.8/13.6 +60.3 0.0001 50/64 22.3/18.9 +18.9 0.0049 36/48
N2 OP50 UC 50 µM 2 21.9/16.1 +36.0 0.64/0.53 99/112 21.1/13.6 +55.1 0.0001 72/64 23.2/18.9 +22.7 0.0013 27/48
N2 OP50 UD 50 µM 2 19.4/16.3 +19.0 0.58/0.49 140/136 17.4/13.6 +27.9 0.0002 68/64 21.3/18.3 +16.4 0.0072 68/76 N2 OP50 UA 10 µM* 2 22.7/18.3 +24.0 0.52/0.47 120/131 22.2/17.9 24.0 0.0007 53/49
23.0/18.5 24.3 0.0001 67/82 N2 OP50 UA 30 µM** 2 25.9/18.4 +40.7 0.60/0.49 108/129 26.1/18.3 42.6 0.0001 30/44
25.7/18.4 39.6 0.0001 78/85 N2 OP50 UA 50 µM
dev. only 2 17.6/16.7 +5.4 0.61/0.54 89/100 14.3/14.2 +0.7 0.9 51/52
21.1/18.9 +11.6 0.08 38/48 N2 OP50 UA 50 µM
ad. only 3 22.7/16.5 +37.5 0.39/0.38 167/218 24.2/14.2 +70.4 0.0001 36/52
22.7/16.0 +41.8 0.0001 71/90 21.6/18.3 +18.0 0.0037 60/76
N2 OP50 UA 50 µM until day 4
2 22.0/16.7 +31.7 0.56/0.51 118/128 19.2/14.2 +35.2 0.0001 44/52 23.4/18.3 +27.8 0.0001 74/76
N2 OP50 UA 50 µM until day 8
2 20.4/17.1 +19.3 0.58/0.44 138/166 19.4/16.0 +21.2 0.0001 72/90 21.4/18.3 +16.9 0.0026 66/76
N2 OP50 UA 50 µM the first 4 days
2 20.6/16.4 +25.6 0.47/0.40 161/169 20.8/16.0 +30.0 0.0001 75/90 20.3/16.8 +20.8 0.0001 86/79
N2 OP50 UVkilled
UA 50 µM ad. only
2 25.3/20.4 +24.0 0.45/0.56 119/129 24.3/19.7 +23.3 0.0001 43/51 25.6/21.0 +21.9 0.0001 76/78
daf-16 (mu86)
OP50 UA 50 µM 2 19.1/14.2 +34.5 0.38/0.40 121/113 17.2/13.6 +26.4 0.0001 72/71 21.8/15.3 +42.5 0.0001 49/42
eat-2 (ad465)
OP50 UA 50 µM 2 27.5/20.2 +36.1 0.39/0.62 76/106 29.5/20.1 +46.7 0.0001 50/66 33.2/21.9 +51.6 0.0001 26/40
aak-2 (ok524)
OP50 UA 50 µM 2 17.8/16.5 +7.8 0.41/0.34 109/121 17.4/16.4 +6.1 0.2 66/66 18.4/16.8 +9.5 0.003 43/55
mev-1 (kn1)
OP50 UA 50 µM 2 13.1/12.3 +6.5 0.41/0.35 112/138 13.1/11.8 +11.0 0.03 57/78 13.2/12.9 +2.3 0.7 55/60
N2 HT115 UA 50 µM 4 21.6/17.9 +20.6 0.42/0.36 217/233 23.1/18.3 +26.2 0.0001 57/68 24.8/19.8 +25.2 0.0001 47/50 18.9/16.0 +18.1 0.0005 77/65 20.6/18.0 +14.4 0.01 36/50
N2 bec-1 UA 50 µM 2 19.6/18.1 +8.3 0.39/0.42 103/112 19.8/18.5 +7.0 0.1 49/57 19.4/17.8 +8.9 0.08 54/55
N2 vps-34 UA 50 µM 2 16.0/15.2 +5.2 0.45/0.41 101/94 15.9/15.0 +6.0 0.4 56/50 16.5/15.7 +5.1 0.4 45/44
N2 pink-1 UA 50 µM 2 19.3/18.4 +4.9 0.53/0.52 105/102 21.7/19.4 +11.8 0.07 49/51 17.1/17.4 -1.7 0.6 56/51
Nature Medicine: doi:10.1038/nm.4132
Ryu et al. – Urolithin A induces mitophagy and improves muscle function
N2 dct-1 UA 50 µM 2 18.1/18.2 -0.5 0.38/0.39 108/105 17.7/17.4 +1.7 0.4 68/64 18.8/19.5 -3.6 0.1 40/41
N2 sqst-1 UA 50 µM 2 17.5/17.8 -1.7 0.33/0.38 109/106 16.9/17.4 -2.8 0.3 68/69 18.5/18.5 +0.0 0.6 41/37
N2 skn-1 UA 50 µM 2 12.4/13.4 -7.4 0.30/0.35 114/123 12.3/13.8 -10.8 0.0029 82/77 12.9/12.7 +1.5 0.9 32/46
N2 OP50 UA 50 µM +NAC
2 22.7/17.0 +33.5 0.43/0.49 152/165 23.3/19.0 +22.6 0.0005 76/74 22.1/15.3 +44.4 0.0001 76/91
N2 OP50 UA 50 µM +Para 4mM D1
2 5.6/4.9 +14.3 0.18/0.17 77/102 3.4/3.1 +9.6 0.02 31/38 6.6/5.9 +11.8 0.0032 46/64
N2 OP50 UA 50 µM +Para 4mM D8***
2 6.4/5.7 +12.3 0.10/0.15 45/70 6.4/5.9 +8.4 0.04 33/43 5.7/5.2 +9.6 0.03 12/27
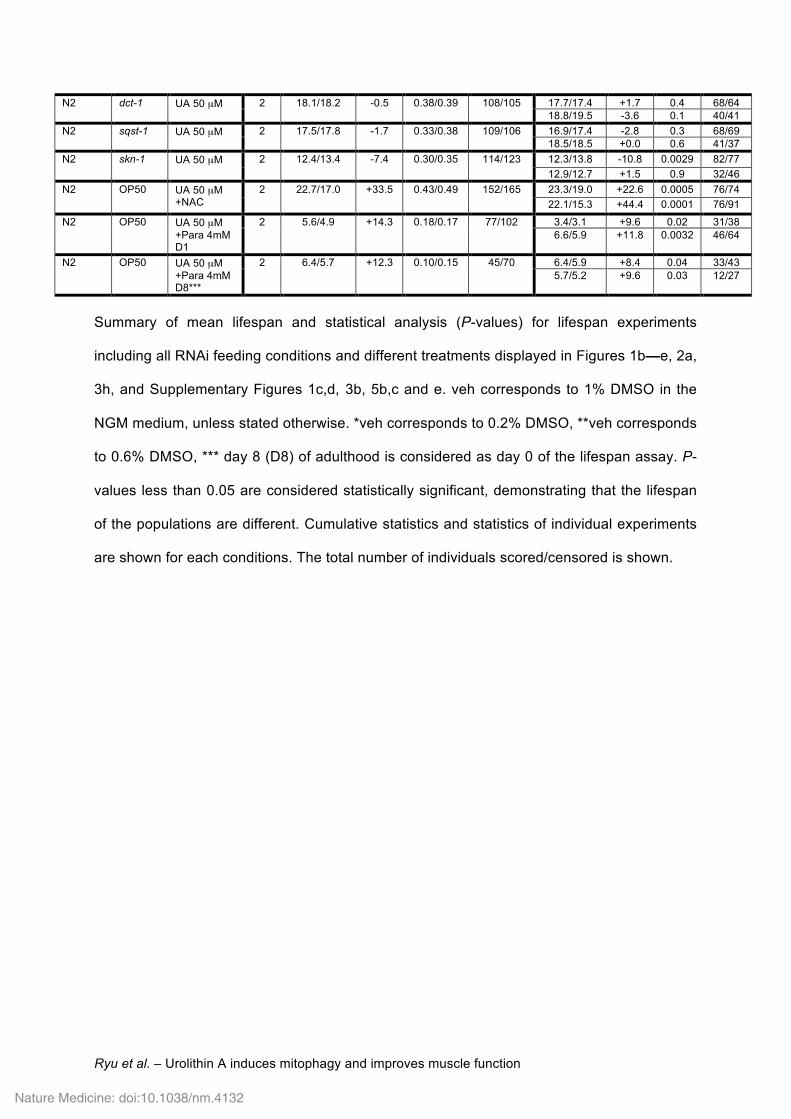
Summary of mean lifespan and statistical analysis (P-values) for lifespan experiments
including all RNAi feeding conditions and different treatments displayed in Figures 1b—e, 2a,
3h, and Supplementary Figures 1c,d, 3b, 5b,c and e. veh corresponds to 1% DMSO in the
NGM medium, unless stated otherwise. *veh corresponds to 0.2% DMSO, **veh corresponds
to 0.6% DMSO, *** day 8 (D8) of adulthood is considered as day 0 of the lifespan assay. P-
values less than 0.05 are considered statistically significant, demonstrating that the lifespan
of the populations are different. Cumulative statistics and statistics of individual experiments
are shown for each conditions. The total number of individuals scored/censored is shown.
Nature Medicine: doi:10.1038/nm.4132
Ryu et al. – Urolithin A induces mitophagy and improves muscle function
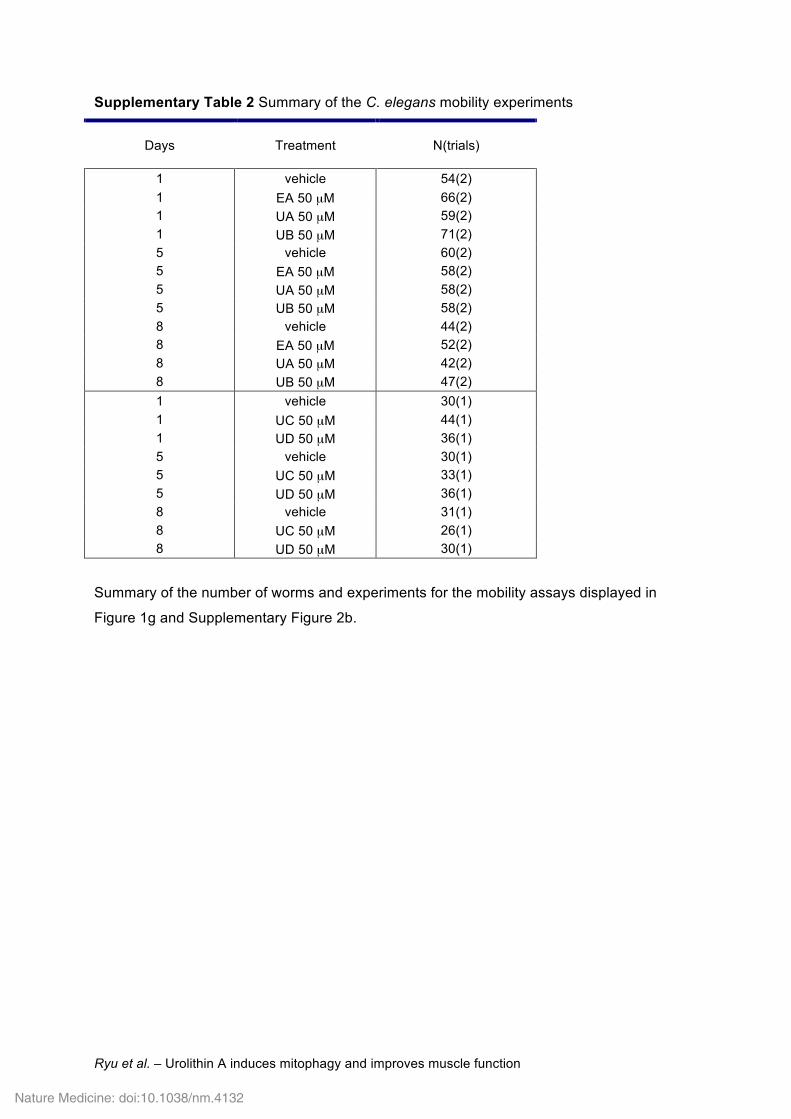
Supplementary Table 2 Summary of the C. elegans mobility experiments
Days Treatment N(trials)
1 vehicle 54(2) 1 EA 50 µM 66(2) 1 UA 50 µM 59(2) 1 UB 50 µM 71(2) 5 vehicle 60(2) 5 EA 50 µM 58(2) 5 UA 50 µM 58(2) 5 UB 50 µM 58(2) 8 vehicle 44(2) 8 EA 50 µM 52(2) 8 UA 50 µM 42(2) 8 UB 50 µM 47(2) 1 vehicle 30(1) 1 UC 50 µM 44(1) 1 UD 50 µM 36(1) 5 vehicle 30(1) 5 UC 50 µM 33(1) 5 UD 50 µM 36(1) 8 vehicle 31(1) 8 UC 50 µM 26(1) 8 UD 50 µM 30(1)
Summary of the number of worms and experiments for the mobility assays displayed in
Figure 1g and Supplementary Figure 2b.
Nature Medicine: doi:10.1038/nm.4132
Ryu et al. – Urolithin A induces mitophagy and improves muscle function
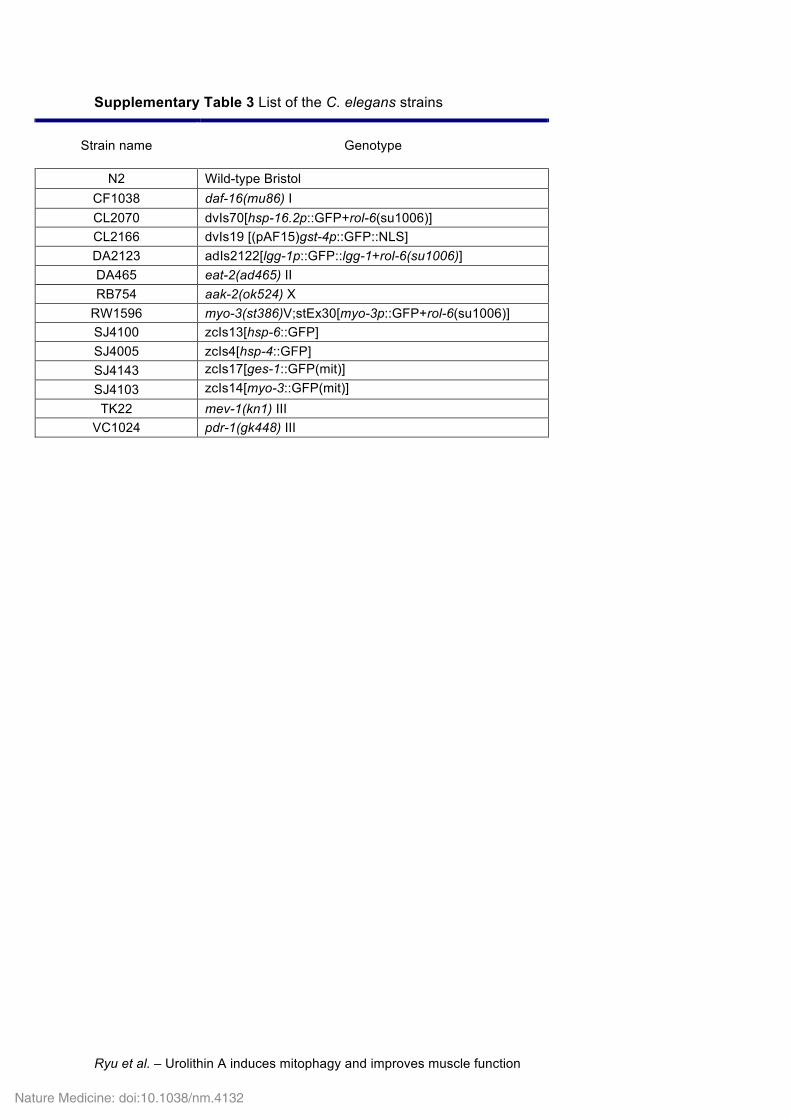
Supplementary Table 3 List of the C. elegans strains
Strain name Genotype
N2 Wild-type Bristol CF1038 daf-16(mu86) I CL2070 dvIs70[hsp-16.2p::GFP+rol-6(su1006)] CL2166 dvIs19 [(pAF15)gst-4p::GFP::NLS] DA2123 adIs2122[lgg-1p::GFP::lgg-1+rol-6(su1006)] DA465 eat-2(ad465) II RB754 aak-2(ok524) X
RW1596 myo-3(st386)V;stEx30[myo-3p::GFP+rol-6(su1006)] SJ4100 zcIs13[hsp-6::GFP] SJ4005 zcIs4[hsp-4::GFP] SJ4143 zcIs17[ges-1::GFP(mit)] SJ4103 zcIs14[myo-3::GFP(mit)] TK22 mev-1(kn1) III
VC1024 pdr-1(gk448) III
Nature Medicine: doi:10.1038/nm.4132
Ryu et al. – Urolithin A induces mitophagy and improves muscle function
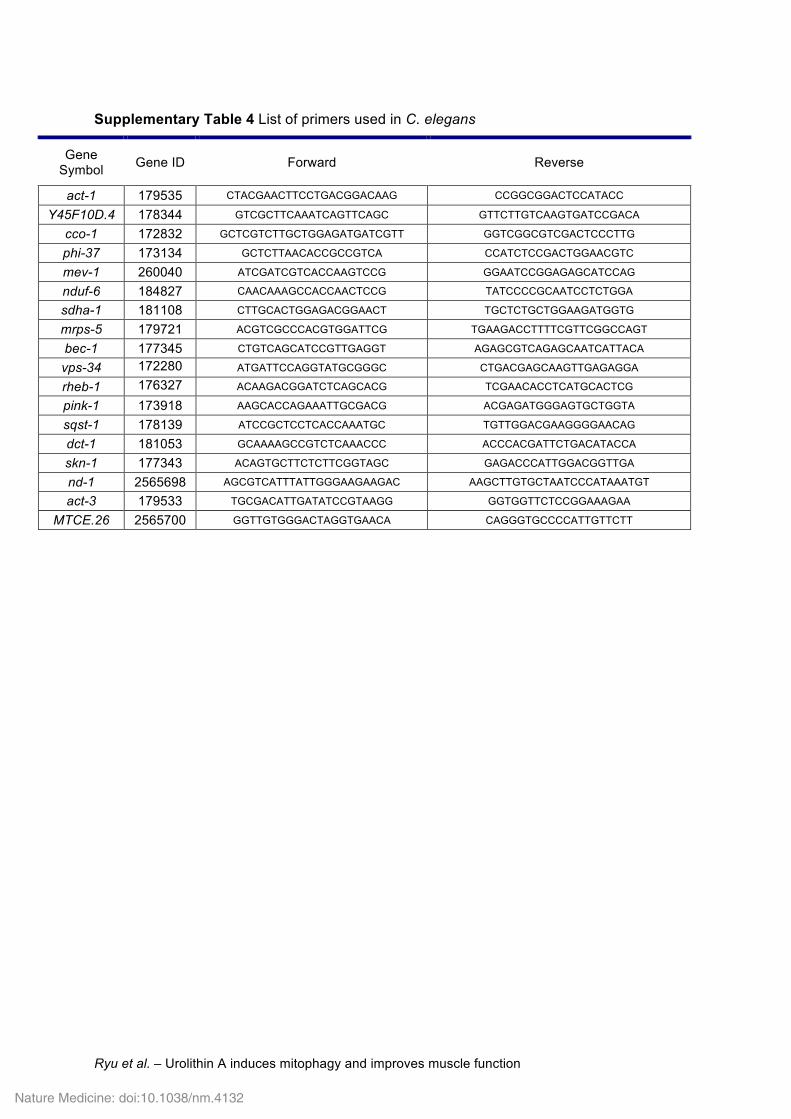
Supplementary Table 4 List of primers used in C. elegans
Gene Symbol Gene ID Forward Reverse
act-1 179535 CTACGAACTTCCTGACGGACAAG CCGGCGGACTCCATACC
Y45F10D.4 178344 GTCGCTTCAAATCAGTTCAGC GTTCTTGTCAAGTGATCCGACA
cco-1 172832 GCTCGTCTTGCTGGAGATGATCGTT GGTCGGCGTCGACTCCCTTG
phi-37 173134 GCTCTTAACACCGCCGTCA CCATCTCCGACTGGAACGTC
mev-1 260040 ATCGATCGTCACCAAGTCCG GGAATCCGGAGAGCATCCAG
nduf-6 184827 CAACAAAGCCACCAACTCCG TATCCCCGCAATCCTCTGGA
sdha-1 181108 CTTGCACTGGAGACGGAACT TGCTCTGCTGGAAGATGGTG
mrps-5 179721 ACGTCGCCCACGTGGATTCG TGAAGACCTTTTCGTTCGGCCAGT
bec-1 177345 CTGTCAGCATCCGTTGAGGT AGAGCGTCAGAGCAATCATTACA
vps-34 172280 ATGATTCCAGGTATGCGGGC CTGACGAGCAAGTTGAGAGGA
rheb-1 176327 ACAAGACGGATCTCAGCACG TCGAACACCTCATGCACTCG
pink-1 173918 AAGCACCAGAAATTGCGACG ACGAGATGGGAGTGCTGGTA
sqst-1 178139 ATCCGCTCCTCACCAAATGC TGTTGGACGAAGGGGAACAG
dct-1 181053 GCAAAAGCCGTCTCAAACCC ACCCACGATTCTGACATACCA
skn-1 177343 ACAGTGCTTCTCTTCGGTAGC GAGACCCATTGGACGGTTGA
nd-1 2565698 AGCGTCATTTATTGGGAAGAAGAC AAGCTTGTGCTAATCCCATAAATGT
act-3 179533 TGCGACATTGATATCCGTAAGG GGTGGTTCTCCGGAAAGAA
MTCE.26 2565700 GGTTGTGGGACTAGGTGAACA CAGGGTGCCCCATTGTTCTT
Nature Medicine: doi:10.1038/nm.4132
Ryu et al. – Urolithin A induces mitophagy and improves muscle function
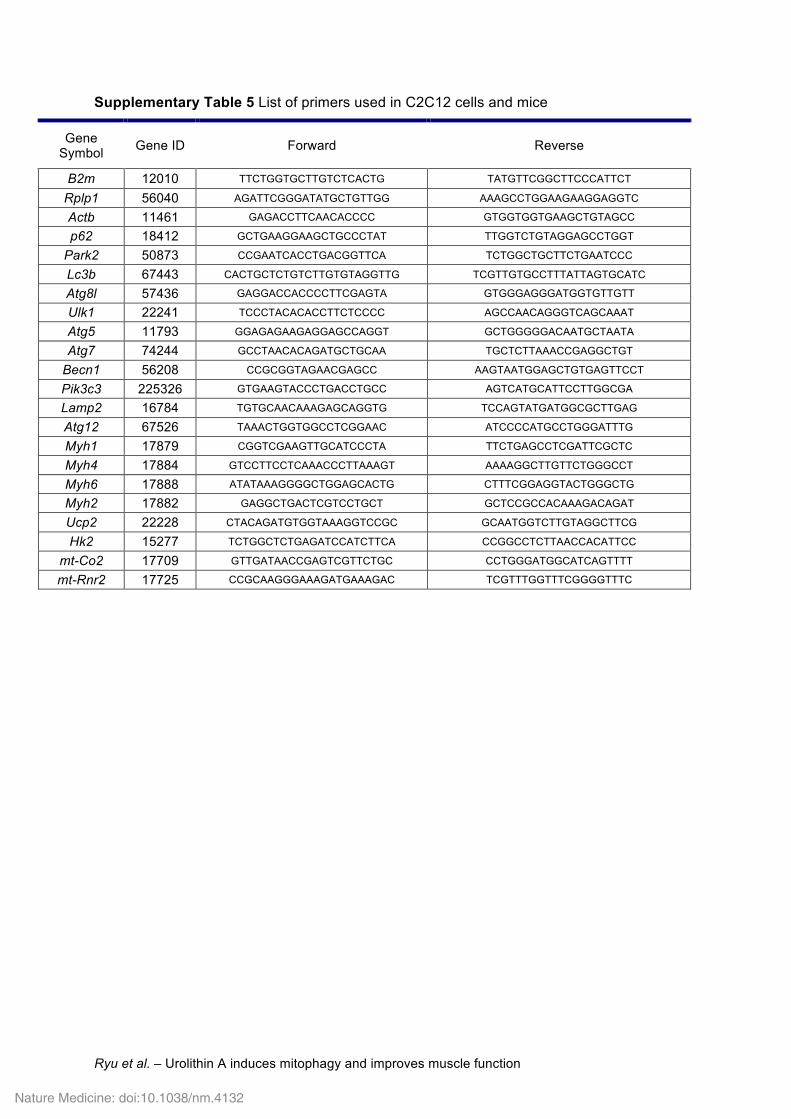
Supplementary Table 5 List of primers used in C2C12 cells and mice
Gene Symbol Gene ID Forward Reverse
B2m 12010 TTCTGGTGCTTGTCTCACTG TATGTTCGGCTTCCCATTCT
Rplp1 56040 AGATTCGGGATATGCTGTTGG AAAGCCTGGAAGAAGGAGGTC
Actb 11461 GAGACCTTCAACACCCC GTGGTGGTGAAGCTGTAGCC
p62 18412 GCTGAAGGAAGCTGCCCTAT TTGGTCTGTAGGAGCCTGGT
Park2 50873 CCGAATCACCTGACGGTTCA TCTGGCTGCTTCTGAATCCC
Lc3b 67443 CACTGCTCTGTCTTGTGTAGGTTG TCGTTGTGCCTTTATTAGTGCATC
Atg8l 57436 GAGGACCACCCCTTCGAGTA GTGGGAGGGATGGTGTTGTT
Ulk1 22241 TCCCTACACACCTTCTCCCC AGCCAACAGGGTCAGCAAAT
Atg5 11793 GGAGAGAAGAGGAGCCAGGT GCTGGGGGACAATGCTAATA
Atg7 74244 GCCTAACACAGATGCTGCAA TGCTCTTAAACCGAGGCTGT
Becn1 56208 CCGCGGTAGAACGAGCC AAGTAATGGAGCTGTGAGTTCCT
Pik3c3 225326 GTGAAGTACCCTGACCTGCC AGTCATGCATTCCTTGGCGA
Lamp2 16784 TGTGCAACAAAGAGCAGGTG TCCAGTATGATGGCGCTTGAG
Atg12 67526 TAAACTGGTGGCCTCGGAAC ATCCCCATGCCTGGGATTTG
Myh1 17879 CGGTCGAAGTTGCATCCCTA TTCTGAGCCTCGATTCGCTC
Myh4 17884 GTCCTTCCTCAAACCCTTAAAGT AAAAGGCTTGTTCTGGGCCT
Myh6 17888 ATATAAAGGGGCTGGAGCACTG CTTTCGGAGGTACTGGGCTG
Myh2 17882 GAGGCTGACTCGTCCTGCT GCTCCGCCACAAAGACAGAT
Ucp2 22228 CTACAGATGTGGTAAAGGTCCGC GCAATGGTCTTGTAGGCTTCG
Hk2 15277 TCTGGCTCTGAGATCCATCTTCA CCGGCCTCTTAACCACATTCC
mt-Co2 17709 GTTGATAACCGAGTCGTTCTGC CCTGGGATGGCATCAGTTTT
mt-Rnr2 17725 CCGCAAGGGAAAGATGAAAGAC TCGTTTGGTTTCGGGGTTTC
Nature Medicine: doi:10.1038/nm.4132
Ryu et al. – Urolithin A induces mitophagy and improves muscle function
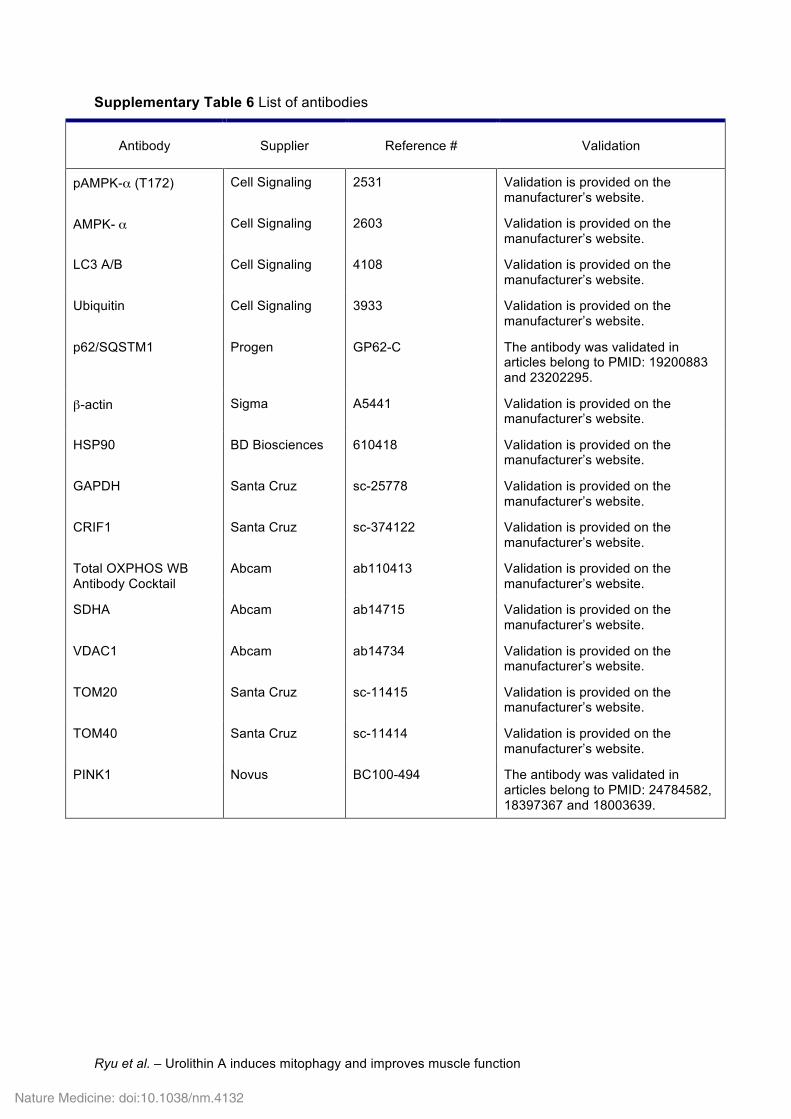
Supplementary Table 6 List of antibodies
Antibody Supplier Reference # Validation
pAMPK-α (T172) Cell Signaling 2531 Validation is provided on the manufacturer’s website.
AMPK- α Cell Signaling 2603 Validation is provided on the manufacturer’s website.
LC3 A/B Cell Signaling 4108 Validation is provided on the manufacturer’s website.
Ubiquitin Cell Signaling 3933 Validation is provided on the manufacturer’s website.
p62/SQSTM1 Progen GP62-C The antibody was validated in articles belong to PMID: 19200883 and 23202295.
β-actin Sigma A5441 Validation is provided on the manufacturer’s website.
HSP90 BD Biosciences 610418 Validation is provided on the manufacturer’s website.
GAPDH Santa Cruz sc-25778 Validation is provided on the manufacturer’s website.
CRIF1 Santa Cruz sc-374122 Validation is provided on the manufacturer’s website.
Total OXPHOS WB Antibody Cocktail
Abcam ab110413 Validation is provided on the manufacturer’s website.
SDHA Abcam ab14715 Validation is provided on the manufacturer’s website.
VDAC1 Abcam ab14734 Validation is provided on the manufacturer’s website.
TOM20 Santa Cruz sc-11415 Validation is provided on the manufacturer’s website.
TOM40 Santa Cruz sc-11414 Validation is provided on the manufacturer’s website.
PINK1 Novus BC100-494 The antibody was validated in articles belong to PMID: 24784582, 18397367 and 18003639.
Nature Medicine: doi:10.1038/nm.4132
Ryu et al. – Urolithin A induces mitophagy and improves muscle function
a
Time (d)
Sur
viva
l (%
)
vehicle, OP50UA, OP50
c
Time (d)
Sur
viva
l (%
)
vehicle, HT115UA, HT115
d
b
HT1
15 A
595
0
0.1
0.2
0.3
0.4
0.5
OP5
0 A 59
5
hours at 37°C0 1 2 3 4 5 6 7 8
DMSO 1%UA 50 μM
0
0.1
0.2
0.3
0.4
0.5
OP5
0 A 59
5
hours at 37°C0 1 2 3 4 5 6 7 8
DMSO 0.5%UA 25 μM
0
0.1
0.2
0.3
0.4
0.5
OP5
0 A 59
5
hours at 37°C0 1 2 3 4 5 6 7 8
0
0.1
0.2
0.3
0.4
hours at 37°C0 1 2 3 4 5 6 7 8
DMSO 2%UA 100 μM
DMSO 0.5%UA 25 μM
0
0.1
0.2
0.3
0.4
hours at 37°C0 1 2 3 4 5 6 7 8
HT1
15 A
595
DMSO 1%UA 50 μM
0
0.1
0.2
0.3
0.4
hours at 37°C0 1 2 3 4 5 6 7 8
HT1
15 A
595
DMSO 2%UA 100 μM
0 10 20 30 400
20
40
60
80
100
0 10 20 30 40 500
20
40
60
80
100
P < 0.0001 P < 0.0001
e
50 worms
OP50+
cpd 1OP50
+cpd 2
f
Supplementary Fig. 1
0
0.5
1.0
0
0.5
1.0
0
0.5
1.0
vehi
cle
vehi
cle
UA
UA
UA
vehi
cle
Frac
tion
of w
orm
s 2h
vehi
cle
vehi
cle
UA
UA
UA
vehi
cle
4h
Frac
tion
of w
orm
s
Frac
tion
of w
orm
s
vehi
cle
vehi
cle
UA
UA
UA
vehi
cle
6h
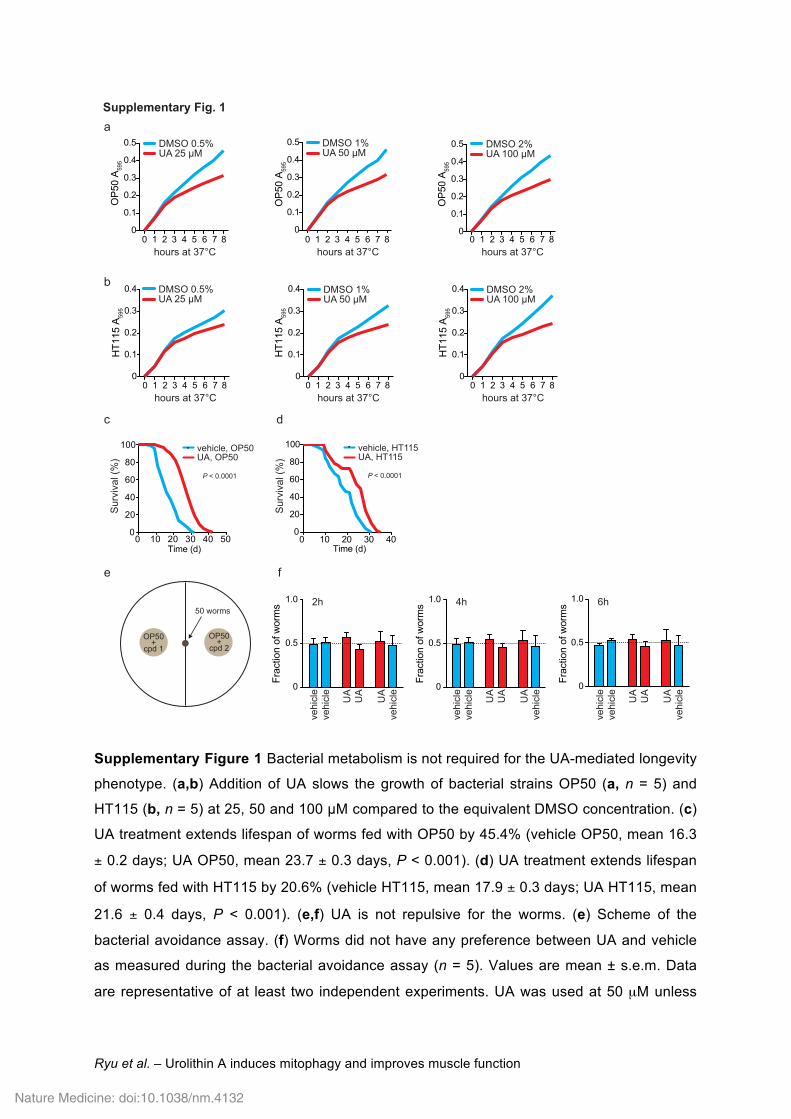
Supplementary Figure 1 Bacterial metabolism is not required for the UA-mediated longevity
phenotype. (a,b) Addition of UA slows the growth of bacterial strains OP50 (a, n = 5) and
HT115 (b, n = 5) at 25, 50 and 100 μM compared to the equivalent DMSO concentration. (c)
UA treatment extends lifespan of worms fed with OP50 by 45.4% (vehicle OP50, mean 16.3
± 0.2 days; UA OP50, mean 23.7 ± 0.3 days, P < 0.001). (d) UA treatment extends lifespan
of worms fed with HT115 by 20.6% (vehicle HT115, mean 17.9 ± 0.3 days; UA HT115, mean
21.6 ± 0.4 days, P < 0.001). (e,f) UA is not repulsive for the worms. (e) Scheme of the
bacterial avoidance assay. (f) Worms did not have any preference between UA and vehicle
as measured during the bacterial avoidance assay (n = 5). Values are mean ± s.e.m. Data
are representative of at least two independent experiments. UA was used at 50 µM unless
Nature Medicine: doi:10.1038/nm.4132
Ryu et al. – Urolithin A induces mitophagy and improves muscle function
stated otherwise. Vehicle corresponds to 1% DMSO unless stated otherwise. See also
Supplementary Table 1.
Nature Medicine: doi:10.1038/nm.4132
Ryu et al. – Urolithin A induces mitophagy and improves muscle function
050
100150200250
020406080
100
Day 7 Day 14
*** *
***
050
100150200250
***
020406080
100
P = 0.1
1 5 80
1
2
3
4
5
1 5 80
1
2
3
4
5
pum
ping
/min
*
050
100150200250
020406080
100
**
pum
ping
/min
pum
ping
/min
1 5 80
1
2
3
4
5
**
mob
ility
(A.U
.)
Time (d)
mob
ility
(A.U
.)
Time (d)
mob
ility
(A.U
.)
Time (d)
vehicleEA
vehicleUB
vehicleUC
a
b
Supplementary Fig. 2
1 5 80
1
2
3
4
5
mob
ility
(A.U
.)
vehicleUD
050
100150200250
**
020406080
100
pum
ping
/min
d
L1-L3 L4 Y.Ad
num
ber o
f pro
geny
vehicleUA
totalc
0
50
100
150
0
20
40
60
80
100
0
20
40
60
80
100
0
300
Ad
fract
ion
of w
orm
s(a
fter 4
8 h)
vehicleUA
1 2 3 4Time (d)
5L1-L3 L4 Y.Ad Ad
***
*
**
Time (d)
vehicleEA
vehicleUB
vehicleUC
vehicleUD
Day 7 Day 14 Day 7 Day 14 Day 7 Day 14fra
ctio
n of
wor
ms
(afte
r 72
h)
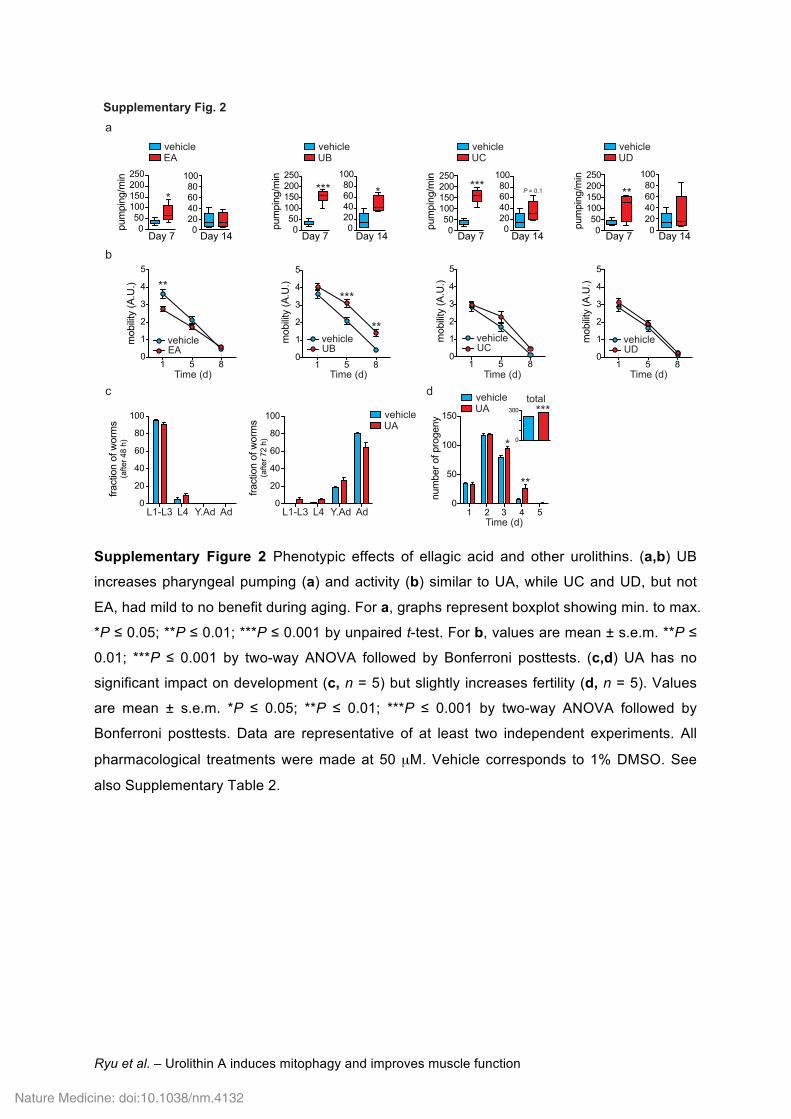
Supplementary Figure 2 Phenotypic effects of ellagic acid and other urolithins. (a,b) UB
increases pharyngeal pumping (a) and activity (b) similar to UA, while UC and UD, but not
EA, had mild to no benefit during aging. For a, graphs represent boxplot showing min. to max.
*P ≤ 0.05; **P ≤ 0.01; ***P ≤ 0.001 by unpaired t-test. For b, values are mean ± s.e.m. **P ≤
0.01; ***P ≤ 0.001 by two-way ANOVA followed by Bonferroni posttests. (c,d) UA has no
significant impact on development (c, n = 5) but slightly increases fertility (d, n = 5). Values
are mean ± s.e.m. *P ≤ 0.05; **P ≤ 0.01; ***P ≤ 0.001 by two-way ANOVA followed by
Bonferroni posttests. Data are representative of at least two independent experiments. All
pharmacological treatments were made at 50 µM. Vehicle corresponds to 1% DMSO. See
also Supplementary Table 2.
Nature Medicine: doi:10.1038/nm.4132
Ryu et al. – Urolithin A induces mitophagy and improves muscle function
Supplementary Fig. 3
b
0 10 20 30 400
20
40
60
80
100
0 10 20 30 400
20
40
60
80
100
0 10 20 30 400
20
40
60
80
100
Time (d)
Surv
ival (%
)
a
larval development adulthoodday 4day 0 day 8
12
534
vehicle
UA full life
UA specific timing
dc
AT
P c
onte
nt
(RL
U .
10
3)
Day 1
AT
P c
onte
nt
(RL
U .
10
3)
Day 8
e
0
1
2
3
4
vehic
le
UA
V1
IV2
SV
2
0
20
40
60
80
100 **
f
ve
hic
le
UA
37
°C (
1h
)
***
0
5
10
15
ve
hic
le
UA
mrp
s-5
Fold
induction
(hsp
-6::g
fp) ***
ve
hic
le
UA
Tu
nic
a. 0
2
4
6
8
ve
hic
le
UA
Acry
lam
ide
***
0
2
4
6
8
10
***
0
0.5
1.0
1.5
2.0
2.5
Surv
ival (%
)(1)
Surv
ival (%
)0 10 20 30 40
0
20
40
60
80
100
0 10 20 30 400
20
40
60
80
100
Surv
ival (%
)
Surv
ival (%
)(2) (3) (4) (5)
Time (d) Time (d) Time (d) Time (d)
n.s.
vehicleUA
vehicleUA
Fold
induction
(hsp
-16.
2::g
fp)
Fold
induction
(hsp
-4::g
fp)
Fold
induction
(gst
-4::g
fp)
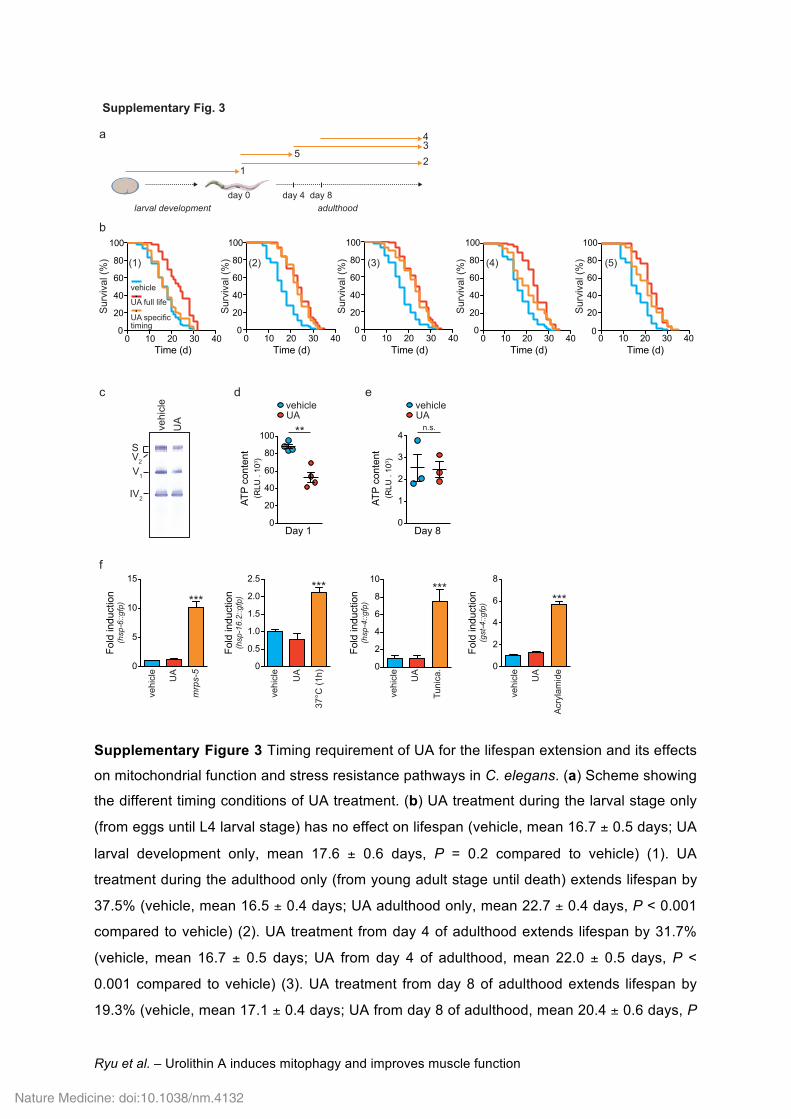
Supplementary Figure 3 Timing requirement of UA for the lifespan extension and its effects
on mitochondrial function and stress resistance pathways in C. elegans. (a) Scheme showing
the different timing conditions of UA treatment. (b) UA treatment during the larval stage only
(from eggs until L4 larval stage) has no effect on lifespan (vehicle, mean 16.7 ± 0.5 days; UA
larval development only, mean 17.6 ± 0.6 days, P = 0.2 compared to vehicle) (1). UA
treatment during the adulthood only (from young adult stage until death) extends lifespan by
37.5% (vehicle, mean 16.5 ± 0.4 days; UA adulthood only, mean 22.7 ± 0.4 days, P < 0.001
compared to vehicle) (2). UA treatment from day 4 of adulthood extends lifespan by 31.7%
(vehicle, mean 16.7 ± 0.5 days; UA from day 4 of adulthood, mean 22.0 ± 0.5 days, P <
0.001 compared to vehicle) (3). UA treatment from day 8 of adulthood extends lifespan by
19.3% (vehicle, mean 17.1 ± 0.4 days; UA from day 8 of adulthood, mean 20.4 ± 0.6 days, P
Nature Medicine: doi:10.1038/nm.4132
Ryu et al. – Urolithin A induces mitophagy and improves muscle function
< 0.001 compared to vehicle) (4). UA treatment during the 4 first days of adulthood extends
lifespan by 25.6% (vehicle, mean 16.4 ± 0.4 days; UA during the 4 first days of adulthood,
mean 20.6 ± 0.5 days, P < 0.001 compared to vehicle) (5). (c) BN-Page analysis in worms
reveals a reduced abundance of the mitochondrial complexes after 1 day of UA treatment.
S= super complexes; V2= dimeric complexes V; V1= complexes V; IV2= dimeric complexes IV.
(d,e) At Day 1 of adulthood, UA reduces ATP content (d, n = 4). At Day 8, ATP content is
equal in vehicleand UA treated worms (e, n = 3). Values are mean ± s.e.m. **P ≤ 0.01; n.s.
not significant by unpaired t-test. (f) UA had no effect on the mitochondrial stress (n = 9),
heat shock stress (n = 10), ER stress (n = 5) and oxidative stress (n = 12) as determined
using the hsp-6::GFP, hsp-16.2::GFP, hsp-4::GFP and gst-4::gfp reporters respectively. As
positive controls, mrps-5 RNAi, 1h at 37°C, exposure to tunicamycin (Tunica.) and
acrylamide were used to induce hsp-6::gfp, hsp-16.2::gfp, hsp-4::gfp and gst-4::gfp reporters,
respectively. Values are mean ± s.e.m. ***P ≤ 0.001 by one-way ANOVA. Data are
representative of at least two independent experiments. UA was used at 50 µM. Vehicle
corresponds to 1% DMSO. See also Supplementary Table 1.
Nature Medicine: doi:10.1038/nm.4132
Ryu et al. – Urolithin A induces mitophagy and improves muscle function
a
Supplementary Fig. 4
0
5
10
15
0
5
10
15
0
5
10
15
0
1
2
3
4
0
1
2
3
4
0
1
2
3
4
mobili
ty (
A.U
.)
bec-1 pink-1vector only
mobili
ty (
A.U
.)
bec-1 pink-1vector only
***
*
*
f
0 1 2 3 4
bec-1
vps-34
rheb-1
pink-1
sqst-1
dct-1
skn-1
******
***
*****
**
vehicleUA
D1 bec-1
vps-34
rheb-1
pink-1
sqst-1
dct-1
skn-1
vehicleUA
D8
b
c
g
d e
0 0.5 1.0 1.5 2.0
*
P = 0.0005P < 0.0001
mRNA level
(fold induction)
mRNA level
(fold induction)
Fold
induction
(pm
yo-3m
tGF
P)
vehicleUA
ev dct-1
***
n.s.
Fold
induction
(pm
yo-3m
tGF
P)
vehicleUA
ev sqst-1
0
1
2
3
4
*
0
0.5
1.0
1.5
2.0
*
n.s.
OC
R
(pm
ole
s/m
in/w
orm
s)
0
10
20
30
40
0
10
20
30
40
0
5
10
15
20
25
0
5
10
15
20
25vehicle
UApink-1 RNAi, D1vector only, D1
basal FCCP basal FCCP
OC
R
(pm
ole
s/m
in/w
orm
s) pdr-1(gk448), D1wild-type, D1
vehicle
UA
**
basal FCCP basal FCCP
vehicle UA
***
Siz
e o
f m
ichondria (
A.U
.)p
ges-
1mtG
FP
h
vehicleUA
***
0
0.5
1.0
1.5
2.0
2.5
**
mR
NA
level
(fo
ld in
du
ctio
n)
fzo-1 opa-1
j
0
20
40
60
80
0
50
100
150
vehicle UA
***
i
vehicleUA
Day 1 Day 1 Day 1
vehicleUA
Day 8 Day 8 Day 8
Siz
e o
f m
ichondria (
A.U
.)p
myo
-3m
tGF
P
***
*
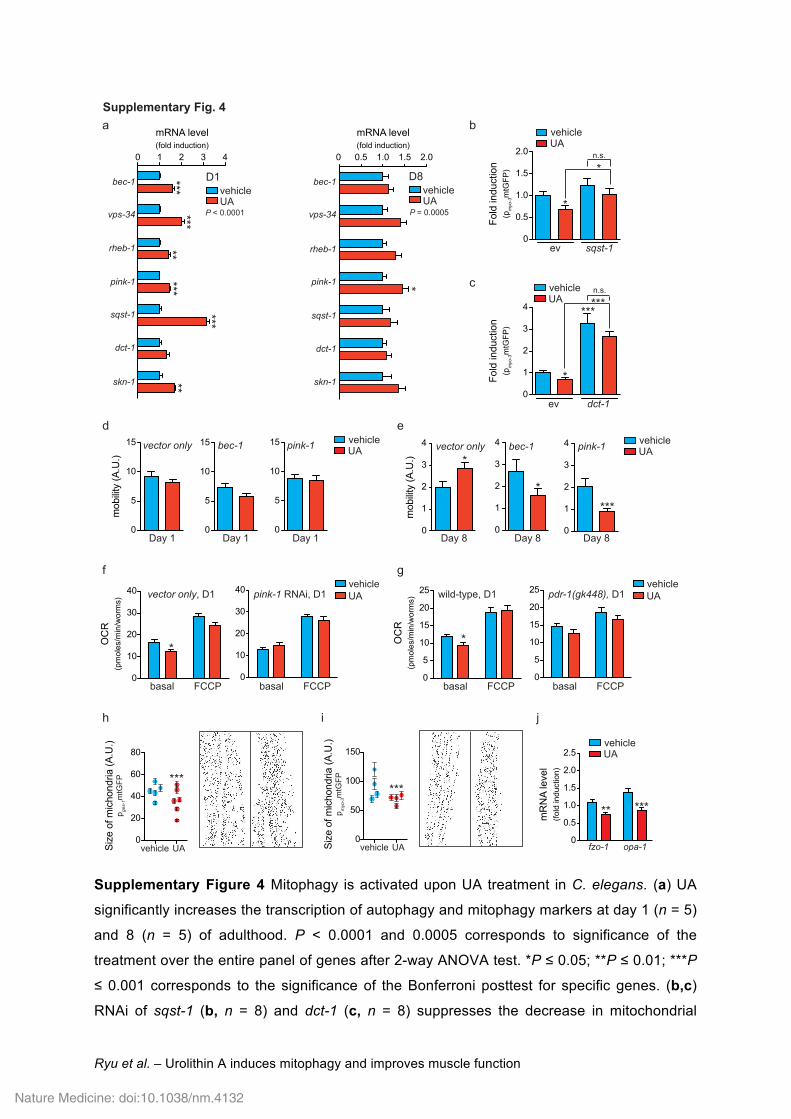
Supplementary Figure 4 Mitophagy is activated upon UA treatment in C. elegans. (a) UA
significantly increases the transcription of autophagy and mitophagy markers at day 1 (n = 5)
and 8 (n = 5) of adulthood. P < 0.0001 and 0.0005 corresponds to significance of the
treatment over the entire panel of genes after 2-way ANOVA test. *P ≤ 0.05; **P ≤ 0.01; ***P
≤ 0.001 corresponds to the significance of the Bonferroni posttest for specific genes. (b,c)
RNAi of sqst-1 (b, n = 8) and dct-1 (c, n = 8) suppresses the decrease in mitochondrial
Nature Medicine: doi:10.1038/nm.4132
Ryu et al. – Urolithin A induces mitophagy and improves muscle function
content induced by UA in the muscle mtGFP reporter strain (pmyo-3mtGFP) at day 1 of
adulthood. Values are mean ± s.e.m. *P ≤ 0.05; ***P ≤ 0.001; n.s. not significant by unpaired
t-test. (d,e) RNAi of bec-1 and pink-1 does not impact mobility at day 1 of adulthood (d).
However, both genes are required for the improvement of mobility induced by UA observed
at day 8 of adulthood (e). Values are mean ± s.e.m. *P ≤ 0.05; ***P ≤ 0.001 by unpaired t-test.
(f,g) RNAi of pink-1 (f, n = 20) or mutation of pdr-1, the worm homolog of PARK2, (g, n = 20)
suppresses the decrease in basal OCR measured in UA treated worms. FCCP was used at
10 µM. Values are mean ± s.e.m. *P ≤ 0.05 by unpaired t-test.. (h,i) UA decreases the
average size of mitochondria in intestine (h, n = 5) and muscle (i, n = 5) mtGFP reporter
strains in worms at day 1 of adulthood. Values are mean ± s.e.m. ***P ≤ 0.001 by unpaired t-
test. (j) UA decreases the expression of the fusion genes fzo-1, the worm homolog of
mitofusin 2 (Mfn2), and opa-1 (n = 5). Values are mean ± s.e.m. **P ≤ 0.01; ***P ≤ 0.001 by
unpaired t-test. Data are representative of at least two independent experiments. UA was
used at 50 µM. Vehicle corresponds to 1% DMSO.
Nature Medicine: doi:10.1038/nm.4132
Ryu et al. – Urolithin A induces mitophagy and improves muscle function
aSupplementary Fig. 5
c
0
20
40
60
80
100
P < 0.00010
20
40
60
80
100 vehicle, NACUA ad, NAC
P < 0.0001
e
0 10 20 30 40 0 10 20 30 40
Sur
viva
l (%
)
Time (d)
larval development adulthood
day 0 day 8 day 15
b
Treatment with vehicle or UAParaquat
Survival assay (b)
Treatment with vehicle or UAParaquat
Survival assay (c)
0
0.5
1.0
1.5
vehi
cle
UA
Fold
indu
ctio
n(M
itoS
ox)
n.s.
d
8 10 12 14 160
50
100
P = 0.0034
vehicle, D8UA, D8
0 2 4 6 80
50
100
Sur
viva
l (%
)(P
araq
uat 4
m M
)
P = 0.006
vehicle, D1UA, D1
Sur
viva
l (%
)(P
araq
uat 4
m M
)
Sur
viva
l (%
)
Time (d)
Time (d) Time (d)
vehicleUA ad
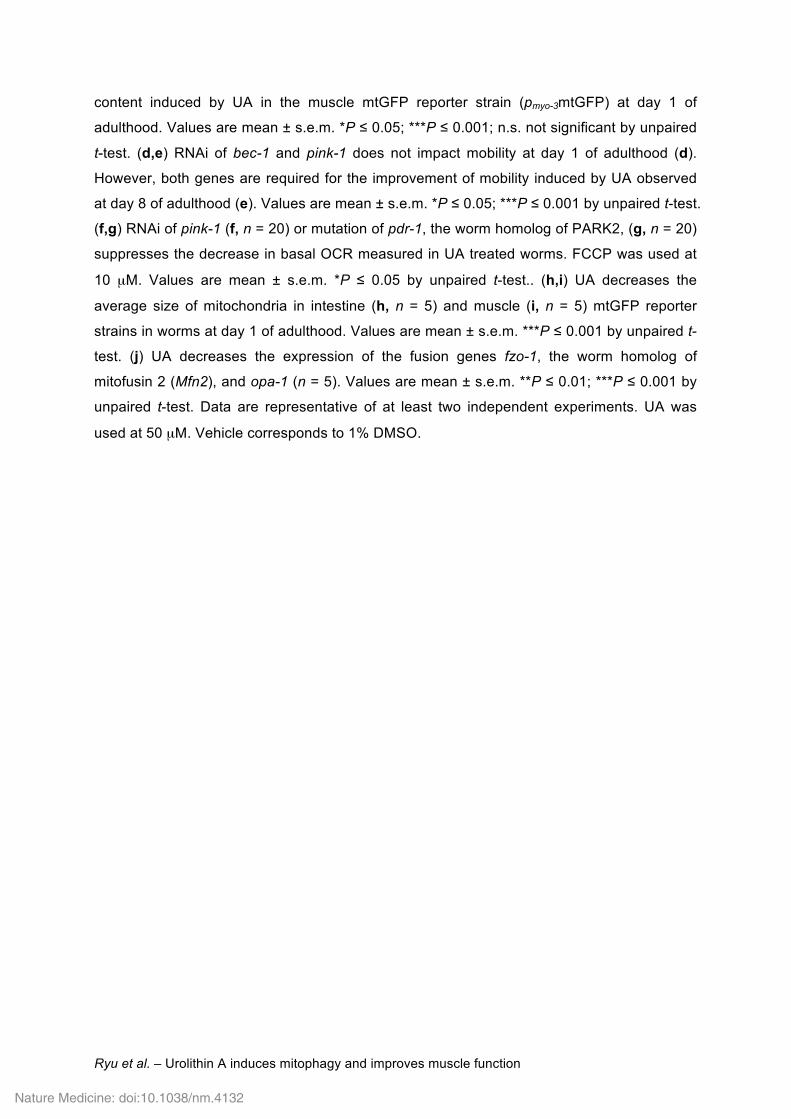
Supplementary Figure 5. UA prolongs lifespan independently of ROS. (a) Scheme showing
the different timing conditions of UA treatment for the paraquat assay. (b,c) Treatment with
UA from the eggs stage extends lifespan of worms exposed to paraquat 4 mM from Day 1
(D1) (b) and 8 (D8) (c). The experiment was stopped at day 14 of adulthood to avoid any
interference with the mortality due to aging. (d) UA has no effect on ROS production as
revealed by the Mitosox® staining (n = 6). Values are mean ± s.e.m. ns: not significant. (e)
UA extends lifespan of worms treated during adulthood in presence of N-acetylcysteine
(NAC) at 5 mM. Data are representative of at least two independent experiments. UA was
used at 50 µM. Vehicle corresponds to 1% DMSO. See also Supplementary Table 1.
Nature Medicine: doi:10.1038/nm.4132
Ryu et al. – Urolithin A induces mitophagy and improves muscle function
Supplementary Fig. 6a
Fold
incr
ease
(p-A
MP
Kα/
AM
PK
α)
vehicle 10 20 50UA (μM)
vehicle 10 20 50UA (μM)
vehicle 10 20 50UA (μM)
**
*** **
b
vehicle 10 20 50UA (μM)
vehicle 10 20 50UA (μM)
** *****
vehicle 10 20 50UA (μM)
***
0
5
10
15
20
0
1
2
3
4
5
0
20
40
60
0
5
10
15
0
1
2
3
4
5
05
10152025
100300500
0
1
2
3
4
5
vehicle 10 20 50UA (μM)
**
0
1
2
3
4
5
vehicle 10 20 50UA (μM)
**
***
c
vehicleUA 10 μM
vehicleUA 50 μM
vehicleUA 100 μM
Cou
ntC
ount
Cou
nt
FITC-A
FITC-A
FITC-A
samplevehicle
UA 10 μM
mean8.95
9.09
samplevehicle
UA 50 μM
mean8.95
14.5
samplevehicle
UA 100 μM
mean8.95
17.8
d
e
g
0
2
4
6
8
0
2
4
6
8
0
2
4
6
8
0
5
10
15
0
0.5
1.0
1.50 6 12 24
0 6 12 24
0 6 12 24
0 6 12 24
0 6 12 24
Fold
incr
ease
(SD
HB
(CII)
/ TO
M20
)
*
*
*
*
*
0.8
0.9
1.0
1.1
1.2
Oxy
gen
cons
umpt
ion
(rat
io o
ver c
ontro
l)
vehicleUA 0.1 µM
UA 1 µMUA 10 µM
10-8 10-7 10-6 10-5 10-4 10-30
0.5
1.0
1.5
UA concentration (M)
f
0 20 40 60 80 100 120Time (min)
Injection of the compound
Oxy
gen
cons
umpt
ion
(rat
io o
ver c
ontro
l)
Fold
incr
ease
(LC
3-II/
LC3-
I)
Fold
incr
ease
(p62
/TO
M40
)
Fold
incr
ease
(Ub/
TOM
40)
Fold
incr
ease
(p-A
MP
Kα/
AM
PK
α)
Fold
incr
ease
(LC
3-II/
LC3-
I)
Fold
incr
ease
(p62
/TO
M40
)
Fold
incr
ease
(Ub/
TOM
40)
Fold
incr
ease
(UQ
CR
C2
(CIII
) / T
OM
20)
Fold
incr
ease
(MTC
O1
(CIV
) / T
OM
20)
Fold
incr
ease
(ATP
5A (C
V) /
TO
M20
)Fo
ld in
crea
se(T
OM
20 /
HS
P90
)
Fluorescence intensity
4Time (h)
12 241Geo
met
ric M
ean
(103 )
3
2
1
0
4
*** *****
vehicle
UA
Time (h)
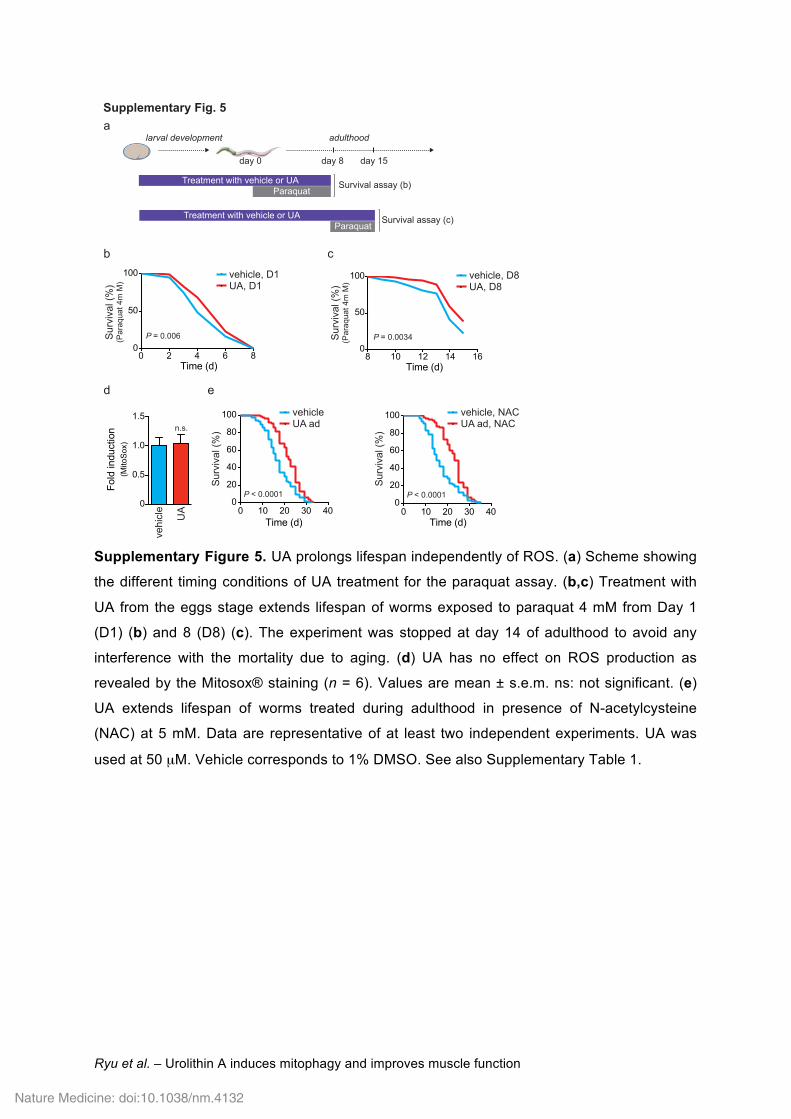
Supplementary Figure 6 The effect of UA on the mitophagy is conserved in mammalian
cells. (a,b) Pixel intensity quantification of the WB shown in the Fig. 4a (a) and Fig. 4b (b).
Nature Medicine: doi:10.1038/nm.4132
Ryu et al. – Urolithin A induces mitophagy and improves muscle function
(c) FACS analyses demonstrated a dose dependent induction of UA-induced autophagy, as
measured by LC3-II accumulation, in C2C12 myoblasts after 24 hours treatment (n = 3). (d)
Quantification of the fluorescence intensity of the CytoID® dye by FACS shown in the Fig. 4d
(n = 4). (e) UA does not affect respiration of the C2C12 myotubes in the two hours following
the addition of the compound at concentrations ranging from 0.1 to 10 µM (n = 5). Grey area
represents the 95% confidence interval of the vehicle group. (f) UA does not impact
respiration of mitochondria isolated from mouse liver, even when used at doses up to 100 µM.
Grey area represents the 95% confidence interval of the vehicle group. (g) Pixel intensity
quantification of the WB shown in the Fig. 5i (n = 3). CII: complex II; CIII: complex III; CIV:
complex IV; CV: complex V. Values are mean ± s.e.m. Data are representative of at least
two independent experiments. *P ≤0.05; **P ≤0.01; ***P ≤0.001 by one-way ANOVA. Vehicle
corresponds to 0.1% DMSO.
Nature Medicine: doi:10.1038/nm.4132
Ryu et al. – Urolithin A induces mitophagy and improves muscle function
Supplementary Fig. 7[U
A] (n
g / m
l)
0 2 7
Treatment duration(days)
n.d.
a b
0.85
0.90
0.95
1.00
0
0.05
0.10
0.15
0.20
Treatment duration (weeks)
0 6Lean
mas
s / b
ody
wei
ght
Fat m
ass
/ bod
y w
eigh
t
Treatment duration (weeks)
0 6
e
0
2
4
6
8
10
Velo
city
(cm
/s)
fControlUA
ControlUA
ControlUA
h
Control UA
CI
CIV
CIV
CII
Control UA
Control UA Control UA
Control UA Control UA
IVIII
IV
II
i
j
0 10 20 3030
35
40
45
50
55
Body
wei
ght (
g)
0 10 20 3010
20
30
40
Fat m
ass
(%)
0 10 20 30
60
70
80
90
Lean
mas
s (%
)
0
1
2
3
4
0
5
10
15
20
0 2 7
Treatment duration(days)
[UA]
(ng
/ g)
n.d.
Treatment duration (weeks)
Treatment duration (weeks)
Treatment duration (weeks)
cControlUA
ControlUA
ControlUA
-2 0 2 4 6 826
28
30
32
34
Body
wei
ght (
g)
Treatment duration (weeks)
ControlUA
d
0.5 1 2 4Ratio over control
g
Control
UAMyh6
Myh2
Myh4
Myh1
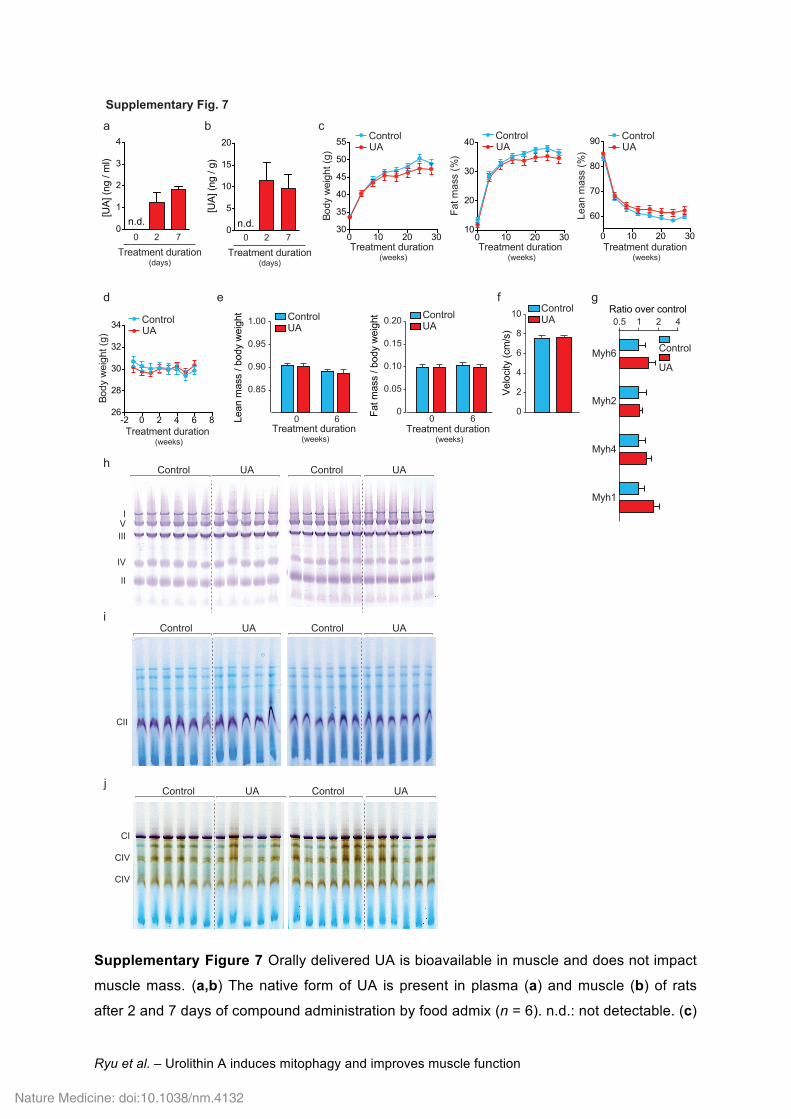
Supplementary Figure 7 Orally delivered UA is bioavailable in muscle and does not impact
muscle mass. (a,b) The native form of UA is present in plasma (a) and muscle (b) of rats
after 2 and 7 days of compound administration by food admix (n = 6). n.d.: not detectable. (c)
Nature Medicine: doi:10.1038/nm.4132
Ryu et al. – Urolithin A induces mitophagy and improves muscle function
UA has no effect on body weight gain, fat mass gain and lean mass loss in 16-months old
male C57BL6/J mice treated for 34 weeks with UA admixed to high-fat diet (HFD) (n = 25).
(d,e) UA did not affect body weight (d), lean mass or fat mass (e) in 24-months old male
C57BL6/J mice treated during 6 weeks with UA admixed to normal chow diet (NCD) (n = 16).
(f) Young rats were randomized according to their velocity measured during an Elevated Plus
Maze test at the age of 5.5 weeks, before starting the treatment (n = 12). (g) UA does not
change the expression of transcripts of myosin heavy chain isoforms in gastrocnemius
muscle of 24-months old male C57BL6/J mice treated for 34 weeks under HFD (n = 10). (h)
Images of BN-PAGE for the quantification of respiratory complexes proteins abundance
shown in Fig. 6h. (i,j) Images of the complexes activity measured in BN-PAGE gel for
complex II (i) and complexes I and IV (j) shown in Fig. 6h. Values are mean ± s.e.m. Control
means the corresponding diet without UA admixed.
Nature Medicine: doi:10.1038/nm.4132
Ryu et al. – Urolithin A induces mitophagy and improves muscle function
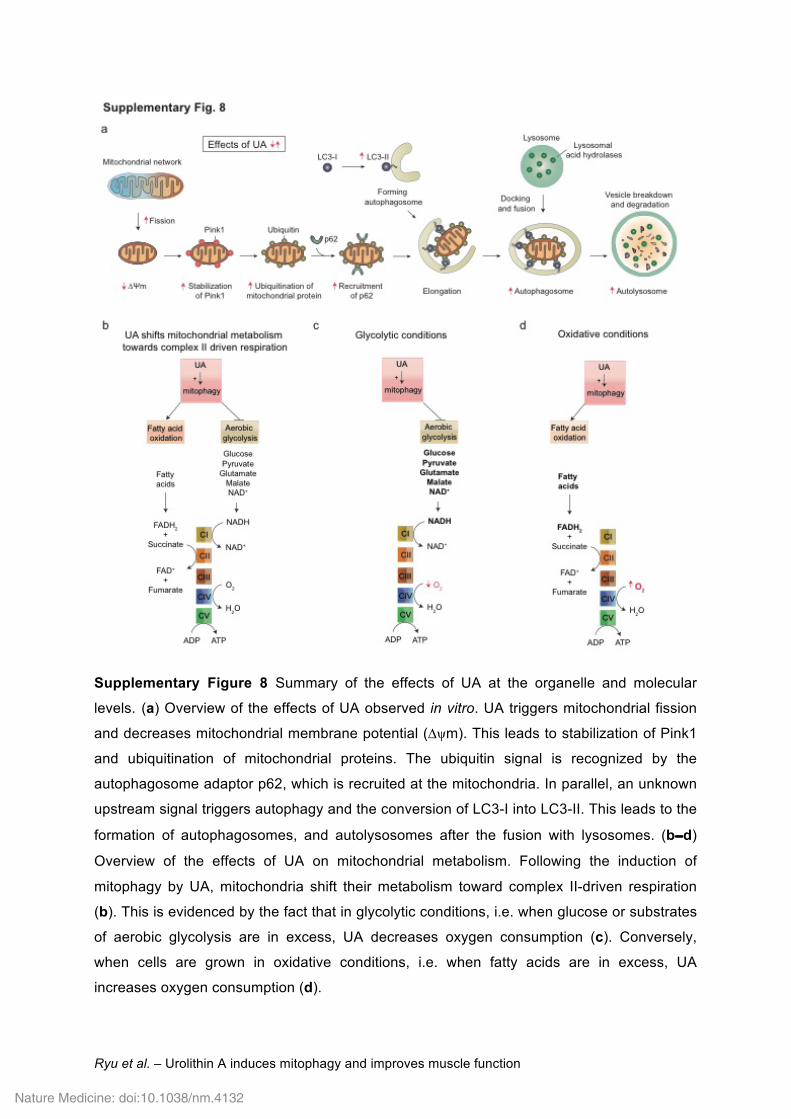
Supplementary Figure 8 Summary of the effects of UA at the organelle and molecular
levels. (a) Overview of the effects of UA observed in vitro. UA triggers mitochondrial fission
and decreases mitochondrial membrane potential (∆ψm). This leads to stabilization of Pink1
and ubiquitination of mitochondrial proteins. The ubiquitin signal is recognized by the
autophagosome adaptor p62, which is recruited at the mitochondria. In parallel, an unknown
upstream signal triggers autophagy and the conversion of LC3-I into LC3-II. This leads to the
formation of autophagosomes, and autolysosomes after the fusion with lysosomes. (b−d)
Overview of the effects of UA on mitochondrial metabolism. Following the induction of
mitophagy by UA, mitochondria shift their metabolism toward complex II-driven respiration
(b). This is evidenced by the fact that in glycolytic conditions, i.e. when glucose or substrates
of aerobic glycolysis are in excess, UA decreases oxygen consumption (c). Conversely,
when cells are grown in oxidative conditions, i.e. when fatty acids are in excess, UA
increases oxygen consumption (d).
Nature Medicine: doi:10.1038/nm.4132