summary of rock mechanics work completed for posiva before … · 2008-12-12 · summary of rock...
TRANSCRIPT

P O S I V A O Y
F I - 2 7 1 6 0 O L K I L U O T O , F I N L A N D
P h o n e ( 0 2 ) 8 3 7 2 3 1 ( n a t . ) , ( + 3 5 8 - 2 - ) 8 3 7 2 3 1 ( i n t . )
F a x ( 0 2 ) 8 3 7 2 3 7 0 9 ( n a t . ) , ( + 3 5 8 - 2 - ) 8 3 7 2 3 7 0 9 ( i n t . )
Summary of Rock Mechanics WorkCompleted for Posiva before 2005
June 2006
POSIVA 2006 -04
John A . Hudson
Er ik Johansson
POSIVA 2006 -04
June 2006
P O S I V A O Y
F I - 2 7 1 6 0 O L K I L U O T O , F I N L A N D
P h o n e ( 0 2 ) 8 3 7 2 3 1 ( n a t . ) , ( + 3 5 8 - 2 - ) 8 3 7 2 3 1 ( i n t . )
F a x ( 0 2 ) 8 3 7 2 3 7 0 9 ( n a t . ) , ( + 3 5 8 - 2 - ) 8 3 7 2 3 7 0 9 ( i n t . )
John A . Hudson
Rock Eng inee r i ng Consu l t an t s , UK
Er i k Johansson
Saan io & R i ekko l a Oy
Summary of Rock Mechanics WorkCompleted for Posiva before 2005
Base maps: ©National Land Survey, permission 41/MYY/06

ISBN 951 -652 -144 -4ISSN 1239 -3096
T h e c o n c l u s i o n s a n d v i e w p o i n t s p r e s e n t e d i n t h e r e p o r t a r e
t h o s e o f a u t h o r ( s ) a n d d o n o t n e c e s s a r i l y c o i n c i d e
w i t h t h o s e o f P o s i v a .

Tekijä(t) – Author(s)
John A. Hudson, Rock Engineering Consultants, UK Erik Johansson, Saanio & Riekkola Oy
Toimeksiantaja(t) – Commissioned by
Posiva Oy
Nimeke – Title
SUMMARY OF ROCK MECHANICS WORK COMPLETED FOR POSIVA BEFORE 2005
Tiivistelmä – Abstract
To plan Posiva’s rock mechanics work for 2005-2006 and beyond, it was necessary to have a clear understanding of the individual components of work that had been completed for Posiva before 2005 and to assess the cumulative rock mechanics knowledge base. This review summarizes the 80 individual completed documents, which include rock mechanics reports and other reports containing rock mechanics material. They are summarised within a structured framework of rock properties, analyses and the effects of excavation.
Following the introductory section, the method of structuring the rock mechanics information is presented. Then the tabulation highlighting the features of all the previous rock mechanics work is explained. This tabulation forms the Appendix; the content of each rock mechanics report that has been produced is summarized via the table headings of document number, subject area, document reference, subject matter, objectives, methodology, highlighted figures, conclusions and comments.
In addition to the direct usefulness of the tabulation in summarizing each report, it has been possible to draw overall conclusions:
• Information has also been obtained worldwide, especially Sweden and Canada. • The rock stress state has been measured but further work is required related both to in situ
measurements and numerical modelling to study, e.g., the influence of deformation zones on the local stress state.
• The intact rock has been extensively studied: there is a good knowledge of the parameters and their values, including the anisotropic nature of the site rocks.
• The geometry of the fractures is included in the geological characterisation but more rock mechanics work is required on the mechanical properties.
• The mechanical properties of the deformation zones have not been studied in detail. • The thermal properties of the site rock are relatively well understood. • A new classification has been developed for constructability and long-term safety assessment. This
classification contains rock mechanics components. • Analysis and numerical modelling methodologies are well developed. • Stress damage mapping is well established but more work is required on the excavation disturbed
zone (EDZ). • Experience in monitoring has been established in the VLJ tunnel. • Long-term rock and excavation behaviour has not been studied sufficiently. • The rock mechanics knowledge here has supported the future rock mechanics programme planning.• The Prediction-Outcome studies underway in the ramp currently being constructed will
significantly enhance the rock mechanics knowledge. All these conclusions have been and will be taken into account in the rock mechanics planning.
Avainsanat - Keywords
rock mechanics, nuclear waste disposal, Olkiluoto, site characterization, laboratory testing, field testing, numerical modelling
ISBN
ISBN 951-652-144-4 ISSN
ISSN 1239-3096
Sivumäärä – Number of pages
152Kieli – Language
English
Posiva-raportti – Posiva Report
Posiva Oy FI-27160 OLKILUOTO, FINLAND Puh. 02-8372 (31) – Int. Tel. +358 2 8372 (31)
Raportin tunnus – Report code
POSIVA 2006-04
Julkaisuaika – Date
June 2006


Tekijä(t) – Author(s)
John A. Hudson, Rock Engineering Consultants, UK Erik Johansson, Saanio & Riekkola Oy
Toimeksiantaja(t) – Commissioned by
Posiva Oy
Nimeke – Title
ENNEN VUOTTA 2005 TEHTYJEN KALLIOMEKAANISTEN TÖIDEN YHTEENVETO
Tiivistelmä – Abstract Voidakseen suunnitella Posiva Oy:n tulevia kalliomekaanisia töitä ja tutkimuksia vuoden 2005 jälkeen, on tärkeä ymmärtää Posivan ennen vuotta 2005 tehtyä kalliomekaanista työtä ja arvioida sen tiedon tasoa. Tämä raportin tarkoituksena on ollut tiivistää ja arvioida 80 yksittäistä kalliomekaanista dokumenttia tai selvitystä.
Kalliomekaaninen tieto on aihepiireittäin jäsennelty raportissa, ja yksittäiset raportit on esitetty taulukon muodossa raportin liitetiedoissa. Raporteista on esitetty ko. työn tavoitteet, tutkimusmenetelmät, oleelliset kuvat ja taulukot, yhteenveto ja merkittävyys.
Seuraavat yleiset johtopäätökset voidaan tehdä koskien Olkiluodon tutkimusalueen kalliomekaanisia tutkimuksia:
• Tietoa on kerätty myös ympäri maailmaa, erityisesti kuitenkin Ruotsista ja Kanadasta. • Kallion jännitystilaa on mitattu, mutta lisämittauksia ja numeerista mallintamista tarvitaan,
jotta paremmin ymmärretään esim. deformaatiovyöhykkeiden vaikutusta alueen jännitystilaan.• Kivilajien ominaisuuksia on tutkittu runsaasti, ja niistä on olemassa hyvä tietokanta sisältäen
tietoa myös kiven anisotropiaominaisuuksista. • Rakoilun geometria sisältyy geologiseen karakterisointiin, mutta lisätyötä tarvitaan rakoilun
mekaanisten ominaisuuksien selvittämiseksi. • Deformaatiovyöhykkeiden mekaanisia ominaisuuksia ei ole tutkittu yksityis-kohtaisesti. • Kiven lämpötekniset ominaisuudet tunnetaan suhteellisen hyvin. • Uusi kalliotilojen rakennettavuutta ja pitkäaikaisturvallisuutta huomioiva kallion
luokitusmenetelmä on kehitetty. Menetelmä sisältää myös kalliomekaanisia tekijöitä. • Numeeristen analysointimenetelmien käyttö on ollut kehittynyttä. • Jännitystilavaurioiden kartoitusmenetelmää on kehitetty, mutta lisää työtä tarvitaan louhinnan
aiheuttaman rikkonaisuusvyöhykkeen tutkimiseksi. • Kokemuksia kalliotilojen monitoroinnista on saatu VLJ-luolasta. • Kallion pitkäaikaisominaisuuksia ei ole tutkittu riittävästi. • Nykyinen kalliomekaaninen tieto on tukenut tulevan ohjelman suunnittelua. • ONKALOn ajotunnelin louhinnan aikana tehtävät kalliomekaaniset ennusteet ja mittaukset
tulevat parantamaan merkittävästi Olkiluodon kalliomekaanista tietoa.
Kaikki esitetyt johtopäätökset on huomioitu tai tullaan huomiomaan kalliomekaanisessa suunnittelussa.
Avainsanat - Keywords
kalliomekaniikka, ydinjätteiden loppusijoitus, Olkiluoto, paikkatutkimukset, laboratoriokokeet, kenttäkokeet, numeerinen mallintaminen
ISBN
ISBN 951-652-144-4 ISSN
ISSN 1239-3096 Sivumäärä – Number of pages
152 Kieli – Language
Englanti
Posiva-raportti – Posiva Report
Posiva Oy FI-27160 OLKILUOTO, FINLAND Puh. 02-8372 (31) – Int. Tel. +358 2 8372 (31)
Raportin tunnus – Report code
POSIVA 2006-04
Julkaisuaika – Date
Kesäkuu 2006


1
TABLE OF CONTENTS
ABSTRACT
TIIVISTELMÄ
TABLE OF CONTENTS.................................................................................................. 1
1 INTRODUCTION AND BACKGROUND................................................................ 3
2 STRUCTURING THE ROCK MECHANICS INFORMATION................................ 52.1 Tabulation of the rock mechanics documents.............................................. 5
3 CONCLUSIONS .................................................................................................... 7
4 APPENDIX: TABULATION OF THE 80 ROCK MECHANICS REPORTS STUDIED............................................................................................................... 9
Sources of information ............................................................................... 10Rock stress state........................................................................................ 13Deformation and strength properties of intact rock .................................... 31Fracture properties..................................................................................... 57Properties of the rock mass ....................................................................... 62Properties of deformation zones ................................................................ 62Thermal properties of rock and thermal analyses ...................................... 62Rock mass classification ............................................................................ 79SURPAC visualization and DFN model ..................................................... 87Site/baseline conditions ............................................................................. 87Rock mechanics analyses.......................................................................... 91Olkiluoto site-specific analyses ................................................................ 102Effects of excavation ................................................................................ 118Stress damage – boreholes and tunnel stress mapping .......................... 118Block failure.............................................................................................. 124EDZ (Excavation damaged zone) ............................................................ 124In situ rock measurements and monitoring .............................................. 129Long-term rock and excavation behaviour ............................................... 140Prediction-Outcome studies ..................................................................... 143Post-excavation analyses ........................................................................ 143Planning of rock mechanics investigation ................................................ 143

2

3
1 INTRODUCTION AND BACKGROUND
In order to be able to develop optimal plans for the rock mechanics activities in the period 2005-2006 and beyond, it was necessary to co-ordinate the results of the manifold and separate rock mechanics projects that have already been completed for Posiva. In this way, the future rock mechanics plans can be developed from the overall Posiva objectives via a coherent knowledge base. The purpose of this Report, therefore, is to list all the past 80 rock mechanics reports, to highlight their conclusions, and hence to draw conclusions on the current state of knowledge and the requirements for the future.
One of the main thrusts in the rock mechanics subject area is to establish the continuing rock mechanics site descriptive model for the Olkiluoto site. This model consists of the geometrical, mechanical and thermal descriptions of the rock mass.
The geometrical description will be based on the bedrock geological model.
The mechanical description includes the in situ stress state and the deformation and strength properties of the intact rock, the fractures, the rock mass between deformation zones, and the deformation zones.
The thermal description is based on the thermal properties of the intact rock.
The main purpose of the rock mechanics site descriptive model is to supply information for ONKALO (Rock Characterisation Facility) and repository design and to provide input for the safety assessment. Thus, the rock mechanics model will also include a description of the effects of excavation and time on the deformation and strength properties. Additionally, there is a particular need to consider the interaction with the hydrogeological model because of the effect of water pressure on the in situ stress and the inflow of water into excavations during and after construction. In the long term, hydrogeochemical effects have to be taken into account because of potential precipitation in fractures and other effects.
To develop the rock mechanics site descriptive model and the necessary knowledge for repository design and input to long-term safety assessment requires a three component strategic approach:
characterization of the rock properties;
numerical modelling of the rock properties and behaviour; and
measurements, monitoring and test cases in the access ramp and ONKALO.
These three components are summarized below.
Component 1: Characterization of the rock properties
In some cases, the rock properties can be directly measured, e.g. the magnitudes and orientations of the in situ principal stresses and the uniaxial compressive strength of the

4
intact rock. In other cases, the properties have to be estimated because it is not possible to measure them directly, e.g. the elastic modulus of a 100 m x 100 m x 100 m rock mass volume. Such estimation can be made from numerical modelling and indirect insitu measurements, e.g. P-wave velocity, or rock mass behaviour, e.g. tunnel displacements. Thus, the rock property site descriptive model interacts with the other two strategic components: numerical modelling and in situ measurements.
Component 2: Numerical modelling of the rock properties and behaviour
This encompasses continuum and discrete element numerical modelling using, e.g. the FLAC, UDEC, 3DEC and PFC programs, to simulate the mechanical properties and behaviour of the rock mass. It is important to know how the stress state will be perturbed by the deformation zones, how the properties of the intact rock and fractures combine to determine the properties of the rock mass, how the excavation process causes an excavation disturbed zone, etc.
Component 3: Measurements, monitoring and prediction-outcome test cases in ONKALO
The way to establish confidence in the rock mechanics modelling is to predict the rock properties and behaviour and then to measure them. In the ONKALO ramp, niches and characterization level, there will be prediction-outcome test cases to provide such comparisons of estimated and actual values of the rock properties. The predictive capability is essential for rock engineering design in order that the consequences of different engineering options can be assessed, e.g. the depth and orientation of repository tunnels. Additionally, the work provides support for the CEIC (Co-ordination of Engineering, Investigations and Construction) process which aims to determine the site conditions beforehand and to ensure that the optimal design, based on the interpretation of the site conditions, is selected for implementation and for continuous updating.
Thus, this report summarising all the Posiva rock mechanics work before 2005 provides the knowledge foundation for establishing the rock mechanics work necessary for the future.

5
2 STRUCTURING THE ROCK MECHANICS INFORMATION
A wide variety of rock mechanics activities have been underway in past years and the results have been written up in the 80 documents. These documents cover the full range from published Posiva reports to memos. In order to structure the information, each document has been classified according to one of the following categories.
- Sources of information From literature and other sites worldwide From Olkiluoto - Rock stress state - Properties of the intact rock - Properties of fractures - Properties of the rock mass - Properties of deformation zones - Thermal properties/analyses - Rock mass classification - SURPAC visualization and DFN model - Baseline conditions - Rock mechanics analyses - Effects of excavation, Stress damage – boreholes and tunnel stress mapping Block failure EDZ - In situ rock measurements and monitoring (including micro-seismic monitoring) - Long-term rock and excavation behaviour - Prediction-Outcome studies - Post-excavation analyses - Rock mechanics planning.
2.1 Tabulation of the rock mechanics documents
Each document is described in a table forming a single page of the Appendix. This table is then followed, where appropriate, by highlighted diagrams from the document. The following information is provided for each document:
document number subject area document reference subject matter objectivesmethodology highlighted figures conclusionscomments

6
It should be noted that the contents of these summary tables contain only information obtained directly from the reports, i.e. there has been no attempt to make subjective comments on the quality of the work1.
The tabulation has enabled all the rock mechanics work conducted before 2005 to be co-ordinated in this one document location, and the cumulative conclusions relating to the current state of rock mechanics knowledge to be coherently established.
1 In a separate document, an auditing exercise is reported that was conducted on 11 of the reports listed here which deal with numerical modelling: “Auditing of Posiva’s rock mechanics numerical modelling work conducted before 2005” by John A Hudson and John P Harrison. Rock Engineering Consultants memo to Posiva.

7
3 CONCLUSIONS
In addition to the direct usefulness of the tabulation in summarizing each report, it has been possible to draw overall conclusions relating to the content of the rock mechanics work to date in the context of the Olkiluoto site. These conclusions are:
Information has also been obtained worldwide, especially Sweden and Canada. The rock stress state has been measured but further work is required related both to in situ measurements and numerical modelling to study, e.g., the influence of deformation zones on the local stress state. The intact rock has been extensively studied: there is a good knowledge of the parameters and their values, including the anisotropic nature of the site rocks. The geometry of the fractures is included in the geological characterisation but more rock mechanics work is required on the mechanical properties. The mechanical properties of the deformation zones have not been studied in detail. The thermal properties of the site rock are relatively well understood.A new classification has been developed for constructability and long-term safety assessment. This classification contains rock mechanics components. Analysis and numerical modelling methodologies are well developed. Stress damage mapping is well established but more work is required on the excavation disturbed zone (EDZ). Experience in monitoring has been established in the VLJ tunnel. Long-term rock and excavation behaviour has not been studied sufficiently. The rock mechanics knowledge here has supported the future rock mechanics programme planning. The Prediction-Outcome studies underway in the ONKALO ramp currently being constructed will significantly enhance the rock mechanics knowledge.
The Prediction-Outcome studies underway in the ramp currently being constructed will significantly enhance the rock mechanics knowledge. All these conclusions have been taken into account in the rock mechanics planning which is now co-ordinated by the Rock Mechanics Group of Posiva’s Olkiluoto Modelling Task Force.

8

9
4 APPENDIX: TABULATION OF THE 80 ROCK MECHANICS REPORTS STUDIED
It should be noted that some of the Figure captions listed in the tables below have been abbreviated from the captions in the original reports. This is because the intention of the figure presentations is to indicate the type of work that was conducted, so the captions are not intended to indicate the exact details or references to the origin of the figures from other sources.
Also, in many cases it has been possible to obtain the original electronic versions of the highlighted figures, so the quality of these is good. However, in some cases, it has been necessary to obtain the figures by digitally scanning the hard copy version of the figure. In these cases, the quality of the highlighted figures is variable.

10
Sources of information
Document number 1. (Project document number: 46)
Subject area Sources of information, from literature and other sites worldwide
Document reference Martin, D. 1994. TVO/SKB/AECL workshop on rock strength proceedings. Work report TEKA-94-07. Teollisuuden Voima Oy, Helsinki.
Subject matter Review of the failure of stiff, strong, crystalline, intact rock.
Objectives To provide a book type review of aspects of brittle rock strength in the context of a radioactive waste repository. In particular to explain why the back-analysed rock strength at the Canadian URL was around 100 MPa, whereas the laboratory measured strength was around 200 MPa.
Methodology Presentation of chapters covering introduction, in situ stress, sample disturbance and laboratory properties, laboratory properties of Lac du Bonnet granite, progressive failure of Lac du Bonnet granite, failure around openings in massive rocks, modelling the failure process, and conclusions.
Highlighted figures None
Conclusions Pages 151-156 of the report provide conclusions explaining the in situ failure of rock.
Comments Report contains 149 references.

11
Document number 2. (Project document number: 47)
Subject area Sources of information, from literature and other sites worldwide
Document reference Juvonen, I. 2002. Rock mechanics studies at underground research laboratories for spent nuclear fuel repositories – Literature review. Working report 2002-55. Posiva Oy, Olkiluoto.
Subject matter Review of rock mechanics studies at URL (Canada) and HRL (Sweden) and lessons learned.
Objectives To provide an overview of the experiences of existing near-field rock mechanics studies carried out at great depths over the last ten years with special emphasis on utilisation of acoustic emission.
Methodology 70+ articles and reports studied, mostly from the URL in Canada and the HRL in Sweden.
Highlighted figures None
Conclusions URLs provide the environment for studying the behaviour of a rock mass in situ at depth – which cannot be obtained from surface-based investigations.
Many data presented from the experiments at the URLs, and lessons learned reported.
AE/MS monitoring proved to be the most useful tool in determining the rock damage and validating numerical models and is therefore recommended.
Comments

12
Document number 3. (Project document number: 48.)
Subject area Sources of information, from literature and other sites worldwide
Document reference Johansson, E. 2004. SKB’s stress measurements in Oskarshamn and Forsmark. Memorandum Project-718-8/2004. Saanio & Riekkola Oy, Helsinki. (in Finnish)
Subject matter Summary of SKB’s in situ stress measurements in deep boreholes.
Objectives To provide a short summary.
Methodology Statement of the key facts.
Highlighted figures None
Conclusions Summary description of the details.
Comments This is a short memo.

13
Rock stress state
Document 4. (Project document number: 1.)
Subject area Rock stress state
Document reference
Klasson, H. & Lejon, B. 1990. Rock stress measurements in the deep boreholes at Kuhmo, Hyrynsalmi, Sievi, Eurajoki and Konginkangas. Report YJT-90-18. Nuclear Waste Commission of Finnish Power Companies, Helsinki.
Subject matter First rock stress measurements at five investigation sites. Measurements with hydraulic fracturing in one deep borehole (KR1 at each site). In Olkiluoto measurements in the depth ranges 471-653 and 775-905 m. The other four sites are to the NE of Olkiluoto.
Objectives To report on stress measurements made for the purpose of providing input to the site selection process for an underground facility for the disposal of high-level radioactive waste.
Methodology Use of the hydraulic fracturing method for determining components of the stress state: the minimum and maximum horizontal stresses. Results were subjected to critical discussion. Work conducted by SKB via Lulea University of Technology. Tests conducted at 13 test levels around 500 and 800 m depths (see above). Measurements at Olkiluoto were made in 1989 in migmatic gneiss and pegmatite.
Highlightedfigures
Fig. 6.1. Measured values of the minimum horizontal stress.
Fig. 6.2. Maximum horizontal stress calculated by the first breakdown method.
Fig. 6.3. Maximum horizontal stress calculated by the second breakdown method.
Fig. 6.4. Orientations of the maximum horizontal stress.
Fig. 6.5. Overview of stress components at Olkiluoto (bounds established by linear regression). H stress gradient: 0.065 MPa/m.
Conclusions Testing was successfully completed at Syyry, Olkiluoto and Kivetty. Testing was partly successful at Romuvaara, but unsuccessful at Veitsivaara. Testing at Olkiluoto was considered ‘good’ for data quality. The stress magnitudes can be seen in Fig. 6.5. The mean orientation of the maximum horizontal stress is N88E. The maximum and minimum horizontal stress components at the 500 level are 23 and 13 MPa, and at the 800 m level are 44 and 23 MPa. In terms of the regional stress state across the five sites and hence across southern Finland, the measured stress magnitudes were compatible with Syyry and Kivetty (the other two sites where the data quality was also ‘good’. However, the orientations of the maximum horizontal principal stress at Syyry and Kivetty were more NE-SW, in line with the Fennoscandian regional trend, compared with the E-W direction at Olkiluoto. The Olkiluoto stress field seems to be rotated.

14
Comments The hydraulic fracturing method is fairly reliable in terms of the magnitude of the minimum horizontal principal stress and its orientation.
Figure 6.1. Measured values of the minimum horizontal stress.
Figure 6.2. Maximum horizontal stress calculated by the first breakdown method.

15
Figure 6.3. Maximum horizontal stress calculated by the second breakdown method.
Figure 6.4. Orientations of the maximum horizontal stress.
Figure 6.5. Overview of stress components at Olkiluoto (bounds established by linear regression). H stress gradient: 0.065 MPa/m.

16
Document number 5. (Project document number: 2.)
Subject area Rock stress state
Document reference Ljunggren, C. & Klasson, H. 1996. Rock stress measurements at the three investigation sites, Kivetty, Romuvaara and Olkiluoto, Finland Volume 1 and 2. Work report PATU-96-26e. Posiva Oy, Helsinki.
Subject matter Rock stress measurements at three sites with overcoring method (in one borehole) and hydraulic fracturing (in three boreholes). In Olkiluoto measurements (KR2, KR4 and KR10) at depth (z) of 296 – 799 m.
Objectives To obtain the magnitudes and directions of the principal in situ rock stresses (and the associated horizontal and vertical components) using overcoring and hydraulic fracturing at the three sites listed in the title.
Methodology The intention was that at each site measurements were to be conducted using 3-D overcoring in a 76 mm diameter borehole (at 300, 450 and 600 m depths) and hydraulic fracturing at depths within the range 280-800 m depth.
Highlighted figures Fig. 1.1. Location of the three sites.
Table 5.1. Olkiluoto measurements – test programme and overall results.
Fig. 5.1. The Olkiluoto site and location of the core-drilled boreholes at the time.
Fig. 5.2. Magnitudes of sigmas H and h from hydraulic fracturing.
Fig. 5.3. Orientations of sigmaH from hydraulic fracturing.
Fig. 5.7. Magnitudes of sigmas H and h from overcoring.
Fig. 5.8. SigmaH directions from overcoring.
Fig. 5.9. Overview of sigmaH magnitudes.
Conclusions Overcoring measurements were successfully completed at all sites. However, whilst the hydraulic fracturing tests were successful at Kivetty, they were not so successful at the other sites, because the hydraulic fractures developed non-parallel to the borehole.
The results were as follows:
Kivetty: SigmaH~26 MPa, sigmah~15 MPa, sigmaH SE
Romuvaara: SigmaH~32 MPa, sigmah~18 MPa, sigmaH SE - E
Olkiluoto: SigmaH~26 MPa, sigmah~16 MPa, sigmaH E
Unfortunately, the hydraulic fracturing and overcoring measurements did not agree as well at Olkiluoto as they did at the other two sites.
Comments

17
Figure 1.1. Location of the three sites. Figure 5.1. The Olkiluoto site and location of the core-drilled boreholes at the time.
Table 5.1. Olkiluoto measurements – test programme and overall results.
Figure 5.2. Magnitudes of sigmas H and h from hydraulic fracturing.
Figure 5.7. Magnitudes of sigmas H and h from overcoring.

18
Figure 5.3. Orientations of sigmaH from hydraulic fracturing.
Figure 5.8. SigmaH directions from overcoring.
Figure 5.9. Overview of sigmaH magnitudes.

19
Document number 6.
(Project document number: 3.)
Subject area Rock stress state
Document reference
Hakala, M. 1999. Numerical study on core damage and interpretation of in situ state of stress. Report POSIVA 99-25. Posiva Oy, Helsinki.
Subject matter Development of methodology to interpret the in situ stress state based on core disking observations. Mainly developed because of Hästholmen site where intensive core disking occurred. Not used for Olkiluoto site.
Objectives Assessment of the potential of core and ring discing to estimate the in situ state of stress. Study of stresses induced by coring/overcoring and fracture growth.
Methodology Use of FLAC3D to study developing stress states.
Highlightedfigures
Fig. 5-4. Quadrant-symmetric model for overcoring simulation.
Fig. 6-8. Development of secondary elastic stresses during overcoring.
Fig. 7-9. Failure modes with the Hoek-Brown envelope.
Conclusions The spacing, shape and initiation point of the discing are stress state dependent. If direct stress measurements cannot be used, the core discing and ring discing can be used to estimate the stresses.
Comments

20
r =38 mm
114 mm = 3r
114 mm = 3r
46 mm
114 mm = 3r
Sym
metr
yfa
ce
Sym
metry
face
Z
YX
Boreholewall
Pilotholewall
Host rock
-4 -3 -2 -1 0 1 2 3 4
Minimum Principal Stress 3 ( MPa )
-5
0
5
10
15
20
25
30
35
Tension - Root
Tension - Side
Tension - Top
Deviatoric - Bit
Maximum Principal Stress ( MPa )1
Combinedyield, 3<0
Yield in shear,
3 >0
Yield surfacewith low mivalue
Yield surfacewith high mivalue
= 1.0Hh /= 0.5HV /
Uniaxial Tension Failure,1=0
Figure 5-4. Quadrant-symmetric model for overcoring simulation.
Figure 7-9. Failure modes with the Hoek-Brown envelope.
c. d.
a. b.
0.760.94
0.81
0.56
Z
YX
Z
YX
X
Z
YX
Z
Y
tension, > 0.5 MPaContours:
tension, < 0.5 MPa
compression
3D-vectors: tension
compression
Figure 6-8. Development of secondary elastic stresses during overcoring.

21
Document number 7. (Project document number: 4.)
Subject area Rock stress state
Document reference Malmlund, H. & Johansson, E. 2002. Rock stress measurements at Posiva sites (in Finnish). Working Report 2002-47. Posiva Oy, Olkiluoto.
Subject matter Review of stress measurement results at the four site investigation sites.
Objectives To summarise the stress measurement results from tests conducted at four sites, Olkiluoto, Hästholmen, Kivetty and Romuvaara (during so called detailed investigation phase). Results also compared to site structural geology.
Methodology Assessment of the measurement results
Highlighted figures Fig. 4-10. Direction of the major horizontal in situ stress in Olkiluoto based on the hydraulic fracturing results.
Fig. 4-11. Vertical and horizontal stresses with depth in Olkiluoto. Overcoring results are presented as average values calculated from the stress tensors.
Fig. 4-13. a) Direction of principal stresses 1, 2 and 3 based on the overcoring results from OL-KR10. b) Direction of the deformation zones and the foliation based the bedrock model 3.01.
Conclusions 40% of stress measurements at Olkiluoto were successful. At Olkiluoto, the maximum horizontal stress increases at a rate of 5.6 MPa/100 m. The orientation of this stress is E-W based on hydraulic fracturing. At Olkiluoto, the principal stresses are aligned parallel and perpendicular to the foliation. The spread of the overcoring results was greater than for the hydraulic fracturing results (but it is noted that the anisotropy was not taken into account in the overcoring).
Comments

22
Figure 4-10. Direction of the major horizontal in situ stress in Olkiluoto based on the hydraulic fracturing results.
Figure 4-11. Vertical and horizontal stresses with depth in Olkiluoto. Overcoring results are presented as average values calculated from the stress tensors.
Figure 4-13. a) Direction of principal stresses 1, 2 and 3 based on the overcoring results from OL-KR10. b) Direction of the deformation zones and the foliation based the bedrock model 3.01.

23
Document number 8. (Project document number: 5.)
Subject area Rock stress state
Document reference Sjöberg, J. 2003. Overcoring rock stress measurements in borehole KR24, Olkiluoto. Working Report 2003-60. Posiva Oy, Olkiluoto.
Subject matter Rock stress measurements with overcoring method and in the vicinity of zone RH20 in borehole KR24. Three successful (only) measurements at depth (borehole depth) of 310 – 388 m.
Objectives To measure the 3-D rock stress state in borehole OL-KR24 at a depth of 288-390 m using an updated version of the Borre Probe. The purpose of the measurements was to increase the confidence and reliability of the rock stress state in the area, and to conduct stress measurements in the vicinity of a fracture zone. Glue tests were also performed.
Methodology Use of the upgraded Borre probe in the standard overcoring technique for stress measurements.
Highlighted figures Fig. 1-1. Map of the Olkiluoto site showing the location of borehole OL-KR24.
Fig. 2-7. Measurement procedure using the Borre probe.
Conclusions Although the glue tests were somewhat inconclusive, they indicated that longer hardening times were not necessary.
There were problems with the stress measurements in terms of cuttings and/or debris in the borehole and equipment problems. Only three measurements were considered successful, indicating a major principal stress of 16-21 MPa at the depth of 310-390 m trending NE-SW and almost horizontal.
There was ‘strain drift’ and high values for the Poisson’s ratio in the biaxial testing (i.e. after the overcoring) indicating possible damage to the overcored sample. The reliability of the measurements is considered to be relatively low.
Comments

24
Figure 1-1. Map of the Olkiluoto site showing the location of borehole OL-KR24.
Figure 2-7. Measurement procedure using the Borre probe.

25
Document number 9. (Project document number: 6.)
Subject area Rock stress state
Document reference Hakala, M. 2003. Quality control for overcoring stress measurement data. POSIVA 2006-03. Posiva Oy, Olkiluoto. (to be published)
Subject matter Joint project between Posiva and SKB to increase the credibility and quality of OC stress measurements.
Objectives To improve overcoring data analysis by studying the transient strains, especially the early strains.
Methodology Computer program was developed to simulate the transient strains and stresses during overcoring in any in situ stress and coring load conditions in an isotropic rock regime.
The solution is based on superpositioning of elastic stresses and the basic idea can be applied also for different overcoring probes with minor modifications and recalculation of stress tensors. The measured strains can be compared to the calculated ones to check if the measured transient behaviour coincides with the interpreted in situ state of stress. If not, the in situ state of stress can be calculated based any transient or final strain values. The transient stresses can be compared to the strength envelope of the intact rock and thereby estimate core damage potential.
Highlighted figures Fig. 2-2. Flowchart for phases of overcoring in situ stress measurement.
Fig. 3-7. The measured and calculated transient strains for Borre probe measurement. The following phases can be found in the strain behaviour: a) stable value, b) local maximum or minimum before strain gauge position, c) local maximum or minimum after strain gauge position and d) final stable value. The strain gauge position is equal to zero coring advance.
Fig. 4-11. Overcoring quality control tool, comparison of measured and calculated strains.
Fig. 4-14. Overcoring quality control tool, stress maximum paths with rock strength envelopes
Figure 4-15. Definition of strength envelopes and their interpretation
Conclusions Technically the developed code fulfilled all the objectives and the error of the code was found to be less than 5%. The analysed case studies showed clearly the advantage of having an objective method of studying the reliability of stress measurement data. On the other hand, the interpretation of the in situ state of stress from early strains is difficult because the solution is sensitive to the measured strains and coring advance.

26
The work also includes a comprehensive list of factors to be considered when performing in situ stress measurement and procedures to interpret measurement data.
Comments Work is planned in the next phase to cover anisotropic rock conditions as well.
1) site characterization
2) estimation of potential for suggesfull measurement
3) drill hole position and orientation
4) drilling of full size hole
5) starting level for measurement
6) pilot drilling
7) acceptance of pilot hole
8) cell installation
9) hardening of glue and cell monitoring
10) overcoring
11) stabilizing the cell, breaking core
12) biaxial testing
13) geological logging of core
14) biaxial test interpretation
15) transient strain check
16) stress calculation, sensitivity study
17) guidelines for further use
Site
consi
dere
atio
nP
rior
OC
Duri
ng
OC
Aft
er
OC
Inte
rpre
tatio
nLoca
tion
con
sidere
atio
n
-200
-100
0
100
200
300
400
500
600
700
-200 -150 -100 -50 0 50 100 150
Coring advance ( mm )
Str
ain
(
)
G1 ( R1_axi )G2 ( R1_tan )G3 ( R1_incl. )G4 ( R2_axi )G5 ( R2_tan )G6 ( R2_incl. )G7 ( R3_axi )G8 ( R3_tan )G9 ( R3_incl. )G1m ( R1_axi )G3m ( R1_incl. )G2m ( R1_tan )G4m ( R2_axi )G6m ( R2_incl. )G5m ( R2_tan )G7m ( R3_axi )G9m ( R3_incl. )G8m ( R3_tan )
a. b. c. d.
Figure 2-2. Flowchart for phases of overcoring in situ stress measurement.
Figure 3-7. The measured and calculated transient strains for Borre probe measurement. The following phases can be found in the strain behaviour: a) stable value, b) local maximum or minimum before strain gauge position, c) local maximum or minimum after strain gauge position and d) final stable value. The strain gauge position is equal to zero coring advance.
Figure 4-11. Overcoring quality control tool, comparison of measured and calculated strains.
Figure 4-14. Overcoring quality control tool, stress maximum paths with rock strength envelopes.

27
cd
ci
Stress path of point wheremaximum compressiontakes place
Stress path of point wheremaximum tensiontakes place
DAMAGE EVIDENT
HIGH DAMAGEPOTENTIAL
DAMAGE POSSIBLE
Secondary stress on pilothole wall with biggersignal
Strength envelope,defined by , and s=1ucs t
t
ucs
Crack initiation envelope,-1 ci3 =
Crack damage envelope,defined by , s=1 cd andm ( strength envelope )
Envelope for= 0.05 3 1
Figure 4-15. Definition of strength envelopes and their interpretation.

28
Document number 10.
(Project document number: 7.)
Subject area Rock stress state
Document reference Siitari-Kauppi, M. 2003. Core damage study of two overcored samples from borehole KR24 using PMMA-method. Memorandum Work 9728/03/HH. Helsinki University, Helsinki (in Finnish).
Subject matter Identifying the damage in overcored rock samples.
Objectives To study the damage of two overcored samples from stress measurement borehole KR24.
Methodology Use of the PMMA technique to highlight the cracks.
Highlighted figures Fig. 8. Sample KR24 2:2:6 A1. Photo on the core sample (upper) and the corresponding autoradiograph (lower).
Conclusions One sample showed clear evidence on core damage (microcracking), the other one was undamaged.
Comments
Figure 8. Sample KR24 2:2:6 A1. Photo on the core sample (upper) and the corresponding autoradiograph (lower). R=location of strain gauge rosettes.

29
Document number 11.
(Project document number: 8.)
Subject area Rock stress state
Document reference Hakala, M. 2004. Quality control study for in situ stress measurements in borehole OL-KR24. Memorandum Matti Hakala / KMS Hakala Oy, Joensuu. 22.9.2005.
Subject matter Analyses of stress measurement results in KR24 using the developed transient strain analysis tool.
Objectives To re-analyse overcoring stress measurements using the quality control program.
Methodology The strain-stress-strength analyses were made using the OCQ-code developed in Posiva and SKB joint project.
Highlighted figures Fig. 3-1. Orientations of in situ principal stresses from three measurements using three different interpretations assumptions.
Fig. 3-2. Magnitudes of in situ principal stresses in three measurements using three different interpretations assumptions.
Conclusions The three best measurements; 1:8:1, 2:2:6 and 2:3.2, of a total of 8 overcoring attempts (number of probe installations was 15) were analysed, while the others were rated unsuccessful based on overcoring or biaxial response.
Comments This study was a final part of the Posiva’s commission 9758/03/HH ”Kairareiän KR24 jännitystilamittauksiin liittyvä asiantuntijatyö” and is related to in situ stress measurements at Olkiluoto in borehole KR24 carried out by SwedPower in the summer of 2003.
Sigma-1
Sigma-2
Sigma-3
North = y = dd 0°
East = x = dd 90°
S1 ( 1:8:1 )
S1 ( 2:2:6 )
S1 ( 2:3:2 )
S2 ( 1:8:1 )
S2 ( 2:2:6 )
S2 ( 2:3:2 )
S3 ( 2:3:2 )
S3 ( 1:8:1 )
S3 ( 2:2:6 )
dip=60° dip=30° dip=0°
0
5
10
15
20
25
1:8:1 1:8:1, I 1:8:1, I+WP 2:2:6 2:2:6, I 2:2:6, I+WP 2:3:2 2:3:2, I 2:3:2, I+WP
Measurement ( I = inverse solution, WP=water pressure taken into account )
Pri
ncip
al
str
ess (
MP
a )
Sigma 1
Sigma 2
Sigma 3
Figure 3-1. Orientations of in situ principal stresses from three measurements using three different interpretations assumptions.
Figure 3-2. Magnitudes of in situ principal stresses in three measurements using three different interpretations assumptions.

30
Document number 12.
(Project document number: 9.)
Subject area Rock stress state
Document reference Geological Survey of Finland. 2005. Regional stress field in Satakunta area. Report P 34.4.042.
Subject matter Study of the stress state in the Satakunta region (Olkiluoto belongs to Satakunta). This study is part of a wider GeoSatakunta project.
Objectives The aim of this study is partly thematic – to study which geological processes affect the stress field in the Satakunta area. The first phase of this project ends at the beginning of 2004 with a report on the probable different phenomena and processes, which might affect the stress field.
Methodology Overview geological study and reviews
Highlighted figures Fig 3, page 36. Stress map of Northern Europe (Reinecker et al. 2003).
Conclusions Some conclusions relating to specific subjects but no direct overall conclusions.
Comments The next phase is to collect the data and model the stress field based on the data given in this report.
Fig 3, page 36. Stress map of Northern Europe (Reinecker et al. 2003).

31
Deformation and strength properties of intact rock
Document number 13.
(Project document number: 10)
Subject area Properties of the intact rock
Document reference Matikainen, R. & Simonen, A. 1992. Rock mechanics properties of core samples drilled during preliminary site investigations. TVO/Site Investigations Work Report 92-36 (in Finnish). Teollisuuden Voima Oy, Helsinki.
Subject matter First laboratory tests on core samples from five sites to determine strength and deformation properties of different rock types. 11 samples from Olkiluoto at the depth range of 109 – 327 m.
Objectives To conduct uniaxial deformability and strength tests on the main rock types from the five SI areas. Also, to then compare these results with those obtained earlier.
Methodology Laboratory testing using the ISRM Suggested Methods. 66 uniaxial compressive tests were conducted.
Highlighted figures Table 4. Strength and deformation properties measured from Olkiluoto core samples, E = Young’s modulus, v = Poisson ratio, UCS = uniaxial compressive strength, d = core sample diameter, l = core sample length.
Appendix 11/8. An example of stress-strain curve, sample OL-KR3_2A, mica gneiss, depth 308 m.
Conclusions In Olkiluoto, the UCS and E values for the mica gneiss/tonalite were 94-153 MPa and 39-72 GPa, and for the granites 118-159 MPa and 64-69 GPa. There were some differences in the individual tests between the values obtained by point load testing on the cores in the field and the laboratory tests conducted here.
Comments

32
Table 4. Strength and deformation properties measured from Olkiluoto core samples, E = Young’s modulus, v = Poisson ratio, UCS = uniaxial compressive strength, d = core sample diameter, l = core sample length.
Appendix 11/8. An example of stress-strain curve, sample OL-KR3_2A, mica gneiss, depth 308 m.

33
Document number 14.
(Project document number: 11.)
Subject area Properties of the intact rock
Document reference Kuula, H. 1994. Strength properties of intact rock at Olkiluoto, Romuvaara and Kivetty sites. Work report TEKA-94-13. Teollisuuden Voima Oy, Helsinki.
Subject matter Rock mechanics testing of cores.
Objectives Laboratory tests on core samples from three sites to determine strength and deformation properties of the main rock types at deeper levels. Cyclic loading was used.
Methodology MTS testing system and use of 7 samples from Olkiluoto at the depth range of 443 – 809 m.
Highlighted figures Appendix page: Stress-strain curve for Olkiluoto sample from KR4, depth 491.4 m.
Conclusions There is a correlation between the compressive strength and rock type but no clear relation between the rock type and the crack initiation and crack damage values. In Olkiluoto, the peak strength (UCS) values for the mica gneiss were 98-127 MPa, and for the pegmatites 113-136 MPa.
Comments

34
Appendix. An example of stress-strain curve, sample from OL-KR4, mica gneiss, depth 491.4 m.

35
Document number 15.
(Project document number: 11A.)
Subject area Properties of intact rock
Document reference Kajanen, J. 1995. Testreport Mak-Kal 2088/94. Helsinki University of Technology, Espoo.
Subject matter Testing of core samples.
Objectives To conduct laboratory tests on rock samples to determine strength and deformation properties.
Methodology Laboratory tests on 5 core samples from Olkiluoto at the depth range of 98 – 155 m.
Highlighted figures None
Conclusions Results presented. The peak strength (UCS) values for the mica gneiss were 99-155 MPa and Young’s modulus 43-69 GPa.
Comments Relates to post-graduate work to study the fracture testing of core samples.

36
Document number 16.
(Project document number: 12.)
Subject area Properties of the intact rock
Document reference Johansson, E. & Autio, J. 1995. Properties of rock in TVO Research Tunnel and investigation sites. Work report TEKA-95-10. Teollisuuden Voima Oy, Helsinki.
Subject matter Additional laboratory tests on core samples.
Objectives To obtain the deformation and strength properties of the main rock types from three investigation sites and the research tunnel at Olkiluoto. Also, to determine drillability indices.
Methodology Laboratory testing of 5 samples from Olkiluoto at the depth range of 473 – 501 m. Use of MTS machine and Drilling Rate Index and Cerchar Abrasion Index.
Highlighted figures Fig. 7a. Testing machine for scratching the surface of a rock sample.
Fig. 8. Variation of DRI in various rock types and the average DRI-values determined for the rock types of this study.
Fig. 19. Strength properties of mica gneiss at Olkiluoto investigation site.
Fig. 26. Cube representing the jointing at Olkiluoto site.
Conclusions Specific results are given for the samples from the different sites and inter-comparison conclusions are made.
Comments

37
Figure 7a. Testing machine for scratching the surface of a rock sample.
Figure 8. Variation of DRI in various rock types and the average DRI-values determined for the rock types of this study.
Figure 19. Strength properties of mica gneiss at Olkiluoto investigation site.
Figure 26. Cube representing the jointing at Olkiluoto site.

38
Document number 17.
(Project document number: 13)
Subject area Properties of the intact rock
Document reference
Hakala, M. & Heikkilä, E. 1997a. Summary report - Development of laboratory tests and the stress-strain behaviour of Olkiluoto mica gneiss. Report POSIVA-97-04. Posiva Oy, Helsinki.
Subject matter Development of laboratory testing procedure to establish statistically reliable stress-strain behaviour of the intact rock for the detailed site investigation phase. Olkiluoto mica gneiss and pegmatite were used as test samples in the development work. 132 tests on mica gneiss and 12 tests on pegmatite.
Objectives To develop and quantify a suitable combination of laboratory tests to establish statistically reliable stress-strain characteristic for the main rock types at Olkiluoto.
Methodology Literature study, development and quantification of laboratory tests and suggested test procedures. 130 loading tests of Olkiluoto mica gneiss. Commonly used tests, plus direct tension, damage controlled and acoustic emission tests.
Highlightedfigures
Fig. 4.2.2. Location of OL-KR10 borehole from which the samples were obtained (geology for 500 m level).
Fig. 4.4.1. Envelopes for uniaxial stress-strain behaviour of Olkiluoto mica-gneiss.
Fig. 4.4.6. 95% confidence limit for standard deviation of crack initiation stress.
Fig. 4.4.8. 95% confidence limit for standard deviation of the peak strength.
Fig. 4.5.2. 95% confidence limit for crack initiation and crack damage stress envelopes.
App. 3 – page 2. Deviation of Young’s modulus in uniaxial compression test, 0.75 MPa/s.
Conclusions Olkiluoto mica gneiss (30% mica on the average) is strongly heterogeneous, so a statistical approach is necessary. The mica gneiss is brittle (Class II) and the foliation affects the failure. Factors affecting the properties are discussed. Recommendations are made concerning the specimen preparation and testing procedures
Comments

39
MicaGneiss
VeinedGneiss
Tonalite
TonaliteGneiss
Diabase
KR2
KR4
KR1
KR6
KR5
KR3
KR7
KR10
KR8
KR9
CoreDrillingBorehole 500m
Olkiluoto KR10 Mica Gneiss
Uniaxial Compression Tests, n = 60
Axial Stress ( MPa )
Radial Strain Axial Strain
-25
0
25
50
75
100
125
150
175
200
225
250
-1.2% -0.8% -0.4% 0.0% 0.4% 0.8%
Figure 4.2.2. Location of OL-KR10 borehole from which the samples were obtained (geology for 500 m level).
Figure 4.4.1. Envelopes for uniaxial stress-strain behaviour of Olkiluoto mica-gneiss.
4032
3626
3238
29
60 6170 70 72
67
115
0
50
100
150
200
250
1A-Slw 1A-Nrm 3A-0.5 3A-1 3A-3 3A-5 3A-15
Test Configuration
Crack Initiation ( MPa )
Olkiluoto Mica Gneiss
95% Confidence for
Stardard Deviation
and Average, n = 88
n=15n=23
n=8n=8
n=18n=8
n=8
4550 4851
78
4954
93
54
71
56
6876
59
132138
115124
139 139
188
0
50
100
150
200
250
1A-Slw 1A-Nrm 3A-0.5 3A-1 3A-3 3A-5 3A-15
Test Configuration
Peak Stength ( MPa )
Olkiluoto Mica Gneiss
95% Confidence for
Stardard Deviation
and Average, n = 100
n=13
n=23
n=7
n=7 n=17
n=7
n=8
95
107
9092
140
96105
Figure 4.4.6. 95% confidence limit for standard deviation of crack initiation stress.
Figure 4.4.8. 95% confidence limit for standard deviation of the peak strength.
1
29
40
3.9
60
115
2.6
49
95
9
104
171
0
50
100
150
200
-15 0 15 30
Minimum Principal Stress 3, ( MPa )
Maximum Principal Stress 1, ( MPa )
Olkiluoto Mica Gneiss95% Confidence Limits for
Crack Damage and
Crack Initiation
cd - upper
cd - lower
ci - upper
ci - lower
62
50
73
0 %
20 %
40 %
60 %
80 %
100 %
0 20 40 60 80 100
Young's Modulus ( GPa )
Young's Modulus, n=25
Normal Distribution, n=25
Average, n=25
95% Confidence forSt.Deviation, n=25
Cumulative Probability
Olkiluoto KR10 Mica Gneiss
Uniaxial, 0.75 MPa/s
Figure 4.5.2. 95% confidence limit for crack initiation and crack damage stress envelopes.
Appendix 3 - page 2. Deviation of Young’s modulus in uniaxial compression test, 0.75 MPa/s.

40
Document number 18.
(Project document number: 14.)
Subject area Properties of the intact rock
Document reference Hakala, M. & Heikkilä, E. 1997b. Laboratory testing of Olkiluoto mica gneiss in borehole OL-KR10. Work report POSIVA-97-07e. Posiva Oy, Helsinki.
Subject matter Comprehensive laboratory testing on Olkiluoto mica gneiss samples from three depth levels. Uniaxial and triaxial conventional loading tests, also damage controlled tests, and tests with acoustic emission monitoring were conducted. Strength correlation with rock texture was also studied.
Objectives To conduct laboratory testing of the Olkiluoto mica gneiss to obtain rock mechanics values for the intact rock.
Methodology 132 tests to obtain the complete stress-strain behaviour. Specimens from OL-KR10 at depths 400-450 m and 550-600 m. Also, direct and indirect tensile tests. Acoustic emission was studied in some tests. Thin sections were studied. 12 specimens of pegmatite were also tested.
Highlighted figures Fig. 5.1.2. Determination of critical stress states t, ci, cd, p.
Fig. 5.2.1. Variation of uniaxial stress-strain behaviour of Olkiluoto mica-gneiss and two typical stress-strain curves.
Fig. 5.2.2. Variation of triaxial stress-strain behaviour of Olkiluoto mica-gneiss with one typical stress-strain curve.
Fig. 5.3.1. The 95% confidence limit for standard deviation of Young’s modulus.
Conclusions Mica gneiss is brittle and has no significant strength after 0.3% uniaxial strain. The spread in results is well described by a normal distribution. Many other recorded details, including wet/dry effect.
Comments Very relevant report.

41
Figure 5.1.2. Determination of critical stress states t, ci, cd, p.
Figure 5.2.1. Variation of uniaxial stress-strain behaviour of Olkiluoto mica-gneiss and two typical stress-strain curves.
Figure 5.2.2. Variation of triaxial stress-strain behaviour of Olkiluoto mica-gneiss with one typical stress-strain curve.
Figure 5.3.1. The 95% confidence limit for standard deviation of Young’s modulus.

42
Document number 19.
(Project document number: 15.)
Subject area Properties of the intact rock
Document reference
Hakala, M. 1998. Particle mechanical aspect of stress-strain behaviour in rock. Working Report 98-77. Posiva Oy, Helsinki.
Subject matter First study to test PFC (particle mechanical code) code to find out how micromechanical properties affect the observed stress-strain behaviour and which are the key micromechanical elements that define the stress-strain behaviour of schistose rock such as Olkiluoto mica gneiss.
Objectives To use the particle flow code PFC3D to establish how the different micromechanical properties affect the observed stress-strain behaviour and what are the key micromechanical elements defining the stress-strain behaviour of the foliated mica schist.
Methodology Use of 13 test numerical loading simulations to monitor the response and damage of the specimens. The factors studied were: packing, confinement, loading rate, contact stiffness, bond strength, particle friction, spatial variation of strength and dip of weakness planes.
Highlightedfigures
Fig. 1.1. The process phases leading to the failure of brittle rock and determination of the critical stress states.
Fig. 5.2. Phases of model preparation.
Fig. 8.1. Stress-strain behaviour in Test case N and Olkiluoto mica gneiss.
Conclusions The PFC code was found to simulate the development of elastic parameters a stable damaging phase temporary hardening hardening with an increased strain rate strain rate dependence of the post-failure phase.
The code is helpful for studying the structural breakdown of rock but a good knowledge of material physics, rock mechanics and programming are needed to use the code. Recommendations are made relating to cautions with respect to the unrealistically high dilation with small confining stress, the effect of particle size, and the effect of the strain measurement method.
Comments Experiments enabled the ‘Martin parameters’ of crack initiation stress and crack damage stress to be studied as well as the shape of the complete stress-strain curve and the associated volumetric expansion. This report was produced in 1998 and the PFC program has been upgraded for a variety of features since then.

43
Strain ( mm/mm )
Deviatoric Stress ( MPa )
AxialRadial
0
50
100
150
200
-0.4% -0.2% 0.0% 0.2% 0.4%
Test Case N OL-KR10 micagneiss, 404.75
OL-KR10 micagneiss, All
Figure 1.1. The process phases leading to the failure of brittle rock and determination of the critical stress states.
Figure 8.1. Stress-strain behaviour in Test case N and Olkiluoto mica gneiss.
Generation Expansion Compacted
Figure 5.2. Phases of model preparation.

44
Document number 20.
(Project document number: 16.)
Subject area Properties of the intact rock
Document reference
Autio, J., Johansson, E., Kirkkomäki, T., Hakala, M. & Heikkilä, E. 2000. In-situ failure test in the Research Tunnel at Olkiluoto. Report POSIVA 2000-05. Posiva Oy, Helsinki.
Subject matter As part of the in-situ failure test design, laboratory tests were performed to investigate the strength and deformation properties dependence on the orientation of schistosity (foliation). The rock type was gneissic tonalite from the Olkiluoto research tunnel.
Objectives To consider a preliminary design for the failure test in the Research Tunnel at Olkiluoto, assess the technical feasibility of the test and to provide input information for further numerical modelling of the test, including rock properties, fracture propagation, in situ stress, and the use of an expanding agent to produce an artificial stress field.
Methodology Samples from the Research Tunnel were tested at HUT. FLAC2D and FLAC3D used for numerical modelling, including a strain softening model.
Highlightedfigures
Fig. 1.2-1. The research tunnel at Olkiluoto.
Table 3.1-1. Mechanical properties of the gneissic tonalite.
Fig. 3.1-1. The gneissic tonalite in Deere’s classification system.
Fig. 3.4-1. Compressive strength versus foliation angle for all samples.
Fig. 4.4-2. Maximum principal stress around full-scale deposition holes.
Fig. 6.6-3. A vertical section taken parallel to the axis of the test hole showing sigma1 stresses for a swelling pressure of 50 MPa.
Conclusions The mechanical properties of the gneissic tonalite depend on the orientation of the foliation; clear correlation was found between the deformation and strength properties and the foliation. The in situ test was shown to be technically feasible and a state of stress high enough to cause failure could be created. A suite of conclusions regarding the likely results of the experiment in the Research Tunnel are presented (p. 115).
Comments The Research Tunnel experiment did not go ahead but the rock property information is useful.

45
Figure 1.2-1. The Research Tunnel at Olkiluoto. Figure 3.1-1. The gneissic tonalite in Deere’s classification system.
ucs[MPa] cd[Mpa] ci[MPa] t[MPa] E [GPa] 92 81 37 9,4 58
DRI CAI Q-cont[%] JF[pcs/m]55 0,25 3,8 15-20 1
ucs, cd, ci and t are uniaxial compressive, crack damage, crack initiation and tensile strengths respectively. E is Young’s modulus, is Poisson’s ratio, DRI is drillability index, CAI is Cerchar abrasiveness index, Q is quartz content and JF is joint frequency.
p - all diameters
y = 0.0166x2 - 1.9542x + 150.32
R2 = 0.6652
y = 0.0134x2 - 1.6575x + 142.05
R2 = 0.8704
y = 0.022x2 - 2.3187x + 150.2
R2 = 0.5096
30
40
50
60
70
80
90
100
110
120
130
140
150
160
170
0.0 22.5 45.0 67.5 90.0
Schistosity angle [degrees]
d 54 mm
d 41 mm
d 99 mm
d 54 mm
d 41 mm
d 99 mm
x
y
Sample axis
Schistosity planes
Shistosity angle
Table 3.1-1. Mechanical properties of the gneissic tonalite.
Figure 3.4-1. Compressive strength versus foliation angle for all samples.

46
-1.700E+07 -2.000E+07-1.400E+07 -1.700E+07-1.100E+07 -1.400E+07-8.000E+06 -1.100E+07-5.000E+06 -8.000E+06-5.000E+06 -5.000E+06
max mininterval = 3.000E+06max. p.s. contours
H
Research tunnel
h
v
=5.12 MPa
=2.42 MPa
=1.9 MPa
Stress:
Rock type:
Bottom
Floor level
H perpendicular to tunnel axis
Gneissic tonalite
Figure 4.4-2. Maximum principal stress around full-scale deposition holes.
Figure 6.6-3. A vertical section taken parallel to the axis of the test hole showing sigma1 stresses for a swelling pressure of 50 MPa.

47
Document number 21.
(Project document number: 17.)
Subject area Properties of the intact rock
Document reference
Wanne, T. 2002. Rock strength and deformation dependence on schistosity. Simulation of rock with PFC3D. POSIVA 2002-05. Posiva Oy, Helsinki.
Subject matter Strength and deformation properties dependence on the orientation of schistosity was studied further using numerical modelling and the PFC code. Numerical simulations were compared to laboratory observations (gneissic tonalite).
Objectives To study the effect of rock anisotropy on the deformation and strength properties by simulating an unconfined compression test with PFC3D.
Methodology The schistosity/foliation was studied by generating an anisotropic particle structure of matrix particles and oriented band particles. The results were compared to real tests on gneissic tonalite.
Highlightedfigures
Fig. 4-3. Particle band generation produces an anisotropic model.
Fig. 5-4. Peak strength of the laboratory tests and the PFC3D runs.
Fig. 5-8. Schematic illustration of the four phases of damage formation.
Conclusions The responses of the model and the real rock were found to be similar, and both were a function of schistosity. The PFC model results did depend on the particle size and geometry of banding.
Comments

48
Figure 4-3. Particle band generation produces an anisotropic model.
Figure 5-4. Peak strength of the laboratory tests and the PFC3D runs.
Figure 5-8. Schematic illustration of the four phases of damage formation.

49
Document number 22.
(Project document number: 18.)
Subject area Properties of the intact rock
Document reference Wanne, T. 2003. Point load test results from Olkiluoto area. Determination of strength of intact rock from boreholes KR1 – KR23. Memorandum Research - 11/2003. Saanio & Riekkola Oy, Helsinki.
Subject matter Summary of point load test results.
Objectives Tests were conducted in the field during drilling of each deep borehole using testing equipment called the Rock Tester. 814 samples from 23 boreholes at depths 10 – 1038 m were tested.
Methodology For this memorandum, the point load test results were collected from drilling reports (POSIVA Working Reports) by Suomen Malmi Oy (SMOY), including data sets of 23 core-drilled boreholes (KR1 – KR23) at Olkiluoto area. The results were classified according to six rock types.
Highlighted figures Table 1. Uniaxial compressive strength of the samples based on the point load index, median, average, standard deviation and number of samples in each category.
Figure 2. Frequency (%) distribution of the uniaxial compressive strength of the mica gneiss samples based on the point load index.
Figure 3. Frequency (%) distribution of the uniaxial compressive strength of the veined gneiss samples based on the point load index.
Figure 4. Frequency (%) distribution of the uniaxial compressive strength of the granite and pegmatite samples based on the point load index.
Figure 5. Frequency (%) distribution of the uniaxial compressive strength of the tonalite samples based on the point load index.
Figure 6. Uniaxial compressive strength of the mica samples with respect to the vertical depth.
Conclusions The results regarding the strength properties of different rock types are compiled and summarized as graphs. The appendices contain the data sorted by the borehole number. In practice, the average value of the whole data set (142 35 MPa) can be used as an estimate for the uniaxial compressive strength of the rock at the area in question. The depth dependence was also studied and it was found out that the strength values do not have a correlation with the depth.
Comments It has been discussed whether to add the rest of the surface borehole information and expand this into a Posiva Working Report (this has been done, report will be published in 2005).

50
Table 1. Uniaxial compressive strength of the samples based on the point load index, median, average, standard deviation and number of samples in each category.
UCS [MPa] median
UCS [MPa] average
Standard deviation [MPa]
Number of samples
Mica gneiss 145 149 22,1 233 Veined gneiss 128 131 21,7 176 Granite/Pegmatite 152 152 25,3 160 Tonalite 146 151 22,9 65 Amphibolite/Metadiabase 111 111 9,1 4 Hornblende gneiss 156 156 2,4 2 Total (unmodified) 143 145 36,7 814
Mica gneiss - point load test, 310 samples
0,00
5,00
10,00
15,00
20,00
25,00
30,00
50 75 100 125 150 175 200 225 250 275 300 More
ucs [MPa]
Fre
q-%
Veined gneiss - point load test, 218 samples
0,00
5,00
10,00
15,00
20,00
25,00
30,00
35,00
50 75 100 125 150 175 200 225 250 275 300 More
ucs [MPa]
Fre
q-%
Figure 2. Frequency (%) distribution of the uniaxial compressive strength of the mica gneiss samples based on the point load index.
Figure 3. Frequency (%) distribution of the uniaxial compressive strength of the veined gneiss samples based on the point load index.
Granite/Pegmatite - point load test, 198 samples
0,00
5,00
10,00
15,00
20,00
25,00
30,00
50 75 100 125 150 175 200 225 250 275 300 More
ucs [MPa]
Fre
q-%
Tonalite - point load test, 80 samples
0,00
5,00
10,00
15,00
20,00
25,00
30,00
35,00
50 75 100 125 150 175 200 225 250 275 300 More
ucs [MPa]
Fre
q-%
Figure 4. Frequency (%) distribution of the uniaxial compressive strength of the granite and pegmatite samples based on the point load index.
Figure 5. Frequency (%) distribution of the uniaxial compressive strength of the tonalite samples based on the point load index.
Uniaxial compressive strength (point load test) versus depth - 310 Mica samples
0
50
100
150
200
250
300
0 100 200 300 400 500 600 700 800 900 1000
depth [m]
ucs [
MP
a]
Figure 6. Uniaxial compressive strength of the mica samples with respect to the vertical depth.

51
Document number 23.
(Project document number: 19.)
Subject area Properties of the intact rock
Document reference Johansson, E. & Hjerpe, T. 2003. Material models for analyzing behavior of intact rock for Olkiluoto rock types and needed input data. Memorandum TS 29/2003. Saanio & Riekkola Oy, Helsinki.
Subject matter Description of different approaches to model the behaviour of intact rock.
Objectives To study new models that can take into account inhomogeneity and anisotropy.
Methodology Memo describes the development of different material models for intact rock and discusses the input data needed for the models.
Highlighted figures Figure 1. Illustration of the rock mechanics design issues associated with the performance assessment of a nuclear waste repository. Also shown are the potential stress paths that need to be considered when assessing the rock mechanics issues (Martin et al. 2001).
Figure 2. Stress-strain diagram obtained from a single uniaxial compression test for a rock sample showing the definition of crack initiation ( ci), unstable cracking ( cd) and peak strength ( p or ucs). The axial and lateral strains are measured. The volumetric strain and crack volumetric strain are calculated (according to Martin 1994).
Figure 4. Cohesion and friction with strain for Olkiluoto mica gneiss.
Conclusions There is a comprehensive list of recommendations for moving into a modelling arena where rock cracking and anisotropy can be taken into account.
Comments

52
Figure 1. Illustration of the rock mechanics design issues associated with the performance assessment of a nuclear waste repository. Also shown are the potential stress paths that need to be considered when assessing the rock mechanics issues (Martin et al. 2001).

53
Figure 2. Stress-strain diagram obtained from a single uniaxial compression test for a rock sample showing the definition of crack initiation ( ci), unstable cracking ( cd) and peak strength ( p or �ucs). The axial and lateral strains are measured. The volumetric strain and crack volumetric strain are calculated (according to Martin 1994).
Figure 4. Cohesion and friction with strain for Olkiluoto mica gneiss.

54
Document number 24.
(Project document number: 20.)
Subject area Properties of the intact rock
Document reference Hakala, M., Kuula, H. & Hudson, J. 2005. Strength and strain anisotropy of Olkiluoto mica gneiss. Working Report 2005-61. Posiva Oy, Olkiluoto.
Subject matter Testing of anisotropic intact rock.
Objectives First laboratory tests on core samples to define the anisotropic properties for Olkiluoto mica gneiss.
Methodology 19 samples from boreholes KR12 and KR14 at depths in the range 333 – 619 m were tested.
Highlighted figures Fig. 5-2. Polar plot of mean apparent Young’s modulus. Measured values and result from transverse isotropic solution.
Fig. 5-9. Crack initiation stress level of each specimen defined from extensometer readings and acoustic emission measurements.
Fig. 5-13. Crack damage stress level of each specimen defined from extensometer readings and acoustic emission measurements.
Fig. 5-16. Peak strength of each specimen.
Fig. 6-1. Observed effect of anisotropy on critical stress states (modified from Hudson & Harrison 1997).
Conclusions The results showed a deformation anisotropy of about 1.4 (E/E’). This anisotropy is high enough to produce significant errors both in magnitudes and orientations of in situ principal stresses when the data is reduced from overcoring assuming isotropy, and therefore it is suggested to develop a method to take this into account in the interpretation of the stress measurement results.
Comments

55
0
10
20
30
40
50
60
70
80
90
100
0 20 40 60 80 100 ( GPa )
( G
Pa
)
Ey=40GPa
Ey=60GPa
Ey=80GPa
LS-Fit for Transverse isotropy
Measured
15°
30°
45°
60°
75°
Figure 5-2. Polar plot of mean apparent Young’s modulus. Measured values and result from transverse isotropic solution.
0
25
50
75
100
125
150
175
0 10 15 20 22 25 27 27 27 42 42 45 45 45 70 70 70 78 80
MTS_s_ci
AE_s_ci1
AE_s_ci2
Axial stress (MPa)
Anisotropy angle ( degrees )
Figure 5-9. Crack initiation stress level of each specimen defined from extensometer readings and acoustic emission measurements.

56
0
25
50
75
100
125
150
175
0 10 15 20 22 25 27 27 27 42 42 45 45 45 70 70 70 78 80
MTS_s_cd
AE_s_cd1
AE_s_cd2
Axial stress (MPa)
Anisotropy angle ( degrees )
Figure 5-13. Crack damage stress level of each specimen defined from extensometer readings and acoustic emission measurements.
0
25
50
75
100
125
150
175
0 10 15 20 22 25 27 27 27 42 42 45 45 45 70 70 70 78 80
Axial stress ( MPa )
Anisotropy angle ( degrees )
Figure 5-16. Peak strength of each specimen.
Figure 6-1. Observed effect of anisotropy to critical stress states (modified from Hudson & Harrison 1997).

57
Fracture properties
Document number 25.
(Project document number: 27.)
Subject area Properties of fractures
Document reference Hakala, M., Johansson, E., Simonen, A. & Lorig, L. 1993. Application of the continuously-yielding joint model for studying disposal of high-level nuclear waste in crystalline rock. Report YJT-93-06. Nuclear Waste Commission of Finnish Power Companies, Helsinki.
Subject matter Testing of the non-linear continuously yielding joint model.
Objectives To use the joint input data as received from the triaxial joint tests (granitic rock from a depth of 400 – 600 m) and to conduct 3DEC numerical analyses.
Methodology MTS testing machine at HUT was used to determine the joint properties.
Highlighted figures Fig. 3-4. Typical instrumented specimen.
Fig. 3-6. The principle of the triaxial test of a joint.
Fig. 5-1. Vertical UDEC model and boundary conditions for a) the in situ state and b) after excavation.
Fig. 5-4. Flow rates on joints using constant stiffness joint model.
Fig. 5-5. Flow rates on joints using the Continuously-Yielding joint model.
Conclusions The numerical evaluation of scale effect showed a clear effect for joint normal and shear parameters.
Comparison of constant stiffness and continuously yielding joints in the numerical model showed no major differences, although some hydraulic apertures in the vicinity of the tunnel were different.
Comments

58
Fig. 3-4. Typical instrumented specimen. Figure 3-6. The principle of the triaxial test of a joint.
Figure 5-1. Vertical UDEC model and boundary conditions for a) the in situ state and b) after excavation.
Figure 5-4. Flow rates on joints using constant stiffness joint model.
Figure 5-5. Flow rates on joints using the Continuously-Yielding joint model.

59
Document number 26.
(Project document number: 28.)
Subject area Properties of fractures
Document reference Hakala, M. 1997. Validation of triaxial testing of rock joints for studying disposal of high-level waste in crystalline rock. (Unpublished work on CD-ROM)
Subject matter Mechanical properties of fractures.
Objectives Evaluation of suitability of triaxial joint testing.
Methodology Laboratory testing
Highlighted figures None
Conclusions The results were not after all very encouraging with major problems relating to scale effect and test arrangement (see document number 25).
Comments

60
Document number 27.
(Project document number: 29.)
Subject area Properties of fractures
Document reference Palmén, J., Heikkinen, E., Hellä, P. & Ahokas, H. 2001. Generic fracture properties of intact bedrock at repository depth level. Memorandum 11.9.2001. Fintact Oy, Helsinki.
Subject matter Fracture description from three boreholes at Olkiluoto from the depth level of 300 – 600 m. This geological description was made to try to estimate the mechanical fracture properties.
Objectives To define the generalised fracture subsets best characterising the intact rock at the repository depth level and its surroundings at 300-600 m depth.
Methodology The significance of each fracture subset was assessed according to the fracture type, properties and orientation. The differences between the previous work in 1995 and the current work was established.
Previous work used surface mapping data, some oriented data from boreholes and data from the low and intermediate waste repository at Ulkopää. The new work used data from KR1, KR2 and KR4, plus information from the fracture database. Comparison was possible with hydraulic conductivity, aperture and fracture type.
The borehole length was divided into fracture zones and the fractures were divided into types. Fracture clusters in the sub-volumes were studied.
Highlighted figures Fig. 2. The fracture sets and the orientation of the observed fractures.
Fig. 3. Fracture type distribution.
Fig. 13. Histogram for hydraulic apertures of hydraulically conductive fractures.
Conclusions Seven orientational sub-sets were established with their details and correlations with other parameters.
Comments

61
Figure 2. The fracture sets and the orientation of the observed fractures.
Figure 3. Fracture type distribution. Figure 13. Histogram for hydraulic apertures of hydraulically conductive fractures.

62
Properties of the rock mass
No specific reports on this subject
Properties of deformation zones
No specific reports on this subject
Thermal properties of rock and thermal analyses
Document number 28.
(Project document number: 30.)
Subject area Thermal properties
Document reference Kjørholt, H. 1992. Thermal properties of rock. TVO/Site investigations Work report 92-56. Teollisuuden Voima Oy, Helsinki.
Subject matter Measuring the thermal properties.
Objectives First laboratory tests on core samples from five sites to determine the thermal properties of different rock types.
Methodology Work includes three samples from Olkiluoto in the depth range of 106 – 307 m.
Highlighted figures None
Conclusions Results given for the measurements.
Comments

63
Document number 29.
(Project document number: 31.)
Subject area Thermal properties
Document reference Kukkonen, I. & Lindberg, A. 1995. Thermal conductivity of rocks at the TVO investigation sites Olkiluoto, Romuvaara and Kivetty. Report YJT-95-08. Nuclear Waste Commission of Finnish Power Companies, Helsinki.
Subject matter Laboratory tests on core samples from three sites to determine thermal properties of main rock types at deeper levels. 9 samples from Olkiluoto at the depth range of 342 – 502 m. Three Olkiluoto samples in anisotropy testing.
Objectives To establish the thermal conductivity from rock samples
Methodology 27 rock samples were used from the three sites using the divided bar method. Microstructural analyses were also carried out.
Highlighted figures None
Conclusions Values were obtained in the range 2.41 to 4.23 Wm-1K-1 which is in good agreement with the theoretical values estimated from the microstructural composition. The rock at Olkiluoto is thermally anisotropic with an anisotropy factor of about 1.3. The bulk thermal conductivity value for the rock at Olkiluoto is estimated to be 3.04-3.14 Wm-1K-1.
Comments

64
.
Document number 30.
(Project document number: 32.)
Subject area Thermal properties
Document reference Kukkonen, I. & Lindberg, A. 1998. Thermal properties of rocks at the investigation sites: measured and calculated thermal conductivity, specific heat capacity and thermal diffusivity. Working Report 98-09e. Posiva Oy, Helsinki.
Subject matter Determination of thermal properties as calculated from the mineral composition. Comparison between measured and calculated values.
Objectives Measurement of thermal conductivity, specific heat capacity, thermal diffusivity, density and mineral composition of 35 rock samples.
Methodology Standard testing and indirect determinations
Highlighted figures None
Conclusions Values were obtained and compared for the four investigation sites of Olkiluoto, Romuvaara, Kivetty and Hästholmen
Comments

65
Document number 31.
(Project document number: 33.)
Subject area Thermal properties
Document reference Kukkonen, I. & Suppala, I. 1999. Measurement of thermal conductivity and diffusivity in situ: Literature survey and theoretical modelling of measurements. Report POSIVA 99-01. Posiva Oy, Helsinki.
Subject matter Pre-study to evaluate the possibilities to measure thermal properties in situ. Scale effect is considered to be significant factor.
Objectives To establish the then current situation with respect to in situ measurements of thermal conductivity and diffusivity of bedrock and to simulate measurements
Methodology Literature survey of ‘active’ and ‘passive’ methods and theoretical simulations of measurements.
Highlighted figures None
Conclusions Measurement would yield information within 1 m of the drillhole and the measurement would last about 24 hours.
Specific parameters established for a measurement probe.
Comments Followed by actual probe, see following Document 32 [34].

66
Document number 32.
(Project document number: 34.)
Subject area Thermal properties
Document reference Kukkonen, I., Suppala, I., Sulkanen, K. & Koskinen, T. 2000. Measurement of thermal conductivity and diffusivity in situ: measurements and results obtained with a test instrument. Working Report 2000-25. Posiva Oy, Helsinki.
Subject matter First measurements in GTK’s (Geological Survey of Finland) test hole and preliminary results with a constructed test in situ test instrument.
Objectives In situ measurement of thermal conductivity and diffusivity of the crystalline bedrock.
Methodology Use of a prototype drillhole tool, 1.5 m long, 42 mm diameter, in a 56 mm hole in granite/granitic gneisses. Tests in the test hole facility of the Geological Survey of Finland at Espoo.
Highlighted figures Fig. 2. Outlook of the constructed in situ probe. Numbers with hatching indicate the locations of the temperature sensors.
Fig. 4. Temperature (solid line), thermal conductivity (squares) and simplified geological column of the test hole R301 at the Geological Survey of Finland, Espoo. Rock type symbols: GG = granite gneiss, MG = mica gneiss, HG = hornblende gneiss, G = granite.
Conclusions Probe operation was reasonably good. The in situ conductivities could be measured with reasonable accuracy when compared to drill core measurements. Diffusivity values were more sensitive to site circumstances.
Comments Prototype instrument

67
Figure 2. Outlook of the constructed in situ probe. Numbers with hatching indicate the locations of the temperature sensors.
Figure 4. Temperature (solid line), thermal conductivity (squares) and simplified geological column of the test hole R301 at the Geological Survey of Finland, Espoo. Rock type symbols: GG = granite gneiss, MG = mica gneiss, HG = hornblende gneiss, G = granite.

68
Document number 33.
(Project document number: 35.)
Subject area Thermal properties
Document reference Kukkonen, I. 2000. Thermal properties of the Olkiluoto mica gneiss: Results of laboratory measurements. Working Report 2000-40. Posiva Oy, Helsinki.
Subject matter Additional laboratory tests on core samples from Olkiluoto to determine thermal properties of mica gneiss. 37 samples from five boreholes at the depth range of 453 – 550 m were measured. Old results were also included and thermal properties were corrected for the temperature dependencies using literature data. Anisotropy was also investigated by correlating schistosity angle and thermal conductivity. Good summary report.
Objectives To obtain the thermal properties of mica gneiss samples from Olkiluoto boreholes (OL-KR1,2,4,9,11) at depths 450-550 m.
To measure thermal conductivity, specific heat capacity, density and core angle of schistosity, and to calculate thermal diffusivity.
Methodology Thermal conductivity by the steady-state divided bar. Specific heat by the calorimetric method. Bulk density by the Archimedes principle. Thermal diffusivity calculated. Schistosity angle measured.
Highlighted figures Fig. 4. Thermal conductivity results.
Fig. 5. Thermal diffusivity results.
Fig. 9. Thermal conductivity and schistosity angle (90° is perpendicular to the schistosity).
Conclusions The Olkiluoto mica gneiss is thermally anisotropic and heterogeneous. Thermal conductivity decreases with increasing temperature; specific heat capacity increases with increasing temperature; average thermal diffusivity decreases with increasing temperature. Anisotropy causes variations of up to 30%. Thermal conductivity and diffusivity are lowest in a direction perpendicular to the schistosity. The results follow the pattern of previous measurements.
Thermal properties can vary considerably over short distances.
Comments

69
Figure 4. Thermal conductivity results. Figure 5. Thermal diffusivity results.
Figure 9. Thermal conductivity and schistosity angle (90° is perpendicular to the schistosity).

70
Document number 34.
(Project document number: 36.)
Subject area Thermal properties
Document reference Löfman, J. 2001. The effect of anisotropic bedrock on the temperature rise of the repository – preliminary study. Working Report 2001-17. Posiva Oy, Helsinki.
Subject matter Preliminary analyses of the effects of anisotropy on the temperature distribution in the repository.
Objectives To characterise the effects of a bedrock anisotropic thermal conductivity on the temperature rise in the repository by means of numerical simulation.
Methodology Use of the verified finite element code FEFTRA.
Highlighted figures Fig. 3.6. Schematic description of the directions of foliation (black lines) in the case with three disposal canisters (not to scale).
Fig. 4.6. Temperature rise in the canister and rock in the mid-point between the canisters. The anisotropy coefficient of bedrock is 2.5.
Fig. 4.9. The maximum temperature rise in the canister as a function of dip of foliation perpendicular to the tunnels (cases 2-5). Dip of 0° stands for the horizontal foliation (case 5), whereas dip of 90° denotes the vertical foliation (case 2).
Conclusions Vertical foliation is the best and horizontal foliation is the worst in terms of temperature rise. Vertical foliation perpendicular to the tunnels is better than parallel to the tunnels.
So long as the anisotropy coefficient is less than 2.5, the temperature rise will be below the limit of 85 C as required for the bentonite.
Comments Preliminary analysis

71
Figure 3.6. Schematic description of the directions of foliation (black lines) in the case with three disposal canisters (not to scale).
Figure 4.6. Temperature rise in the canister and rock in the mid-point between the canisters. The anisotropy coefficient of bedrock is 2.5.
Figure 4.9. The maximum temperature rise in the canister as a function of dip of foliation perpendicular to the tunnels (cases 2-5). Dip of 0° stands for the horizontal foliation (case 5), whereas dip of 90° denotes the vertical foliation (case 2).

72
Document number 35.
(Project document number: 37.)
Subject area Thermal properties
Document reference
Kukkonen, I., Suppala, I. & Koskinen, T. 2001. Measurement of rock thermal properties in situ: numerical models of borehole measurements and development of calibration techniques. Working Report 2001-23. Posiva Oy, Helsinki.
Subject matter Numerical simulations and calibration studies to assist the future construction of the in situ borehole instrument.
Objectives To improve the theoretical modelling of in situ thermal measurements in order to provide a solid background for designing a down-hole tool for in situ determination of rock thermal properties.
Methodology Numerical modelling using FEMLAB. Also, tests of potential techniques for calibrating temperature sensors.
Highlightedfigures
Fig. 1. FEM mesh used for numerical modelling of the cylindrical heat source probe.
Conclusions Thermal conductivity and diffusivity can be obtained from drillhole measurements, but the procedure requires care. Conductivity measurements are more reliable than diffusivity measurements.
Comments Straightforward development of thermal rock property measurements using numerical modelling support.
Figure 1. FEM mesh used for numerical modelling of the cylindrical heat source probe.

73
Document number 36.
(Project document number: 38.)
Subject area Thermal properties
Document reference
Ikonen, K. 2003. Thermal analyses of spent nuclear fuel repository. Report POSIVA 2003-04. Posiva Oy, Olkiluoto.
Subject matter The temperature dimensioning of a KBS-3V type repository based on rock property measurements. The report provides an overview of the temperature distribution in the rock, which is one of the basic input information for the rock mechanics studies as well.
Objectives To evaluate the thermal behaviour of a KBS-3V type repository.
Methodology Use of a calculation methodology for the thermal analysis to determine the effect of different parameters and to support the planning, dimensioning and operation of the repository.
Highlightedfigures
Fig. 2. Dimensions of final disposal hole and tunnel.
Fig. 3. Conductivity and heat capacity of Olkiluoto rock.
Fig. 7. Decay power of fuel.
Fig. 33. Temperature distribution of one panel after 21 years operation.
Fig. 43. Canister surface temperature as a function of canister and tunnel spacing.
Conclusions The temperature of the canister surfaces can be determined by an analytical line heat source model more efficiently than by numerical analysis if the analytical model is first verified and calibrated by numerical analysis. The line heat sources can be superposed. The most important and sensitive parameter is the thermal canister power at disposal — because the thermal diffusivity of the rock is low.
Comments

74
Figure 3. Conductivity and heat capacity of Olkiluoto rock.
Figure 2. Dimensions of final disposal hole and tunnel.
Figure 7. Decay power of fuel.
Figure 33. Temperature distribution of one panel after 21 years operation.
Figure 43. Canister surface temperature as a function of canister and tunnel spacing.

75
Document number 37.
(Project document number: 39.)
Subject area Thermal properties
Document reference
Ikonen, K. 2003. Thermal analyses of KBS-3H type repository. Report POSIVA 2003-11. Posiva Oy, Olkiluoto.
Subject matter The temperature dimensioning of a KBS-3H type repository based on rock property measurements. The report gives an overview of the temperature distribution in rock, which is one of the basic input information for the rock mechanics studies. This is a follow on from Project document number 39 but deals with KBS-3H rather than KBS-3V.
Objectives To evaluate the thermal behaviour of a KBS-3H type repository.
Methodology Use of a calculation methodology for the thermal analysis to determine the effect of different parameters and to support the planning, dimensioning and operation of the repository.
Highlightedfigures
Fig. 2. Dimensions of horizontal disposal hole and canister.
Fig. 8. Heat flux distribution along canister external surface after 5 and 15 years.
Fig. 25. Canister surface temperature as a function of canister and tunnel spacing.
Conclusions The results are similar to the calculations for the vertically deposited canisters in the KBS-3V concept because differences between the two disposal concepts tend to cancel each other out in the thermal calculations.
Comments

76
Figure 2. Dimensions of horizontal disposal hole and canister.
Figure 8. Heat flux distribution along canister external surface after 5 and 15 years.
Figure 25. Canister surface temperature as a function of canister and tunnel spacing.

77
Document number 38.
(Project document number: 40.)
Subject area Thermal properties
Document reference
Huotari, T. & Kukkonen, I. 2004. Thermal expansion properties of rocks: Literature survey and estimation of thermal expansion coefficient for Olkiluoto mica gneiss. Working Report 2004-04. Posiva Oy, Olkiluoto.
Subject matter Literature study on the thermal expansion properties and estimation of the range for Olkiluoto mica gneiss — essential parameters to calculate the total stresses (mechanical + thermal) around the repository.
Objectives To present the theoretical basis of thermal expansion properties for rocks in the repository design context.
Methodology Thermal expansion properties studied from data in the literature. Thermal expansion studied with a few simple theoretical models and with PFC2D.
Highlightedfigures
Fig. 2. Schematic layout of repository.
Fig. 19. Thermal stresses for mica gneiss.
Fig. 21. Use of PFC2D to estimate the thermal expansion of a three mineral component simulated rock.
Conclusions Thermal expansion of rock influenced by a number of microstructural parameters, plus pressure and temperature. Methods and data reduction methods for measuring the expansion properties are recommended. Overall value for the Olkiluoto mica gneiss is 7-10 (10-6/degrees C) in the temperature range 20-60 degrees C.
Comments Use of PFC2D to estimate the overall thermal expansion of a multicomponent rock.

78
Figure 2. Schematic layout of repository.
Thermal stresses for mica gneiss
(Temperature rise from 15ºC to 60ºC)
0
5
10
15
20
25
30
0 5 10 15 20 25 30 35 40 45
T (ºC)
(MP
a)
biot=40, pl=10, qv=45, ptf=5 biot=30, pl=30, qv=
biot=30, pl=10, qv=45, ptf=15 biot=30, pl=30, qv=
Figure 19. Thermal stresses for mica gneiss. Figure 21. Use of PFC2D to estimate the thermal expansion of a three mineral component simulated rock.

79
Rock mass classification
Document number 39.
(Project document number: 43.)
Subject area Rock mass classification
Document reference Äikäs, K., Hagros, A., Johansson, E., Malmlund, H., Sievänen, U., Tolppanen, P., Ahokas, H., Heikkinen, E., Jääskeläinen, P., Ruotsalainen, P. & Saksa, P. 2000. Engineering rock mass classification of the Olkiluoto investigation site. Report POSIVA 2000-08. Posiva Oy, Helsinki.
Subject matter First attempt to use rock mass classification to determine suitable bedrock volumes for the repository construction. The classification had three categories – normal, demanding and very demanding. In addition Olkiluoto rock mass quality was classified according to the empirical Q-system.
Objectives To develop a rock mass classification scheme for evaluating the constructability of the host rock and hence determining suitable bedrock volumes for repository construction.
Methodology Studies of the bedrock model, methodology for estimating constructability, rock mass classification of the various units, groundwater chemistry, rock engineering properties and the Q classification, leading to conclusions on constructability and variation at Olkiluoto.
Highlighted figures Fig. 4.8-7. Distribution of Q value within intact rock mass, depth interval 200 - 400 m.
Conclusions The rock mass parameters that determine the constructability of the bedrock at Olkiluoto depend primarily on the depth and lithology and whether the construction takes place in ‘intact’ or fractured rock. The rock lies in the range of normal constructability to 500 m. At greater depths, the level of constructability decreases due to the increasing rock stress. The most important factor is the location and lateral extent of particular fracture zones at Olkiluoto.
Comments

80
Figure 4.8-7. Distribution of Q value within intact rock mass, depth interval 200 - 400 m.

81
Document number 40.
(Project document number: 44.)
Subject area Rock mass classification
Document reference McEwen, T. 2002, Host rock classification. Phase 1: The factors that determine the location and layout of a repository – a review. Working Report 2002-36. Posiva Oy, Helsinki.
Subject matter Host rock classification Phase 1 report presents a review of factors that influence the location and layout of a repository, and these factors include the in situ stress and rock strength, which are discussed in terms of geotechnical considerations in repository location and stability, the repository layout and the location of deposition holes. Rock mechanics factors are also discussed with respect to fracture zones and their respect distances.
Objectives To develop a system for classifying the rock mass at Olkiluoto which considers both long-term safety and constructability
Methodology Reviews factors that need to be considered when locating a repository and determining its layout by drawing on existing reports by Posiva, together with reports from other waste disposal organisations and from the literature. Considers the standpoints of operational and long-term safety. There is an emphasis on fracture zones.
Highlighted figures Fig. 6-1. Schematic of failure envelope for brittle failure, showing four zones of distinct rock mass failure mechanisms: no damage, shear failure, spalling and unravelling (from Martin et al. 2001). Around underground openings spalling and unravelling type behaviours dominate.
Conclusions Refers to the broad constraints on the location and depth of the repository and the factors that are important on the repository scale. The factors are summarised with reference firstly to long-term safety and secondly to repository construction and operation.
Comments Phase 1 report, to be followed by subsequent phases (see next entry).
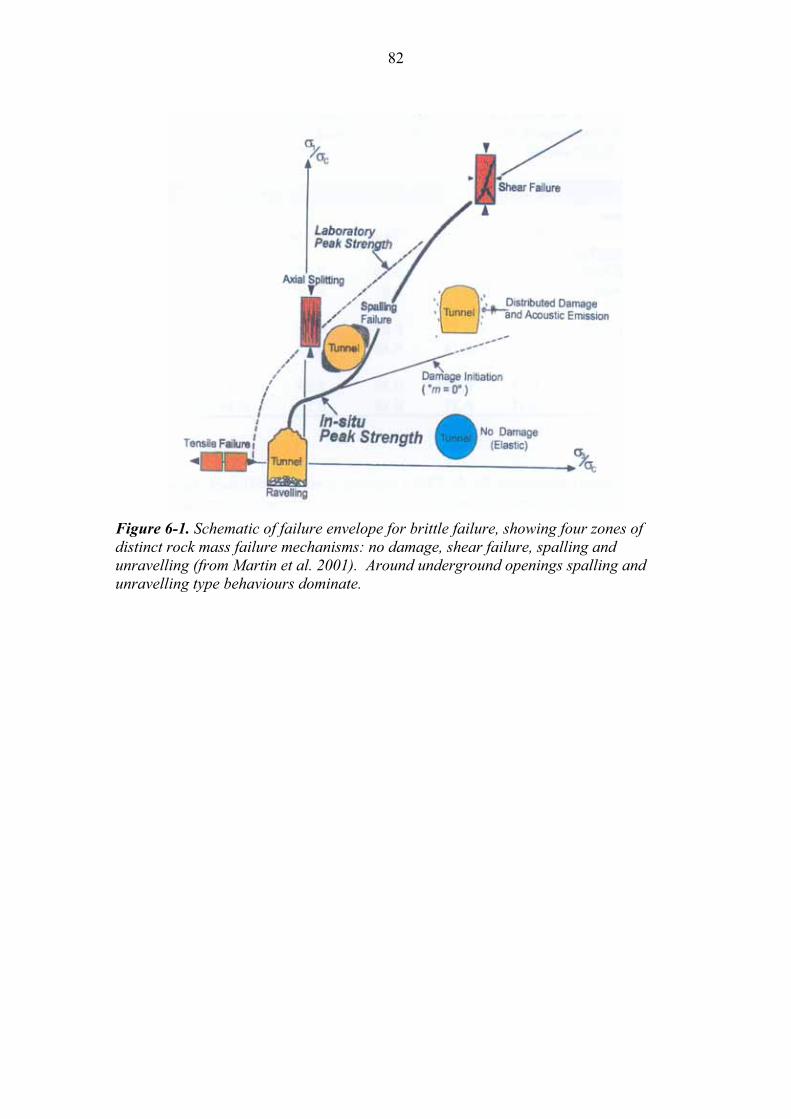
82
Figure 6-1. Schematic of failure envelope for brittle failure, showing four zones of distinct rock mass failure mechanisms: no damage, shear failure, spalling and unravelling (from Martin et al. 2001). Around underground openings spalling and unravelling type behaviours dominate.

83
Document number 41.
(Project document number: 45.)
Subject area Rock mass classification
Document reference Hagros, A., Äikäs, K., McEwen, T. & Anttila, P. 2003. Host rock classification. Phase 2: Influence of host rock properties. Working Report 2003-04. Posiva Oy, Olkiluoto.
Subject matter Phase 2 report discusses the various rock properties that influence the long-term safety, the constructability and the layout and location of the repository, from the standpoint of several disciplines, including rock mechanics. The influence of the mechanical properties of rock material, the mechanical properties of fractures and the in situ stresses are discussed.
Objectives To develop a classification system that can be used to identify potentially suitable volumes of rock for the repository at Olkiluoto and to consider how the properties of the host rock could influence the long-term safety of the disposal system, the layout and location of the repository, and the repository constructability. This work aims at providing the basis for identifying the most important parameters for the rock classification system.
Methodology Review of factors relating to requirements of the host rock, geology, thermal properties, rock mechanics, hydrogeology, chemistry, transport properties, factors influencing rock properties.
Highlighted figures Table 6-1. Strength and deformation properties of the rock types at Olkiluoto. The values presented are arithmetical means, with standard deviations in brackets, N = number of samples. The sample diameter varied from 42-62 mm (Äikäs et al. 2000).
Fig.6-1. Depth dependence of the stress components at Olkiluoto (Äikäs et al. 2000).
Fig. 6-2. a) The orientation of the maximum horizontal in situ stress ( H) at Olkiluoto based on the hydraulic fracturing method; b) the orientation of the principal stress vectors ( 1, 2,
3) based on the overcoring method, plotted on a lower-hemisphere projection (Malmlund & Johansson 2002).
Conclusions The most important factors are:
Repository scale – fracture zones, rock strength/stress ratio, orientations of fractures, foliation, horizontal stress magnitude, groundwater salinity;
Tunnel scale – rock mass hydraulic conductivity, minor fracture zones, fracture frequency, fracture friction;

84
Canister scale – hydraulic conductivity, fracture frequency, aperture and trace length.
There is a conclusions section on pages 131-139.
Comments This report follows Phase 1 abstracted in the previous Table.
Table 6-1. Strength and deformation properties of the rock types at Olkiluoto. The values presented are arithmetical means, with standard deviations in brackets, N = number of samples. The sample diameter varied from 42-62 mm (Äikäs et al. 2000).
Figure 6-1. Depth dependence of the stress components at Olkiluoto (Äikäs et al. 2000).
Figure 6-2. a) The orientation of the maximum horizontal in situ stress ( H) at Olkiluoto based on the hydraulic fracturing method; b) the orientation of the principal stress vectors ( 1, 2, 3)based on the overcoring method, plotted on a lower-hemisphere projection (Malmlund & Johansson 2002).

85
Document number 42.
(Project document number: 45A.)
Subject area Rock mass classification
Document reference Hagros, A., McEwen, T., Anttila, P. & Äikäs, K. 2005. Host rock classification. Phase 3: Proposed classification system. Working Report 2005-07. Posiva Oy, Olkiluoto.
Subject matter Development of rock mass classification for the Olkiluoto rock mass.
Objectives This Phase 3 report presents a classification system for evaluating the suitability of rock mass for the disposal of spent nuclear fuel.
Methodology The system includes a total of seven rock parameters, including strength/stress ratio and Q´, which relate to the mechanical stability of the deposition holes to be taken into account at different scales. A further parameter, fracture zones, includes also some rock mechanics consideration. The system applies to constructability and long-term safety.
The specific system for the repository scale includes fracture zones, strength/stress ratio, hydraulic conductivity and TDS (total dissolved solids). For the tunnel scale it includes hydraulic conductivity, Q´, fracture zones, fracture width (aperture + filling) and fracture trace length. This leads to four suitability classes at the repository and tunnel scales and three suitability classes at the canister scale.
Highlighted figures Fig. 1-1. Host Rock Classification project: the project phases and the main objective.
Table 4-1. Parameters for the repository-scale classification.
Table 4-2. Parameters for the tunnel-scale classification.
Table 4-3. Parameters for the canister-scale classification.
Conclusions No specific conclusions but the report contains a comprehensive summary.
Comments

86
PHASE 1
Review of factors that determine the location and layout of a repository
PHASE 2
Influence of host rock properties
PHASE 3
Development of the classification system
Identification of suitable volumes of
host rock at Olkiluoto
Parameter Notes
Fracture zones
- transmissivity
- Q´
- length
- thickness
Fracture zones defined in the bedrock model are considered, required (minimum) respect distances are determined on the basis of their T, Q´, length and thickness.
Strength/stress ratio Distribution of the strength values of the main rock types and the magnitude of 1.
Hydraulic conductivity Measurement interval 2 m (surface and underground characterisation boreholes).
TDS TDS in the undisturbed conditions; the consideration of upconing needs to be included in the limit values.
Figure 1-1. Host Rock Classification project: the project phases and the main objective.
Table 4-1. Parameters for the repository-scale classification.
Parameter Notes
Hydraulic conductivity Measurement interval 2 m (in pilot holes).
Q´ Determined for borehole and tunnel sections illustrating homogenous quality, minimum determination length 1 m.
Fracture zones
- transmissivity
- Q´
- length
- thickness
If fracture zones are encountered in a tunnel, they can be studied in situ and a less conservative approach is required than at the repository scale; respect distances may be influenced by the rock quality between the fracture zone and the tunnel (defined by means of Q´ and K).
Table 4-2. Parameters for the tunnel-scale classification.
Parameter Notes
Hydraulic conductivity Measurement interval mainly 2 m (in pilot holes).
Q´ Determined for borehole, tunnel and deposition hole sections illustrating homogenous quality, minimum determination length 1 m.
Fracture zones
- transmissivity
- Q´
- length
- thickness
The resolution of the bedrock model needs to be high at the canister scale, as the deposition holes cannot be allowed to intersect any fracture zones, not even minor ones.
Fracture width Total width of (completely or partially) open fractures, grouted fractures or fractures with soft infills.
Fracture trace length Can be considered only when long fractures are mapped in the tunnel, as the correlation between separate tunnels is uncertain.
Table 4-3. Parameters for the canister-scale classification.

87
SURPAC visualization and DFN model
No specific reports on this subject yet.
Site/baseline conditions
Document number 43.
(Project document number: -1.)
Subject area Site/Baseline conditions
Document reference
Anttila, P., Ahokas, H., Front, K., Hinkkanen, H., Johansson, E., Paulamäki, S., Riekkola, R., Saari, J., Saksa, P., Snellman, M., Wikström, L. & Öhberg, A. 1999. Final disposal of spent nuclear fuel in the Finnish bedrock - Olkiluoto site report. Report POSIVA 99-10. Posiva Oy, Helsinki.
Subject matter Olkiluoto Site Report. Summary of the results of the site investigations carried out at Olkiluoto.
Objectives To provide an overview of the Olkiluoto site investigation information.
Methodology Narrative compilation comprising chapters on site characterisation, locational and regional setting, geology, models of the rock mass, hydrogeology, geochemistry, constructability, and repository construction. Brief summary of the rock mechanics properties in Section 4.4. Evaluation in Section 8 of the constructability classes and Q values in boreholes, and areal extent of suitable rock for repository construction. Discussion in Section 9 of the anticipated repository construction with preliminary layouts.
Highlightedfigures
Fig. 8.2-1. Empirical estimates of rock behaviour based on the strength/stress ratio.
Fig. 8.2-2. 3DEC model of deposition tunnel and disposal hole.
Conclusions In terms of structure and stability of the bedrock, the Olkiluoto site is suitable for repository development. The fracture frequency is relatively low (only 2.4% of the borehole core studied at that time had a fracture frequency of more than 10/m). The seismicity is low (nearest earthquake was in 1926, ML = 3.1 located 40 km south of the site). The volume of potentially suitable rock does not include any regional major fracture zones. Regarding repository constructability, there seems to be no significant constraints within the depth range of 400-700 m. The major portion of the rock mass is ‘normal’ for constructability, indicating that excavation can be achieved using conventional methods and materials – although at 700 m depth, the rock is estimated to be ‘demanding’ or ‘very demanding’ because of the higher maximum principal stress, acting sub-horizontally with a magnitude of 35-40 MPa. Recommends construction using the observational method in which the repository concept is adjusted to the in-situ conditions during construction.
Comments Contains an introduction to the strength/stress spalling analysis approach.

88
Maximum appl ied stress (MPa)
Un
iax
ial
co
mp
res
siv
es
tre
ng
th(M
Pa
)
rockburstheavy support requiredsevere
spalling
min
orsp
alling
stab
le
300 m 500 m 700 m
Olkiluoto, mica gneiss
Figure 8.2-1. Empirical estimates of rock behaviour based on the strength/stress ratio.
Figure 8.2-2. 3DEC model of deposition tunnel and disposal hole.

89
Document number 44.
(Project document number: 0.)
Subject area Baseline conditions
Document reference Posiva Oy. 2003. Baseline conditions at Olkiluoto, POSIVA 2003-02, Posiva Oy, Olkiluoto.
Subject matter Describes the baseline conditions in Olkiluoto including the rock mechanics regime based on the investigations conducted before 2003. Good summary description on the site geology, which is basic input information for the rock mechanics.
Objectives To establish a reference point – defined as the data collected up until the end of year 2002 – for the coming phases of the Finnish spent nuclear fuel disposal programme.
Methodology Defining the current surface and underground conditions at the site. Establishing the natural fluctuations of properties that are potentially affected by construction of ONKALO. Providing references to data on parameters for use in model development and testing and the use of models to assist in understanding and interpreting the data.
Highlighted figures Fig. 7-1. Modelling approaches for fracture zones and associated parameters.
Fig. 7-2. Estimation of deformation modulus (ERM) of a fracture zone as a function of fracture frequency based on pressuremeter in situ measurements. Reference intact granite modulus is 60 MPa.
Fig. 7-3. Magnitudes of the maximum and minimum horizontal and vertical in situ stresses vs. depth at Olkiluoto.
Conclusions Comprehensive description of the various environmental and geological characteristics of the Olkiluoto island summarizing two decades of studies. It is anticipated that the prevailing stress-strength conditions at depth will allow the use of normal rock construction methods.
Comments Summary of some of the main rock mechanics properties, and introduction to estimating brittle deformation zone stiffness.

90
Figure 7-1. Modelling approaches for fracture zones and associated parameters.
Figure 7-2. Estimation of deformation modulus (ERM) of a fracture zone as a function of fracture frequency based on pressuremeter in situ measurements. Reference intact granite modulus is 60 MPa.
y = 0.03 Z - 5.0, R2 = 0.68
y = 0.03 Z + 0.9, R2 = 0.83
y = 0.06 Z - 2.0, R2 = 0.79, Z > 300 m
0
5
10
15
20
25
30
35
40
45
50
0 100 200 300 400 500 600 700 800 900
Depth (m)
Str
es
s (
MP
a)
Sig-HSig-hSig-VLinear (Sig-V)Linear (Sig-h)Linear (Sig-H)Linear (All Finland)
H:
h:
V:
All Finnish data, sig-H (Tolppanen&Särkkä
1999)
Figure 7-3. Magnitudes of the maximum and minimum horizontal and vertical in situ stresses vs. depth at Olkiluoto.

91
Rock mechanics analyses
Document number 45.
(Project document number: 49.)
Subject area Analyses
Document reference
Johansson, E., Hakala, M. & Lorig, L. 1991. Rock mechanical, thermomechanical and hydraulic behaviour of the near field for spent nuclear fuel. Report YJT-91-21. Nuclear Waste Commission of Finnish Power Companies, Helsinki.
Subject matter Early work. Non-Olkiluoto studies but relevance to Olkiluoto. First numerical near field analyses (UDEC, 3DEC) assuming a hypothetic site (granitic rock at 500 m) and KBS-3V configuration.
Objectives To use UDEC and 3DEC to simulate the mechanical response associated with excavation and the thermo-mechanical response associated with waste emplacement. Model data based on site investigations in Finland.
Methodology 1. Develop methodology to model the rock behaviour. 2. Obtain preliminary information about the near-field rock
mass behaviour. 3. Compare 2-D and 3-D results to draw conclusions about the
requirements for further computational analyses. Highlightedfigures
Fig. 3-2. The near-field model with joint sets.
Fig. 3-3. The horizontal stress state related to the disposal tunnel.
Fig. 3-28. The principal stresses after excavation, a and b, and after 60 and 900 years, c and d.
Conclusions Overall stability of the repository near-field appears to be good for 0-900 years. Maximal displacements are about 2 mm on the walls of the disposal tunnel. Local hydraulic conductivity increases by 4-6 times. Later, the heating causes rock expansion and reduces the hydraulic conductivity, depending on the assumptions made regarding the fracture apertures. Equilibrium established after 900 years. 2-D modelling can be sufficient to model the mechanical behaviour in the near-field but 3-D modelling is required to assess the thermomechanical behaviour.
Comments

92
Figure 3-2. The near-field model with joint sets.
Figure 3-3. The horizontal stress state related to the disposal tunnel.
Figure 3-28. The principal stresses after excavation, a and b, and after 60 and 900 years, c and d.

93
Document number 46.
(Project document number: 50.)
Subject area Analyses
Document reference Johansson, E. & Hakala, M. 1992. Mechanical, thermo-mechanical and hydraulic analyses of rock mass around a repository for spent nuclear fuel. Report YJT-92-17 (in Finnish). Nuclear Waste Commission of Finnish Power Companies, Helsinki.
Subject matter Mainly literature review on near field and far field studies of spent nuclear fuel repository.
Objectives To understand/realize the factors affecting the rock mass behaviour of the repository. Also, rock mechanics numerical study of the near-field and far-field rock stability and behaviour around a repository in a crystalline rock mass.
Methodology Review of other work and 3DEC numerical modelling.
Highlighted figures None
Conclusions The overall stability of the repository is good. Minor instability could occur in the vicinity of the emplacement tunnel and emplacement hole. For safety analysis, rock mechanics effects are likely to be insignificant, although some fracture permeabilities could be affected.
Results are preliminary because the input parameters are insufficiently known. More developed computer codes are required.
Comments Early review work

94
Document number 47.
(Project document number: 51.)
Subject area Analyses
Document reference Johansson, E., Hakala, M. & Salo, J-P. 1993. Rock mass behaviour around a nuclear waste repository in hard crystalline rock - overview based on numerical modelling. Work report TEKA-93-02. Teollisuuden Voima Oy, Helsinki.
Subject matter Study of near-filed and far-field behaviour.
Objectives To study repository stability and other aspects.
Methodology Use of information in the literature and numerical modelling.
Highlighted figures Fig. 2. Schematic picture of stress distribution around a disposal tunnel after the excavation.
Fig. 4. Plastic shear displacements in joints around the disposal rooms after heating.
Conclusions Results indicate that the overall stability of the repository is good but minor instability can occur around the emplacement tunnel and emplacement hole. Changes in the hydraulic permeability of the rock mass are small except for isolated joints. Avoidance of critical fracture zones and the use of appropriate support will mitigate any problems. More work is required on the development of numerical codes to improve the analysis capabilities.
Comments Related to report (YJT-92-17).
Figure 2. Schematic picture of stress distribution around a disposal tunnel after the excavation.
Figure 4. Plastic shear displacements in joints around the disposal rooms after heating.

95
Document number 48.
(Project document number: 53.)
Subject area Analyses
Document reference Tolppanen, P. 1994. Effect of high stresses on the rock structures. Work report TEKA-94-14 (in Finnish). Teollisuuden Voima Oy, Helsinki.
Subject matter The effects of high stresses on tunnel stability.
Objectives To identify problems which may be caused by excavation in a highly stressed rock mass and how to prevent possible failures around the excavated rooms.
To make more detailed numerical and analytical studies relating to stability and to identify the rock mechanics conditions where the rock strength could be reached.
Methodology Literature study and numerical analyses.
Highlighted figures None
Conclusions Given in the report in relation to the different subjects covered.
Comments Report in Finnish and complete copy with Posiva.

96
Document number 49.
(Project document number: 54.)
Subject area Analyses
Document reference Johansson, E. & Hakala, M. 1995. Rock mechanical aspect on the critical depth for a KBS-3 type repository based on the brittle rock strength criterion developed at URL in Canada. Report SKB AR D-95-014. Swedish Nuclear Fuel and Waste Management Co, Stockholm.
Subject matter Numerical modelling of repository.
Objectives To consider the rock mechanics stability of the repository at different depths.
Methodology Numerical stress-strength analyses (FLAC3D) for KBS-3 type repository (hypothetic) using the URL’s experiences on intact rock failures.
Critical repository depth studied via elastic stress distribution. Six different stress regimes studied. Thermal stresses and bentonite swelling also taken into account. Stresses analysed considering the URL brittle rock strength criteria.
Highlighted figures Table 1. In situ stress state used in the numerical analyses.
Table II. Rock mass properties used in the numerical analyses
Fig. 3-1. FLAC3D model geometry, size and boundary conditions for analysing the elastic stress state around the deposition tunnel and deposition hole.
Fig. 5-3. Maximum compressive stress 1 ( 3 = 0) as a function of the major in situ horizontal stress H at three critical points of interest after excavation of the deposition tunnel and deposition hole.
Conclusions Results indicate that no failure would be expected if the major horizontal principal stress is <17 MPa, which is the lower boundary of this stress at 500 m depth. For a repository at 500-1000 m depth, problems will arise; and, if the major principal horizontal stress is above 68 MPa, serious rock mechanics problems will occur.
Comments

97
Table 1. In situ stress state used in the numerical analyses.
Table II. Rock mass properties used in the numerical analyses.
Figure 3-1. FLAC3D model geometry, size and boundary conditions for analysing the elastic stress state around the deposition tunnel and deposition hole.
Figure 5-3. Maximum compressive stress 1 ( 3 = 0) as a function of the major in situ horizontal stress H at three critical points of interest after excavation of the deposition tunnel and deposition hole.

98
Document number 50.
(Project document number: 55.)
Subject area Analyses
Document reference
Wanne, T. & Johansson, E. 2003. Äspö Pillar Stability Experiment. Coupled 3D thermo-mechanical modelling. Preliminary results. SKB Report IPR-03-04. Swedish Nuclear Fuel and Waste Management Co, Stockholm.
Subject matter Preliminary thermo-mechanical analyses (FLAC3D) for the pillar stability experiment at the 420 m level at Äspö.
Objectives Study focussed on understanding and control of progressive rock failure in a rock pillar and the damage caused by high stresses – with reference to the APSE pillar stability experiment at Äspö HRL.
Methodology Modelling using FLAC3D, plus sensitivity study for different in situ stress application and rock properties. Two different modelling geometries used. Crack initiation predicted.
Highlightedfigures
Fig. 2-2. Heaters, temperature sensors and deposition holes (hole diameter 1.8 m).
Fig. 4-1. Comparison of the maximum principal stress contours at the horizontal section 1.5 m below the tunnel floor after 120 days heating.
Conclusions Occurrence and location of cracking identified based on the stress distributions.
Comments Work dedicated to the APSE experiment. Linear elastic analysis only used, so redistribution of stresses at failure could not be studied.

99
Figure 2-2. Heaters, temperature sensors and deposition holes (hole diameter 1.8 m).
Figure 4-1. Comparison of the maximum principal stress contours at the horizontal section 1.5 m below the tunnel floor after 120 days heating.

100
Document number 51.
(Project document number: 56.)
Subject area Analyses
Document reference
Wanne, T., Johansson, E. & Potyondy, D. 2004. Äspö Pillar Stability Experiment, Final coupled 3D thermo-mechanical modelling. Preliminary particle-mechanical modelling. SKB Report R-04-03. Swedish Nuclear Fuel and Waste Management Co, Stockholm.
Subject matter Final thermo-mechanical analyses (FLAC3D) for the pillar stability experiment at 420 m level at Äspö and preliminary damage (fracture propagation) analyses with the novel coupled code FLAC3D/FLAC/PFC.
Objectives Further analysis of the Äspö APSE experiment. Study of progressive rock failure and damage.
Methodology 3-D elastic thermo-mechanical numerical modelling study of the Äspö APSE experiment, using FLAC3D and coupled FLAC and PFC2D.
Highlightedfigures
Fig. 1-1. Geometry of the APSE experiment.
Table 2-3. In situ stress used in the modelling.
Fig. 3-3. Maximum principal stress in section 0.5 m below tunnel floor.
Fig. 3-17. Crack initiation stress exceeded (120 days after heating, 1.5 m below tunnel floor).
Fig. 4-7. Effect of strength reduction factor on damage patterns.
Conclusions Values given for stress increase due to heating (150-200 MPa), crack initiation extended about 2 m down the hole wall. Cracking predicted.
Comments Method of connecting FLAC3D and PFC2D. Not known if model represents reality. Have to wait until the APSE experiments are written up.

101
Stress component
Magnitude [MPa]
Dip direction [o]
Dip [o]
1 27 310 07
2 10 090 83
3 10 208 00
APSE tunnel orientation is 046o
Figure 1-1. Geometry of the APSE experiment.
Table 2-3. In situ stress used in the modelling.
Figure 3-3. Maximum principal stress in section 0.5 m below tunnel floor.
Figure 3-17. Crack initiation stress exceeded (120 days after heating, 1.5 m below tunnel floor).
Figure 4-7. Effect of strength reduction factor on damage patterns.

102
Olkiluoto site-specific analyses
Document number 52.
(Project document number: 57.)
Subject area Analyses
Document reference
Tolppanen, P., Johansson, E. & Hakala, M. 1995. Rock mechanical analyses of in situ stress/strength ratio at the TVO investigation sites Kivetty, Olkiluoto and Romuvaara. Report YJT-95-11. Nuclear Waste Commission of Finnish Power Companies, Helsinki.
Subject matter First site specific numerical rock mechanics analyses for three sites. Input data based on preliminary site investigations. The studied repository depths were 300, 500 and 800 m. Vertical and horizontal deposition hole concepts were analysed.
Objectives To understand the problems caused by excavating tunnels and deposition holes in high stress regimes and how to prevent possible failures around the excavation.
Methodology Uses empirical and 3DEC studies.
Highlightedfigures
Table 3.2-2. Rock properties at Olkiluoto.
Fig. 5.2-3. 3DEC model of deposition tunnel and deposition hole.
Table 5.3-1. The fracture sets used in the 3DEC modelling.
Fig. 5.3-1. Jointed rock model used in 3DEC modelling.
Fig. 5.3-2. Stress contours at 800 m and for sigma1 = 45.5 MPa.
Conclusions Low chance of rock bursts at Olkiluoto.
Comments Not clear if stable and unstable crack growth loci do follow the Hoek-Brown relation for the overall strength.

103
ROCK TYPE
PARAMETER MICA GNEISS GRANITE /
PEGMATITE
TONALITIC
GNEISS
Number of tests 14 5 4
Peak strength, ucs (MPa) 118.4 (19.7) 133.8 (18.5) 109.5 (7.8)
Crack damage strength, cd (MPa) 100.7 (16.7) 105.3 (15.8) -
Crack initiation strength, ci (MPa) 64.0 (10.6) 33.0 (4.6) -
Young’s modulus, E (GPa) 59.7 (9.5) 69.6 (12.8) 64.5 (1.7)
Poisson’s ratio, 0.24 (0.02) 0.30 (0.05) 0.28 (0.02)
Density, (kg/dm3) 2.79 (0.08) 2.63 (0.04) 2.8
Point load strength Is (MPa) 7.1 7.5 7.6
Table 3.2-2. Rock properties at Olkiluoto. Figure 5.2-3. 3DEC model of deposition tunnel and deposition hole.
JOINT SETS DIP DIP DIRECTION
I a 73 170 I b 80 350 II a 78 85 II b 82 285 III a 74 120 III b 79 300 IV 30 160
Table 5.3-1. The fracture sets used in the 3DEC modelling.
Figure 5.3-1. Jointed rock model used in 3DEC modelling.
Figure 5.3-2. Stress contours at 800 m and for sigma1 = 45.5 MPa.

104
Document number 53.
(Project document number: 58.)
Subject area Analyses
Document reference LaPointe, P. & Cladouhos, T. 1999. An overview of a possible approach to calculate rock movements due to earthquakes at Finnish nuclear waste repository sites. Report POSIVA 99-02. Posiva Oy, Helsinki.
Subject matter Study to estimate the rock movements (in fractures) due to earthquakes that may diminish canister safety. Relates to long term safety aspects.
Objectives Estimation of rock movements due to earthquakes in the context of canister safety
Methodology The problem of considering rock movements caused by earthquakes is described and then DFN models are used to show the influence of fracture size, intensity and orientation.
Highlighted figures Fig. 1-1. Fracture slippage due to an earthquake.
Fig. 2-1. Four stage process for estimating earthquake-induced displacements.
Conclusions The main conclusions are self-evident : larger fractures will induce larger slips and, as the fracture intensity increases, more fractures are likely to intersect canister holes.
It is important to have good data on orientations, side distributions and intensity of the fractures for the DFN model. Further scaling studies are required to extrapolate data from lower scales to the larger scales of interest for this study.
Comments This is a preliminary study.
There is a follow up report, Posiva 2002-02 “Estimation of rock movements due to future earthquakes at four candidate sites for a spent fuel repository in Finland” by P R La Pointe and J. Hermanson. This a similar, but more extensive, study and estimates canister failure probability.

105
Figure 1-1. Fracture slippage due to an earthquake.
Figure 2-1. Four stage process for estimating earthquake-induced displacements.

106
Document number 54.
(Project document number: 59.)
Subject area Analyses
Document reference
Johansson, E., Äikäs, K., Autio, J., Hagros, A., Malmlund, H., Rautakorpi, J., Sievänen, U., Wanne, T., Anttila, P. & Raiko, H. 2002. Preliminary KBS-3H layout adaptation for the Olkiluoto site. Analysis of rock factors affecting the orientation of a KBS-3H deposition hole. Working Report 2002-57. Posiva Oy, Olkiluoto.
Subject matter Study of different rock factors affecting the orientation of horizontal deposition hole concept. Geological, hydrogeological, thermal and mechanical factors were analysed. Rock mechanics analyses were performed using FLAC3D, also with some rock anisotropic considerations and KBTunnel (block theory).
Objectives To study how the KBS-3H concept could be adapted to the Olkiluoto site.
Methodology A block model for Olkiluoto was established, incorporating transversely isotropic intact rock and fracture sets. Rock properties listed. Block theory and FLAC3D used.
Highlightedfigures
Table 6-5. Properties of the intact rock mass used in the Olkiluoto block model.
Fig. 6-4. Dip and dip direction of fractures at 400-500 m.
Table 6-7. Average fracture frequency and spacing in the intact rock mass, 400-500 m.
Table 6-11. Q-value, Q and RQD of fracture zones.
Table 9-10. Joint sets used in the block theory analysis.
Fig. 9-10. Identification of unstable blocks.
Conclusions The layouts for KBS-3V and KBS-3H are not different in principle but there are some differences in detail.
Comments No direct linkage between block model and analyses conducted. Conclusions clear from first principles.

107
Lithological properties:
Rock type distribution Mica gneiss 100 %
Foliation: Dip direction
(º)/Dip (º)
150/40
Average ? foliation foliation
Mechanical properties:
Peak strength, ucs [MPa] 106 106 106
Crack damage strength,
cd [MPa]
8 8 88
Crack initiation strength,
ci [MPa]
48 48 48
Young’s modulus, E [GPa] 61 73 50
Poisson’s ratio, 0.23 0.32 0.24
Density, [kg/dm3] 2740
Q’ - value 21
Thermal properties:
Conductivity
(W m-1
K-1
) at 60 ºC
2.6 2.7 2.2
Diffusivity
(10-6
m2s
-1) at 60 ºC
1.2 1.3 1.1
Specific heat capacity
(J·kg-1
K-1
) at 60 ºC
784
Table 6-5. Properties of the intact rock mass used in the Olkiluoto block model.
Figure 6-4. Dip and dip direction of fractures at 400-500 m.
Data set Number of
fractures
Borehole
length (m)
Fracture
frequency
(fractures/m)
Fracture
spacing (m)
KR1, KR2,
KR4 - KR7, KR10,
KR12
967 773 1.25 0.80
Fractures roughly
perpendicular to KR1
74 99 0.75 1.34
Fractures roughly
perpendicular to KR5
54 97 0.56 1.80
Fracture zones/Rock
mass quality
Q-value Q’ RQD Number of
fracture
zones
Borehole
length
(m)
All fracture zones 0.64 5.53 78.7 10 89
Gently-dipping fracture
zones (dip < 45º)
0.68 5.80 78.4 7 72
Steeply-dipping fracture
zones (dip > 45º)
0.50 4.53 79.9 3 17
Table 6-7. Average fracture frequency and spacing in the intact rock mass, 400-500 m.
Table 6-11. Q-value, Q and RQD of fracture zones.
Joint set Dip direction
[°]
Dip [°] Joint spacing
[m]
Friction angle
[°]
150 20 1.5 20
J2 240 80 1 30
J3 170 90 1.6 30
J4 120 90 1.7 30
Table 9-10. Joint sets used in the block theory analysis. Figure 9-10. Identification of unstable blocks.

108
Document number 55.
(Project document number: 60.)
Subject area Analyses
Document reference
Potyondy, D. & Cundall, P. 2000. Bonded-particle simulations of the in-situ failure test at Olkiluoto. Working Report 2000-29. Posiva Oy, Helsinki.
Subject matter PFC (damage) analyses to serve the planning of the in situ failure test to be conducted in the research tunnel. The execution of test was afterwards postponed. Instead, Posiva has participated in the Äspö pillar stability experiment
Objectives Use of PFC to predict crack damage formation adjacent to a circular test hole in gneissic tonalite subjected to compressive loading produced by the pressurization of two horizontal slots located above and below the test hole.
Methodology PFC2D calibrated to match elastic modulus, crack initiation stress, unconfined compressive stress, including anisotropy of modulus and strength.
Highlightedfigures
Fig. 48. Geometry and boundary conditions of the test-hole models.
Fig. 52. Particles in far-field region of fine resolution test-hole model.
Fig. 65. Force distribution near right notch and all cracks.
Conclusions Crack formation predicted by PFC2D for 60 MPa slot pressures. PFC seems to be a good tool for this.
Comments

109
x
diam. = 100 mm
520 mm
2 MPa
9 MPa
0.1 MPa
35
0m
m
50 mm
581 mm
ysi
G=
23.2
GPa
=0.
25
nu
infini
te-e
last
icbo
unda
ry
30
Figure 48. Geometry and boundary conditions of the test-hole models.
Figure 52. Particles in far-field region of fine resolution test-hole model.
Figure 65. Force distribution near right notch and all cracks.

110
Document number 56.
(Project document number: 61.)
Subject area Analyses
Document reference
Johansson, E. & Rautakorpi, J. 2000. Rock mechanics stability at Olkiluoto, Hästholmen, Kivetty and Romuvaara. Report POSIVA 2000-02. Posiva Oy, Helsinki.
Subject matter Site specific, near field, numerical rock mechanics analyses (3DEC) for four sites. Input data based on detailed site investigations. The studied repository depths were from 300 m to 700 m. Vertical and horizontal deposition hole concepts were analysed.
Objectives To assess the near-field stability of the final disposal tunnels and deposition holes at the four investigation sites (i.e. before Olkiluoto was chosen) and for depths between 300 and 700 m.
Methodology Two empirical methods (based on the strength/stress ratio) and 3DEC were used as the analysis tools. A statistical approach was used for the input data.
Highlightedfigures
Fig. 2.1-1. Stability classification for openings in good quality rock.
Fig. 2.1-2. Damage index expressed as a function of the ratio of the maximum tangential stress at the tunnel boundary to the unconfined compressive strength.
Table 2.1-1. Relation of stress/strength in competent rock.
Fig. 2.2-4. Principle of plotting the stability evaluations for the KBS3 concept.
Table 3.4-1. Characteristic rock properties of mica gneiss at Olkiluoto.
Fig. 4.1-2. Stability evaluation of the mica gneiss at Olkiluoto (Q-system).
Fig. 4.1-9. Stability of main rock types at Posiva’s investigation sites.
Conclusions The results indicate that the rock mechanics conditions during the pre- and post-closure phases were stable at all the depths and sites considered, especially when the deposition tunnels are orientated parallel to the major horizontal principal stress. If the tunnels are orientated perpendicular to the maximum horizontal stress component, some failure of the weaker zones of rock could occur at depth — although the depth of spalling would not be great. The results from the empirical methods and the numerical methods were consistent.
Comments

111
0 10 20 30 40 50 60 700
50
100
150
200
250
300
r o c k b u r s t
Maximum applied stress (MPa)
Un
iaxia
lco
mp
ressiv
estr
en
gth
(MP
a)
heavy support required
stre
ss/s
tren
gth=
0.1
stre
ss/stre
ngth
=0.2
stress/stre
ngth=0.3
stress/strength=0.4
stress/strength=0.5
s e ve r es pa l l i
n gm
i no r
sp a l li n
g
st a
bl e
0
0.1
0.2
0.3
0.4
0.5
0 0.1 0.2 0.3 0.4 0.5 0.6 0.7 0.8 0.9 1 1.1 1.2 1.3 1.4 1.5
Damage index (Di=smax/sc)
STABLE
MINOR SPALLING
SEVERE SPALLING
HEAVY SUPPORT
DIFFICULT TO SUPPORT
Figure 2.1-1. Stability classification for openings in good quality rock.
Figure 2.1-2. Damage index expressed as a function of the ratio of the maximum tangential stress at the tunnel boundary to the unconfined compressive strength.
Stress level ucs / 1 t / ucs
Low stress, near surface, open joints > 200 > 0.01
Medium stress, favourable stress conditions 200 - 10 0.01 - 0.3
High stress, very tight structure. Usually favourable to
stability
10 - 5 0.3 - 0.4
Moderate slabbing after > 1 hour in massive rock 5 - 3 0.5 - 0.65
Slabbing and rock burst after minutes in massive rock 3 - 2 0.65 - 1.0
Heavy rock burst (immediate deformations in massive
rock)
< 2 > 1.0
Tensile strength ofrock mass is exceeded
Crack damage strength ofrock mass is exceeded
Peak strength ofrock mass is exceeded
Crack initiation strength ofrock mass is exceeded
Rock mass isin elastic state
Disposal tunnel
Deposition hole
about 5 m
Table 2.1-1. Relation of stress/strength in competent rock.
Figure 2.2-4. Principle of plotting the stability evaluations for the KBS3 concept.
PARAMETER MICA GNEISS
Lower quartile
Median Upper quartile
Mean value
Standard deviation
Tests
Peak strength, ucs [MPa] 89.9 106.4 118.8 106.3 26.8 59
Crack damage strength, cd [MPa] 68.9 86.7 99.3 87.9 24.3 49
Crack initiation strength, ci [MPa] 39.9 45.1 54.5 48.2 12.5 50
Peak strength, p [MPa],
3=15 MPa
125.0 150.7 161.9 153.0 39.8 8
Crack damage strength, cd [MPa],
3=15 MPa
117.7 143.7 148.4 144.1 35.8 8
Crack initiation strength, ci [MPa],
3=15 MPa
58.4 79.8 90.7 77.8 18.4 8
Tensile strength, t [MPa], dry -10.5 -14.2 -14.2 -12.4 3.0 5
Tensile strength, t [MPa], wet -7.5 -10.5 -12.4 -9.9 2.8 20
Young’s modulus, E [GPa] 55.6 61.4 68.0 61.4 8.3 108
Poisson’s ratio, 0.19 0.23 0.27 0.23 0.05 108
Density, [kg/dm3] 2715 2733 2760 2737 36 142
Table 3.4-1. Characteristic rock properties of mica gneiss at Olkiluoto.

112
0
5
10
15
20
25
30
200 300 400 500 600 700 800
Depth (m)
lower quartile
median
upper quartile
3
STABLE ROCK
POSSIBLE / MINOR
SPALLING
MODERATE SPALLING
ROCK BURST
Mica gneiss
Maximum appl ied stress (MPa)
Un
iax
ial
co
mp
res
siv
es
tre
ng
th(M
Pa
)
rockburstheavy support require
d
severespallin
g
min
orsp
alling
stab
le
R m g
U R L
sp
R tg
K gr H rgr
H pyt
K pgrdr
O m g
H stholmen pyterliteH stholmen equigranular rapakivi graniteKivetty graniteKivetty porphyritic granodioriteOlkiluoto mica gneissRomuvaara mica gneissRomuvaara tonalite gneissUnderground Research Laboratory, Canada
sp Hard Rock Laboratory, Sweden
HpytHrgrKgrKpgrdrOmgRmgRtgURL
sp
Figure 4.1-2. Stability evaluation of the mica gneiss at Olkiluoto (Q-system).
Figure 4.1-9. Stability of main rock types at Posiva’s investigation sites.

113
Document number 57.
(Project document number: 62.)
Subject area Analyses
Document reference Wanne, T. 2002. Displacements during shaft excavation calculated with FLAC3D. Memorandum TS-21/2002. Saanio & Riekkola Oy, Helsinki. (in Finnish)
Subject matter Analysis of rock displacements induced by excavation.
Objectives To provide a method for calculating shaft displacements during excavation
Methodology FLAC3D analyses to calculate rock displacements to support the possible convergence measurements during ONKALO shaft sinking. (At the time the most probable access option was a shaft.)
Highlighted figures None
Conclusions The analysis provided an appropriate method.
Comments In fact the ramp option was chosen.

114
Document number 58.
(Project document number: 63.)
Subject area Analyses
Document reference Wanne, T. 2002. Brittle friction-cohesion constitutive material model. Memorandum TS-22/2002. Saanio & Riekkola Oy, Helsinki. (in Finnish)
Subject matter Analysis including the breakdown of friction model.
Objectives To include the URL constitutive model in the FLAC3D analysis
Methodology Testing of FLAC3D analyses using so called damage accumulated material model. Input data was received from the damage controlled lab tests of mica gneiss (see Work report POSIVA-97-07e).
Highlighted figures None
Conclusions Analysis was successfully developed.
Comments

115
Document number 59.
(Project document number: 64.)
Subject area Analyses
Document reference
Rautakorpi, J., Johansson, E., Tinucci, J., Palmén, J., Hellä, P., Ahokas, H. & Heikkinen, E. 2003. Effect of fracturing on tunnel orientation using KBTunnel and 3DEC programmes for repository of spent nuclear fuel in Olkiluoto. Working Report 2003-09. Posiva Oy, Olkiluoto.
Subject matter Preliminary study to analyse block behaviour of fractured rock in Olkiluoto regime using the existing fracture information. Numerical analyses were performed with KBTunnel and 3DEC codes.
Objectives To evaluate the effect of fracturing on tunnel (hole) stability, tunnel orientation and need for rock support.
Methodology Use of keyblock theory to identify kinematically admissible blocks and then studying these these blocks within 3DEC to see if they are unstable when the stresses are taken into account.
Highlightedfigures
Fig. 2-4. Orientation of maximum horizontal in situ stress.
Fig. 2-5. Orientations of the principal stress vectors.
Table 3-1. Fracture sets with their properties, depths 300-600 m.
Table 3-2. Fracture sets with their properties, 400-500 m.
Fig. 3-2. Fractures at 400-500 m.
Table 3-6. Geometry of excavation profiles.
Fig. 4-8. 3DEC model with disposal tunnel and deposition hole.
Conclusions Apart from tunnel directions from block analysis, conclusions could have been obtained from simpler models. Nice idea to study potentially unstable blocks in 3DEC. Good tables of block volumes, needed support, numbers of unstable blocks for different orientations.
Comments Seems to be something wrong with the stresses on the excavation boundary, Fig. 4-10 (report reviewed earlier by J. Hudson, 22 May 2003 letter to Johanna Hansen).

116
Figure 2-4. Orientation of maximum horizontal in situ stress.
Figure 2-5. Orientations of the principal stress vectors.
FRACTURE
SET
(colour in Fig. 3-1)
DIP
DIRECTION
[º]
DIP
[º]FRACTURE
SPACING
[m]
DOMINANT
FRACTURE TYPEFRICTION
ANGLE [º]
I (light grey) 180 65 4.6 Major steep fracture set in the site
30
II (medium grey)
155 30 1.9 Slickensided, parallel to foliation; filled, D3
35
III (dark grey) 35 20 4.4 - 30
IV (black) 5 55 10.2 - 25
V (blue) 120/300 80 2.8 - 30
VI (red) 260 35 9.7 - 30
VII (geen) 230 17.1 Brittle, filled; minor faults of D5
27.5
FRACTURE
SET
DIP DIRECTION
[º] DIP
[º] FRACTURE
SPACING
[m]
FRICTION
ANGLE
[º]
II b 150 20 1.5 20VII b 240 80 1.5 30
I b 170 90 1.6 30
V b 120 90 1.7 30
Table 3-1. Fracture sets with their properties, depths 300-600 m.
Table 3-2. Fracture sets with their properties, 400-500 m.

117
CALCULATION PROFILE WIDTH
[m]
HEIGHT [m]
PROFILE PLOT
DISPOSAL TUNNEL 3.5 4.4
DEPOSITION HOLE 1.752 7.8
MAIN TUNNEL 6 6.1
REPAIR HALL 12 8.3
Figure 3-2. Fractures at 400-500 m. Table 3-6. Geometry of excavation profiles.
Figure 4-8. 3DEC model with disposal tunnel and the deposition hole.

118
Effects of excavation
No specific reports on this subject yet.
Stress damage – boreholes and tunnel stress mapping
Document number 60.
(Project document number: 21.)
Subject area Stress damage – boreholes and tunnel stress mapping
Document reference Sacklén, N. 1999. Core discing mapping from drill cores of Romuvaara, Kivetty, Olkiluoto and Hästholmen. Working report 99-12 (in Finnish with an English abstract). Posiva Oy, Helsinki.
Subject matter Core discing mapping from four sites. Core discing was first met in Olkiluoto (study of 5 boreholes) at a depth of about 590 m.
Objectives To study all core samples from the Romuvaara, Kivetty and Olkiluoto sites and some from Hästholmen for core discing.
Methodology Document the core discing, including the shape of the fracture surface, slice size, incipient fractures, and the angle between the saddle depression and the core orientation.
Highlighted figures Fig. 1-1. Typical type of ring discing, an example from the Hästholmen borehole HH-KR6.
Fig. 2-2. An angle between the saddle seat axis and the core orientation mark.
Fig. 4-3. Different types of core discing fractures in Romuvaara, Kivetty, Olkiluoto and Hästholmen. Note that scale in Hästholmen is different.
Conclusions 435 core discing fractures were mapped. Cup fractures are the dominant type at Romuvaara, Kivetty and Olkiluoto, but saddle type fractures dominate at Hästholmen. The thickness of the discs varied up to 42 mm.
Comments

119
Figure 1-1. Typical type of ring discing, an example from the Hästholmen borehole HH-KR6.
Figure 2-2. An angle between the saddle seat axis and the core orientation mark.
Figure 4-3. Different types of core discing fractures in Romuvaara, Kivetty, Olkiluoto and Hästholmen. Note that scale in Hästholmen is different
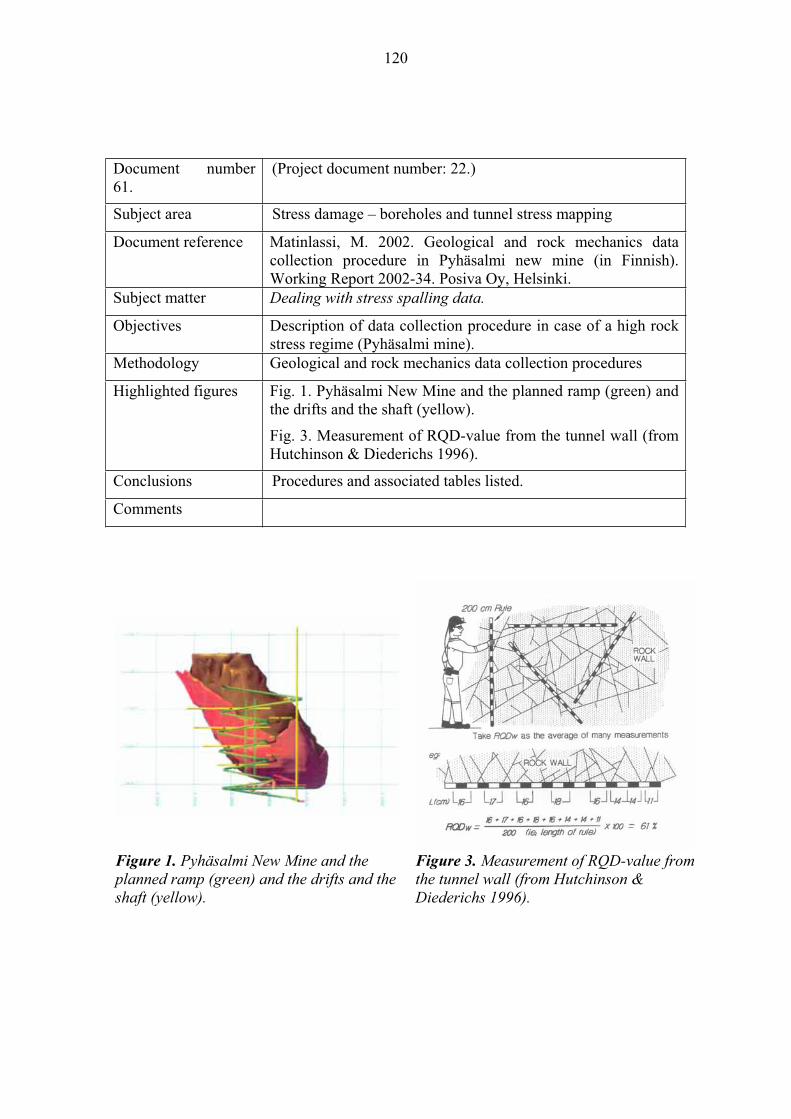
120
Document number 61.
(Project document number: 22.)
Subject area Stress damage – boreholes and tunnel stress mapping
Document reference Matinlassi, M. 2002. Geological and rock mechanics data collection procedure in Pyhäsalmi new mine (in Finnish). Working Report 2002-34. Posiva Oy, Helsinki.
Subject matter Dealing with stress spalling data.
Objectives Description of data collection procedure in case of a high rock stress regime (Pyhäsalmi mine).
Methodology Geological and rock mechanics data collection procedures
Highlighted figures Fig. 1. Pyhäsalmi New Mine and the planned ramp (green) and the drifts and the shaft (yellow).
Fig. 3. Measurement of RQD-value from the tunnel wall (from Hutchinson & Diederichs 1996).
Conclusions Procedures and associated tables listed.
Comments
Figure 1. Pyhäsalmi New Mine and the planned ramp (green) and the drifts and the shaft (yellow).
Figure 3. Measurement of RQD-value from the tunnel wall (from Hutchinson & Diederichs 1996).

121
Document number 62.
(Project document number: 23.)
Subject area Stress damage – boreholes and tunnel stress mapping
Document reference
Hakala, M., Kuula, H., Matinlassi, M., Somervuori, P., Syrjänen, P. & Tolppanen, P. 2002. Analyses of tunnel stress failures at Pyhäsalmi mine. Working report 2002-28. Posiva Oy, Helsinki.
Subject matter Analyses of stress induced failure observations based on Pyhäsalmi mine data.
Objectives To develop a method to map and analyse stress failure observations, understand factors affecting stress failures, and study criteria to predict stress-induced failure around excavations.
Methodology The Pyhäsalmi mine was selected as a test site because the geology and stress-strength ratio are similar to that at Olkiluoto. Stress failures were compared with failure predictions based on the elastic 3D secondary stresses and yield criteria.
Highlightedfigures
Fig. 1-1. Stress-strength ratio for Olkiluoto and Pyhäsalmi vulcanite.
Fig. 6-8. The effect of the excavation direction on the observed stress failures.
Fig. 6-14. Stress failures in a 3.1 m wide ore pass at Pyhäsalmi mine.
Fig. 8-5. Principal stress path at the tunnel wall surface.
Fig. 8-17. Effect of stress-strength anisotropy on different stress failure probabilities.
Conclusions In addition to the stress state, the orientation of rock anisotropy was considered a significant factor in explaining the stress failures, with minor factors being rock type and its strength, tunnel shape, time after excavation and some geological anomalies. Peak strength criteria were found to over-estimate the in situ rock strength.
Comments Mapping study, data reduction and comparison with failure criteria.

122
0
100
200
300
400
0 50 100 150 200 250
Maximum secodary stress ( MPa )
Tunnel
Shaft
Uniaxial compressive strength ( MPa )
Stable -
unsupported
Minor spalling -
light support
Severe
spalling -
moderate
support
Heavy
support
required
Very difficult to
support
OKP 1300 m
( 1200 - 1400 )Hakala et al., 1998 & 1999
Olkiluoto 500 m
( 400 - 700 )Äikäs et al., 2000
Based on:Hoek and Brown ( 1980 ), modified by Martin ( 1998 )
Occurrence of stress failures with tunnel excavation direction- volcanite, observation period is one day after excavation
0 %
20 %
40 %
60 %
80 %
100 %
0° (32m)
30° (6m)
60° (5m)
90° (26m)
120° (138m)
150° (12m)
180° (100m)
210° (27m)
240° (68m)
270° (44m)
300° (61m)
330° (29m)
J2…J4
J1
J0
Trend of the major principal stress280° - 310°
Trend of the major principal stress280° - 310°
Figure 1-1. Stress-strength ratio for Olkiluoto and Pyhäsalmi vulcanite.
Figure 6-8. The effect of the excavation direction on the observed stress failures.
Figure 6-14. Stress failures in a 3.1 m wide ore pass at Pyhäsalmi mine.

123
0
40
80
120
160
200
240
280
320
360
-30 -15 0 15 30 45 60
90°
45°
0°
C.p. =2.5%
C.p. =20%
C.p. =40%
C.p. =60%
C.p. =80%
C.p. =97.5%
s3/s1=0.05
Major principal stress ( MPa )
Minor principal stress ( MPa )
Pyhäsalmi Volcanite- principal stress 1/ 3 path 1 cm above tunnel- angle between tunnel axis and in situ 1 stress: 90°, 45° and 0°- in situ: 1, sH =75 MPa, H/ h=1.7, H/ V= 1.8- ci and cd stress envelopes with different cumulative probabilit
Figure 8-5. Principal stress path at the tunnel wall surface.
Figure 8-17. Effect of stress-strength anisotropy on different stress failure probabilities.
.
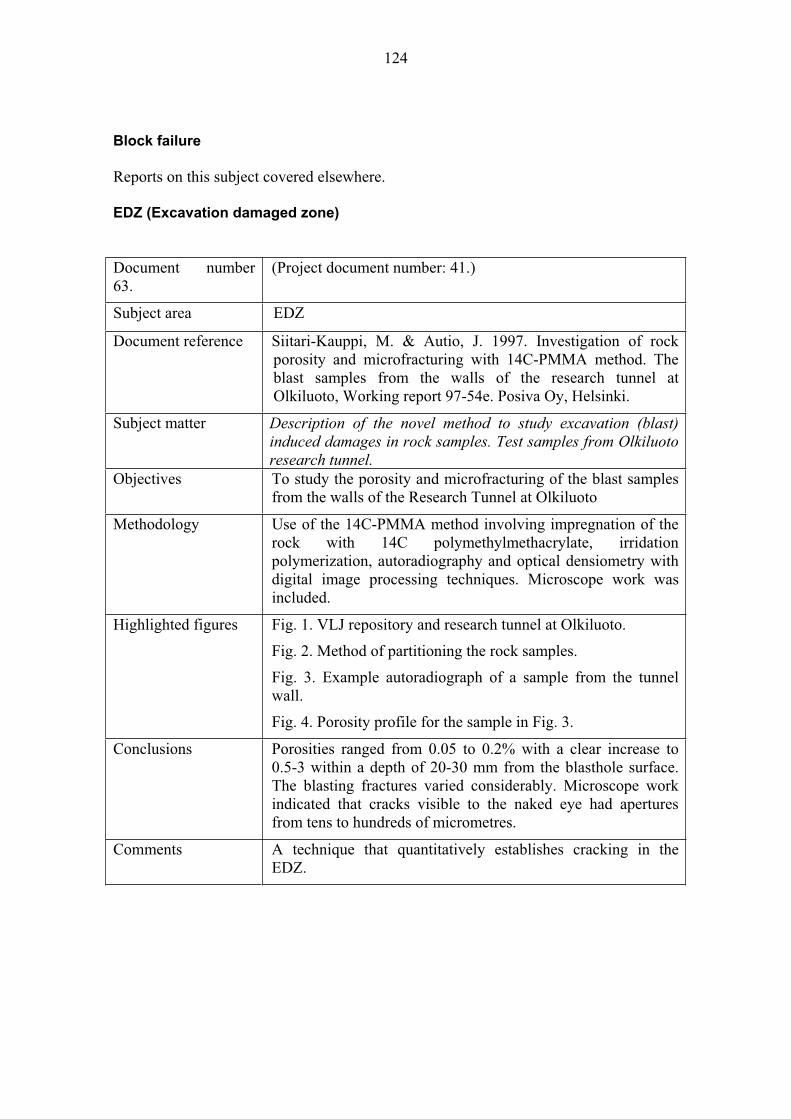
124
Block failure
Reports on this subject covered elsewhere.
EDZ (Excavation damaged zone)
Document number 63.
(Project document number: 41.)
Subject area EDZ
Document reference Siitari-Kauppi, M. & Autio, J. 1997. Investigation of rock porosity and microfracturing with 14C-PMMA method. The blast samples from the walls of the research tunnel at Olkiluoto, Working report 97-54e. Posiva Oy, Helsinki.
Subject matter Description of the novel method to study excavation (blast) induced damages in rock samples. Test samples from Olkiluoto research tunnel.
Objectives To study the porosity and microfracturing of the blast samples from the walls of the Research Tunnel at Olkiluoto
Methodology Use of the 14C-PMMA method involving impregnation of the rock with 14C polymethylmethacrylate, irridation polymerization, autoradiography and optical densiometry with digital image processing techniques. Microscope work was included.
Highlighted figures Fig. 1. VLJ repository and research tunnel at Olkiluoto.
Fig. 2. Method of partitioning the rock samples.
Fig. 3. Example autoradiograph of a sample from the tunnel wall.
Fig. 4. Porosity profile for the sample in Fig. 3.
Conclusions Porosities ranged from 0.05 to 0.2% with a clear increase to 0.5-3 within a depth of 20-30 mm from the blasthole surface. The blasting fractures varied considerably. Microscope work indicated that cracks visible to the naked eye had apertures from tens to hundreds of micrometres.
Comments A technique that quantitatively establishes cracking in the EDZ.

125
Figure 1. VLJ repository and research tunnel at Olkiluoto.
Figure 2. Method of partitioning the rock samples.
Figure 3. Example autoradiograph of a sample from the tunnel wall.
Figure 4. Porosity profile for the sample in Fig. 3.

126
Document number 64.
(Project document number: 42.)
Subject area EDZ
Document reference Autio, J., Malmlund, H., Kemppainen, M., Oila, E. & Siitari-Kauppi, M. 2004. Study of rock damage caused by drill and blast excavation at Äspö Hard Rock Laboratory. Working Report 2004-33. Posiva Oy, Olkiluoto.
Subject matter EDZ testing on samples from Äspö HRL.
Objectives To study the properties of the damaged rock caused by blasting near the blastholes where the fracturing and alteration of the rock are most pronounced.
Methodology Take samples from two rounds in the ZEDEX drift representing low shock energy smooth blasting and careful smooth blasting. The 14C-PMMA technique was used to study the damage.
Highlighted figures Fig. 6-10. Example of EDZ sample partitioning.
Fig. 8-29. Example of photo and corresponding auto-radiograph.
Fig. 8-30. Example sample showing porosity as red areas (same sample as Fig. 8.29).
Fig. 8-31. Porosity profile for sample in Fig. 8-32.
Fig. 8-32. Photo of sample.
Fig. 10-1. Additional porosity caused by blasting.
Conclusions The thickness of the EDZ zone in terms of increased porosity is around 30 mm. The EDZ occurs in three zones: a crushed zone of about 1-3 mm; a fractured zone of about 5-7 mm from the surface of the blast hole; a microfractured zone of about 30 mm from the surface.
Comments A technique that qualitatively and quantitatively characterizes the rock alteration caused by blasting (and the effect of excavation).

127
Figure 6-10. Example of EDZ sample partitioning.
Figure 8-29. Example of photo and corresponding autoradiograph.
Figure 8-30. Example sample showing porosity as red areas (same sample as Fig. 8.29).
Figure 8-31. Porosity profile for sample in Fig. 8-32.
Figure 8-32. Photo of sample. Figure 10-1. Additional porosity caused by blasting.

128
Document number 65.
(Project document number: X.)
Subject area EDZ
Document reference Autio, J., Malmlund, H. & Siitari-Kauppi, M. 2004. Study of rock damage caused by tunnel boring at Äspö Hard Rock Laboratory. Working Report 2004-32. Posiva Oy, Olkiluoto.
Subject matter EDZ testing on samples from Äspö HRL, similar to complementary report on blasting damage.
Objectives To study the properties of the rock immediately adjacent to the surface of the TBM tunnel wall (and to compare with the complementary information on the blasted tunnel).
Methodology Take samples from the tunnel wall and study the porosity and microfracturing using the 14C-PMMA method.
Highlighted figures Fig. 8-21. Example sample perpendicular to the tunnel axis.
Fig. 10-1. Porosity as a function of distance into the rock.
Conclusions The average thickness of the damaged zone (defined as increased porosity) was about 20 mm. The damage can be divided into a crushed zone (about 3 mm), a fractured zone (about a further 10 mm), and a third zone with some fracturing and increased porosity for a further 15-35 mm.
Comments
Figure 8-21. Example sample perpendicular to the tunnel axis.
Figure 10-1. Porosity as a function of distance into the rock.

129
In situ rock measurements and monitoring (including micro-seismic monitoring)
Document number 66.
(Project document number: 65.)
Subject area In situ rock measurements and monitoring (including micro-seismic monitoring)
Document reference Chen, R. & Kakkuri, J. 1994. Feasibility study and technical proposal for long-term observations of bedrock stability with GPS. Report YJT-94-02. Nuclear Waste Commission of Finnish Power Companies, Helsinki.
Subject matter Feasibility study of establishing the bedrock stability at local scale using GPS.
Objectives To test the accuracy of the GPS system to see if required accuracies can be achieved.
Methodology An experiment with a baseline of 1041 m. Artificial movements were generated varying from 1 mm to 22 mm.
Highlighted figures Fig. 12. Finnish bedrock structure and GPS network.
Fig. 18. Real and detected movements.
Fig. 21. GPS monitoring network at Olkiluoto.
Conclusions The maximum difference between the GPS detected movements and the artificial movements, was 0.9 mm – which took about 55 minutes. The preliminary design for the GPS network accuracy at Olkiluoto aims at 1mm for horizontal and 2-3 mm for vertical movements.
Comments

130
Figure 12. Finnish bedrock structure and GPS network.
Figure 18. Real and detected movements. Figure 21. GPS monitoring network at Olkiluoto.

131
Document number 67.
(Project document number: 67.)
Subject area In situ rock measurements and monitoring (including micro-seismic monitoring)
Document reference Ollikainen, T., Ahola, J. & Koivula, H. 2002. GPS operations at Olkiluoto, Kivetty and Romuvaara for 2001. Working Report 2002-16. Posiva Oy, Olkiluoto.
Subject matter Description of GPS monitoring system in Olkiluoto.
Objectives To summarise the operation and observations of the GPS stations in 2001.
Methodology Analysis of the GPS readings at the 24 GPS pillar stations.
Highlighted figures Fig. 12. The local GPS monitoring network at Olkiluoto.
Conclusions The Earth’s crust has been stable in all the observation areas.
Comments This report contains a large amount of data.
Figure 12. The local GPS monitoring network at Olkiluoto.

132
Document number 68.
(Project document number: XXX)
Subject area In situ rock measurements and monitoring (including micro-seismic monitoring)
Document reference Ollikainen, T., Ahola, J. & Koivula, H. 2002. GPS operations at Olkiluoto, Kivetty and Romuvaara in 2002-2003. Working Report 2004-12. Posiva Oy, Olkiluoto.
Subject matter Description of GPS monitoring system in Olkiluoto.
Objectives To summarise the operation and observations of the GPS stations in 2002-2003.
Methodology Analysis of the GPS readings at the 24 GPS pillar stations.
Highlighted figures Fig. 2-7. Plate motion of the Eurasian plate at the permanent GPS stations (left picture). Rates of the NNR-NUVELIA model are shown as black arrows and rates from GPS as gray arrows. Differences between models shown in right picture. Note pictures have different scales.
Fig. 3-1. The observation pillar.
Fig. 3-2. The local GPS monitoring network at the observation area of Olkiluoto.
Fig. 5-3. Meteorological observations during mekometer measurements at baseline GPS7-GPS8. The instrumentation at the pillar GPS7. (Photograph J. Ahola 2002)
Conclusions The Earth’s crust has been stable in all the observation areas. At Olkiluoto, the change rates in the inter-station distances were smaller than the observation accuracy. Olkiluoto now has 12 stations.
Comments Follow on from previous report. This report contains a large amount of data.

133
Figure 2-7. Plate motion of the Eurasian plate at the permanent GPS stations (left picture). Rates of the NNR-NUVELIA model are shown as black arrows and rates from GPS as gray arrows. Differences between models shown in right picture. Note pictures have different scales.
Figure 3-1. The observation pillar.
Figure 3-2. The local GPS monitoring network at the observation area of Olkiluoto.
Figure 5-3. Meteorological observations during mekometer measurements at baseline GPS7-GPS8. The instrumentation at the pillar GPS7. (Photograph J. Ahola 2002)
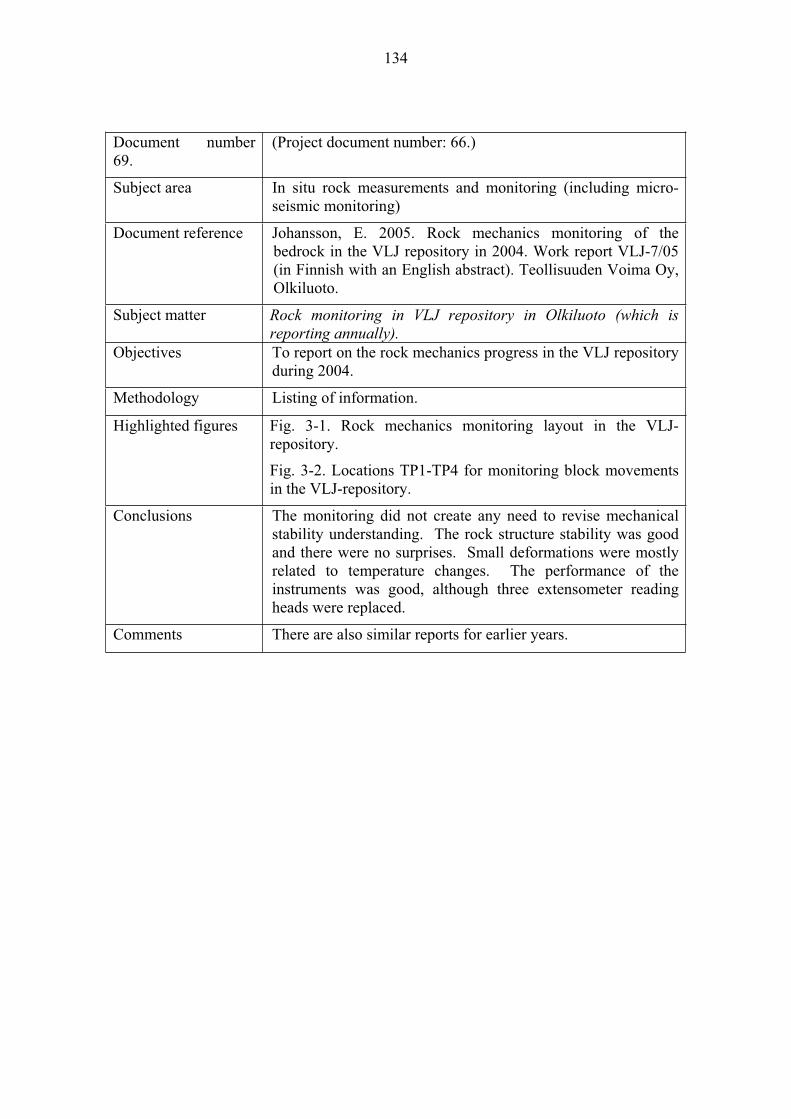
134
Document number 69.
(Project document number: 66.)
Subject area In situ rock measurements and monitoring (including micro-seismic monitoring)
Document reference Johansson, E. 2005. Rock mechanics monitoring of the bedrock in the VLJ repository in 2004. Work report VLJ-7/05 (in Finnish with an English abstract). Teollisuuden Voima Oy, Olkiluoto.
Subject matter Rock monitoring in VLJ repository in Olkiluoto (which is reporting annually).
Objectives To report on the rock mechanics progress in the VLJ repository during 2004.
Methodology Listing of information.
Highlighted figures Fig. 3-1. Rock mechanics monitoring layout in the VLJ-repository.
Fig. 3-2. Locations TP1-TP4 for monitoring block movements in the VLJ-repository.
Conclusions The monitoring did not create any need to revise mechanical stability understanding. The rock structure stability was good and there were no surprises. Small deformations were mostly related to temperature changes. The performance of the instruments was good, although three extensometer reading heads were replaced.
Comments There are also similar reports for earlier years.

135
Figure 3-1. Rock mechanics monitoring layout in the VLJ-repository.
Figure 3-2. Locations TP1-TP4 for monitoring block movements in the VLJ-repository.

136
Document number 70.
(Project document number: 68.)
Subject area In situ rock measurements and monitoring (including micro-seismic monitoring)
Document reference Saari, J. 2003. Seismic network at the Olkiluoto site. Working report 2003-37. Posiva Oy, Olkiluoto.
Subject matter Description of MS monitoring system in Olkiluoto.
Objectives Installation of a monitoring system to monitor tectonic earthquakes in order to characterise the undisturbed baseline of seismicity of the Olkiluoto bedrock and to monitor the excavation-induced seismicity. This will help to improve understanding of the structure, behaviour and long-term stability of the bedrock.
Methodology Local seismic network of six stations established in 2002 on the surface of Olkiluoto island. System manufactured and installed by ISS International Ltd. Coverage about 1 square km down to a depth of 500-1000 m. Resolution threshold ML = -2.
Highlighted figures Fig. 3-2. Basic structure of a seismometer vault. The objective is to provide stable conditions in respect of vibration, moisture, temperature and electrical properties.
Fig. 3-3a. A seismometer vault under construction. The concrete slab and the first concrete ring are shown. The final height of the vault is about 1.5 m.
Fig. 4-7. Screen dump of Jdi presentation (visualisation and interpretation program).
Conclusions System successfully installed.
Comments

137
Figure 3-2. Basic structure of a seismometer vault. The objective is to provide stable conditions in respect of vibration, moisture, temperature and electrical properties.
Figure 3-3a. A seismometer vault under construction. The concrete slab and the first concrete ring are shown. The final height of the vault is about 1.5 m.
Figure 4-7. Screen dump of Jdi presentation (visualisation and interpretation program).

138
Document number 71.
(Project document number: 69.)
Subject area In situ rock measurements and monitoring (including micro-seismic monitoring)
Document reference Posiva Oy. 2003. Programme of monitoring at Olkiluoto during construction and operation of the ONKALO. POSIVA 2003-05. Posiva Oy, Olkiluoto.
Subject matter Monitoring trends for ONKALO construction dealing with different disciplines. Preliminary plans for rock mechanics monitoring, as well. Detailed planning is definitely needed.
Objectives To discuss the strategy of monitoring, for rock mechanics, hydrogeology, geochemistry and other types of disturbance during the ONKALO construction and operation, including the legal context. (In this review, we just consider the rock mechanics aspects.)
Methodology Use of a similar format for each item or parameter: the measurements that have been carried out; and the plan to obtain the necessary data. Outlines are provided for the testing and sampling programmes. Explanations are provided of the different types of monitoring, especially biosphere-related.
Highlighted figures Table 3-1. A timetable for the rock mechanical monitoring programme.
Fig. 3-5. The principle of measuring movements in 3D in a fracture zone at the VLJ-repository. The distances between convergence pins A-D are measured (Johansson 2000).
Fig. 3-7. The principle of measuring rock displacements with multiple-point extensometers and convergence pins as well as loads on a rock bolt.
Conclusions No specific conclusions listed: the intention of the report was to summarise the monitoring requirements in the different subject areas.
Comments Overview of the monitoring requirements in each subject area.
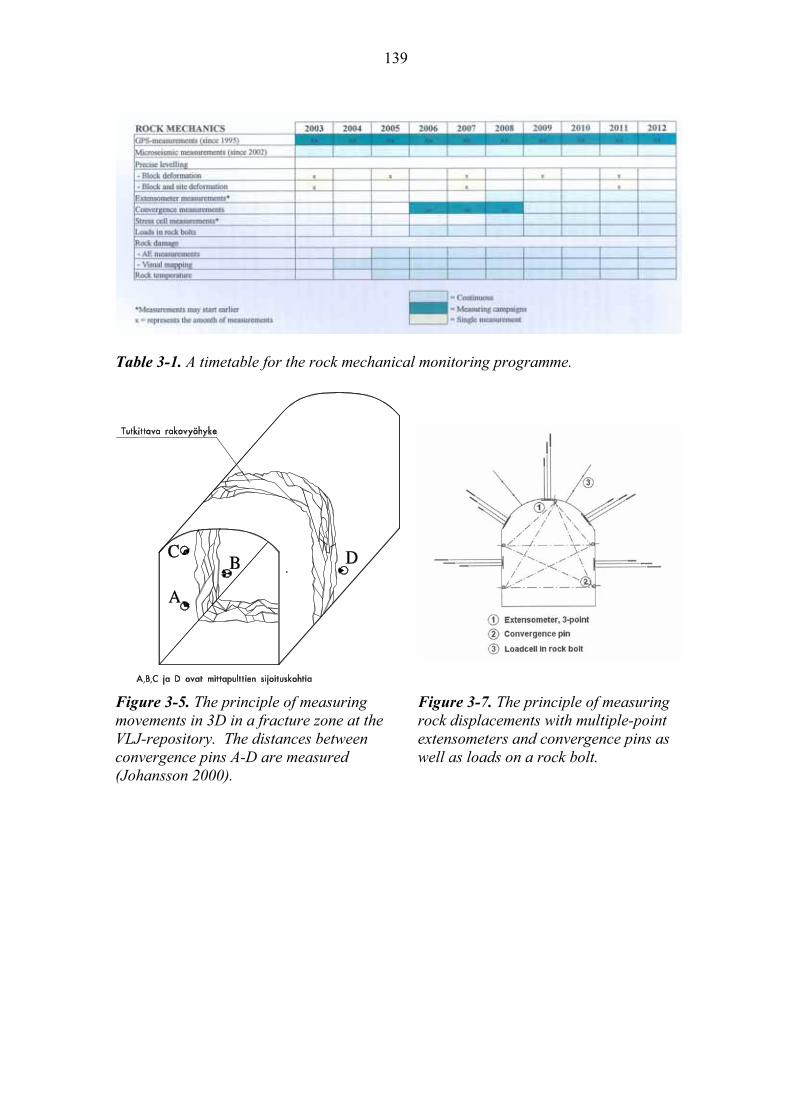
139
Table 3-1. A timetable for the rock mechanical monitoring programme.
Figure 3-5. The principle of measuring movements in 3D in a fracture zone at the VLJ-repository. The distances between convergence pins A-D are measured (Johansson 2000).
Figure 3-7. The principle of measuring rock displacements with multiple-point extensometers and convergence pins as well as loads on a rock bolt.
140
Long-term rock and excavation behaviour
Document number 72.
(Project document number: 24)
Subject area Long-term rock and excavation behaviour
Document reference
Tuokko, T. 1990. The long term strength and deformation properties of crystalline rock in a high level nuclear waste repository. Report YJT-90-22 (in Finnish). Nuclear Waste Commission of Finnish Power Companies, Helsinki.
Subject matter Literature study on creep and long term properties in hard, crystalline rock.
Objectives Study of time dependent phenomena affecting he deformation and strength properties of stiff, strong crystalline rock, with assessments of measuring methods for field conditions and the influence of time on shaft deformations.
Methodology Study of the literature and use of an AECL program to evaluate time dependent deformation around a main shaft.
Highlightedfigures
None
Conclusions Creep and cyclic fatigue are important and they arise from sub-critical crack growth which is most affected by stress intensity, chemical environment, temperature and microstructure. Theoretical models are defective in describing the triaxial stress condition, and it is difficult to measure the model parameters. Acoustic emission is suited for observing long-term crack growth in field conditions.
Comments Also see next report
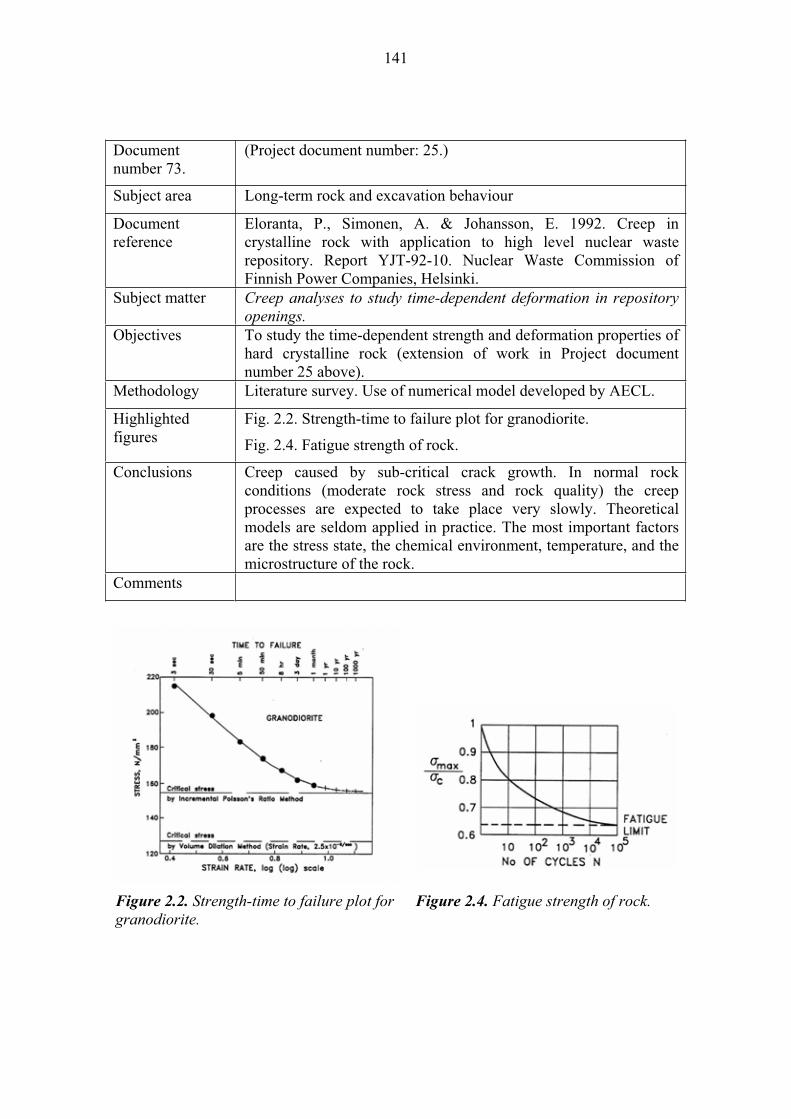
141
Document number 73.
(Project document number: 25.)
Subject area Long-term rock and excavation behaviour
Document reference
Eloranta, P., Simonen, A. & Johansson, E. 1992. Creep in crystalline rock with application to high level nuclear waste repository. Report YJT-92-10. Nuclear Waste Commission of Finnish Power Companies, Helsinki.
Subject matter Creep analyses to study time-dependent deformation in repository openings.
Objectives To study the time-dependent strength and deformation properties of hard crystalline rock (extension of work in Project document number 25 above).
Methodology Literature survey. Use of numerical model developed by AECL.
Highlightedfigures
Fig. 2.2. Strength-time to failure plot for granodiorite.
Fig. 2.4. Fatigue strength of rock.
Conclusions Creep caused by sub-critical crack growth. In normal rock conditions (moderate rock stress and rock quality) the creep processes are expected to take place very slowly. Theoretical models are seldom applied in practice. The most important factors are the stress state, the chemical environment, temperature, and the microstructure of the rock.
Comments
Figure 2.2. Strength-time to failure plot for granodiorite.
Figure 2.4. Fatigue strength of rock.

142
Document number 74.
(Project document number: 26.)
Subject area Long-term rock and excavation behaviour
Document reference Rasilainen, K. (ed.) 2004. Localisation of SR97 process report for Posiva’s spent nuclear fuel repository at Olkiluoto. Posiva Report 2004-05. Posiva Oy, Olkiluoto.
Subject matter Summary of processes involved in the long-term rock and excavation behaviour.
Objectives To document current understanding of processes considered relevant for the safety of spent fuel repository based on the geosphere and bedrock model at Olkiluoto.
Methodology Based on site investigations performed and includes the description of mechanical processes (i.e. rock mechanics) in the geosphere (pages 89-111).
Highlighted figures Fig. 5-17. New fracturing in tunnel floor due to high stress concentrations. Example from URL, Canada.
Conclusions Processes described.
Comments Covers all disciplines.
Figure. 5-17. New fracturing in tunnel floor due to high stress concentrations.Example from URL, Canada.

143
Prediction-Outcome studies
No reports on this subject were produced before 2005.
Post-excavation analyses
No specific reports on this subject.
Planning of rock mechanics investigation
Document number 75.
(Project document number: 71.)
Subject area Rock mechanics planning
Document reference Posiva Oy. 2000. Disposal of spent fuel in Olkiluoto bedrock. POSIVA 2000-14, Posiva Oy, Helsinki.
Subject matter Posiva’s R&D plans for the repository pre-construction phase (<2010). Report will be updated in the mid phase, at the end of 2005. Includes briefly some rock mechanics discussions.
Objectives To provide an overview of the programme for research, development and technical design for the pre-construction phase, including the programme framework, confirmation site investigations, aspects of technology and operational safety, safety case, environmental impacts and programme implementation. (Only the rock mechanics aspects are highlighted here.)
Methodology Discussion of each of the main subject areas listed above in the Objectives section, generally by an introduction/background about the subject, objectives, discussion of the important issues.
Highlighted figures Fig. 3-12. The process for the design, construction, characterisation and evaluation in the course of construction of the ONKALO.
Fig. 4-1. KBS-3-concept in its basic form (1400 canisters) (Riekkola et al. 1999).
Conclusions No conclusions explicitly listed.
Page 92 has an assessment of rock behaviour and mentions that rock mechanics analyses will be part of the documentation submitted for the licence application.
Comments Overview document.

144
Figure 3-12. The process for the design, construction, characterisation and evaluation in the course of construction of the ONKALO.
Figure 4-1. KBS-3-concept in its basic form (1400 canisters) (Riekkola et al. 1999).

145
Document number 76.
(Project document number: 70.)
Subject area Rock mechanics planning
Document reference Andersson, J. & McEwen, T. 2000. Workshop on needs and priorities for future R&D on spent fuel disposal - Haikko, Finland, 21-22 September, 2000. Working Report 2000-45. Posiva Oy, Olkiluoto.
Subject matter Review of Posiva’s plans for R&D work. Feedback from the authorities, also concerning rock mechanics aspects.
Objectives To report on a Workshop held at Haikko, Finland, from September 21-22, 2000 which was held to seek comment on Posiva’s R&D plans and ideas for future work, especially to seek expert opinion on priorities for future research and to seek guidance on site investigation requirements.
Methodology Presentation of Posiva’s R&D programme for 2001-2010 and goals for site confirmation programme at Olkiluoto, plus the role of the ONKALO.
Reporting of the discussion at the Workshop, which took place in five Working Groups: strategy for underground characterisation, hydrogeology and transport, geochemistry and transport, performance of engineered barriers, safety assessment. Extended summaries and concluding discussions are included.
Highlighted figures None necessary
Conclusions Sets of individual contributions summarised here.
Comments Worth going back and reading the conclusions of this Workshop, given the intervening years’ work.

146
Document number 77.
(Project document number: 72.)
Subject area Rock mechanics planning
Document reference Bäckblom, G. & Öhberg, A. 2002. The observational method to engineering and construction of the access to the ONKALO facility. Working report 2002-48. Posiva Oy, Helsinki.
Subject matter Description of OM-method with some rock mechanical considerations, as well.
Objectives To explain the concept of the observational method (design-as-you-go) and its possible application for the design and construction of the access to the ONKALO facility
Methodology To provide background material on the ONKALO facility, to outline previous experience with the method, and then to clearly define and describe the observation al method. Example applications to a shaft and a ramp access to ONKALO are studied, together with preparations required for implementation.
Highlighted figures Fig. 3-1. Application of the observational method.
Conclusions The observational method seems useful and so its potential use in the ONKALO ramp should be followed up. It should really be called ‘decide-as-you-go’, rather than ‘design-as-you-go’.
Comments

147
Figure 3-1. Application of the observational method.
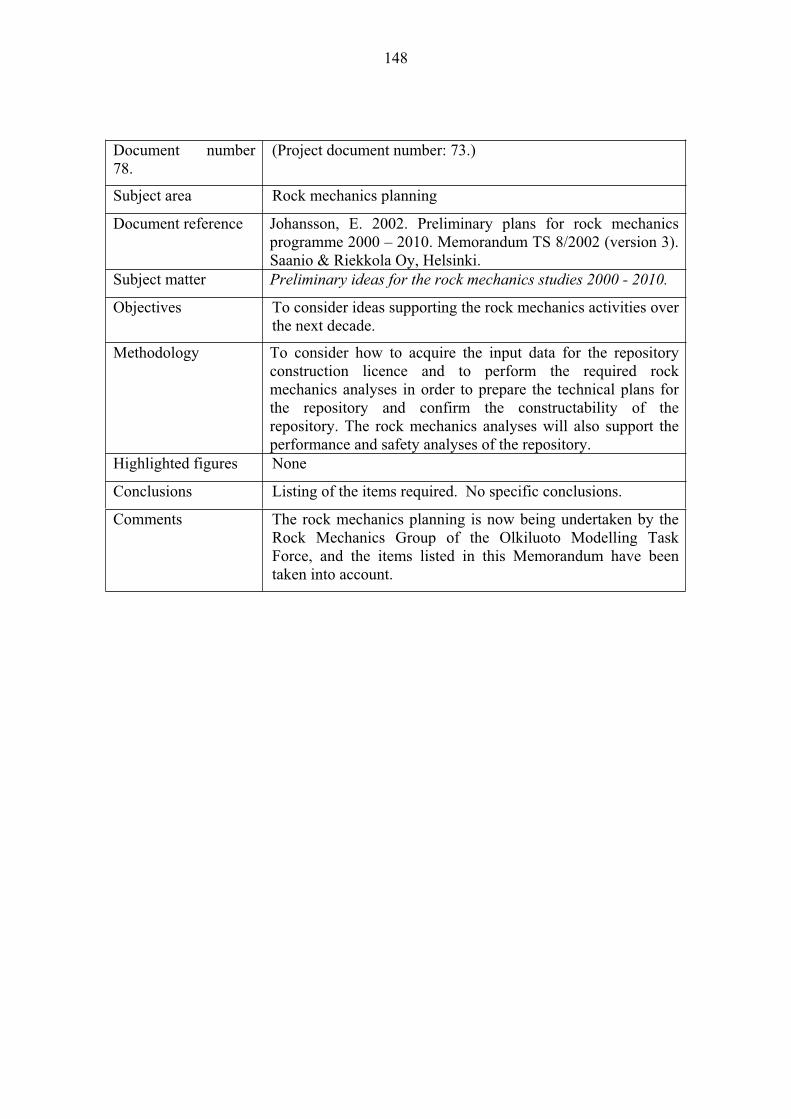
148
Document number 78.
(Project document number: 73.)
Subject area Rock mechanics planning
Document reference Johansson, E. 2002. Preliminary plans for rock mechanics programme 2000 – 2010. Memorandum TS 8/2002 (version 3). Saanio & Riekkola Oy, Helsinki.
Subject matter Preliminary ideas for the rock mechanics studies 2000 - 2010.
Objectives To consider ideas supporting the rock mechanics activities over the next decade.
Methodology To consider how to acquire the input data for the repository construction licence and to perform the required rock mechanics analyses in order to prepare the technical plans for the repository and confirm the constructability of the repository. The rock mechanics analyses will also support the performance and safety analyses of the repository.
Highlighted figures None
Conclusions Listing of the items required. No specific conclusions.
Comments The rock mechanics planning is now being undertaken by the Rock Mechanics Group of the Olkiluoto Modelling Task Force, and the items listed in this Memorandum have been taken into account.

149
Document number 79.
(Project document number: 74.)
Subject area Rock mechanics planning
Document reference Posiva Oy. 2003. ONKALO Underground Characterisation and Research Programme (UCRP). POSIVA 2003-03. Posiva Oy, Olkiluoto.
Subject matter Description of investigation and research programme for ONKALO. Trends for rock mechanics investigations are given as well.
Objectives To describe the ONKALO - Underground Characterisation and Research Programme for exploring the Olkiluoto rock conditions and thereby enhancing the current geoscientific understanding of the site in anticipation of submitting the licence application.
Methodology Description of the objectives, construction plans, characterisation programme, underground investigation methods, monitoring programme, evaluation modelling, R&D related to construction and characterisation, instrument development, data management, and management aspects.
Highlighted figures Table 5-1. Stress measurements at various construction phases of ONKALO.
Fig. 5-2. Modelling approaches for fracture zones and associated parameters (Johansson et al. 1996).
Fig. 7-2. The individual discipline models are all integrated. The geometrical framework of the geological description is the key to this integration.
Fig. 7-4. Prediction-outcome process.
Fig. 7-6. Rock mechanics modelling scheme.
Conclusions No specific conclusions listed.
Comments Overview of intent.

150
Table 5-1. Stress measurements at various construction phases of ONKALO.
Figure 5-2. Modelling approaches for fracture zones and associated parameters (Johansson et al. 1996).
Figure 7-2. The individual discipline models are all integrated. The geometrical framework of the geological description is the key to this integration.

151
Figure 7-4. Prediction-outcome process. Figure 7-6. Rock mechanics modelling scheme.

152
Document number 80.
(Project document number: 75.)
Subject area Rock mechanics planning
Document reference Saksa, P., Anttila, P., Riekkola, R. & Hautojärvi, A. 2003. Strategy for construction and investigation planning. Working report 2003-28. Posiva Oy, Olkiluoto.
Subject matter Strategy for underground investigations. Partly similar text as found in the above UCRP report.
Objectives To develop the strategy for the underground characterisation at Olkiluoto, which includes verification of the site suitability, defining and identifying suitable rock volumes for the repository, detailed characterisation of the host rock for layout design, safety assessment and construction planning, and testing and demonstration of the disposal techniques.
Methodology Description of research objectives, requirements for repository host rock and ONKALO, disposal concepts and options, plans for ONKALO, characterisation strategy, surface investigations, underground investigations, data processing plus interpretation and modelling, and data management.
Highlighted figures Fig. 6-2. Phases of tunnel mapping for construction and rock characterisation purposes.
Conclusions No specific conclusions listed.
Comments Overview report.
Figure 6-2. Phases of tunnel mapping for construction and rock characterisation purposes.
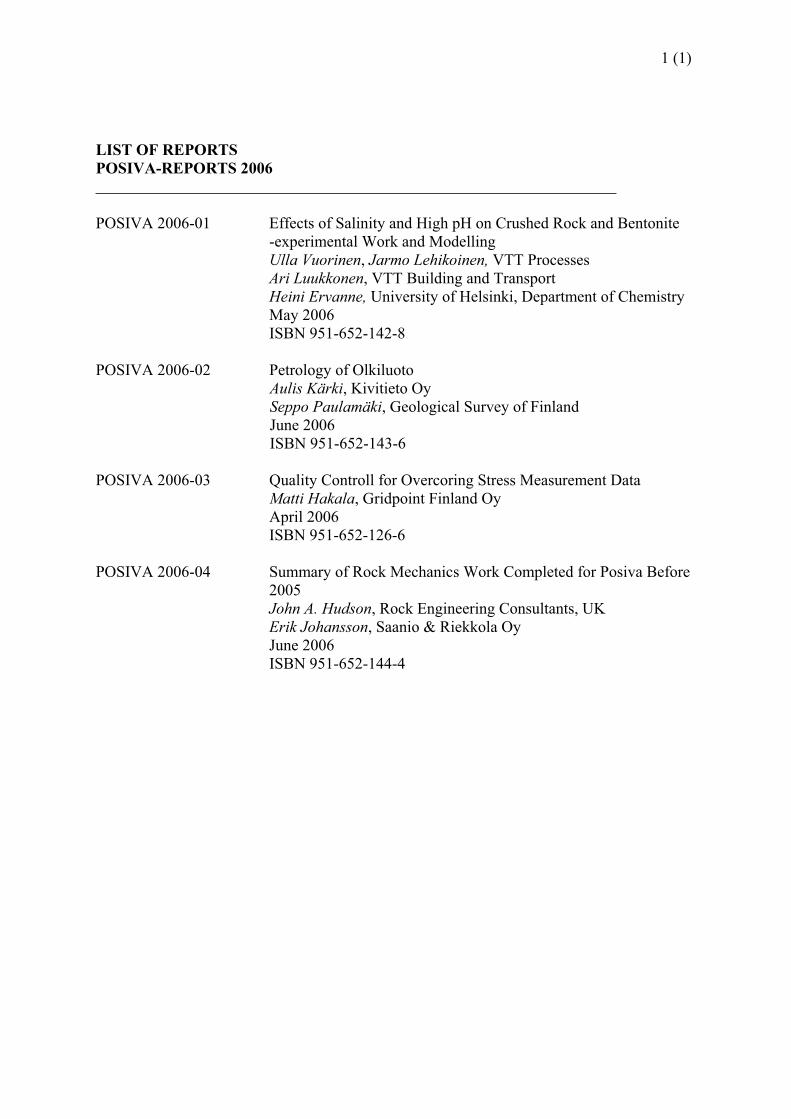
1 (1)
LIST OF REPORTS
POSIVA-REPORTS 2006
POSIVA 2006-01 Effects of Salinity and High pH on Crushed Rock and Bentonite
-experimental Work and Modelling
Ulla Vuorinen, Jarmo Lehikoinen, VTT Processes
Ari Luukkonen, VTT Building and Transport
Heini Ervanne, University of Helsinki, Department of Chemistry
May 2006
ISBN 951-652-142-8
POSIVA 2006-02 Petrology of Olkiluoto
Aulis Kärki, Kivitieto Oy
Seppo Paulamäki, Geological Survey of Finland
June 2006
ISBN 951-652-143-6
POSIVA 2006-03 Quality Controll for Overcoring Stress Measurement Data
Matti Hakala, Gridpoint Finland Oy
April 2006
ISBN 951-652-126-6
POSIVA 2006-04 Summary of Rock Mechanics Work Completed for Posiva Before
2005
John A. Hudson, Rock Engineering Consultants, UK
Erik Johansson, Saanio & Riekkola Oy
June 2006
ISBN 951-652-144-4
