sorption of protactinium on rocks in groundwaters from ... · in groundwaters from posiva...
TRANSCRIPT
POSIVA OY
POSIVA-96-18
Sorption of protactinium on rocks in groundwaters from Posiva
investigation sites
Seija Kulmala, Martti Hakanen Laboratory of Radiochemistry
Department of Chemistry University of Helsinki
Antero Lindberg Geological Survey of Finland
December 1996
Mikonkatu 15 A. FIN-001 00 HELSINKI, FINLAND
Phone (09) 2280 30 (nat.), (+358-9-) 2280 30 (int.)
Fax (09) 2280 3719 (nat.). (+358-9-) 2280 3719 (int.)
POSIVA OY
POSIVA-96-18
Sorption of protactinium on rocks in groundwaters from Posiva
investigation sites
Seija Kulmala, Martti Hakanen Laboratory of Radiochemistry
Department of Chemistry University of Helsinki
Antero Lindberg Geological Survey of Finland
December 1996
Mikonkatu 15 A, FIN-001 00 HELSINKI, FINLAND
Phone (09) 2280 30 (nat.). (+358-9-) 2280 30 (int.)
Fax (09) 2280 3719 (nat.), (+358-9-) 2280 3719 (int.)
ISBN 951-652-017-0 ISSN 1239-3096
The conclusions and viewpoints presented in the report are
those of author(s) and do not necessarily coincide
with those of Posiva.
Posiva-raportti - Posiva report
PosivaOy Mikonkatu 15 A, FIN-00100 HELSINKI, FINLAND Puh. (09) 2280 30- lnt. Tel. +358 9 2280 30
Tekija(t) - Author(s)
Seija Kulmala, Martti Hakanen, University of Helsinki Antero Lindberg, Geological Survey of Finland
Nimeke- Title
Toimeksiantaja(t)- Commissioned by
Posiva Oy
Raportin tunnus - Report code
POSIV A-96-18
Julkaisuaika- Date
December 1996
SORPTION OF PROTACTINIUM ON ROCKS IN GROUNDWATERS FROM POSIVA INVESTIGATION SITES
Tiivistelma- Abstract
Posiva Oy intends to dispose of the spent fuel produced in Finnish nuclear power plants in a repository deep in the Finnish bedrock. For the purpose Posiva Oy selected three areas for detailed investigations in 1992. These areas are Kivetty in .Aanekoski, Romuvaara in Kuhmo and Olkiluoto in Eurajoki. This study examines the sorption behaviour of protactinium on crushed rock and thin section samples of rocks from these areas. In January 1997 detailed investigations will also be initiated at Hastholmen in Loviisa.
The sorption of protactinium was high on all rocks under both oxic and anoxic conditions. The main difference between the oxic and anoxic conditions was the solubility of the spiking solution. The spiking solution was dried into a teflon platelet and the teflon platelet put into the sample. Under anoxic conditions the undissolved fraction was 4. 70-6.7% and under oxic conditions it was < 1.0%.
The sorption of protactinium was lowest on Romuvaara rock samples from RO-KR5 groundwater under anoxic conditions. The RI values were 0.07-2.3 m3/kg. Under oxic conditions the Rd values were 0.20-1.8 m3/kg. From KI-KR4 and OL-KR5 groundwaters under anoxic conditions the Rd values for Romuvaara rock samples were 0.70-8.6 m3/kg and 0.35-1.7 m3/kg, respectively.
The sorption of protactinium on Kivetty and Olkiluoto rock samples was almost the same. The Rd values for Kivetty rock samples from KI-KR4 groundwater were 0.51-1.7 m3/kg and 1.7-12 m3/kg under oxic and anoxic conditions, respectively. The corresponding Rd values for Olkiluoto rock samples were 0.71-3.1 m3/kg and 0.31-2.4 m3/kg.
ISBN ISSN ISBN 951-652-017-0 ISSN 1239-3096
Sivumaara- Number of pages Kieli - Language 25 +Appendices English
Posiva-raportti - Posiva report
PosivaOy Mikonkatu 15 A, FIN-001 00 HELSINKI, FINLAND Puh. (09) 2280 30- lnt. Tel. +358 9 2280 30
Tekija(t) - Author(s)
Seija Kulmala, Martti Hakanen, Helsingin yliopisto Antero Lindberg, Geologian tutkimuskeskus
Nimeke- Title
Toimeksiantaja(t)- Commissioned by
Posiva Oy
Raportin tunnus - Report code
POSIVA-96-18
Julkaisuaika - Date
Joulukuu 1996
PROT AKTINIUMIN SORPTIO POSIV AN TUTKIMUSALUEIDEN POHJA VESIST A KIVIIN
Tiivistelma- Abstract
Posiva Oy suunnittelee suomalaisissa ydinvoimaloissa syntyvan kaytetyn ydinpolttoaineen loppusijoittamista syvalle suomalaiseen kallioperaan. Yksityiskohtaisia tutkimuksia varten Posiva Oy on valinnut vuonna 1992 kolme aluetta eri paikkakunnilta: Kivetyn Aanekoskelta, Romuvaaran Kuhmosta ja Olkiluodon Eurajoelta. Tassa tutkimuksessa on kasitelty protaktiniumin sorptiota nailta paikkakunnilta valittuihin kivimurskeisiin ja -hieisiin. Tammikuussa 1997 Loviisan Hastholmen liitetaan mukaan kaytetyn polttoaineen sijoituspaikkatutkimuksiin.
Protaktiniumin sorptio oli korkeaa kaikilla kivilla seka hapellisissa etta hapettomissa olosuhteissa. Suurin ero hapellisten ja hapettomien olosuhteiden valilla oli leimaliuoksen liukoisuudessa. Leimaliuos kuivattiin teflonpalalle, joka laitettiin naytteeseen. Hapettomissa olosuhteissa teflonpalalle jai 4,70-16,7 %. Hapellisissa olosuhteissa liukenemattoman leiman osuus oli < 1,0 %.
Protaktiniumin sorptio oli heikointa Romuvaaran kiviin RO-KR5-pohjavedesta hapettomissa olosuhteissa. Massajakaantumiskertoimet, Rt -arvot, olivat 0.07-2,3 m3 /kg. Hapellisissa olosuhteissa RI-arvot olivat 0,20-1,8 m3/kg. KI-KR4- ja OL-KR5-pohjavesista hapettomissa olosuhteissa Rdarvot Romuvaaran kivinaytteille olivat 0,70-8.6 m3/kg KI-KR4-pohjavedella ja 0.35-1,7 m3/kg OLKR5-poh javedella.
Protaktiniumin sorptio Kivetyn ja Olkiluodon kivinaytteisiin vastaavista pohjavesista oli miltei samaa. Rd-arvot Kivetyn kivinaytteille KI-KR4-pohjavedesta olivat 0,51-1,7 m3/kg hapellisissa olosuhteissa ja 1,7-12 m3/kg hapettomissa olosuhteissa. Vastaavat Rd-arvot Olkiluodon kivinaytteille OL-KR5-pohjavedesta olivat 0,71-3,1 m3/kg ja 0,31-2,4 m3/kg.
ISBN ISSN ISBN 951-652-017-0 ISSN 1239-3096
Sivumaara- Number of pages Kieli - Language 25 + lii tteet Englanti
PREFACE
This study was commissioned by Teollisuuden Voima Oy (after 1.1.1996 Posiva Oy) and was
carried out in the Laboratory of Radiochemistry, Department of Chemistry, University of
Helsinki. The contact persons from Posiva were Lauri PolHinen and Margit Snellman. The
responsible researchers and authors were Seija Kulmala and Martti Hakanen from the
Laboratory of Radiochemistry. The rock samples were chosen and identified by Antero Lindberg
from the Geological Survey of Finland.
CONTENTS
1 INTRODUCTION
2 MATERIALS
2.1 Rock samples
2.2 Ground waters
2.3 Chemicals and solutions for measurement of
cation exchange capacity
2.4 Radionuclides and carrier solutions
3 METHODS
3.1 Cation exchange capacity (CEC values)
3.2 Sorption experiments
3.2.1 Oxic conditions
3.2.2 Anoxic conditions
3.3 Sorption on thin section samples
4 RESULTS
4.1 Cation exchange capacities, CEC values
4.2 Experiments with crushed rock, Rct values
4.2.1 Oxic conditions
4.2.2 Anoxic conditions
4.2.3 Palmottu crushed rock samples
4.3 Rock thin sections, Ra values
5 CONCLUSIONS
6 LITERATURE
APPENDIX A
APPENDIX B
1
2
2
4
5
5
6
6
7
7
10
12
13
13
17
17
18
21
21
23
25
1
1. INTRODUCTION
Since 1983 Teollisuuden Voima Oy (TVO) has been surveying Finnish bedrock for the final
disposal of the spent nuclear fuel. Since january 1996 the work has been continued by Posiva
Oy. Five sites were studied during the preliminary site investigation phase in 1987-1992.
Detailed site investigations were initiated in 1993 in three of these sites: Romuvaara in Kuhmo,
Kivetty in Aanekoski and Olkiluoto in Eurajoki.
This study is one part of a broad investigation into the migration behaviour of nuclear waste
radionuclides under groundwater conditions in Finland. Here the sorption of protactinium was
studied, under both oxic and anoxic conditions. Most samples were crushed rock, the others
polished rock thin sections.
2
2. MATERIALS
2.1 Rock samples
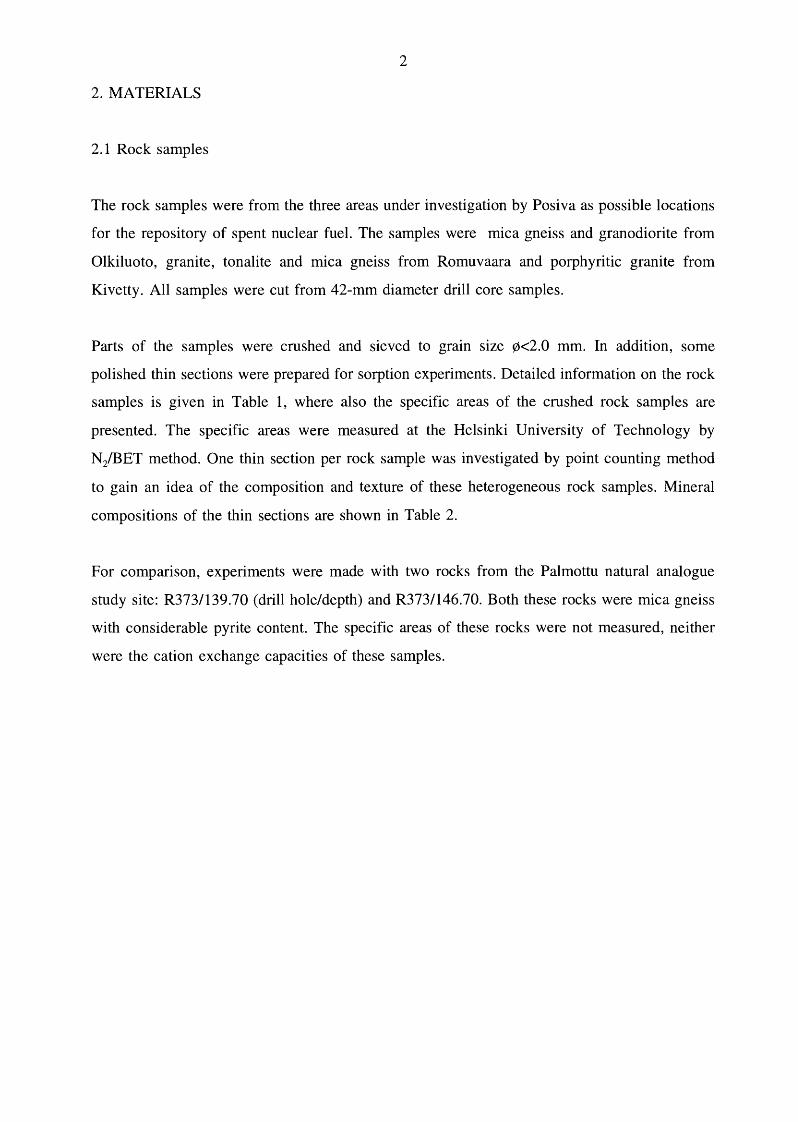
The rock samples were from the three areas under investigation by Posiva as possible locations
for the repository of spent nuclear fuel. The samples were mica gneiss and granodiorite from
Olkiluoto, granite, tonalite and mica gneiss from Romuvaara and porphyritic granite from
Kivetty. All samples were cut from 42-mm diameter drill core samples.
Parts of the samples were crushed and sieved to grain stze (25<2.0 mm. In addition, some
polished thin sections were prepared for sorption experiments. Detailed information on the rock
samples is given in Table 1, where also the specific areas of the crushed rock samples are
presented. The specific areas were measured at the Helsinki University of Technology by
N/BET method. One thin section per rock sample was investigated by point counting method
to gain an idea of the composition and texture of these heterogeneous rock samples. Mineral
compositions of the thin sections are shown in Table 2.
For comparison, experiments were made with two rocks from the Palmottu natural analogue
study site: R373/139.70 (drill hole/depth) and R373/146.70. Both these rocks were mica gneiss
with considerable pyrite content. The specific areas of these rocks were not measured, neither
were the cation exchange capacities of these samples.
3
Table 1. Rock samples used in the study. Crushed rock samples and polished thin sections were prepared at the Geological Survey of Finland and specific areas were measured at the Helsinki University of Technology, Laboratory of Mechanical Processing and Recycling. Ol=Olkiluoto study site, Ro=Romuvaara study site and Ki=Kivetty study site.
Rock Depth of the Depth of the Specific area of rock thin crushed rock the crushed rock
section (m) sample (m) (m2/g)
011, mica gneiss 561 520-586 0.95 012A, granodiorite (tonalite) 355 346-390 0.22 012B, granodiorite (granite) 417 417--455 0.36
Ro 1 A, tonalite 337 335--412 0.28 Ro1B, granite (leukotonal.) 559 547-654 0.23 Ro 1 C, mica gneiss 753 724-793 0.18
Ki4A, porph. granite 301 255-328 0.21 Ki4B, porph. granite 385, 439 371--442 0.22 (granod.)
rock names based on omt countm ; names m arentheses are "tleld names p g p
Table 2. Mineral compositions of thin sections (Vol.-%) calculated by point counting method (500 points/sample).
Minerals 011111 012A/9 012B/9 Ro1A/9 Ro1B/10 Ro1C/11 Ki4A/6 Ki4B/4
K-feldspar 19.2 16.6 15.2 - 30.2 0.2 26.4 36.6 Plagioclace 14.8 38.6 38.4 25.4 24.8 27.0 23.6 25.4 Quartz 16.6 26.0 35.8 44.4 36.4 38.8 39.0 20.0 Biotite 32.4 6.6 0.2 16.4 2.6 31.2 5.4 12.0 Muscovite 2.4 3.6 9.2 12.2 3.8 0.2 0.8 0.8 Chlorite - 6.4 0.2 + 0.6 0.2 - -Hornblende - - - - +? - 4.0 4.4 Apatite ? 1.0 - 0.2 + 0.8 0.2 0.2 Epidote + 0.4 + 1.0 1.2 0.6 - 0.2 Calcite - - - - + - - -
Sphene - + - + - - - 0.2 Zircon - ? ? + Garnet - 0.6 + - - - - -Sillimanite 3.2 - 1.0 - - - - -Cordierite 9.8 - - - - - - -Fluorite - - - - 0.2 - - -
Opaques 1.6 0.2 - 0.4 + 1.0 0.6 0.2
Some detailed information of the thin sections is presented in Appendix A, Table 1.
4
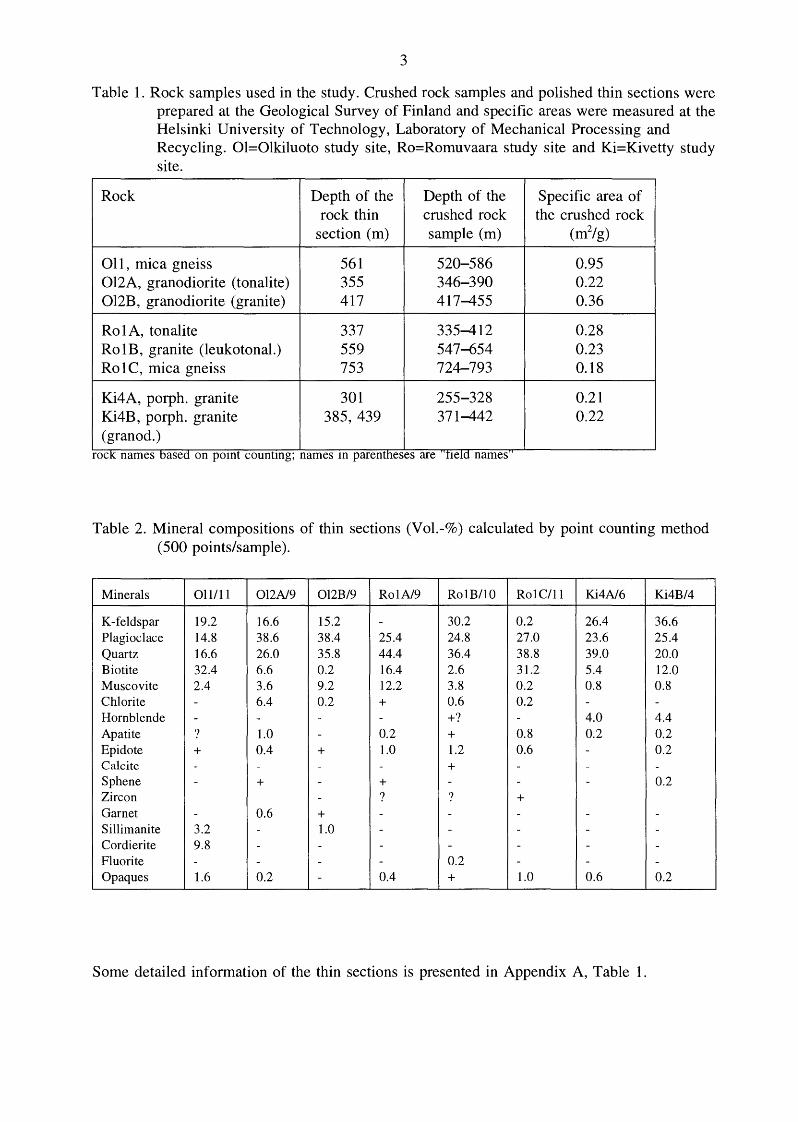
2.2 Groundwaters
The waters were natural groundwaters collected from the same areas and depths as the rock
samples. The concentrations of selected solutes in the groundwaters are presented in Table 3 and
the detailed chemical compositions of the groundwaters in Appendix A.
Table 3. Chemical composition of the natural groundwaters used in this study (lmatran Voima Oy, Chem. Lab.
Ro-KR5ff1 Ki-KR4ff1 Ol-KR5ff1 13.11.1995 20.11.1995 30.10.1995
pH 9.3 8.2 8.2 Eh(Pt) (mV) * 300 -75 -270 Conductivity 25°C (mS/m) 18.0 17.0 2330 Alkalinity ( meq/1) 0.28 0.24 0.10 KMn04 (mg/1) 2.8 2.9 80.0 Si02 (mg/1) 13.0 13.0 6.3 co2,tot (mg/1) 53.8 58.2 4.20 Br (mg/1) 0.10 0.03 58.0 Cl (mg/1) 4.3 3.2 9200 F (mg/1) - 3.0 1.30 P04 (mg/1) 0.44 0.02 <0.01 S04 (mg/1) 3.9 2.00 3.30 AI (mg/1) 0.071 0.030 0.032 Ca (total, mg/1) 2.1 13.0 2100 Fe (total, mg/1) 0.059 0.520 0.230 K (mg/1) 0.69 0.87 15.0 Mg (mg/1) 0.08 3.0 67.0 Mn (mg/1) 0.001 0.210 0.360 Na (mg/1) 39.0 18.0 3330 Cs (mg/1) <0.005 <0.005 0.008 H-3 (TU) 0.9 1.9 2.0 U-238 (H20, Jlg/1) 0.439 3.190 0.026
ionic strength 1.5 ·10-3 1.9·10-3 3.1 ·1 o-l
* Eh(Pt) (mV) field measurement Other values are measured at the laboratory
5
2.3 Chemicals and solutions for measurement of cation exchange capacity
A silver-thiourea (AgTU) solution was prepared to determine the cation exchange capacity
(CEC) of the crushed rock samples 11/. The solution contained
7.79 g thiourea (Pro analysi (p.a.), Merck)/240 ml ultra pure grade water
and 7.82 g NH4Ac (0.1 M, p.a., Merck)
and 500 ml 0.02 M AgN03 (1.71 g AgN03 (p.a., Merck) and 500 ml ultra pure
grade water)
diluted to one litre
Another experiment to determine the CEC value was made with the same AgTU solution but
with the pH adjusted to pH 1.0 with 1.0 M HN03 solution.
The caesium sorption isotherm was also measured. Four different Cs solutions were prepared in
ultra pure grade water. The Cs concentration was obtained with nonradioactive CsCl (p.a.
Merck), and 100 fll of Cs-134 solution/sample was added as tracer. The concentrations of
caesium in the solutions were: Cs1 1.11·10-2 mol/1,
Cs3 1.22 ·1 o-6 mol/1,
Cs2 1.16 ·1 o-4 mol/1
Cs4 1.16 ·1 o-7 mol/1
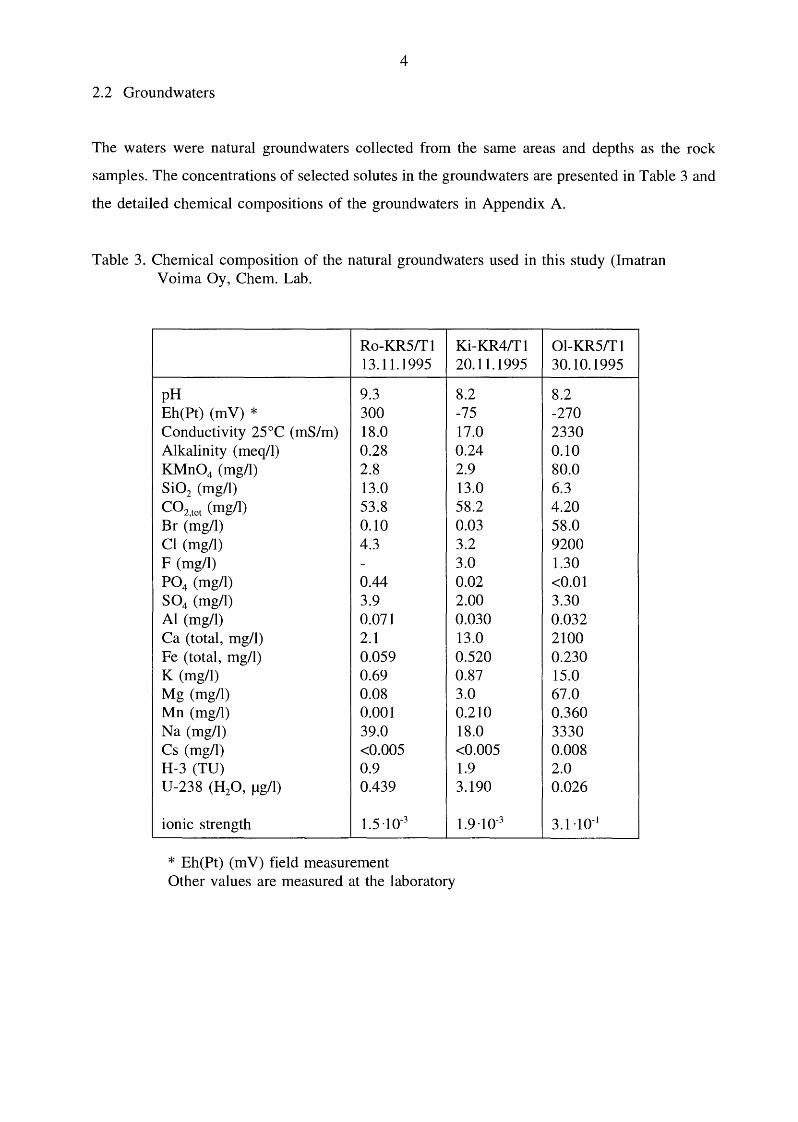
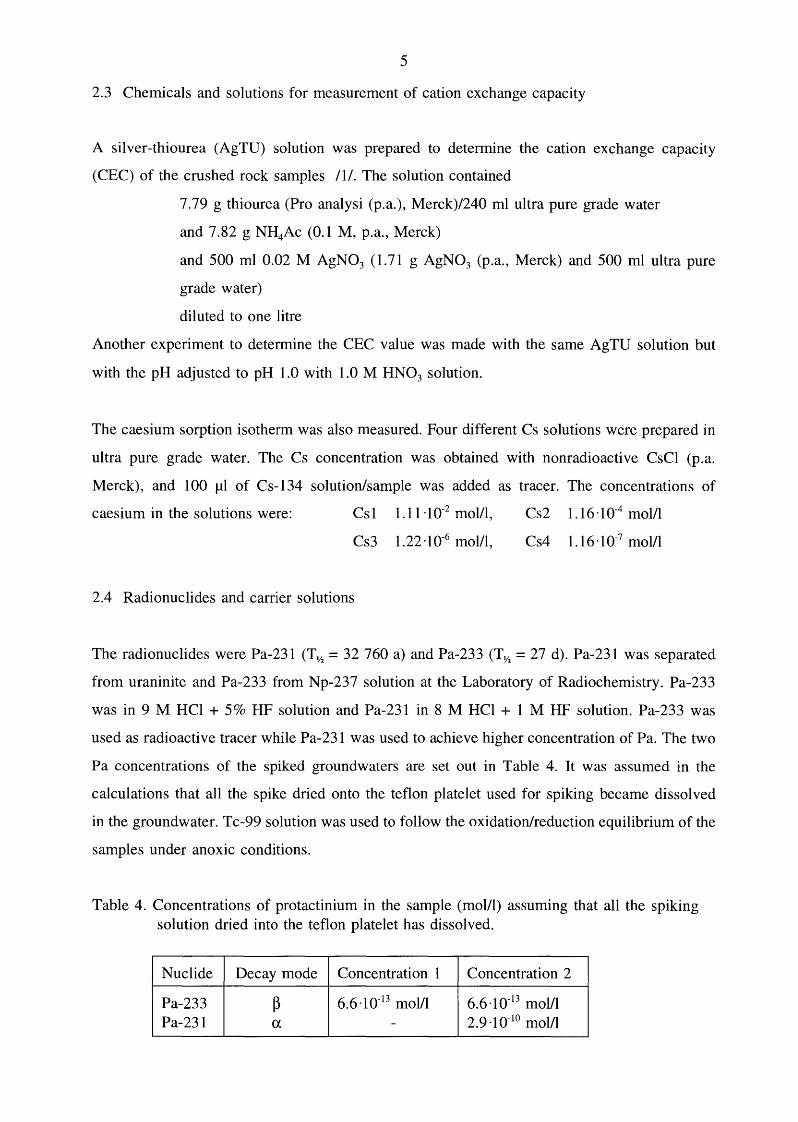
2.4 Radionuclides and carrier solutions
The radionuclides were Pa-231 (T y2 = 32 760 a) and Pa-233 (Ty
2 = 27 d). Pa-231 was separated
from uraninite and Pa-233 from Np-237 solution at the Laboratory of Radiochemistry. Pa-233
was in 9 M HCl + 5% HF solution and Pa-231 in 8 M HCl + 1 M HF solution. Pa-233 was
used as radioactive tracer while Pa-231 was used to achieve higher concentration of Pa. The two
Pa concentrations of the spiked groundwaters are set out in Table 4. It was assumed in the
calculations that all the spike dried onto the teflon platelet used for spiking became dissolved
in the ground water. Tc-99 solution was used to follow the oxidation/reduction equilibrium of the
samples under anoxic conditions.
Table 4. Concentrations of protactinium in the sample (mol/1) assuming that all the spiking solution dried into the teflon platelet has dissolved.
Nuclide Decay mode Concentration 1 Concentration 2
Pa-233 ~ 6.6·10-13 mol/1 6.6·10-13 mol/1 Pa-231 a - 2.9 ·1 o-IO mol/1
6
3. METHODS
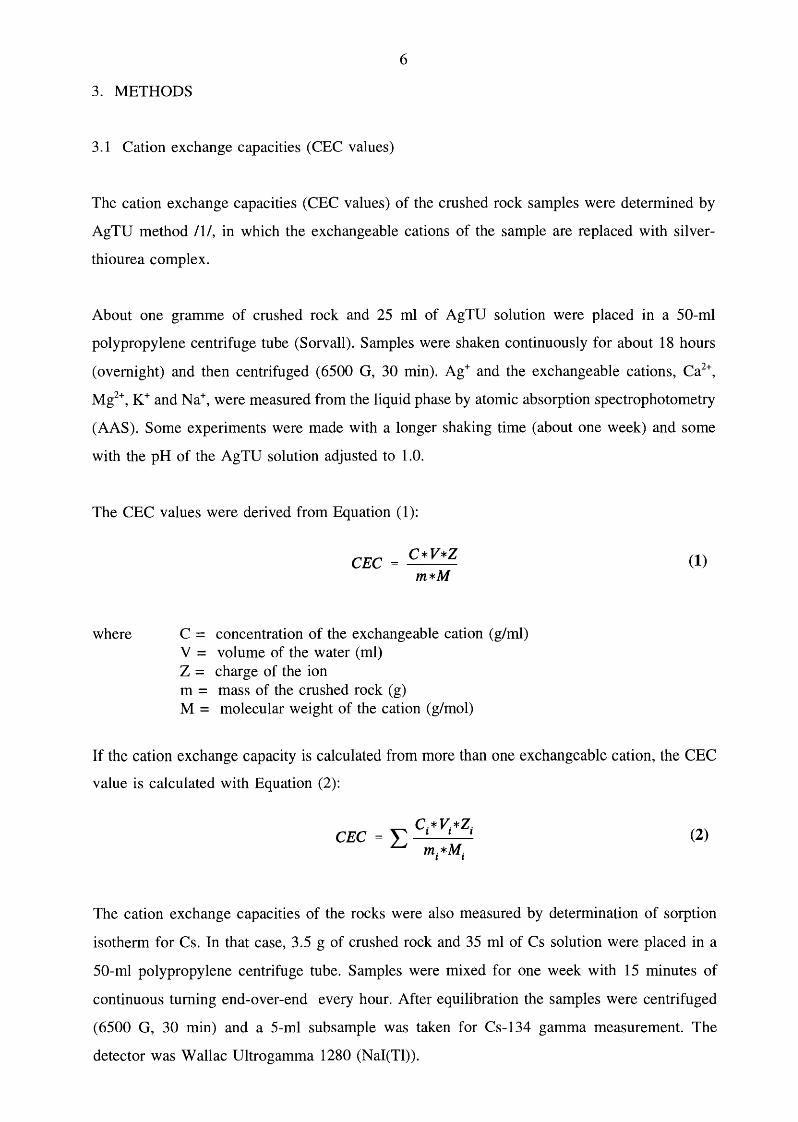
3.1 Cation exchange capacities (CEC values)
The cation exchange capacities (CEC values) of the crushed rock samples were determined by
AgTU method /11, in which the exchangeable cations of the sample are replaced with silver
thiourea complex.
About one gramme of crushed rock and 25 ml of AgTU solution were placed in a 50-ml
polypropylene centrifuge tube (Sorvall). Samples were shaken continuously for about 18 hours
(overnight) and then centrifuged (6500 G, 30 min). Ag+ and the exchangeable cations, Ca2+,
Mg2+, K+ and Na+, were measured from the liquid phase by atomic absorption spectrophotometry
(AAS). Some experiments were made with a longer shaking time (about one week) and some
with the pH of the AgTU solution adjusted to 1.0.
The CEC values were derived from Equation (1):
where
CEC
C = concentration of the exchangeable cation (g/ml) V = volume of the water (ml) Z = charge of the ion m = mass of the crushed rock (g) M = molecular weight of the cation (g/mol)
(1)
If the cation exchange capacity is calculated from more than one exchangeable cation, the CEC
value is calculated with Equation (2):
(2)
The cation exchange capacities of the rocks were also measured by determination of sorption
isotherm for Cs. In that case, 3.5 g of crushed rock and 35 ml of Cs solution were placed in a
50-ml polypropylene centrifuge tube. Samples were mixed for one week with 15 minutes of
continuous turning end-over-end every hour. After equilibration the samples were centrifuged
(6500 G, 30 min) and a 5-ml subsample was taken for Cs-134 gamma measurement. The
detector was Wallac Ultrogamma 1280 (Nai(Tl)).
7
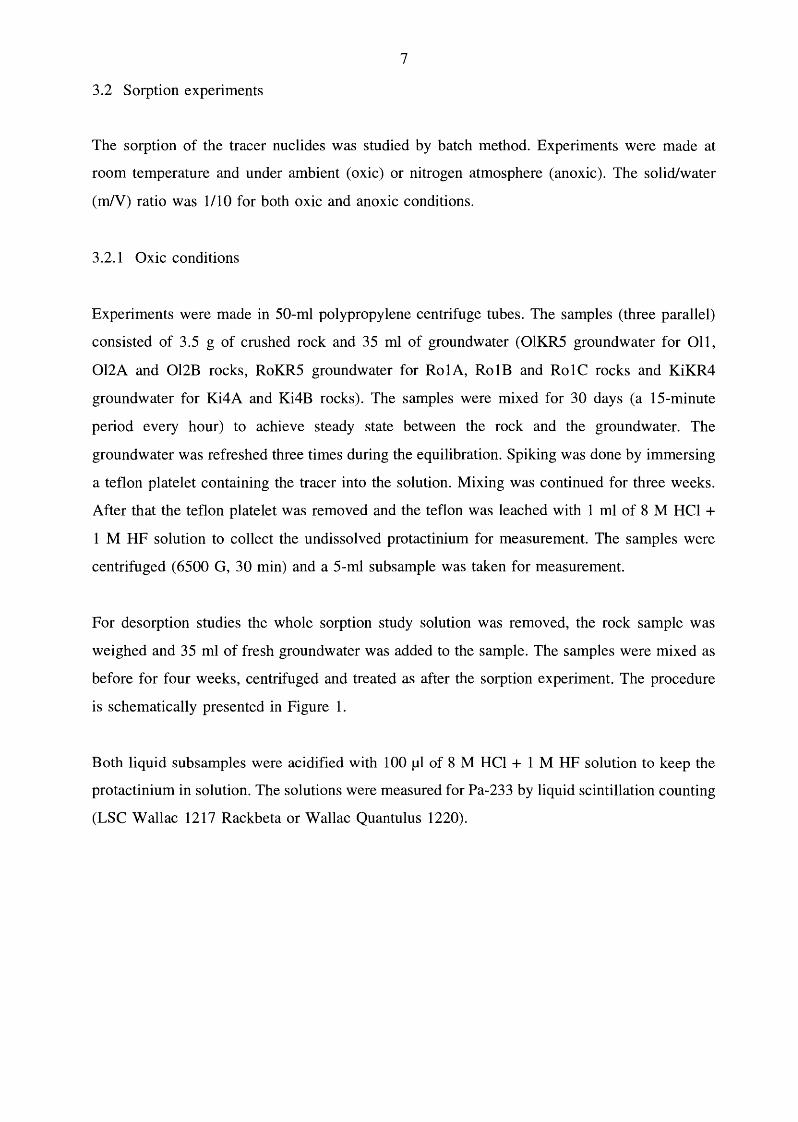
3.2 Sorption experiments
The sorption of the tracer nuclides was studied by batch method. Experiments were made at
room temperature and under ambient (oxic) or nitrogen atmosphere (anoxic). The solid/water
(m/V) ratio was 1110 for both oxic and anoxic conditions.
3 .2.1 Oxic conditions
Experiments were made in 50-ml polypropylene centrifuge tubes. The samples (three parallel)
consisted of 3.5 g of crushed rock and 35 ml of ground water (OlKR5 ground water for 011,
012A and Ol2B rocks, RoKR5 groundwater for Ro1A, Ro1B and Ro1C rocks and KiKR4
groundwater for Ki4A and Ki4B rocks). The samples were mixed for 30 days (a 15-minute
period every hour) to achieve steady state between the rock and the groundwater. The
groundwater was refreshed three times during the equilibration. Spiking was done by immersing
a teflon platelet containing the tracer into the solution. Mixing was continued for three weeks.
After that the teflon platelet was removed and the teflon was leached with 1 ml of 8 M HCl +
1 M HF solution to collect the undissolved protactinium for measurement. The samples were
centrifuged (6500 G, 30 min) and a 5-ml subsample was taken for measurement.
For desorption studies the whole sorption study solution was removed, the rock sample was
weighed and 35 ml of fresh groundwater was added to the sample. The samples were mixed as
before for four weeks, centrifuged and treated as after the sorption experiment. The procedure
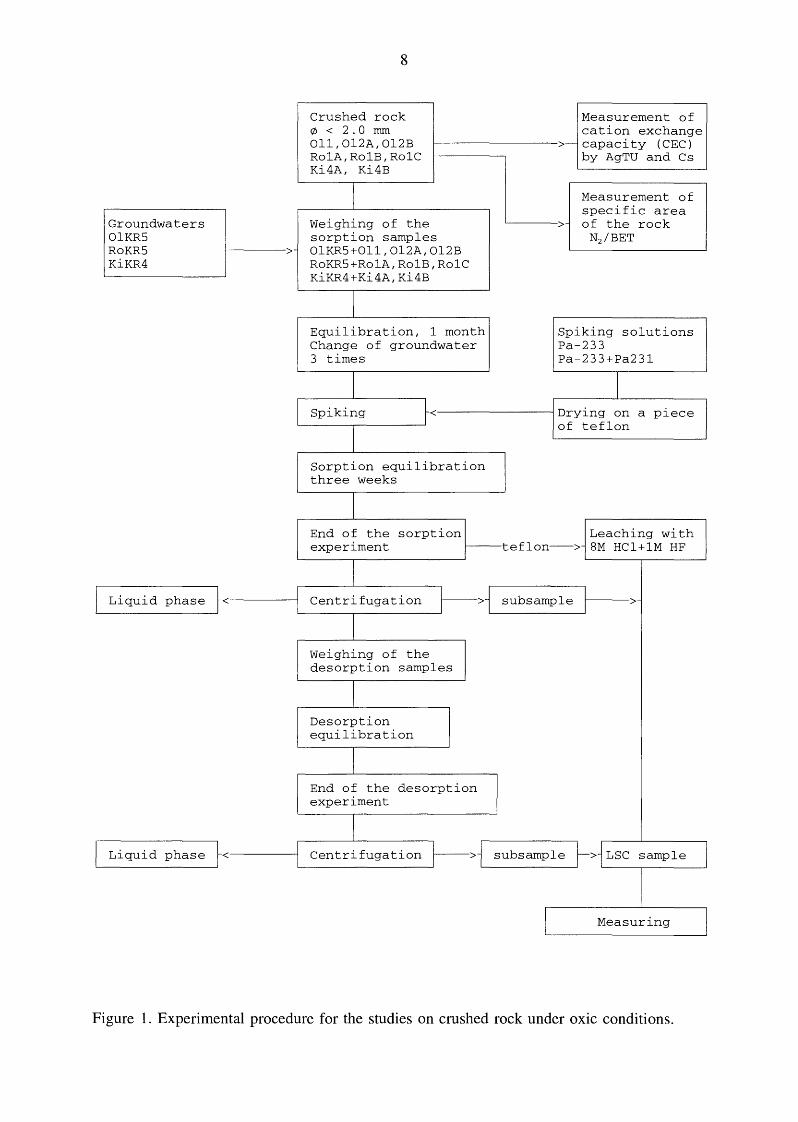
is schematically presented in Figure 1.
Both liquid subsamples were acidified with 100 ~1 of 8 M HCl + 1 M HF solution to keep the
protactinium in solution. The solutions were measured for Pa-233 by liquid scintillation counting
(LSC Wallac 1217 Rackbeta or Wallac Quantulus 1220).
Groundwaters OlKR5 RoKR5 KiKR4
Liquid phase ~<
Liquid phase ~<
>
8
Crushed rock (/> < 2.0 mm Oll,Ol2A,Ol2B RolA,RolB,RolC Ki4A, Ki4B
I Weighing of the sorption samples OlKR5+0ll,Ol2A,Ol2B RoKR5+RolA,RolB,RolC KiKR4+Ki4A,Ki4B
I Equilibration, 1 month Change of groundwater 3 times
I Spiking <
I Sorption equilibration three weeks
I End of the sorption
Measurement of cation exchange
>-capacity (CEC) by AgTU and Cs
Measurement of specific area
> of the rock N2 /BET
Spiking solutions Pa-233 Pa-233+Pa231
Drying on a piece of teflon
experiment Leaching with
---> 8M HCl+lM HF -teflon
I Centrifugation >~ subs amp le >
I Weighing of the desorption samples
I Desorption equilibration
I End of the desorption experiment
I Centrifugation >~ subsampl e ~> LSC sample
Measuring
Figure 1. Experimental procedure for the studies on crushed rock under oxic conditions.
9
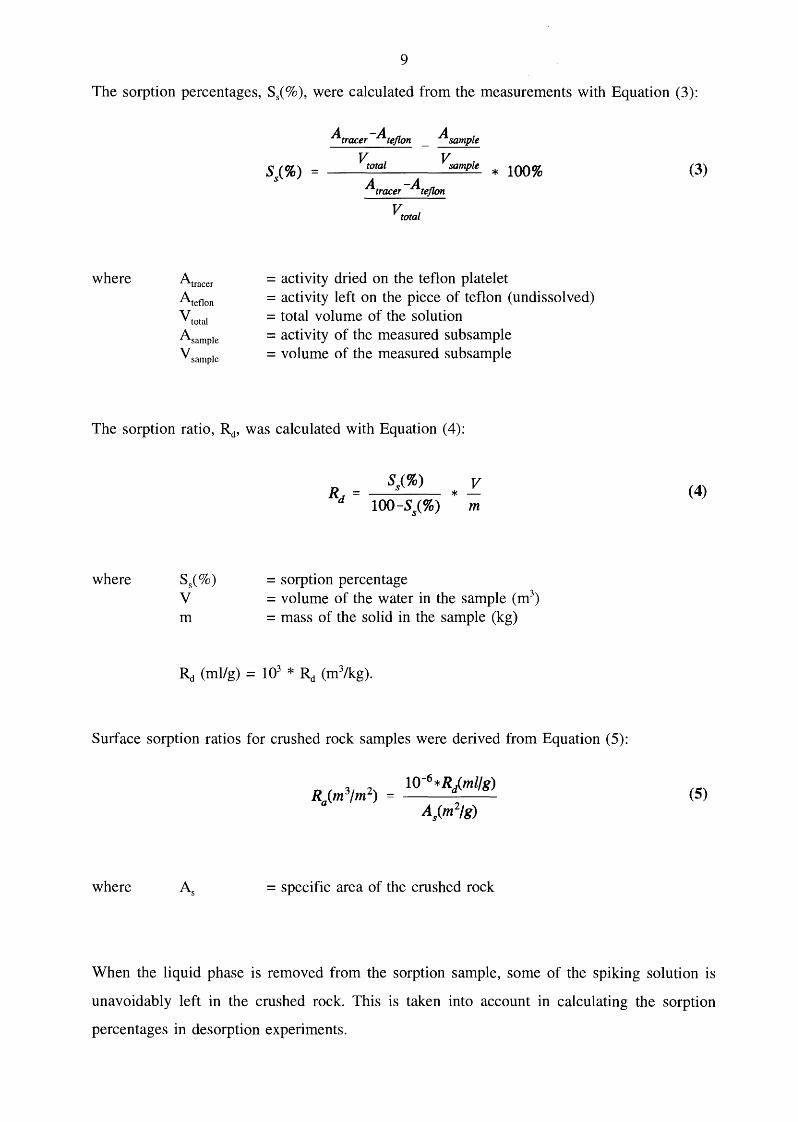
The sorption percentages, S5(% ), were calculated from the measurements with Equation (3):
where Atracer
Ateflon
V total
Asample
V sample
A tracer-Atejlon A sample
= activity dried on the teflon platelet = activity left on the piece of teflon (undissolved) = total volume of the solution = activity of the measured subsample = volume of the measured subsample
The sorption ratio, Rct, was calculated with Equation ( 4):
where
m
R = d
= sorption percentage
* V m
= volume of the water in the sample (m3)
= mass of the solid in the sample (kg)
Surface sorption ratios for crushed rock samples were derived from Equation (5):
where
10-6 *Rjml/g)
A/m2/g)
= specific area of the crushed rock
(3)
(4)
(5)
When the liquid phase is removed from the sorption sample, some of the spiking solution is
unavoidably left in the crushed rock. This is taken into account in calculating the sorption
percentages in desorption experiments.
10
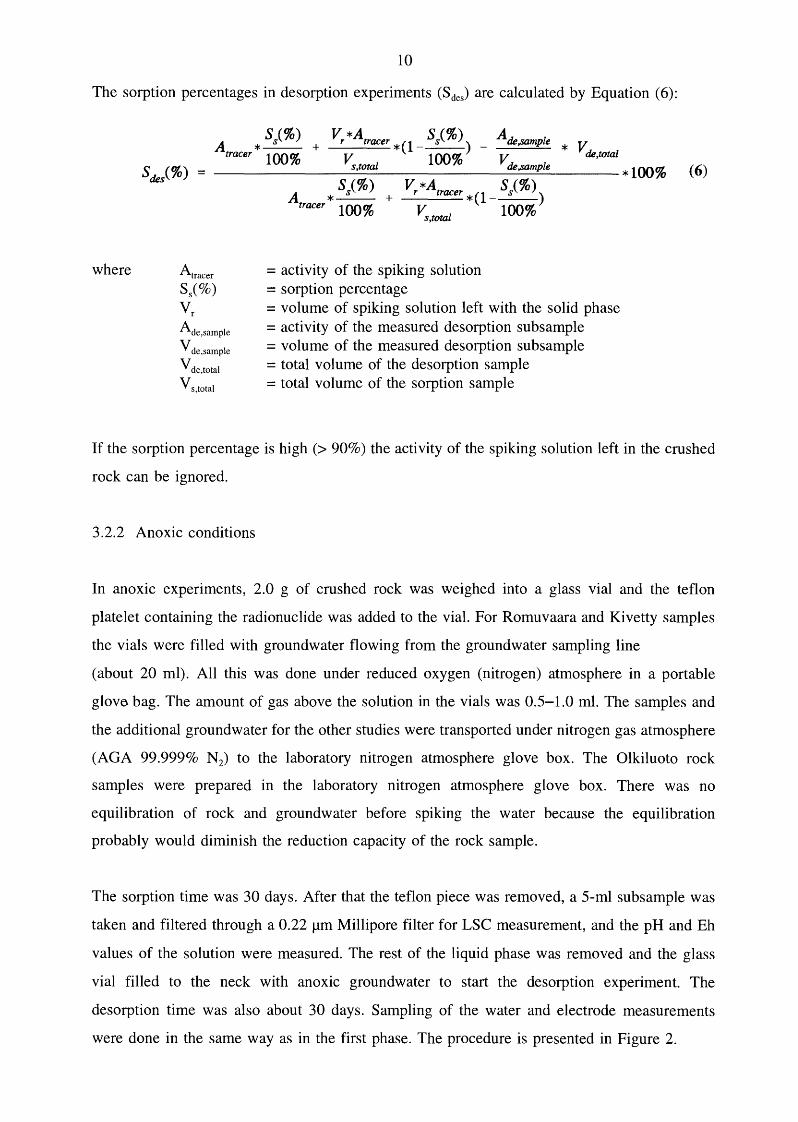
The sorption percentages in desorption experiments (SdeJ are calculated by Equation (6):
where
Ss(%) Vr *Atracer S/%) Ade,sample V Atracer * 100% + *(1---) - V * de,total
... vs,"o"nl 100% de l ., ,.,. ,samp e * 100%
Atracer S/%) vr Ade,sample vde,sample vde,total vs,total
Ss(%) Vr*Atracer S/%) A *-- + *(1---)
tracer 100% vs,total 100%
= activity of the spiking solution = sorption percentage = volume of spiking solution left with the solid phase =activity of the measured desorption subsample = volume of the measured desorption subsample = total volume of the desorption sample = total volume of the sorption sample
(6)
If the sorption percentage is high (> 90%) the activity of the spiking solution left in the crushed
rock can be ignored.
3 .2.2 Anoxic conditions
In anoxic experiments, 2.0 g of crushed rock was weighed into a glass vial and the teflon
platelet containing the radionuclide was added to the vial. For Romuvaara and Kivetty samples
the vials were filled with groundwater flowing from the groundwater sampling line
(about 20 ml). All this was done under reduced oxygen (nitrogen) atmosphere in a portable
glovt} bag. The amount of gas above the solution in the vials was 0.5-1.0 ml. The samples and
the additional groundwater for the other studies were transported under nitrogen gas atmosphere
(AGA 99.999% N2) to the laboratory nitrogen atmosphere glove box. The Olkiluoto rock
samples were prepared in the laboratory nitrogen atmosphere glove box. There was no
equilibration of rock and groundwater before spiking the water because the equilibration
probably would diminish the reduction capacity of the rock sample.
The sorption time was 30 days. After that the teflon piece was removed, a 5-ml subsample was
taken and filtered through a 0.22 1-1m Millipore filter for LSC measurement, and the pH and Eh
values of the solution were measured. The rest of the liquid phase was removed and the glass
vial filled to the neck with anoxic groundwater to start the desorption experiment. The
desorption time was also about 30 days. Sampling of the water and electrode measurements
were done in the same way as in the first phase. The procedure is presented in Figure 2.
11
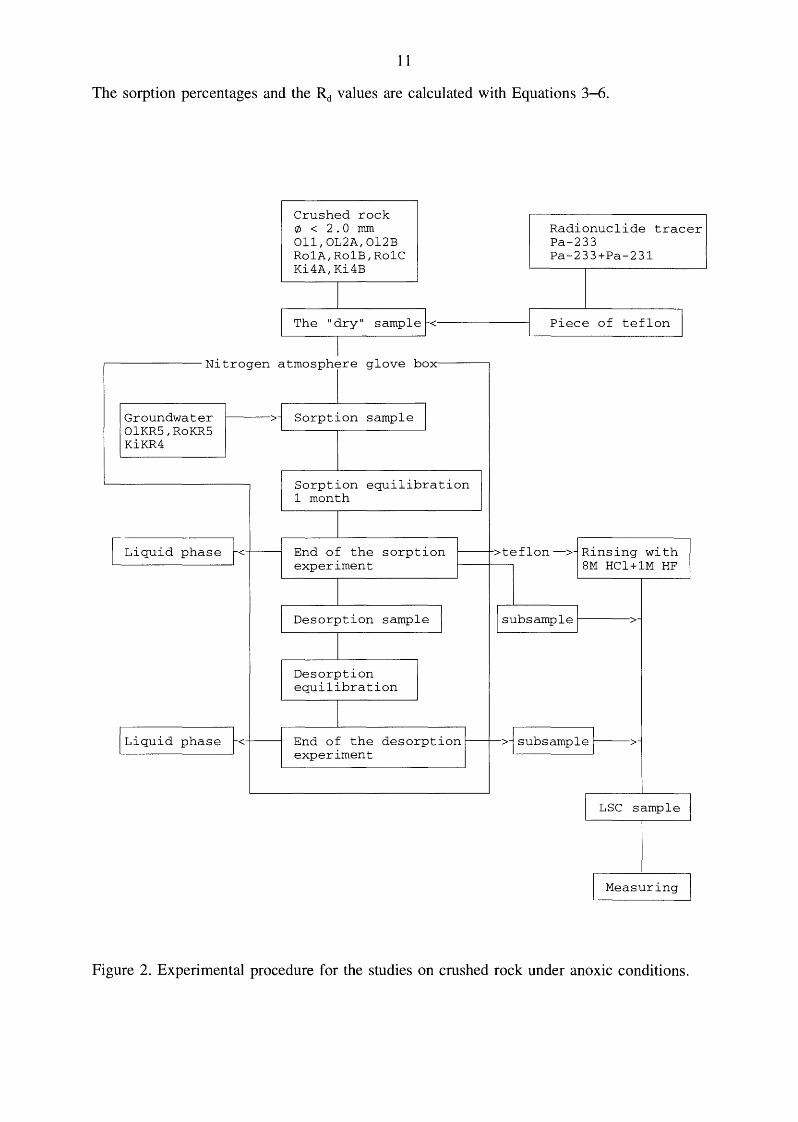
The sorption percentages and the Rd values are calculated with Equations 3-6.
Crushed rock C/J < 2.0 mm Oll,OL2A,Ol2B RolA,RolB,RolC Ki4A,Ki4B
I The "dry" sample <-------i
I
Radionuclide tracer Pa-233 Pa-233+Pa-231
Piece of teflon I
N1trogen atrnosphrre glove box
.-------------,
~--> Sorption sample I Groundwater OlKR5,RoKR5 KiKR4
I Liquid phase ~< r--
I Liquid phase ~< -
Sorption equilibration 1 month
End of the sorption f---- >teflon -> Rinsing with experiment BM HCl+lM HF
Desorption sample I
Desorption equilibration
I subsample ~--->
End of the desorption f---r->4 subsample I > experiment
LSC sample
Measuring
Figure 2. Experimental procedure for the studies on crushed rock under anoxic conditions.
12
3.3 Sorption on thin section samples
The sorption of the tracers on thin sections was studied by batch and autoradiographic methods
/2/. The thin sections were first equilibrated with the groundwaters. The acid solution
containing the radioactive Pa-233 tracer was evaporated gently to dryness and then dissolved in
the appropriate groundwater. The equilibration water was removed and the thin section covered
with 1.0 ml of the freshly spiked ground water. The exposure time was about 18 hours (over
night). After that the spiking solution was removed and the thin section rinsed with 1.0 ml of
groundwater and left to dry. The rinsing solution was added to the removed sample solution.
The Pa-233 in solution was measured by liquid scintillation counting.
Autoradiographs were made from the spiked thin sections. The film was Kodak X -OMA T MA
X-ray film and exposure time was about one month. The autoradiographs were measured by
scanner Ricoh FS2 connected to a PC with the Global Lab Image TM program.
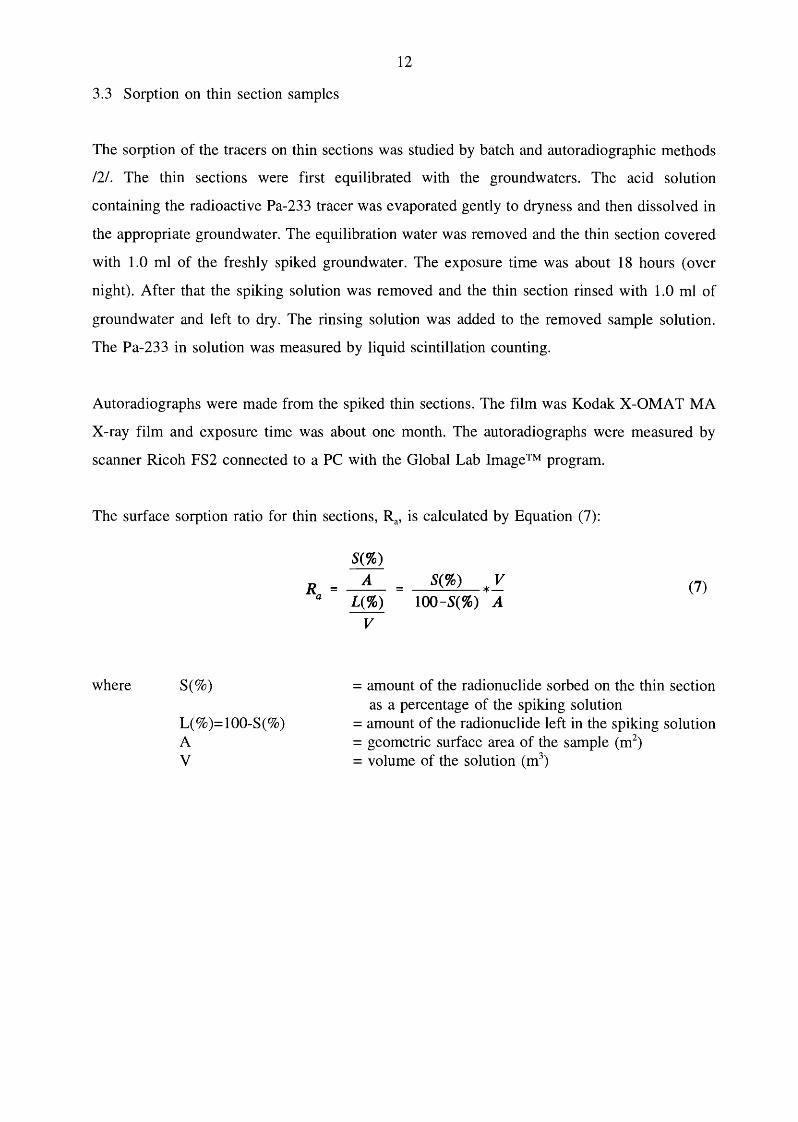
The surface sorption ratio for thin sections, Ra, is calculated by Equation (7):
where S(%)
L(% )=100-S(o/o) A V
Ra =
S(%)
A --L(%)
V
= _S__.;.(%_o_) -*V 100-S(%) A
(7)
= amount of the radionuclide sorbed on the thin section as a percentage of the spiking solution
= amount of the radionuclide left in the spiking solution = geometric surface area of the sample (m2
)
= volume of the solution (m3)
13
4. RESULTS
4.1 Cation exchange capacities, CEC values
The cation exchange capacities of the crushed rock are presented in Table 5. The table shows
the total CEC values derived from changes in the Ag+ concentration and the CEC (total) values
calculated as a sum of the concentrations of the exchangeable cations Ca2+, Mg2+, K+ and Na+.
The CEC values from the experiments with longer shaking time, as well as the experiments with
pH 1.0 AgTU solution, are included in Table 5.
The shaking time seems to have no effect on the CEC values: the difference in CEC values
between 18 hours and one week was negligible. Reducing the pH to 1.0, which was done
mainly to remove all free calcite minerals from the rock samples, on the other hand, increased
the CEC values significantly, especially for the exchangeable cations K+ and Mg2+.
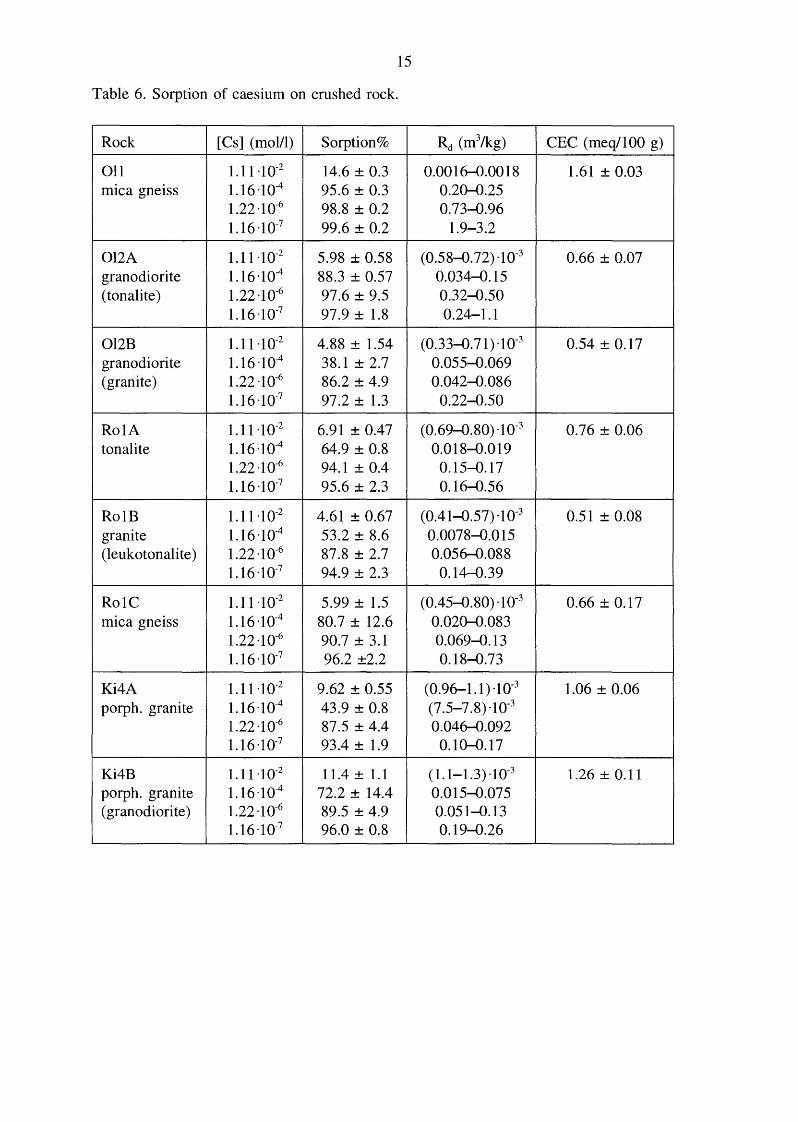
Table 6 summarizes the cation exchange capacities measured for caesium. The values are the
mean values of three parallel samples. The results for individual samples are presented in
Appendix B. The mass distribution ratios, Rct values, of caesium from CsCl solutions on
Olkiluoto, Romuvaara and Kivetty rocks are displayed in Figures 3-5.
The CEC values measured for Cs were comparable to the CEC values measured for AgTU (Ag).
With Ol2A, 012B and all Romuvaara rocks the CEC values for caesium were smaller than for
Ag, which is probably due to too low Cs concentration to saturate all the cation exchange
places. For Romuvaara rocks the CEC value measured for Ag differed from the CEC (total)
value measured according to the exchangeable cations. This is caused by the release of Ca2+,
which is equivalent to about 90% of the total CEC. The high amount of Ca in water is probably
due to both cation exchange as well as solution of some Ca containing mineral.
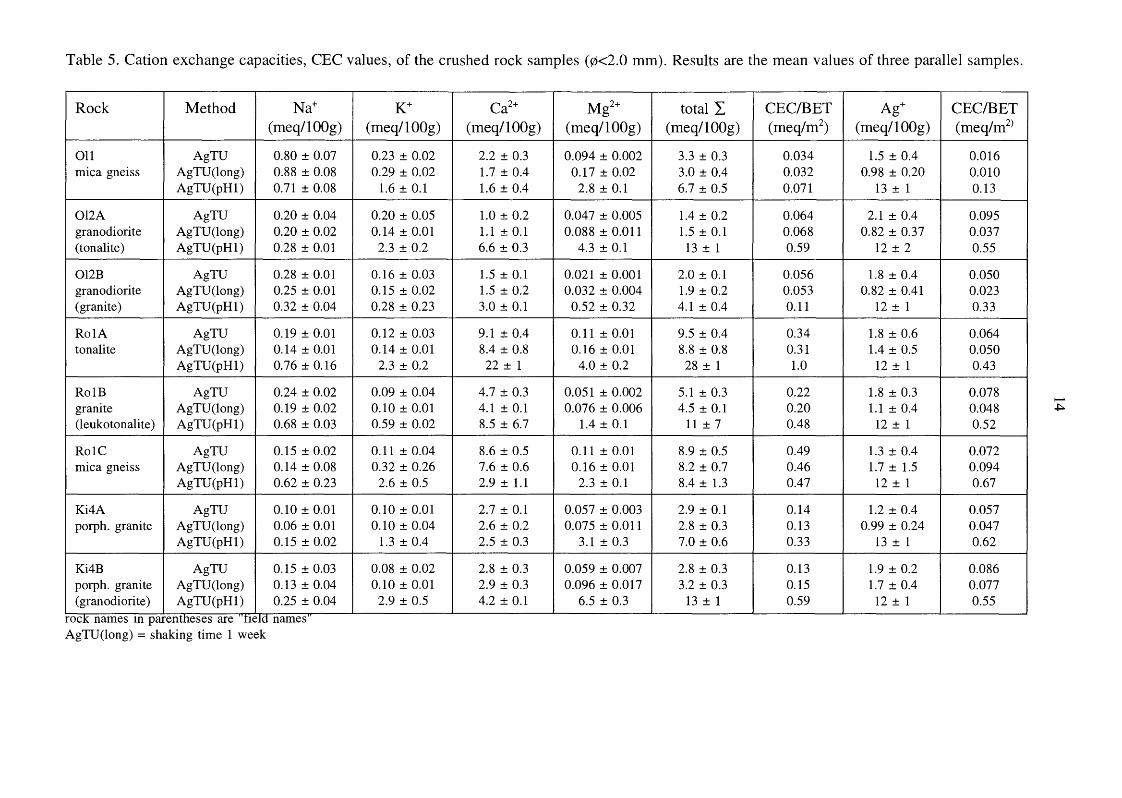
Table 5. Cation exchange capacities, CEC values, of the crushed rock samples ((25<2.0 mm). Results are the mean values of three parallel samples.
Rock Method Na+ K+ Ca2+ Mg2+ total L. CEC/BET Ag+ CEC/BET (meqllOOg) (meq/lOOg) (meq/lOOg) (meq/lOOg) (meq/lOOg) (meq/m2) (meq/lOOg) (meq/m2
>
011 AgTU 0.80 ± 0.07 0.23 ± 0.02 2.2 ± 0.3 0.094 ± 0.002 3.3 ± 0.3 0.034 1.5 ± 0.4 0.016 mica gneiss AgTU(long) 0.88 ± 0.08 0.29 ± 0.02 1.7 ± 0.4 0.17 ± 0.02 3.0 ± 0.4 0.032 0.98 ± 0.20 0.010
AgTU(pH1) 0.71 ± 0.08 1.6 ± 0.1 1.6 ± 0.4 2.8 ± 0.1 6.7 ± 0.5 0.071 13 ± 1 0.13
012A AgTU 0.20 ± 0.04 0.20 ± 0.05 1.0 ± 0.2 0.047 ± 0.005 1.4 ± 0.2 0.064 2.1 ± 0.4 0.095 granodiorite AgTU(long) 0.20 ± 0.02 0.14 ± 0.01 1.1 ±0.1 0.088 ± 0.011 1.5 ± 0.1 0.068 0.82 ± 0.37 0.037 (tonalite) AgTU(pH1) 0.28 ± 0.01 2.3 ± 0.2 6.6 ± 0.3 4.3 ± 0.1 13 ± 1 0.59 12 ± 2 0.55
012B AgTU 0.28 ± 0.01 0.16 ± 0.03 1.5 ± 0.1 0.021 ± 0.001 2.0 ± 0.1 0.056 1.8 ± 0.4 0.050 granodiorite AgTU(long) 0.25 ± 0.01 0.15 ± 0.02 1.5 ± 0.2 0.032 ± 0.004 1.9 ± 0.2 0.053 0.82 ± 0.41 0.023 (granite) AgTU(pH1) 0.32 ± 0.04 0.28 ± 0.23 3.0 ± 0.1 0.52 ± 0.32 4.1±0.4 0.11 12 ± 1 0.33
Ro1A AgTU 0.19 ± 0.01 0.12 ± 0.03 9.1 ±0.4 0.11 ± 0.01 9.5 ± 0.4 0.34 1.8 ± 0.6 0.064 tonalite AgTU(long) 0.14 ± 0.01 0.14 ± 0.01 8.4 ± 0.8 0.16 ± 0.01 8.8 ± 0.8 0.31 1.4 ± 0.5 0.050
AgTU(pHl) 0.76 ± 0.16 2.3 ± 0.2 22 ± 1 4.0 ± 0.2 28 ± 1 1.0 12 ± 1 0.43
Ro1B AgTU 0.24 ± 0.02 0.09 ± 0.04 4.7 ± 0.3 0.051 ± 0.002 5.1 ± 0.3 0.22 1.8 ± 0.3 0.078 !--"
granite AgTU(1ong) 0.19 ± 0.02 0.10 ± 0.01 4.1 ±0.1 0.076 ± 0.006 4.5 ± 0.1 0.20 1.1 ± 0.4 0.048 (leukotonalite) AgTU(pH1) 0.68 ± 0.03 0.59 ± 0.02 8.5 ± 6.7 1.4±0.1 11 ± 7 0.48 12 ± 1 0.52
I
+::-
Ro1C AgTU 0.15 ± 0.02 0.11 ± 0.04 8.6 ± 0.5 0.11 ± 0.01 8.9 ± 0.5 0.49 1.3 ± 0.4 0.072 mica gneiss AgTU(long) 0.14 ± 0.08 0.32 ± 0.26 7.6 ± 0.6 0.16 ± 0.01 8.2 ± 0.7 0.46 1.7 ± 1.5 0.094
AgTU(pH1) 0.62 ± 0.23 2.6 ± 0.5 2.9 ± 1.1 2.3 ± 0.1 8.4 ± 1.3 0.47 12 ± 1 0.67
Ki4A AgTU 0.10 ± 0.01 0.10 ± 0.01 2.7 ± 0.1 0.057 ± 0.003 2.9 ± 0.1 0.14 1.2 ± 0.4 0.057 porph. granite AgTU(long) 0.06 ± 0.01 0.10 ± 0.04 2.6 ± 0.2 0.075 ± 0.011 2.8 ± 0.3 0.13 0.99 ± 0.24 0.047
AgTU(pH1) 0.15 ± 0.02 1.3 ± 0.4 2.5 ± 0.3 3.1 ± 0.3 7.0 ± 0.6 0.33 13 ± 1 0.62
Ki4B AgTU 0.15 ± 0.03 0.08 ± 0.02 2.8 ± 0.3 0.059 ± 0.007 2.8 ± 0.3 0.13 1.9 ± 0.2 0.086 porph. granite AgTU(long) 0.13 ± 0.04 0.10 ± 0.01 2.9 ± 0.3 0.096 ± 0.017 3.2 ± 0.3 0.15 1.7 ± 0.4 0.077 (granodiorite) AgTU(pH1) 0.25 ± 0.04 2.9 ± 0.5 4.2 ± 0.1 6.5 ± 0.3 13 ± 1 0.59 12 ± 1 0.55
-- p L
AgTU(long) =shaking time 1 week
15
Table 6. Sorption of caesium on crushed rock.
Rock [Cs] (mol/1) Sorption% Rd (m3/kg) CEC (meq/1 00 g)
011 1.11 ·1 o-2 14.6 ± 0.3 0.0016-0.0018 1.61 ± 0.03 . . 1.16 ·10-4 95.6 ± 0.3 0.2CHl.25 mica gneiss 1.22·10-6 98.8 ± 0.2 0.73-0.96 1.16·10-7 99.6 ± 0.2 1.9-3.2
012A 1.11 ·1 o-2 5.98 ± 0.58 (0.58-0. 72) ·1 o-3 0.66 ± 0.07 granodiorite 1.16 ·10-4 88.3 ± 0.57 0.034-0.15 (tonalite) 1.22·10-6 97.6 ± 9.5 0.32-0.50
1.16·10-7 97.9 ± 1.8 0.24-1.1
012B 1.11 ·10-2 4.88 ± 1.54 (0.33-0.71) ·1 o-3 0.54 ± 0.17 granodiorite 1.16·10-4 38.1 ± 2.7 0.055-0.069 (granite) 1.22·10-6 86.2 ± 4.9 0.042-0.086
1.16 ·10-7 97.2 ± 1.3 0.22-0.50
Ro1A 1.11 ·10-2 6.91 ± 0.47 (0.69-0.80) ·1 o-3 0.76 ± 0.06 tonalite 1.16 ·10-4 64.9 ± 0.8 0.018-0.019
1.22·10-6 94.1 ± 0.4 0.15-0.17 1.16·10-7 95.6 ± 2.3 0.16-0.56
Ro1B 1.11 ·10-2 4.61 ± 0.67 (0.41-0.57) ·1 o-3 0.51 ± 0.08 granite 1.16 ·10-4 53.2 ± 8.6 0.0078-0.015 (leukotonalite) 1.22·10-6 87.8 ± 2.7 0.056-0.088
1.16·10-7 94.9 ± 2.3 0.14-0.39
Ro1C 1.11 ·10-2 5.99 ± 1.5 (0.45-0.80) ·1 o-3 0.66 ± 0.17 mica gneiss 1.16 ·10-4 80.7 ± 12.6 0.02CHl.083
1.22·10-6 90.7 ± 3.1 0.069-0.13 1.16 ·10-7 96.2 ±2.2 0.18-0.73
Ki4A 1.11 ·10-2 9.62 ± 0.55 (0.96-1.1) ·1 o-3 1.06 ± 0.06 porph. granite 1.16 ·1o-4 43.9 ± 0.8 (7.5-7.8)·10-3
1.22·10-6 87.5 ± 4.4 0.046-0.092 1.16·10-7 93.4 ± 1.9 0.1CHl.17
Ki4B 1.11 ·10-2 11.4 ± 1.1 (1.1-1.3)·10-3 1.26 ± 0.11 porph. granite 1.16 ·1o-4 72.2 ± 14.4 0.015-0.075 (granodiorite) 1.22·10-6 89.5 ± 4.9 0.051--0.13
1.16-10-7 96.0 ± 0.8 0.19-0.26
16
... 011 • 012A .,. 0128
1
~
0 • ... .,. • 0 ...
~ • ........ -1 .., .,. E
"0
a: -2 ~
0)
.2 ...
-3
' -4 I
-10 -9 -8 -7 -6 -5 -4 -3 -2 -1 0
log [Cs]eq (mol/1)
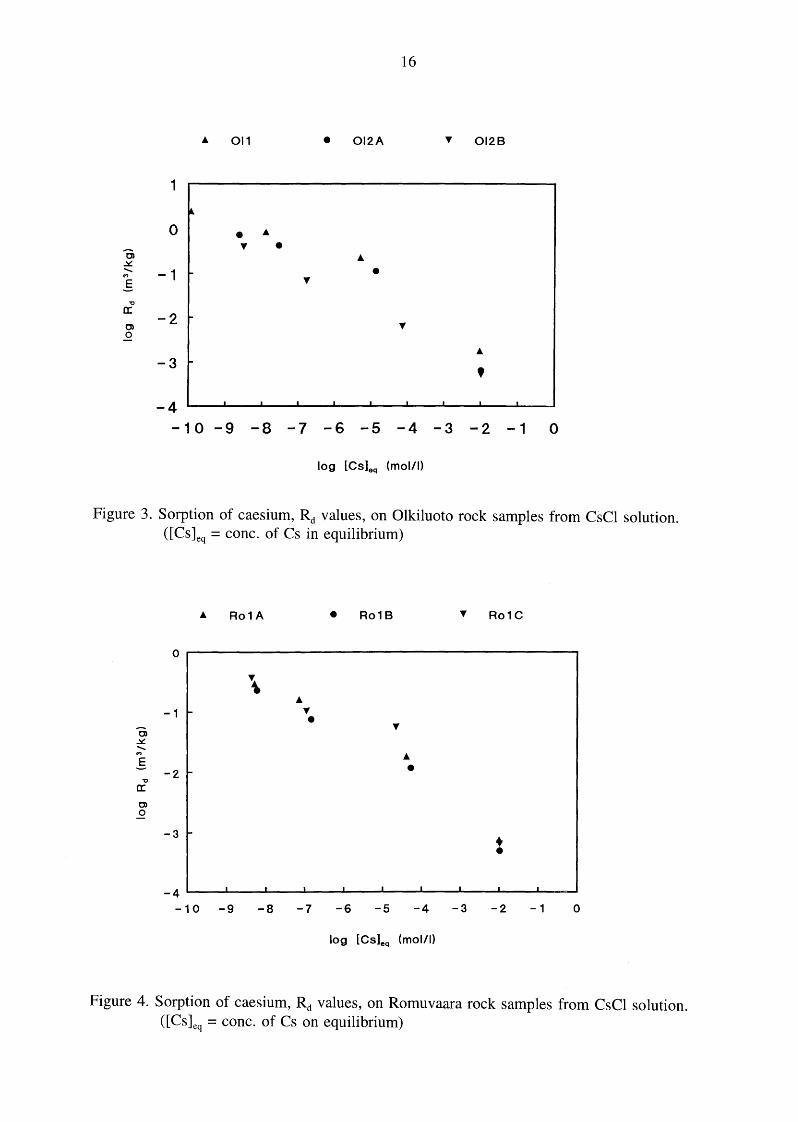
Figure 3. Sorption of caesium, Rd values, on Olkiluoto rock samples from CsCl solution. ([Cs]eq = cone. of Cs in equilibrium)
... Ro1A • Ro1B .,. Ro1C
0
\ ... -1 1-
.,. •
0 .,.
~ ........ .., ... E • -2 1-
"0
a: 0)
_Q
-3 ~
+ •
-4 I I I I I I I I
-10 -9 -8 -7 -6 -5 -4 -3 -2 -1 0
log [Cs]eq (mol! I)
Figure 4. Sorption of caesium, Rd values, on Romuvaara rock samples from CsCl solution. ([Cs]eq = cone. of Cs on equilibrium)
17
... Ki4A • Ki4B
0
• ... -1 f- \
0, • ~
' ... .§
-2 -'t:J
a: 0>
..2
-3 f-
-4 ~---~·------~·------~·---~·----~·---~·~---~·------~·---~·~~ -10 -9 -8 -7 -6 -5 -4 -3 -2 -1 0
log [ Cs]eq (mol! I)
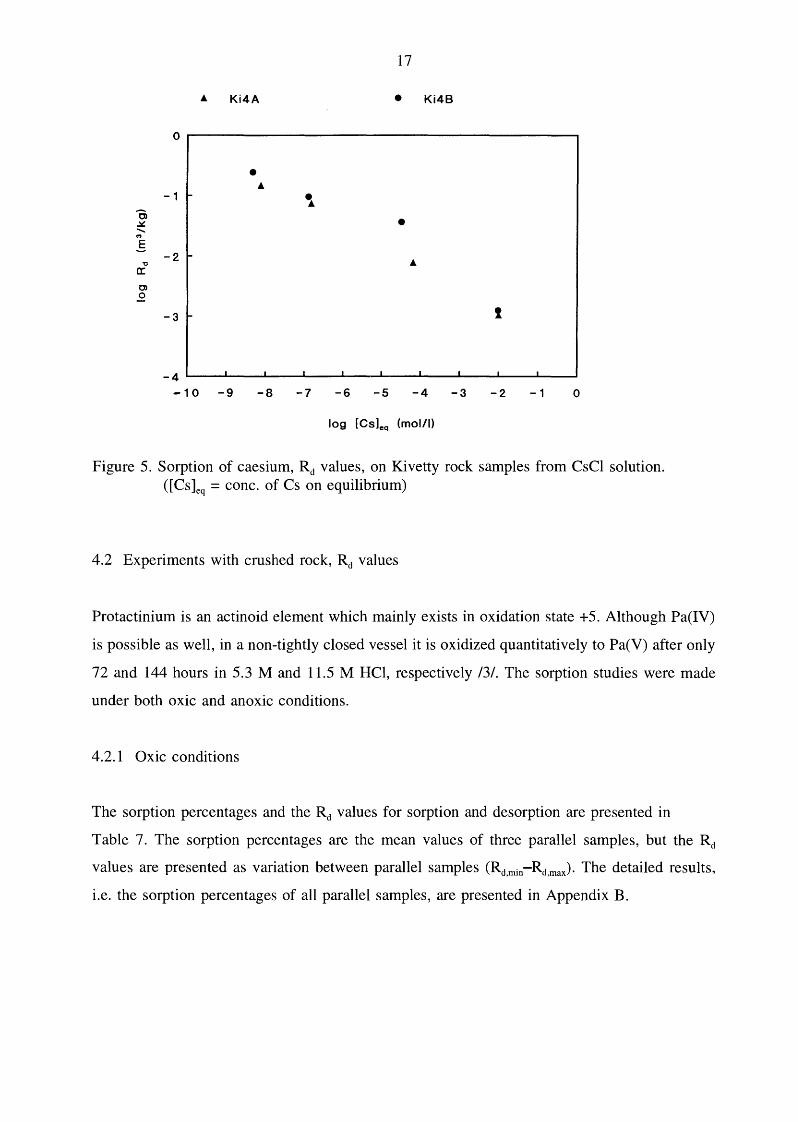
Figure 5. Sorption of caesium, Rd values, on Kivetty rock samples from CsCl solution. ([Cs]eq = cone. of Cs on equilibrium)
4.2 Experiments with crushed rock, Rd values
Protactinium is an actinoid element which mainly exists in oxidation state +5. Although Pa(IV)
is possible as well, in a non-tightly closed vessel it is oxidized quantitatively to Pa(V) after only
72 and 144 hours in 5.3 M and 11.5 M HCl, respectively /3/. The sorption studies were made
under both oxic and anoxic conditions.
4.2.1 Oxic conditions
The sorption percentages and the Rd values for sorption and desorption are presented in
Table 7. The sorption percentages are the mean values of three parallel samples, but the Rd
values are presented as variation between parallel samples (Rd,min-Rd,maJ· The detailed results,
i.e. the sorption percentages of all parallel samples, are presented in Appendix B.
18
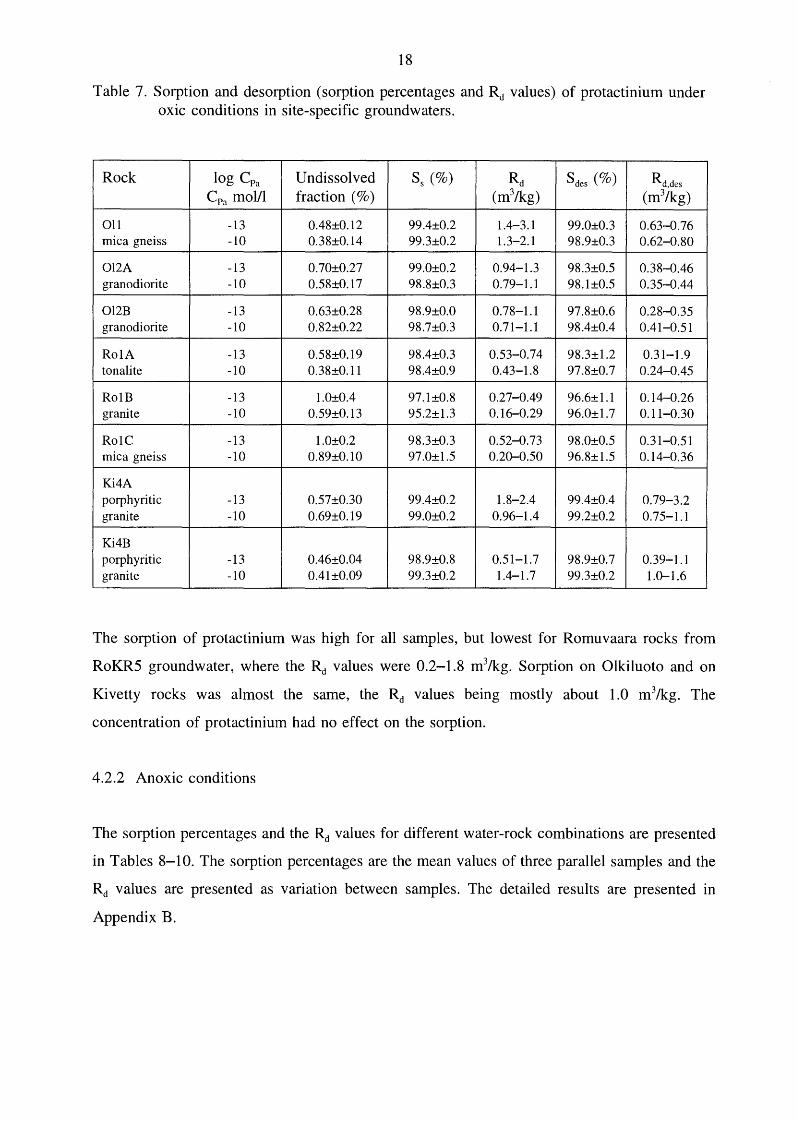
Table 7. Sorption and desorption (sorption percentages and Rd values) of protactinium under oxic conditions in site-specific groundwaters.
Rock log CPa Undissolved ss(%) Rd sdes (%) Rd,des CPa mol/1 fraction (%) (m3/kg) (m3/kg)
011 -13 0.48±0.12 99.4±0.2 1.4-3.1 99.0±0.3 0.63-0.76 mica gneiss -10 0.38±0.14 99.3±0.2 1.3-2.1 98.9±0.3 0.62-0.80
012A -13 0.70±0.27 99.0±0.2 0.94-1.3 98.3±0.5 0.38-0.46 granodiorite -10 0.58±0.17 98.8±0.3 0.79-1.1 98.1±0.5 0.35-0.44
012B -13 0.63±0.28 98.9±0.0 0.78-1.1 97.8±0.6 0.28-0.35 granodi orite -10 0.82±0.22 98.7±0.3 0.71-1.1 98.4±0.4 0.41-0.51
Ro1A -13 0.58±0.19 98.4±0.3 0.53-0.74 98.3±1.2 0.31-1.9 tonalite -10 0.38±0.11 98.4±0.9 0.43-1.8 97.8±0.7 0.24-0.45
Ro1B -13 1.0±0.4 97.1±0.8 0.27-0.49 96.6±1.1 0.14-0.26 granite -10 0.59±0.13 95.2±1.3 0.16-0.29 96.0±1.7 0.11-0.30
Ro1C -13 1.0±0.2 98.3±0.3 0.52-0.73 98.0±0.5 0.31-0.51 mica gneiss -10 0.89±0.10 97.0±1.5 0.2(}-0.50 96.8±1.5 0.14-0.36
Ki4A porphyritic -13 0.57±0.30 99.4±0.2 1.8-2.4 99.4±0.4 0.79-3.2 granite -10 0.69±0.19 99.0±0.2 0.96-1.4 99.2±0.2 0.75-1.1
Ki4B porphyritic -13 0.46±0.04 98.9±0.8 0.51-1.7 98.9±0.7 0.39-1.1 granite -10 0.41±0.09 99.3±0.2 1.4-1.7 99.3±0.2 1.(}-1.6
The sorption of protactinium was high for all samples, but lowest for Romuvaara rocks from
RoKR5 groundwater, where the Rd values were 0.2-1.8 m3/kg. Sorption on Olkiluoto and on
Kivetty rocks was almost the same, the Rd values being mostly about 1.0 m3/kg. The
concentration of protactinium had no effect on the sorption.
4.2.2 Anoxic conditions
The sorption percentages and the Rd values for different water-rock combinations are presented
in Tables 8-10. The sorption percentages are the mean values of three parallel samples and the
Rd values are presented as variation between samples. The detailed results are presented in
Appendix B.
19
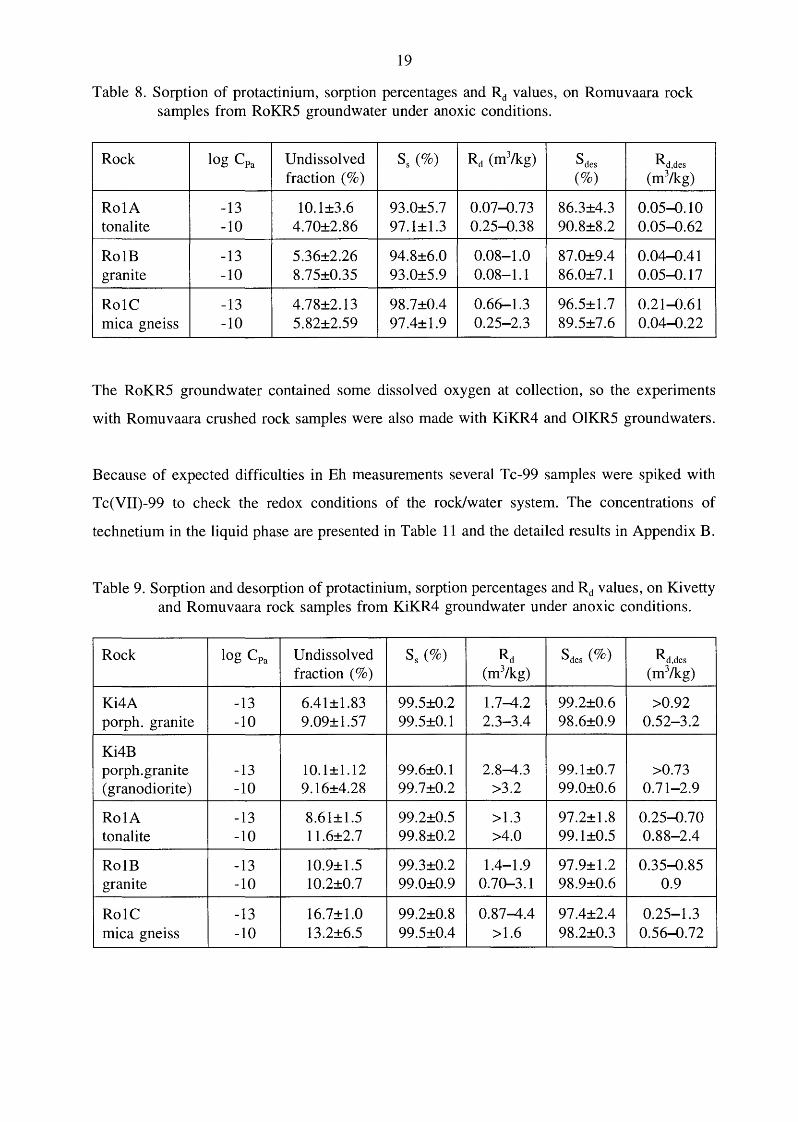
Table 8. Sorption of protactinium, sorption percentages and Rct values, on Romuvaara rock samples from RoKR5 groundwater under anoxic conditions.
Rock log CPa Undissolved ss(%) Rct (m3/kg) sdes Rd,des fraction (%) (%) (m3/kg)
Ro1A -13 10.1±3.6 93.0±5.7 0.07--0.73 86.3±4.3 0.05--0.10 tonalite -10 4.70±2.86 97.1±1.3 0.25--0.38 90.8±8.2 0.05--0.62
Ro1B -13 5.36±2.26 94.8±6.0 0.08-1.0 87.0±9.4 0.04--0.41 granite -10 8.75±0.35 93.0±5.9 0.08-1.1 86.0±7.1 0.05--0.17
Ro1C -13 4.78±2.13 98.7±0.4 0.66-1.3 96.5±1.7 0.21--0.61 . .
-10 5.82±2.59 97.4±1.9 0.25-2.3 89.5±7.6 0.04--0.22 mica gneiss
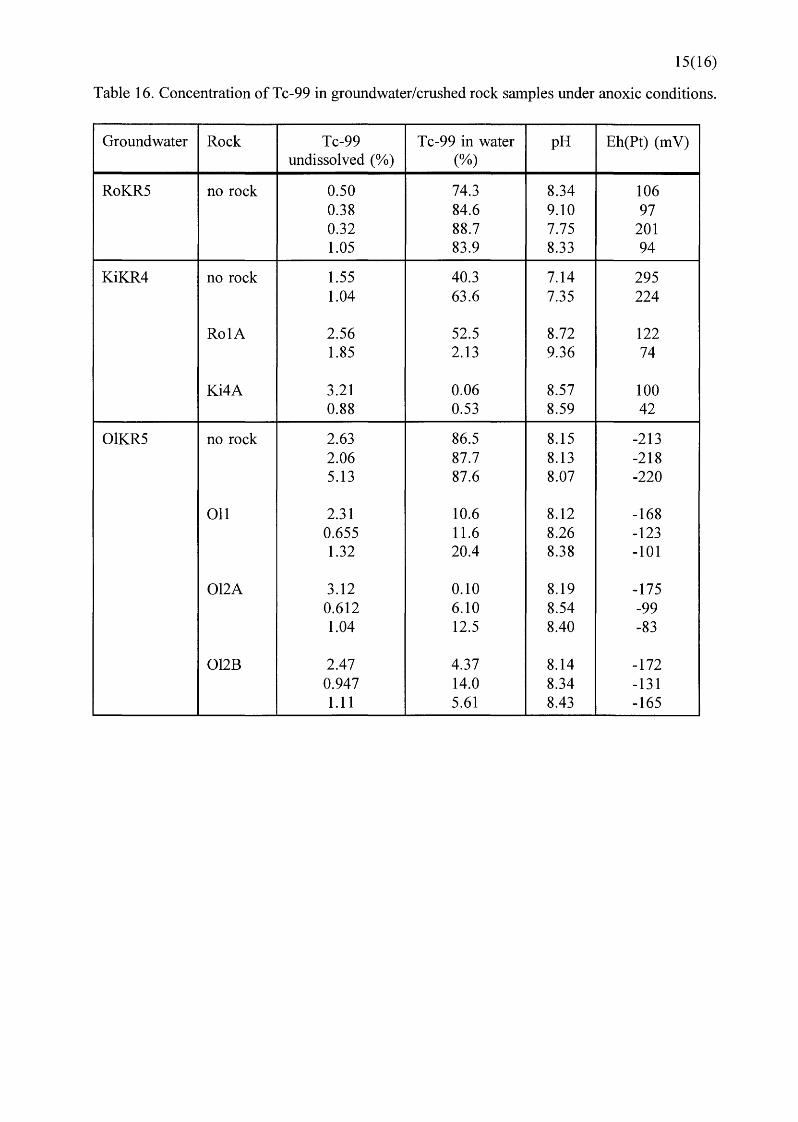
The RoKR5 groundwater contained some dissolved oxygen at collection, so the experiments
with Romuvaara crushed rock samples were also made with KiKR4 and OlKR5 groundwaters.
Because of expected difficulties in Eh measurements several Tc-99 samples were spiked with
Tc(VII)-99 to check the redox conditions of the rock/water system. The concentrations of
technetium in the liquid phase are presented in Table 11 and the detailed results in Appendix B.
Table 9. Sorption and desorption of protactinium, sorption percentages and Rct values, on Kivetty and Romuvaara rock samples from KiKR4 groundwater under anoxic conditions.
Rock log CPa Undissolved ss(%) Rct sdes (%) Rd,des fraction (%) (m3/kg) (m3/kg)
Ki4A -13 6.41±1.83 99.5±0.2 1.7-4.2 99.2±0.6 >0.92 porph. granite -10 9.09±1.57 99.5±0.1 2.3-3.4 98.6±0.9 0.52-3.2
Ki4B porph.granite -13 10.1±1.12 99.6±0.1 2.8--4.3 99.1±0.7 >0.73 (granodiorite) -10 9.16±4.28 99.7±0.2 >3.2 99.0±0.6 0.71-2.9
Ro1A -13 8.61±1.5 99.2±0.5 >1.3 97.2±1.8 0.25--0.70 tonalite -10 11.6±2.7 99.8±0.2 >4.0 99.1±0.5 0.88-2.4
Ro1B -13 10.9±1.5 99.3±0.2 1.4-1.9 97.9±1.2 0.35--0.85 granite -10 10.2±0.7 99.0±0.9 0.70-3.1 98.9±0.6 0.9
Ro1C -13 16.7±1.0 99.2±0.8 0.87-4.4 97.4±2.4 0.25-1.3 . .
-10 13.2±6.5 99.5±0.4 >1.6 98.2±0.3 0.56--0.72 mica gneiss
20
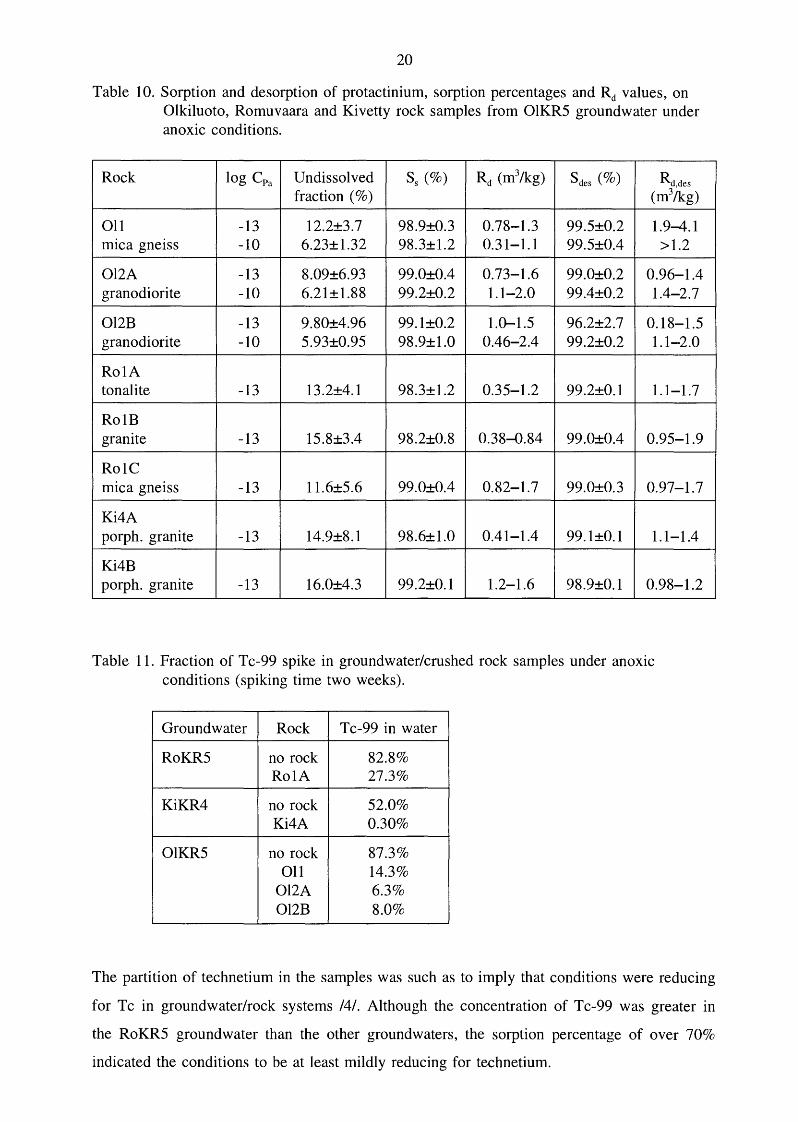
Table 10. Sorption and desorption of protactinium, sorption percentages and Rd values, on Olkiluoto, Romuvaara and Kivetty rock samples from 01KR5 groundwater under anoxic conditions.
Rock log CPa Undissolved ss(%) Rd (m3/kg) sdes (%) Rd,des fraction (%) (m3/kg)
011 -13 12.2±3.7 98.9±0.3 0.78-1.3 99.5±0.2 1.9-4.1 mica gneiss -10 6.23±1.32 98.3±1.2 0.31-1.1 99.5±0.4 >1.2
012A -13 8.09±6.93 99.0±0.4 0.73-1.6 99.0±0.2 0.96-1.4 granodiorite -10 6.21±1.88 99.2±0.2 1.1-2.0 99.4±0.2 1.4-2.7
012B -13 9.80±4.96 99.1±0.2 1.0-1.5 96.2±2.7 0.18-1.5 granodiorite -10 5.93±0.95 98.9±1.0 0.46-2.4 99.2±0.2 1.1-2.0
Ro1A tonalite -13 13.2±4.1 98.3±1.2 0.35-1.2 99.2±0.1 1.1-1.7
Ro1B granite -13 15.8±3.4 98.2±0.8 0.38-0.84 99.0±0.4 0.95-1.9
Ro1C . .
-13 11.6±5.6 99.0±0.4 0.82-1.7 99.0±0.3 0.97-1.7 mica gneiss
Ki4A porph. granite -13 14.9±8.1 98.6±1.0 0.41-1.4 99.1±0.1 1.1-1.4
Ki4B porph. granite -13 16.0±4.3 99.2±0.1 1.2-1.6 98.9±0.1 0.98-1.2
Table 11. Fraction of Tc-99 spike in groundwater/crushed rock samples under anoxic conditions (spiking time two weeks).
Ground water Rock Tc-99 in water
RoKR5 no rock 82.8% Ro1A 27.3%
KiKR4 no rock 52.0% Ki4A 0.30%
01KR5 no rock 87.3% 011 14.3%
012A 6.3% 012B 8.0%
The partition of technetium in the samples was such as to imply that conditions were reducing
for Tc in groundwater/rock systems /4/. Although the concentration of Tc-99 was greater in
the RoKR5 groundwater than the other groundwaters, the sorption percentage of over 70%
indicated the conditions to be at least mildly reducing for technetium.
21
The pH and Eh(Pt) values of the samples were also measured, but because of the lack of a
suitable redox pair, the Eh values of the RoKR5 and KiKR4 groundwaters differed between
parallel samples. The readings were also associated with uncertainties The measured Eh values
for RoKR5 groundwater were -121- +464 m V and for KiKR4 groundwater +54- +364 m V and
-266- +300 m V for Kivetty and Romuvaara rock samples, respectively. For 01KR5 and
Palmottu groundwaters there was a suitable redox pair, so the Eh values did not differ so much
between parallel samples. The Eh values for 01KR5 were -9- -106 m V, -13- -161 m V and
-36- -89 m V for Olkiluoto, Romuvaara and Kivetty rock samples, respectively. The pH values
were 8.0-8.6 (mainly 8.3), 7.7-9.1 (mainly 8.0) and 8.1-8.7 (mainly 8.4) for 01KR5, RoKR5
and KiKR4 groundwaters, respectively. The results of the pH and of the Eh measurements are
presented in Appendix B, along with the sorption percentages and Rd values for each parallel
sample.
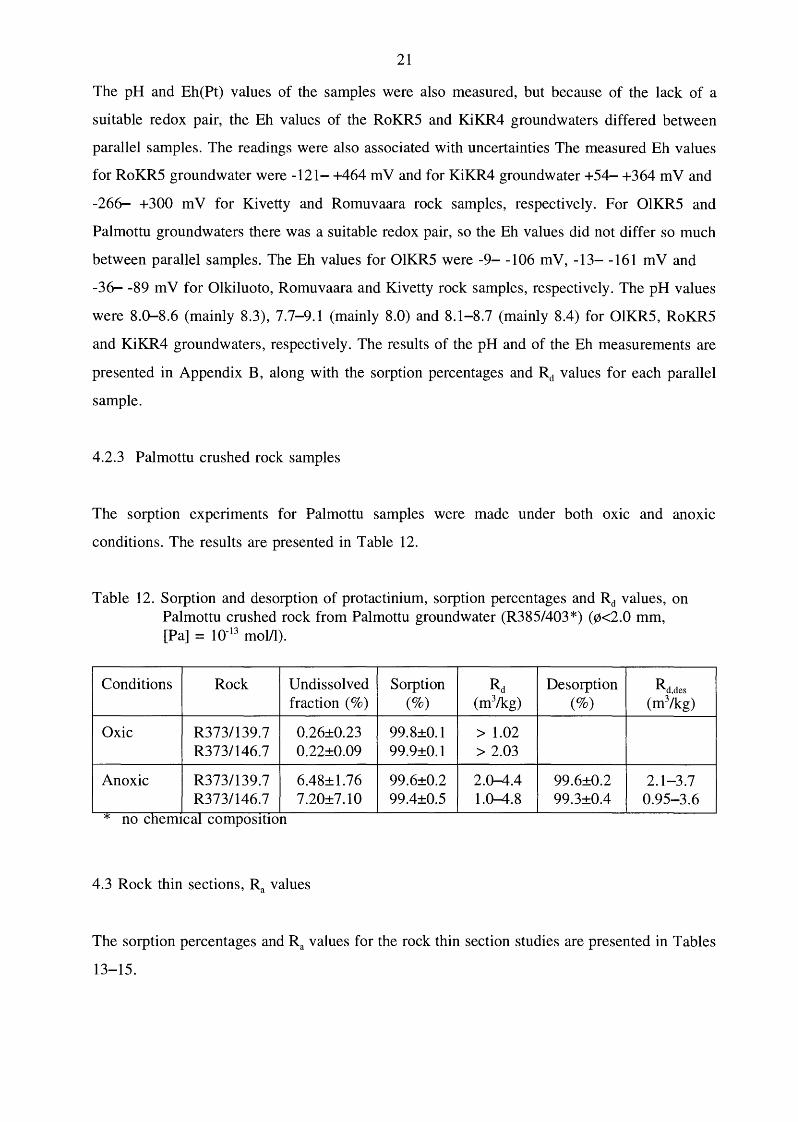
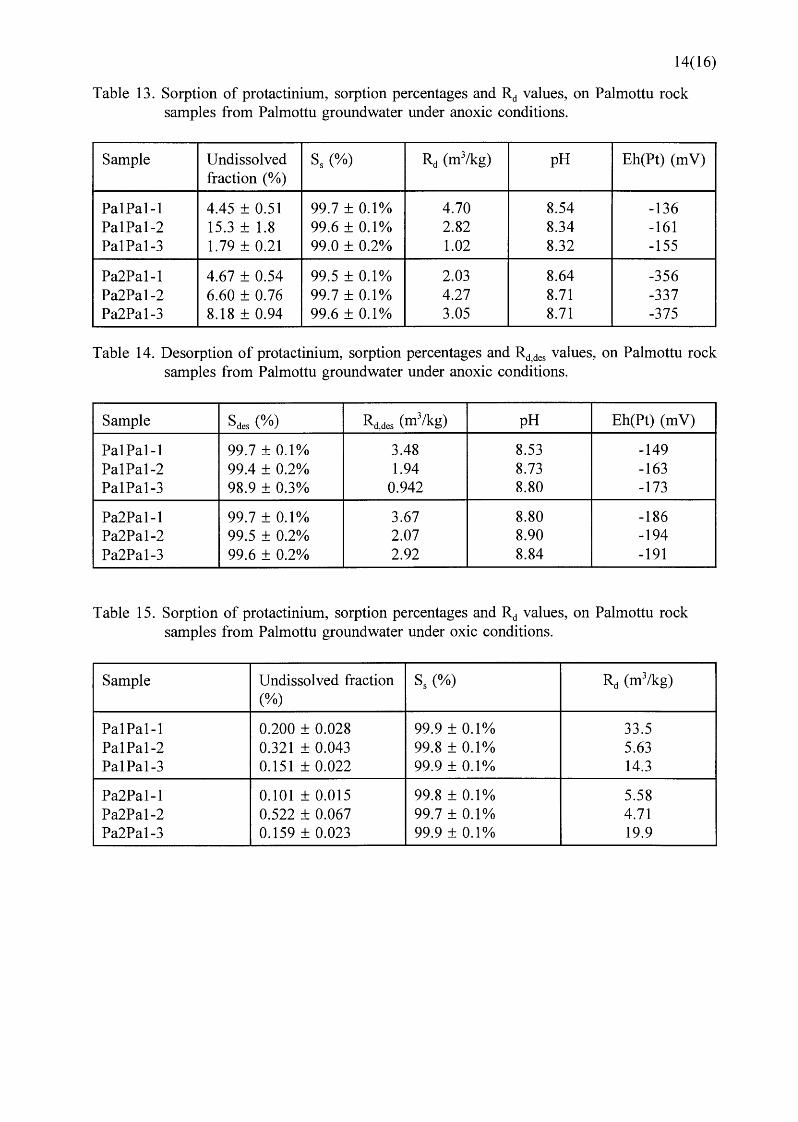
4.2.3 Palmottu crushed rock samples
The sorption experiments for Palmottu samples were made under both oxic and anoxtc
conditions. The results are presented in Table 12.
Table 12. Sorption and desorption of protactinium, sorption percentages and Rd values, on Palmottu crushed rock from Palmottu groundwater (R385/403*) (~<2.0 mm, [Pa] = 10-13 mol/1).
Conditions Rock Undissolved Sorption Rct Desorption Rd,des fraction (%) (%) (m3/kg) (%) (m3/kg)
Oxic R373/139.7 0.26±0.23 99.8±0.1 > 1.02 R373/146.7 0.22±0.09 99.9±0.1 > 2.03
Anoxic R373/139.7 6.48±1.76 99.6±0.2 2.0-4.4 99.6±0.2 2.1-3.7 R373/146.7 7.20±7.10 99.4±0.5 1.0-4.8 99.3±0.4 0.95-3.6
* no chemtcal corn osttlon p
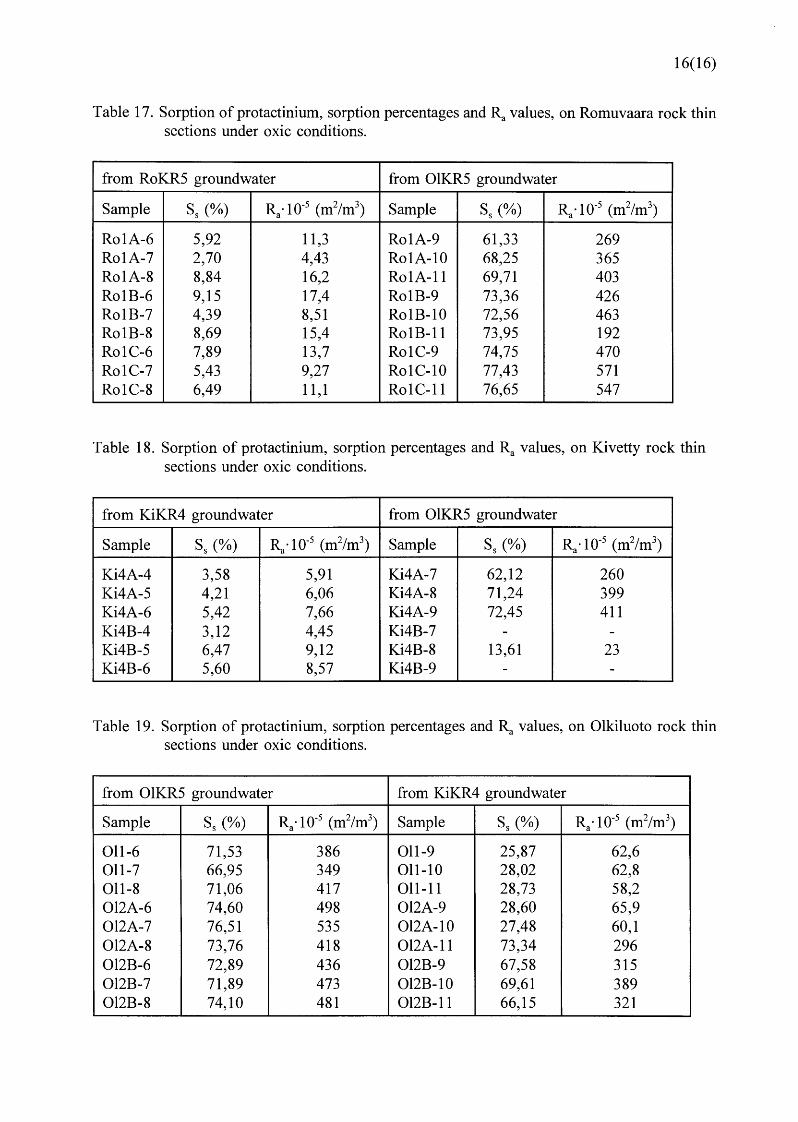
4.3 Rock thin sections, Ra values
The sorption percentages and Ra values for the rock thin section studies are presented in Tables
13-15.
22
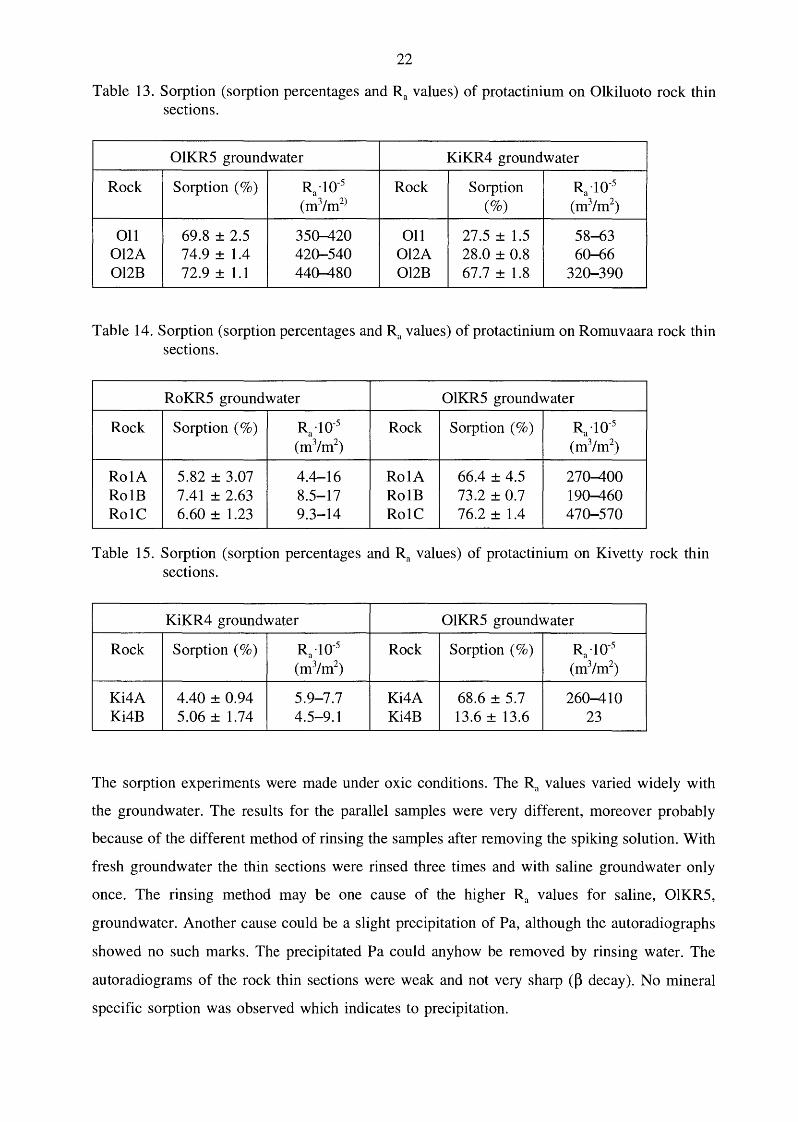
Table 13. Sorption (sorption percentages and Ra values) of protactinium on Olkiluoto rock thin sections.
01KR5 groundwater KiKR4 groundwater
Rock Sorption (%) R ·1o-5 a Rock Sorption R ·10-5
a (m3/m2) (%) (m3/m2)
011 69.8 ± 2.5 350-420 011 27.5 ± 1.5 58-63 012A 74.9 ± 1.4 420-540 Ol2A 28.0 ± 0.8 60-66 012B 72.9 ± 1.1 440-480 Ol2B 67.7 ± 1.8 320-390
Table 14. Sorption (sorption percentages and Ra values) of protactinium on Romuvaara rock thin sections.
RoKR5 groundwater 01KR5 groundwater
Rock Sorption (%) R ·10-5 a Rock Sorption (%) R ·10-5
a (m3/m2) (m3/m2)
Ro1A 5.82 ± 3.07 4.4-16 Ro1A 66.4 ± 4.5 270-400 Ro1B 7.41 ± 2.63 8.5-17 Ro1B 73.2 ± 0.7 190-460 Ro1C 6.60 ± 1.23 9.3-14 Ro1C 76.2 ± 1.4 470-570
Table 15. Sorption (sorption percentages and Ra values) of protactinium on Kivetty rock thin sections.
KiKR4 groundwater 01KR5 groundwater
Rock Sorption (%) R ·10-5 a Rock Sorption (%) R ·10-5
a (m3/m2) (m3/m2)
Ki4A 4.40 ± 0.94 5.9-7.7 Ki4A 68.6 ± 5.7 260-410 Ki4B 5.06 ± 1.74 4.5-9.1 Ki4B 13.6 ± 13.6 23
The sorption experiments were made under oxic conditions. The Ra values varied widely with
the groundwater. The results for the parallel samples were very different, moreover probably
because of the different method of rinsing the samples after removing the spiking solution. With
fresh groundwater the thin sections were rinsed three times and with saline groundwater only
once. The rinsing method may be one cause of the higher Ra values for saline, 01KR5,
groundwater. Another cause could be a slight precipitation of Pa, although the autoradiographs
showed no such marks. The precipitated Pa could anyhow be removed by rinsing water. The
autoradiograms of the rock thin sections were weak and not very sharp CP decay). No mineral
specific sorption was observed which indicates to precipitation.
23
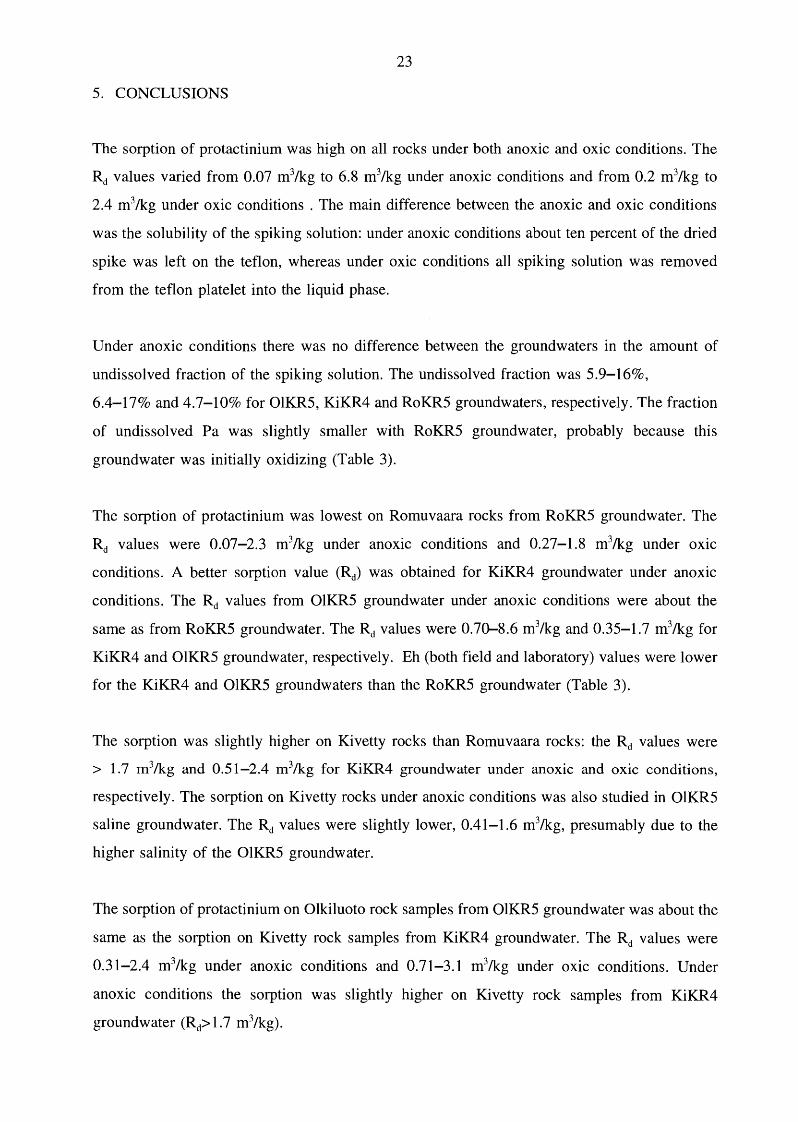
5. CONCLUSIONS
The sorption of protactinium was high on all rocks under both anoxic and oxic conditions. The
Rd values varied from 0.07 m3/kg to 6.8 m3/kg under anoxic conditions and from 0.2 m3/kg to
2.4 m3 /kg under oxic conditions . The main difference between the anoxic and oxic conditions
was the solubility of the spiking solution: under anoxic conditions about ten percent of the dried
spike was left on the teflon, whereas under oxic conditions all spiking solution was removed
from the teflon platelet into the liquid phase.
Under anoxic conditions there was no difference between the groundwaters in the amount of
undissolved fraction of the spiking solution. The undissolved fraction was 5.9-16%,
6.4-17% and 4.7-10% for 01KR5, KiKR4 and RoKR5 groundwaters, respectively. The fraction
of undissolved Pa was slightly smaller with RoKR5 groundwater, probably because this
groundwater was initially oxidizing (Table 3).
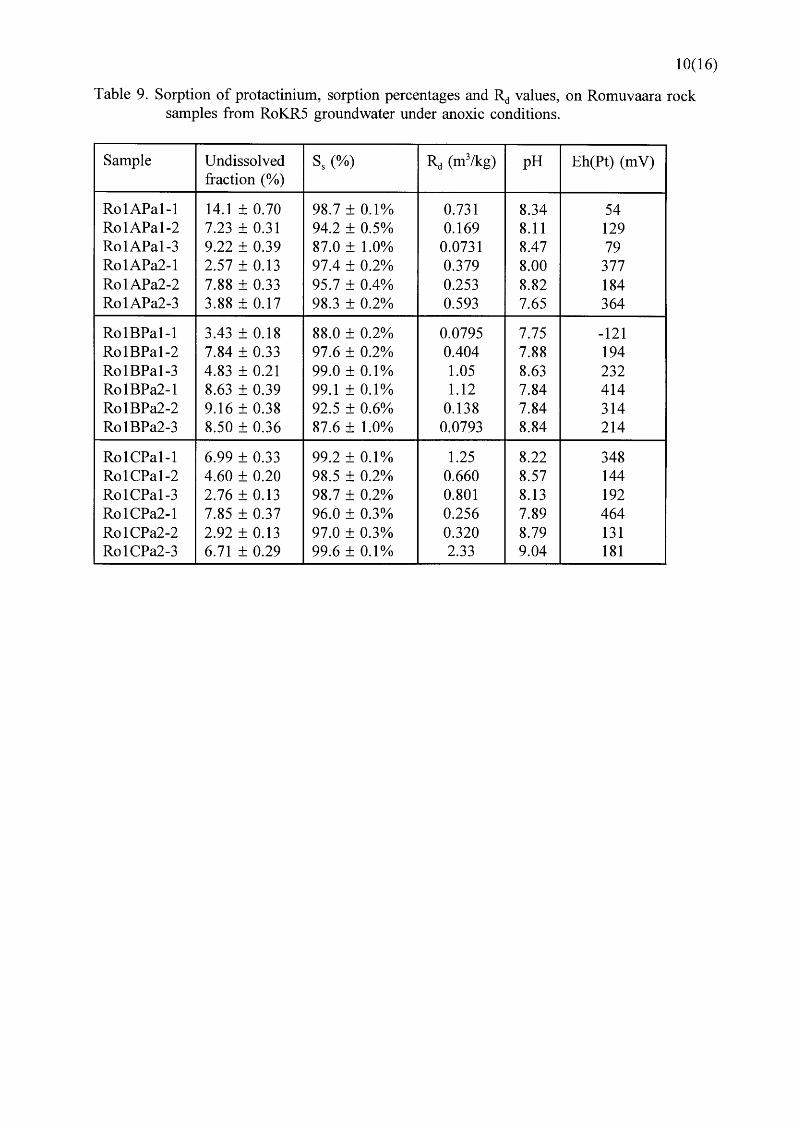
The sorption of protactinium was lowest on Romuvaara rocks from RoKR5 groundwater. The
Rd values were 0.07-2.3 m3/kg under anoxic conditions and 0.27-1.8 m3/kg under oxic
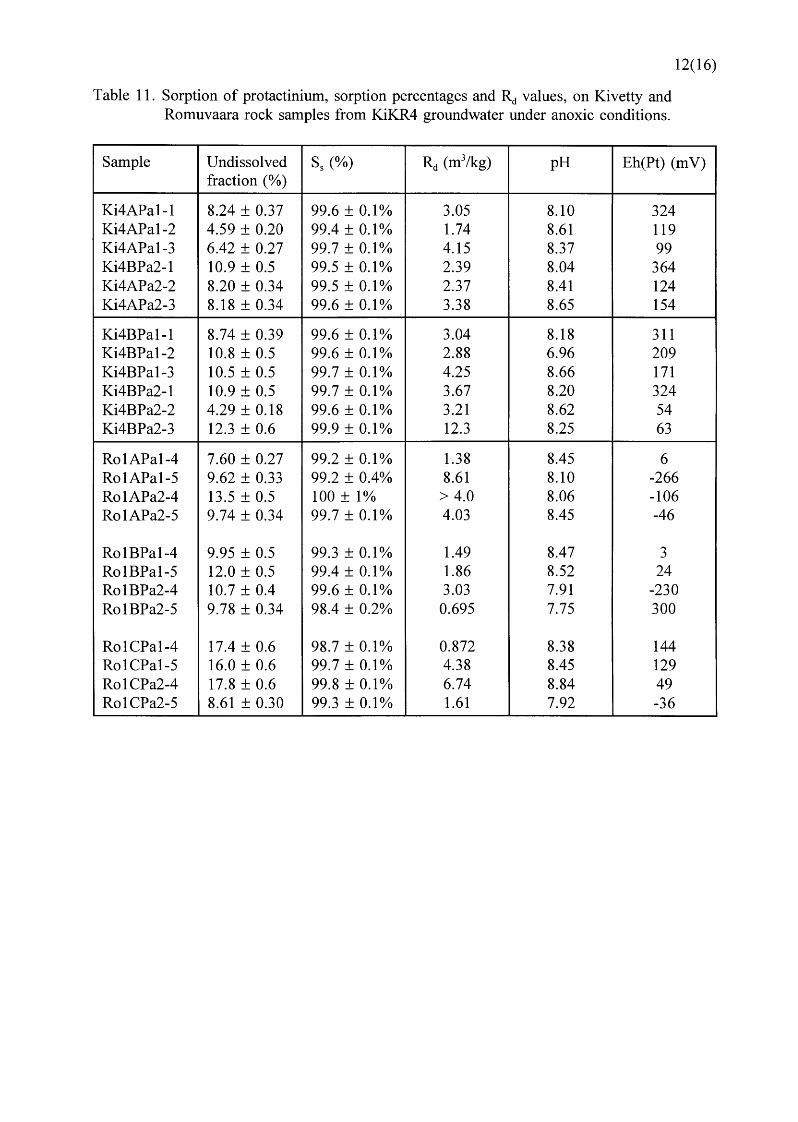
conditions. A better sorption value (Rd) was obtained for KiKR4 groundwater under anoxic
conditions. The Rd values from 01KR5 groundwater under anoxic conditions were about the
same as from RoKR5 groundwater. The Rd values were 0.70-8.6 m3/kg and 0.35-1.7 m3/kg for
KiKR4 and 01KR5 groundwater, respectively. Eh (both field and laboratory) values were lower
for the KiKR4 and 01KR5 groundwaters than the RoKR5 groundwater (Table 3).
The sorption was slightly higher on Kivetty rocks than Romuvaara rocks: the Rd values were
> 1.7 m3/kg and 0.51-2.4 m3/kg for KiKR4 groundwater under anoxic and oxic conditions,
respectively. The sorption on Kivetty rocks under anoxic conditions was also studied in 01KR5
saline groundwater. The Rd values were slightly lower, 0.41-1.6 m3/kg, presumably due to the
higher salinity of the 01KR5 groundwater.
The sorption of protactinium on Olkiluoto rock samples from 01KR5 ground water was about the
same as the sorption on Kivetty rock samples from KiKR4 groundwater. The Rd values were
0.31-2.4 m3/kg under anoxic conditions and 0.71-3.1 m3/kg under oxic conditions. Under
anoxic conditions the sorption was slightly higher on Kivetty rock samples from KiKR4
ground water (Rct> 1.7 m3/kg).
24
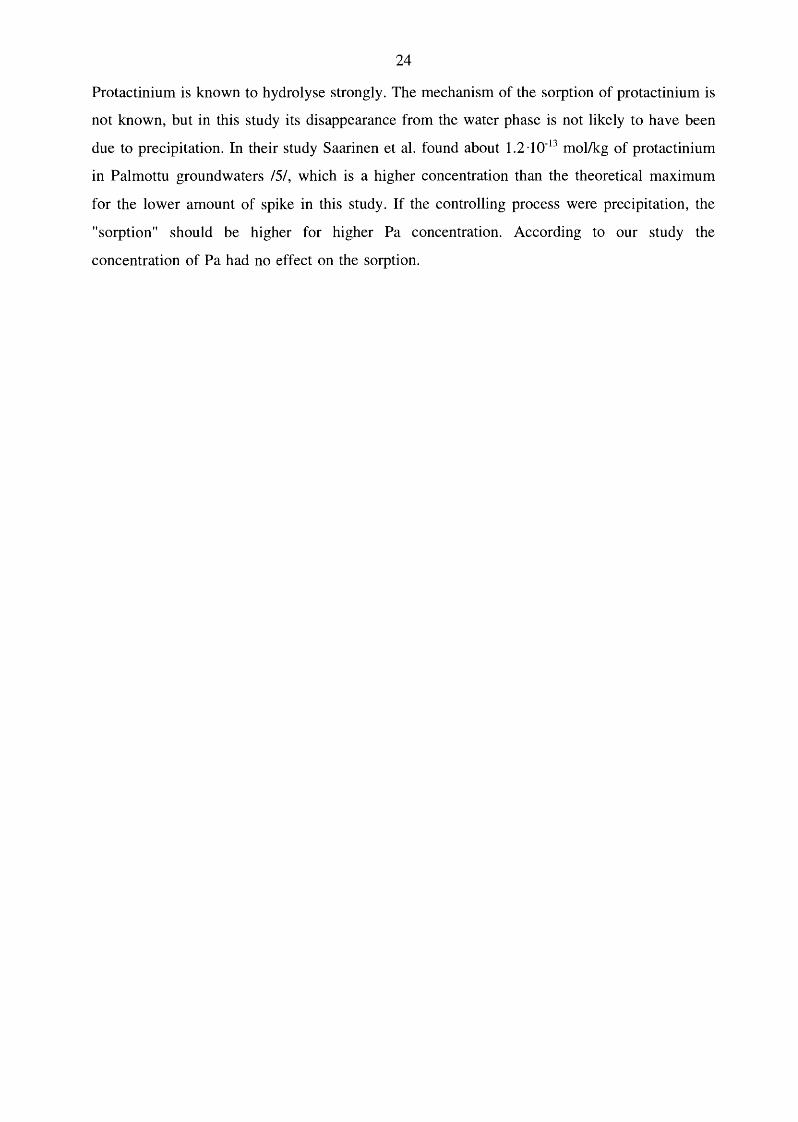
Protactinium is known to hydrolyse strongly. The mechanism of the sorption of protactinium is
not known, but in this study its disappearance from the water phase is not likely to have been
due to precipitation. In their study Saarinen et al. found about 1.2 ·1 o-13 mol/kg of protactinium
in Palmottu groundwaters /5/, which is a higher concentration than the theoretical maximum
for the lower amount of spike in this study. If the controlling process were precipitation, the
"sorption" should be higher for higher Pa concentration. According to our study the
concentration of Pa had no effect on the sorption.
25
6 LITERATURE
1. Chhabra, R., Pleysier, J. & Cremers, A.: ( 197 5) The measurement of the cation exchange capacity and exchangeable cations in soils: a new method. Proc. Int. Clay Conf. 1975, Applied Publishing Ltd, Wilmele, Illinois 60091, USA.
2. Lindberg, A., Pinnioja, S. & Nikula, A.:(l987) The sorption of radionuclides on bedrock, mineralogical effects and autoradiographic method. Report YJT -83-02, 26 p, Nuclear Waste Commission of Finnish Power Companies, Helsinki 1987 .
3. Pal'shin, E.S., Myasoedov, B.F. & Davydov, A.V., 1970. Analytical chemistry of protactinium, Ann Arbon-Humphrey Science Publishers, London.
4. Hakanen, M. & Lindberg, A: ( 1995) Technetium, neptunium and uranium in simulated anaerobic ground water conditions. Report YJT -95-02, Nuclear Waste Commission of Finnish Power Companies, Helsinki 1995.
5. Saarinen, L. & Suksi, 1.:(1995) Distribution of Pa-231 and Ra-226 in rock - an indicator of rock matrix diffusion. Report YJT -95-01, 25 p, Nuclear Waste Commission of Finnish Power Companies, Helsinki 1995.
APPENDIX A.
Table 1.
Table 2.
1(3)
Mineral composition of thin sections (Vol.-%) calculated by point counting method (500 points/sample).
Chemical composition of the 01KR5, RoKR5 and KiKR4 groundwaters (IVO Chem.Lab.)
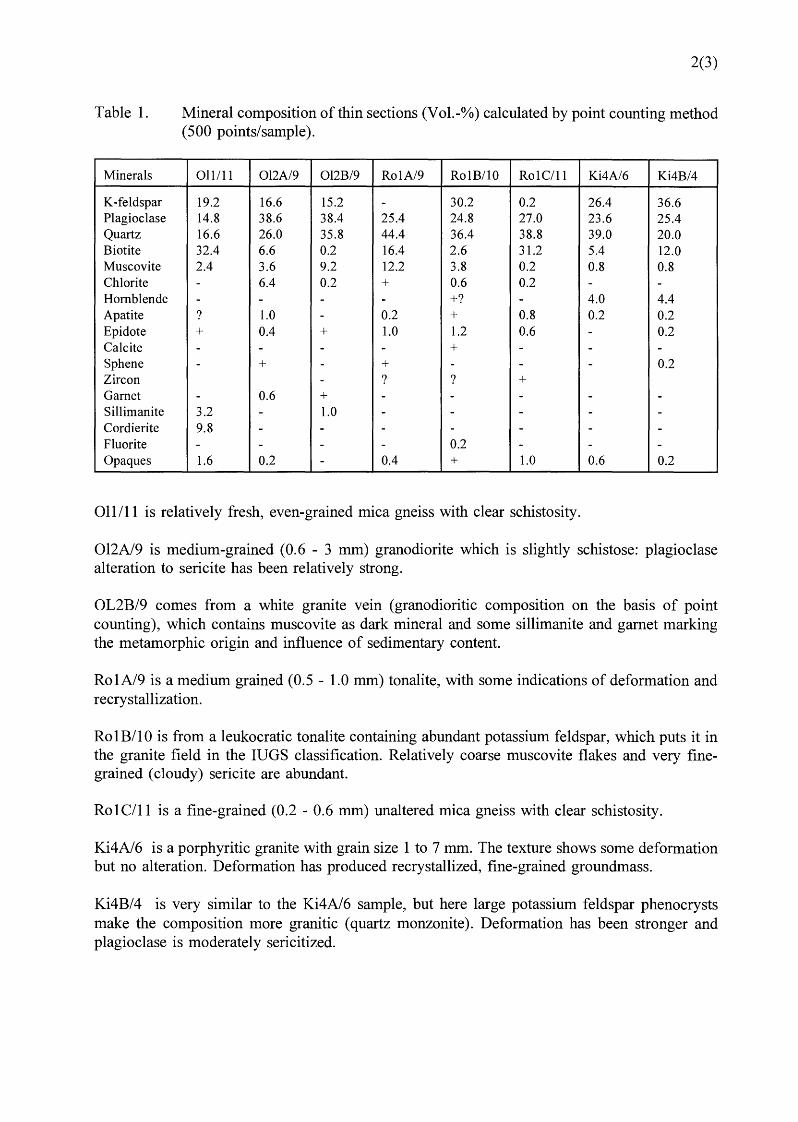
Table 1.
Minerals
K-feldspar Plagioclase Quartz Biotite Muscovite Chlorite Hornblende Apatite Epidote Calcite Sphene Zircon Garnet Sillimanite Cordierite Fluorite Opaques
2(3)
Mineral composition of thin sections (Vol.-%) calculated by point counting method (500 points/sample).
011/11 012A/9 012B/9 Ro1A/9 RolB/10 Ro1C/11 Ki4A/6 Ki4B/4
19.2 16.6 15.2 - 30.2 0.2 26.4 36.6 14.8 38.6 38.4 25.4 24.8 27.0 23.6 25.4 16.6 26.0 35.8 44.4 36.4 38.8 39.0 20.0 32.4 6.6 0.2 16.4 2.6 31.2 5.4 12.0 2.4 3.6 9.2 12.2 3.8 0.2 0.8 0.8 - 6.4 0.2 + 0.6 0.2 - -- - - - +? - 4.0 4.4 ? 1.0 - 0.2 + 0.8 0.2 0.2 + 0.4 + 1.0 1.2 0.6 - 0.2 - - - - + - - -- + - + - - - 0.2
- ? ? + - 0.6 + - - - - -3.2 - 1.0 - - - - -9.8 - - - - - - -- - - - 0.2 - - -1.6 0.2 - 0.4 + 1.0 0.6 0.2
011/11 is relatively fresh, even-grained mica gneiss with clear schistosity.
012A/9 is medium-grained (0.6 - 3 mm) granodiorite which is slightly schistose: plagioclase alteration to sericite has been relatively strong.
OL2B/9 comes from a white granite vein (granodioritic composition on the basis of point counting), which contains muscovite as dark mineral and some sillimanite and garnet marking the metamorphic origin and influence of sedimentary content.
Ro 1A/9 is a medium grained (0.5 - 1.0 mm) tonalite, with some indications of deformation and recrystallization.
Ro1B/10 is from a leukocratic tonalite containing abundant potassium feldspar, which puts it in the granite field in the lUGS classification. Relatively coarse muscovite flakes and very finegrained (cloudy) sericite are abundant.
Ro 1 C/11 is a fine-grained (0.2 - 0.6 mm) unaltered mica gneiss with clear schistosity.
Ki4A/6 is a porphyritic granite with grain size 1 to 7 mm. The texture shows some deformation but no alteration. Deformation has produced recrystallized, fine-grained groundmass.
Ki4B/4 is very similar to the Ki4A/6 sample, but here large potassium feldspar phenocrysts make the composition more granitic (quartz monzonite ). Deformation has been stronger and plagioclase is moderately sericitized.
3(3)
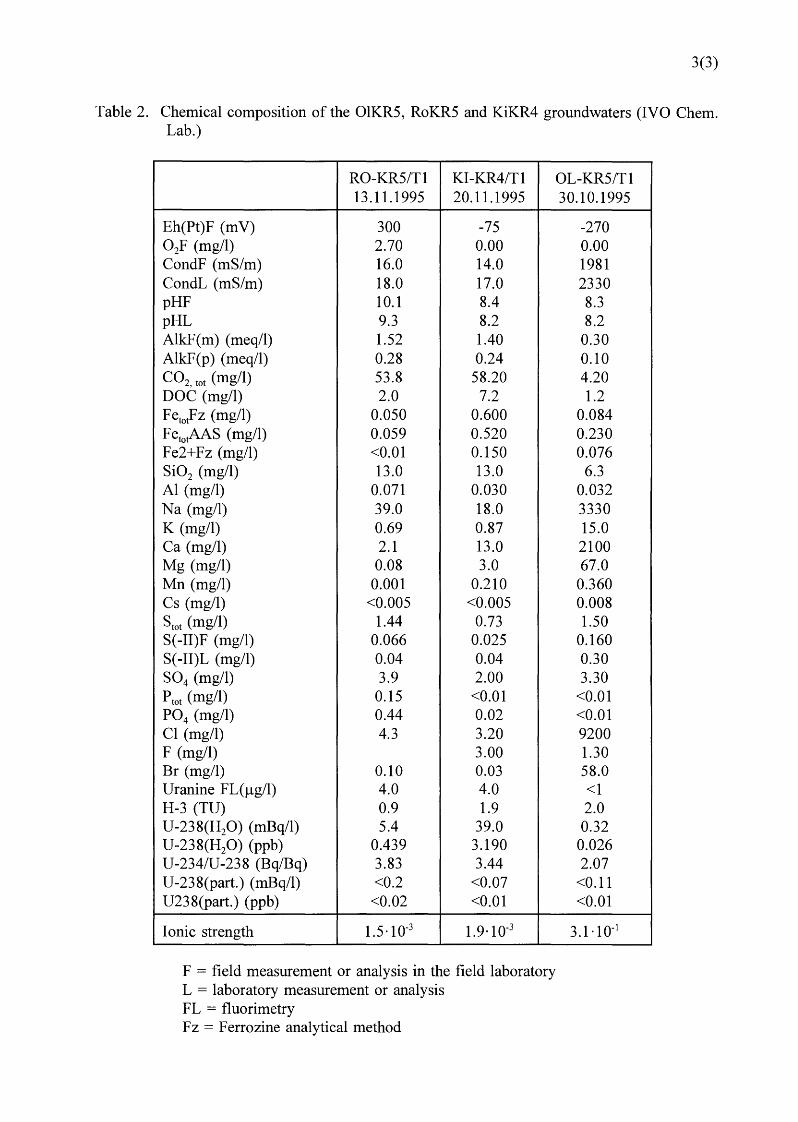
Table 2. Chemical composition of the 01KR5, RoKR5 and KiKR4 groundwaters (IVO Chem. Lab.)
RO-KR5/T1 KI-KR4/T1 OL-KR5/T1 13.11.1995 20.11.1995
Eh(Pt)F (mV) 300 -75 0 2F (mg/1) 2.70 0.00 CondF (mS/m) 16.0 14.0 CondL (mS/m) 18.0 17.0 pHF 10.1 8.4 pHL 9.3 8.2 AlkF(m) (meq/1) 1.52 1.40 AlkF(p) (meq/1) 0.28 0.24 C02, tot (mg/1) 53.8 58.20 DOC (mg/1) 2.0 7.2 FetotFz (mg/1) 0.050 0.600 FetotAAS (mg/1) 0.059 0.520 Fe2+Fz (mg/1) <0.01 0.150 Si02 (mg/1) 13.0 13.0 Al (mg/1) 0.071 0.030 Na (mg/1) 39.0 18.0 K (mg/1) 0.69 0.87 Ca (mg/1) 2.1 13.0 Mg (mg/1) 0.08 3.0 Mn (mg/1) 0.001 0.210 Cs (mg/1) <0.005 <0.005 stot (mg/1) 1.44 0.73 S(-II)F (mg/1) 0.066 0.025 S( -II)L (mg/1) 0.04 0.04 S04 (mg/1) 3.9 2.00 Ptot (mg/1) 0.15 <0.01 P04 (mg/1) 0.44 0.02 Cl (mg/1) 4.3 3.20 F (mg/1) 3.00 Br (mg/1) 0.10 0.03 Uranine FL(J.lg/1) 4.0 4.0 H-3 (TU) 0.9 1.9 U-238(H20) (mBq/1) 5.4 39.0 U-238(H20) (ppb) 0.439 3.190 U-234/U-238 (Bq/Bq) 3.83 3.44 U-238(part.) (mBq/1) <0.2 <0.07 U238(part.) (ppb) <0.02 <0.01
Ionic strength 1.5 ·1 o-3 1.9·1 o-3
F = field measurement or analysis in the field laboratory L = laboratory measurement or analysis FL = fluorimetry Fz = Ferrozine analytical method
30.10.1995
-270 0.00 1981 2330 8.3 8.2
0.30 0.10 4.20 1.2
0.084 0.230 0.076
6.3 0.032 3330 15.0 2100 67.0
0.360 0.008 1.50
0.160 0.30 3.30
<0.01 <0.01 9200 1.30 58.0 <1 2.0 0.32
0.026 2.07
<0.11 <0.01
3.1·10-1
1(16)
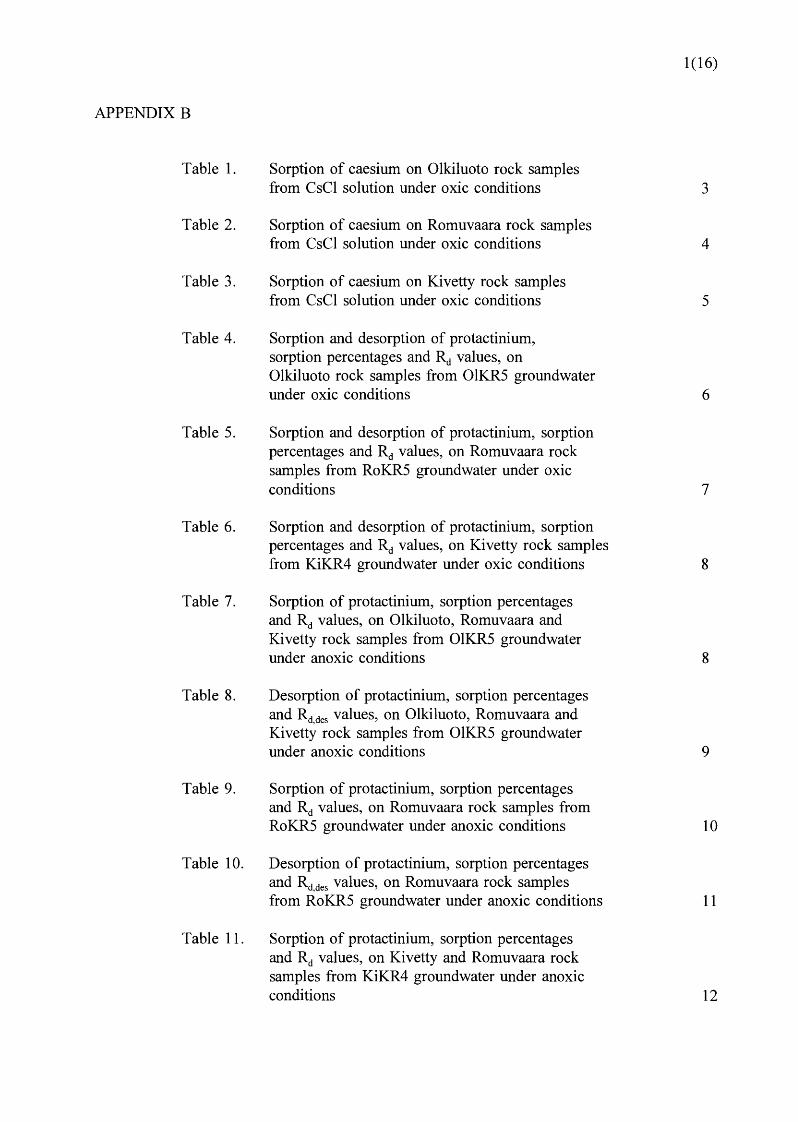
APPENDIX B
Table 1. Sorption of caesium on Olkiluoto rock samples from CsCl solution under oxic conditions 3
Table 2. Sorption of caesium on Romuvaara rock samples from CsCl solution under oxic conditions 4
Table 3. Sorption of caesium on Kivetty rock samples from CsCl solution under oxic conditions 5
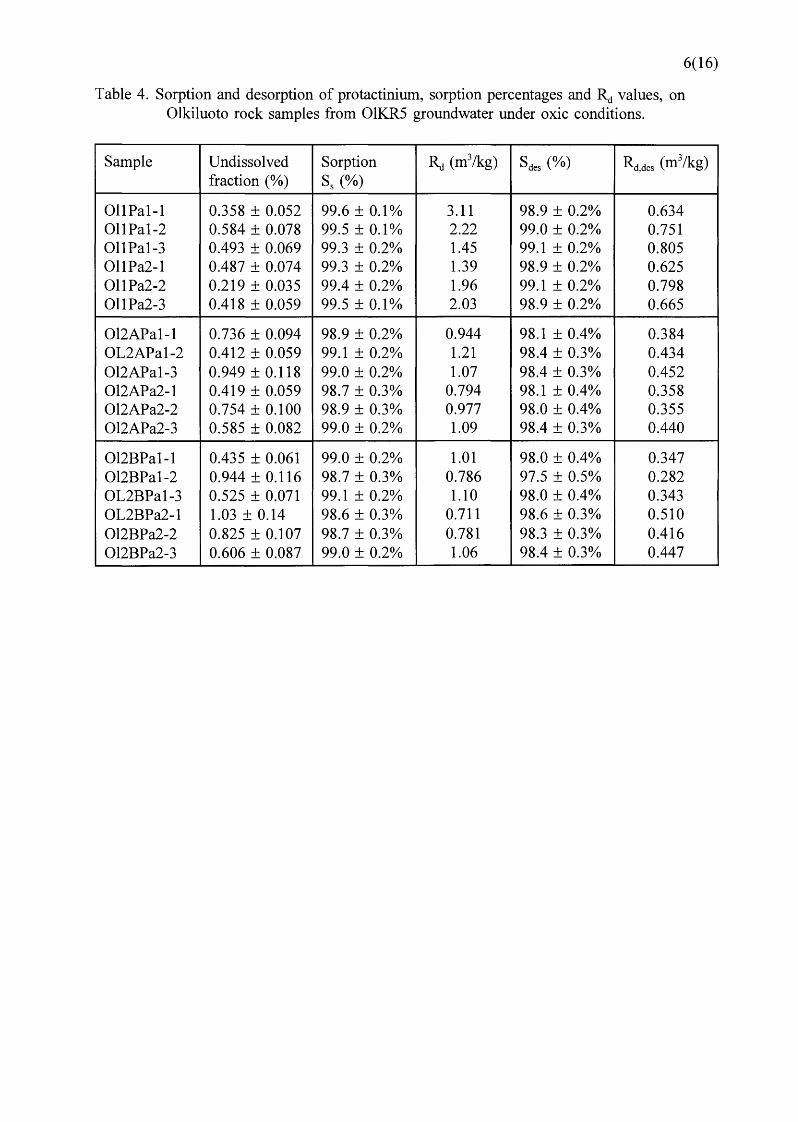
Table 4. Sorption and desorption of protactinium, sorption percentages and Rd values, on Olkiluoto rock samples from 01KR5 groundwater under oxic conditions 6
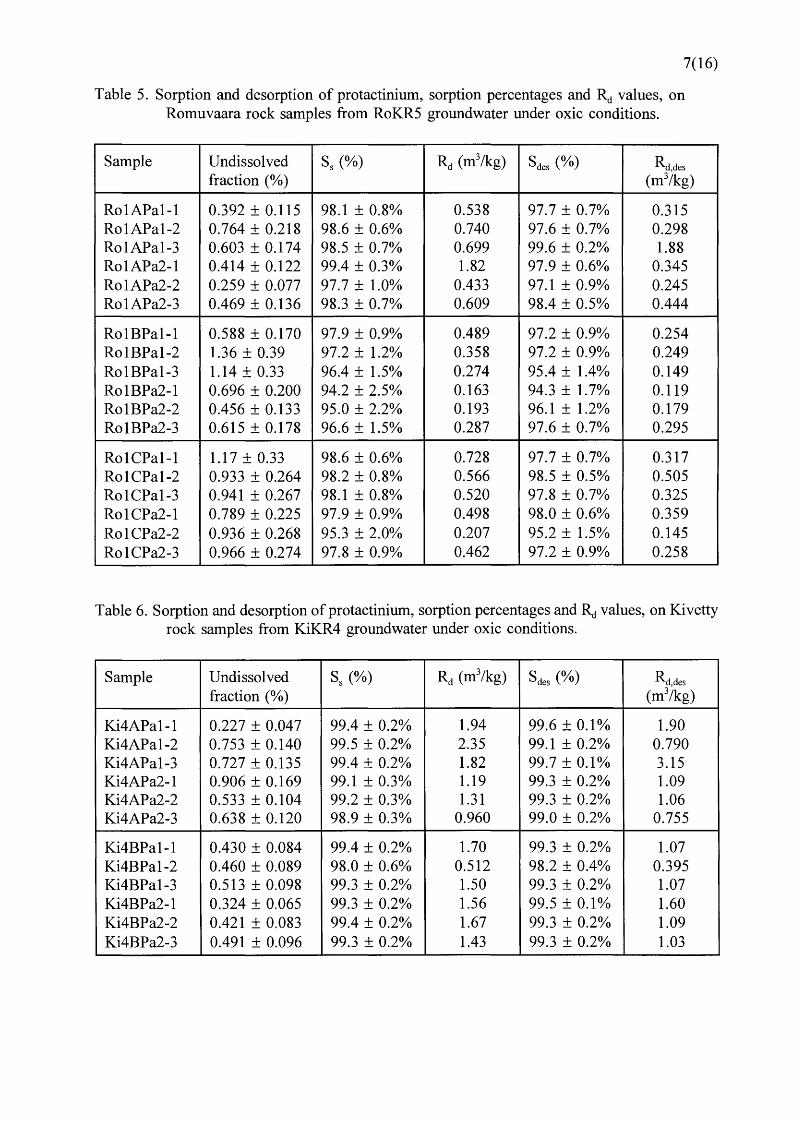
Table 5. Sorption and desorption of protactinium, sorption percentages and Rd values, on Romuvaara rock samples from RoKR5 groundwater under oxic conditions 7
Table 6. Sorption and desorption of protactinium, sorption percentages and Rd values, on Kivetty rock samples from KiKR4 groundwater under oxic conditions 8
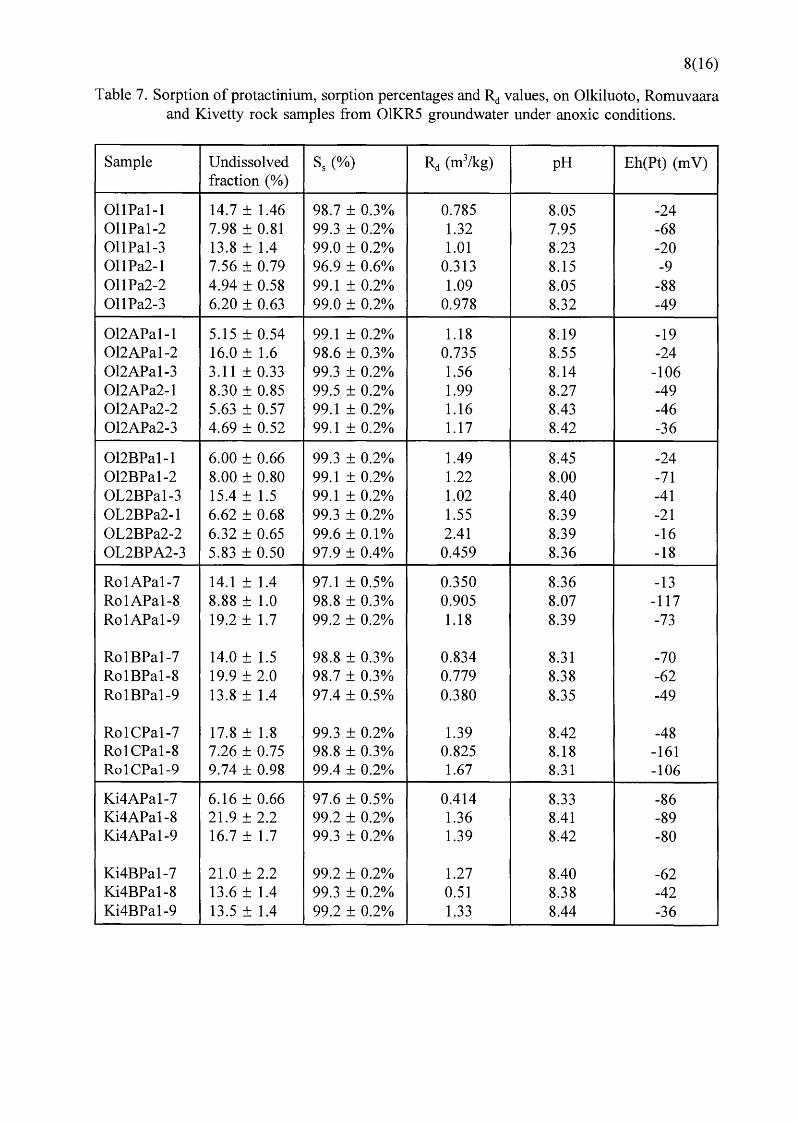
Table 7. Sorption of protactinium, sorption percentages and Rd values, on Olkiluoto, Romuvaara and Kivetty rock samples from 01KR5 groundwater under anoxic conditions 8
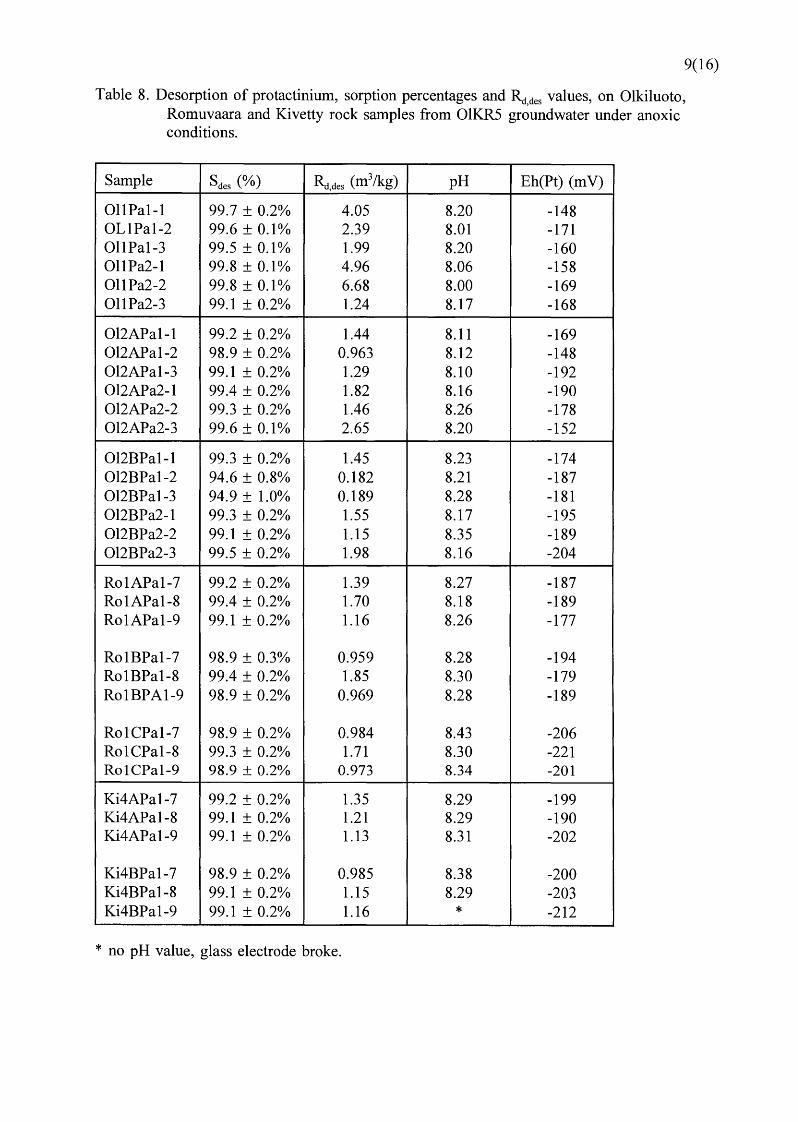
Table 8. Desorption of protactinium, sorption percentages and Rd,des values, on Olkiluoto, Romuvaara and Kivetty rock samples from 01KR5 groundwater under anoxic conditions 9
Table 9. Sorption of protactinium, sorption percentages and Rd values, on Romuvaara rock samples from RoKR5 groundwater under anoxic conditions 10
Table 10. Desorption of protactinium, sorption percentages and Rd,des values, on Romuvaara rock samples from RoKR5 groundwater under anoxic conditions 11
Table 11. Sorption of protactinium, sorption percentages and Rd values, on Kivetty and Romuvaara rock samples from KiKR4 groundwater under anoxic conditions 12
2(16)
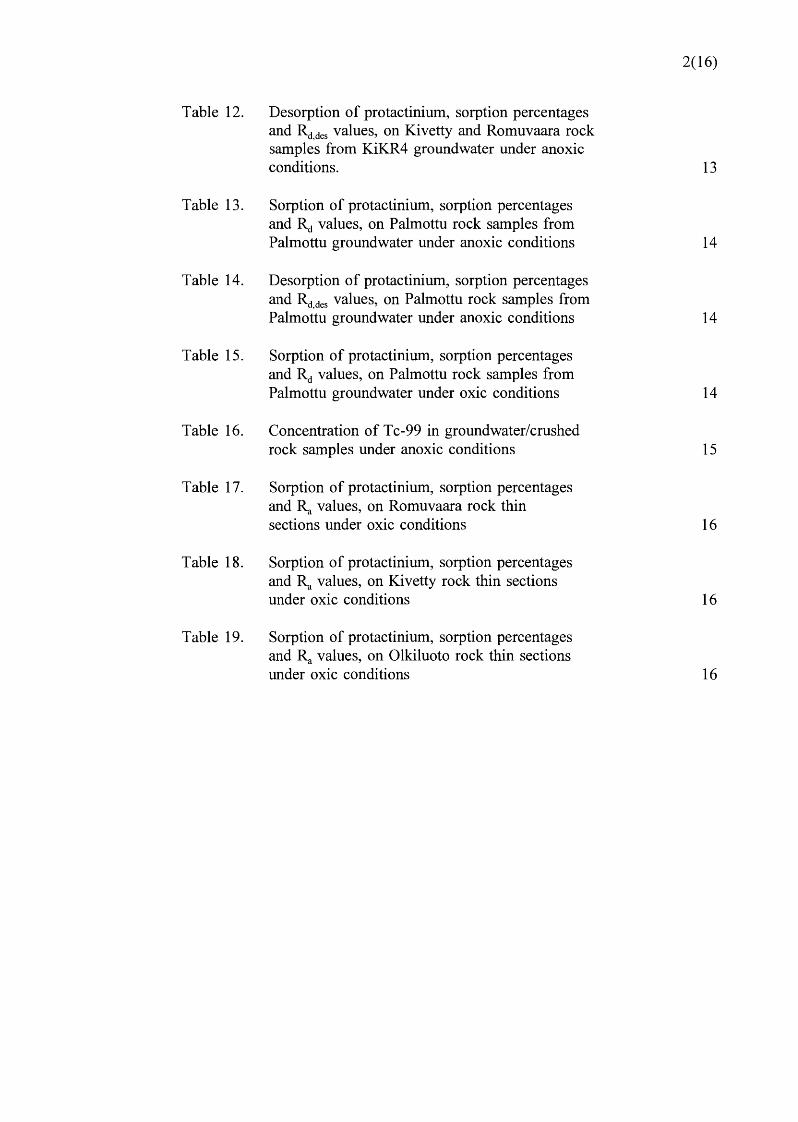
Table 12. Desorption of protactinium, sorption percentages and Rct des values, on Kivetty and Romuvaara rock samples from KiKR4 groundwater under anoxic conditions. 13
Table 13. Sorption of protactinium, sorption percentages and Rct values, on Palmottu rock samples from Palmottu groundwater under anoxic conditions 14
Table 14. Desorption of protactinium, sorption percentages and Rct,ctes values, on Palmottu rock samples from Palmottu groundwater under anoxic conditions 14
Table 15. Sorption of protactinium, sorption percentages and Rct values, on Palmottu rock samples from Palmottu groundwater under oxic conditions 14
Table 16. Concentration of Tc-99 in groundwater/crushed rock samples under anoxic conditions 15
Table 17. Sorption of protactinium, sorption percentages and Rt values, on Romuvaara rock thin sections under oxic conditions 16
Table 18. Sorption of protactinium, sorption percentages and Rt values, on Kivetty rock thin sections under oxic conditions 16
Table 19. Sorption of protactinium, sorption percentages and Rt values, on Olkiluoto rock thin sections under oxic conditions 16
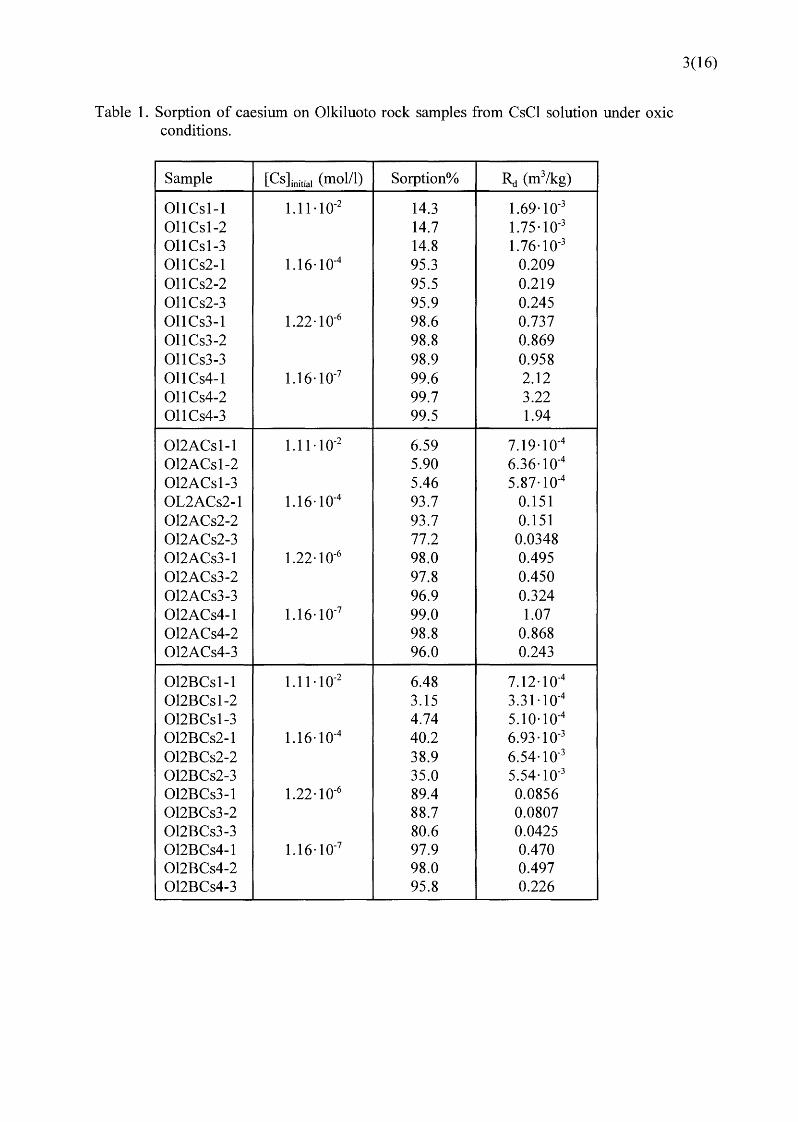
Table 1. Sorption of caesium on Olkiluoto rock samples from CsCl solution under oxic conditions.
Sample [Cs ]initial (mol/1) Sorption% Rt (m3/kg)
011Cs1-1 1.11-1 o-2 14.3 1.69·10-3
011Cs1-2 14.7 1. 75 ·1 o-3
011Cs1-3 14.8 1.76·10-3
011Cs2-1 1.16·1 o-4 95.3 0.209 011Cs2-2 95.5 0.219 Ol1Cs2-3 95.9 0.245 011 Cs3-1 1.22·10-6 98.6 0.737 011Cs3-2 98.8 0.869 011Cs3-3 98.9 0.958 011Cs4-1 1.16·10-7 99.6 2.12 011Cs4-2 99.7 3.22 011Cs4-3 99.5 1.94
012ACs1-1 1.11-1 o-2 6.59 7.19·10-4
012ACs1-2 5.90 6.36·10-4
012ACs1-3 5.46 5.87 ·1 o-4
OL2ACs2-1 1.16·10-4 93.7 0.151 012ACs2-2 93.7 0.151 012ACs2-3 77.2 0.0348 012ACs3-1 1.22·10-6 98.0 0.495 012ACs3-2 97.8 0.450 012ACs3-3 96.9 0.324 012ACs4-1 1.16·10-7 99.0 1.07 012ACs4-2 98.8 0.868 012ACs4-3 96.0 0.243
012BCs1-1 1.11-1 o-2 6.48 7.12·10-4
012BCs1-2 3.15 3.31·10-4
012BCs1-3 4.74 5.1 o-1 o-4
012BCs2-1 1.16·1 o-4 40.2 6.93·10-3
012BCs2-2 38.9 6.54·10-3
012BCs2-3 35.0 5.54·10-3
012BCs3-1 1.22 ·1 o-6 89.4 0.0856 012BCs3-2 88.7 0.0807 012BCs3-3 80.6 0.0425 012BCs4-1 1.16·10-7 97.9 0.470 012BCs4-2 98.0 0.497 012BCs4-3 95.8 0.226
3(16)
4(16)
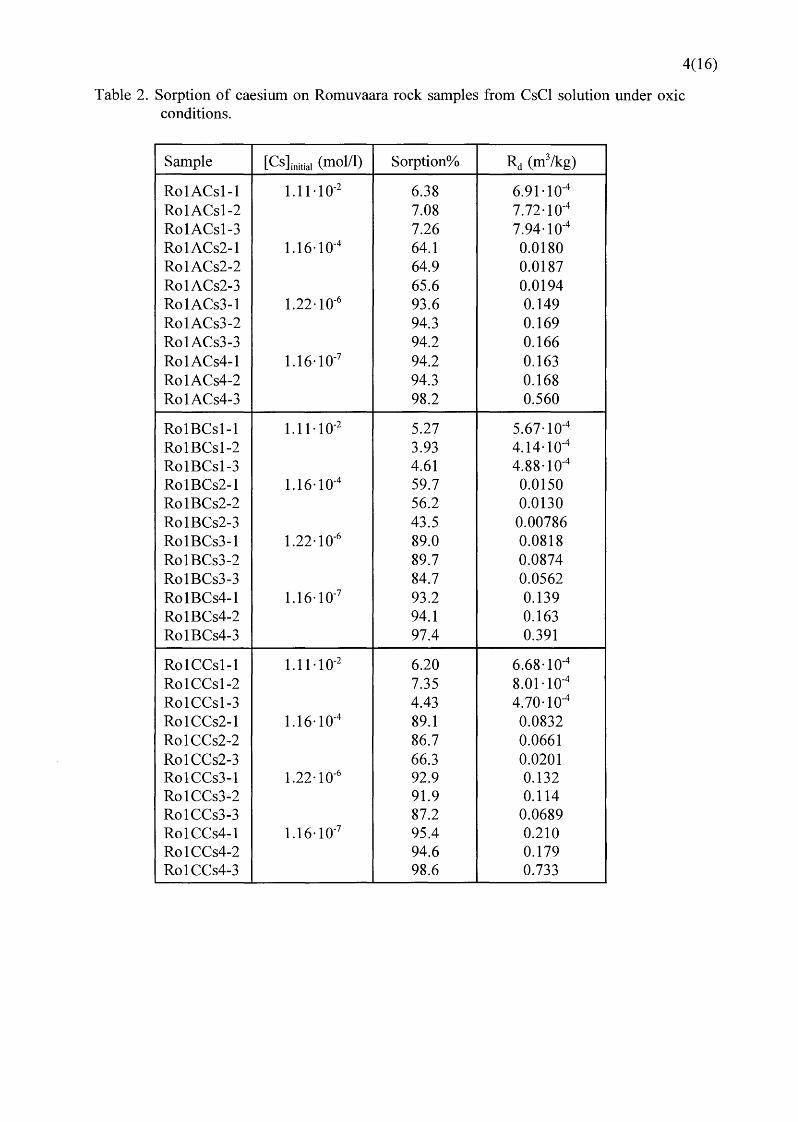
Table 2. Sorption of caesium on Romuvaara rock samples from CsCl solution under oxic conditions.
Sample [Cs lnitial (mol/1) Sorption% Rd (m3/kg)
Ro1ACs1-1 1.11-1 o-2 6.38 6.91·1 o-4
Ro1ACs1-2 7.08 7.72·10-4
Ro1ACs1-3 7.26 7.94·10-4
Ro1ACs2-1 1.16·10-4 64.1 0.0180 Ro1ACs2-2 64.9 0.0187 Ro1ACs2-3 65.6 0.0194 Ro1ACs3-1 1.22 ·1 o-6 93.6 0.149 Ro1ACs3-2 94.3 0.169 Ro1ACs3-3 94.2 0.166 Ro1ACs4-1 1.16·1 o-7 94.2 0.163 Ro1ACs4-2 94.3 0.168 Ro1ACs4-3 98.2 0.560
Ro1BCs1-1 1.11-1 o-2 5.27 5.67 ·1 o-4
Ro1BCs1-2 3.93 4.14·10-4
Ro1BCs1-3 4.61 4.88·10-4
Ro1BCs2-1 1.16·1 o-4 59.7 0.0150 Ro1BCs2-2 56.2 0.0130 Ro1BCs2-3 43.5 0.00786 Ro1BCs3-1 1.22 ·1 o-6 89.0 0.0818 Ro1BCs3-2 89.7 0.0874 Ro1BCs3-3 84.7 0.0562 Ro1BCs4-1 1.16·1 o-7 93.2 0.139 Ro1BCs4-2 94.1 0.163 Ro1BCs4-3 97.4 0.391
Ro1CCs1-1 1.11-1 o-2 6.20 6.68·10-4
Ro1CCs1-2 7.35 8.01·1 o-4
Ro1CCs1-3 4.43 4.70·10-4
Ro1CCs2-1 1.16·10-4 89.1 0.0832 Ro1CCs2-2 86.7 0.0661 Ro1CCs2-3 66.3 0.0201 Ro1CCs3-1 1.22·10-6 92.9 0.132 Ro1CCs3-2 91.9 0.114 Ro1CCs3-3 87.2 0.0689 Ro1CCs4-1 1.16·10-7 95.4 0.210 Ro1CCs4-2 94.6 0.179 Ro1CCs4-3 98.6 0.733
5(16)
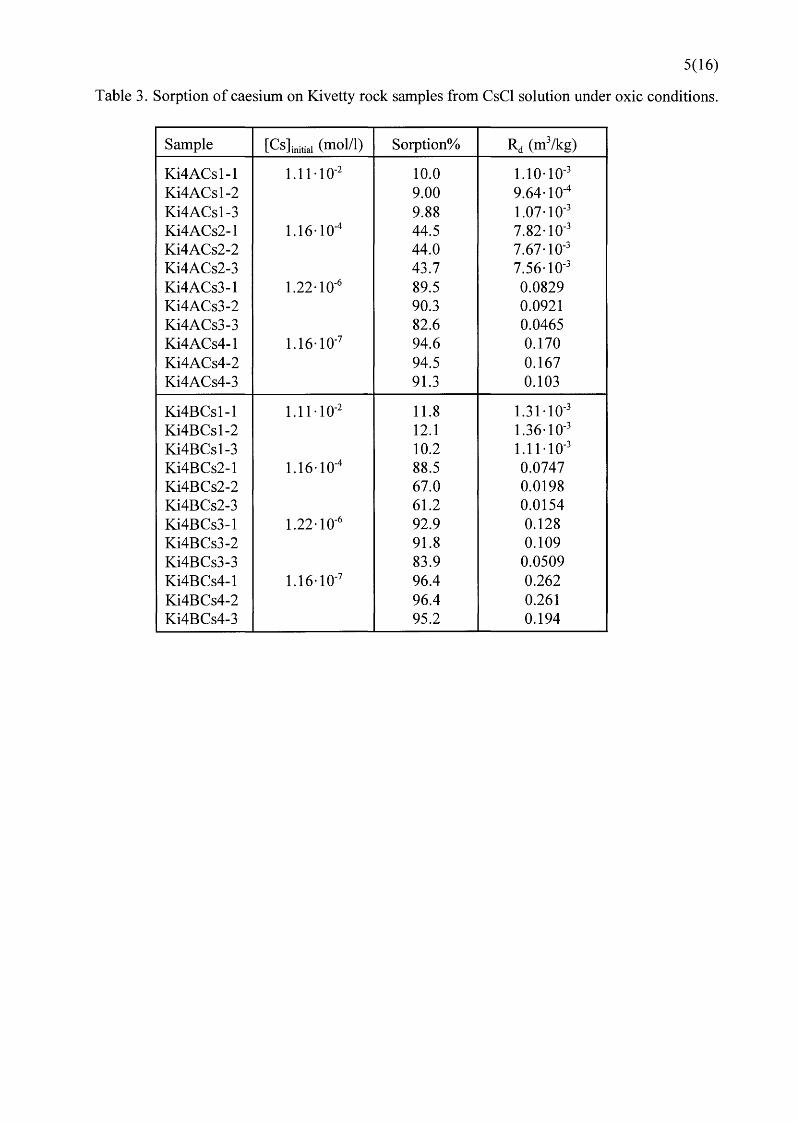
Table 3. Sorption of caesium on Kivetty rock samples from CsCl solution under oxic conditions.
Sample [Cs lnitial (mol/1) Sorption% Rd (m3/kg)
Ki4ACs1-1 1.11·1 o-2 10.0 1.1 0·1 o-3
Ki4ACs1-2 9.00 9.64·10-4
Ki4ACs1-3 9.88 1.07·10-3
Ki4ACs2-1 1.16·10-4 44.5 7.82·10-3
Ki4ACs2-2 44.0 7.67·10-3
Ki4ACs2-3 43.7 7.56·10-3
Ki4ACs3-1 1.22 ·1 o-6 89.5 0.0829 Ki4ACs3-2 90.3 0.0921 Ki4ACs3-3 82.6 0.0465 Ki4ACs4-1 1.16·10-7 94.6 0.170 Ki4ACs4-2 94.5 0.167 Ki4ACs4-3 91.3 0.103
Ki4BCs1-1 1.11·1 o-2 11.8 1.31·1 o-3
Ki4BCs1-2 12.1 1.36·1 o-3
Ki4BCs1-3 10.2 1.11·1 o-3
Ki4BCs2-1 1.16·10-4 88.5 0.0747 Ki4BCs2-2 67.0 0.0198 Ki4BCs2-3 61.2 0.0154 Ki4BCs3-1 1.22·10-6 92.9 0.128 Ki4BCs3-2 91.8 0.109 Ki4BCs3-3 83.9 0.0509 Ki4BCs4-1 1.16·1 o-7 96.4 0.262 Ki4BCs4-2 96.4 0.261 Ki4BCs4-3 95.2 0.194
6(16)
Table 4. Sorption and desorption of protactinium, sorption percentages and Rd values, on Olkiluoto rock samples from 01KR5 groundwater under oxic conditions.
Sample Undissolved Sorption Rd (m3/kg) sdes (%) Rd des (m3 /kg) fraction (%) ss(%)
011Pa1-1 0.358 ± 0.052 99.6 ± 0.1% 3.11 98.9 ± 0.2% 0.634 011Pa1-2 0.584 ± 0.078 99.5 ± 0.1% 2.22 99.0 ± 0.2% 0.751 011Pa1-3 0.493 ± 0.069 99.3 ± 0.2% 1.45 99.1 ± 0.2% 0.805 011Pa2-1 0.487 ± 0.074 99.3 ± 0.2% 1.39 98.9 ± 0.2% 0.625 011Pa2-2 0.219 ± 0.035 99.4 ± 0.2% 1.96 99.1 ± 0.2% 0.798 011Pa2-3 0.418 ± 0.059 99.5 ± 0.1% 2.03 98.9 ± 0.2% 0.665
012APa1-1 0. 736 ± 0.094 98.9 ± 0.2% 0.944 98.1 ± 0.4% 0.384 OL2APa1-2 0.412 ± 0.059 99.1 ± 0.2% 1.21 98.4 ± 0.3% 0.434 012APa1-3 0.949 ± 0.118 99.0 ± 0.2% 1.07 98.4 ± 0.3% 0.452 012APa2-1 0.419 ± 0.059 98.7 ± 0.3% 0.794 98.1 ± 0.4% 0.358 012APa2-2 0.754 ± 0.100 98.9 ± 0.3% 0.977 98.0 ± 0.4% 0.355 012APa2-3 0.585 ± 0.082 99.0 ± 0.2% 1.09 98.4 ± 0.3% 0.440
012BPa1-1 0.435 ± 0.061 99.0 ± 0.2% 1.01 98.0 ± 0.4% 0.347 012BPa1-2 0.944 ± 0.116 98.7 ± 0.3% 0.786 97.5 ± 0.5% 0.282 OL2BPa1-3 0.525 ± 0.071 99.1 ± 0.2% 1.10 98.0 ± 0.4% 0.343 OL2BPa2-1 1.03 ± 0.14 98.6 ± 0.3% 0.711 98.6 ± 0.3% 0.510 012BPa2-2 0.825 ± 0.107 98.7 ± 0.3% 0.781 98.3 ± 0.3% 0.416 012BPa2-3 0.606 ± 0.087 99.0 ± 0.2% 1.06 98.4 ± 0.3% 0.447
7(16)
Table 5. Sorption and desorption of protactinium, sorption percentages and Rd values, on Romuvaara rock samples from RoKR5 groundwater under oxic conditions.
Sample Undissolved ss (%) Rd (m3/kg) sdes (%) Rd,des fraction (%) (m3/kg)
Ro1APa1-1 0.392 ± 0.115 98.1 ± 0.8% 0.538 97.7 ± 0.7% 0.315 Ro1APa1-2 0.764 ± 0.218 98.6 ± 0.6% 0.740 97.6 ± 0.7% 0.298 Ro1APa1-3 0.603 ± 0.174 98.5 ± 0.7% 0.699 99.6 ± 0.2% 1.88 Ro1APa2-1 0.414 ± 0.122 99.4 ± 0.3% 1.82 97.9 ± 0.6% 0.345 Ro1APa2-2 0.259 ± 0.077 97.7 ± 1.0% 0.433 97.1 ± 0.9% 0.245 Ro1APa2-3 0.469 ± 0.136 98.3 ± 0.7% 0.609 98.4 ± 0.5% 0.444
Ro1BPa1-1 0.588 ± 0.170 97.9 ± 0.9% 0.489 97.2 ± 0.9% 0.254 Ro1BPa1-2 1.36 ± 0.39 97.2 ± 1.2% 0.358 97.2 ± 0.9% 0.249 Ro1BPa1-3 1.14 ± 0.33 96.4 ± 1.5% 0.274 95.4 ± 1.4% 0.149 Ro1BPa2-1 0.696 ± 0.200 94.2 ± 2.5% 0.163 94.3 ± 1.7% 0.119 Ro1BPa2-2 0.456 ± 0.133 95.0 ± 2.2% 0.193 96.1 ± 1.2% 0.179 Ro1BPa2-3 0.615 ± 0.178 96.6 ± 1.5% 0.287 97.6 ± 0.7% 0.295
Ro1CPa1-1 1.17 ± 0.33 98.6 ± 0.6% 0.728 97.7 ± 0.7% 0.317 Ro1CPa1-2 0.933 ± 0.264 98.2 ± 0.8% 0.566 98.5 ± 0.5% 0.505 Ro1CPa1-3 0.941 ± 0.267 98.1 ± 0.8% 0.520 97.8 ± 0.7% 0.325 Ro1CPa2-1 0. 789 ± 0.225 97.9 ± 0.9% 0.498 98.0 ± 0.6% 0.359 Ro1CPa2-2 0.936 ± 0.268 95.3 ± 2.0% 0.207 95.2 ± 1.5% 0.145 Ro1CPa2-3 0.966 ± 0.274 97.8 ± 0.9% 0.462 97.2 ± 0.9% 0.258
Table 6. Sorption and desorption of protactinium, sorption percentages and ~ values, on Kivetty rock samples from KiKR4 groundwater under oxic conditions.
Sample Undissolved ss (%) Rd (m3/kg) sdes (%) Rd,des fraction (%) (m3/kg)
Ki4APa1-1 0.227 ± 0.047 99.4 ± 0.2% 1.94 99.6±0.1% 1.90 Ki4APa1-2 0.753 ± 0.140 99.5 ± 0.2% 2.35 99.1 ± 0.2% 0.790 Ki4APa1-3 0.727 ± 0.135 99.4 ± 0.2% 1.82 99.7 ± 0.1% 3.15 Ki4APa2-1 0.906 ± 0.169 99.1 ± 0.3% 1.19 99.3 ± 0.2% 1.09 Ki4APa2-2 0.533 ± 0.104 99.2 ± 0.3% 1.31 99.3 ± 0.2% 1.06 Ki4APa2-3 0.638 ± 0.120 98.9 ± 0.3% 0.960 99.0 ± 0.2% 0.755
Ki4BPa1-1 0.430 ± 0.084 99.4 ± 0.2% 1.70 99.3 ± 0.2% 1.07 Ki4BPa1-2 0.460 ± 0.089 98.0 ± 0.6% 0.512 98.2 ± 0.4% 0.395 Ki4BPa1-3 0.513 ± 0.098 99.3 ± 0.2% 1.50 99.3 ± 0.2% 1.07 Ki4BPa2-1 0.324 ± 0.065 99.3 ± 0.2% 1.56 99.5±0.1% 1.60 Ki4BPa2-2 0.421 ± 0.083 99.4 ± 0.2% 1.67 99.3 ± 0.2% 1.09 Ki4BPa2-3 0.491 ± 0.096 99.3 ± 0.2% 1.43 99.3 ± 0.2% 1.03
8(16)
Table 7. Sorption of protactinium, sorption percentages and Rd values, on Olkiluoto, Romuvaara and Kivetty rock samples from 01KR5 groundwater under anoxic conditions.
Sample Undissolved ss (%) Rd (m3/kg) pH Eh(Pt) (mV) fraction (%)
011Pa1-1 14.7 ± 1.46 98.7 ± 0.3% 0.785 8.05 -24 011Pa1-2 7.98 ± 0.81 99.3 ± 0.2% 1.32 7.95 -68 011Pa1-3 13.8 ± 1.4 99.0 ± 0.2% 1.01 8.23 -20 011Pa2-1 7.56 ± 0.79 96.9 ± 0.6% 0.313 8.15 -9 011Pa2-2 4.94 ± 0.58 99.1 ± 0.2% 1.09 8.05 -88 011Pa2-3 6.20 ± 0.63 99.0 ± 0.2% 0.978 8.32 -49
012APa1-1 5.15 ± 0.54 99.1 ± 0.2% 1.18 8.19 -19 012APa1-2 16.0 ± 1.6 98.6 ± 0.3% 0.735 8.55 -24 012APa1-3 3.11 ± 0.33 99.3 ± 0.2% 1.56 8.14 -106 012APa2-1 8.30 ± 0.85 99.5 ± 0.2% 1.99 8.27 -49 012APa2-2 5.63 ± 0.57 99.1 ± 0.2% 1.16 8.43 -46 012APa2-3 4.69 ± 0.52 99.1 ± 0.2% 1.17 8.42 -36
012BPa1-1 6.00 ± 0.66 99.3 ± 0.2% 1.49 8.45 -24 012BPa1-2 8.00 ± 0.80 99.1 ± 0.2% 1.22 8.00 -71 OL2BPa1-3 15.4± 1.5 99.1 ± 0.2% 1.02 8.40 -41 OL2BPa2-1 6.62 ± 0.68 99.3 ± 0.2% 1.55 8.39 -21 OL2BPa2-2 6.32 ± 0.65 99.6 ± 0.1% 2.41 8.39 -16 OL2BPA2-3 5.83 ± 0.50 97.9 ± 0.4% 0.459 8.36 -18
Ro1APa1-7 14.1 ± 1.4 97.1 ± 0.5% 0.350 8.36 -13 Ro1APa1-8 8.88 ± 1.0 98.8 ± 0.3% 0.905 8.07 -117 Ro1APa1-9 19.2 ± 1.7 99.2 ± 0.2% 1.18 8.39 -73
Ro1BPa1-7 14.0 ± 1.5 98.8 ± 0.3% 0.834 8.31 -70 Ro1BPa1-8 19.9 ± 2.0 98.7 ± 0.3% 0.779 8.38 -62 Ro1BPa1-9 13.8 ± 1.4 97.4 ± 0.5% 0.380 8.35 -49
Ro1CPa1-7 17.8 ± 1.8 99.3 ± 0.2% 1.39 8.42 -48 Ro1CPa1-8 7.26 ± 0.75 98.8 ± 0.3% 0.825 8.18 -161 Ro1CPa1-9 9.74 ± 0.98 99.4 ± 0.2% 1.67 8.31 -106
Ki4APa1-7 6.16 ± 0.66 97.6 ± 0.5% 0.414 8.33 -86 Ki4APa1-8 21.9 ± 2.2 99.2 ± 0.2% 1.36 8.41 -89 Ki4APa1-9 16.7 ± 1.7 99.3 ± 0.2% 1.39 8.42 -80
Ki4BPa1-7 21.0 ± 2.2 99.2 ± 0.2% 1.27 8.40 -62 Ki4BPa1-8 13.6 ± 1.4 99.3 ± 0.2% 0.51 8.38 -42 Ki4BPa1-9 13.5 ± 1.4 99.2 ± 0.2% 1.33 8.44 -36
9(16)
Table 8. Desorption of protactinium, sorption percentages and Rd,des values, on Olkiluoto, Romuvaara and Kivetty rock samples from 01KR5 groundwater under anoxic conditions.
Sample sdes (%) RI,des (m3 /kg) pH Eh(Pt) (mV)
Ol1Pa1-1 99.7 ± 0.2% 4.05 8.20 -148 OL1Pa1-2 99.6 ± 0.1% 2.39 8.01 -171 011Pa1-3 99.5 ± 0.1% 1.99 8.20 -160 011Pa2-1 99.8 ± 0.1% 4.96 8.06 -158 011Pa2-2 99.8±0.1% 6.68 8.00 -169 011Pa2-3 99.1 ± 0.2% 1.24 8.17 -168
012APa1-1 99.2 ± 0.2% 1.44 8.11 -169 012APa1-2 98.9 ± 0.2% 0.963 8.12 -148 012APa1-3 99.1 ± 0.2% 1.29 8.10 -192 012APa2-1 99.4 ± 0.2% 1.82 8.16 -190 012APa2-2 99.3 ± 0.2% 1.46 8.26 -178 012APa2-3 99.6 ± 0.1% 2.65 8.20 -152
012BPa1-1 99.3 ± 0.2% 1.45 8.23 -174 012BPa1-2 94.6 ± 0.8% 0.182 8.21 -187 012BPa1-3 94.9 ± 1.0% 0.189 8.28 -181 012BPa2-1 99.3 ± 0.2% 1.55 8.17 -195 012BPa2-2 99.1 ± 0.2% 1.15 8.35 -189 012BPa2-3 99.5 ± 0.2% 1.98 8.16 -204
Ro1APa1-7 99.2 ± 0.2% 1.39 8.27 -187 Ro1APa1-8 99.4 ± 0.2% 1.70 8.18 -189 Ro1APa1-9 99.1 ± 0.2% 1.16 8.26 -177
Ro1BPa1-7 98.9 ± 0.3% 0.959 8.28 -194 Ro1BPa1-8 99.4 ± 0.2% 1.85 8.30 -179 Ro1BPA1-9 98.9 ± 0.2% 0.969 8.28 -189
Ro1CPa1-7 98.9 ± 0.2% 0.984 8.43 -206 Ro1CPa1-8 99.3 ± 0.2% 1.71 8.30 -221 RolCPal-9 98.9 ± 0.2% 0.973 8.34 -201
Ki4APa1-7 99.2 ± 0.2% 1.35 8.29 -199 Ki4APa1-8 99.1 ± 0.2% 1.21 8.29 -190 Ki4APa1-9 99.1 ± 0.2% 1.13 8.31 -202
Ki4BPa1-7 98.9 ± 0.2% 0.985 8.38 -200 Ki4BPa1-8 99.1 ± 0.2% 1.15 8.29 -203 Ki4BPa1-9 99.1 ± 0.2% 1.16 * -212
* no pH value, glass electrode broke.
10(16)
Table 9. Sorption of protactinium, sorption percentages and Rd values, on Romuvaara rock samples from RoKR5 groundwater under anoxic conditions.
Sample Undissolved ss (%) Rd (m3/kg) pH Eh(Pt) (mV) fraction (%)
Ro1APa1-1 14.1 ± 0.70 98.7 ± 0.1% 0.731 8.34 54 Ro1APa1-2 7.23 ± 0.31 94.2 ± 0.5% 0.169 8.11 129 Ro1APa1-3 9.22 ± 0.39 87.0 ± 1.0% 0.0731 8.47 79 Ro1APa2-1 2.57 ± 0.13 97.4 ± 0.2% 0.379 8.00 377 Ro1APa2-2 7.88 ± 0.33 95.7 ± 0.4% 0.253 8.82 184 Ro1APa2-3 3.88±0.17 98.3 ± 0.2% 0.593 7.65 364
Ro1BPa1-1 3.43 ± 0.18 88.0 ± 0.2% 0.0795 7.75 -121 Ro1BPa1-2 7.84 ± 0.33 97.6 ± 0.2% 0.404 7.88 194 Ro1BPa1-3 4.83 ± 0.21 99.0 ± 0.1% 1.05 8.63 232 Ro1BPa2-1 8.63 ± 0.39 99.1 ± 0.1% 1.12 7.84 414 Ro1BPa2-2 9.16±0.38 92.5 ± 0.6% 0.138 7.84 314 Ro1BPa2-3 8.50 ± 0.36 87.6 ± 1.0% 0.0793 8.84 214
Ro1CPa1-1 6.99 ± 0.33 99.2 ± 0.1% 1.25 8.22 348 Ro1CPa1-2 4.60 ± 0.20 98.5 ± 0.2% 0.660 8.57 144 Ro1CPa1-3 2.76 ± 0.13 98.7 ± 0.2% 0.801 8.13 192 Ro1CPa2-1 7.85 ± 0.37 96.0 ± 0.3% 0.256 7.89 464 Ro1CPa2-2 2.92 ± 0.13 97.0 ± 0.3% 0.320 8.79 131 Ro1CPa2-3 6.71 ± 0.29 99.6 ± 0.1% 2.33 9.04 181
11(16)
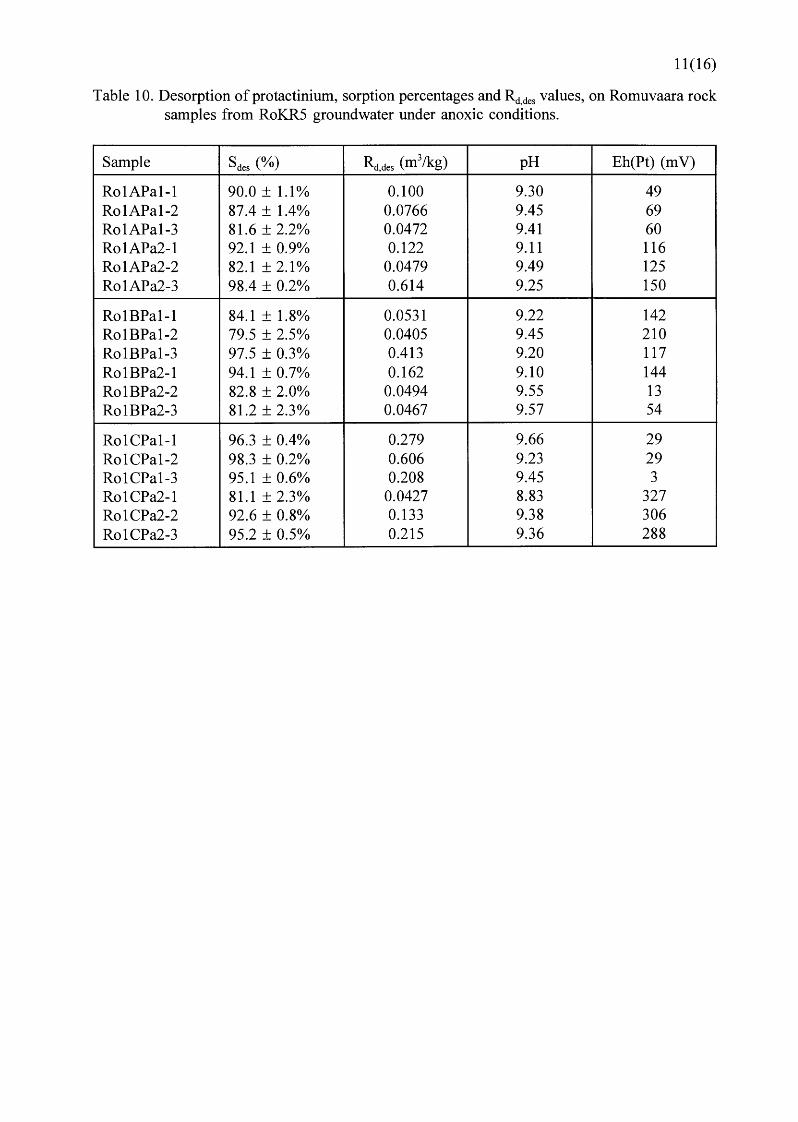
Table 10. Desorption of protactinium, sorption percentages and Rd,des values, on Romuvaara rock samples from RoKR5 groundwater under anoxic conditions.
Sample sdes (%) Rd des (m3 /kg) pH Eh(Pt) (mV)
Ro1APa1-1 90.0 ± 1.1% 0.100 9.30 49 Ro1APa1-2 87.4 ± 1.4% 0.0766 9.45 69 Ro1APa1-3 81.6 ± 2.2% 0.0472 9.41 60 Ro1APa2-1 92.1 ± 0.9% 0.122 9.11 116 Ro1APa2-2 82.1 ± 2.1% 0.0479 9.49 125 Ro1APa2-3 98.4 ± 0.2% 0.614 9.25 150
Ro1BPa1-1 84.1 ± 1.8% 0.0531 9.22 142 Ro1BPa1-2 79.5 ± 2.5% 0.0405 9.45 210 Ro1BPa1-3 97.5 ± 0.3% 0.413 9.20 117 Ro1BPa2-1 94.1 ± 0.7% 0.162 9.10 144 Ro1BPa2-2 82.8 ± 2.0% 0.0494 9.55 13 Ro1BPa2-3 81.2 ± 2.3% 0.0467 9.57 54
Ro1CPa1-1 96.3 ± 0.4% 0.279 9.66 29 Ro1CPa1-2 98.3 ± 0.2% 0.606 9.23 29 Ro1CPa1-3 95.1 ± 0.6% 0.208 9.45 3 Ro1CPa2-1 81.1 ± 2.3% 0.0427 8.83 327 Ro1CPa2-2 92.6 ± 0.8% 0.133 9.38 306 Ro1CPa2-3 95.2 ± 0.5% 0.215 9.36 288
12(16)
Table 11. Sorption of protactinium, sorption percentages and Rd values, on Kivetty and Romuvaara rock samples from KiKR4 groundwater under anoxic conditions.
Sample Undissolved ss (%) Rd (m3/kg) pH Eh(Pt) (mV) fraction (%)
Ki4APa1-1 8.24 ± 0.37 99.6 ± 0.1% 3.05 8.10 324 Ki4APa1-2 4.59 ± 0.20 99.4 ± 0.1% 1.74 8.61 119 Ki4APa1-3 6.42 ± 0.27 99.7 ± 0.1% 4.15 8.37 99 Ki4BPa2-1 10.9 ± 0.5 99.5 ± 0.1% 2.39 8.04 364 Ki4APa2-2 8.20 ± 0.34 99.5±0.1% 2.37 8.41 124 Ki4APa2-3 8.18 ± 0.34 99.6 ± 0.1% 3.38 8.65 154
Ki4BPa1-1 8.74 ± 0.39 99.6 ± 0.1% 3.04 8.18 311 Ki4BPa1-2 10.8 ± 0.5 99.6 ± 0.1% 2.88 6.96 209 Ki4BPa1-3 10.5 ± 0.5 99.7 ± 0.1% 4.25 8.66 171 Ki4BPa2-1 10.9 ± 0.5 99.7 ± 0.1% 3.67 8.20 324 Ki4BPa2-2 4.29±0.18 99.6±0.1% 3.21 8.62 54 Ki4BPa2-3 12.3 ± 0.6 99.9 ± 0.1% 12.3 8.25 63
Ro1APa1-4 7.60 ± 0.27 99.2 ± 0.1% 1.38 8.45 6 Ro1APa1-5 9.62 ± 0.33 99.2 ± 0.4% 8.61 8.10 -266 Ro1APa2-4 13.5 ± 0.5 100 ± 1% > 4.0 8.06 -106 Ro1APa2-5 9.74 ± 0.34 99.7 ± 0.1% 4.03 8.45 -46
Ro1BPa1-4 9.95 ± 0.5 99.3 ± 0.1% 1.49 8.47 3 Ro1BPa1-5 12.0 ± 0.5 99.4 ± 0.1% 1.86 8.52 24 Ro1BPa2-4 10.7 ± 0.4 99.6 ± 0.1% 3.03 7.91 -230 Ro1BPa2-5 9.78 ± 0.34 98.4 ± 0.2% 0.695 7.75 300
Ro1CPa1-4 17.4 ± 0.6 98.7 ± 0.1% 0.872 8.38 144 Ro1CPa1-5 16.0 ± 0.6 99.7 ± 0.1% 4.38 8.45 129 Ro1CPa2-4 17.8 ± 0.6 99.8 ± 0.1% 6.74 8.84 49 Ro1CPa2-5 8.61 ± 0.30 99.3 ± 0.1% 1.61 7.92 -36
13(16)
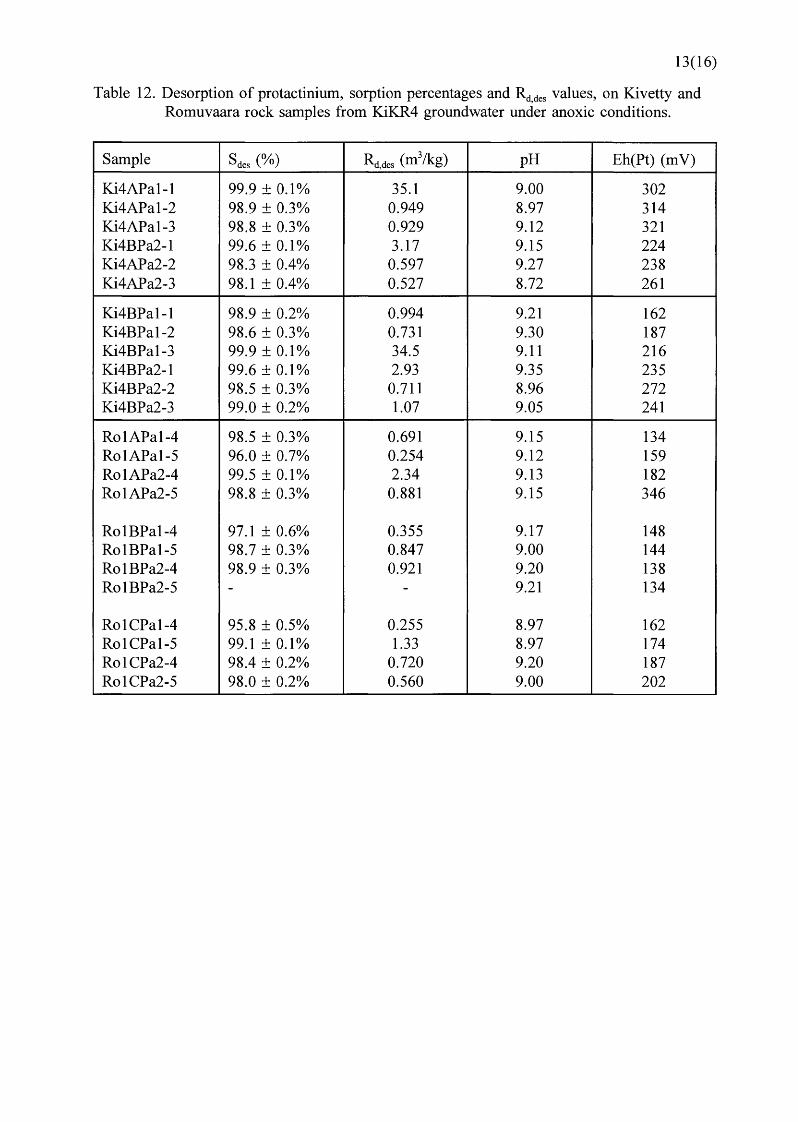
Table 12. Desorption of protactinium, sorption percentages and Rd,des values, on Kivetty and Romuvaara rock samples from KiKR4 groundwater under anoxic conditions.
Sample sdes (%) Rd,des (m3/kg) pH Eh(Pt) (mV)
Ki4APa1-1 99.9 ± 0.1% 35.1 9.00 302 Ki4APa1-2 98.9 ± 0.3% 0.949 8.97 314 Ki4APa1-3 98.8 ± 0.3% 0.929 9.12 321 Ki4BPa2-1 99.6 ± 0.1% 3.17 9.15 224 Ki4APa2-2 98.3 ± 0.4% 0.597 9.27 238 Ki4APa2-3 98.1 ± 0.4% 0.527 8.72 261
Ki4BPa1-1 98.9 ± 0.2% 0.994 9.21 162 Ki4BPa1-2 98.6 ± 0.3% 0.731 9.30 187 Ki4BPa1-3 99.9±0.1% 34.5 9.11 216 Ki4BPa2-1 99.6 ± 0.1% 2.93 9.35 235 Ki4BPa2-2 98.5 ± 0.3% 0.711 8.96 272 Ki4BPa2-3 99.0 ± 0.2% 1.07 9.05 241
Ro1APa1-4 98.5 ± 0.3% 0.691 9.15 134 Ro1APa1-5 96.0 ± 0.7% 0.254 9.12 159 Ro1APa2-4 99.5 ± 0.1% 2.34 9.13 182 Ro1APa2-5 98.8 ± 0.3% 0.881 9.15 346
Ro1BPa1-4 97.1 ± 0.6% 0.355 9.17 148 Ro1BPa1-5 98.7 ± 0.3% 0.847 9.00 144 Ro1BPa2-4 98.9 ± 0.3% 0.921 9.20 138 Ro1BPa2-5 - - 9.21 134
Ro1CPa1-4 95.8 ± 0.5% 0.255 8.97 162 Ro1CPa1-5 99.1 ± 0.1% 1.33 8.97 174 Ro1CPa2-4 98.4 ± 0.2% 0.720 9.20 187 Ro1CPa2-5 98.0 ± 0.2% 0.560 9.00 202
14(16)
Table 13. Sorption of protactinium, sorption percentages and Rd values, on Palmottu rock samples from Palmottu groundwater under anoxic conditions.
Sample Undissolved ss (%) Rd (m3/kg) pH Eh(Pt) (mV) fraction (%)
Pa1Pa1-1 4.45 ± 0.51 99.7 ± 0.1% 4.70 8.54 -136 Pa1Pa1-2 15.3 ± 1.8 99.6 ± 0.1% 2.82 8.34 -161 Pa1Pa1-3 1.79 ± 0.21 99.0 ± 0.2% 1.02 8.32 -155
Pa2Pa1-1 4.67 ± 0.54 99.5 ± 0.1% 2.03 8.64 -356 Pa2Pa1-2 6.60 ± 0.76 99.7 ± 0.1% 4.27 8.71 -337 Pa2Pa1-3 8.18 ± 0.94 99.6 ± 0.1% 3.05 8.71 -375
Table 14. Desorption of protactinium, sorption percentages and Rd,des values, on Palmottu rock samples from Palmottu groundwater under anoxic conditions.
Sample sdes (%) Rd,des (m3/kg) pH Eh(Pt) (mV)
Pa1Pa1-1 99.7 ± 0.1% 3.48 8.53 -149 Pa1Pa1-2 99.4 ± 0.2% 1.94 8.73 -163 Pa1Pa1-3 98.9 ± 0.3% 0.942 8.80 -173
Pa2Pa1-1 99.7 ± 0.1% 3.67 8.80 -186 Pa2Pa1-2 99.5 ± 0.2% 2.07 8.90 -194 Pa2Pa1-3 99.6 ± 0.2% 2.92 8.84 -191
Table 15. Sorption of protactinium, sorption percentages and Rd values, on Palmottu rock samples from Palmottu groundwater under oxic conditions.
Sample Undissolved fraction ss(%) Rd (m3/kg) (%)
Pa1Pa1-1 0.200 ± 0.028 99.9±0.1% 33.5 Pa1Pa1-2 0.321 ± 0.043 99.8 ± 0.1% 5.63 Pa1Pa1-3 0.151 ± 0.022 99.9±0.1% 14.3
Pa2Pa1-1 0.101 ± 0.015 99.8±0.1% 5.58 Pa2Pa1-2 0.522 ± 0.067 99.7 ± 0.1% 4.71 Pa2Pa1-3 0.159 ± 0.023 99.9 ± 0.1% 19.9
15(16)
Table 16. Concentration of Tc-99 in groundwater/crushed rock samples under anoxic conditions.
Ground water Rock Tc-99 Tc-99 in water pH Eh(Pt) (mV) undissolved (%) (%)
RoKR5 no rock 0.50 74.3 8.34 106 0.38 84.6 9.10 97 0.32 88.7 7.75 201 1.05 83.9 8.33 94
KiKR4 no rock 1.55 40.3 7.14 295 1.04 63.6 7.35 224
Ro1A 2.56 52.5 8.72 122 1.85 2.13 9.36 74
Ki4A 3.21 0.06 8.57 100 0.88 0.53 8.59 42
01KR5 no rock 2.63 86.5 8.15 -213 2.06 87.7 8.13 -218 5.13 87.6 8.07 -220
011 2.31 10.6 8.12 -168 0.655 11.6 8.26 -123 1.32 20.4 8.38 -101
012A 3.12 0.10 8.19 -175 0.612 6.10 8.54 -99 1.04 12.5 8.40 -83
012B 2.47 4.37 8.14 -172 0.947 14.0 8.34 -131 1.11 5.61 8.43 -165
16(16)
Table 17. Sorption of protactinium, sorption percentages and~ values, on Romuvaara rock thin sections under oxic conditions.
from RoKR5 groundwater from 01KR5 groundwater
Sample ss(%) ~-10-5 (m2/m3) Sample ss(%) ~-10-5 (m2/m3
)
Ro1A-6 5,92 11,3 Ro1A-9 61,33 269 Ro1A-7 2,70 4,43 Ro1A-10 68,25 365 Ro1A-8 8,84 16,2 Ro1A-11 69,71 403 Ro1B-6 9,15 17,4 Ro1B-9 73,36 426 Ro1B-7 4,39 8,51 Ro1B-10 72,56 463 Ro1B-8 8,69 15,4 Ro1B-11 73,95 192 Ro1C-6 7,89 13,7 Ro1C-9 74,75 470 Ro1C-7 5,43 9,27 Ro1C-10 77,43 571 Ro1C-8 6,49 11 '1 Ro1C-11 76,65 547
Table 18. Sorption of protactinium, sorption percentages and ~ values, on Kivetty rock thin sections under oxic conditions.
from KiKR4 groundwater from 01KR5 groundwater
Sample ss (%) ~-10-5 (m2/m3) Sample ss (%) ~-10-5 (m2/m3
)
Ki4A-4 3,58 5,91 Ki4A-7 62,12 260 Ki4A-5 4,21 6,06 Ki4A-8 71,24 399 Ki4A-6 5,42 7,66 Ki4A-9 72,45 411 Ki4B-4 3,12 4,45 Ki4B-7 - -Ki4B-5 6,47 9,12 Ki4B-8 13,61 23 Ki4B-6 5,60 8,57 Ki4B-9 - -
Table 19. Sorption of protactinium, sorption percentages and~ values, on Olkiluoto rock thin sections under oxic conditions.
from 01KR5 groundwater from KiKR4 groundwater
Sample ss (%) ~-1 o-5 (m2/m3) Sample ss (%) ~-10-5 (m2/m3
)
011-6 71,53 386 011-9 25,87 62,6 011-7 66,95 349 011-10 28,02 62,8 011-8 71,06 417 011-11 28,73 58,2 012A-6 74,60 498 012A-9 28,60 65,9 012A-7 76,51 535 012A-10 27,48 60,1 012A-8 73,76 418 012A-11 73,34 296 012B-6 72,89 436 012B-9 67,58 315 012B-7 71,89 473 012B-10 69,61 389 012B-8 74,10 481 012B-11 66,15 321
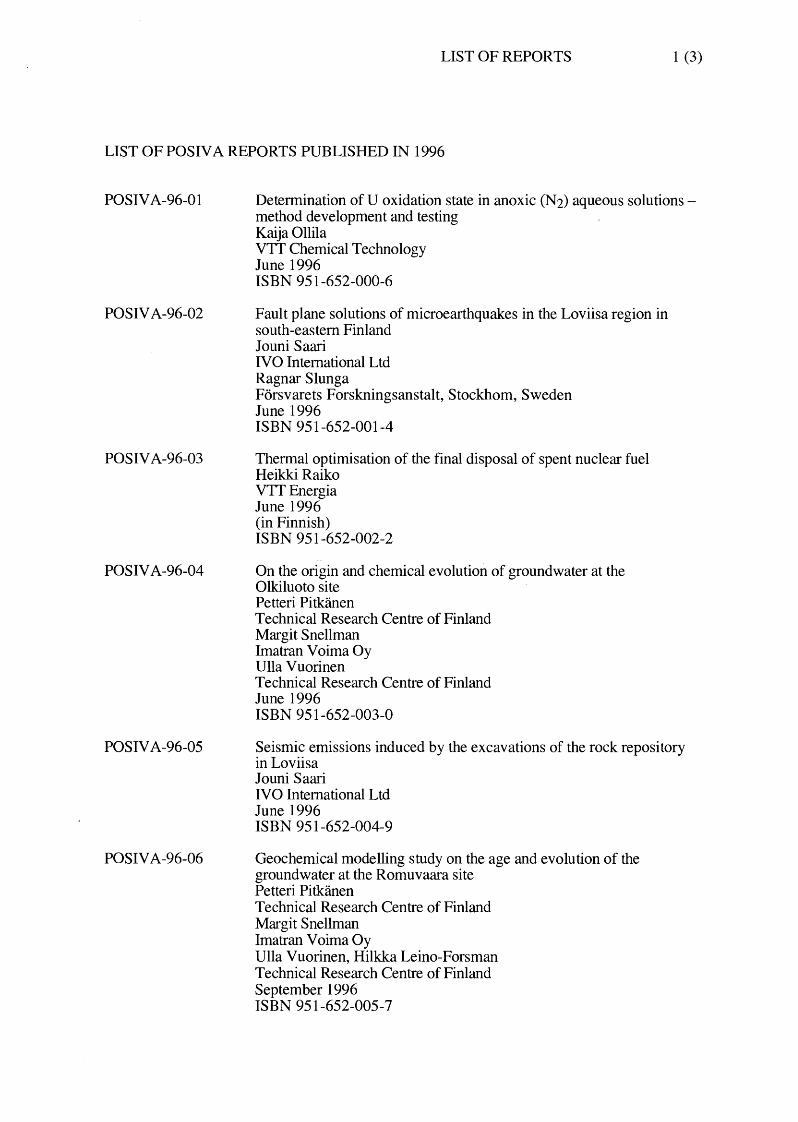
LIST OF REPORTS 1 (3)
LIST OF POSIV A REPORTS PUBLISHED IN 1996
POSIV A-96-01
POSIV A-96-02
POSIV A-96-03
POSIV A-96-04
POSIV A-96-05
POSIV A-96-06
Determination of U oxidation state in anoxic (N2) aqueous solutionsmethod development and testing Kaija Ollila VTT Chemical Technology June 1996 ISBN 951-652-000-6
Fault plane solutions of microearthquakes in the Loviisa region in south-eastern Finland Jouni Saari IVO International Ltd Ragnar Slunga Forsvarets Forskningsanstalt, Stockhom, Sweden June 1996 ISBN 951-652-001-4
Thermal optimisation of the final disposal of spent nuclear fuel Heikki Raiko VTTEnergia June 1996 (in Finnish) ISBN 951-652-002-2
On the origin and chemical evolution of ground water at the Olkiluoto site Petteri Pitkanen Technical Research Centre of Finland Margit Snellman Imatran Voima Oy Ulla Vuorinen Technical Research Centre of Finland June 1996 ISBN 951-652-003-0
Seismic emissions induced by the excavations of the rock repository in Loviisa Jouni Saari IVO International Ltd June 1996 ISBN 951-652-004-9
Geochemical modelling study on the age and evolution of the groundwater at the Romuvaara site Petteri Pitkanen Technical Research Centre of Finland Margit Snellman Imatran Voima Oy Ulla Vuorinen, Hilkka Leino-Forsman Technical Research Centre of Finland September 1996 ISBN 951-652-005-7
POSIV A-96-07
POSIV A-96-08
POSIV A-96-09
POSIV A-96-1 0
POSIVA-96-11
POSIVA-96-12
POSIVA-96-13
LIST OF REPORTS 2 (3)
Boring of full scale deposition holes using a novel dry blind boring method Jorma Autio, Timo Kirkkomaid Saanio & Riekkola Consulting Engineers November 1996 ISBN 951-652-006-5
Production methods and costs of oxygen free copper canisters for nuclear waste disposal Harri Aalto, Hannu Rajainmaki, Lenni Laakso Outokumpu Poricopper Oy October 1996 ISBN 951-652-007-3
Characterization of the excavation disturbance caused by boring of the experimental full scale deposition holes in the Research Tunnel at Olkiluoto Jorma Autio Saanio & Riekkola Consulting Engineers December 1996 ISBN 951-652-008-1
Gamma and neutron dose rates on the outer surface of the nuclear waste disposal canisters Markku Anttila VTTEnergy December 1996 ISBN 951-652-009-X
Criticality safety calculations for the nuclear waste disposal canisters Markku Anttila VTTEnergy December 1996 ISBN 951-652-010-3
Assessment of alternative disposal concepts Jorma Autio, Timo Saanio, Pasi Tolppanen Saanio & Riekkola Consulting Engineers Heikki Raiko, Timo Vieno VTTEnergy Jukka-Pekka Salo Posiva Oy December 1996 ISBN 951-652-011-1
Design report of the canister for nuclear fuel disposal Heikki Raiko VTTEnergy Jukka-Pekka Salo Posiva Oy December 1996 ISBN 951-652-012-X
POSIV A -96-14
POSIV A -96-15
POSIVA-96-16
POSIV A-96-17
POSIVA-96-18
LIST OF REPORTS 3 (3)
Final disposal of spent nuclear fuel in the Finnish bedrock, technical research and development in the period 1993-1996 Posiva Oy December 1996 (in Finnish) ISBN 951-652-013-8
The HyrkkoHi native copper mineralization as a natural analogue for copper canisters Nuria Marcos Helsinki University of Technology Laboratory of Engineering Geology and Geophysics October 1996 ISBN 951-652-014-6
Final disposal of spent fuel in the Finnish bedrock, scope and requirements for site specific safety analysis Posiva Oy December 1996 (in Finnish) ISBN 951-652-015-4
Interim report on safety assessment of spent fuel disposal TILA-96 Timo Vieno, Henrik Nordman VTTEnergy December 1996 ISBN 951-652-016-2
Sorption of protactinium on rocks in ground waters from Posiva investigation sites Seija Kulmala, Martti Hakanen University of Helsinki Department of Chemistry Radiochemistry laboratory Antero Lindberg Geological Survey of Finland December 1996 ISBN 951-652-017-0