substantial liquid assets (usd billion)
TRANSCRIPT
S E P T E M B E R2 0 2 1

contentsCAF Overview01
Financial Highlights02
Funding Strategy03
Key Investment Factors04
OverviewCAF

CAF is a Supranationalfinancial institution owned by Latin American countries
The Development Bank of Latin America
More than 50 years financing sustainable development and regional integration
Leading development bank in financing infrastructure and energy projects in Latin America
Enjoys Preferred Creditor Treatment in its shareholder countries
Rated Aa3/A+/A+/AA by Moody’s, S&P, Fitch and JCR
Figures as of June 30, 2021
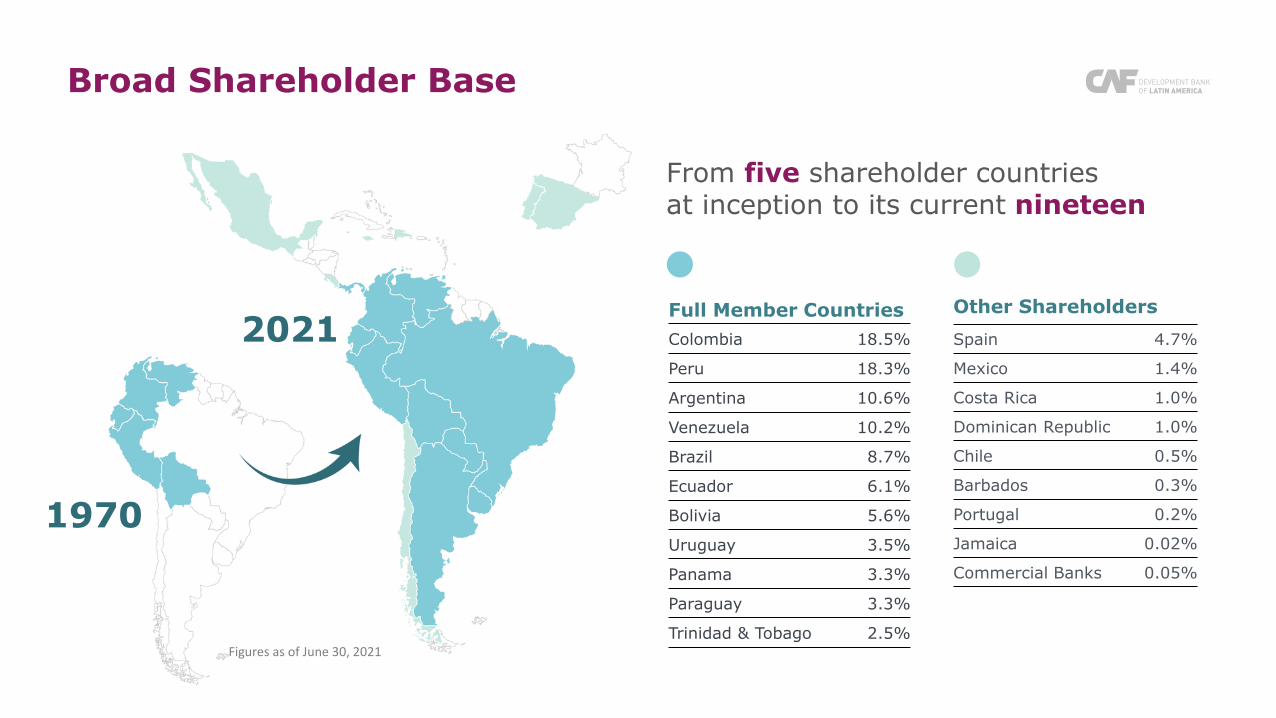
Broad Shareholder Base
2021
1970
From five shareholder countries at inception to its current nineteen
Full Member Countries
Colombia 18.5%
Peru 18.3%
Argentina 10.6%
Venezuela 10.2%
Brazil 8.7%
Ecuador 6.1%
Bolivia 5.6%
Uruguay 3.5%
Panama 3.3%
Paraguay 3.3%
Trinidad & Tobago 2.5%
Other Shareholders
Spain 4.7%
Mexico 1.4%
Costa Rica 1.0%
Dominican Republic 1.0%
Chile 0.5%
Barbados 0.3%
Portugal 0.2%
Jamaica 0.02%
Commercial Banks 0.05%
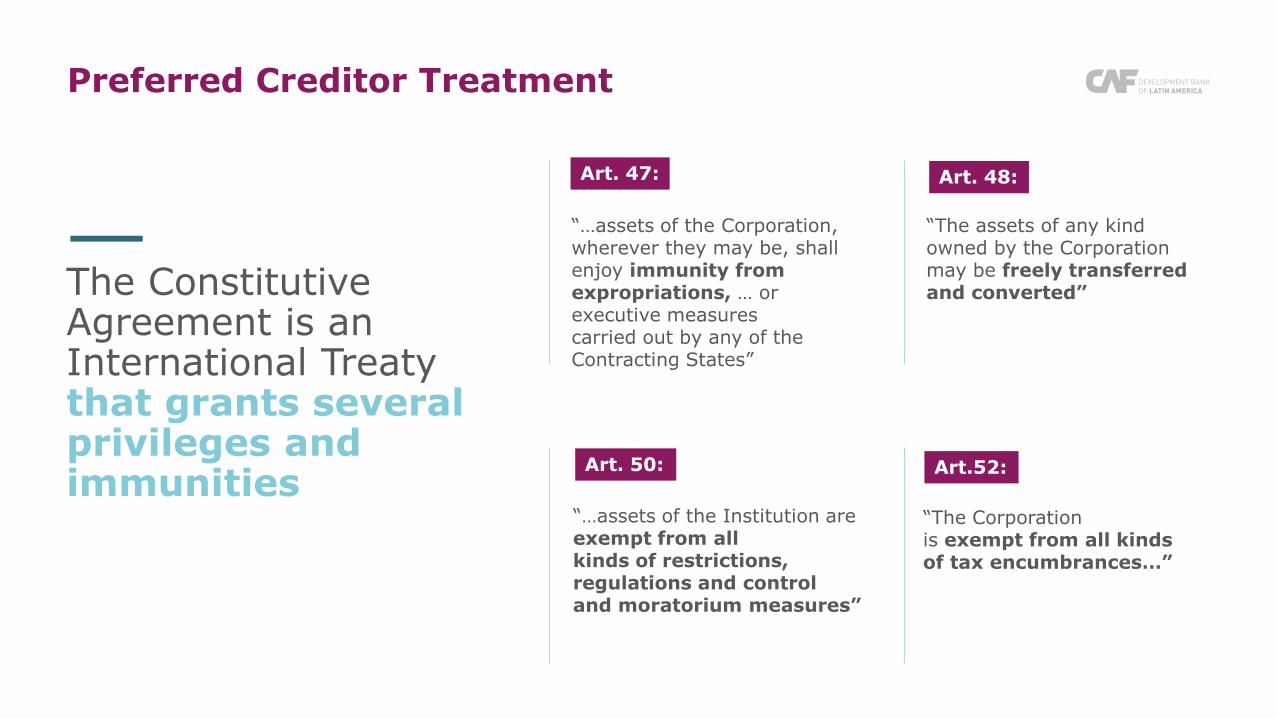
Preferred Creditor Treatment
The Constitutive Agreement is an International Treaty that grants several privileges and immunities
“…assets of the Corporation, wherever they may be, shall enjoy immunity from expropriations, … or executive measures carried out by any of the Contracting States”
Art. 47: Art. 48:
Art. 50: Art.52:
“The assets of any kind owned by the Corporation may be freely transferred and converted”
“…assets of the Institution are exempt from all kinds of restrictions, regulations and control and moratorium measures”
“The Corporation is exempt from all kinds of tax encumbrances…”

(*) Assigned by Moody’s
Proven Preferred Creditor Treatment
CAF’s Rating(*)
Peru Moratorium on external debt payments
VenezuelaForeign Exchange controls
Mexico“Tequila Crisis”
AsiaFinancial Crisis
19941980’s
BoliviaHIPC Initiative
RussiaDefault on debt
1998
1997
ArgentinaFinancial crisis and default on external debt
2001-2002
VenezuelaOil Strike
2003
USASubprime Mortgage Crisis
2007
EcuadorDefault on several bonds
2008
EuropeSovereign debt crisis
2009
EMCommodity Prices downturn
2012
VenezuelaSelective Default
2017
Baa3 Baa2 A3 A2 A1 Aa3
2020
COVID-19

HighlightsFinancial

Figures as of June 30, 2021
Strong & Liquid Balance Sheet(USD billion)
$2.4(5%)
$26.7(56%)
$18.2 (39%)
47.2
Liquidity
Loans
Others
Assets
$13.0 (27%)
$ 1.6 (3%)
32.6 (69%)
47.2
Borrowings
Others
Stockholders' Equity
Liabilities/Equity

12.012.7 13.0
13.914.7
18.2
2016 2017 2018 2019 2020 2021
Substantial Liquid Assets(USD billion)
Figures as of December 31 of each year
*Figures as of June 30, 2021
Breakdown by GeographyLiquid Assets
Australia & NZ 1.9%
Europe 31.3%
Middle East 9.3%
Latam 5.4%
US & Canada 25.2%
Asia 25.2%
Supranationals 1.7%
*
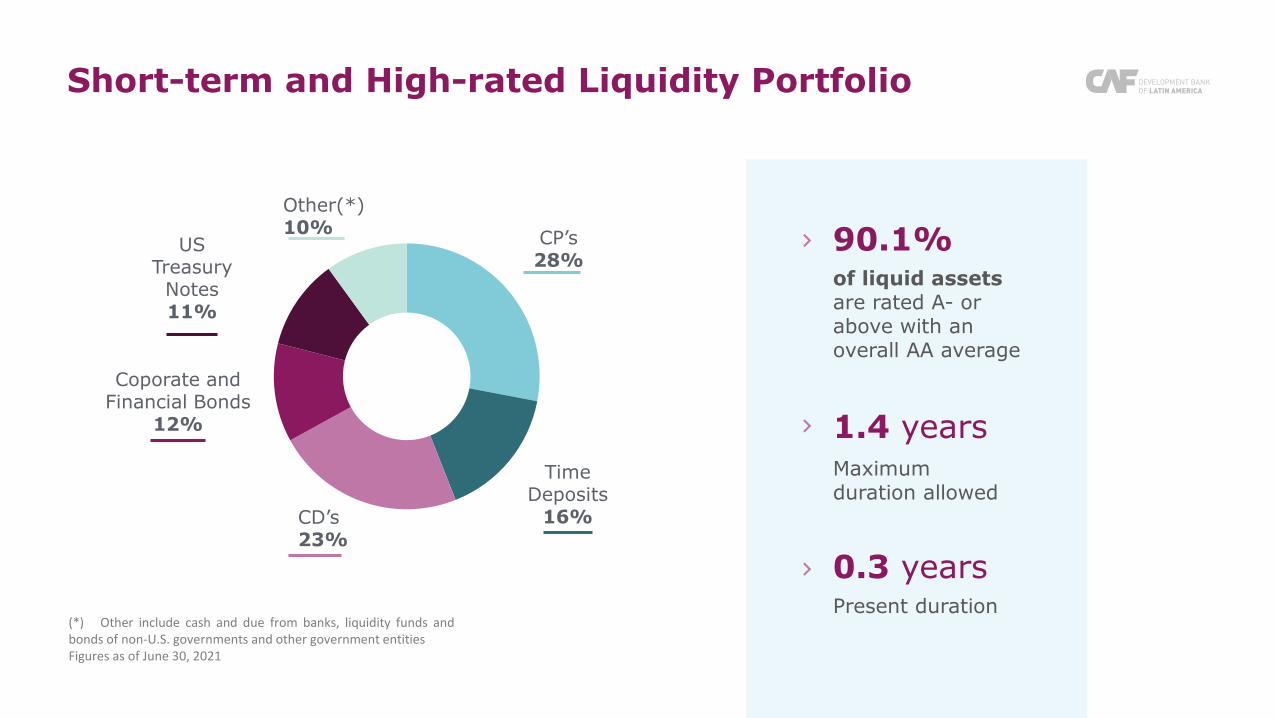
(*) Other include cash and due from banks, liquidity funds andbonds of non-U.S. governments and other government entitiesFigures as of June 30, 2021
Short-term and High-rated Liquidity Portfolio
Other(*)10%
CP’s28%
Time Deposits
16%
Coporate and Financial Bonds
12%
CD’s23%
US Treasury
Notes11%
of liquid assets are rated A- or above with an overall AA average
90.1%
1.4 years
0.3 yearsPresent duration
Maximum duration allowed
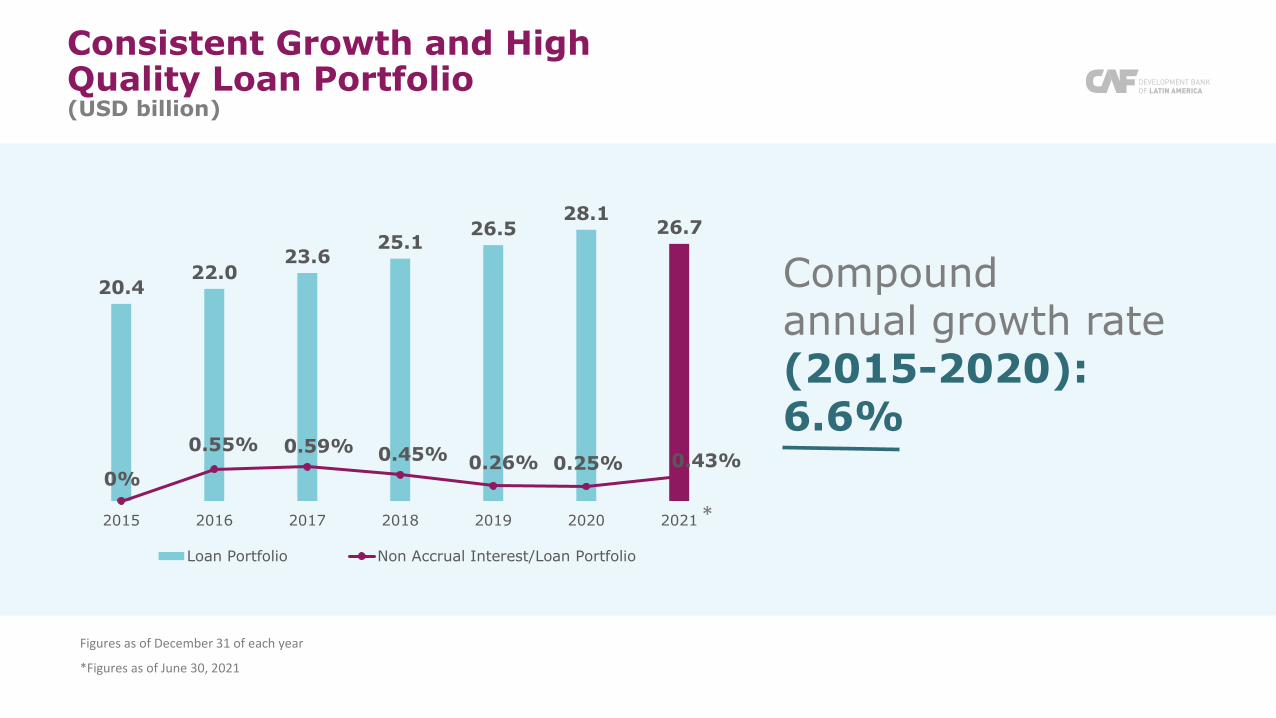
20.422.0
23.625.1
26.528.1
26.7
0%
0.55% 0.59% 0.45% 0.26% 0.25% 0.43%
0,00%
1,00%
2,00%
3,00%
4,00%
5,00%
-
5,0
10,0
15,0
20,0
25,0
30,0
2015 2016 2017 2018 2019 2020 2021
Loan Portfolio Non Accrual Interest/Loan Portfolio
Consistent Growth and High Quality Loan Portfolio(USD billion)
Compound annual growth rate (2015-2020): 6.6%
*
Figures as of December 31 of each year
*Figures as of June 30, 2021

Figures as of June 30, 2021
Diversified Loan PortfolioBy Country & Sector
Public Sector
95%
Private Sector
5%Colombia 10.8%
Argentina 13.2%
Bolivia 10.6%
Barbados 0.6%
Brazil 8.0%
Costa Rica 2.1%
Chile 0.9%
DominicanRepublic 0.5%
Ecuador 14.6%Jamaica 0.0%
Spain 0.0%
Mexico 2.4%
Panama 7.9%
Paraguay 4.4%
Venezuela 11.4%
Trinidad & Tobago 3.9%
Peru 5.4%
Uruguay 3.4%

Diversified Loan PortfolioBy Industries
Transportation27.3%
Energy 15.5%
Water7.2%
Public Administration31.3%
Financial6.2%
Others12.5%
Figures as of June 30, 2021

Strong Capital Base(USD billion)
10.511.1
11.912.8
13.0 13.0
2016 2017 2018 2019 2020 2021
Retained Earnings & Reserves
(3.8 bn)
Paid-in capital
(9.2 bn)
In addition, CAF has USD 1.6 bn in callable capital
Figures as of June 30, 2021
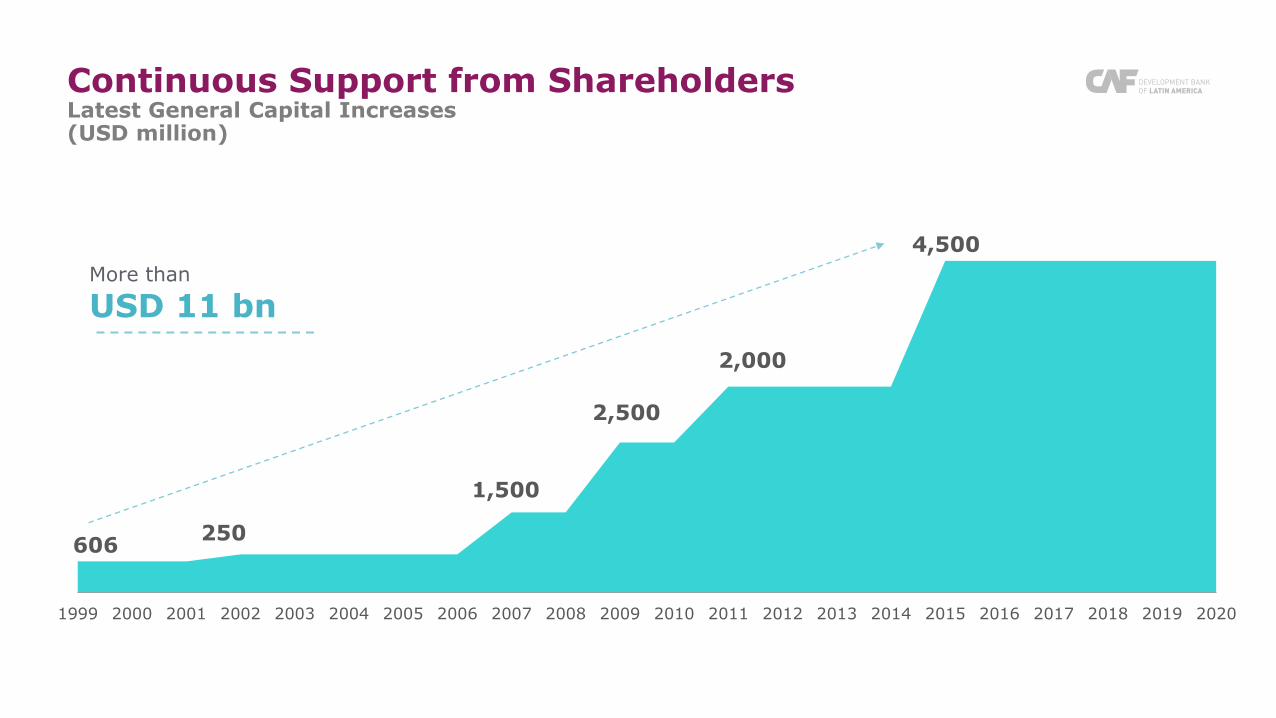
250
1,500
2,500
2,000
4,500
1999 2000 2001 2002 2003 2004 2005 2006 2007 2008 2009 2010 2011 2012 2013 2014 2015 2016 2017 2018 2019 2020
606
Continuous Support from ShareholdersLatest General Capital Increases (USD million)
More than
USD 11 bn

CAF vs AAA Rated Multilateral Institutions
Multilateral Financial Institution
CAF’sRanking
Ratings (Fitch/Moody’s/S&P)
A+/Aa3/A+ AAA/Aaa/AAA AAA/Aaa/AAA AAA/Aaa/AAA AAA/Aaa/AAA AAA/Aaa/AAA
Equity / Assets (%) 1st 28 22 22 19 26 14
Liquidity /Total Assets (%) 3rd 31 26 32 18 47 29
Largest Exposure /Total Portfolio (%) 2nd 15 17 20 16 19 9
Impaired loans and advances/ Total loans (%) 3rd 0.3 2.4 2.7 0.1 4.2 0.2
Source: Standard & Poor’s “Supranational Special Edition 2021”. Figures as of end of year 2020 * IBRD
*
StrategyFunding

Composition of Financial Liabilities
Long-term loans
5%Term
Deposits
10%
CP's
6%
Bonds
79%
CAF’s debt maturity profile is in line with
the average life of its assets
Figures as of June 30, 2021

Bond Strategy
Capital market programs in place in strategic markets
Issuance of thematic bonds
Generate various reference points
Use of private placements to modify the averageduration of liabilities
Benchmark size issues
Investor Diversification
Cost Optimization
Asset / Liability Duration Match
Liquid Bonds in Secondary Market

Capital Markets Programs
Schedule B Issuer
US Dollar Benchmark deals (USD 1-2 Bn)
Tenors 3-10 years
Included in relevant indexes
Listed in LSE exchange
US Shelf
Benchmark deals in different currencies
EUR, CHF, CAD, HKD
Targeted and custom made notes
Tenors 2-30 years
Listed (when required)
Standard documentation
EMTN
Samurai and Uridashi
Tenors 2-10 years
Japan Shelf
Australian Dollar
Benchmark deals Program size: AUD 2 Bn
Targeted towards local and foreign investors
AMTN
Aimed to foster development of local financialmarkets
Registered programs in Colombia, Peru, Mexico and Venezuela
Stand Alone Issues
Schuldschein, other
Domestic Programs
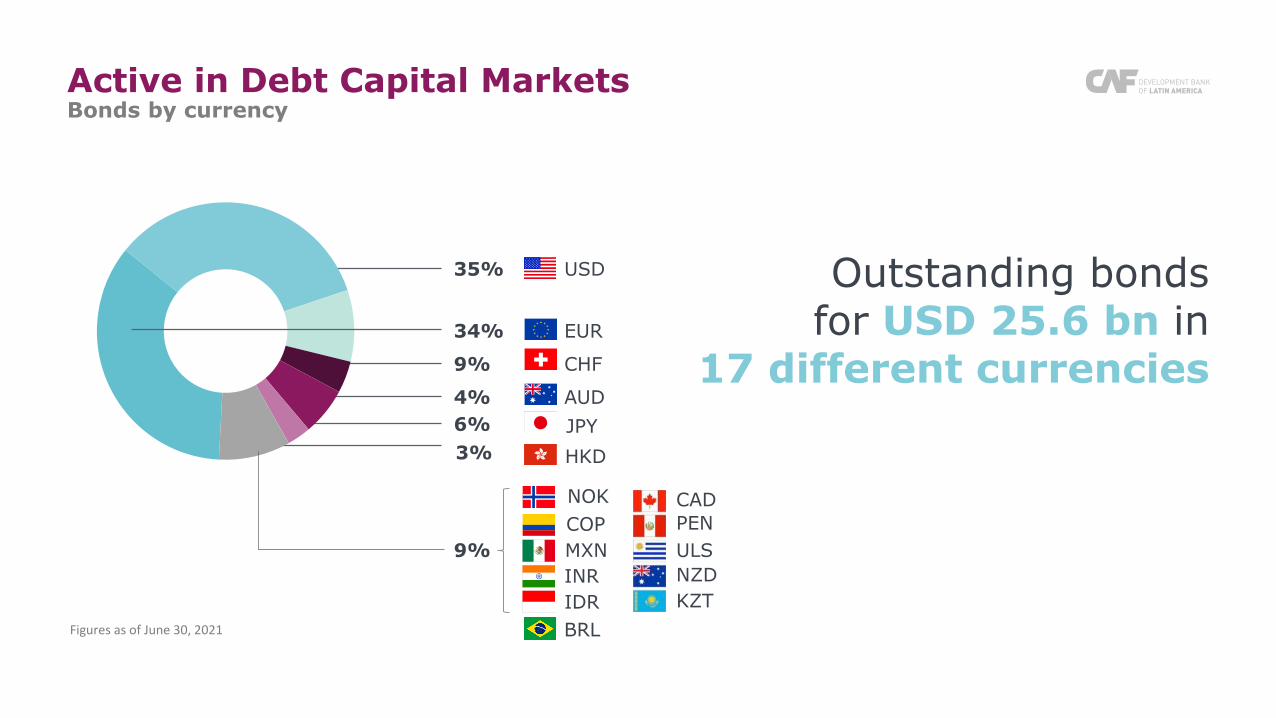
Active in Debt Capital MarketsBonds by currency
35%
34%
9%
4%
6%
9%
USD
EUR
CHF
AUD
NOK
JPY
COP
MXN
INR
IDR
CAD
PEN
ULS
NZD
KZT
Outstanding bonds for USD 25.6 bn in
17 different currencies
3% HKD
Figures as of June 30, 2021 BRL

Recent Benchmark Issues
USD 750MM
5yr
1.625%
Maturity: 2025
(Issued Sept, 2020)
Main investors were central banks and official institutions
EUR 700MM
5yr
1.625%
Maturity: 2025
(Issued June, 2020)
First Social Bond with a largeparticipation of new investors
CAF’s continuous benchmark-size issuances are a testament to itsstrengthening credit historyVery high-quality order-book
EUR 1.25BN
5yr
0.250%
Maturity: 2026
(Issued Feb, 2021)
Record order bookof EUR 1.9 Bn and 142 investors
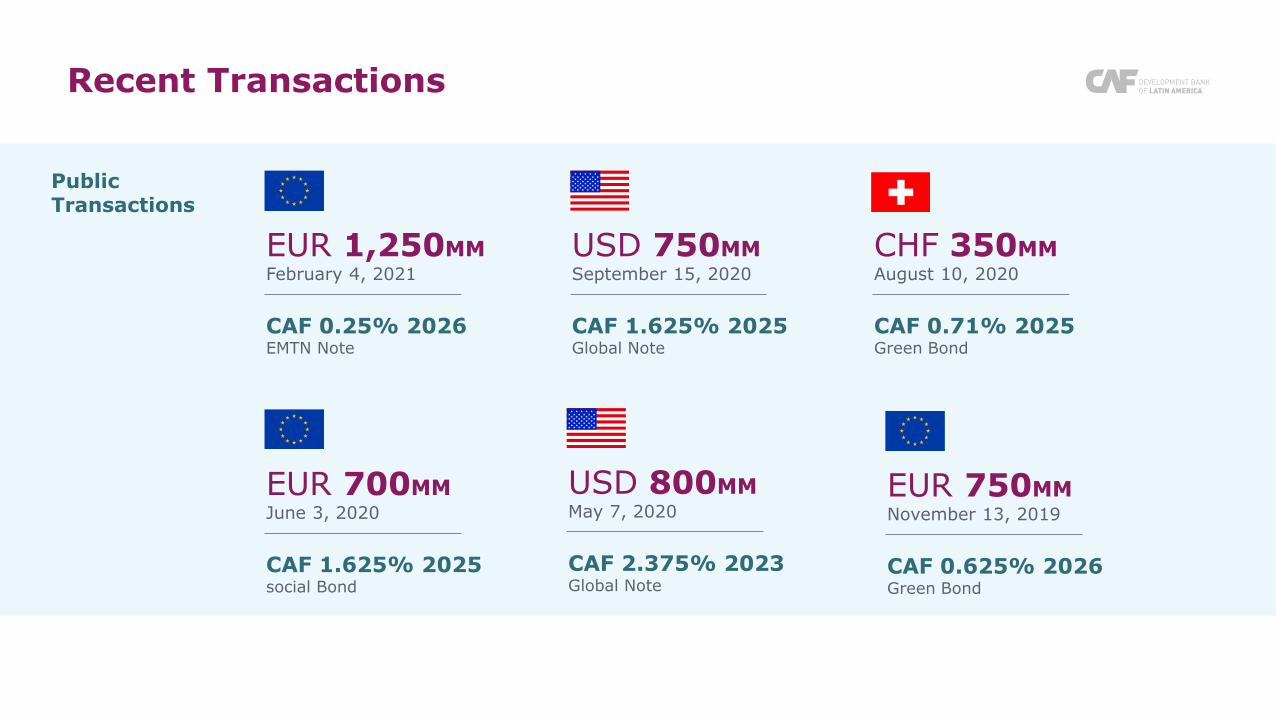
Recent Transactions
Public Transactions
USD 750MMSeptember 15, 2020
CAF 1.625% 2025Global Note
EUR 700MMJune 3, 2020
CAF 1.625% 2025social Bond
USD 800MMMay 7, 2020
CAF 2.375% 2023Global Note
EUR 750MMNovember 13, 2019
CAF 0.625% 2026Green Bond
EUR 1,250MMFebruary 4, 2021
CAF 0.25% 2026EMTN Note
CHF 350MMAugust 10, 2020
CAF 0.71% 2025Green Bond
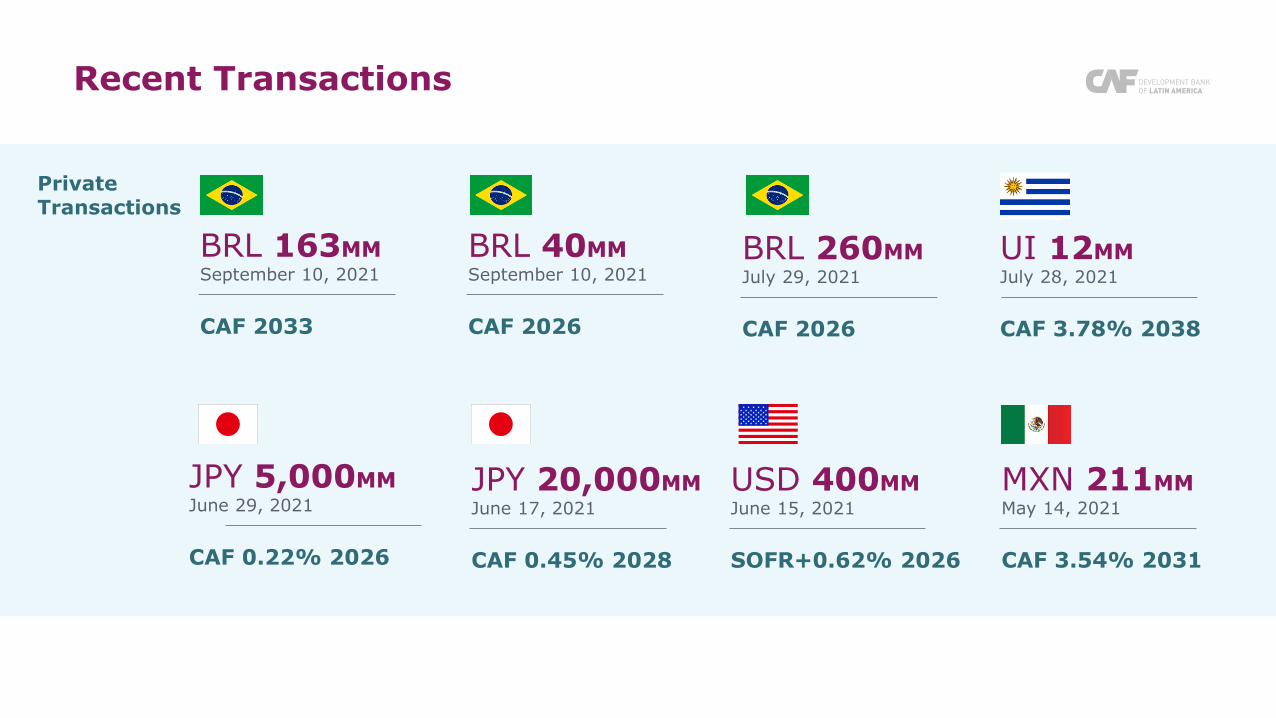
Recent Transactions
Private Transactions
JPY 5,000MMJune 29, 2021
CAF 0.22% 2026
UI 12MMJuly 28, 2021
CAF 3.78% 2038
USD 400MMJune 15, 2021
SOFR+0.62% 2026
MXN 211MMMay 14, 2021
CAF 3.54% 2031
JPY 20,000MMJune 17, 2021
CAF 0.45% 2028
BRL 40MMSeptember 10, 2021
CAF 2026
BRL 163MMSeptember 10, 2021
CAF 2033
BRL 260MMJuly 29, 2021
CAF 2026
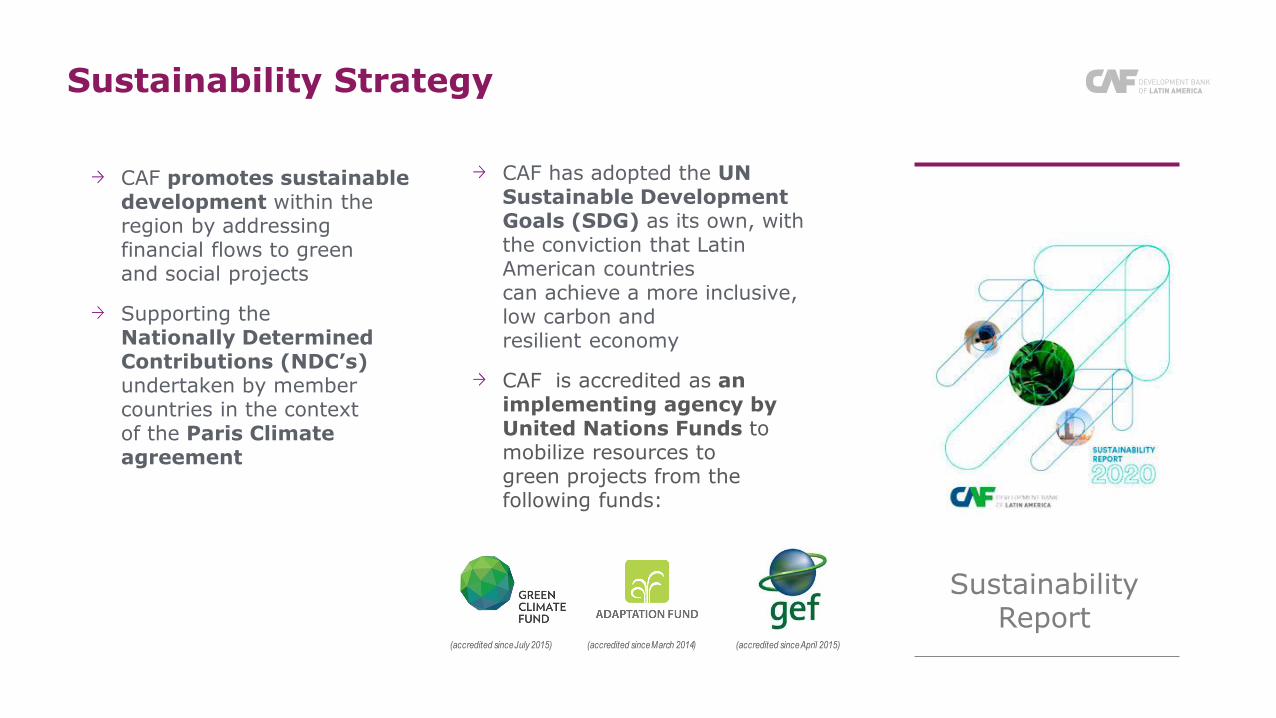
Sustainability Strategy
CAF promotes sustainable development within theregion by addressing financial flows to green and social projects
Supporting theNationally Determined Contributions (NDC’s) undertaken by member countries in the context of the Paris Climate agreement
Sustainability Report
CAF has adopted the UN Sustainable Development Goals (SDG) as its own, with the conviction that Latin American countries can achieve a more inclusive, low carbon and resilient economy
CAF is accredited as an implementing agency by United Nations Funds to mobilize resources to green projects from the following funds:
(accredited since July 2015) (accredited since March 2014) (accredited since April 2015)
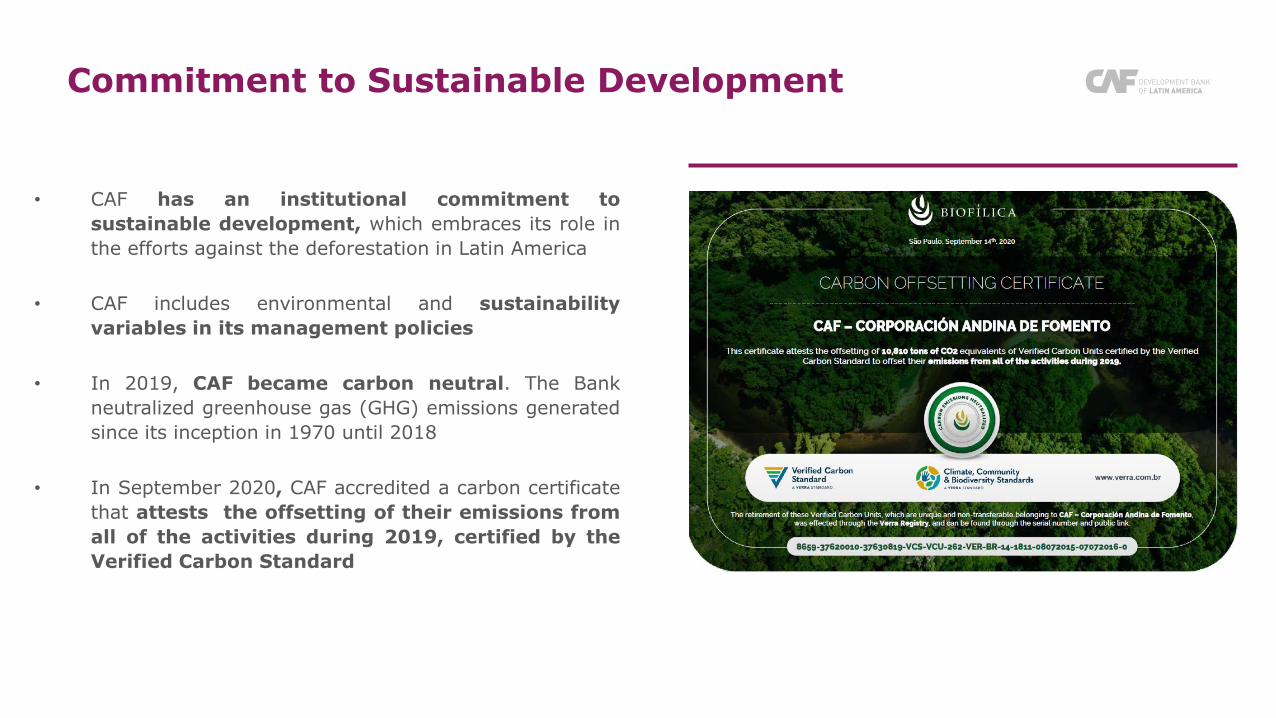
Commitment to Sustainable Development
• CAF has an institutional commitment to
sustainable development, which embraces its role in
the efforts against the deforestation in Latin America
• CAF includes environmental and sustainability
variables in its management policies
• In 2019, CAF became carbon neutral. The Bank
neutralized greenhouse gas (GHG) emissions generated
since its inception in 1970 until 2018
• In September 2020, CAF accredited a carbon certificate
that attests the offsetting of their emissions from
all of the activities during 2019, certified by the
Verified Carbon Standard

• CAF maintains robust policies for mitigating its
operational risk, which assures the continuity and
stability of its operations
• In September 2020, the British Standard Institute
(BSI) maintained its certification originally issued in
2016 confirming that CAF’s operates a Business
Continuity Management System which complies
with the requirements of ISO 22301:2012
• The Business Continuity Management System supports
the provision of the following CAF’s key services and
products: Loans, Credit Lines, Equity Stakes and
Treasury Services
Strong Operational Risk Management
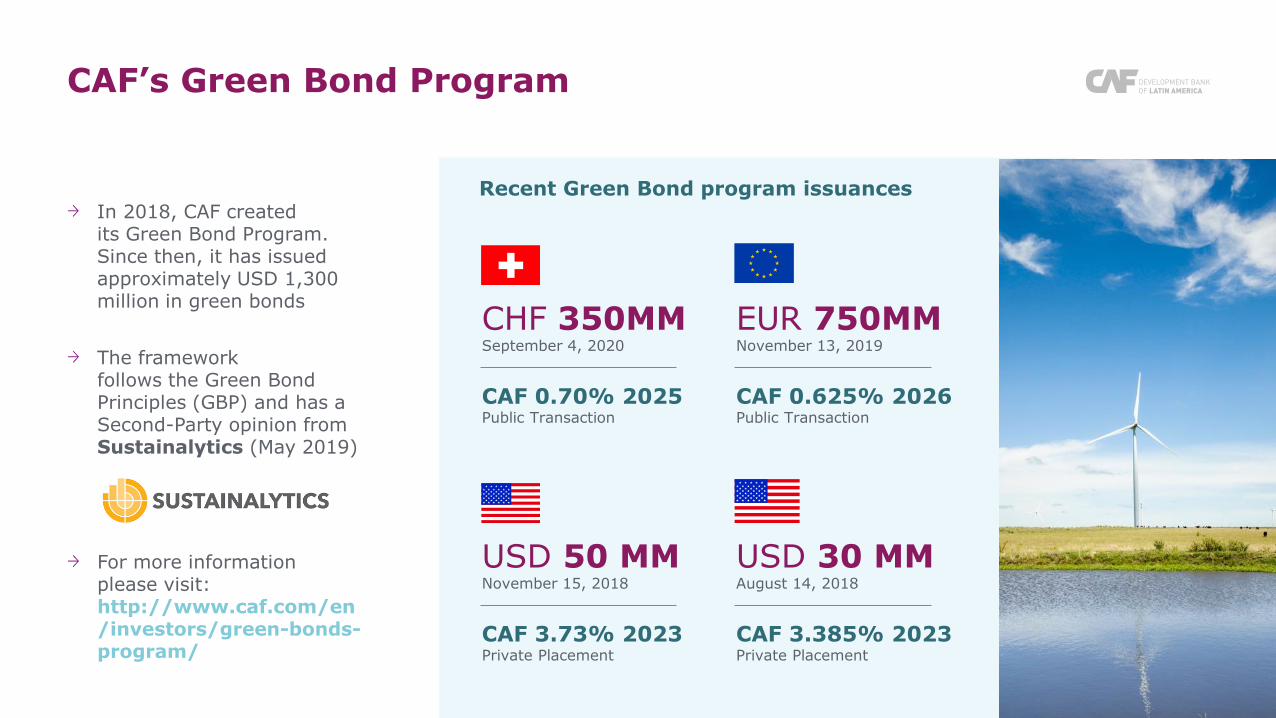
The framework follows the Green Bond Principles (GBP) and has a Second-Party opinion from Sustainalytics (May 2019)
For more information please visit: http://www.caf.com/en/investors/green-bonds-program/
CAF’s Green Bond Program
In 2018, CAF created its Green Bond Program. Since then, it has issuedapproximately USD 1,300 million in green bonds
Recent Green Bond program issuances
CHF 350MMSeptember 4, 2020
CAF 0.70% 2025Public Transaction
EUR 750MMNovember 13, 2019
CAF 0.625% 2026Public Transaction
USD 50 MMNovember 15, 2018
CAF 3.73% 2023Private Placement
USD 30 MMAugust 14, 2018
CAF 3.385% 2023Private Placement

CAF’s Social Bond Program
Recent Social Bond program issuances:
EUR 700 MMMay 27, 2020
CAF 1.625% 2025Public Transaction
In 2020, CAF created its Social Bond Program with a Use of Proceeds focused on the response to theCOVID-19 outbreak
The frameworkfollows the Social Bond Principles (SBP) and has a Second-Party opinion from Sustainalytics (October 2020)
For more information please visit: https://www.caf.com/media/2678628/caf-s-social-bondframework.pdf

USCP and ECP programs
Ratings A1/P-1/F1+
Size: USCP USD 3.0 bn ECP USD 3.0 bn
Tenors up to 1 year
Bloomberg CAF<GO>
Term Deposits
Clients: Corporate, Financial and Official Institutions
Amounts vary between US$1 – 500 million
Dealers:
Bank of America
Barclays
Bred Banque Populaire
Citibank
Goldman Sachs
ING Bank NV
JP Morgan
Short Term Liabilities

Other Sources of Funding and Cooperation
Credit Facilities
Technical Assistance
Green Funds
Agence Française de Développement (AfD)
European Investment Bank (EIB)
China Development Bank (CDB)
India Exim Bank
JBIC
KFW Bankengruppe
Korea Exim Bank
Nordic Investment Bank (NIB)
SEK – Sweden
Agence Française de Développement
BMZ – KfW
Caixa do Brasil
European Commission – LAIF
FASEP France
OFID Fund
Agencia Española de Cooperación Internacional (AECID)
Green Climate Fund
Global Environmental Fund (GEF)
InvestmentKey
Factors
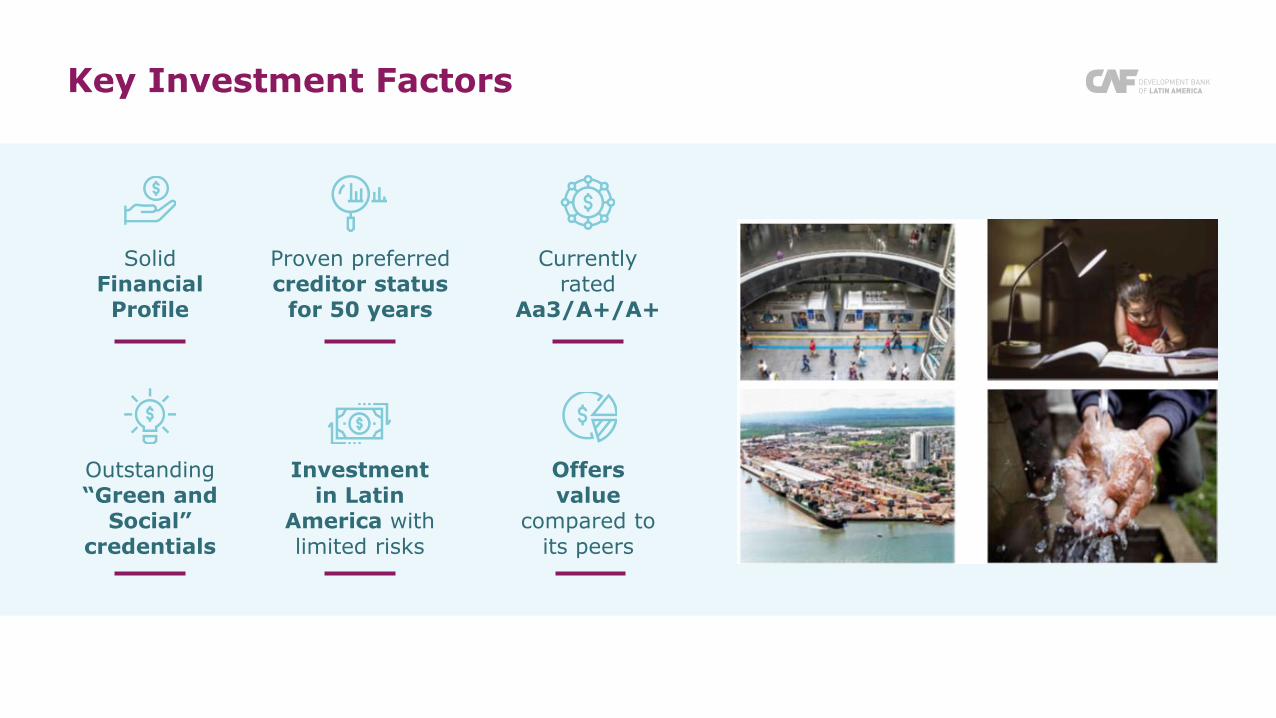
Key Investment Factors
Solid Financial Profile
Proven preferred creditor status
for 50 years
Outstanding “Green and
Social” credentials
Investment in Latin
America with limited risks
Currently rated
Aa3/A+/A+
Offers value
compared to its peers

SnapshotsProject

Highlighted Projects
Amount:
More investment for water program -Phase V (MIAGUA V):
The Tacachira wastewater treatment plant project that includes the construction of a sewage system, to serve the population of District 7 in the city of El Alto
200,000 people will benefit from a new drinking water supply
50,000 people will benefit froman improved sewage system
Bolivia USD 77 millionCountry:
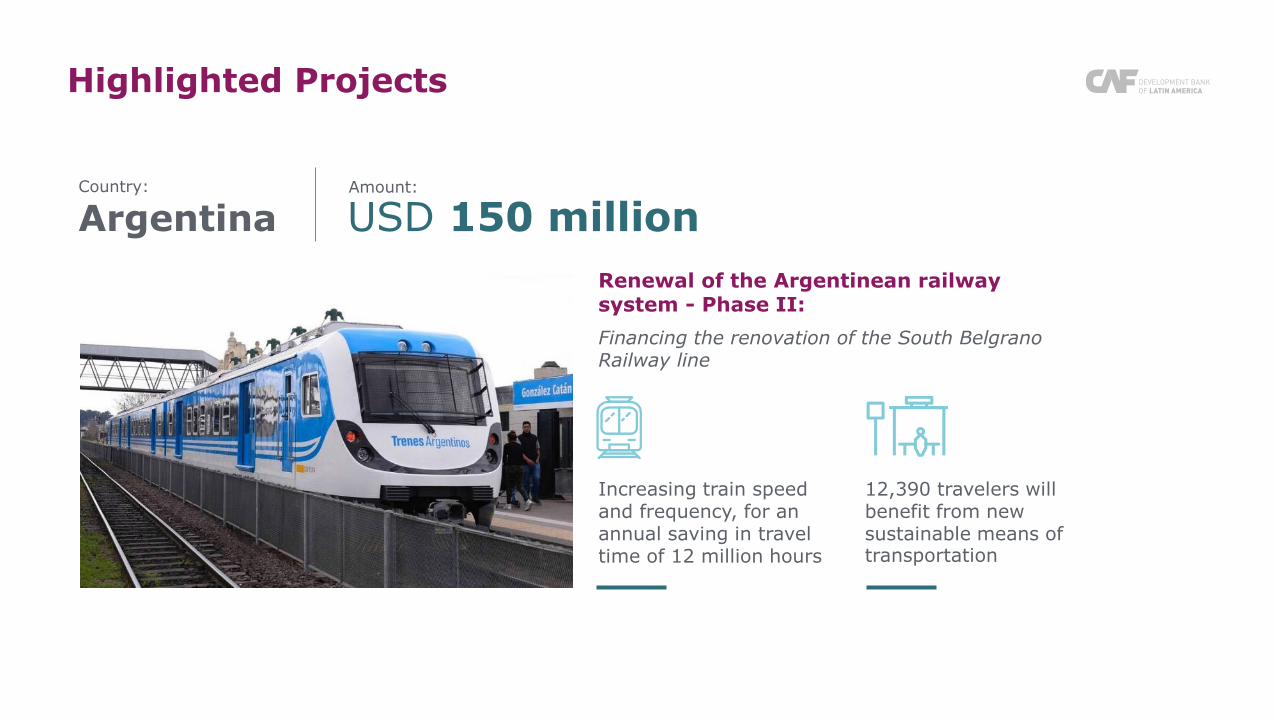
Highlighted Projects
Renewal of the Argentinean railway system - Phase II:
Financing the renovation of the South Belgrano Railway line
Increasing train speed and frequency, for an annual saving in travel time of 12 million hours
12,390 travelers will benefit from new sustainable means of transportation
Argentina USD 150 millionAmount:Country:

Highlighted Projects
Construction of Line 17 of the São Paulo Subway System
184,000 travelers will benefit from an improved means of transportation
Brazil USD 220 millionAmount:Country:

Highlighted Projects
Interconnected National and Rural Electricity Distribution System’s Transmission Strengthening Program:
5,259 km of new or rehabilitated transmission and distribution lines
2 million people will benefit froman improved energy infrastructure
Paraguay USD 170 million
Increase the electricity supply reliability and security of theeast, north, south and central systems in the country, as well as improve the distribution infrastructure in the eastern region
Amount:Country:
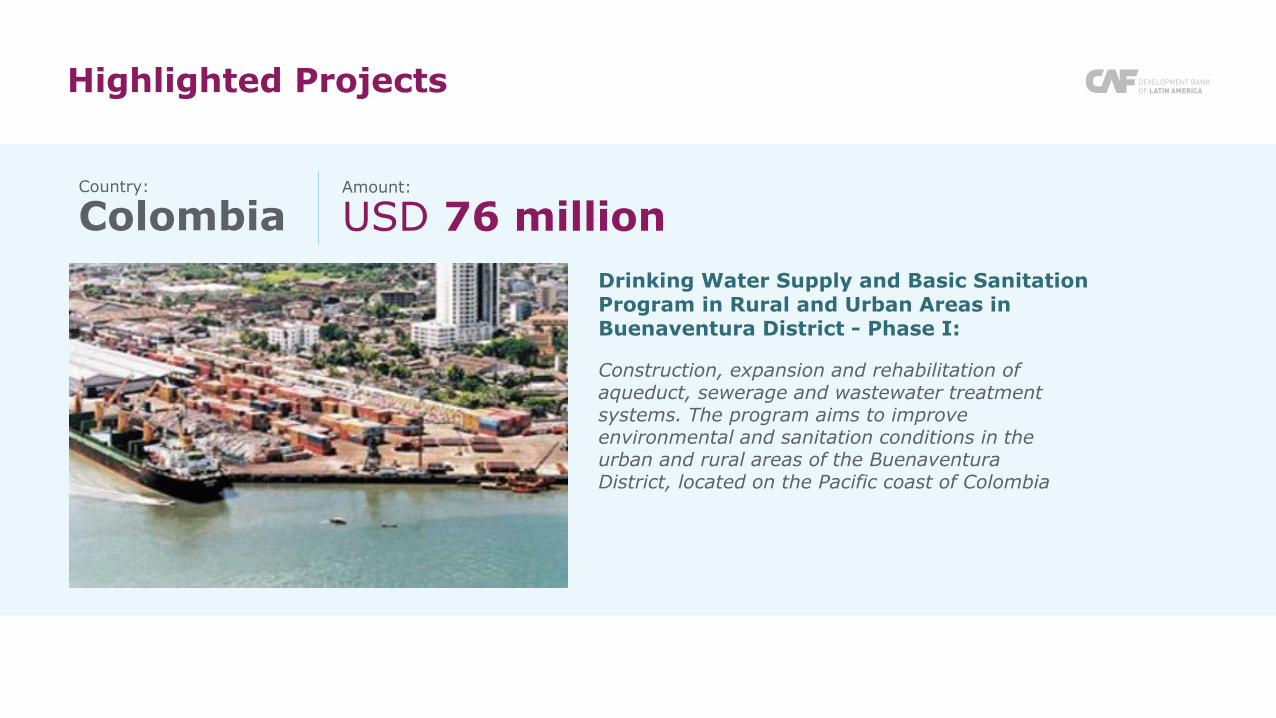
Highlighted Projects
Drinking Water Supply and Basic Sanitation Program in Rural and Urban Areas in Buenaventura District - Phase I:
Colombia USD 76 million
Construction, expansion and rehabilitation of aqueduct, sewerage and wastewater treatment systems. The program aims to improve environmental and sanitation conditions in theurban and rural areas of the Buenaventura District, located on the Pacific coast of Colombia
Amount:Country:

Everything we dobegins with you
www.caf.com@AgendaCAF
Disclaimer
This presentation is for informational purposes only; it does not constitute an offer to sell or solicitation of an offer to buy any of Corporación Andina de Fomento’s securities in any jurisdiction to any person to whom it is unlawful to make such an offer or solicitation.
not guarantee, nor can it be held liable for, the content, or the accuracy, truthfulness or completeness, of thematerial in this document. Additionally, CAF shall under no circumstances be held liable for losses, damages, liabilities or expenses incurred or assumed as a result of the use of this document. CAF, in its sole
The information contained in this document is subjectto changes, modifications, additions, clarifications and/or substitutions.Corporación Andina de Fomento (“CAF”) is not responsible for theinformation contained in this presentation nor for theimplications there of that could be made. CAF does

Disclaimer
discretion, may add, change or update this document and its contents without prior notice.
ACCORDINGLY, THE USE OF THIS DOCUMENT AND ITS CONTENTS IS THE EXCLUSIVE RESPONSBILITY OF THE USER, AT ITS OWN RISK. Potential users should conduct their
Nothing in this presentation shall constitute nor shall be construed as a waiver of the immunities, privileges and exemptions granted to CAF by its Constitutive Agreement, by theagreements which CAF has entered or may enter with its shareholder countries, or by the legislation of those states.
own appropriate investigations and consult their legal, accounting and tax advisors in order to make an independent determination of theaccuracy, completeness and veracity of the data contained herein and of the suitability and consequences of any use thereof.