condensed financial report – supplementary data - … · free cash flow amounted to usd 2.5...
TRANSCRIPT

Novartis International AG Novartis Global Communications CH-4002 Basel Switzerland
http://www.novartis.com
CONDENSED FINANCIAL REPORT – SUPPLEMENTARY DATA Novartis Q4 and FY 2017 Condensed Financial Report – Supplementary Data INDEX Page
GROUP AND DIVISIONAL OPERATING PERFORMANCE Q4 and FY 2017
Group 2
Innovative Medicines 6
Sandoz 14
Alcon 16
CASH FLOW AND GROUP BALANCE SHEET 18
INNOVATION REVIEW 21
CONDENSED CONSOLIDATED FINANCIAL STATEMENTS
Consolidated income statements 26
Condensed consolidated statements of comprehensive income 28
Condensed consolidated balance sheets 29
Condensed consolidated changes in equity 30
Condensed consolidated cash flow statements 31
Notes to condensed consolidated financial statements, including update on legal proceedings 33
SUPPLEMENTARY INFORMATION 42
CORE RESULTS
Reconciliation from IFRS to core results 44
Group 46
Innovative Medicines 48
Sandoz 50
Alcon 52
Corporate 54
ADDITIONAL INFORMATION
Condensed consolidated changes in net debt / Share information 56
Free cash flow 57
Net sales of the top 20 Innovative Medicines products 58
Innovative Medicines sales by business franchise 60
Net sales by region 62
Currency translation rates 64
Income from associated companies 65
DISCLAIMER 66

2/67
GROUP AND DIVISIONAL OPERATING PERFORMANCE
Key figures Q4 2017 Q4 2016 % change FY 2017 FY 2016 % change
USD m USD m USD cc 1 USD m USD m USD cc 1 Net sales to third parties 12 915 12 322 5 2 49 109 48 518 1 2
Divisional operating income 2 034 1 605 27 25 8 960 8 739 3 5
Corporate income & expense, net 36 - 150 nm nm - 331 - 471 30 27
Operating income 2 070 1 455 42 41 8 629 8 268 4 7
As % of net sales 16.0 11.8 17.6 17.0
Income from associated companies 416 156 167 166 1 108 703 58 58
Interest expense - 208 - 168 - 24 - 26 - 777 - 707 - 10 - 12
Other financial income and expense 23 - 365 nm nm 39 - 447 nm nm
Taxes - 325 - 142 - 129 - 72 -1 296 -1 119 - 16 - 13
Net income 1 976 936 111 58 7 703 6 698 15 12
Basic earnings per share (USD) 0.85 0.40 113 59 3.28 2.82 16 14 Cash flows from operating activities
3 408 3 591 -5
12 621 11 475 10
Free cash flow 1 2 456 2 976 - 17 10 428 9 455 10
Core 1
Core operating income 3 223 3 013 7 5 12 850 12 987 - 1 0
As % of net sales 25.0 24.5 26.2 26.8
Core net income 2 818 2 658 6 4 11 391 11 314 1 2
Basic core earnings per share (USD)
1.21 1.12 8 6 4.86 4.75 2 3
nm = not meaningful Fourth quarter Net sales Net sales were USD 12.9 billion (+5%, +2% cc) in the fourth quarter, as volume growth of 7 percentage points (cc), including growth from Cosentyx and Entresto, was partly offset by the negative impacts of generic competition (-3 percentage points) and pricing (-2 percentage points). Corporate income and expense, net Corporate income and expense, which includes the cost of Group management and central services, amounted to an income of USD 36 million compared to a net expense of USD 150 million in prior year. The change versus prior year was mainly due to a gain from achievement of a sales milestone related to the 2015 Vaccines divestment to GSK, partly offset by lower contributions from the captive insurance companies. Operating income Operating income was USD 2.1 billion (+42%, +41% cc) mainly driven by growth drivers, productivity, lower impairments and a gain from achievement of a sales milestone related to the 2015 Vaccines divestment to GSK, which were partly offset by generic erosion. Operating income margin in constant currencies increased 4.3 percentage points; currency had a negative impact of 0.1 percentage point, resulting in a net increase of 4.2 percentage points to 16.0% of net sales. Core adjustments amounted to USD 1.2 billion (2016: USD 1.6 billion). Core operating income was USD 3.2 billion (+7%, +5% cc) as growth drivers and productivity more than offset generic erosion. Core operating income margin in constant currencies increased 0.7 percentage points; currency had a negative impact of 0.2 percentage points, resulting in a net increase of 0.5 percentage points to 25.0% of net sales. Income from associated companies Income from associated companies amounted to USD 416 million, compared to USD 156 million in prior year. The increase was mainly due to higher income recognized from our investment in GSK Consumer Healthcare Holdings Ltd. (GSK Consumer Healthcare).
1 Constant currencies (cc), core results and free cash flow are non-IFRS measures. An explanation of non-IFRS measures can be found on page 42. Unless otherwise noted, all growth rates in this document refer to same period in prior year.
3/67
The estimated income from our investments in GSK Consumer Healthcare in 2017 amounts to USD 291 million compared to USD 36 million in 2016. This increase is due to improved operating results of USD 18 million and an estimated one-time deferred tax income of USD 237 million, arising from a change in a Swiss cantonal statutory tax rate. The income contribution from Roche Holding AG (Roche) increased to USD 124 million compared to USD 120 million in prior year. Interest expense and other financial income/expense Interest expense increased to USD 208 million from USD 168 million in prior year due to higher outstanding debt. Other financial income and expense amounted to an income of USD 23 million compared to an expense of USD 365 million in the prior year, which included exceptional charges related to a revaluation loss in Venezuela of USD 0.3 billion. Taxes The tax rate was 14.1% compared to 13.2% in prior year. On December 22, 2017, the US enacted tax reform legislation (Tax Cuts and Jobs Act), which among other provisions, reduced the US Corporate tax rate from 35% to 21%, effective January 1, 2018. This required a revaluation of the deferred tax assets and liabilities and a portion of current tax payables to the newly enacted tax rate at the date of enactment, which resulted in a net tax expense of USD 61 million (2.7%). In addition, a change in a Swiss cantonal statutory tax rate resulted in a one-time income from our share in GSK Consumer Healthcare, the impact of which decreased the tax rate by 1.4%. Excluding the impact of these rate changes the reported tax rate for 2017 would have been 12.8% compared to 13.2% in prior year, mainly as a result of the higher true-up adjustment to the full year reported tax rate in prior year. The core tax rate was 15.6% compared to 14.5% in prior year. Net income and EPS Net income was USD 2.0 billion (+111%, +58% cc), driven by the strong operating income growth and higher income from associated companies. The prior year included exceptional charges related to a revaluation loss in Venezuela of USD 0.3 billion. EPS was USD 0.85 (+113%, +59% cc), driven by growth in net income and the benefit from the share buyback program. Core net income was USD 2.8 billion (+6%, +4% cc), driven by growth in core operating income. Core EPS was USD 1.21 (+8%, +6% cc), driven by growth in core net income and the benefit from the share buyback program. Free cash flow amounted to USD 2.5 billion (-17% USD) compared to USD 3.0 billion in prior year. The decrease of USD 0.5 billion was mainly driven by lower cash flows from operating activities and higher net investments. Full Year Net sales Net sales were USD 49.1 billion (+1%, +2% cc) in the full year, as volume growth of 7 percentage points (cc), including growth from Cosentyx and Entresto, was partly offset by the negative impacts of generic competition (-3 percentage points) and pricing (-2 percentage points). Corporate income and expense, net Corporate income and expense, which includes the cost of Group management and central services, amounted to a net expense of USD 331 million compared to USD 471 million in prior year. The decrease in expense was mainly due to a gain from achievement of a sales milestone related to the 2015 Vaccines divestment to GSK, partly offset by lower gains from divestment in real estate and lower contributions from the captive insurance companies.

4/67
Operating income Operating income was USD 8.6 billion (+4%, +7% cc) as growth drivers, productivity, lower amortization and a gain from achievement of a sales milestone related to the 2015 Vaccines divestment to GSK, more than offset generic erosion. Operating income margin in constant currencies increased 0.8 percentage points; currency had a negative impact of 0.2 percentage points, resulting in a net increase of 0.6 percentage points to 17.6% of net sales. Core adjustments amounted to USD 4.2 billion (2016: USD 4.7 billion). Core operating income was USD 12.9 billion (-1%, 0% cc) broadly in line with prior year as sales growth and productivity fully offset generic erosion and growth investments. Core operating income margin in constant currencies decreased 0.3 percentage points, mainly due to generic erosion of Gleevec/Glivec, partly offset by growth drivers and productivity; currency had a negative impact of 0.3 percentage points, resulting in a net decrease of 0.6 percentage points to 26.2% of net sales. Income from associated companies Income from associated companies increased to USD 1.1 billion, compared to USD 703 million in prior year. The increase was mainly due to higher income recognized from our investment in GSK Consumer Healthcare. The estimated income from our investments in GSK Consumer Healthcare in 2017 amounted to USD 629 million compared to USD 234 million in 2016. The increase is due to improved operational results of USD 89 million, an estimate of a one-time deferred tax income of USD 237 million, arising from a change in a Swiss cantonal statutory tax rate, and a positive prior year adjustment of USD 47 million based on the actual audited results for 2016, compared to a negative prior year adjustment of USD 22 million recognized in 2016 for 2015. The estimated income from our investment in Roche in 2017 amounted to USD 456 million (2016: USD 464 million), which reflected our estimated share of income for 2017 of USD 523 million (2016: USD 532 million) offset by the negative prior year adjustment of USD 67 million, based on actual 2016 results (2016: negative adjustment of USD 68 million, based on actual 2015 results). Interest expense and other financial income/expense Interest expense increased to USD 777 million from USD 707 million in prior year period due to higher outstanding debt. Other financial income and expense amounted to an income of USD 39 million compared to an expense of USD 447 million in prior year. The prior year included exceptional charges related to a revaluation loss in Venezuela of USD 0.3 billion and higher currency losses. Taxes The tax rate was 14.4% compared to 14.3% in prior year. On December 22, 2017, the US enacted tax reform legislation (Tax Cuts and Jobs Act), which among other provisions, reduced the US Corporate tax rate from 35% to 21%, effective January 1, 2018. This required a revaluation of the deferred tax assets and liabilities and a portion of current tax payables to the newly enacted tax rate at the date of enactment, which resulted in an increase of USD 61 million (0.7%) net tax expense. In addition, a change in a Swiss cantonal statutory tax rate resulted in a one-time income from our share in GSK Consumer Healthcare, the impact of which decreased the tax rate by 0.4%. Excluding the impact of these rate changes the reported tax rate for 2017 would have been 14.1% compared to 14.3% in prior year. The core tax rate was 15.3% compared to 15.0% in prior year. Net income and EPS Net income was USD 7.7 billion (+15%, +12% cc), driven by higher operating income and income from associated companies. The prior year included exceptional charges related to a revaluation loss in Venezuela of USD 0.3 billion. EPS was USD 3.28 (+16%, +14% cc), driven by net income growth and the benefit from the share buyback program. Core net income was USD 11.4 billion (+1%, +2% cc), growing above core operating income due to higher core income from associated companies.

5/67
Core EPS was USD 4.86 (+2%, +3% cc), with growth in core net income and the benefit from the share buyback program. Free cash flow amounted to USD 10.4 billion (+10% USD) compared to USD 9.5 billion in 2016. The increase was mainly driven by favorable working capital changes, lower legal settlement payments out of provisions and lower taxes paid, partly offset by the decrease in operating income adjusted for non-cash items and higher net investments.

6/67
Innovative Medicines
Q4 2017 Q4 2016 % change
FY 2017 FY 2016 % change USD m USD m USD cc USD m USD m USD cc
Net sales 8 756 8 273 6 4 33 025 32 562 1 2Operating income 1 807 1 360 33 31 7 782 7 426 5 7 As % of net sales 20.6 16.4 23.6 22.8 Core operating income 2 671 2 407 11 9 10 330 10 354 0 2 As % of net sales 30.5 29.1 31.3 31.8 Fourth quarter Net sales Net sales were USD 8.8 billion (+6%, +4% cc) in the fourth quarter. Volume contributed 9 percentage points to sales growth. Generic competition had a negative impact of 4 percentage points largely due to Gleevec/Glivec genericization in Europe and the US. Pricing had a negative impact of 1 percentage point. Regionally, US sales (USD 2.9 billion, +4% cc) grew as Cosentyx, Entresto, Promacta/Revolade, Exjade and Kisqali more than offset the generic competition, largely for Gleevec/Glivec. Japan sales (USD 0.6 billion, +6% cc) grew mainly driven by Promacta/Revolade and Galvus. Europe sales (USD 3.0 billion, -1% cc) slightly declined due to Gleevec/Glivec genericization, partly offset by Cosentyx, Entresto and Tafinlar + Mekinist growth. Emerging Growth Markets sales increased 8% (cc) to USD 2.2 billion. Novartis Pharmaceuticals BU sales were USD 5.5 billion (+6% cc). Immunology and Dermatology (USD 1.2 billion, +27% cc) sales increased, driven by strong growth of Cosentyx (USD 615 million, +53% cc) across all indications. In Cardio-Metabolic, Entresto (USD 185 million, +164% cc) delivered strong results driven by growing adoption by physicians in US and Europe and continuous market access improvements. Respiratory (USD 445 million, +10% cc) performance was driven by strong growth of Ultibro (USD 120 million, +26% cc) and Xolair (USD 247 million, +9% cc). In Neuroscience, Gilenya (USD 825 million, -1% cc) slightly declined. Ophthalmology sales (USD 1.3 billion, -1% cc) slightly decreased as impact by generics in the US was partly offset by continued growth of Lucentis (USD 485 million, +2% cc).
Novartis Oncology BU sales were USD 3.2 billion (-1% cc). The sales decline was due to Gleevec/Glivec (USD 448 million, -43% cc) generic impact in Europe and the US. Excluding Gleevec/Glivec, sales grew 13% (cc) driven by Promacta/Revolade (USD 255 million, +43% cc), Tafinlar + Mekinist (USD 246 million, +33% cc), Jakavi (USD 228 million, +33% cc), Exjade (USD 281 million, +16% cc), Kisqali (USD 35 million), and Tasigna (USD 485 million, +6% cc). Operating income Operating income was USD 1.8 billion (+33%, +31% cc), mainly driven by higher sales and lower impairments, partly offset by generic erosion and growth investments for Cosentyx, Entresto, and Kisqali. Operating income margin in constant currencies increased 4.3 percentage points; currency had a negative impact of 0.1 percentage points, resulting in a net increase of 4.2 percentage points to 20.6% of net sales. Core adjustments totaled USD 864 million, including USD 643 million for amortization of intangible assets. Prior year core adjustments were USD 1.0 billion. Core adjustments decreased compared to prior year mainly due to lower impairments. Core operating income was USD 2.7 billion (+11%, +9% cc). Core operating income margin in constant currencies increased by 1.5 percentage points; currency had a negative impact of 0.1 percentage points, resulting in a net increase of 1.4 percentage points to 30.5% of net sales. Core gross margin as a percentage of net sales increased by 1.1 percentage points (cc), mainly driven by productivity. Core R&D expenses decreased by 0.1 percentage points (cc), Core SG&A expenses increased by 0.7 percentage points (cc), largely due to growth investments. Core Other Income and Expense, net increased the margin by 1.0 percentage points (cc) driven by divestments.

7/67
Full year Net sales Innovative Medicines delivered net sales of USD 33.0 billion (+1%, +2% cc) in the full year, including USD 2.1 billion of Cosentyx and USD 507 million of Entresto. Volume growth of +8 percentage points more than offset the negative impacts of generic competition (-5 percentage points) and pricing (-1 percentage point). In the US (USD 11.1 billion, +2% cc), the strong performance of Cosentyx, Entresto and Promacta/Revolade was partly offset by generic competition, largely for Gleevec/Glivec. Europe sales (USD 11.3 billion, 0% cc) were in line with prior year as Cosentyx, Tafinlar + Mekinist, Jakavi and Entresto growth was offset by generic competition, largely for Gleevec/Glivec. Japan sales (USD 2.4 billion, 0% cc) were in line with prior year. Emerging Growth Markets sales increased 7% (cc) to USD 8.4 billion. Operating income Operating income was USD 7.8 billion (+5%, +7% cc) mainly driven by higher sales, lower amortization and productivity, partly offset by generic erosion and growth investments. Operating income margin in constant currencies increased 1.1 percentage points; currency had a negative impact of 0.3 percentage points, resulting in a net increase of 0.8 percentage points to 23.6% of net sales. Core adjustments amounted to USD 2.5 billion, including USD 2.2 billion of amortization of intangible assets. Prior year core adjustments were USD 2.9 billion. Core adjustments decreased compared to prior year mainly driven by lower amortization. Core operating income was USD 10.3 billion (0%, 2% cc). Core operating income margin in constant currencies slightly decreased by 0.1 percentage points; currency had a negative impact of 0.4 percentage points, resulting in a net decrease of 0.5 percentage points to 31.3% of net sales. Core gross margin as a percentage of net sales increased by 0.7 percentage points (cc) mainly driven by productivity and higher revenues from the Xolair profit sharing in the US. Core R&D expenses decreased by 0.7 percentage points (cc), mainly reflecting continued productivity and resource allocation from the creation of the Global Drug Development unit. Core SG&A expenses increased by 1.5 percentage points (cc), largely due to growth investments. Core Other Income and Expense, net impact was negligible. Innovative Medicines product review All comments below focus on fourth quarter movements in constant currencies. ONCOLOGY BUSINESS UNIT
Q4 2017 Q4 2016 % change FY 2017 FY 2016 % change USD m USD m USD cc USD m USD m USD cc Gleevec/Glivec 448 764 -41 -43 1 943 3 323 -42 -41 Tasigna 485 458 6 6 1 841 1 739 6 9 Sandostatin 421 408 3 3 1 612 1 646 -2 -1 Afinitor/Votubia 407 391 4 3 1 525 1 516 1 2 Exjade/Jadenu 281 237 19 16 1 059 956 11 11 Tafinlar + Mekinist1 246 178 38 33 873 672 30 29 Promacta/Revolade 255 178 43 43 867 635 37 37 Votrient 213 192 11 8 808 729 11 10 Jakavi 228 162 41 33 777 581 34 32 Kisqali 35 0 nm nm 76 0 nm nm Other 224 239 -6 -8 893 993 -10 -9 Total Oncology business unit 3 243 3 207 1 -1 12 274 12 790 -4 -31Majority of sales for Tafinlar and Mekinist are combination, but both can be used as a monotherapy nm = not meaningful
Tasigna (USD 485 million, +6% cc) showed solid growth mainly driven by the US. Tasigna is approved for the treatment of adult patients newly diagnosed with Philadelphia chromosome-positive (Ph+) chronic myeloid leukemia (CML) in the chronic phase, and is also approved for the treatment of adult patients with Ph+ CML in the chronic or accelerated phase who are resistant or intolerant to at least one prior therapy including Gleevec/Glivec.

8/67
Gleevec/Glivec (USD 448 million, -43% cc) continued to decline, driven by generic imatinib competition in most major markets. Gleevec/Glivec is approved in more than 110 countries for the treatment of adult patients in all phases of Ph+ CML, for the treatment of patients with KIT (CD117)-positive gastrointestinal tumors (KIT+ GIST), which cannot be surgically removed and/or have metastasized, and for the treatment of adult patients following complete surgical removal of KIT+ GIST. Not all indications are available in every country. Sandostatin (USD 421 million, +3% cc) grew slightly driven primarily by growth in LACAN and phasing in Emerging Growth Markets. Sandostatin is a somatostatin analogue available in immediate and long-acting release injectable formulations and is indicated for the treatment of acromegaly and NET. In NET, Sandostatin LAR is used for patients with symptoms of carcinoid syndrome from gastro-entero-pancreatic NET as well as for tumor control in patients with advanced NET of the midgut or unknown primary tumor location. Afinitor/Votubia (USD 407 million, +3% cc) grew low single digits despite competitive pressure in the breast cancer and renal cell carcinoma indications, which was offset by growth in the neuroendocrine tumor (NET) and tuberous sclerosis complex (TSC) indications. Afinitor is approved in more than 115 countries in combination with exemestane for the treatment of certain postmenopausal women with hormone receptor-positive, human epidermal growth factor receptor-2 negative (HR+/HER2-) advanced breast cancer; for certain patients with advanced renal cell carcinoma, for some types of advanced NET of of gastrointestinal, lung or pancreatic origin. Afinitor/Votubia is also approved in more than 95 countries, including the US, EU member states and Japan, for treatment of certain patients with subependymal giant cell astrocytoma (SEGA) associated with TSC, and for treatment of certain patients with renal angiomyolipoma associated with TSC. The product is also approved in more than 30 countries, including EU member states as adjunctive treatment for certain patients with refractory seizures associated with TSC. Data from the TSC-associated seizure study are under review in the US. Everolimus, the active ingredient in Afinitor/Votubia, is available under the trade names Zortress and Certican for use in other non-oncology indications and is exclusively licensed to Abbott and sublicensed to Boston Scientific for use in drug-eluting stents. Exjade/Jadenu (USD 281 million, +16% cc) showed strong growth mainly driven by the US, and by continued uptake of Film-Coated Tablet (FCT). Exjade is a once-daily dispersible tablet for chronic transfusional iron overload, as well as for chronic iron overload in patients with non-transfusion-dependent thalassemia. Jadenu, a once-daily oral film-coated tablet formulation that can be swallowed whole or crushed (for patients who have difficulty to swallow) is approved in the US, Canada, Switzerland and other markets for the same indications as Exjade. In the EU, the film-coated tablet formulation is approved as Exjade. Regulatory applications are under review in several other countries worldwide. Promacta/Revolade (USD 255 million, +43% cc) grew at a strong double-digit rate across all regions, driven by continued worldwide uptake as well as growth of the thrombopoietin (TPO) class for chronic immune thrombocytopenia (ITP). It is the only approved once-daily oral TPO receptor agonist and the only TPO receptor agonist with multiple indications in different disease states and leads the market globally in the TPO class. It is approved in more than 100 countries for the treatment of thrombocytopenia in adult patients with chronic ITP who have had an insufficient response or are refractory to other treatments. In the US and EU, Promacta/Revolade is approved for patients one year and older with chronic ITP who have had an insufficient response to other treatments. It is approved in Japan for aplastic anemia as first-line therapy and for patients who are refractory to other treatments. It is also approved in 45 countries for the treatment of patients with severe aplastic anemia who are refractory to other treatments, and in more than 50 countries for the treatment of thrombocytopenia in patients with chronic hepatitis C to allow them to initiate and maintain interferon-based therapy. Tafinlar + Mekinist (USD 246 million, +33% cc) performance was driven by continued double-digit growth in the US due to increased demand and new launches in Europe. Tafinlar + Mekinist is the first combination of its kind for the treatment of patients with BRAF V600E/K mutation-positive unresectable or metastatic melanoma, as detected by a validated test, and continues to be the market leader globally across targeted therapy options. It is also the first combination of BRAF and MEK inhibitors to report three years of follow-up survival data in a Phase III study and five years of follow up in a separate Phase II study in BRAF V600+ unresectable or metastatic melanoma patients. The combination of Tafinlar + Mekinist is also approved for the treatment of metastatic non-small cell lung cancer (NSCLC) with a BRAF V600E mutation in the US and advanced NSCLC with a BRAF V600 mutation in the EU.

9/67
Jakavi (USD 228 million, +33% cc) showed continued double-digit growth across all regions driven by myelofibrosis (MF) and reimbursement of the second-line polycythemia vera (PV) indication in additional countries. Jakavi, an oral inhibitor of the JAK1 and JAK2 tyrosine kinases, is the first JAK inhibitor indicated for the treatment of disease-related splenomegaly or symptoms in adult patients with primary MF, post-polycythemia vera MF or post-essential thrombocythemia MF and adult patients with PV who are resistant to or intolerant of hydroxyurea. Jakavi is currently approved in more than 100 countries for patients with MF, including EU countries, Switzerland, Japan and Canada, and in more than 75 countries for patients with PV, including EU countries, Switzerland, Japan, and Canada. Novartis licensed ruxolitinib from Incyte Corporation for development and commercialization in the areas of oncology, hematology and graft-versus-host disease outside the US. Ruxolitinib, marketed in the US as Jakafi® by Incyte, is approved by the FDA for the treatment of patients with PV who have had an inadequate response to or are intolerant of hydroxyurea. Jakafi® is also approved by the FDA for treatment of patients with intermediate or high-risk MF, including primary MF, post-polycythemia vera MF and post-essential thrombocythemia MF. Votrient (USD 213 million, +8% cc) showed solid growth driven mainly by the US, Europe and Emerging Growth Markets. Votrient is a small molecule tyrosine kinase inhibitor (TKI) that inhibits a number of intracellular proteins to limit tumor growth and cell survival, which is approved in the US for the treatment of patients with aRCC, and in the EU for first-line treatment of adult patients with aRCC as well as patients who have received prior cytokine therapy for advanced disease. Votrient is also indicated for the treatment of patients with selective subtypes of advanced soft tissue sarcoma (STS) who have received prior chemotherapy or have progressed within 12 months after neoadjuvant therapy (efficacy in adipocytic STS or gastrointestinal stromal tumors has not been demonstrated). Kisqali (USD 35 million) continued to progress in the fourth quarter with growth in the US and additional launches in the EU. Following Germany in September, Spain and the UK launched Kisqali in Q4 after reimbursement in November. Other markets in the EU are expected to gain reimbursement over the next 12 months. Additional filings are underway with other health authorities worldwide. Kisqali is a selective cyclin-dependent kinase inhibitor, a class of drugs that help slow the progression of cancer by inhibiting the proteins cyclin-dependent kinase 4 and 6. Kisqali was approved in combination with an aromatase inhibitor by the FDA and launched in the US in March 2017 as initial endocrine-based therapy for the treatment of postmenopausal women with hormone receptor positive, human epidermal growth factor receptor-2 negative (HR+/HER2-) advanced or metastatic breast cancer. In May 2017, FDA approved Kisqali Femara Co-Pack (ribociclib tablets; letrozole tablets), the first-of-its-kind in Oncology, as initial endocrine-based therapy for the treatment of HR+/HER2- advanced or metastatic breast cancer in postmenopausal women. Kymriah launch in the US progressed well in the fourth quarter. 33 treatment centers are now REMs certified, 25 of those are fully operational and we are focused on ensuring access for patients. In August 2017, Kymriah became the first available chimeric antigen receptor T cell (CAR-T) therapy when it received FDA approval for children and young adults with B-cell acute lymphoblastic leukemia (ALL) that is refractory or has relapsed at least twice. Kymriah is a novel immunocellular therapy and a one-time treatment that uses a patient’s own T cells to fight cancer. PHARMACEUTICAL BUSINESS UNIT OPHTHALMOLOGY
Q4 2017 Q4 2016 % change
FY 2017 FY 2016 % change
USD m USD m USD cc USD m USD m USD cc Lucentis 485 452 7 2 1 888 1 835 3 4 Travoprost Group 150 161 -7 -9 589 619 -5 -5 Systane Group 108 100 8 7 400 377 6 5 Topical Olopatadine Group 59 55 7 7 284 335 -15 -15 Other 544 551 -1 -3 2 207 2 297 -4 -4 Total Ophthalmology 1 346 1 319 2 -1 5 368 5 463 -2 -1
Lucentis (USD 485 million, +2% cc) sales continued to grow in most markets, driven by volume growth. Lucentis is approved for six indications and is the only treatment available for all types of choroidal neovascularization (CNV). Lucentis is an anti-VEGF therapy specifically designed for the eye, minimizing systemic exposure. The Lucentis pre-filled syringe has launched in 34 countries so

10/67
far. Lucentis is licensed from Genentech, and Novartis holds the rights to commercialize the product ex-US. Genentech holds the rights to commercialize Lucentis in the US. Travoprost Group (USD 150 million, -9% cc) sales declined mainly due to loss of exclusivity in Europe. Travoprost Group includes Travatan, TravatanZ and DuoTrav, which are indicated for the reduction of elevated intraocular pressure in patients with open-angle glaucoma or who have ocular hypertension. Single agent travoprost products (Travatan, TravatanZ, Travatan BAK-Free and Izba) are prescribed as first-line agents. DuoTrav (travoprost and timolol) is a fixed-dose combination solution approved as a second-line treatment. Systane Group (USD 108 million, +7% cc) sales grew in the US and Europe. The Systane portfolio is a group of ocular health products, most of which are indicated for the temporary relief of burning and irritation due to dryness of the eye. The Systane portfolio includes Systane Ultra, Systane Balance, and Systane Hydration, and includes treatments for daily and nighttime relief, as well as products for everyday lid hygiene, and for discomfort associated with contact lens wear. Topical Olopatadine Group (USD 59 million, +7% cc) sales grew despite loss of exclusivity of Pataday in the US. Patanol, Pataday and Pazeo are olopatadine hydrochloride ophthalmic solutions of different concentrations that are approved to treat the signs and symptoms of allergic conjunctivitis (Patanol), as well as ocular itching associated with allergic conjunctivitis (Pataday and Pazeo). Novartis ophthalmic OTC products, together with a small portfolio of surgical diagnostic products, (2017 sales of USD 0.8 billion) have been transferred to the Alcon Division effective January 1, 2018. IMMUNOLOGY and DERMATOLOGY
Q4 2017 Q4 2016 % change
FY 2017 FY 2016 % change
USD m USD m USD cc USD m USD m USD cc
Cosentyx 615 391 57 53 2 071 1 128 84 82 Neoral/Sandimmun(e) 124 126 -2 -3 488 515 -5 -4 Zortress/Certican 116 104 12 8 414 398 4 4 Ilaris 115 75 53 51 402 283 42 42 Myfortic 104 91 14 14 378 383 -1 3 Other 81 104 -22 -23 288 308 -6 -7
Total Immunology and Dermatology
1 155 891 30 27 4 041 3 015 34 35
Xolair sales for all indications are reported in the Respiratory franchise
Cosentyx (USD 615 million, +53% cc) showed strong growth across all indications, with more than 125,000 patients treated since launch. Cosentyx is the first and only fully human monoclonal antibody that selectively neutralizes interleukin-17A (IL-17A), cornerstone cytokine in the pathogenesis of psoriasis (PsO), ankylosing spondylitis (AS) and psoriatic arthritis (PsA), and is approved to treat PsO, AS, PsA and in Japan pustular PsO. In clinical trials, Cosentyx has shown superiority over Enbrel® and Stelara®, providing rapid and sustainable efficacy for patients with PsO. The Cosentyx EU label was updated to include difficult-to-treat areas palmoplantar, nail and scalp PsO. Xolair continued its strong growth globally as a treatment for chronic spontaneous urticaria (CSU), also known as chronic idiopathic urticaria (CIU). CSU is a distressing skin condition that appears spontaneously and causes persistent hives, itch and/or painful deeper swelling of the skin for 6 weeks or more. Xolair is also a treatment for moderate-to-severe or severe persistent allergic asthma (SAA), which is addressed in the Respiratory section. All Xolair sales are booked in the Respiratory franchise. Novartis co-promotes Xolair with Genentech in the US and shares a portion of the operating income, but does not book US sales. Neoral/Sandimmun(e) (USD 124 million, -3% cc) sales declined slightly due to generic competition and mandatory price reductions, mainly in Europe and Japan. Neoral/Sandimmun(e) is an immunosuppressant to prevent organ rejection following a kidney, liver, heart, lung or bone marrow transplant. It is also indicated for the treatment of selected autoimmune disorders, such as endogenous uveitis, nephrotic syndrome, psoriasis, rheumatoid arthritis and atopic dermatitis. Zortress/Certican (USD 116 million, +8% cc), approved in more than 100 countries to prevent organ rejection in adult heart and kidney transplant patients, continued to show growth. It is also approved for liver transplant patients in over 70 countries, including EU countries and the US. Everolimus, the

11/67
active ingredient in Zortress/Certican, is marketed for other indications under the trade names Afinitor/Votubia. For use in drug-eluting stents Everolimus is exclusively licensed to Abbott and sublicensed to Boston Scientific. Ilaris (USD 115 million, +51% cc) continued to grow strongly across all regions. Ilaris is a selective, high-affinity, fully human monoclonal antibody that inhibits IL-1β, a key cytokine in the inflammatory pathway, by blocking the action of IL-1β for a sustained period of time, therefore inhibiting inflammation that is caused by its over-production. Ilaris is approved in over 70 countries as a treatment for various inflammatory conditions, especially for adults and children with cryopyrin-associated periodic syndrome (CAPS), systemic juvenile idiopathic arthritis (SJIA), and the symptomatic treatment of refractory acute gouty arthritis. In 2016, Ilaris received approval for patients with Adult-Onset Still’s Disease in Europe, and for three rare and distinct types of Periodic Fever Syndromes, also known as Hereditary Periodic Fevers, in the US and Japan. The European Commission approved Ilaris for the same three Periodic Fever Syndromes in February 2017. Myfortic (USD 104 million, +14% cc), a transplantation medicine, grew despite loss of exclusivity in several markets. NEUROSCIENCE
Q4 2017 Q4 2016 % change
FY 2017 FY 2016 % change
USD m USD m USD cc USD m USD m USD cc
Gilenya 825 810 2 -1 3 185 3 109 2 2 Other 25 30 -17 -22 102 124 -18 -18
Total Neuroscience 850 840 1 -1 3 287 3 233 2 2
Gilenya (USD 825 million, -1% cc), slightly declined mainly due to US partly offset by growth in Europe. Gilenya is indicated to treat relapsing forms of multiple sclerosis (RMS) and is approved in over 80 countries. Gilenya has been used to treat more than 225,000 patients with long-term data now out to 10 years, with the total patient exposure now at more than 508,000 patient years. Gilenya is licensed from Mitsubishi Tanabe Pharma. RESPIRATORY
Q4 2017 Q4 2016 % change
FY 2017 FY 2016 % change
USD m USD m USD cc USD m USD m USD cc Ultibro Breezhaler 120 90 33 26 411 363 13 12 Seebri Breezhaler 42 38 11 4 151 149 1 3 Onbrez Breezhaler 29 36 -19 -12 112 143 -22 -14 COPD Portfolio 191 164 16 13 674 655 3 5 Xolair 1 247 216 14 9 920 835 10 11 Other 7 8 -13 -3 23 31 -26 -14 Total Respiratory 445 388 15 10 1 617 1 521 6 81Revenue, which is ex-US only, reflects Xolair sales for all indications (including CSU/CIU, which is managed by the Immunology and Dermatology franchise)
The COPD portfolio, which consists of Ultibro Breezhaler, Onbrez Breezhaler and Seebri Breezhaler, grew 13% (cc) to USD 191 million. All three products in the COPD portfolio are delivered via the low-resistance Breezhaler inhalation device. Ex US, Novartis continues to bring Ultibro Breezhaler, Onbrez Breezhaler and Seebri Breezhaler to patients with COPD. In the US, these products are available at different doses or regimens under the names Utibron Neohaler, Arcapta Neohaler and Seebri Neohaler and Sunovion Pharmaceuticals Inc. has assumed as of December 21, 2016 US commercialization rights for them. Ultibro Breezhaler (USD 120 million, +26% cc), a LABA/LAMA, grew driven by positive FLAME study results and the GOLD guidelines, which recommended LABA/LAMA as the preferred option in the majority of symptomatic patients regardless of their exacerbation risk. This is further reinforced by the recently published FLASH Clinical Trial supporting direct switch from ICS/LABA to Ultibro Breezhaler. Ultibro Breezhaler, a first-in-class dual bronchodilator, is approved in over 100 countries, including Japan, EU countries and China (approved in December 2017). It is a once-daily fixed-dose combination of indacaterol and glycopyrronium bromide, and in the EU is indicated as a maintenance bronchodilator treatment to relieve symptoms in adult patients with COPD.

12/67
Seebri Breezhaler (USD 42 million, +4% cc), an inhaled LAMA is approved in over 100 countries and indicated as a maintenance bronchodilator treatment to relieve symptoms of patients with COPD. In the US, Seebri™ Neohaler® was launched in October 2017 by Sunovion Pharmaceuticals Inc. Glycopyrronium bromide and certain use and formulation intellectual property were exclusively licensed to Novartis in April 2005 by Sosei and Vectura. Onbrez Breezhaler (USD 29 million, -12% cc), an inhaled LABA, declined, due in part to a focus of resources on Ultibro Breezhaler. Onbrez Breezhaler is indicated as a maintenance of airflow obstruction in adult patients with COPD, and is approved in over 100 countries. Xolair (USD 247 million, +9% cc), continued to grow strongly driven by Europe and Emerging Growth Markets. Xolair is currently approved in more than 90 countries as a treatment for moderate-to-severe or severe persistent allergic asthma. Worldwide, Xolair is the first and only biologic approved for adults and children with moderate-to-severe allergic asthma (July 2016, FDA approved Xolair children six to 11 years of age with moderate to severe persistent asthma). In August 2017, Xolair was approved in China for moderate to severe persistent allergic asthma in adults & adolescents > 12 years of age. This approval makes Xolair the first & only biologic approved for asthma in China. Xolair as a treatment for CSU/CIU is addressed earlier in the Immunology and Dermatology section. Novartis co-promotes Xolair with Genentech in the US and shares a portion of the operating income, but does not book US sales. CARDIO-METABOLIC
Q4 2017 Q4 2016 % change
FY 2017 FY 2016 % change
USD m USD m USD cc USD m USD m USD cc Entresto 185 68 172 164 507 170 198 195 Other 5 4 25 36 17 14 21 25
Total Cardio-Metabolic 190 72 164 157 524 184 185 182
Entresto (USD 185 million, +164% cc) (sacubitril/valsartan) performance driven by growing adoption by physicians in US and Europe, and continued market access improvements. More than 420,000 heart failure patients with reduced ejection fraction benefit from Entresto, now approved in almost 100 countries. A growing body of clinical and real-world evidence, including a new study presented at the American Heart Association’s Scientific Sessions 2017, shows how Entresto helps patients with HFrEF not only live longer and stay out of the hospital, but also feel better. In the last three months of 2017 Entresto was launched in additional countries like Ireland and China. In China alone there are one million patients eligible to use Entresto.
ESTABLISHED MEDICINES
Q4 2017 Q4 2016 % change
FY 2017 FY 2016 % change
USD m USD m USD cc USD m USD m USD cc Galvus 327 298 10 8 1 233 1 193 3 5 Exforge 249 237 5 1 960 926 4 4 Diovan/Co-Diovan 244 257 -5 -6 957 1 073 -11 -9 Voltaren/Cataflam 119 136 -13 -10 465 525 -11 -4 Exelon/Exelon Patch 88 114 -23 -24 381 444 -14 -14 Ritalin/Focalin 74 73 1 -2 236 282 -16 -18 Other 426 441 -3 -2 1 682 1 913 -12 -10 Total Established Medicines
1 527 1 556 -2 -3 5 914 6 356 -7 -5
Galvus Group (USD 327 million, +8% cc) continues to grow driven by solid performance in Japan and Emerging Growth Markets. In 2017, Galvus was listed in the National Reimbursement Drug List (NRDL) in China. The Galvus Group is currently approved in more than 125 countries. The Group includes Galvus, an oral treatment for type-2 diabetes, and Eucreas, a single-pill combination of vildagliptin (the active ingredient in Galvus) and metformin. Galvus is mainly promoted for the treatment of patients whose diabetes is uncontrolled on metformin as well as for special patient segments, such as elderly and renal-impaired patients.

13/67
Exforge Group (USD 249 million, +1% cc), which includes Exforge and Exforge HCT, slightly grew despite ongoing generic competition in the US and Japan, and beginning in Europe in 2017. Both Exforge and Exforge HCT grew in Emerging Growth Markets. Diovan Group (USD 244 million, -6% cc), consisting of Diovan monotherapy and the combination product Co-Diovan/Diovan HCT, saw sales decline in US, EU, Japan and Latin America due to loss of exclusivity. Voltaren/Cataflam (USD 119 million, -10% cc) is a leading international brand by sales in the non-steroidal anti-inflammatory drugs (NSAIDs) market for the relief of symptoms in rheumatic diseases, such as rheumatoid arthritis and osteoarthritis, and for various other inflammatory and pain conditions. This product is subject to generic competition. Exelon/Exelon Patch (USD 88 million, -24% cc) declined due to generic competition for Exelon Patch in the US and EU. Exelon Patch is approved for the treatment of mild-to-moderate Alzheimer’s disease dementia (AD) in more than 85 countries, and severe AD in 14 countries, including the US. Exelon Patch is also indicated for the treatment of Parkinson’s disease dementia in more than 20 countries. Ritalin/Focalin (USD 74 million, -2% cc) is a treatment for attention deficit hyperactivity disorder (ADHD). Ritalin and Ritalin LA are available in more than 70 and 30 countries, respectively, and are also indicated for narcolepsy. Ritalin and Focalin are subject to generic competition in the US.

14/67
Sandoz
Q4 2017 Q4 2016 % change
FY 2017 FY 2016 % change USD m USD m USD cc USD m USD m USD cc
Net sales 2 595 2 605 0 -4 10 060 10 144 -1 -2Operating income 305 365 -16 -19 1 368 1 445 -5 -7 As % of net sales 11.8 14.0 13.6 14.2 Core operating income 543 521 4 1 2 080 2 071 0 -1 As % of net sales 20.9 20.0 20.7 20.4 Fourth quarter Net sales Sandoz net sales were USD 2.6 billion (0%, -4% cc) in the fourth quarter, as 8 percentage points of price erosion, mainly in the US, was partly offset by volume growth of 4 percentage points. Excluding the US, net sales grew by 4% (cc). Sales in the US were USD 796 million (-17% cc), due to increased industry-wide pricing pressure and continued customer consolidation. Sales in Europe were USD 1.2 billion (+3% cc), driven by Germany, UK and France. Sales in Asia / Africa / Australasia were USD 377 million (+4% cc), mainly driven by China. Sales in Latin America were USD 100 million (+13% cc), mainly driven by Brazil. Global sales of Biopharmaceuticals (biosimilars, biopharmaceutical contract manufacturing and Glatopa 20mg) grew 6% (cc) to USD 309 million. By region, Europe continued double-digit growth supported by the recent launches of biosimilars Rixathon (rituximab) and Erelzi (etanercept). US Biopharmaceuticals declined primarily due to competitive pressures on Glatopa 20mg and the ongoing market conversion to the 40mg version of the reference medicine. Zarxio, the first US biosimilar approved under the BPCIA pathway, continues to grow double digit after two years on the market. Retail sales were USD 2.1 billion (-6% cc), driven primarily by decline in the US (-19% cc). Total Anti-Infectives franchise sales were USD 370 million (-2% cc). The decline in Anti-Infectives finished dosage forms sold under the Sandoz name (USD 233 million, -5% cc) was offset by growth in Anti-Infectives sold to third parties for sale under their own name (USD 137 million +9% cc). Operating income Operating income was USD 305 million (-16%, -19% cc) mainly due to US price erosion and higher manufacturing restructuring charges, partly offset by continued gross margin improvement. Operating income margin in constant currencies decreased by 2.1 percentage points; currency had a negative impact of 0.1 percentage points, resulting in a net decrease of 2.2 percentage points to 11.8% of net sales. Core adjustments amounted to USD 238 million, including USD 114 million of amortization. Prior year core adjustments were USD 156 million. Core adjustments increased compared to prior year mainly driven by higher manufacturing restructuring charges. Core operating income was USD 543 million (+4%, +1% cc), as gross margin improvements and divestment of small non-strategic assets were partially offset by lower sales and higher M&S investments. Core operating income margin increased by 1.1 percentage points (cc); currency had a negative impact of 0.2 percentage points, resulting in a net increase of 0.9 percentage points to 20.9% of net sales. Core gross margin as a percentage of net sales increased by 1.6 percentage points (cc), driven by a favorable product and geographic mix and ongoing productivity improvements, which more than offset the impact of price erosion in the US. Core R&D expenses decreased by 0.5 percentage points (cc). Core SG&A expenses increased by 2.0 percentage points (cc) mainly due to higher M&S investments in key ex-US markets. Core Other Income and Expense, had a positive margin contribution of 1.0 points (cc) mainly due to gains from the divestment of small non-strategic assets.

15/67
Full Year Net sales Sandoz net sales were USD 10.1 billion (-1%, -2% cc) in 2017, as volume growth of 6 percentage points was more than offset by 8 percentage points of price erosion, mainly in the US. Excluding the US, net sales grew by 4% (cc). Sales in the US were USD 3.3 billion (-12% cc) mainly due to increased industry-wide pricing pressure and continued customer consolidation. Sales in Europe were USD 4.6 billion (+4% cc), mainly driven by growth in Italy, France and Switzerland. Sales in Asia / Africa / Australasia were USD 1.4 billion (+1% cc), driven by Japan partly offset by Saudi Arabia. Sales in Latin America were USD 419 million (+10% cc), mainly driven by Brazil. Global sales of Biopharmaceuticals grew 12% (cc) to USD 1.1 billion, driven by Zarxio (filgrastim), Binocrit (epoetin alfa) and the launch of Rixathon (rituximab) and Erelzi (etanercept) in selected European markets. Sandoz now has five approved and marketed biosimilars in Europe, more than any other company. Retail Generics sales were USD 8.4 billion (-3% cc), as the decline in the US (-14% cc) more than offset growth outside the US (+3% cc). Total Anti-Infectives franchise sales were USD 1.4 billion (0% cc). Growth in finished dosage forms sold under the Sandoz name (USD 880 million, +2% cc), was offset by a decline in Anti-Infectives sold to third parties for sale under their own name (USD 516 million -2% cc), which resulted from the discontinuation of low-margin products in prior year. Operating income Operating income was USD 1.4 billion (-5%, -7% cc) mainly due to US price erosion, increased investments in ex-US M&S and higher manufacturing restructuring charges, partly offset by sales growth outside of US and continued gross margin improvements from favorable product and geographic mix and productivity improvements. Operating income margin in constant currencies decreased 0.7 percentage points; currency had a positive impact of 0.1 percentage points, resulting in a net decrease of 0.6 percentage points to 13.6% of net sales. Core adjustments amounted to USD 712 million, including USD 454 million of amortization. Prior year core adjustments were USD 626 million. Core adjustments increased compared to prior year mainly driven by higher manufacturing restructuring charges. Core operating income was USD 2.1 billion (0%, -1% cc), as gross margin improvements offset lower sales and higher M&S investments including European biosimilars launches. Core operating income margin in constant currencies increased 0.1 percentage points; currency had a positive impact of 0.2 percentage points, resulting in a net increase of 0.3 percentage points to 20.7% of net sales. Core gross margin as a percentage of net sales increased by 1.3 percentage points (cc), driven by a favorable product and geographic mix and ongoing productivity improvements, which more than offset the impact of price erosion in the US. Core R&D expenses decreased by 0.2 percentage points (cc). Core SG&A expenses increased by 1.4 percentage points (cc), due to higher M&S investments behind growth drivers. Core Other Income and Expense had no impact on margin.

16/67
Alcon Q4 2017 Q4 2016 % change
FY 2017 FY 2016 % change
USD m USD m USD cc USD m USD m USD ccNet sales 1 564 1 444 8 6 6 024 5 812 4 4Operating loss -78 -120 35 33 -190 -132 -44 -14 As % of net sales -5.0 -8.3 -3.2 -2.3 Core operating income 221 163 36 36 857 850 1 5 As % of net sales 14.1 11.3 14.2 14.6 Fourth quarter Net sales Alcon net sales were USD 1.6 billion (+8%, +6% cc) in the fourth quarter, with growth across most market segments. Surgical growth of +9% (cc) was driven by growth of cataract consumables and IOLs. Vision Care grew +2% (cc) including continued double-digit growth of Dailies Total1, partly offset by declines in the weekly/monthly portfolio. Stock in trade movements accounted for approximately 1% (cc) of Alcon growth in the quarter. Alcon’s results reflect the fourth consecutive quarter of net sales growth as a result of improved operations, innovation, and customer relationships. Sales in the US grew +3% (cc), Europe grew +3% (cc) and Asia / Africa / Australasia grew +15% (cc). Emerging Growth Markets grew +19% (cc). Operating loss/income Operating loss was USD 78 million, compared to a loss of USD 120 million in prior year, mainly due to the higher sales. Operating income margin in constant currencies grew 3.2 percentage points; currency had a positive impact of 0.1 percentage points, resulting in a net increase of 3.3 percentage points. Core adjustments amounted to USD 299 million, driven by amortization of intangible assets and other net costs. Prior year core adjustments were USD 283 million, primarily due to amortization of intangible assets and other net costs. Core operating income was USD 221 million (+36%, +36% cc), primarily driven by higher sales. Core operating income margin in constant currencies increased by 3.0 percentage points driven by higher sales; currency had a negative impact of 0.2 percentage points, resulting in a net increase of 2.8 percentage points to 14.1% of net sales. Core gross margin as a percentage of net sales declined 1.3 percentage points (cc) versus prior year impacted by sales mix and competitive pricing pressure. Core R&D expenses decreased by 0.5 percentage points (cc). Core SG&A expenses decreased by 4.4 percentage points (cc) mainly driven by sales uptake. Core Other Income and Expense, net decreased the margin by 0.6 percentage points (cc). Full year Net sales Alcon net sales were USD 6.0 billion (+4%, +4% cc) for the full year. Surgical sales grew +5% (cc), driven by growth in most market segments, particularly vitreoretinal and cataract consumables. Vision Care sales grew +3% (cc), driven by continued double-digit growth of Dailies Total1. Sales in the US grew +1% (cc), Europe grew +3% (cc) and Asia / Africa / Australasia grew +10% (cc). Emerging Growth Markets grew +15% (cc). Operating loss/income Operating loss was USD 190 million for the full year, compared to a loss of USD 132 million in prior year, mainly due to growth plan investments and higher impairment charges related to business development activities, partly offset by higher sales. Operating income margin in constant currencies decreased 0.3 percentage points; currency had a negative impact of 0.6 percentage points, resulting in a net decrease of 0.9 percentage points. Core adjustments amounted to USD 1.0 billion, driven by amortization, impairments of intangible assets and other net costs, and were in line with prior year. Core operating income was USD 857 million (+1%, +5% cc), as higher sales were partly offset by growth plan investments. Core operating income margin in constant currencies increased by 0.2 percentage points; currency had a negative

17/67
impact of 0.6 percentage points, resulting in a net decrease of 0.4 percentage points to 14.2% of net sales. Core gross margin as a percentage of net sales decreased by 0.4 percentage points. Core R&D expenses decreased by 0.3 percentage points (cc). Core SG&A expenses decreased by 0.7 percentage points (cc). Core Other Income and Expense, net decreased the margin by 0.4 percentage points (cc). Alcon product review All comments below focus on fourth quarter movements in constant currencies. SURGICAL Q4 2017 Q4 2016 % change FY 2017 FY 2016 % change USD m USD m USD cc USD m USD m USD ccCataract products 743 679 9 8 2 749 2 695 2 3
Consumables 389 354 10 9 1 443 1 390 4 5IOLs 272 239 14 13 995 986 1 3Equipment 82 86 -5 -6 311 319 -3 -2
Vitreoretinal products 179 161 11 9 686 616 11 11Refractive/Other 60 47 28 26 225 207 9 8Total Surgical 982 887 11 9 3 660 3 518 4 5 Surgical sales were USD 1.0 billion (+9% cc) in the fourth quarter, driven by growth in IOLs (+13% cc), which benefitted from stock in trade movements, as well as improved performance of advanced technology IOLs and a broad recovery in emerging growth markets. Sales growth was also spurred by continued strong performance of cataract consumables (+9% cc) and vitreoretinal (+9% cc). Refractive/Other grew +26% (cc), reflecting continued strength in the refractive segment and positive momentum behind CyPass Micro-Stent in the US. VISION CARE Q4 2017 Q4 2016 % change FY 2017 FY 2016 % change USD m USD m USD cc USD m USD m USD ccContact lenses 443 420 5 2 1 833 1 762 4 4Contact lens care 139 137 1 1 531 532 0 0Total Vision Care 582 557 4 2 2 364 2 294 3 3 Vision Care sales were USD 582 million (+2% cc) in the fourth quarter. Contact lenses grew +2% (cc), as continued double-digit growth of Dailies Total1 globally was partially offset by declines in the weekly/monthly segment. Contact lens care grew +1% (cc), driven by Emerging Growth Markets, mainly in Asia.
18/67
CASH FLOW AND GROUP BALANCE SHEET Cash flow Fourth quarter Cash flows from operating activities amounted to USD 3.4 billion in the fourth quarter, compared to USD 3.6 billion in prior year. The decrease of USD 0.2 billion was mainly due to unfavorable net working capital changes partially offset by higher net income adjusted for non-cash items. Cash flows used in investing activities from continuing operations amounted to USD 1.0 billion. This amount included mainly cash outflows for the purchase of property, plant and equipment of USD 0.6 billion, for intangible assets of USD 0.3 billion, for financial assets and other non-current assets of USD 0.2 billion. This was partly offset by cash inflows from the sale of property, plant and equipment, intangible assets and financial assets of USD 0.2 billion. In prior year, cash flows used in investing activities from continuing operations amounted to USD 0.8 billion. This amount included cash outflows for the purchase of property, plant and equipment of USD 0.6 billion, for intangible assets of USD 0.2 billion, for financial assets and other non-current assets of USD 0.1 billion and for acquisitions and divestments of businesses, net (mainly including the Reprixys Pharmaceuticals Corporation acquisition) of USD 0.2 billion. This was partly offset by cash inflows from the sale of property, plant and equipment, intangible assets and financial assets of USD 0.3 billion. Cash flows used in investing activities from discontinued operations, which consists of payments out of provisions related to the portfolio transformation transactions, amounted to USD 13 million, compared to USD 0.2 billion in prior year. The cash flows used in financing activities amounted to USD 2.4 billion, compared to USD 2.3 billion in prior year. The current year quarter amount is mainly due to the net reduction in current financial debts of USD 1.4 billion and the net cash outflows for treasury share transactions of USD 0.9 billion. The prior year amount included a net reduction in current financial debts of USD 2.1 billion and net cash outflows for treasury share transactions of USD 0.2 billion. Free cash flow amounted to USD 2.5 billion (-17% USD) compared to USD 3.0 billion in prior year. The decrease of USD 0.5 billion was mainly driven by lower cash flows from operating activities and higher net investments. Full year Cash flows from operating activities amounted to USD 12.6 billion, compared to USD 11.5 billion in 2016. The increase of USD 1.1 billion was mainly driven by favorable working capital changes, lower legal settlement payments out of provisions and lower taxes paid, partly offset by the decrease in net income adjusted for non-cash items. Cash flows used in investing activities from continuing operations amounted to USD 3.0 billion in 2017. This amount included cash outflows for the purchase of property, plant and equipment of USD 1.7 billion, for intangible assets of USD 1.1 billion, for financial assets and other non-current assets of USD 0.5 billion and for acquisitions and divestments of businesses, net (mainly the Ziarco Group Limited and Encore Vision, Inc. acquisitions) of USD 0.8 billion. This was partly offset by cash inflows from the sale of property, plant and equipment, intangible assets and financial assets of USD 1.1 billion. In 2016, cash flows used in investing activities from continuing operations amounted to USD 2.7 billion. This amount included cash outflows for the purchase of property, plant and equipment of USD 1.9 billion, for intangible assets of USD 1.0 billion, for financial assets and other non-current assets of USD 0.4 billion and for acquisitions and divestments of businesses, net (including the Transcend Medical, Inc. and Reprixys Pharmaceuticals Corporation acquisitions) of USD 0.8 billion. This was partly offset by cash inflows from the sale of property, plant and equipment, intangible assets and financial assets of USD 1.3 billion and from the net proceeds from sales of marketable securities and commodities of USD 0.1 billion.

19/67
Cash flows used in investing activities from discontinued operations, which consists of payments out of provisions related to the portfolio transformation transactions, amounted to USD 0.1 billion, compared to USD 0.7 billion in 2016, which also included capital gains taxes. The cash flows used in financing activities amounted to USD 7.7 billion, compared to USD 5.3 billion in 2016. The 2017 amount included cash outflows for the dividend payment of USD 6.5 billion and for net treasury share transactions of USD 5.2 billion. The net cash inflows from current and non-current financial debts of USD 4.0 billion were mainly from the issuance of bonds denominated in US dollar and euro for a notional amount of USD 3.0 billion and EUR 1.85 billion (USD 2.0 billion), respectively, partially offset by the repayment of current and non-current financial debt of USD 0.9 billion. The 2016 cash flows used in financing activities amounted to USD 5.3 billion, which includes cash outflows for the dividend payment of USD 6.5 billion and for net treasury share transactions of USD 0.9 billion. The net cash inflows from current and non-current financial debts of USD 2.1 billion was mainly from the increase in short-term borrowings of USD 1.8 billion and from the issuance of two euro denominated bonds for total proceeds of USD 1.9 billion, partially offset by the repayment at maturity of a euro denominated bond of USD 1.7 billion. Free cash flow amounted to USD 10.4 billion (+10% USD) compared to USD 9.5 billion in 2016. The increase was mainly driven by favorable working capital changes, lower legal settlement payments out of provisions and lower taxes paid, partly offset by the decrease in operating income adjusted for non-cash items and higher net investments. Balance sheet Assets Total non-current assets of USD 104.9 billion at December 31, 2017 decreased by USD 0.3 billion compared to December 31, 2016. Property, plant and equipment increased by USD 0.8 billion to USD 16.5 billion, mainly due to the favorable currency translation adjustments, as net additions were offset by depreciation. Goodwill increased by USD 0.8 billion to USD 31.8 billion, mainly due to USD 0.7 billion favorable currency translation adjustments. Intangible assets other than goodwill decreased by USD 1.3 billion to USD 30.0 billion, as net additions of USD 2.4 billion and favorable currency translation adjustments of USD 0.7 billion were more than offset by amortization and impairment charges totaling USD 4.4 billion. Financial and other non-current assets decreased by USD 0.6 billion to USD 26.7 billion, as a decrease in the deferred tax assets of USD 1.8 billion was partly offset by an increase of USD 1.1 billion in the investments in associated companies, mainly due to the favorable currency translation adjustments. Total current assets increased by USD 3.3 billion to USD 28.2 billion at December 31, 2017, due to an increase in cash and cash equivalents, marketable securities, commodities and derivatives of USD 1.7 billion. Inventories and other current assets increased by USD 0.6 billion each, and trade receivables by USD 0.4 billion. Liabilities Total non-current liabilities of USD 35.4 billion at December 31, 2017 increased by USD 2.4 billion compared to December 31, 2016. Long-term financial debt increased by USD 5.3 billion to USD 23.2 billion at December 31, 2017, mainly due to the issuance of bonds denominated in US dollar and euro for a total notional amount of USD 3.0 billion and EUR 1.85 billion (USD 2.0 billion) respectively. Other non-current liabilities decreased by USD 2.9 billion to USD 12.2 billion at December 31, 2017, mainly due to a reduction of the pension obligations of USD 1.3 billion resulting from actuarial gains and a change in the accounting for a component of the Swiss pension plan from defined benefit to defined contribution plan. Total current liabilities increased by USD 1.2 billion to USD 23.4 billion at December 31, 2017. Trade payables at USD 5.2 billion increased slightly by USD 0.3 billion. Current financial debts and derivatives decreased by USD 0.6 billion to USD 5.3 billion, mainly due to lower short-term borrowings. Other current liabilities increased by USD 1.5 billion to USD 12.9 billion. Group equity The Group’s equity decreased by USD 0.7 billion to USD 74.2 billion at December 31, 2017, compared to USD 74.9 billion at December 31, 2016. The decrease was mainly on account of USD 6.5 billion for the dividend payment and net treasury share purchases of USD 5.3 billion. These amounts resulting from transactions with shareholders were partially offset by net income of USD 7.7

20/67
billion, favorable currency translation differences of USD 2.2 billion, net actuarial gains from defined benefit plans of USD 0.9 billion and Equity-based compensation of USD 0.6 billion. Net debt and debt/equity ratio The Group’s liquidity amounted to USD 9.5 billion at December 31, 2017 compared to USD 7.8 billion at December 31, 2016, and the total of the non-current and current financial debt, including derivatives, amounted to USD 28.5 billion at December 31, 2017, compared to USD 23.8 billion at December 31, 2016. The net debt increased to USD 19.0 billion at December 31, 2017 compared to USD 16.0 billion at December 31, 2016. The debt/equity ratio increased to 0.38:1 at December 31, 2017 compared to 0.32:1 at December 31, 2016.

21/67
Innovation Review Benefitting from our continued focus on innovation, Novartis has one of the industry’s most competitive pipelines with more than 200 projects in clinical development. Selected Innovative Medicines approvals: US, EU and Japan Product Active ingredient/
Descriptor Indication Approval date
Jadenu/Exjade granules
deferasirox Chronic iron overload (pediatric) EU – Nov 2017
Tasigna nilotinib Pediatric CML EU – Nov 2017
Selected Innovative Medicines projects awaiting regulatory decisions Completed submissions
Product Indication US EU Japan News update AMG 334 Migraine
prophylaxis Q2 2017 Q2 2017 - Primary and secondary endpoints of
Phase III STRIVE 24 week, EM study published in New England Journal of Medicine
CTL019 (Kymriah in US)
Pediatric/young adult acute lymphoblastic leukemia
Approved Q4 2017 Q4 2017 (tbc)
r/r Diffuse Large B-Cell Lymphoma
Q4 2017 Q4 2017
Gilenya (fingolimod)
Pediatric multiple sclerosis
Q4 2017 Q4 2017 - Results of Phase III PARADIGMS presented at the 7th joint ECTRIMS-ACTRIMS meeting showed children and adolescents treated with Gilenya had an 82% reduction in ARR as compared to interferon beta-1a.
- FDA granted Breakthrough Therapy designation
ACZ885 (canakinumab)
Secondary prevention of cardiovascular events
Q4 2017 Q4 2017 - Pre-planned secondary analysis of an exploratory endpoint showed that people with a prior heart attack who achieved hsCRP levels below 2mg/L at three months after the first dose had a 25% reduction in major adverse cardiovascular events (MACE) versus placebo. These patients also had a significant reduction of 31% in the rate of cardiovascular (CV) death and all-cause death
Promacta/ Revolade
Aplastic anemia (moderate and severe)
Q4 2016
Signifor LAR Cushing’s disease Q3 2017 Approved Q2 2017 Tafinlar + Mekinist
BRAF V600+ non-small cell lung cancer (NSCLC)
Approved Approved Q4 2016 - Results were published in The Lancet Oncology showing efficacy for patients with BRAF V600E-mutant metastatic non-small cell lung cancer (NSCLC) without prior systemic therapy when treated with the combination. The results were also presented at ESMO 2017.
High-risk BRAF V600+ melanoma (adjuvant)
Q4 2017 Q4 2017 Q4 2017
22/67
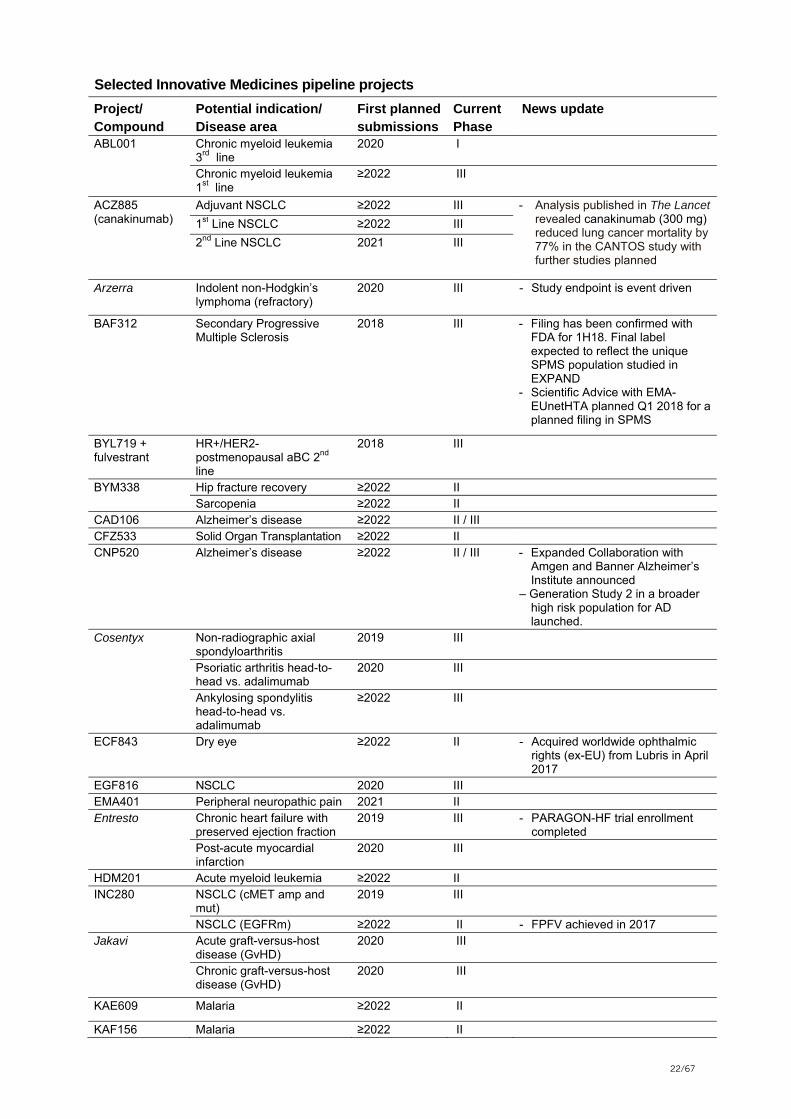
Selected Innovative Medicines pipeline projects
Project/ Compound
Potential indication/ Disease area
First planned submissions
Current Phase
News update
ABL001 Chronic myeloid leukemia 3rd line
2020 I
Chronic myeloid leukemia 1st line
≥2022 III
ACZ885 (canakinumab)
Adjuvant NSCLC ≥2022 III - Analysis published in The Lancet revealed canakinumab (300 mg) reduced lung cancer mortality by 77% in the CANTOS study with further studies planned
1st Line NSCLC ≥2022 III
2nd Line NSCLC 2021 III
Arzerra Indolent non-Hodgkin’s lymphoma (refractory)
2020 III - Study endpoint is event driven
BAF312 Secondary Progressive Multiple Sclerosis
2018 III - Filing has been confirmed with FDA for 1H18. Final label expected to reflect the unique SPMS population studied in EXPAND
- Scientific Advice with EMA-EUnetHTA planned Q1 2018 for a planned filing in SPMS
BYL719 + fulvestrant
HR+/HER2- postmenopausal aBC 2nd line
2018 III
BYM338 Hip fracture recovery ≥2022 II Sarcopenia ≥2022 II
CAD106 Alzheimer’s disease ≥2022 II / III CFZ533 Solid Organ Transplantation ≥2022 II CNP520 Alzheimer’s disease ≥2022 II / III - Expanded Collaboration with
Amgen and Banner Alzheimer’s Institute announced
– Generation Study 2 in a broader high risk population for AD launched.
Cosentyx Non-radiographic axial spondyloarthritis
2019 III
Psoriatic arthritis head-to-head vs. adalimumab
2020 III
Ankylosing spondylitis head-to-head vs. adalimumab
≥2022 III
ECF843 Dry eye ≥2022 II - Acquired worldwide ophthalmic rights (ex-EU) from Lubris in April 2017
EGF816 NSCLC 2020 III EMA401 Peripheral neuropathic pain 2021 II Entresto Chronic heart failure with
preserved ejection fraction 2019 III - PARAGON-HF trial enrollment
completed Post-acute myocardial infarction
2020 III
HDM201 Acute myeloid leukemia ≥2022 II INC280 NSCLC (cMET amp and
mut) 2019 III
NSCLC (EGFRm) ≥2022 II - FPFV achieved in 2017 Jakavi Acute graft-versus-host
disease (GvHD) 2020 III
Chronic graft-versus-host disease (GvHD)
2020 III
KAE609 Malaria ≥2022 II
KAF156 Malaria ≥2022 II

23/67
Kisqali (LEE011) + tamoxifen + goserelin or NSAI + goserelin
HR+/HER2- premenopausal aBC 1st line
2018 III - Phase III MONALEESA-7 data presented at SABCS
- Trial results to be discussed with HAs
Kisqali (LEE011) + fulvestrant
HR+/HER2- postmenopausal aBC 1st/2nd line
2018 III - Fully enrolled
Kisqali (LEE011) + adjuvant endocrine therapy
HR+/HER2- BC (adjuvant,) ≥2022 III - FPFV achieved in 2017
CTL019 (Kymriah US, tisagenlecleucel)
r/r Follicular lymphoma 2020 III Chronic lymphocytic leukemia
2021 III
DLBCL in 1st relapse ≥2022 II r/r DLBCL ≥2022 II - Combination with
pembrolizumab LAM320 Multi-drug resistant
tuberculosis 2018 III
LCI699 Cushing’s disease 2018 III - Fully enrolled; additional registration trial for US currently enrolling
LHW090 Resistant hypertension ≥2022 II LIK066 Weight loss ≥2022 II LJN452 Non-alcoholic steatohepatitis
(NASH) ≥2022 II - FDA Fast Track designation
LMI070 Spinal muscular atrophy 2021 II - Fast Track designation granted for Type I SMA
Lucentis Retinopathy of prematurity 2018 III - Phase III PIP study enrolling LOU064 Chronic spontaneous
urticaria ≥2022 II
MAA868 Stroke prevention in atrial fibrillation
≥2022 II
MTV273 Multiple myeloma ≥2022 I OMB157 (ofatumumab)
Relapsing multiple sclerosis 2019 III
PDR001 + Tafinlar + Mekinist
Metastatic BRAF V600+ melanoma
2019 III - COMBI-I study ongoing: Part 3 FPFV achieved in September 2017
PDR001 NET 2019 III - Fully enrolled - FDA orphan drug designation
Metastatic Melanoma 2021 II Promacta / Revolade
Severe aplastic anemia 1st line
2018 III - FDA Breakthrough Therapy designation
QAW039 Asthma 2020 III QBW251 COPD ≥2022 II QGE031 Chronic spontaneous
urticaria / chronic idiopathic urticaria
2021 II
QMF149 Asthma 2019 III QVM149 Asthma 2019 III RTH258 nAMD 2018 III - Positive Phase III results (HAWK,
HARRIER) announced in June 2017
- Presented at AAO in Nov 2017 Diabetic macular edema 2020 III
Rydapt (PKC412)
Acute myeloid leukemia (FLT3 wild type)
≥2022 III
SEG101 Sickle cell pain crises 2019 III UNR844 Presbyopia 2021 II VAY736 Auto-Immune Hepatitis 2021 II
Primary Sjoegren’s syndrome
≥2022 II - FDA Fast Track designation

24/67
VAY785 (emricasan)
Non-alcoholic steatohepatitis (NASH)
≥2022 II - Conatus transaction announced in May 2017
Xolair Nasal Polyps 2020 III ZPL389 Atopic dermatitis 2021 II
25/67
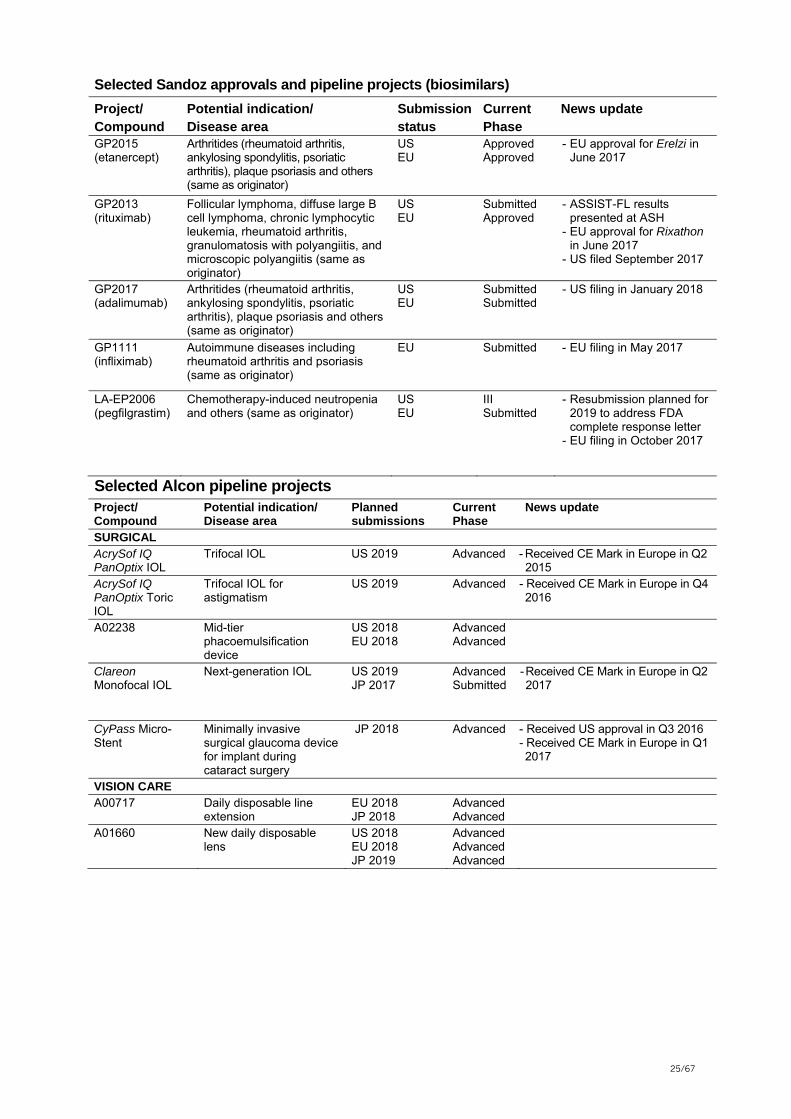
Selected Sandoz approvals and pipeline projects (biosimilars)
Project/ Compound
Potential indication/ Disease area
Submission status
Current Phase
News update
GP2015 (etanercept)
Arthritides (rheumatoid arthritis, ankylosing spondylitis, psoriatic arthritis), plaque psoriasis and others (same as originator)
US EU
Approved Approved
- EU approval for Erelzi in June 2017
GP2013 (rituximab)
Follicular lymphoma, diffuse large B cell lymphoma, chronic lymphocytic leukemia, rheumatoid arthritis, granulomatosis with polyangiitis, and microscopic polyangiitis (same as originator)
US EU
Submitted Approved
- ASSIST-FL results presented at ASH
- EU approval for Rixathon in June 2017
- US filed September 2017
GP2017 (adalimumab)
Arthritides (rheumatoid arthritis, ankylosing spondylitis, psoriatic arthritis), plaque psoriasis and others (same as originator)
US EU
Submitted Submitted
- US filing in January 2018
GP1111 (infliximab)
Autoimmune diseases including rheumatoid arthritis and psoriasis (same as originator)
EU Submitted - EU filing in May 2017
LA-EP2006 (pegfilgrastim)
Chemotherapy-induced neutropenia and others (same as originator)
US EU
III Submitted
- Resubmission planned for 2019 to address FDA complete response letter
- EU filing in October 2017
Selected Alcon pipeline projects Project/ Compound
Potential indication/ Disease area
Planned submissions
Current Phase
News update
SURGICAL AcrySof IQ PanOptix IOL
Trifocal IOL US 2019 Advanced - Received CE Mark in Europe in Q2 2015
AcrySof IQ PanOptix Toric IOL
Trifocal IOL for astigmatism
US 2019 Advanced - Received CE Mark in Europe in Q4 2016
A02238 Mid-tier phacoemulsification device
US 2018 EU 2018
Advanced Advanced
Clareon Monofocal IOL
Next-generation IOL US 2019 JP 2017
Advanced Submitted
- Received CE Mark in Europe in Q2 2017
CyPass Micro-Stent
Minimally invasive surgical glaucoma device for implant during cataract surgery
JP 2018 Advanced - Received US approval in Q3 2016 - Received CE Mark in Europe in Q1 2017
VISION CARE A00717 Daily disposable line
extension EU 2018 JP 2018
Advanced Advanced
A01660 New daily disposable lens
US 2018 EU 2018 JP 2019
Advanced Advanced Advanced

26/67
CONDENSED INTERIM CONSOLIDATED FINANCIAL STATEMENTS
Consolidated income statements
Fourth quarter (unaudited)
(USD millions unless indicated otherwise) Q4 2017 Q4 2016 Change
Net sales 12 915 12 322 593
Other revenues 249 284 -35
Cost of goods sold -4 489 -4 489
Gross profit 8 675 8 117 558
Marketing & Sales -3 464 -3 246 -218
Research & Development -2 502 -2 584 82
General & Administration -577 -592 15
Other income 620 381 239
Other expense -682 -621 -61
Operating income 2 070 1 455 615
Income from associated companies 416 156 260
Interest expense -208 -168 -40
Other financial income and expense, net 23 -365 388
Income before taxes 2 301 1 078 1 223
Taxes -325 -142 -183
Net income 1 976 936 1 040
Attributable to:
Shareholders of Novartis AG 1 976 957 1 019
Non-controlling interests 0 -21 21
Weighted average number of shares outstanding – Basic (million) 2 322 2 375 -53
Basic earnings per share (USD) 1 0.85 0.40 0.45
Weighted average number of shares outstanding – Diluted (million) 2 348 2 395 -47
Diluted earnings per share (USD) 1 0.84 0.40 0.44
1 Earnings per share (EPS) is calculated on the amount of net income attributable to shareholders of Novartis AG.

27/67
Consolidated income statements
Full year (audited)
(USD millions unless indicated otherwise) FY 2017 FY 2016 Change
Net sales 49 109 48 518 591
Other revenues 1 026 918 108
Cost of goods sold -17 175 -17 520 345
Gross profit 32 960 31 916 1 044
Marketing & Sales -12 861 -11 998 -863
Research & Development -8 972 -9 039 67
General & Administration -2 136 -2 194 58
Other income 1 969 1 927 42
Other expense -2 331 -2 344 13
Operating income 8 629 8 268 361
Income from associated companies 1 108 703 405
Interest expense -777 -707 -70
Other financial income and expense, net 39 -447 486
Income before taxes 8 999 7 817 1 182
Taxes -1 296 -1 119 -177
Net income 7 703 6 698 1 005
Attributable to:
Shareholders of Novartis AG 7 703 6 712 991
Non-controlling interests 0 -14 14
Weighted average number of shares outstanding – Basic (million) 2 346 2 378 -32
Basic earnings per share (USD) 1 3.28 2.82 0.46
Weighted average number of shares outstanding – Diluted (million) 2 371 2 400 -29
Diluted earnings per share (USD) 1 3.25 2.80 0.45
1 Earnings per share (EPS) is calculated on the amount of net income attributable to shareholders of Novartis AG.

28/67
Condensed consolidated statements of comprehensive income
Fourth quarter (unaudited)
(USD millions) Q4 2017 Q4 2016 Change
Net income 1 976 936 1 040
Other comprehensive income to be eventually recycled
into the consolidated income statement:
Fair value adjustments on financial instruments, net of taxes -109 -64 -45
Novartis share of other comprehensive income
recognized by associated companies, net of taxes -203 766 -969
Net investment hedge -30 -30
Translation effects -99 -2 589 2 490
Total of items to eventually recycle -441 -1 887 1 446
Other comprehensive income never to be recycled
into the consolidated income statement:
Net actuarial (losses)/gains from defined benefit plans, net
of taxes -230 736 -966
Comprehensive income 1 305 -215 1 520
Attributable to:
Shareholders of Novartis AG 1 304 -192 1 496
Non-controlling interests 1 -23 24
Full year (audited)
(USD millions) FY 2017 FY 2016 Change
Net income 7 703 6 698 1 005
Other comprehensive income to be eventually recycled
into the consolidated income statement:
Fair value adjustments on financial instruments, net of taxes 50 -98 148
Novartis share of other comprehensive income
recognized by associated companies, net of taxes -37 671 -708
Net investment hedge -237 -237
Translation effects 2 210 -2 391 4 601
Total of items to eventually recycle 1 986 -1 818 3 804
Other comprehensive income never to be recycled
into the consolidated income statement:
Net actuarial gains/(losses) from defined benefit plans, net
of taxes 851 -515 1 366
Comprehensive income 10 540 4 365 6 175
Attributable to:
Shareholders of Novartis AG 10 538 4 382 6 156
Non-controlling interests 2 -17 19

29/67
Condensed consolidated balance sheets (audited) Dec 31, Dec 31,
(USD millions) 2017 2016 Change
Assets
Non-current assets
Property, plant & equipment 16 464 15 641 823
Goodwill 31 750 30 980 770
Intangible assets other than goodwill 29 997 31 340 -1 343
Financial and other non-current assets 26 660 27 232 -572
Total non-current assets 104 871 105 193 -322
Current assets
Inventories 6 867 6 255 612
Trade receivables 8 600 8 202 398
Other current assets 3 256 2 697 559
Cash and cash equivalents, marketable securities,
commodities and derivatives 9 485 7 777 1 708
Total current assets 28 208 24 931 3 277
Total assets 133 079 130 124 2 955
Equity and liabilities
Equity attributable to Novartis AG shareholders 74 168 74 832 -664
Non-controlling interests 59 59 0
Total equity 74 227 74 891 -664
Non-current liabilities
Financial debts 23 224 17 897 5 327
Other non-current liabilities 12 225 15 127 -2 902
Total non-current liabilities 35 449 33 024 2 425
Current liabilities
Trade payables 5 169 4 873 296
Financial debts and derivatives 5 308 5 905 -597
Other current liabilities 12 926 11 431 1 495
Total current liabilities 23 403 22 209 1 194
Total liabilities 58 852 55 233 3 619
Total equity and liabilities 133 079 130 124 2 955

30/67
Condensed consolidated changes in equity
Fourth quarter (unaudited)
(USD millions) Q4 2017 Q4 2016 Change
Consolidated equity at October 1 72 370 75 066 -2 696
Comprehensive income 1 305 -215 1 520
Purchase of treasury shares -884 -122 -762
Exercise of options and employee transactions 20 20
Equity-based compensation 105 162 -57
Decrease of treasury share repurchase
obligation under a share buyback trading plan 1 312 1 312
Change in non-controlling interests -1 -1
Consolidated equity at December 31 74 227 74 891 -664
Full year (audited)
(USD millions) FY 2017 FY 2016 Change
Consolidated equity at January 1 74 891 77 122 -2 231
Comprehensive income 10 540 4 365 6 175
Purchase of treasury shares -5 574 -992 -4 582
Exercise of options and employee transactions 255 214 41
Equity-based compensation 612 664 -52
Dividends to shareholders of Novartis AG -6 495 -6 475 -20
Impact of change in ownership of consolidated entities -7 7
Change in non-controlling interests -2 -2
Consolidated equity at December 31 74 227 74 891 -664

31/67
Condensed consolidated cash flow statements
Fourth quarter (unaudited)
(USD millions) Q4 2017 Q4 2016 Change
Net income 1 976 936 1 040
Reversal of non-cash items
Taxes 325 142 183
Depreciation, amortization and impairments 1 724 1 832 -108
Change in provisions and other non-current liabilities 157 219 -62
Income from associated companies -416 -156 -260
Net financial expense 185 533 -348
Other -297 -41 -256
Net income adjusted for non-cash items 3 654 3 465 189
Interest and other financial receipts 150 237 -87
Interest and other financial payments -338 -201 -137
Taxes paid 1 -486 -791 305
Cash flows before working capital and provision changes 2 980 2 710 270
Payments out of provisions and other
net cash movements in non-current liabilities -372 -184 -188
Change in net current assets
and other operating cash flow items 800 1 065 -265
Cash flows from operating activities 3 408 3 591 -183
Purchase of property, plant & equipment -638 -586 -52
Purchase of intangible assets -332 -195 -137
Proceeds from sales of intangible assets 100 179 -79
Purchase of financial and other non-current assets -167 -131 -36
Proceeds from sales of property, plant & equipment and financial assets 85 118 -33
Acquisitions and divestments of businesses, net -24 -235 211
Change in marketable securities and commodities -7 3 -10
Cash flows used in investing activities
from continuing operations -983 -847 -136
Cash flows used in investing activities
from discontinued operations 1 -13 -226 213
Total cash flows used in investing activities -996 -1 073 77
Change in current and non-current financial debts -1 449 -2 108 659
Treasury share transactions, net -907 -205 -702
Other financing cash flows -40 10 -50
Cash flows used in financing activities -2 396 -2 303 -93
Effect of exchange rate changes on cash and cash equivalents 34 -382 416
Change in cash and cash equivalents 50 -167 217
Cash and cash equivalents at October 1 8 810 7 174 1 636
Cash and cash equivalents at December 31 8 860 7 007 1 853
1 In Q4 2016, the total net tax payment amounted to USD 797 million, of which USD 6 million was included in the cash flows used in investing activities from discontinued operations.
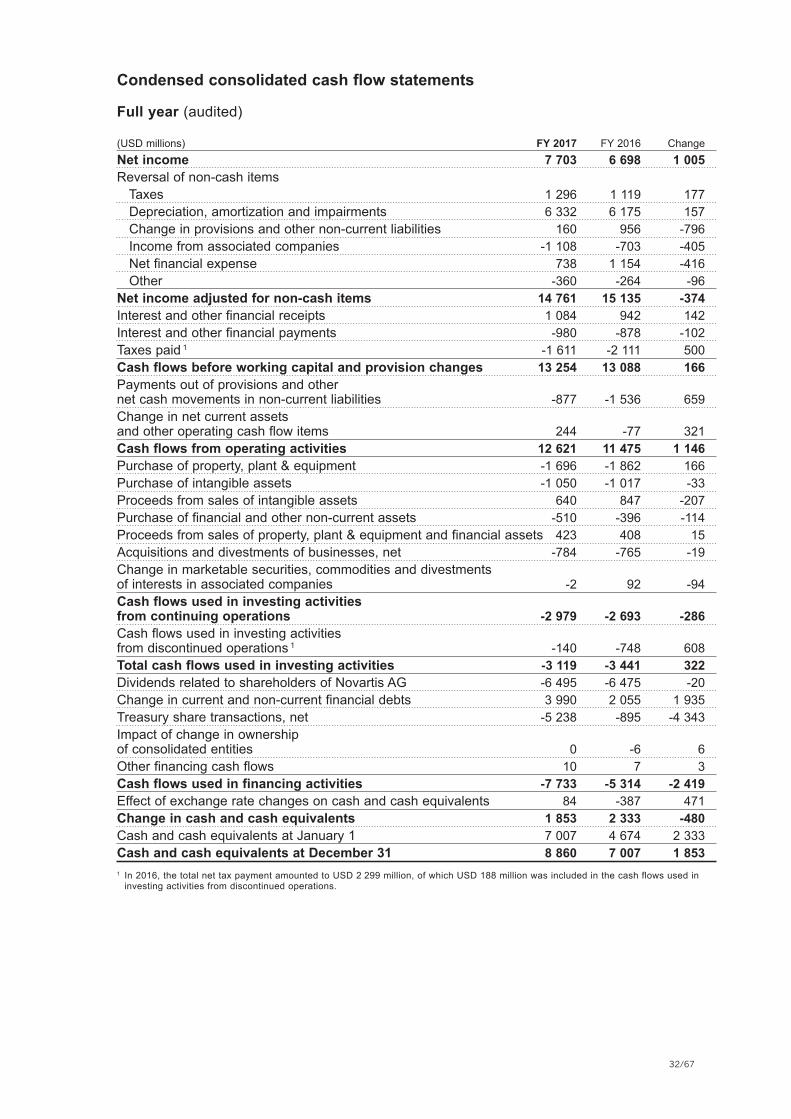
32/67
Condensed consolidated cash flow statements
Full year (audited)
(USD millions) FY 2017 FY 2016 Change
Net income 7 703 6 698 1 005
Reversal of non-cash items
Taxes 1 296 1 119 177
Depreciation, amortization and impairments 6 332 6 175 157
Change in provisions and other non-current liabilities 160 956 -796
Income from associated companies -1 108 -703 -405
Net financial expense 738 1 154 -416
Other -360 -264 -96
Net income adjusted for non-cash items 14 761 15 135 -374
Interest and other financial receipts 1 084 942 142
Interest and other financial payments -980 -878 -102
Taxes paid 1 -1 611 -2 111 500
Cash flows before working capital and provision changes 13 254 13 088 166
Payments out of provisions and other
net cash movements in non-current liabilities -877 -1 536 659
Change in net current assets
and other operating cash flow items 244 -77 321
Cash flows from operating activities 12 621 11 475 1 146
Purchase of property, plant & equipment -1 696 -1 862 166
Purchase of intangible assets -1 050 -1 017 -33
Proceeds from sales of intangible assets 640 847 -207
Purchase of financial and other non-current assets -510 -396 -114
Proceeds from sales of property, plant & equipment and financial assets 423 408 15
Acquisitions and divestments of businesses, net -784 -765 -19
Change in marketable securities, commodities and divestments
of interests in associated companies -2 92 -94
Cash flows used in investing activities
from continuing operations -2 979 -2 693 -286
Cash flows used in investing activities
from discontinued operations 1 -140 -748 608
Total cash flows used in investing activities -3 119 -3 441 322
Dividends related to shareholders of Novartis AG -6 495 -6 475 -20
Change in current and non-current financial debts 3 990 2 055 1 935
Treasury share transactions, net -5 238 -895 -4 343
Impact of change in ownership
of consolidated entities 0 -6 6
Other financing cash flows 10 7 3
Cash flows used in financing activities -7 733 -5 314 -2 419
Effect of exchange rate changes on cash and cash equivalents 84 -387 471
Change in cash and cash equivalents 1 853 2 333 -480
Cash and cash equivalents at January 1 7 007 4 674 2 333
Cash and cash equivalents at December 31 8 860 7 007 1 853 1 In 2016, the total net tax payment amounted to USD 2 299 million, of which USD 188 million was included in the cash flows used in
investing activities from discontinued operations.

33/67
Notes to the Condensed Interim Consolidated Financial Statements for the three month period and year ended December 31, 2017 (audited)
1. Basis of preparation
These Condensed Interim Consolidated Financial Statements for the three month period and year ended December 31, 2017, were prepared in accordance with International Accounting Standard 34 Interim Financial Reporting and accounting policies set out in the 2017 Annual Report published on January 24, 2018.
2. Selected critical accounting policies
The Group’s principal accounting policies are set out in Note 1 to the Consolidated Financial Statements in the Annual Report 2017 and conform with International Financial Reporting Standards (IFRS) as issued by the International Accounting Standards Board. The presentation of financial statements requires management to make subjective and complex judgments that affect the reported amounts. Because of the inherent uncertainties, actual outcomes and results may differ from management’s assumptions and estimates.
As discussed in the 2017 Annual Report, goodwill, Alcon brand name and acquired In-Process Research & Development projects are reviewed for impairment at least annually and these, as well as all other investments in intangible assets, are reviewed for impairment whenever an event or decision occurs that raises concern about their balance sheet carrying value. The amount of goodwill and other intangible assets on the Group’s consolidated balance sheet has risen significantly in recent years, primarily from acquisitions. Impairment testing under IFRS may lead to potentially significant impairment charges in the future that could have a materially adverse impact on the Group’s results of operations and financial condition.

34/67
3. Significant transactions
Significant transactions in 2017
Innovative Medicines – Acquisition of Ziarco Group LimitedOn January 20, 2017, Novartis acquired Ziarco Group Limited, a privately held company in the United Kingdom, focused on the development of novel treatments in dermatology. This acquisition adds a once daily oral H4 receptor antagonist in development for atopic dermatitis (AD), commonly known as eczema, to complement the Novartis dermatology portfolio and pipeline. The fair value of the total purchase consideration was USD 420 million. The amount consisted of an initial cash payment of USD 325 million and the net present value of the contingent consideration of USD 95 million, due to the Ziarco shareholders, which they are eligible to receive upon achievement of specified development milestones. The purchase price allocation resulted in net identifiable assets of USD 395 million and goodwill of USD 25 million. Results of operations since the date of acquisition were not material.
Innovative Medicines – Acquisition of Encore Vision, Inc.On January 20, 2017, Novartis acquired Encore Vision, Inc., a privately-held company in Fort Worth, Texas, USA, focused on the development of a novel treatment in presbyopia. The fair value of the total purchase consideration was USD 456 million. The amount consisted of an initial cash payment of USD 366 million and the net present value of the contingent consideration of USD 90 million, due to the Encore shareholders, which they are eligible to receive upon achievement of specified development and commercialization milestones. The purchase price allocation resulted in net identifiable assets of USD 389 million and goodwill of USD 67 million. Results of operations since the date of acquisition were not material.
Significant transaction entered into in 2017 and closed in January 2018
Innovative Medicines – Acquisition of Advanced Accelerator Applications, S.A.On October 30, 2017, Novartis entered into a binding memorandum of understanding with Advanced Accelerator Applications S.A., (AAA), a NASDAQ-listed company headquartered in Saint-Genis-Pouilly, France, under which Novartis agreed to commence a tender offer for 100% of the share capital of AAA subject to certain conditions. Novartis commenced the tender offer on December 7, 2017, to purchase all of the outstanding ordinary shares for a price of USD 41 per share and USD 82 per American Depositary Share (ADS), each representing two ordinary shares of AAA, which expired on January 19, 2018. The offer values AAAs equity at USD 3.9 billion, on a fully diluted basis. The transaction to acquire AAA is being funded mainly through external short- and long-term debt.
As of the expiration of the tender offer, approximately 97% of the then outstanding fully diluted ordinary shares, including ordinary shares represented by ADSs, were validly tendered. On January 22, 2018, Novartis accepted and paid USD 3.9 billion for the ordinary shares, including ordinary shares represented by ADSs, tendered in the offer.
On January 22, 2018 Novartis also commenced a subsequent offering period that will expire on January 31, 2018, unless extended.
AAA is a radiopharmaceutical company that develops, produces and commercializes molecular nuclear medicines, including Lutathera® (lutetium (177Lu) oxodotreotide), a first-in-class RLT product for neuroendocrine tumors (NETs) and a portfolio of diagnostic products. Radiopharmaceuticals, such as Lutathera®, are unique medicinal formulations containing radioisotopes, which are used clinically for both diagnosis and therapy.
Significant transactions in 2016
Alcon – Acquisition of Transcend Medical, Inc.On February 17, 2016, Alcon entered into an agreement to acquire Transcend Medical, Inc. (Transcend), a privately-held, US-based company focused on developing minimally-invasive surgical devices to treat glaucoma. The transaction closed on March 23, 2016, and the fair value of the total purchase consideration was USD 332 million. The amount consisted of an initial cash payment of USD 240 million and the net present value of the contingent consideration of USD 92 million due to the Transcend shareholders, which they are eligible to receive upon achievement of specified development and commercialization milestones. The purchase price allocation resulted in net identifiable assets of

35/67
USD 294 million and goodwill of USD 38 million. The 2016 results of operations since the date of acquisition were not material.
Innovative Medicines – Acquisition of Reprixys Pharmaceuticals CorporationOn November 18, 2016, Novartis acquired Reprixys Pharmaceuticals Corporation (Reprixys), a privately held, US-based company specializing in development of therapeutics in certain hematologic and inflammatory disorders following receipt of results of the SUSTAIN study. The initial interest of 19% was adjusted to its fair value of USD 64 million through the consolidated income statement at acquisition date. This re-measurement resulted in a gain of USD 53 million.
The fair value of the total purchase consideration for acquiring the 81% stake Novartis did not already own amounted to USD 268 million. The amount consisted of an initial cash payment of USD 194 million and the net present value of the contingent consideration of USD 74 million due to the Reprixys shareholders, which they are eligible to receive upon achievement of specified development and commercialization milestones. The purchase price allocation resulted in net identifiable assets of USD 332 million. No goodwill was recognized. The 2016 results of operations since the date of acquisition were not material.

36/67
4. Summary of equity attributable to Novartis AG shareholders
Issued share capital and reserves attributable to Novartis AG Number of outstanding shares shareholders (in millions) (in USD millions) 2017 2016 Change FY 2017 FY 2016 Change
Balance at beginning of year 2 374.1 2 373.9 0.2 74 832 77 046 -2 214
Shares acquired to be cancelled -66.2 -10.3 -55.9 -5 270 -784 -4 486
Other share purchases -3.8 -2.6 -1.2 -304 -208 -96
Exercise of options and
employee transactions 4.6 4.1 0.5 255 214 41
Equity-based compensation 8.8 9.0 -0.2 612 664 -52
Dividends to
shareholders of Novartis AG -6 495 -6 475 -20
Net income of the period attributable
to shareholders of Novartis AG 7 703 6 712 991
Impact of change in ownership of
consolidated entities -7 7
Other comprehensive income
attributable to shareholders of
Novartis AG 2 835 -2 330 5 165
Balance at December 31 2 317.5 2 374.1 -56.6 74 168 74 832 -664
In 2017, Novartis entered into an irrevocable, non-discretionary arrangement with a bank to repurchase Novartis shares on the second trading line under its up-to USD 5 billion share buyback, as well as to mitigate dilution from equity-based participation plans. The commitment under this arrangement is the expected purchases by the bank under such trading plan over a rolling 90-day period. As of December 31, 2017, this trading plan commitment was fully executed and expired, and as a consequence, there is no contingent liability related to this plan recognized.

37/67
5. Consolidated income statements – Segmentation
The businesses of Novartis are divided operationally on a worldwide basis into three identified reporting segments, Innovative Medicines, Sandoz and Alcon. In addition, we separately report Corporate activities.
Reporting segments are presented in a manner consistent with the internal reporting to the chief operating decision maker which is the Executive Committee of Novartis. The reporting segments are managed separately because they each research, develop, manufacture, distribute and sell distinct products that require differing marketing strategies.
The Executive Committee of Novartis is responsible for allocating resources and assessing the performance of the reporting segments.
Innovative Medicines researches, develops, manufactures, distributes and sells patented prescription medicines. The Innovative Medicines Division is organized into two global business units: Novartis Oncology, which consists of the global business franchises Oncology and Novartis Pharmaceuticals, which consists of the global business franchises Ophthalmology, Neuroscience, Immunology and Dermatology, Respiratory, Cardio-Metabolic and Established Medicines.
Sandoz develops, manufactures, distributes and sells prescription medicines, as well as pharmaceutical active substances, that are not protected by valid and enforceable third-party patents. Sandoz is organized globally in three franchises: Retail Generics, Anti-Infectives and Biopharmaceuticals. In Retail Generics, Sandoz develops, manufactures and markets active ingredients and finished dosage forms of pharmaceuticals to third parties. Retail Generics includes the areas of dermatology, respiratory, oncology, ophthalmics, cardiovascular, metabolism, central nervous system, pain, gastrointestinal, and hormonal therapies, as well as finished dosage form anti-infectives sold to third parties. In Anti-Infectives, Sandoz manufactures active pharmaceutical ingredients and intermediates, mainly antibiotics, for internal use by Retail Generics and for sale to third party customers. In Biopharmaceuticals, Sandoz develops, manufactures and markets protein or other biotechnology-based products, including biosimilars, and provides biotechnology manufacturing services to other companies.
Alcon researches, discovers, develops, manufactures, distributes and sells eye care products. Alcon is the global leader in eye care with product offerings in eye care devices and vision care. Alcon is organized into two global business franchises: Surgical and Vision Care. The Surgical franchise includes technologies and devices for cataract, retinal, glaucoma and refractive surgery, as well as intraocular lenses to treat cataract and refractive errors, like presbyopia and astigmatism. Alcon also provides viscoelastics, surgical solutions, surgical packs, and other disposable products for cataract and vitreoretinal surgery. The Vision Care franchise comprises daily disposable, monthly replacement, and color-enhancing contact lenses, as well as a complete line of contact lens care products including multi-purpose and hydrogen-peroxide based solutions, rewetting drops and daily protein removers.
The divisions are supported by Novartis Institute for BioMedical Research, Novartis Business Services, Global Drug Development and Novartis Technical Operations. Corporate activities include Group headquarter functions and items that are not specific to one segment. Further details are provided in Note 3 to the Consolidated Financial Statements of the Annual Report 2017.

38/67
Segmentation – Fourth quarter Innovative Corporate Medicines Sandoz Alcon (including eliminations) Group
(USD millions) Q4 2017 Q4 2016 Q4 2017 Q4 2016 Q4 2017 Q4 2016 Q4 2017 Q4 2016 Q4 2017 Q4 2016
Net sales to third parties 8 756 8 273 2 595 2 605 1 564 1 444 12 915 12 322
Sales to other segments 166 160 36 33 -202 -193
Net sales 8 922 8 433 2 631 2 638 1 564 1 444 -202 -193 12 915 12 322
Other revenues 220 256 10 6 19 22 249 284
Cost of goods sold -2 340 -2 435 -1 514 -1 505 -849 -782 214 233 -4 489 -4 489
Gross profit 6 802 6 254 1 127 1 139 715 662 31 62 8 675 8 117
Marketing & Sales -2 470 -2 302 -491 -445 -503 -499 -3 464 -3 246
Research & Development -2 162 -2 244 -198 -209 -142 -131 -2 502 -2 584
General & Administration -271 -234 -90 -82 -83 -101 -133 -175 -577 -592
Other income 223 221 83 49 9 2 305 109 620 381
Other expense -315 -335 -126 -87 -74 -53 -167 -146 -682 -621
Operating income 1 807 1 360 305 365 -78 -120 36 -150 2 070 1 455
as % of net sales 20.6% 16.4% 11.8% 14.0% -5.0% -8.3% 16.0% 11.8%
Income from associated companies 1 1 415 155 416 156
Interest expense -208 -168
Other financial income and expense, net 23 -365
Income before taxes 2 301 1 078
Taxes -325 -142
Net income 1 976 936

39/67
Segmentation – Full year Innovative Corporate Medicines Sandoz Alcon (including eliminations) Group
(USD millions) FY 2017 FY 2016 FY 2017 FY 2016 FY 2017 FY 2016 FY 2017 FY 2016 FY 2017 FY 2016
Net sales to third parties 33 025 32 562 10 060 10 144 6 024 5 812 49 109 48 518
Sales to other segments 668 624 118 104 3 -789 -728
Net sales 33 693 33 186 10 178 10 248 6 027 5 812 -789 -728 49 109 48 518
Other revenues 898 815 37 37 3 4 88 62 1 026 918
Cost of goods sold -9 007 -9 331 -5 800 -5 971 -3 231 -3 092 863 874 -17 175 -17 520
Gross profit 25 584 24 670 4 415 4 314 2 799 2 724 162 208 32 960 31 916
Marketing & Sales -9 089 -8 435 -1 811 -1 681 -1 961 -1 882 -12 861 -11 998
Research & Development -7 630 -7 709 -774 -814 -568 -516 -8 972 -9 039
General & Administration -986 -978 -315 -300 -383 -410 -452 -506 -2 136 -2 194
Other income 1 027 1 091 204 185 47 48 691 603 1 969 1 927
Other expense -1 124 -1 213 -351 -259 -124 -96 -732 -776 -2 331 -2 344
Operating income 7 782 7 426 1 368 1 445 -190 -132 -331 -471 8 629 8 268
as % of net sales 23.6% 22.8% 13.6% 14.2% -3.2% -2.3% 17.6% 17.0%
Income from associated companies -1 23 6 1 086 697 1 108 703
Interest expense -777 -707
Other financial income and expense, net 39 -447
Income before taxes 8 999 7 817
Taxes -1 296 -1 119
Net income 7 703 6 698

40/67
6. Financial instruments
The following table illustrates the three hierarchical levels for valuing financial instruments at fair value and also those measured at amortized cost or at cost as of December 31, 2017 and December 31, 2016. For additional information on the hierarchies and other matters, please refer to the Consolidated Financial Statements in the 2017 Annual Report, published on January 24, 2018.
Valued at amortized Level 1 Level 2 Level 3 cost or cost Total
Dec 31, Dec 31, Dec 31, Dec 31, Dec 31, Dec 31, Dec 31, Dec 31, Dec 31, Dec 31,
(USD millions) 2017 2016 2017 2016 2017 2016 2017 2016 2017 2016
Debt securities 303 284 25 22 328 306
Fund investments 34 31 34 31
Total available-for-sale marketable securities 337 315 25 22 362 337
Time deposits with original maturity more than 90 days 125 108 125 108
Derivative financial instruments 31 230 31 230
Accrued interest on debt securities 1 1 1 1
Total marketable securities, time deposits and derivative financial instruments 337 315 56 252 126 109 519 676
Financial investments and long-term loans
Available-for-sale financial investments 672 513 437 476 1 109 989
Fund investments 166 107 166 107
Contingent consideration receivables 394 586 394 586
Long-term loans and receivables from customers
and finance lease, advances, security deposits 574 514 574 514
Financial investments and long-term loans 672 513 997 1 169 574 514 2 243 2 196
Associated companies at fair value through profit or loss 28 188 188 216 188
Contingent consideration receivables short-term 450 450
Contingent consideration payables -852 -889 -852 -889
Other financial liabilities -72 -129 -72 -129
Derivative financial instruments -107 -116 -107 -116
Total financial liabilities at fair value -107 -116 -924 -1 018 -1 031 -1 134
In 2017 there were no changes in the valuation techniques used for financial instruments nor significant transfers from one level to the other nor significant transactions associated with level 3 financial instruments.
The fair value of straight bonds amounted to USD 23.8 billion at December 31, 2017 (USD 17.9 billion at December 31, 2016) compared to the balance sheet value of USD 23.0 billion at December 31, 2017 (USD 17.3 billion at December 31, 2016). For all other financial assets and liabilities, the carrying amount is a reasonable approximation of the fair value. The carrying amount of financial assets included in the line financial investments and long-term loans of USD 2.2 billion at December 31, 2017 (USD 2.2 billion at December 31, 2016) is included in line “financial and other non-current assets” of the condensed consolidated balance sheets.
The Group’s exposure to financial risks has not changed significantly during the period and there have been no major changes to the risk management department or in any risk management policies.

41/67
7. Legal proceedings update
A number of Novartis companies are, and will likely continue to be, subject to various legal proceedings, including litigations, arbitrations and governmental investigations, that arise from time to time. Legal proceedings are inherently unpredictable. As a result, the Group may become subject to substantial liabilities that may not be covered by insurance and may in the future incur judgments or enter into settlements of claims that could have a material adverse effect on its results of operations or cash flow. Note 20 to the Consolidated Financial Statements in our 2016 Annual Report and 2016 Form 20-F contains a summary as of the date of these reports of significant legal proceedings to which Novartis or its subsidiaries were a party. The following is a summary as of January 23, 2018 of significant developments in those proceedings, as well as any new significant proceedings commenced since the date of the 2016 Annual Report and 2016 Form 20-F. Reference is also made to Note 19 to the Consolidated Financial Statements in our 2017 Annual Report and 2017 Form 20-F for a summary of significant legal proceedings.
Investigations and related litigationsAsia/Russia investigationIn 2017, Novartis Group companies, as well as present and former senior executives of Alcon, received document requests and subpoenas from the US Department of Justice and the US Securities and Exchange Commission requesting information concerning Alcon’s business practices in Asia and Russia and related accounting treatment, both before and after Alcon became part of the Novartis Group. Novartis is cooperating with this investigation.
In addition to the matter described above, there have been other developments in the other legal matters described in Note 20 to the Consolidated Financial Statements contained in our 2016 Annual Report and 2016 Form 20-F. These do not significantly affect the assessment of management concerning the adequacy of the total provisions recorded for legal proceedings.
8. Subsequent events
For significant transactions entered into in 2017 and closed in January 2018, see Note 3.
42/67
SUPPLEMENTARY INFORMATION (unaudited)
Non-IFRS disclosures
Core results
The Group’s core results – including core operating income, core net income and core earnings per share – exclude fully the amortization and impairment charges of intangible assets, excluding software, and certain acquisition related items. The following items that exceed a threshold of USD 25 million are also excluded: integration and divestment related income and expenses, divestment gains and losses, restructuring charges/releases and related items, legal related items, impairments of property, plant and equipment and financial assets, as well as income and expense items that management deems exceptional and that are or are expected to accumulate within the year to be over a USD 25 million threshold.
Novartis believes that investor understanding of the Group’s performance is enhanced by disclosing core measures of performance because, since they exclude items which can vary significantly from year to year, the core measures enable better comparison of business performance across years. For this same reason, Novartis uses these core measures in addition to IFRS and other measures as important factors in assessing the Group’s performance.
The following are examples of how these core measures are utilized:
• In addition to monthly reports containing financial information prepared under International Financial Reporting Standards (IFRS), senior management receives a monthly analysis incorporating these core measures.
• Annual budgets are prepared for both IFRS and core measures.
Despite the use of these measures by management in setting goals and measuring the Group’s performance, these are non-IFRS measures that have no standardized meaning prescribed by IFRS. As a result, such measures have limits in usefulness to investors.
Because of their non-standardized definitions, the core measures (unlike IFRS measures) may not be comparable to the calculation of similar measures of other companies. These core measures are presented solely to permit investors to more fully understand how the Group’s management assesses underlying performance. These core measures are not, and should not be viewed as, a substitute for IFRS measures.
As an internal measure of Group performance, these core measures have limitations, and the Group’s performance management process is not solely restricted to these metrics. A limitation of the core measures is that they provide a view of the Group’s operations without including all events during a period, such as the effects of an acquisition, divestment, or amortization/impairments of purchased intangible assets and restructurings.
Constant currencies
Changes in the relative values of non-US currencies to the US dollar can affect the Group’s financial results and financial position. To provide additional information that may be useful to investors, including changes in sales volume, we present information about our net sales and various values relating to operating and net income that are adjusted for such foreign currency effects.
Constant currency calculations have the goal of eliminating two exchange rate effects so that an estimate can be made of underlying changes in the consolidated income statement excluding the impact of fluctuations in exchanges rates:
• the impact of translating the income statements of consolidated entities from their non-USD functional currencies to USD; and
• the impact of exchange rate movements on the major transactions of consolidated entities performed in currencies other than their functional currency.

43/67
We calculate constant currency measures by translating the current year’s foreign currency values for sales and other income statement items into USD using the average exchange rates from the prior year and comparing them to the prior year values in USD.
We use these constant currency measures in evaluating the Group’s performance, since they may assist us in evaluating our ongoing performance from year to year. However, in performing our evaluation, we also consider equivalent measures of performance which are not affected by changes in the relative value of currencies.
Growth rate calculation
For ease of understanding, Novartis uses a sign convention for its growth rates such that a reduction in operating expenses or losses compared to the prior year is shown as a positive growth.
Net debt and free cash flow
Net debt and free cash flow are non-IFRS financial measures, which means they should not be interpreted as measures determined under IFRS. Net debt is presented as additional information because management believes it is a useful supplemental indicator of the Group’s ability to pay dividends, to meet financial commitments and to invest in new strategic opportunities, including strengthening its balance sheet. Free cash flow is presented as additional information because management believes it is a useful supplemental indicator of the Group’s ability to operate without reliance on additional borrowing or use of existing cash. Free cash flow is a measure of the net cash generated that is available for debt repayment, investment in strategic opportunities and for returning to shareholders. The definition of free cash flow used by Novartis does not include amounts related to changes in investments in associated companies nor related to acquisitions or divestments of subsidiaries. Free cash flow is not intended to be a substitute measure for cash flow from operating activities as determined under IFRS.
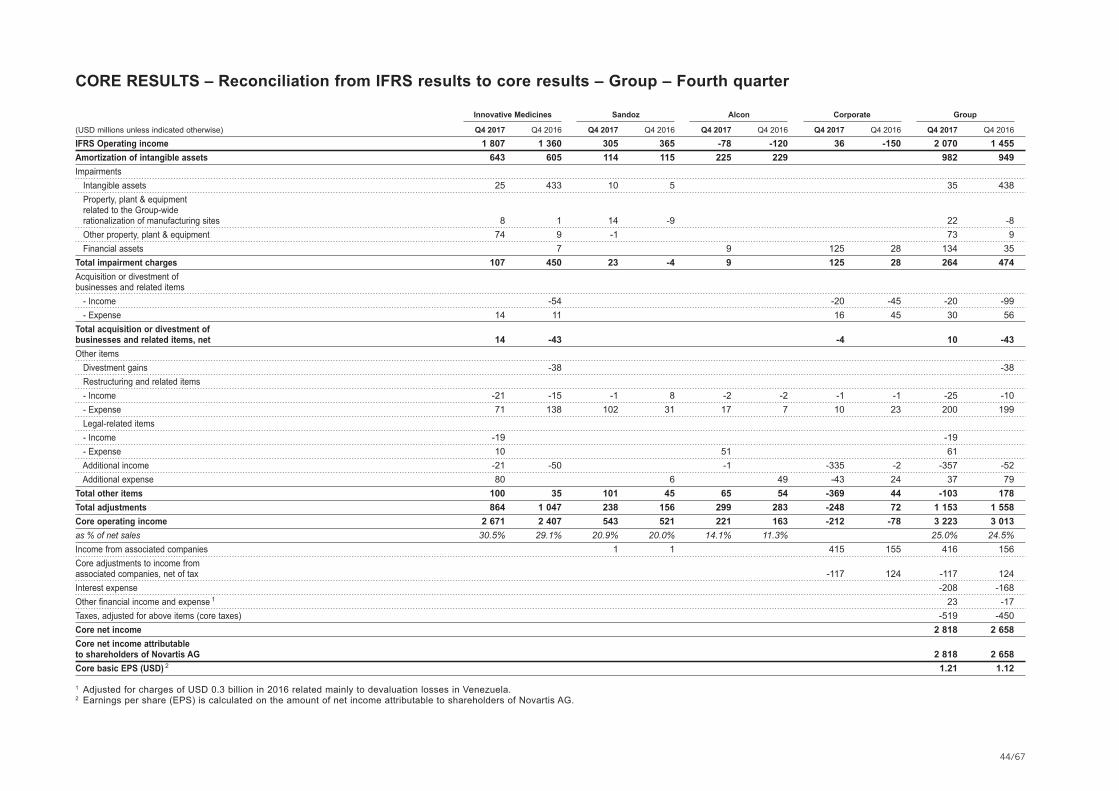
44/67
CORE RESULTS – Reconciliation from IFRS results to core results – Group – Fourth quarter
Innovative Medicines Sandoz Alcon Corporate Group
(USD millions unless indicated otherwise) Q4 2017 Q4 2016 Q4 2017 Q4 2016 Q4 2017 Q4 2016 Q4 2017 Q4 2016 Q4 2017 Q4 2016
IFRS Operating income 1 807 1 360 305 365 -78 -120 36 -150 2 070 1 455
Amortization of intangible assets 643 605 114 115 225 229 982 949
Impairments
Intangible assets 25 433 10 5 35 438
Property, plant & equipment
related to the Group-wide
rationalization of manufacturing sites 8 1 14 -9 22 -8
Other property, plant & equipment 74 9 -1 73 9
Financial assets 7 9 125 28 134 35
Total impairment charges 107 450 23 -4 9 125 28 264 474
Acquisition or divestment of
businesses and related items
- Income -54 -20 -45 -20 -99
- Expense 14 11 16 45 30 56
Total acquisition or divestment of
businesses and related items, net 14 -43 -4 10 -43
Other items
Divestment gains -38 -38
Restructuring and related items
- Income -21 -15 -1 8 -2 -2 -1 -1 -25 -10
- Expense 71 138 102 31 17 7 10 23 200 199
Legal-related items
- Income -19 -19
- Expense 10 51 61
Additional income -21 -50 -1 -335 -2 -357 -52
Additional expense 80 6 49 -43 24 37 79
Total other items 100 35 101 45 65 54 -369 44 -103 178
Total adjustments 864 1 047 238 156 299 283 -248 72 1 153 1 558
Core operating income 2 671 2 407 543 521 221 163 -212 -78 3 223 3 013
as % of net sales 30.5% 29.1% 20.9% 20.0% 14.1% 11.3% 25.0% 24.5%
Income from associated companies 1 1 415 155 416 156
Core adjustments to income from
associated companies, net of tax -117 124 -117 124
Interest expense -208 -168
Other financial income and expense 1 23 -17
Taxes, adjusted for above items (core taxes) -519 -450
Core net income 2 818 2 658
Core net income attributable
to shareholders of Novartis AG 2 818 2 658
Core basic EPS (USD) 2 1.21 1.12
1 Adjusted for charges of USD 0.3 billion in 2016 related mainly to devaluation losses in Venezuela.2 Earnings per share (EPS) is calculated on the amount of net income attributable to shareholders of Novartis AG.

45/67
CORE RESULTS – Reconciliation from IFRS results to core results – Group – Full year
Innovative Medicines Sandoz Alcon Corporate Group
(USD millions unless indicated otherwise) FY 2017 FY 2016 FY 2017 FY 2016 FY 2017 FY 2016 FY 2017 FY 2016 FY 2017 FY 2016
IFRS Operating income 7 782 7 426 1 368 1 445 -190 -132 -331 -471 8 629 8 268
Amortization of intangible assets 2 243 2 440 454 460 901 901 3 598 3 801
Impairments
Intangible assets 591 522 61 65 57 4 709 591
Property, plant & equipment
related to the Group-wide
rationalization of manufacturing sites 7 1 60 -7 67 -6
Other property, plant & equipment 77 76 13 8 90 84
Financial assets 18 29 197 99 226 117
Total impairment charges 675 617 134 66 86 4 197 99 1 092 786
Acquisition or divestment of
businesses and related items
- Income -2 -68 -115 -229 -117 -297
- Expense 32 41 130 223 162 264
Total acquisition or divestment of
businesses and related items, net 30 -27 15 -6 45 -33
Other items
Divestment gains -368 -608 -6 -48 -368 -662
Restructuring and related items
- Income -53 -41 -7 -23 -4 -4 -1 -5 -65 -73
- Expense 268 418 134 123 34 33 29 65 465 639
Legal-related items
- Income -21 -99 -21 -99
- Expense 35 205 61 96 205
Additional income -534 -61 -3 -51 -13 -372 -22 -960 -96
Additional expense 273 84 6 20 61 46 100 339 251
Total other items -400 -102 124 100 60 77 -298 90 -514 165
Total adjustments 2 548 2 928 712 626 1 047 982 -86 183 4 221 4 719
Core operating income 10 330 10 354 2 080 2 071 857 850 -417 -288 12 850 12 987
as % of net sales 31.3% 31.8% 20.7% 20.4% 14.2% 14.6% 26.2% 26.8%
Income from associated companies -1 23 6 1 086 697 1 108 703
Core adjustments to income from
associated companies, net of tax 1 226 431 227 431
Interest expense -777 -707
Other financial income and expense 1 39 -99
Taxes, adjusted for above items (core taxes) -2 056 -2 001
Core net income 11 391 11 314
Core net income attributable
to shareholders of Novartis AG 11 391 11 307
Core basic EPS (USD) 2 4.86 4.75
1 Adjusted for charges of USD 0.3 billion in 2016 related mainly to devaluation losses in Venezuela.2 Earnings per share (EPS) is calculated on the amount of net income attributable to shareholders of Novartis AG.

46/67
CORE RESULTS – Reconciliation from IFRS results to core results – Group – Fourth quarter
Acquisition or
Amortization divestment of
Q4 2017 of intangible businesses and Q4 2017 Q4 2016
(USD millions unless indicated otherwise) IFRS results assets 1 Impairments 2 related items 3 Other items 4 Core results Core results
Gross profit 8 675 842 10 86 9 613 9 066
Operating income 2 070 982 264 10 -103 3 223 3 013
Income before taxes 2 301 1 045 264 10 -283 3 337 3 108
Taxes 5 -325 -519 -450
Net income 1 976 2 818 2 658
Basic EPS (USD) 6 0.85 1.21 1.12
The following are adjustments to arrive at Core Gross Profit
Cost of goods sold -4 489 842 10 86 -3 551 -3 490
The following are adjustments to arrive at Core Operating Income
Marketing & Sales -3 464 -4 -3 468 -3 239
Research & Development -2 502 140 68 43 -2 251 -2 173
General & Administration -577 1 -576 -573
Other income 620 1 -20 -393 208 222
Other expense -682 185 30 164 -303 -290
The following are adjustments to arrive at Core Income before taxes
Income from associated companies 416 63 -180 299 280
1 Amortization of intangible assets: Cost of goods sold includes recurring amortization of acquired rights to in-market products and other production-related intangible assets; Research & Development includes the recurring amortization of acquired rights for technology platforms; Income from associated companies includes USD 63 million for the Novartis share of the estimated Roche core items.
2 Impairments: Cost of goods sold and Research & Development include impairment charges related to intangible assets; Research & Development and Other expense include impairment charges related to financial assets; Research & Development, Other income and Other expense include reversals and charges related to the impairment of property, plant and equipment.
3 Acquisition or divestment of businesses and related items, including restructuring and integration charges: Other income and Other expense include transitional service-fee income and expenses and other items related to the portfolio transformation and other costs related to an acquisition.
4 Other items: Cost of goods sold; Other Income and Other expense include net restructuring and other charges related to the Group-wide rationalization of manufacturing sites; Cost of goods sold, Research & Development, General & Administration, Other income and Other expense include other restructuring income and charges and related items; Marketing & Sales includes an income from the release of a provision; Research & Development includes fair value adjustments to contingent consideration liabilities and charges related to the impairment of property, plant & equipment; Other income and Other expense include legal-related items; Other income also includes a gain from a Swiss pension plan amendment as well as product and financial asset divestment gains and a fair value adjustment to contingent consideration sales milestone receivables; Other expense also includes a reclass of a fair value adjustment to a contingent consideration liability to a division and an amendment to the Swiss Pension Plan; Income from associated companies includes an adjustment of USD 180 million for the Novartis share of the estimated GSK Consumer Healthcare Holdings Ltd. core items.
5 Taxes on the adjustments between IFRS and core results take into account, for each individual item included in the adjustment, the tax rate that will finally be applicable to the item based on the jurisdiction where the adjustment will finally have a tax impact. Generally, this results in amortization and impairment of intangible assets and acquisition-related restructuring and integration items having a full tax impact. There is usually a tax impact on other items although this is not always the case for items arising from legal settlements in certain jurisdictions. Adjustments related to income from associated companies are recorded net of any related tax effect. Due to these factors and the differing effective tax rates in the various jurisdictions, the tax on the total adjustments of USD 1.0 million to arrive at the core results before tax amounts to USD 194 million. The average tax rate on the adjustments is 18.7%.
6 Earnings per share (EPS) is calculated on the amount of net income attributable to shareholders of Novartis AG.

47/67
CORE RESULTS – Reconciliation from IFRS results to core results – Group – Full year
Acquisition or
Amortization divestment of
FY 2017 of intangible businesses and FY 2017 FY 2016
(USD millions unless indicated otherwise) IFRS results assets 1 Impairments 2 related items 3 Other items 4 Core results Core results
Gross profit 32 960 3 401 92 125 36 578 35 806
Operating income 8 629 3 598 1 092 45 -514 12 850 12 987
Income before taxes 8 999 3 974 1 093 45 -664 13 447 13 315
Taxes 5 -1 296 -2 056 -2 001
Net income 7 703 11 391 11 314
Basic EPS (USD) 6 3.28 4.86 4.75
The following are adjustments to arrive at Core Gross Profit
Cost of goods sold -17 175 3 401 92 125 -13 557 -13 580
The following are adjustments to arrive at Core Operating Income
Marketing & Sales -12 861 -4 -12 865 -11 991
Research & Development -8 972 197 680 -218 -8 313 -8 402
General & Administration -2 136 1 -2 135 -2 120
Other income 1 969 -9 -117 -1 065 778 753
Other expense -2 331 329 162 647 -1 193 -1 059
The following are adjustments to arrive at Core Income before taxes
Income from associated companies 1 108 376 1 -150 1 335 1 134
1 Amortization of intangible assets: Cost of goods sold includes recurring amortization of acquired rights to in-market products and other production-related intangible assets; Research & Development includes the recurring amortization of acquired rights for technology platforms; Income from associated companies includes USD 376 million for the Novartis share of the estimated Roche core items.
2 Impairments: Cost of goods sold and Research & Development include impairment charges related to intangible assets; Research & Development and Other expense include impairment charges related to financial assets; Research & Development, Other income and Other expense include reversals and charges related to the impairment of property, plant and equipment.
3 Acquisition or divestment of businesses and related items, including restructuring and integration charges: Other income and Other expense include transitional service-fee income and expenses and other items related to the portfolio transformation.
4 Other items: Cost of goods sold, Other Income and Other expense include net restructuring and other charges related to the Group-wide rationalization of manufacturing sites; Cost of goods sold, Research & Development, General & Administration, Other income and Other expense include other restructuring income and charges and related items; Marketing & Sales includes an income from the release of a provision; Research & Development includes fair value adjustments to contingent consideration liabilities; Other income and Other expense include legal-related items; Other income also includes a gain from a Swiss pension plan amendment, product and financial asset divestment gains, a partial reversal of a prior period charge, an income from a settlement of a contract dispute and a fair value adjustment to contingent consideration sales milestone receivables; Other expense also includes a provision for contract termination costs, a charge for onerous contracts and an amendment to the Swiss Pension Plan; Income from associated companies includes an adjustment of USD 150 million for the Novartis share of the estimated GSK Consumer Healthcare Holdings Ltd. core items.
5 Taxes on the adjustments between IFRS and core results take into account, for each individual item included in the adjustment, the tax rate that will finally be applicable to the item based on the jurisdiction where the adjustment will finally have a tax impact. Generally, this results in amortization and impairment of intangible assets and acquisition-related restructuring and integration items having a full tax impact. There is usually a tax impact on other items, although this is not always the case for items arising from legal settlements in certain jurisdictions. Adjustments related to income from associated companies are recorded net of any related tax effect. Due to these factors and the differing effective tax rates in the various jurisdictions, the tax on the total adjustments of USD 4.4 billion to arrive at the core results before tax amounts to USD 760 million. The average tax rate on the adjustments is 17.1%.
6 Earnings per share (EPS) is calculated on the amount of net income attributable to shareholders of Novartis AG.

48/67
CORE RESULTS – Reconciliation from IFRS results to core results – Innovative Medicines – Fourth quarter
Acquisition or
divestment of
Q4 2017 Amortization of businesses Other Q4 2017 Q4 2016
(USD millions) IFRS results intangible assets 1 Impairments 2 and related items 3 items 4 Core results Core results
Gross profit 6 802 505 26 7 333 6 845
Operating income 1 807 643 107 14 100 2 671 2 407
The following are adjustments to arrive at Core Gross Profit
Cost of goods sold -2 340 505 26 -1 809 -1 794
The following are adjustments to arrive at Core Operating Income
Marketing & Sales -2 470 -4 -2 474 -2 295
Research & Development -2 162 138 59 43 -1 922 -1 835
General & Administration -271 1 -270 -234
Other income 223 1 -53 171 114
Other expense -315 47 14 87 -167 -188
1 Amortization of intangible assets: Cost of goods sold includes recurring amortization of acquired rights to in-market products and other production-related intangible assets; Research & Development includes the recurring amortization of acquired rights for technology platforms.
2 Impairments: Research & Development includes impairment charges related to intangible assets; Research & Development, Other income and Other expense include reversals and charges related to the impairment of property, plant and equipment.
3 Acquisition or divestment of businesses and related items, including restructuring and integration charges: Other expense includes other items related to the portfolio transformation and other costs related to an acquisition.
4 Other items: Cost of goods sold and Other expense include net restructuring and other charges related to the Group-wide rationalization of manufacturing sites; Costs of goods sold, Research & Development, General & Administration, Other income and Other expense include other restructuring income and charges and related items; Marketing & Sales includes an income from the release of a provision; Research & Development includes fair value adjustments to contingent consideration liabilities; Other income and expense include legal-related items, Other income also includes product and financial asset divestment gains; Other expense also includes an amendment to the Swiss Pension Plan and other charges.

49/67
CORE RESULTS – Reconciliation from IFRS results to core results – Innovative Medicines – Full year
Acquisition or
divestment of
FY 2017 Amortization of businesses Other FY 2017 FY 2016
(USD millions) IFRS results intangible assets 1 Impairments 2 and related items 3 items 4 Core results Core results
Gross profit 25 584 2 056 31 56 27 727 27 109
Operating income 7 782 2 243 675 30 -400 10 330 10 354
The following are adjustments to arrive at Core Gross Profit
Cost of goods sold -9 007 2 056 31 56 -6 864 -6 842
The following are adjustments to arrive at Core Operating Income
Marketing & Sales -9 089 -4 -9 093 -8 428
Research & Development -7 630 187 594 -200 -7 049 -7 112
General & Administration -986 1 -985 -978
Other income 1 027 -9 -2 -665 351 264
Other expense -1 124 59 32 412 -621 -501
1 Amortization of intangible assets: Cost of goods sold includes recurring amortization of acquired rights to in-market products and other production-related intangible assets; Research & Development includes the recurring amortization of acquired rights for technology platforms.
2 Impairments: Cost of goods sold and Research & Development include impairment charges related to intangible assets; Research & Development, Other income and Other expense include reversals and charges related to the impairment of property, plant and equipment.
3 Acquisition or divestment of businesses and related items, including restructuring and integration charges: Other income includes transitional service-fee income; Other expense includes items related to the portfolio transformation and costs related to an acquisition.
4 Other items: Cost of goods sold, Other Income and Other expense include net restructuring and other charges related to the Group-wide rationalization of manufacturing sites; Costs of goods sold, Research & Development, General & Administration, Other income and Other expense include other restructuring income and charges and related items; Marketing & Sales includes an income from the release of a provision; Research & Development includes fair value adjustments to contingent consideration liabilities; Other income and Other expense include legal-related items; Other income also includes a gain from a Swiss pension plan amendment, an income from a settlement of a contract dispute, as well as product and financial asset divestment gains; Other expense also includes a provision for contract termination costs, an amendment to the Swiss Pension Plan, a charge for onerous contracts and other charges.

50/67
CORE RESULTS – Reconciliation from IFRS results to core results – Sandoz – Fourth quarter
Acquisition or
divestment of
Q4 2017 Amortization of businesses Other Q4 2017 Q4 2016
(USD millions) IFRS results intangible assets 1 Impairments 2 and related items items 3 Core results Core results
Gross profit 1 127 114 10 60 1 311 1 270
Operating income 305 114 23 101 543 521
The following are adjustments to arrive at Core Gross Profit
Cost of goods sold -1 514 114 10 60 -1 330 -1 374
The following are adjustments to arrive at Core Operating Income
Other income 83 -1 82 47
Other expense -126 13 42 -71 -60
1 Amortization of intangible assets: Cost of goods sold includes recurring amortization of acquired rights to in-market products and other production-related intangible assets.2 Impairments: Cost of goods sold includes impairment charges related to intangible assets; Other expense includes impairment charges related to property, plant and equipment.3 Other items: Cost of goods sold, Other income and Other expense include net restructuring and other charges related to the Group-wide rationalization of manufacturing sites and other restructuring charges and
related items.
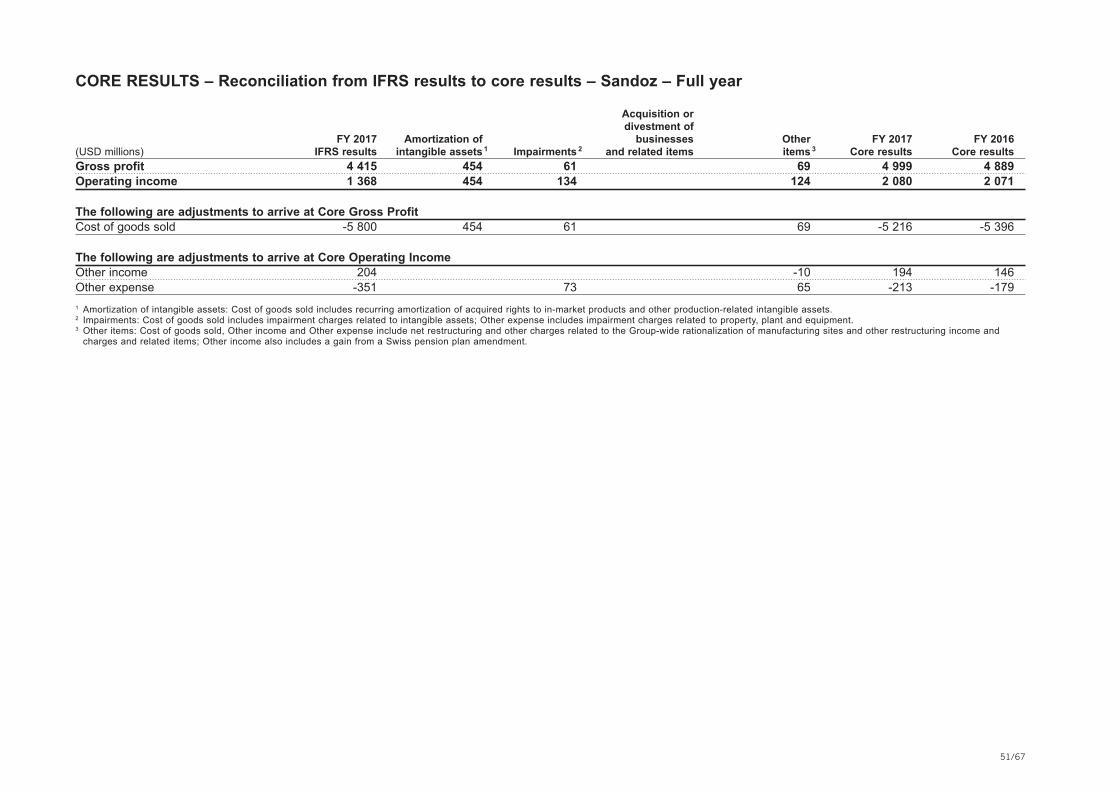
51/67
CORE RESULTS – Reconciliation from IFRS results to core results – Sandoz – Full year
Acquisition or
divestment of
FY 2017 Amortization of businesses Other FY 2017 FY 2016
(USD millions) IFRS results intangible assets 1 Impairments 2 and related items items 3 Core results Core results
Gross profit 4 415 454 61 69 4 999 4 889
Operating income 1 368 454 134 124 2 080 2 071
The following are adjustments to arrive at Core Gross Profit
Cost of goods sold -5 800 454 61 69 -5 216 -5 396
The following are adjustments to arrive at Core Operating Income
Other income 204 -10 194 146
Other expense -351 73 65 -213 -179
1 Amortization of intangible assets: Cost of goods sold includes recurring amortization of acquired rights to in-market products and other production-related intangible assets.2 Impairments: Cost of goods sold includes impairment charges related to intangible assets; Other expense includes impairment charges related to property, plant and equipment.3 Other items: Cost of goods sold, Other income and Other expense include net restructuring and other charges related to the Group-wide rationalization of manufacturing sites and other restructuring income and
charges and related items; Other income also includes a gain from a Swiss pension plan amendment.

52/67
CORE RESULTS – Reconciliation from IFRS results to core results – Alcon – Fourth quarter
Acquisition or
divestment of
Q4 2017 Amortization of businesses Other Q4 2017 Q4 2016
(USD millions) IFRS results intangible assets 1 Impairments 2 and related items items 3 Core results Core results
Gross profit 715 223 938 889
Operating loss/income -78 225 9 65 221 163
The following are adjustments to arrive at Core Gross Profit
Cost of goods sold -849 223 -626 -555
The following are adjustments to arrive at Core Operating Income
Research & Development -142 2 9 -131 -129
Other income 9 -3 6
Other expense -74 68 -6 3
1 Amortization of intangible assets: Cost of goods sold includes recurring amortization of acquired rights to in-market products and other production-related intangible assets; Research & Development includes the recurring amortization of acquired rights for technology platforms.
2 Impairments: Research & Development includes impairment charges related to financial assets.3 Other items: Other income and Other expense include restructuring income and charges and related items; Other expense also includes legal-related items.

53/67
CORE RESULTS – Reconciliation from IFRS results to core results – Alcon – Full year
Acquisition or
divestment of
FY 2017 Amortization of businesses Other FY 2017 FY 2016
(USD millions) IFRS results intangible assets 1 Impairments 2 and related items items 3 Core results Core results
Gross profit 2 799 891 3 690 3 600
Operating loss/income -190 901 86 60 857 850
The following are adjustments to arrive at Core Gross Profit
Cost of goods sold -3 231 891 -2 340 -2 216
The following are adjustments to arrive at Core Operating Income
Research & Development -568 10 86 -18 -490 -486
Other income 47 -17 30 44
Other expense -124 95 -29 -16
1 Amortization of intangible assets: Cost of goods sold includes recurring amortization of acquired rights to in-market products and other production-related intangible assets; Research & Development includes the recurring amortization of acquired rights for technology platforms.
2 Impairments: Research & Development includes impairment charges related to intangible and financial assets.3 Other items: Research & Development includes fair value adjustments to contingent consideration liabilities; Other income and Other expense include restructuring income and charges and related items; Other
income also includes a gain from a Swiss pension plan amendment and the partial reversal of a prior period charge; Other expense also includes legal-related items.
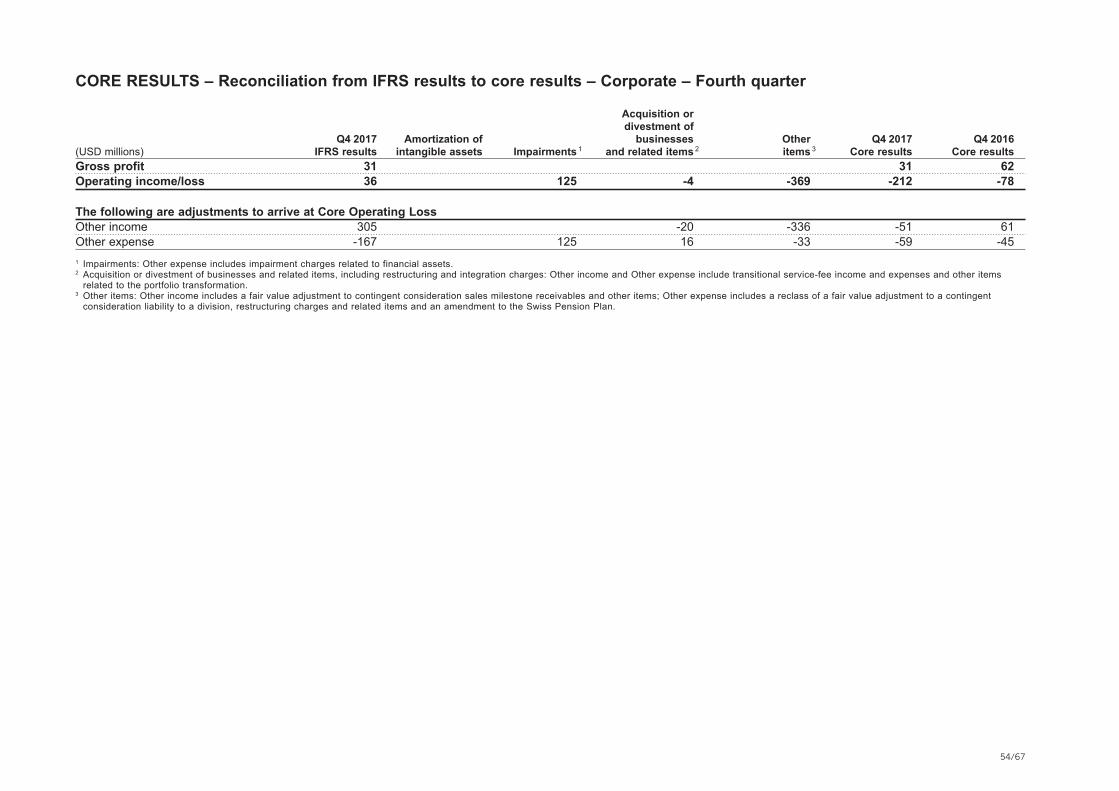
54/67
CORE RESULTS – Reconciliation from IFRS results to core results – Corporate – Fourth quarter
Acquisition or
divestment of
Q4 2017 Amortization of businesses Other Q4 2017 Q4 2016
(USD millions) IFRS results intangible assets Impairments 1 and related items 2 items 3 Core results Core results
Gross profit 31 31 62
Operating income/loss 36 125 -4 -369 -212 -78
The following are adjustments to arrive at Core Operating Loss
Other income 305 -20 -336 -51 61
Other expense -167 125 16 -33 -59 -45
1 Impairments: Other expense includes impairment charges related to financial assets.2 Acquisition or divestment of businesses and related items, including restructuring and integration charges: Other income and Other expense include transitional service-fee income and expenses and other items
related to the portfolio transformation.3 Other items: Other income includes a fair value adjustment to contingent consideration sales milestone receivables and other items; Other expense includes a reclass of a fair value adjustment to a contingent
consideration liability to a division, restructuring charges and related items and an amendment to the Swiss Pension Plan.

55/67
CORE RESULTS – Reconciliation from IFRS results to core results – Corporate – Full year
Acquisition or
divestment of
FY 2017 Amortization of businesses Other FY 2017 FY 2016
(USD millions) IFRS results intangible assets Impairments 1 and related items 2 items 3 Core results Core results
Gross profit 162 162 208
Operating loss -331 197 15 -298 -417 -288
The following are adjustments to arrive at Core Operating Loss
Other income 691 -115 -373 203 299
Other expense -732 197 130 75 -330 -363
1 Impairments: Other expense includes impairment charges related to financial assets.2 Acquisition or divestment of businesses and related items, including restructuring and integration charges: Other income and Other expense include transitional service-fee income and expenses and other items
related to the portfolio transformation.3 Other items: Other income includes a fair value adjustment to contingent consideration sales milestone receivables, a Swiss pension plan amendment and other items; Other income and Other expense include
restructuring income and charges and related items; Other expense also includes an amendment to the Swiss Pension Plan.

56/67
Condensed consolidated changes in net debt
Fourth quarter
(USD millions) Q4 2017 Q4 2016
Change in cash and cash equivalents 50 -167
Change in marketable securities, commodities,
financial debt and financial derivatives 1 642 2 923
Reduction in net debt 1 692 2 756
Net debt at October 1 -20 739 -18 781
Net debt at December 31 -19 047 -16 025
Full year
(USD millions) FY 2017 FY 2016
Change in cash and cash equivalents 1 853 2 333
Change in marketable securities, commodities,
financial debt and financial derivatives -4 875 -1 874
Increase/Reduction in net debt -3 022 459
Net debt at January 1 -16 025 -16 484
Net debt at December 31 -19 047 -16 025
Components of net debt Dec 31, Dec 31, (USD millions) 2017 2016
Non-current financial debts -23 224 -17 897
Current financial debts and derivative
financial instruments -5 308 -5 905
Less liquidity:
Cash and cash equivalents 8 860 7 007
Marketable securities, commodities
and derivative financial instruments 625 770
Net debt at December 31 -19 047 -16 025
Share information Dec 31, Dec 31, 2017 2016
Number of shares outstanding 2 317 456 499 2 374 059 013
Registered share price (CHF) 82.40 74.10
ADR price (USD) 83.96 72.84
Market capitalization (USD billions) 1 195.5 172.0
Market capitalization (CHF billions) 1 191.0 175.9
1 Market capitalization is calculated based on the number of shares outstanding (excluding treasury shares). Market capitalization in USD is based on the market capitalization in CHF converted at the year end CHF/USD exchange rate.

57/67
Free cash flow
Fourth quarter
(USD millions) Q4 2017 Q4 2016 Change
Operating income 2 070 1 455 615
Reversal of non-cash items
Depreciation, amortization and impairments 1 724 1 832 -108
Change in provisions and other non-current liabilities 157 219 -62
Other -297 -41 -256
Operating income adjusted for non-cash items 3 654 3 465 189
Interest and other financial receipts 150 237 -87
Interest and other financial payments -338 -201 -137
Taxes paid -486 -791 305
Payments out of provisions and other
net cash movements in non-current liabilities -372 -184 -188
Change in inventory and trade
receivables less trade payables 478 613 -135
Change in other net current assets and
other operating cash flow items 322 452 -130
Cash flows from operating activities 3 408 3 591 -183
Purchase of property, plant & equipment -638 -586 -52
Purchase of intangible assets -332 -195 -137
Proceeds from sales of intangible assets 100 179 -79
Purchase of financial and other non-current assets -167 -131 -36
Proceeds from sales of property, plant & equipment and financial assets 85 118 -33
Free cash flow 2 456 2 976 -520
Full year
(USD millions) FY 2017 FY 2016 Change
Operating income 8 629 8 268 361
Reversal of non-cash items
Depreciation, amortization and impairments 6 332 6 175 157
Change in provisions and other non-current liabilities 160 956 -796
Other -360 -264 -96
Operating income adjusted for non-cash items 14 761 15 135 -374
Interest and other financial receipts 1 084 942 142
Interest and other financial payments -980 -878 -102
Taxes paid -1 611 -2 111 500
Payments out of provisions and other
net cash movements in non-current liabilities -877 -1 536 659
Change in inventory and trade
receivables less trade payables -393 -1 051 658
Change in other net current assets and
other operating cash flow items 637 974 -337
Cash flows from operating activities 12 621 11 475 1 146
Purchase of property, plant & equipment -1 696 -1 862 166
Purchase of intangible assets -1 050 -1 017 -33
Proceeds from sales of intangible assets 640 847 -207
Purchase of financial and other non-current assets -510 -396 -114
Proceeds from sales of property, plant & equipment and financial assets 423 408 15
Free cash flow 10 428 9 455 973

58/67
Net sales of the top 20 Innovative Medicines products in 2017 – Fourth quarter
US Rest of world Total
% change % change % change in constant in constant % change in constant
Brands Business Franchise Indication USD m currencies USD m currencies USD m in USD currencies
Gilenya Neuroscience Relapsing multiple sclerosis 433 -2 392 0 825 2 -1
Psoriasis, ankylosing
Immunology spondylitis and
Cosentyx and Dermatology psoriatic arthritis 363 41 252 76 615 57 53
Chronic myeloid
Gleevec/Glivec Oncology leukemia and GIST 129 -50 319 -39 448 -41 -43
Age-related
Lucentis Ophthalmology macular degeneration 485 2 485 7 2
Tasigna Oncology Chronic myeloid leukemia 211 10 274 2 485 6 6
Carcinoid tumors
Sandostatin Oncology and Acromegaly 214 -2 207 8 421 3 3
Afinitor/Votubia Oncology Breast cancer / TSC 216 9 191 -2 407 4 3
Galvus Established Medicines Diabetes 327 8 327 10 8
Exjade/Jadenu Oncology Chronic iron overload 139 31 142 4 281 19 16
Exforge Established Medicines Hypertension 5 0 244 1 249 5 1
Diovan/Co–Diovan Established Medicines Hypertension 24 -35 220 -2 244 -5 -6 Xolair 1 Respiratory Asthma 247 9 247 14 9
Tafinlar + Mekinist Oncology Melanoma 93 22 153 39 246 38 33
Immune
Promacta/Revolade Oncology thrombocytopenic purpura 128 42 127 45 255 43 43
Votrient Oncology Renal cell carcinoma 102 10 111 8 213 11 8
Jakavi Oncology Myelofibrosis 228 33 228 41 33
Reduction of elevated
Travoprost Group Ophthalmology intraocular pressure 55 -4 95 -12 150 -7 -9
Entresto Cardio-Metabolic Chronic Heart Failure 100 117 85 254 185 172 164
Immunology
Neoral/Sandimmun(e) and Dermatology Transplantation 7 -36 117 0 124 -2 -3
Voltaren/Cataflam Established Medicines Inflammation/pain 119 -10 119 -13 -10
Top 20 products total 2 219 7 4 335 4 6 554 7 5Rest of portfolio 696 -2 1 506 3 2 202 2 1
Total Division sales 2 915 4 5 841 3 8 756 6 4
1 Net sales reflect Xolair sales for all indications (e.g. including Xolair SAA and Xolair CSU, which is managed by the Immunology and Dermatology franchise).

59/67
Net sales of the top 20 Innovative Medicines products in 2017 – Full year
US Rest of world Total
% change % change % change in constant in constant % change in constant
Brands Business Franchise Indication USD m currencies USD m currencies USD m in USD currencies
Gilenya Neuroscience Relapsing multiple sclerosis 1 709 2 1 476 3 3 185 2 2
Psoriasis, ankylosing
Immunology spondylitis and
Cosentyx and Dermatology psoriatic arthritis 1 275 67 796 115 2 071 84 82
Chronic myeloid
Gleevec/Glivec Oncology leukemia and GIST 627 -48 1 316 -37 1 943 -42 -41
Age-related
Lucentis Ophthalmology macular degeneration 1 888 4 1 888 3 4
Tasigna Oncology Chronic myeloid leukemia 810 12 1 031 6 1 841 6 9
Carcinoid tumors
Sandostatin Oncology and Acromegaly 832 -2 780 1 1 612 -2 -1
Afinitor/Votubia Oncology Breast cancer / TSC 819 6 706 -3 1 525 1 2
Galvus Established Medicines Diabetes 1 233 5 1 233 3 5
Exjade/Jadenu Oncology Chronic iron overload 515 15 544 8 1 059 11 11
Exforge Established Medicines Hypertension 28 180 932 2 960 4 4
Diovan/Co–Diovan Established Medicines Hypertension 87 -41 870 -4 957 -11 -9
Xolair 1 Respiratory Asthma 920 11 920 10 11
Tafinlar + Mekinist Oncology Melanoma 339 14 534 41 873 30 29
Immune
Promacta/Revolade Oncology thrombocytopenic purpura 446 44 421 31 867 37 37
Votrient Oncology Renal cell carcinoma 407 14 401 7 808 11 10
Jakavi Oncology Myelofibrosis 777 32 777 34 32
Reduction of elevated
Travoprost Group Ophthalmology intraocular pressure 216 2 373 -9 589 -5 -5
Entresto Cardio-Metabolic Chronic Heart Failure 297 161 210 262 507 198 195
Immunology
Neoral/Sandimmun(e) and Dermatology Transplantation 38 -7 450 -4 488 -5 -4
Voltaren/Cataflam Established Medicines Inflammation/pain 465 -4 465 -11 -4
Top 20 products total 8 445 6 16 123 3 24 568 4 4Rest of portfolio 2 671 -9 5 786 0 8 457 -4 -3
Total Division sales 11 116 2 21 909 2 33 025 1 2
1 Net sales reflect Xolair sales for all indications (e.g. including Xolair SAA and Xolair CSU, which is managed by the Immunology and Dermatology franchise).

60/67
Innovative Medicines net sales by business franchise – Fourth quarter Q4 2017 Q4 2016 % change % change
USD m USD m USD cc
Oncology
Gleevec/Glivec 448 764 -41 -43
Tasigna 485 458 6 6
Sandostatin 421 408 3 3
Afinitor/Votubia 407 391 4 3
Exjade/Jadenu 281 237 19 16
Tafinlar + Mekinist 246 178 38 33
Promacta/Revolade 255 178 43 43
Votrient 213 192 11 8
Jakavi 228 162 41 33
Kisqali 35 0 nm nm
Other 224 239 -6 -8
Total Oncology business unit 3 243 3 207 1 -1
Ophthalmology
Lucentis 485 452 7 2
Travoprost Group 150 161 -7 -9
Systane Group 108 100 8 7
Topical Olopatadine Group 59 55 7 7
Other 544 551 -1 -3
Total Ophthalmology 1 346 1 319 2 -1
Immunology and Dermatology
Cosentyx 615 391 57 53
Neoral/Sandimmun(e) 124 126 -2 -3
Zortress/Certican 116 104 12 8
Ilaris 115 75 53 51
Myfortic 104 91 14 14
Other 81 104 -22 -23
Total Immunology and Dermatology 1 155 891 30 27
Neuroscience
Gilenya 825 810 2 -1
Other 25 30 -17 -22
Total Neuroscience 850 840 1 -1
Respiratory
Ultibro Breezhaler 120 90 33 26
Seebri Breezhaler 42 38 11 4
Onbrez Breezhaler 29 36 -19 -12
Subtotal COPD1 portfolio 191 164 16 13
Xolair 2 247 216 14 9
Other 7 8 -13 -3
Total Respiratory 445 388 15 10
Cardio-Metabolic
Entresto 185 68 172 164
Other 5 4 25 36
Total Cardio-Metabolic 190 72 164 157
Established Medicines
Galvus 327 298 10 8
Exforge 249 237 5 1
Diovan/Co-Diovan 244 257 -5 -6
Voltaren/Cataflam 119 136 -13 -10
Exelon/Exelon Patch 88 114 -23 -24
Ritalin/Focalin 74 73 1 -2
Other 426 441 -3 -2
Total Established Medicines 1 527 1 556 -2 -3
Total Pharmaceuticals business unit 5 513 5 066 9 6
Total Division net sales 8 756 8 273 6 4
1 Chronic Obstructive Pulmonary Disease2 Net sales reflect Xolair sales for all indications (e.g. including Xolair SAA and Xolair CSU, which is managed by the Immunology and
Dermatology franchise).
nm = not meaningful

61/67
Innovative Medicines net sales by business franchise – Full year FY 2017 FY 2016 % change % change
USD m USD m USD cc
Oncology
Gleevec/Glivec 1 943 3 323 -42 -41
Tasigna 1 841 1 739 6 9
Sandostatin 1 612 1 646 -2 -1
Afinitor/Votubia 1 525 1 516 1 2
Exjade/Jadenu 1 059 956 11 11
Tafinlar + Mekinist 873 672 30 29
Promacta/Revolade 867 635 37 37
Votrient 808 729 11 10
Jakavi 777 581 34 32
Kisqali 76 0 nm nm
Other 893 993 -10 -9
Total Oncology business unit 12 274 12 790 -4 -3
Ophthalmology
Lucentis 1 888 1 835 3 4
Travoprost Group 589 619 -5 -5
Systane Group 400 377 6 5
Topical Olopatadine Group 284 335 -15 -15
Other 2 207 2 297 -4 -4
Total Ophthalmology 5 368 5 463 -2 -1
Immunology and Dermatology
Cosentyx 2 071 1 128 84 82
Neoral/Sandimmun(e) 488 515 -5 -4
Zortress/Certican 414 398 4 4
Ilaris 402 283 42 42
Myfortic 378 383 -1 3
Other 288 308 -6 -7
Total Immunology and Dermatology 4 041 3 015 34 35
Neuroscience
Gilenya 3 185 3 109 2 2
Other 102 124 -18 -18
Total Neuroscience 3 287 3 233 2 2
Respiratory
Ultibro Breezhaler 411 363 13 12
Seebri Breezhaler 151 149 1 3
Onbrez Breezhaler 112 143 -22 -14
Subtotal COPD1 portfolio 674 655 3 5
Xolair 2 920 835 10 11
Other 23 31 -26 -14
Total Respiratory 1 617 1 521 6 8
Cardio-Metabolic
Entresto 507 170 198 195
Other 17 14 21 25
Total Cardio-Metabolic 524 184 185 182
Established Medicines
Galvus 1 233 1 193 3 5
Exforge 960 926 4 4
Diovan/Co-Diovan 957 1 073 -11 -9
Voltaren/Cataflam 465 525 -11 -4
Exelon/Exelon Patch 381 444 -14 -14
Ritalin/Focalin 236 282 -16 -18
Other 1 682 1 913 -12 -10
Total Established Medicines 5 914 6 356 -7 -5
Total Pharmaceuticals business unit 20 751 19 772 5 6
Total Division net sales 33 025 32 562 1 2
1 Chronic Obstructive Pulmonary Disease2 Net sales reflect Xolair sales for all indications (e.g. including Xolair SAA and Xolair CSU, which is managed by the Immunology and
Dermatology franchise).
nm = not meaningful

62/67
Net sales by region1 – Fourth quarter Q4 2017 Q4 2016 % change Q4 2017 Q4 2016
USD m USD m USD cc % of total % of total Innovative Medicines
Europe 3 009 2 832 6 -1 34 34
US 2 915 2 796 4 4 33 34
Asia/Africa/Australasia 2 115 1 960 8 8 24 24
Canada and Latin America 717 685 5 11 9 8
Total 8 756 8 273 6 4 100 100
Of which in Established Markets 6 525 6 185 5 2 75 75
Of which in Emerging Growth Markets 2 231 2 088 7 8 25 25
Sandoz
Europe 1 235 1 113 11 3 48 43
US 796 961 -17 -17 31 37
Asia/Africa/Australasia 377 364 4 4 15 14
Canada and Latin America 187 167 12 9 6 6
Total 2 595 2 605 0 -4 100 100
Of which in Established Markets 1 901 1 941 -2 -6 73 75
Of which in Emerging Growth Markets 694 664 5 2 27 25
Alcon
Europe 420 378 11 3 27 26
US 639 623 3 3 41 43
Asia/Africa/Australasia 383 332 15 15 24 23
Canada and Latin America 122 111 10 14 8 8
Total 1 564 1 444 8 6 100 100
Of which in Established Markets 1 212 1 151 5 3 77 80
Of which in Emerging Growth Markets 352 293 20 19 23 20
Group
Europe 4 664 4 323 8 0 36 35
US 4 350 4 380 -1 -1 34 36
Asia/Africa/Australasia 2 875 2 656 8 8 22 22
Canada and Latin America 1 026 963 7 11 8 7
Total 12 915 12 322 5 2 100 100
Of which in Established Markets 9 638 9 277 4 1 75 75
Of which in Emerging Growth Markets 3 277 3 045 8 7 25 25
1 Net sales from operations by location of third party customer. Emerging Growth Markets comprise all markets other than the Established Markets of the US, Canada, Western Europe, Japan, Australia and New Zealand.

63/67
Net sales by region1 – Full year FY 2017 FY 2016 % change FY 2017 FY 2016
USD m USD m USD cc % of total % of total Innovative Medicines
Europe 11 289 11 217 1 0 34 34
US 11 116 10 897 2 2 34 33
Asia/Africa/Australasia 7 875 7 696 2 4 24 24
Canada and Latin America 2 745 2 752 0 7 8 9
Total 33 025 32 562 1 2 100 100
Of which in Established Markets 24 633 24 416 1 1 75 75
Of which in Emerging Growth Markets 8 392 8 146 3 7 25 25
Sandoz
Europe 4 633 4 354 6 4 46 43
US 3 278 3 708 -12 -12 33 37
Asia/Africa/Australasia 1 391 1 418 -2 1 14 14
Canada and Latin America 758 664 14 12 7 6
Total 10 060 10 144 -1 -2 100 100
Of which in Established Markets 7 383 7 580 -3 -3 73 75
Of which in Emerging Growth Markets 2 677 2 564 4 4 27 25
Alcon
Europe 1 570 1 508 4 3 26 26
US 2 541 2 512 1 1 42 43
Asia/Africa/Australasia 1 452 1 327 9 10 24 23
Canada and Latin America 461 465 -1 7 8 8
Total 6 024 5 812 4 4 100 100
Of which in Established Markets 4 694 4 630 1 1 78 80
Of which in Emerging Growth Markets 1 330 1 182 13 15 22 20
Group
Europe 17 492 17 079 2 1 36 35
US 16 935 17 117 -1 -1 34 35
Asia/Africa/Australasia 10 718 10 441 3 5 22 22
Canada and Latin America 3 964 3 881 2 8 8 8
Total 49 109 48 518 1 2 100 100
Of which in Established Markets 36 710 36 626 0 0 75 75
Of which in Emerging Growth Markets 12 399 11 892 4 7 25 25
1 Net sales from operations by location of third party customer. Emerging Growth Markets comprise all markets other than the Established Markets of the US, Canada, Western Europe, Japan, Australia and New Zealand.

64/67
Principal currency translation rates
Fourth quarter Period-end Period-end Average Average rates rates
rates rates Dec 31, Dec 31, Q4 2017 Q4 2016 2017 2016
1 CHF 1.013 0.999 1.024 0.978
1 CNY 0.151 0.146 0.154 0.144
1 EUR 1.178 1.079 1.195 1.051
1 GBP 1.328 1.242 1.347 1.227
100 JPY 0.886 0.916 0.888 0.854
100 RUB 1.711 1.588 1.734 1.648
Full year Period-end Period-end Average Average rates rates
rates rates Dec 31, Dec 31, FY 2017 FY 2016 2017 2016
1 CHF 1.016 1.015 1.024 0.978
1 CNY 0.148 0.151 0.154 0.144
1 EUR 1.129 1.107 1.195 1.051
1 GBP 1.288 1.355 1.347 1.227
100 JPY 0.892 0.922 0.888 0.854
100 RUB 1.715 1.498 1.734 1.648
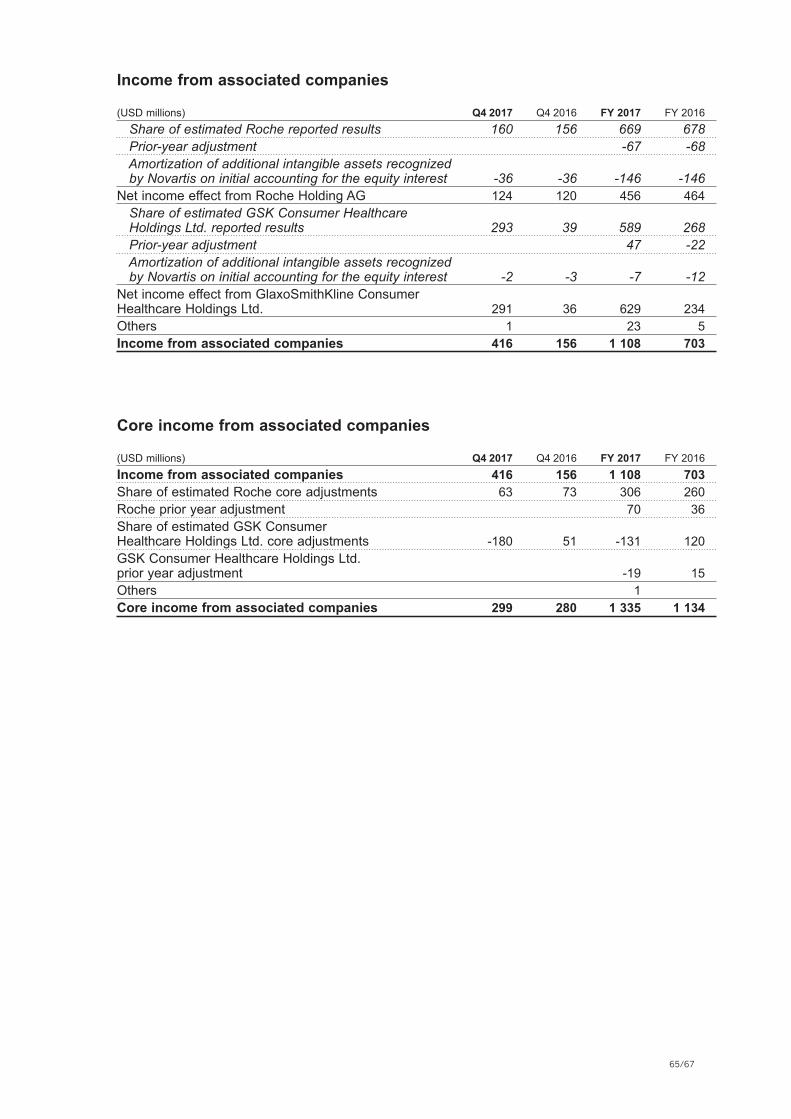
65/67
Income from associated companies
(USD millions) Q4 2017 Q4 2016 FY 2017 FY 2016
Share of estimated Roche reported results 160 156 669 678
Prior-year adjustment -67 -68
Amortization of additional intangible assets recognized
by Novartis on initial accounting for the equity interest -36 -36 -146 -146
Net income effect from Roche Holding AG 124 120 456 464
Share of estimated GSK Consumer Healthcare
Holdings Ltd. reported results 293 39 589 268
Prior-year adjustment 47 -22
Amortization of additional intangible assets recognized
by Novartis on initial accounting for the equity interest -2 -3 -7 -12
Net income effect from GlaxoSmithKline Consumer
Healthcare Holdings Ltd. 291 36 629 234
Others 1 23 5
Income from associated companies 416 156 1 108 703
Core income from associated companies
(USD millions) Q4 2017 Q4 2016 FY 2017 FY 2016
Income from associated companies 416 156 1 108 703
Share of estimated Roche core adjustments 63 73 306 260
Roche prior year adjustment 70 36
Share of estimated GSK Consumer
Healthcare Holdings Ltd. core adjustments -180 51 -131 120
GSK Consumer Healthcare Holdings Ltd.
prior year adjustment -19 15
Others 1
Core income from associated companies 299 280 1 335 1 134
66/67
Disclaimer This press release contains forward-looking statements within the meaning of the United States Private Securities Litigation Reform Act of 1995, that can generally be identified by words such as “innovation,” “poised,” “sustainable growth,” “growth drivers,” “growing,” “Breakthrough Therapy,” “Priority Review,” “submitted,” “accelerated assessment,” “proposed,” “outlook,” “expected,” “to grow,” “pipeline,” “launches,” “priorities,” “will,” “driving,” “growth phase,” “strengthening,” “enabled,” “driven,” “ongoing,” “continued,” “growth plan,” “focused on,” “expect,” “momentum,” “pipelines,” “continues,” “initiate,” “strategic review,” “options,” “progress,” “potential,” “strategy,” “on track,” “remains a priority,” “would,” “estimated,” “to be executed,” “aims,” “launched,” “guidance,” “launch,” “to be discussed,” “under review,” “recommended,” “next 12 months,” “planned,” “Fast Track designation,” “underway,” or similar expressions, or by express or implied discussions regarding potential new products, potential new indications for existing products, or regarding potential future revenues from any such products; or regarding the potential outcome of the strategic review being undertaken to maximize shareholder value of the Alcon Division; or regarding the potential financial or other impact of the significant acquisitions and reorganizations of recent years; or regarding the potential impact of the share buyback plan; or regarding potential future sales or earnings of the Novartis Group or any of its divisions or potential shareholder returns; or by discussions of strategy, plans, expectations or intentions. You should not place undue reliance on these statements. Such forward looking statements are based on our current beliefs and expectations regarding future events, and are subject to significant known and unknown risks and uncertainties. Should one or more of these risks or uncertainties materialize, or should underlying assumptions prove incorrect, actual results may vary materially from those set forth in the forward looking statements. There can be no guarantee that any new products will be approved for sale in any market, or that any new indications will be approved for any existing products in any market, or that any approvals which are obtained will be obtained at any particular time, or that any such products will achieve any particular revenue levels. Nor can there be any guarantee that the strategic review being undertaken to maximize shareholder value of the Alcon Division will reach any particular results, or at any particular time, or that the result of the strategic review will in fact maximize shareholder value. Neither can there be any guarantee that Novartis will be able to realize any of the potential strategic benefits, synergies or opportunities as a result of the significant acquisitions and reorganizations of recent years. Neither can there be any guarantee that shareholders will achieve any particular level of shareholder returns. Nor can there be any guarantee that the Group, or any of its divisions, will be commercially successful in the future, or achieve any particular credit rating or financial results. In particular, our expectations could be affected by, among other things: global trends toward health care cost containment, including government, payor and general public pricing and reimbursement pressures and requirements for increased pricing transparency; regulatory actions or delays or government regulation generally; the potential that the strategic benefits, synergies or opportunities expected from the significant acquisitions and reorganizations of recent years may not be realized or may take longer to realize than expected; the inherent uncertainties involved in predicting shareholder returns; the uncertainties inherent in the research and development of new healthcare products, including clinical trial results and additional analysis of existing clinical data; our ability to obtain or maintain proprietary intellectual property protection, including the ultimate extent of the impact on Novartis of the loss of patent protection and exclusivity on key products which commenced in prior years and will continue this year; safety, quality or manufacturing issues; uncertainties regarding actual or potential legal proceedings, including, among others, actual or potential product liability litigation, litigation and investigations regarding sales and marketing practices, intellectual property disputes and government investigations generally; uncertainties involved in the development or adoption of potentially transformational technologies and business models; general political and economic conditions, including uncertainties regarding the effects of ongoing instability in various parts of the world; uncertainties regarding future global exchange rates; uncertainties regarding future demand for our products; and uncertainties regarding potential significant breaches of data security or data privacy, or disruptions of our information technology systems; and other risks and factors referred to in Novartis AG’s current Form 20-F on file with the US Securities and Exchange Commission. Novartis is providing the information in this press release as of this date and does not undertake any obligation to update any forward-looking statements as a result of new information, future events or otherwise.
All product names appearing in italics are trademarks owned by or licensed to Novartis Group companies. Rituxan® is a registered trademark of Biogen. Neulasta® is a registered trademark of Amgen Inc. Humira® is a registered trademark of AbbVie Inc. Stelara® is a registered trademark of Janssen Biotech, Inc. Seretide® is a registered trademark of GlaxoSmithKline. Jakafi® is a registered trademark of Incyte Corporation. Enbrel® is a registered trademark of Amgen Inc.

67/67
About Novartis Novartis provides innovative healthcare solutions that address the evolving needs of patients and societies. Headquartered in Basel, Switzerland, Novartis offers a diversified portfolio to best meet these needs: innovative medicines, cost-saving generic and biosimilar pharmaceuticals and eye care. Novartis has leading positions globally in each of these areas. In 2017, the Group achieved net sales of USD 49.1 billion, while R&D throughout the Group amounted to approximately USD 9.0 billion. Novartis Group companies employ approximately 122,000 full-time-equivalent associates. Novartis products are sold in approximately 155 countries around the world. For more information, please visit http://www.novartis.com.
Novartis issued its 2017 Annual Report today, and it is available at www.novartis.com. Novartis will also file its 2017 Annual Report on Form 20-F with the US Securities and Exchange Commission today, and will post this document on www.novartis.com. Novartis shareholders may receive a hard copy of either of these documents, each of which contains our complete audited financial statements, free of charge, upon request. Novartis also issued its 2017 Corporate Responsibility Performance Report today, and it is available at www.novartis.com.
Important dates March 2, 2018 Annual General Meeting April 19, 2018 First quarter results 2018 May 15-16, 2018 Meet Novartis Management investor event in Basel July 18, 2018 Second quarter results 2018 October 18, 2018 Third quarter results 2018