strengthening the competitiveness of thai firms: what ... · strengthening the competitiveness of...
TRANSCRIPT
BANK OF THAILAND SYMPOSIUM 2006
Strengthening the Competitiveness of Thai Firms:
What Needs to be Done?∗
Kiatipong Ariyapruchya Cheerapan O-lanthanasate Chatsurang Karnchanasai
Monetary Policy Group Bank of Thailand
August 4, 2006
Abstract
This paper examines the empirical relationship between product-
market competition and firm productivity. Using a rich panel data set of Thai manufacturing firms, we estimate firm total factor productivity and measures of product-market competition such as economic capital rent, price dispersion, market concentration and market entry paperwork. We find that increased product-market competition encourages firm efficiency. Product market competition can also engender productivity growth and innovation. Young firms tend be more efficient and invest more in physical capital and research, reflecting the importance of fluid markets and creative destruction to economic growth.
The challenge for policymakers will be how to harness the forces of market competition to ensure that the firm sector, as a whole, can raise its productivity and adapt to rising competition. We discuss how the appropriate competition policy can also serve to encourage innovation, which will become increasingly important to Thailand’s long-run prosperity as the Thai economy exhausts the gains from factor accumulation and imitation and moves toward becoming a knowledge-based economy.
∗For permission and technical assistance in using the Productivity and Investment Climate Survey, we are grateful to the following: Phanit Laosirirat, Nantaphorn Aungatichart and Tossapol Ramingwong at the Thailand Productivity Institute; Kirida Bhaopichitr at the World Bank; and the National Economic Social Development Board. We would like to thank Atchana Waiquamdee, Suchada Kirakul, Amara Sriphayak, Nipon Poapongsakorn, Phanit Laosirirat and other BOT seminar participants for their comments. We are grateful to Nalin Chutchotitham and Jiranit Chaowalit for their excellent research assistance. All mistakes are ours. Authors’ email addresses: [email protected]; [email protected]; [email protected]
The views expressed herein are those of the authors and do not necessarily represent those of the Bank of Thailand’s policies.
EXECUTIVE SUMMARY
Every nation aspires to economic prosperity. Although attaining this aspiration has proven elusive for many, the Thai economy, by virtue of its exceptional growth over the past two decades, has stood out as a nation that has successfully embarked upon the journey towards economic prosperity. However, Thailand now stands at a critical juncture. Economic growth over the past two decades was primarily due to factor accumulation. The gains from factor accumulation will gradually diminish. Furthermore, the entry of China and India into the global economy has ushered in a new era of rising competition and relentless change. If Thailand is to continue on its journey toward economic prosperity, policymakers must identify and build the foundations for long-run growth. To this end, we find that domestic market competition can serve as a foundation for growth by giving firms the incentive to raise their productivity, the strength to withstand global competition, and the ability to thrive in the global marketplace.
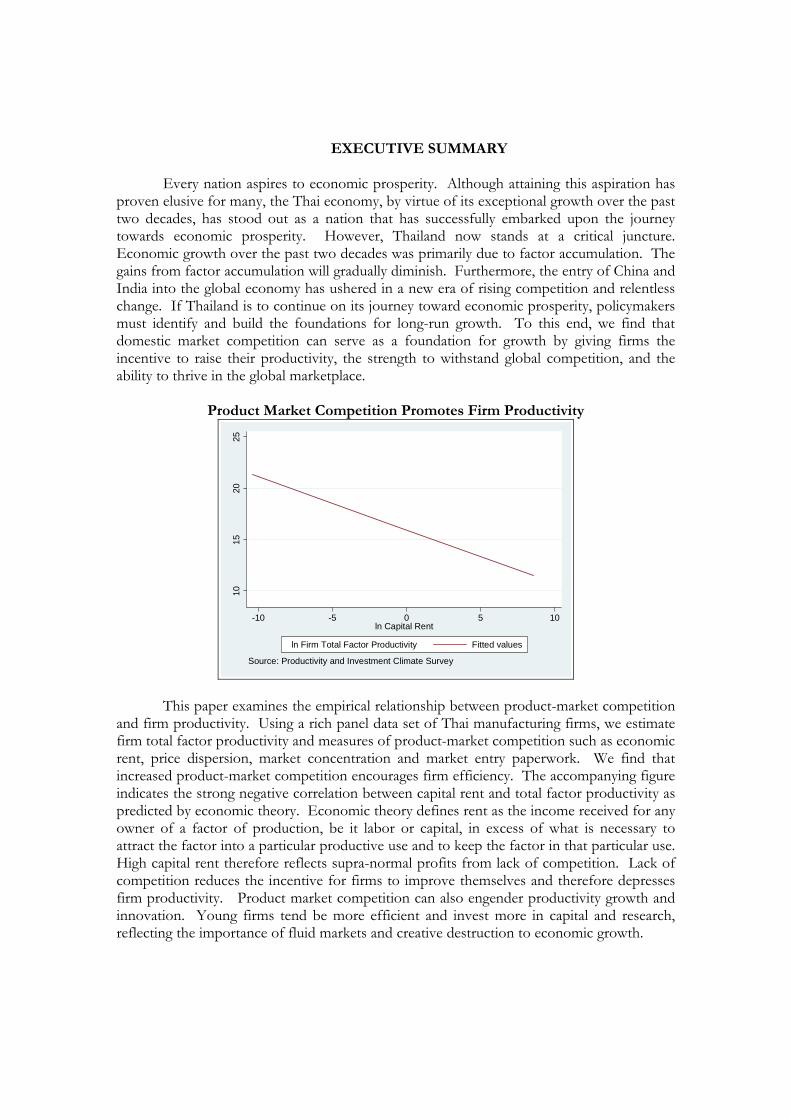
Product Market Competition Promotes Firm Productivity
1015
2025
-10 -5 0 5 10ln Capital Rent
ln Firm Total Factor Productivity Fitted values
Source: Productivity and Investment Climate Survey
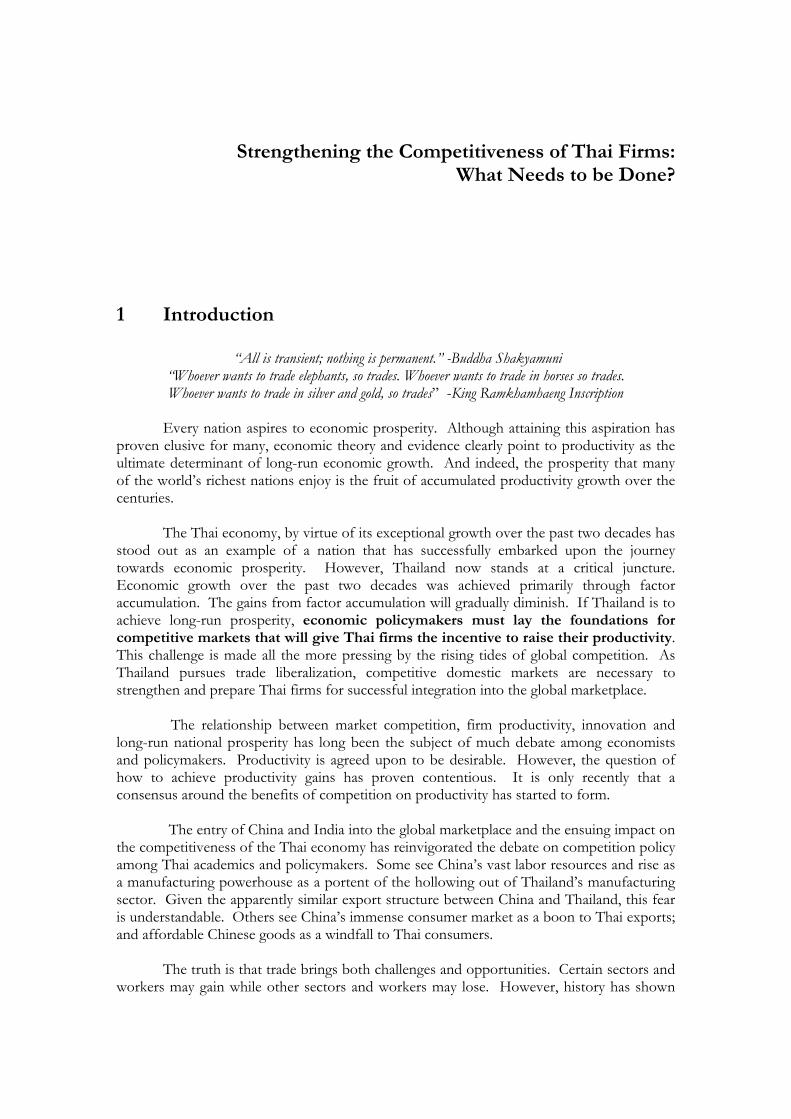
This paper examines the empirical relationship between product-market competition and firm productivity. Using a rich panel data set of Thai manufacturing firms, we estimate firm total factor productivity and measures of product-market competition such as economic rent, price dispersion, market concentration and market entry paperwork. We find that increased product-market competition encourages firm efficiency. The accompanying figure indicates the strong negative correlation between capital rent and total factor productivity as predicted by economic theory. Economic theory defines rent as the income received for any owner of a factor of production, be it labor or capital, in excess of what is necessary to attract the factor into a particular productive use and to keep the factor in that particular use. High capital rent therefore reflects supra-normal profits from lack of competition. Lack of competition reduces the incentive for firms to improve themselves and therefore depresses firm productivity. Product market competition can also engender productivity growth and innovation. Young firms tend be more efficient and invest more in capital and research, reflecting the importance of fluid markets and creative destruction to economic growth.
The challenge for policymakers will be how to harness the forces of market competition to ensure that the firm sector, as a whole, can raise its productivity and adapt to rising competition. The importance of this policy objective cannot be overemphasized: long-run growth ultimately depends on total factor productivity growth. We also stress the immediacy of this challenge in view of the inexorable and accelerating march of globalization. Competitive domestic markets can serve to strengthen Thai firms and prepare them for global competition. Delay would be tantamount to courting disaster. History is rife with examples of economies with noncompetitive domestic markets finding trade liberalization to be disruptive in the short run and possibly hurtful in the long run.
The paper closes with a discussion of the policy implications. Competition policy
should focus on building a foundation for vibrant market competition. The first step would entail removing regulatory impediments to market operation in a timely manner. Examples include price controls, price administration, market entry red-tape, and rationed operation licenses. As product markets are linked to factor markets, it should also be stressed that policymakers should continue the policy of open capital and labor markets, as flexible capital and labor markets underpin firm sector adaptability and resiliency. Regulatory impediments in factor markets, such as wage control, will hurt firm productivity and, in turn, workers, shareholders, and consumers. Restrictions on foreign ownership should be gradually eased to foster competition and technology inflow.
The implementation of competition law falls under the purview of the Trade
Competition Commission (TCC). As such, it should be composed of commissioners representing all relevant interest groups: small and large firms, entrepreneurs, and consumers. Alternatively, the judiciary may be charged with the implementation of competition law. Competition law should be implemented in a transparent and non-discriminatory manner independent from interest group lobbying. Moreover, the TCC should be held accountable for its successes and failures.
Competition law design can also benefit from greater clarity. Anti-competitive
practices such as explicit collusion should be targeted. Quantitative measures of appropriate market competition, especially for non-traded goods, should be defined so as to serve as an objective and transparent aid for assessing anti-competitive practices.
Ensuring product market competition is no easy task. It is in the nature of firms to
seek profit and rent by lobbying regulators to erect artificial barriers and regulatory roadblocks for the purpose of limiting competition. As firms are profit maximizing entities, we can expect no less of them. However, it is the duty of the policymaker to safeguard the public interest by resisting regulatory capture and the temptation to equate firm interest with national interest. Only by doing so, will firms be forced to meet the challenge of competition through constructive means: productivity upgrading and innovation. Patent policy will become increasingly important as the Thai economy exhausts the gains from factor accumulation and imitation and moves toward becoming a knowledge-based economy.
In the past two decades, factor accumulation in the form of physical and human
capital accounted for most of economic growth. The contribution of total factor productivity growth, though relatively small, proved respectable by international standards.
Maintain total factor productivity growth will be crucial for long-run growth. This paper finds that market competition can serve as an engine of economic growth. Although unleashing the forces of competition and creativity can be unsettling, embracing change through technological progress will allow Thailand to build an enduring prosperity.
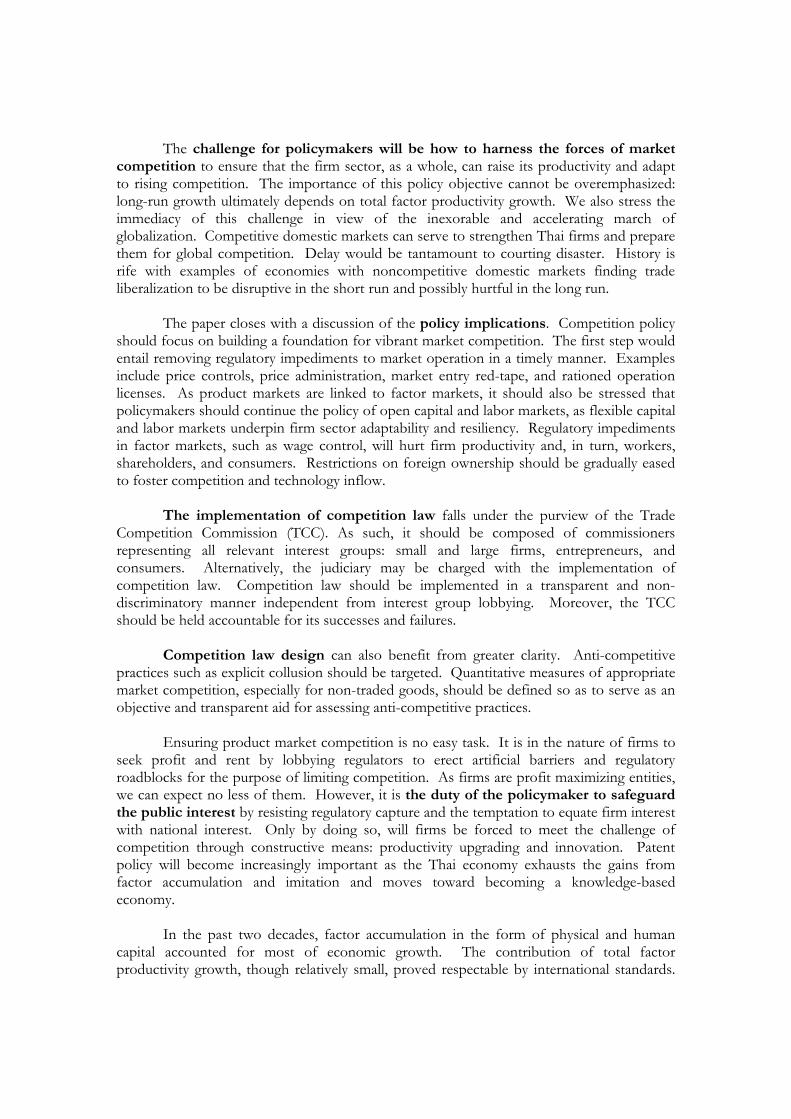
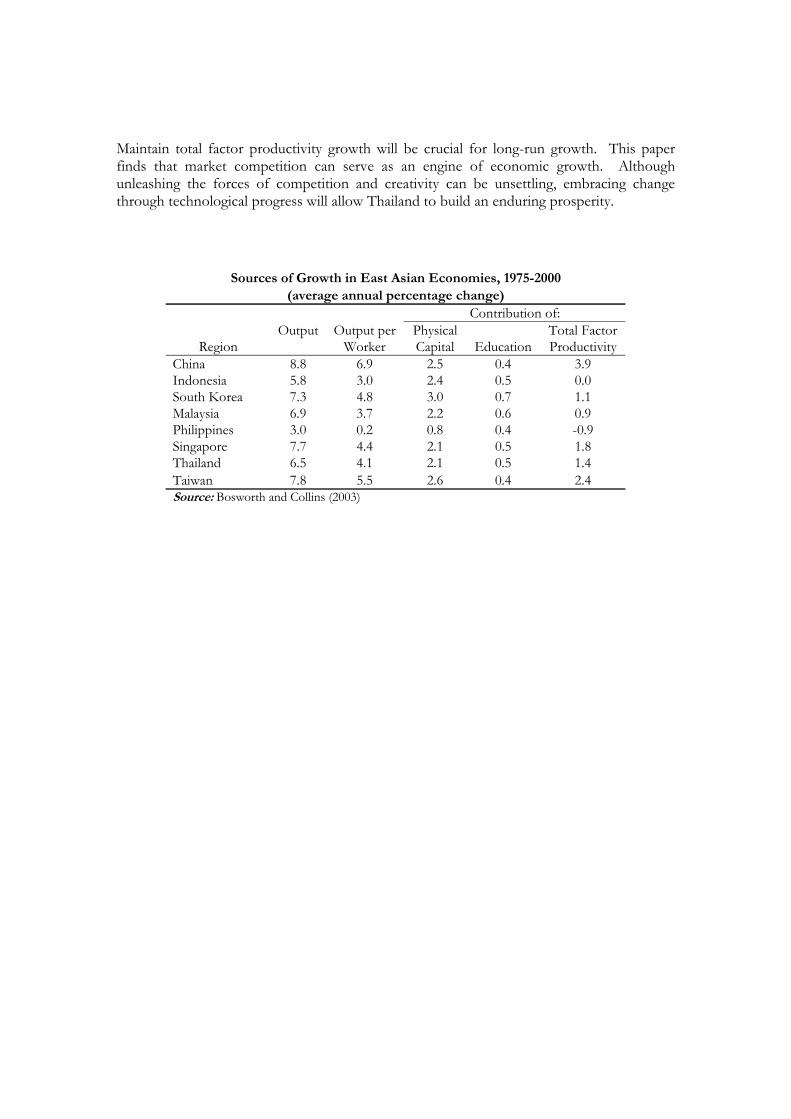
Sources of Growth in East Asian Economies, 1975-2000
(average annual percentage change) Contribution of: Output Output per Physical Total Factor
Region Worker Capital Education Productivity China 8.8 6.9 2.5 0.4 3.9 Indonesia 5.8 3.0 2.4 0.5 0.0 South Korea 7.3 4.8 3.0 0.7 1.1 Malaysia 6.9 3.7 2.2 0.6 0.9 Philippines 3.0 0.2 0.8 0.4 -0.9 Singapore 7.7 4.4 2.1 0.5 1.8 Thailand 6.5 4.1 2.1 0.5 1.4 Taiwan 7.8 5.5 2.6 0.4 2.4 Source: Bosworth and Collins (2003)
Strengthening the Competitiveness of Thai Firms: What Needs to be Done?
1 Introduction
“All is transient; nothing is permanent.” -Buddha Shakyamuni “Whoever wants to trade elephants, so trades. Whoever wants to trade in horses so trades. Whoever wants to trade in silver and gold, so trades” -King Ramkhamhaeng Inscription
Every nation aspires to economic prosperity. Although attaining this aspiration has
proven elusive for many, economic theory and evidence clearly point to productivity as the ultimate determinant of long-run economic growth. And indeed, the prosperity that many of the world’s richest nations enjoy is the fruit of accumulated productivity growth over the centuries.
The Thai economy, by virtue of its exceptional growth over the past two decades has
stood out as an example of a nation that has successfully embarked upon the journey towards economic prosperity. However, Thailand now stands at a critical juncture. Economic growth over the past two decades was achieved primarily through factor accumulation. The gains from factor accumulation will gradually diminish. If Thailand is to achieve long-run prosperity, economic policymakers must lay the foundations for competitive markets that will give Thai firms the incentive to raise their productivity. This challenge is made all the more pressing by the rising tides of global competition. As Thailand pursues trade liberalization, competitive domestic markets are necessary to strengthen and prepare Thai firms for successful integration into the global marketplace.
The relationship between market competition, firm productivity, innovation and
long-run national prosperity has long been the subject of much debate among economists and policymakers. Productivity is agreed upon to be desirable. However, the question of how to achieve productivity gains has proven contentious. It is only recently that a consensus around the benefits of competition on productivity has started to form.
The entry of China and India into the global marketplace and the ensuing impact on
the competitiveness of the Thai economy has reinvigorated the debate on competition policy among Thai academics and policymakers. Some see China’s vast labor resources and rise as a manufacturing powerhouse as a portent of the hollowing out of Thailand’s manufacturing sector. Given the apparently similar export structure between China and Thailand, this fear is understandable. Others see China’s immense consumer market as a boon to Thai exports; and affordable Chinese goods as a windfall to Thai consumers.
The truth is that trade brings both challenges and opportunities. Certain sectors and
workers may gain while other sectors and workers may lose. However, history has shown

2
that, on the balance, openness to trade allows economies to specialize in their comparative advantage goods1 and to exchange these goods for a wider range of goods and services on the world market. In the long run, society benefits from the expanded opportunities and transfer of knowledge that trade brings. And indeed, Thailand has judiciously chosen to pursue openness to trade. The question of how Thailand can maximize the benefits from world economic integration then naturally follows.
In an increasingly integrated and enlarged world economy, reforms, innovations and
changing tastes in one part of the world will have rapid implications on the rest of the world. Prices will fluctuate to balance shifting world demand and supply. The reach and severity of competition will be unprecedented. Bhagwati (2005) uses the metaphor: “kaleidoscopic comparative advantage” to describe a state of knife-edge equilibrium in which comparative advantage may change within a matter of days.2 The Thai economy must therefore be prepared for two significant aspects of the new global economy: rising competition and relentless change. To this end, this paper asks how policymakers can lay the foundations for competitive markets that will allow Thai firms to realize their full productivity potentials and reap the fullest benefits from the global marketplace.
Historically, nations have adopted a myriad of economic policies to meet the
challenge of global competition. The various approaches may be broadly categorized into two groups: the market-led approach versus the state-led approach. The state-led approach entails government actively selecting and promoting incumbent firms and industries in order to create national champions. The promotion is often in the form of subsidy or market barriers designed shelter selected firms from competition in the hope that they would grow and become competitive. History teaches us that this route is at best dubious and, at worse, calamitous. Examples include the experiences of Brazil, Argentina, and India which saw stagnant growth after pursuing protectionist and import substitution policies in the 1960s and 1970s. Proponents of this approach often cite Japan. However, the evidence shows that the Japanese firms that excelled in the global marketplace were not the result of government targeting and pro-active industrial policy, but rather the product of competitive domestic markets.3 Targeted firms and sectors, on the other hand, showed stagnant growth. Furthermore, a decade of moribund growth has forced Japanese policymakers to rethink the value of pro-active industrial policy.
The challenge for Thai firms will be how to cope with the shifting winds of
competition. To compete successfully, firms must upgrade their productivity, innovate when necessary, and identify profitable markets. Now more than ever, firms must also anticipate future market changes. However, it is an unavoidable fact that not all firms will be successful since competition will ensure that only the fittest survive and trade will ensure that nations share the burden of global production. It is neither possible nor desirable for one country to produce everything to meet global demand. What is important is that firms are given full reign in adjusting to the vicissitudes of the market, in upgrading their productivity and in realizing the benefits thereof. 1 See Appendix A for a discussion of how Chinese exports have affected Thai exports in major markets. 2Jagdish Bhagwati (2005) observed “Gone are Adam Smith's days, when no one in Haifa lost sleep because Edinburgh could grow oranges in greenhouses: The cost differences would be substantial. Comparative advantage was "thick," shielded by big buffers. This is no longer so: not predictably from India and China, but almost certainly from somewhere. Hence I use the metaphor: "kaleidoscopic comparative advantage." Today, you have it; but in our state of knife-edge equilibrium, you may lose it tomorrow and regain it the day after. Boeing might win today, Airbus tomorrow, and then Boeing may be back in play again. It is as if the design of trade patterns that you see now gives way to another, as if a kaleidoscope had turned.” 3 See Beason and Weinstein (1996), for example.
3
The challenge for policymakers will be how to harness the forces of market
competition to ensure that the firm sector, as a whole, can adjust to rising competition and market changes. The appropriate institutions and competition policy can provide the right environment and the right incentives for existing firms to raise their productivity, for new firms with the appropriate technology to enter and for firms that cannot adjust or compete to exit. As such, the Thai economy will stand to reap the fullest benefits of globalization. Not only will Thai firms be able to compete in the sectors that truly reflect Thai comparative advantage, Thai national income will also increase commensurately with the increased productivity gains. The appropriate competition policy can also serve to encourage innovation, which will become increasingly important to Thailand’s long-run prosperity as the Thai economy exhaust the gains from accumulating physical and human capital.
Unfortunately, this paper will not provide a panacea for a firm CEO struggling to
survive amidst rising competition. Neither will it identify the products or sectors on which a budding entrepreneur should gamble. Rather, this paper is written for the policymaker who seeks long-run prosperity for Thailand and who understands the larger macroeconomic reality: that the global marketplace is constantly in flux due to changing preferences and technology; that the success of Thai firms and workers depends on productivity; and that successful integration into the global marketplace demands competitive domestic markets. Empirical work based on firm data from United Kingdom, India and other countries suggests that trade reform tends to hurt firms that were not reared within competitive markets. This underscores the urgency of designing the right competition policy that can strengthen and prepare Thai firms for global competition.
The key task is therefore the design and implementation of a competition policy
that will give Thai firms and workers the incentive to excel at what they do, to adjust to changing global demand and supply by moving out of unprofitable markets and into profitable markets. Only then will Thailand be able to reap the fullest benefits from domestic and global marketplaces.
The paper is organized as follows. Part 1 introduces and motivates the paper. Part 2 discusses relevant literature on competition and firm productivity. Part 3 describes our measurement of firm total factor productivity and proxies of product market competition. We find that product market competition promotes firm TFP. Part 4 examines TFP growth and finds that it also benefits from a competitive environment. Part 5 discusses policy for fostering firm productivity. Appendix A examines how Thai exports, in particular electronics, are faring amid the rise of China and India. Appendix B finds that product market competition can foster innovation in certain sectors near the world technology frontier.
4
2 Literature Review
“Monopoly is a great enemy to good management”-Adam Smith
The literature is forming a consensus around the positive impact of competition on efficiency in the face of growing theoretical and empirical support. Supporting examples from history abound: for example, low levels of productivity in former communist bloc countries; successful Japanese exporters forged from intense domestic competition; and impressive productivity gains in the US airline industry following deregulation. It is now common wisdom that competition promotes efficiency and growth. However it has not always been so. The literature on competition policy and firm performance is remarkable for its twists and turns. Adam Smith (1776) argued that firms under pressure from competition will need to cut costs and innovate in order to remain profitable. In Adam Smith’s view, competition impacts both the level of Total Factor Productivity (TFP), or efficiency, and the growth rate of TFP, similar to innovation. The idea that competition fosters productive efficiency was formalized by Hart (1983) which showed that competition provides the incentive for managers and workers to work hard.
Later, Schumpeter (1943) using cross-section firm data, argued that innovation is
increasing in firm size or market concentration. The logic was that large firms had the resources and the incentive to undertake research. Scherer (1965), however, cast doubt on the validity of this claim. Nevertheless, the theoretical industrial organization (IO) literature remained firmly entrenched within the Schumpeterian paradigm. Notable examples include Salop (1997), Dixit and Stiglitz (1977) and Romer (1990) which showed that increased product market competition dissipates the rent of entrants. As innovation is assumed to be driven by new entrants, growth is effectively curtailed by competition.
However, the empirical evidence from the microeconometric literature of the 1990s
failed to confirm the IO theoretical literature. And common wisdom refused to be swayed by the IO literature. Nickell (1996) tellingly observed that “this general belief in the efficacy of competition exists despite the fact that it is not supported by strong theoretical foundations or by a large corpus of hard empirical evidence in its favor.” However, the pioneering works of Nickell (1996) and Blundell, Griffith, and Van Reenen (1999) which utilized panel data from firms listed on the London Stock Exchange found that competition engendered efficiency and productivity growth. The empirical tide had begun to turn.
Unfortunately, the literature now found itself in a quandary. Theory and evidence
apparently diverged. Aghion, Bloom, Blundell, Griffith and Howitt (2002) offer a way out of this quandary. They propose a growth model where firm decisions to innovate depend on pre and post-innovation rent. The model predicts an inverted U-shaped relationship between product competition and innovation. Data from UK firm patenting activity is found to accord well with the model’s predictions.
Regarding the literature on competition policy in Thailand, Poapongsakorn (2006)
and Nicomborirak (2005) both emphasize that there is considerable room left for improving market competition. However, Poapongsakorn (2006) finds that lack of legal clarity is the chief obstacle while Nicomborirak (2005) finds that enforcement is hobbled by interest group lobbying.
5
3 Competition and Firm Productivity 3.1 Motivation
There are large and persistent differences in productivity levels and productivity
growth across firms across and within industries. Heterogeneity in technology use and in human capital is an important determinant of heterogeneity in firm-level productivity. In addition, aggregate productivity growth comes not only from within-firm productivity growth but also from firm dynamics, through which inputs and outputs are constantly reallocated from less efficient firms to more efficient ones. There are myriad reasons as to why some firms are more productive than others. Using firm panel data and regression analysis, this section will focus on examining whether product market competition is positively correlated with firm total factor productivity levels and growth. Within the context of this paper, we expediently define a firm as a legally registered entity devoted to production.4
3.2 Data
This paper’s empirical analysis relies on The Thailand Productivity and Investment
Climate Survey (PICS), a survey of nearly 1400 manufacturing firms in Thailand. The survey was implemented by the National Economic Development Board, the Productivity Institute and the World Bank.5 The survey is based on a core set of questions that have been applied to firms in several other countries. The survey provides a rich data on firm characteristics and perceived business climate.
The PICS is divided into the following modules: CEO, Finance Manager, Personnel
Manager and Workers Survey. PICS surveyed 1,385 firms surveyed from March 2004 to February 2005 with a response rate of 40 percent. The survey covers six regions: North, North East, Central, Bangkok and Vicinity, East and South; and eight industries: food processing, textiles, wearing apparel, auto parts, electronic parts and electrical appliances, rubber and plastic, wooden furniture and product, and machinery and equipment. Sampling is random by industry with the goal of obtaining observations of small, medium and large firms. However, the data is biased towards the larger companies as evidenced by the high occurrence of exporting and foreign ownership.
The PICS survey responses are gleaned from interviews with CEOs, human resource
managers, and a sample of workers. Most variables contain information for the years 2001 and 2002. The details are as follows:
Production Variables The survey includes 3 years regarding firm output and capital input spanning 2000, 2001 and 2002; employment questions span 3 years: 2001, 2002, 2003. In effect, 2 years of data can be used for production function estimation. Real Value Added We estimate production functions with value added as the dependent variable. To obtain a measure of value added we deflate these nominal values of total sales
4 Economic theory defines a firm as a production function. This definition is difficult to use given our data. 5 See Zeufack (2006) for a thorough report of the survey findings.
6
using producer price inflation (PPI) and subtract deflated expenditure on raw materials (direct material cost + purchased parts cost + electricity + fuel and other energy). Labor variables Data is available on the number of workers within production and non-production assignments. Production workers are assumed to be unskilled workers, while non-production workers, such as managers, specialists and professionals are skilled. Physical Capital We have firm balance sheet information that gives us a book value of capital such as equipment, machinery, factories and real estate. This is our proxy for the capital stock. In addition, we have a question on productive capital investment. First difference in the capital stock proxy for missing values in the productive capital investment responses. Investment Climate Variables As one of the main goals of the survey is measuring the impact of the regulatory and investment climate on firm performance, firms were asked to judge how a broad range of problematic business investment climate factors impacted firm operation. 3.3 Measurement of Firm Total Factor Productivity
Total factor productivity is a multi-factor productivity measure that represents the efficiency of the firm in transforming inputs into output. As such, a rise in total factor productivity increases the marginal product of all inputs. It is a broad concept that captures technology, managerial quality, and government policies. Intuitively, it represents technical know-how with regards to transforming inputs into outputs. It can also be viewed as a residual, or the portion of output that cannot be attributed to the contribution of capital or labor. The importance of TFP cannot be understated. There is strong empirical evidence that TFP growth is the key determinant of long-run economic growth.
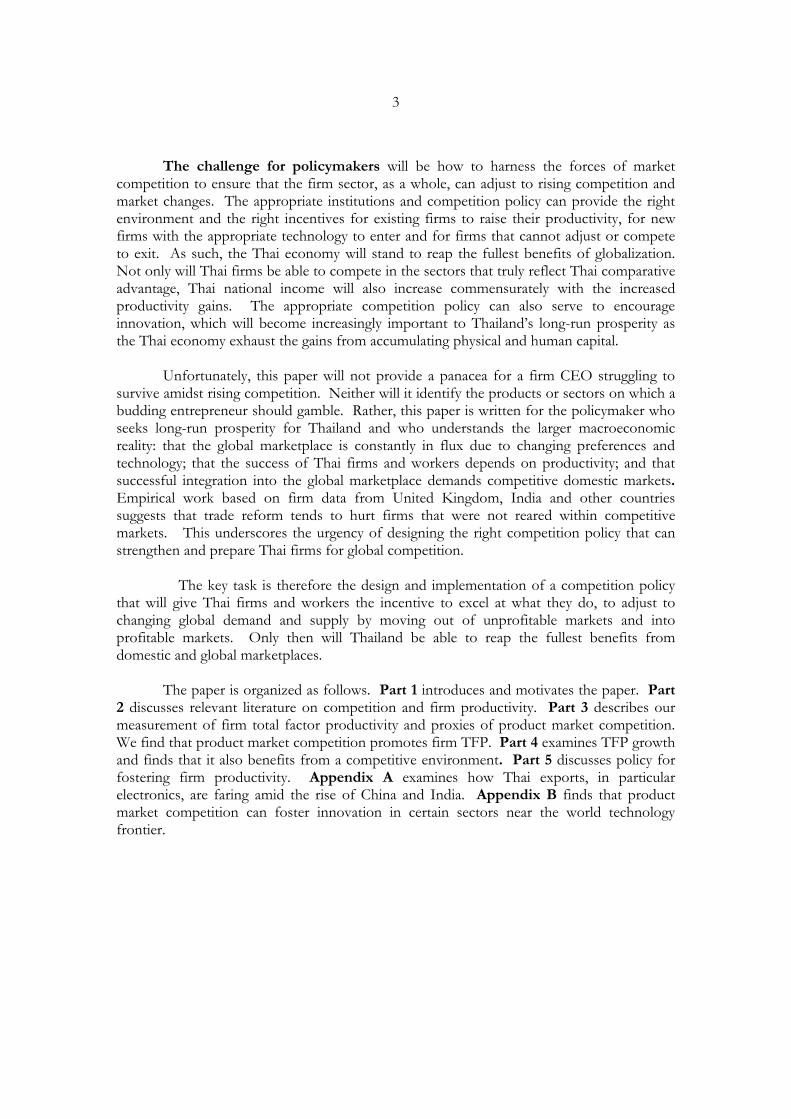
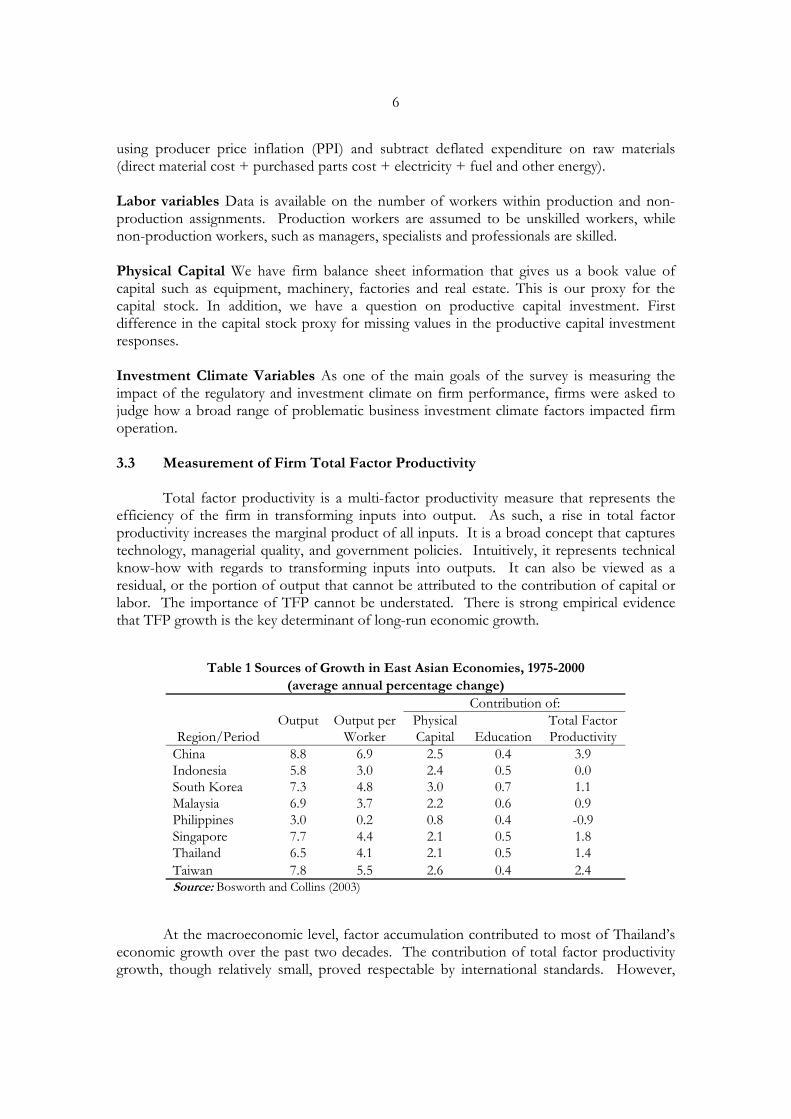
At the macroeconomic level, factor accumulation contributed to most of Thailand’s economic growth over the past two decades. The contribution of total factor productivity growth, though relatively small, proved respectable by international standards. However,
Table 1 Sources of Growth in East Asian Economies, 1975-2000 (average annual percentage change)
Contribution of: Output Output per Physical Total Factor
Region/Period Worker Capital Education Productivity China 8.8 6.9 2.5 0.4 3.9 Indonesia 5.8 3.0 2.4 0.5 0.0 South Korea 7.3 4.8 3.0 0.7 1.1 Malaysia 6.9 3.7 2.2 0.6 0.9 Philippines 3.0 0.2 0.8 0.4 -0.9 Singapore 7.7 4.4 2.1 0.5 1.8 Thailand 6.5 4.1 2.1 0.5 1.4 Taiwan 7.8 5.5 2.6 0.4 2.4 Source: Bosworth and Collins (2003)

7
TFP growth will become increasingly important as the gains from factor accumulation diminish.
There has been a surge of interest of late regarding the estimation of total factor productivity at the micro level. However, such estimation poses a number of obstacles such as simultaneity, selection, and lack of data on physical output and capital units. We use the consistent semi-parametric estimator of Levinsohn and Petrin (2003) to estimate firm-level total factor productivity while solving the problem of simultaneity. The simultaneity problem is mitigated by using the firm’s intermediate inputs decision to proxy for unobserved productivity shocks. Levinsohn and Petrin (2003) essentially improve upon Olley and Pakes (1996) by eschewing the use of investment as a proxy in favor of intermediate inputs and hence avoiding the frequent problem of observations with zero investment. The production function takes the Cobb-Douglas functional form:
γβitititit KLY Α= where β+γ=1 if constant returns to scale
The above equation is transformed into logarithmic terms to allow for linear estimation. The estimation equation for the production is then as follows:
itititit ukly ++= γβ Lower case denotes log terms. Output is measured as real valued added. Observe that the error term is the log of estimated firm TFP.
Economists as early as Marschak and Andrews (1944) have pointed out that estimation of firm production functions are prone to the simultaneity problem: the correlation between input levels and unobserved firm-specific productivity shocks. The simultaneity problem occurs when the firm is able to observe a component of its TFP early enough such that it is able to adjust its factor inputs accordingly. It is likely that firms experiencing large productivity shocks will respond by raising inputs. As a result, the error term will be correlated with the independent variables, resulting in biased parameter estimates and therefore biased estimates of productivity. Overcoming the simultaneity problem involves decomposing the error term into two components as follows:
ititititit ekly +++= ϖγβ
The first component, ϖit, is the transmitted part of the TFP observed by the firm while e it is noise, or unobserved shocks which are independently and identically distributed. The former is a state variable and therefore affects the firm’s input decisions while the latter does not. The challenge for the econometrician is to measure ϖit while controlling for eit. Assuming that a strictly monotonous relationship exists between output and the proxy for eit, a consistent estimate for production function parameter can be found. Capital stock is the value of fixed assets, including machinery and real estate, in the firm balance sheet, deflated by producer inflation. Output is real value added subtracted inputs and production costs, deflated by inflation. The production function considered assumes that output is produced combining four inputs: skilled labor, unskilled labor, intermediates and capital and is estimated using two years of data for each firm (2001 and 2002).
8
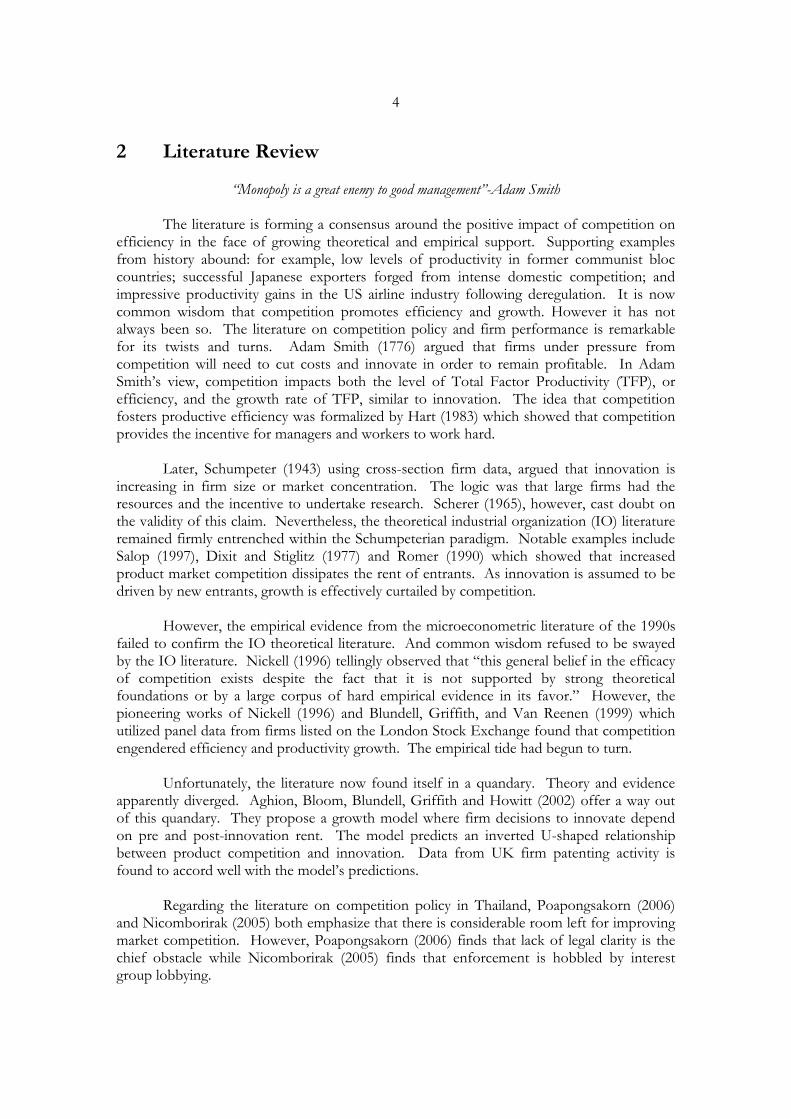
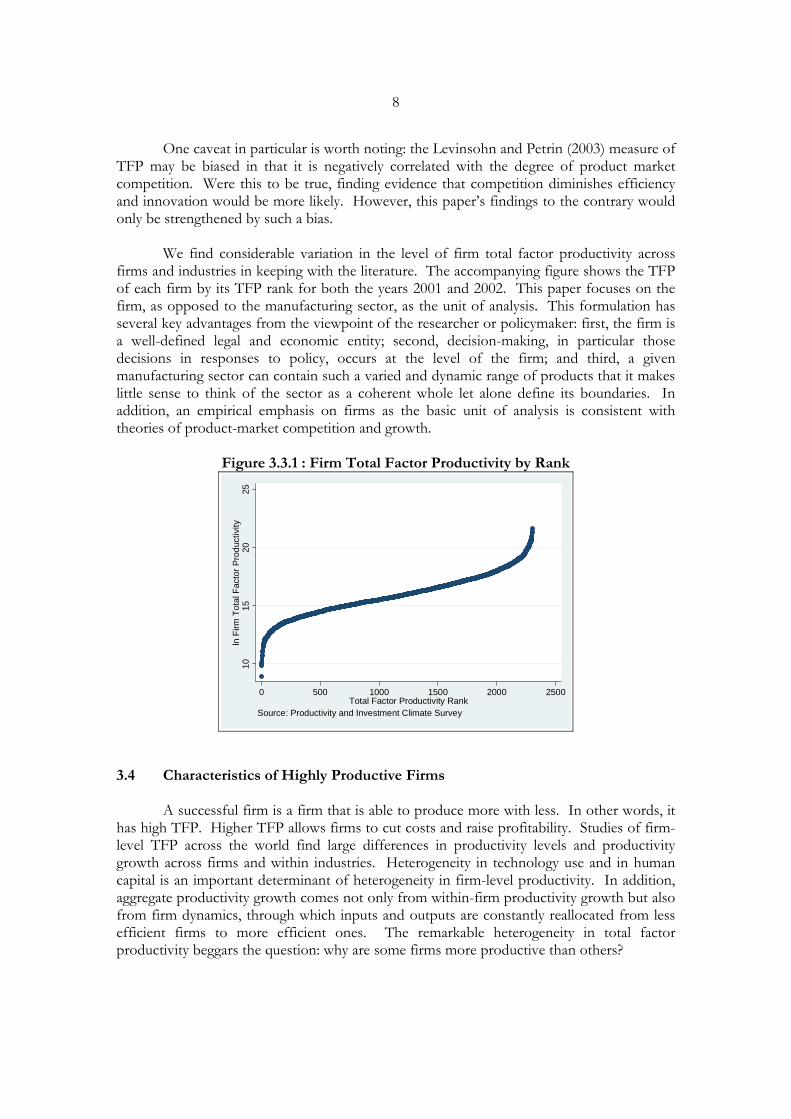
One caveat in particular is worth noting: the Levinsohn and Petrin (2003) measure of TFP may be biased in that it is negatively correlated with the degree of product market competition. Were this to be true, finding evidence that competition diminishes efficiency and innovation would be more likely. However, this paper’s findings to the contrary would only be strengthened by such a bias. We find considerable variation in the level of firm total factor productivity across firms and industries in keeping with the literature. The accompanying figure shows the TFP of each firm by its TFP rank for both the years 2001 and 2002. This paper focuses on the firm, as opposed to the manufacturing sector, as the unit of analysis. This formulation has several key advantages from the viewpoint of the researcher or policymaker: first, the firm is a well-defined legal and economic entity; second, decision-making, in particular those decisions in responses to policy, occurs at the level of the firm; and third, a given manufacturing sector can contain such a varied and dynamic range of products that it makes little sense to think of the sector as a coherent whole let alone define its boundaries. In addition, an empirical emphasis on firms as the basic unit of analysis is consistent with theories of product-market competition and growth.
Figure 3.3.1 : Firm Total Factor Productivity by Rank
1015
2025
ln F
irm T
otal
Fac
tor P
rodu
ctiv
ity
0 500 1000 1500 2000 2500Total Factor Productivity Rank
Source: Productivity and Investment Climate Survey
3.4 Characteristics of Highly Productive Firms
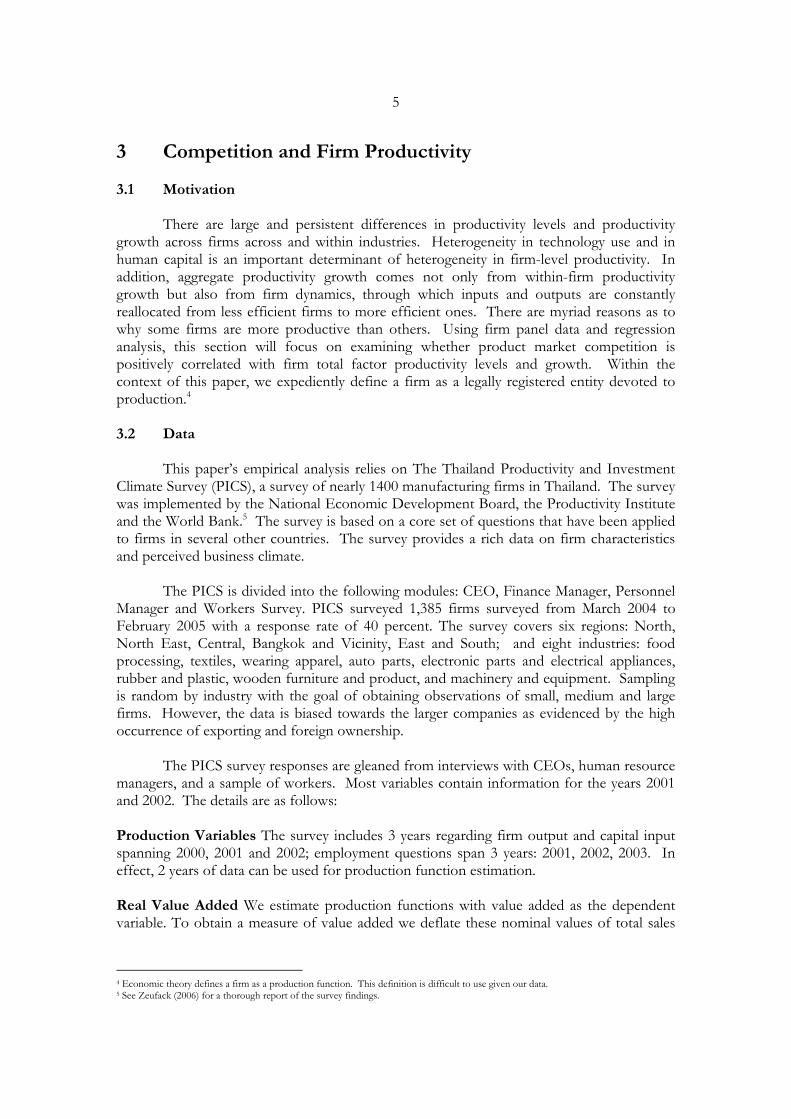
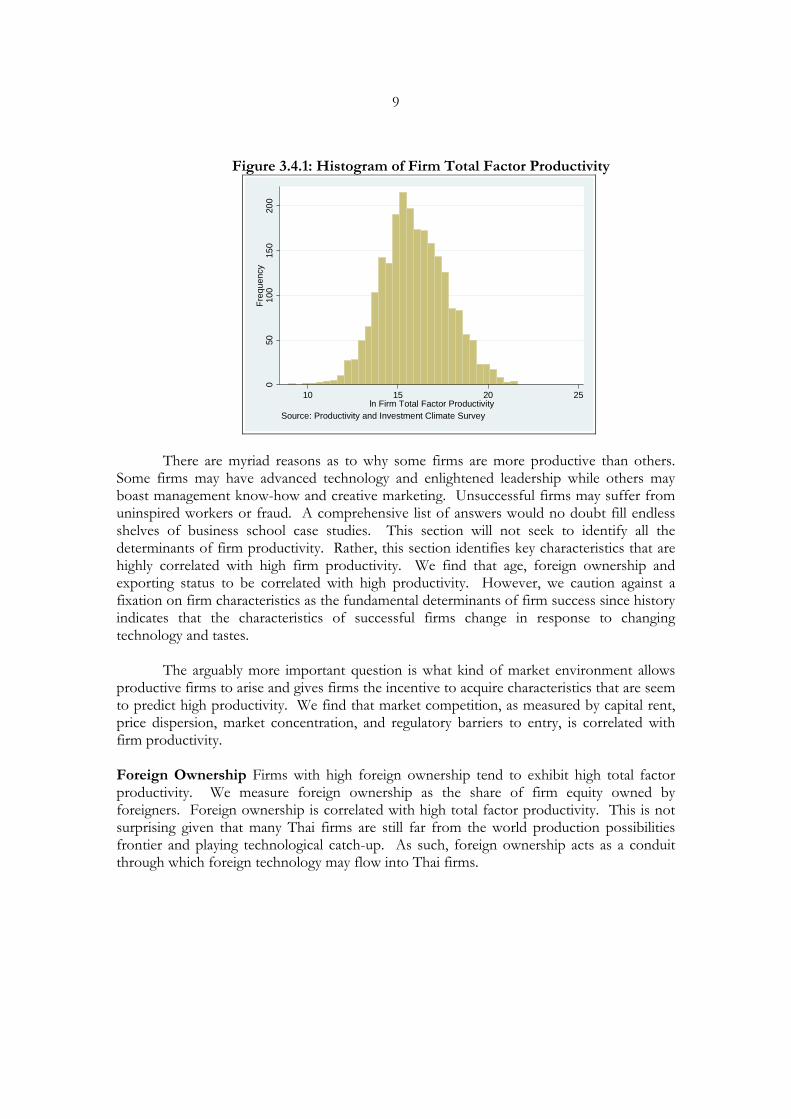
A successful firm is a firm that is able to produce more with less. In other words, it has high TFP. Higher TFP allows firms to cut costs and raise profitability. Studies of firm-level TFP across the world find large differences in productivity levels and productivity growth across firms and within industries. Heterogeneity in technology use and in human capital is an important determinant of heterogeneity in firm-level productivity. In addition, aggregate productivity growth comes not only from within-firm productivity growth but also from firm dynamics, through which inputs and outputs are constantly reallocated from less efficient firms to more efficient ones. The remarkable heterogeneity in total factor productivity beggars the question: why are some firms more productive than others?
9
Figure 3.4.1: Histogram of Firm Total Factor Productivity
050
100
150
200
Freq
uenc
y
10 15 20 25ln Firm Total Factor Productivity
Source: Productivity and Investment Climate Survey
There are myriad reasons as to why some firms are more productive than others. Some firms may have advanced technology and enlightened leadership while others may boast management know-how and creative marketing. Unsuccessful firms may suffer from uninspired workers or fraud. A comprehensive list of answers would no doubt fill endless shelves of business school case studies. This section will not seek to identify all the determinants of firm productivity. Rather, this section identifies key characteristics that are highly correlated with high firm productivity. We find that age, foreign ownership and exporting status to be correlated with high productivity. However, we caution against a fixation on firm characteristics as the fundamental determinants of firm success since history indicates that the characteristics of successful firms change in response to changing technology and tastes.
The arguably more important question is what kind of market environment allows
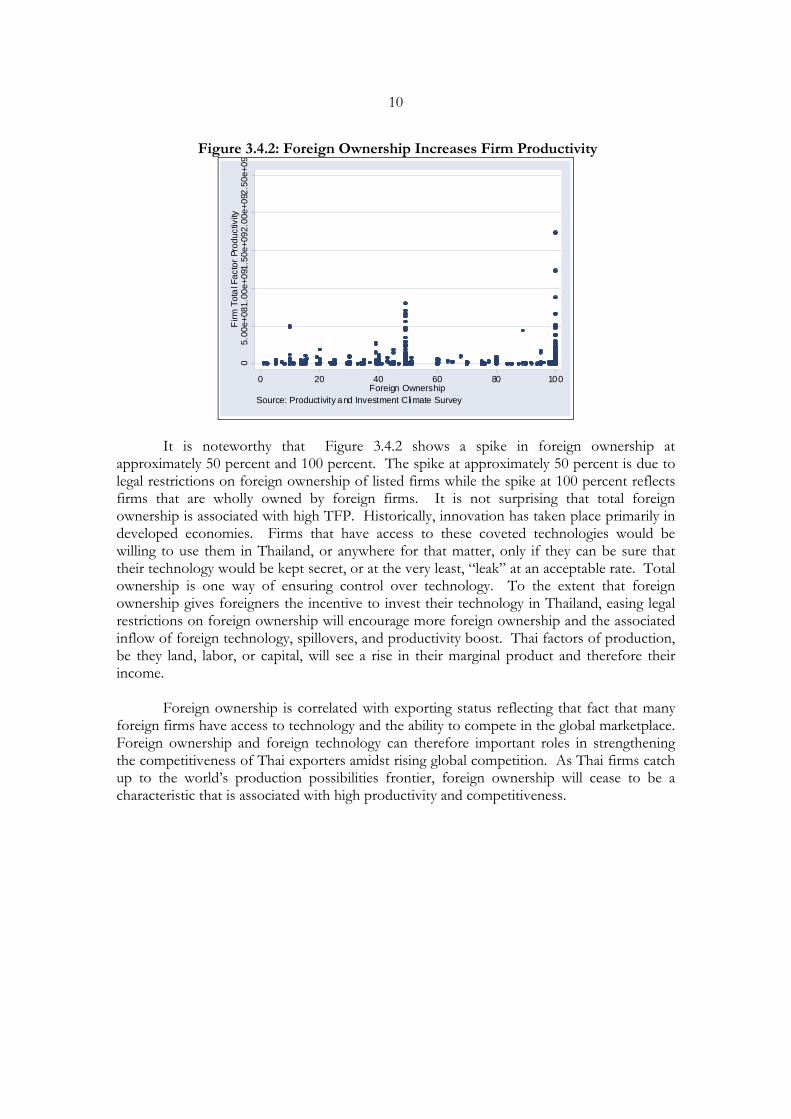
productive firms to arise and gives firms the incentive to acquire characteristics that are seem to predict high productivity. We find that market competition, as measured by capital rent, price dispersion, market concentration, and regulatory barriers to entry, is correlated with firm productivity. Foreign Ownership Firms with high foreign ownership tend to exhibit high total factor productivity. We measure foreign ownership as the share of firm equity owned by foreigners. Foreign ownership is correlated with high total factor productivity. This is not surprising given that many Thai firms are still far from the world production possibilities frontier and playing technological catch-up. As such, foreign ownership acts as a conduit through which foreign technology may flow into Thai firms.
10
Figure 3.4.2: Foreign Ownership Increases Firm Productivity
05.
00e+
081.
00e+
091.
50e+
092.
00e+
092.
50e+
09Fi
rm T
otal
Fac
tor P
rodu
ctiv
ity
0 20 40 60 80 100Foreign Ownership
Source: Productivity and Investment Climate Survey
It is noteworthy that Figure 3.4.2 shows a spike in foreign ownership at approximately 50 percent and 100 percent. The spike at approximately 50 percent is due to legal restrictions on foreign ownership of listed firms while the spike at 100 percent reflects firms that are wholly owned by foreign firms. It is not surprising that total foreign ownership is associated with high TFP. Historically, innovation has taken place primarily in developed economies. Firms that have access to these coveted technologies would be willing to use them in Thailand, or anywhere for that matter, only if they can be sure that their technology would be kept secret, or at the very least, “leak” at an acceptable rate. Total ownership is one way of ensuring control over technology. To the extent that foreign ownership gives foreigners the incentive to invest their technology in Thailand, easing legal restrictions on foreign ownership will encourage more foreign ownership and the associated inflow of foreign technology, spillovers, and productivity boost. Thai factors of production, be they land, labor, or capital, will see a rise in their marginal product and therefore their income.
Foreign ownership is correlated with exporting status reflecting that fact that many foreign firms have access to technology and the ability to compete in the global marketplace. Foreign ownership and foreign technology can therefore important roles in strengthening the competitiveness of Thai exporters amidst rising global competition. As Thai firms catch up to the world’s production possibilities frontier, foreign ownership will cease to be a characteristic that is associated with high productivity and competitiveness.
11
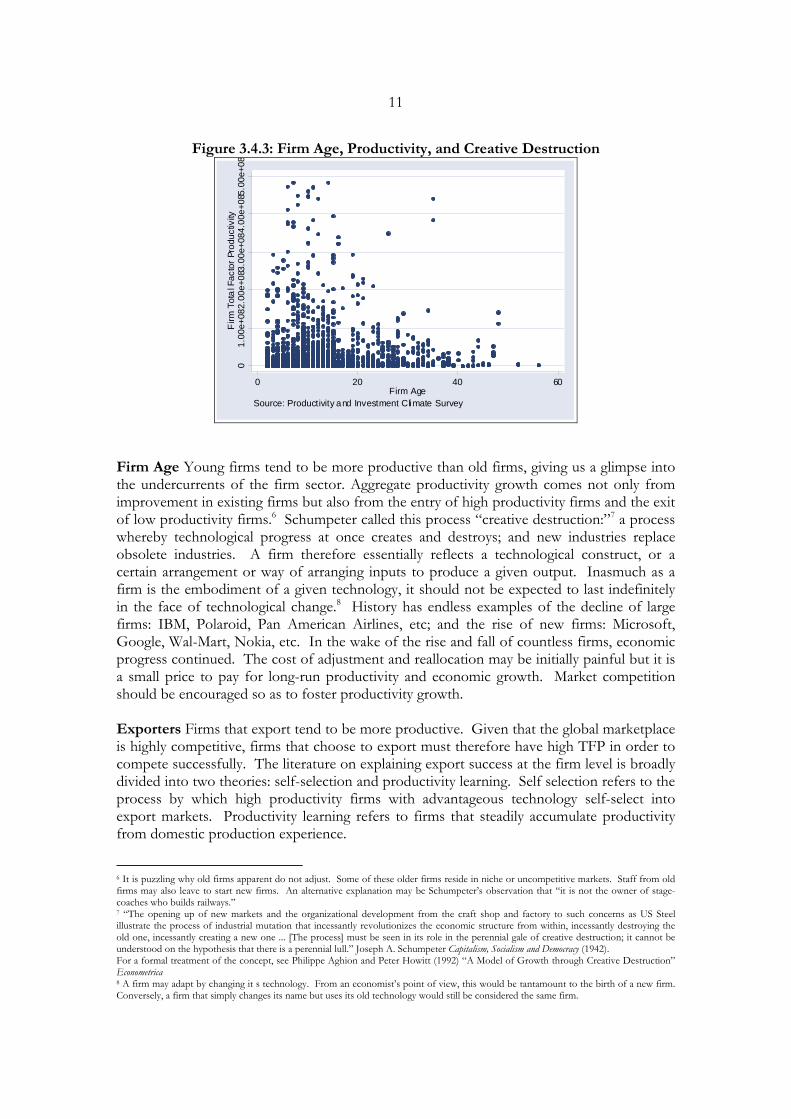
Figure 3.4.3: Firm Age, Productivity, and Creative Destruction
01.
00e+
082.
00e+
083.
00e+
084.
00e+
085.
00e+
08F
irm T
otal
Fac
tor
Prod
uctiv
ity
0 20 40 60Firm Age
Source: Productivity and Investment Climate Survey
Firm Age Young firms tend to be more productive than old firms, giving us a glimpse into the undercurrents of the firm sector. Aggregate productivity growth comes not only from improvement in existing firms but also from the entry of high productivity firms and the exit of low productivity firms.6 Schumpeter called this process “creative destruction:”7 a process whereby technological progress at once creates and destroys; and new industries replace obsolete industries. A firm therefore essentially reflects a technological construct, or a certain arrangement or way of arranging inputs to produce a given output. Inasmuch as a firm is the embodiment of a given technology, it should not be expected to last indefinitely in the face of technological change.8 History has endless examples of the decline of large firms: IBM, Polaroid, Pan American Airlines, etc; and the rise of new firms: Microsoft, Google, Wal-Mart, Nokia, etc. In the wake of the rise and fall of countless firms, economic progress continued. The cost of adjustment and reallocation may be initially painful but it is a small price to pay for long-run productivity and economic growth. Market competition should be encouraged so as to foster productivity growth. Exporters Firms that export tend to be more productive. Given that the global marketplace is highly competitive, firms that choose to export must therefore have high TFP in order to compete successfully. The literature on explaining export success at the firm level is broadly divided into two theories: self-selection and productivity learning. Self selection refers to the process by which high productivity firms with advantageous technology self-select into export markets. Productivity learning refers to firms that steadily accumulate productivity from domestic production experience.
6 It is puzzling why old firms apparent do not adjust. Some of these older firms reside in niche or uncompetitive markets. Staff from old firms may also leave to start new firms. An alternative explanation may be Schumpeter’s observation that “it is not the owner of stage-coaches who builds railways.” 7 “The opening up of new markets and the organizational development from the craft shop and factory to such concerns as US Steel illustrate the process of industrial mutation that incessantly revolutionizes the economic structure from within, incessantly destroying the old one, incessantly creating a new one ... [The process] must be seen in its role in the perennial gale of creative destruction; it cannot be understood on the hypothesis that there is a perennial lull.” Joseph A. Schumpeter Capitalism, Socialism and Democracy (1942). For a formal treatment of the concept, see Philippe Aghion and Peter Howitt (1992) “A Model of Growth through Creative Destruction” Econometrica 8 A firm may adapt by changing it s technology. From an economist’s point of view, this would be tantamount to the birth of a new firm. Conversely, a firm that simply changes its name but uses its old technology would still be considered the same firm.
12
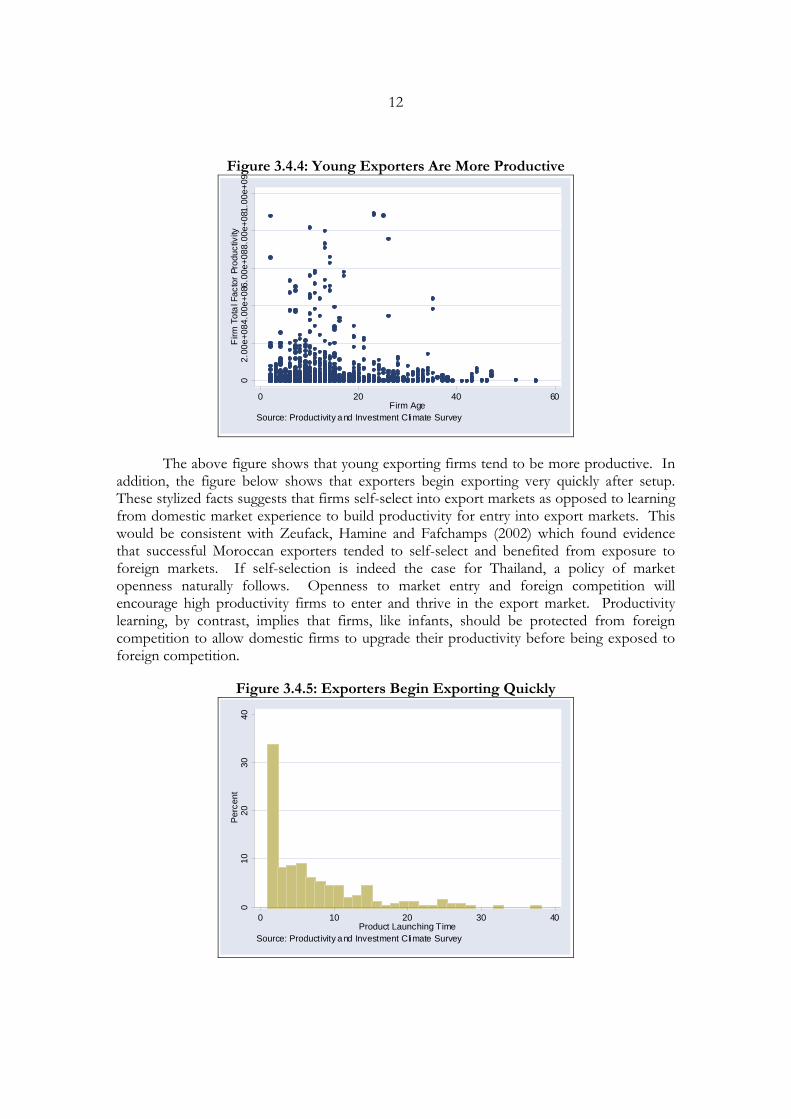
Figure 3.4.4: Young Exporters Are More Productive
02.
00e+
084.
00e+
086.
00e+
088.
00e+
081.
00e+
09F
irm T
otal
Fac
tor P
rodu
ctiv
ity
0 20 40 60Firm Age
Source: Productivity and Investment Climate Survey
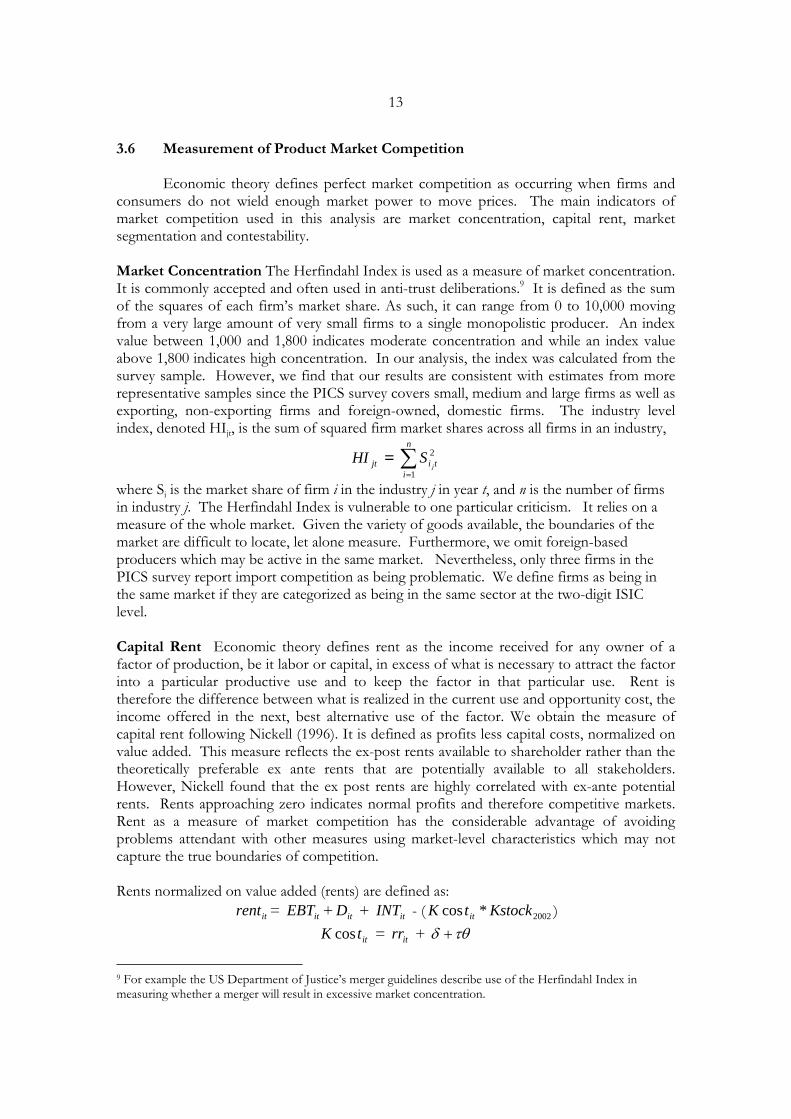
The above figure shows that young exporting firms tend to be more productive. In addition, the figure below shows that exporters begin exporting very quickly after setup. These stylized facts suggests that firms self-select into export markets as opposed to learning from domestic market experience to build productivity for entry into export markets. This would be consistent with Zeufack, Hamine and Fafchamps (2002) which found evidence that successful Moroccan exporters tended to self-select and benefited from exposure to foreign markets. If self-selection is indeed the case for Thailand, a policy of market openness naturally follows. Openness to market entry and foreign competition will encourage high productivity firms to enter and thrive in the export market. Productivity learning, by contrast, implies that firms, like infants, should be protected from foreign competition to allow domestic firms to upgrade their productivity before being exposed to foreign competition.
Figure 3.4.5: Exporters Begin Exporting Quickly
010
2030
40Pe
rcen
t
0 10 20 30 40Product Launching Time
Source: Productivity and Investment Climate Survey
13
3.6 Measurement of Product Market Competition
Economic theory defines perfect market competition as occurring when firms and consumers do not wield enough market power to move prices. The main indicators of market competition used in this analysis are market concentration, capital rent, market segmentation and contestability. Market Concentration The Herfindahl Index is used as a measure of market concentration. It is commonly accepted and often used in anti-trust deliberations.9 It is defined as the sum of the squares of each firm’s market share. As such, it can range from 0 to 10,000 moving from a very large amount of very small firms to a single monopolistic producer. An index value between 1,000 and 1,800 indicates moderate concentration and while an index value above 1,800 indicates high concentration. In our analysis, the index was calculated from the survey sample. However, we find that our results are consistent with estimates from more representative samples since the PICS survey covers small, medium and large firms as well as exporting, non-exporting firms and foreign-owned, domestic firms. The industry level index, denoted HIjt, is the sum of squared firm market shares across all firms in an industry,
jtHI = ∑=
n
iti j
S1
2
where Si is the market share of firm i in the industry j in year t, and n is the number of firms in industry j. The Herfindahl Index is vulnerable to one particular criticism. It relies on a measure of the whole market. Given the variety of goods available, the boundaries of the market are difficult to locate, let alone measure. Furthermore, we omit foreign-based producers which may be active in the same market. Nevertheless, only three firms in the PICS survey report import competition as being problematic. We define firms as being in the same market if they are categorized as being in the same sector at the two-digit ISIC level. Capital Rent Economic theory defines rent as the income received for any owner of a factor of production, be it labor or capital, in excess of what is necessary to attract the factor into a particular productive use and to keep the factor in that particular use. Rent is therefore the difference between what is realized in the current use and opportunity cost, the income offered in the next, best alternative use of the factor. We obtain the measure of capital rent following Nickell (1996). It is defined as profits less capital costs, normalized on value added. This measure reflects the ex-post rents available to shareholder rather than the theoretically preferable ex ante rents that are potentially available to all stakeholders. However, Nickell found that the ex post rents are highly correlated with ex-ante potential rents. Rents approaching zero indicates normal profits and therefore competitive markets. Rent as a measure of market competition has the considerable advantage of avoiding problems attendant with other measures using market-level characteristics which may not capture the true boundaries of competition. Rents normalized on value added (rents) are defined as:
itrent = itEBT + itD + itINT - ( 2002*cos KstocktK it )
ittK cos = itrr + τθδ +
9 For example the US Department of Justice’s merger guidelines describe use of the Herfindahl Index in measuring whether a merger will result in excessive market concentration.
14
where, it = firm i in year t EBT = profits before tax D = depreciation INT = interest payments Kcost = cost of capital Kstock2002 = capital stock in year 2002 rr = real interest rate, which equals the average of real annual Minimum Lending Rate δ = depreciation rate, which is assumed to be constant at 4 percent θ = risk premium, which equals the firm’s short term interest rate minus short term government bond yield τ = weight, which equals the shareholders’ funds divided by shareholders’ funds plus debt Given that tax rates on equity and debt are close, the risk premium on the firm’s debt can serve as a proxy for measuring cost of capital and how it varies across firms. Market Segmentation External competition is a significant source of competitive pressure for any economy. This is not surprising given that the global marketplace, by virtue if its size and fluidity, is more competitive than any domestic market. One indicator of external competitive pressure is the spread between the domestic and export prices for a given good. In segmented markets, the price spread for identical goods will be positive. In integrated markets, the prices of identical goods should be equal. If prices differ, arbitrageurs will buy cheap and sell dear until prices equilibrate.
Price Spread = ort
domestic
PP
exp
The price spread reflects market segmentation, price controls, and tariff and non-tariff barriers. If a given good’s domestic price is greater than its price abroad, the price spread reflects domestic price controls. If the domestic price of a given good is less than its price abroad, the price spread reflects tariff and non-tariff barriers. The spread is constructed by first identifying which firms sell their primary products in both domestic and foreign markets. Next, we calculate the good price from sales and volume data subtracting transportation costs. We note that a common problem in calculating price spreads is that the spreads may not necessarily measure the spreads between identical goods. However, our measure avoids this problem. Each firm’s price spread is obtained from the prices of its primary product only and should therefore reasonably satisfy the assumption of identical goods. Contestability A contestable market is a market with low barriers to entry and low fixed costs. As such, incumbent firms are under the constant threat of new firms and therefore “behave” by keeping prices close to cost. Two proxies are used: the number of licenses and the number of weeks required for the firm to enter the market. The higher the number of licenses or weeks required, the more likely it is that the market is contestable. We note that business entry regulation may not be undesirable per se. Regulation can indeed help ensure that firms meet certain safety or health standards. However, it is a fact that developed
15
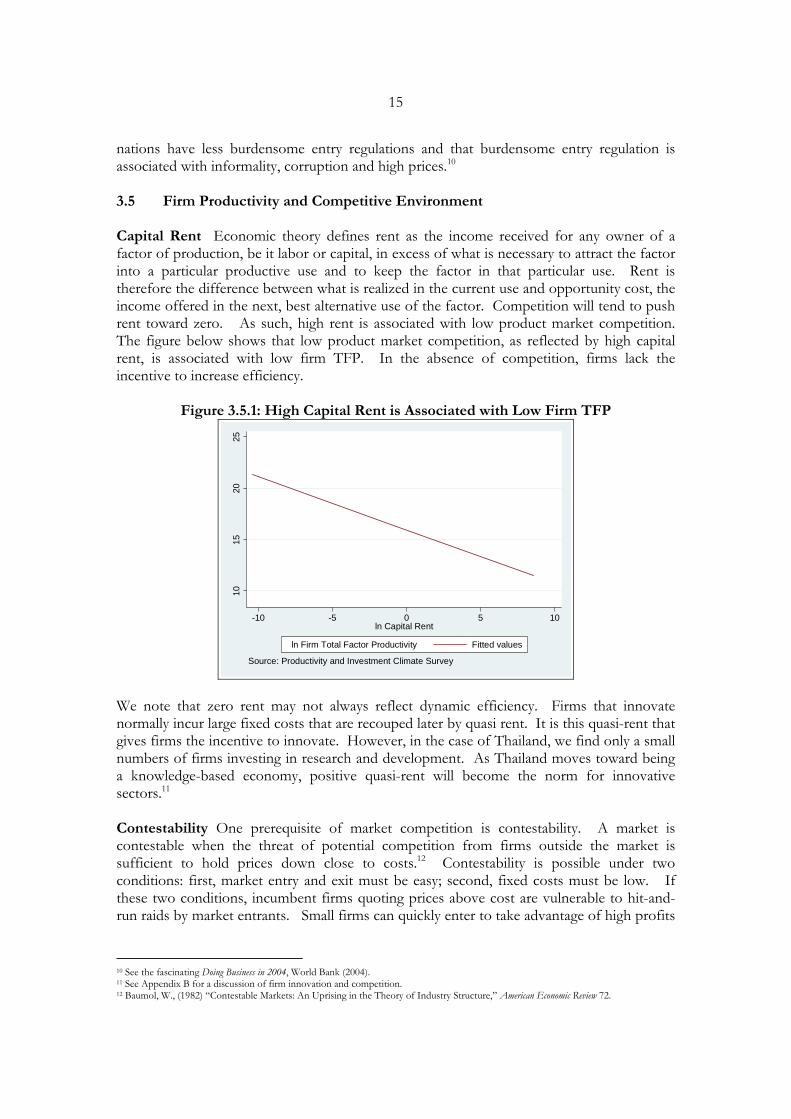
nations have less burdensome entry regulations and that burdensome entry regulation is associated with informality, corruption and high prices.10 3.5 Firm Productivity and Competitive Environment Capital Rent Economic theory defines rent as the income received for any owner of a factor of production, be it labor or capital, in excess of what is necessary to attract the factor into a particular productive use and to keep the factor in that particular use. Rent is therefore the difference between what is realized in the current use and opportunity cost, the income offered in the next, best alternative use of the factor. Competition will tend to push rent toward zero. As such, high rent is associated with low product market competition. The figure below shows that low product market competition, as reflected by high capital rent, is associated with low firm TFP. In the absence of competition, firms lack the incentive to increase efficiency.
Figure 3.5.1: High Capital Rent is Associated with Low Firm TFP
1015
2025
-10 -5 0 5 10ln Capital Rent
ln Firm Total Factor Productivity Fitted values
Source: Productivity and Investment Climate Survey
We note that zero rent may not always reflect dynamic efficiency. Firms that innovate normally incur large fixed costs that are recouped later by quasi rent. It is this quasi-rent that gives firms the incentive to innovate. However, in the case of Thailand, we find only a small numbers of firms investing in research and development. As Thailand moves toward being a knowledge-based economy, positive quasi-rent will become the norm for innovative sectors.11 Contestability One prerequisite of market competition is contestability. A market is contestable when the threat of potential competition from firms outside the market is sufficient to hold prices down close to costs.12 Contestability is possible under two conditions: first, market entry and exit must be easy; second, fixed costs must be low. If these two conditions, incumbent firms quoting prices above cost are vulnerable to hit-and-run raids by market entrants. Small firms can quickly enter to take advantage of high profits
10 See the fascinating Doing Business in 2004, World Bank (2004). 11 See Appendix B for a discussion of firm innovation and competition. 12 Baumol, W., (1982) “Contestable Markets: An Uprising in the Theory of Industry Structure,” American Economic Review 72.
16
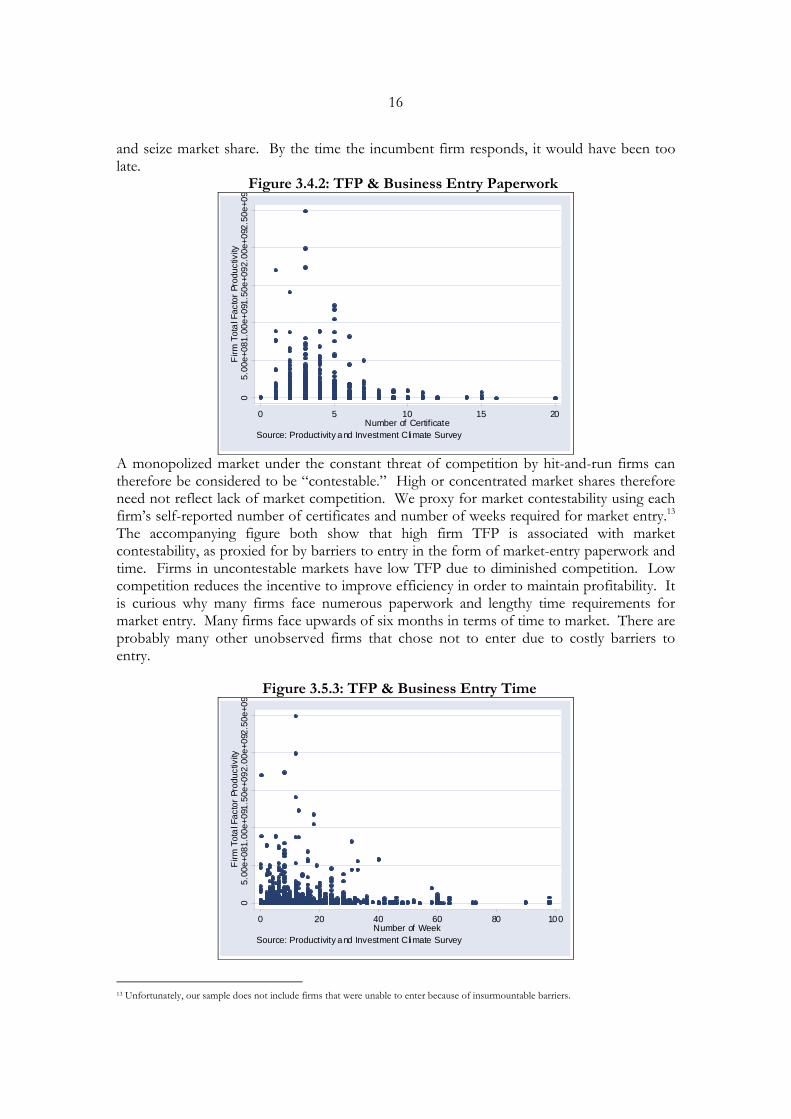
and seize market share. By the time the incumbent firm responds, it would have been too late. Figure 3.4.2: TFP & Business Entry Paperwork
05.
00e+
081.
00e+
091.
50e+
092.
00e+
092.
50e+
09F
irm T
ota
l Fac
tor
Prod
uctiv
ity
0 5 10 15 20Number of Certificate
Source: Productivity and Investment Climate Survey
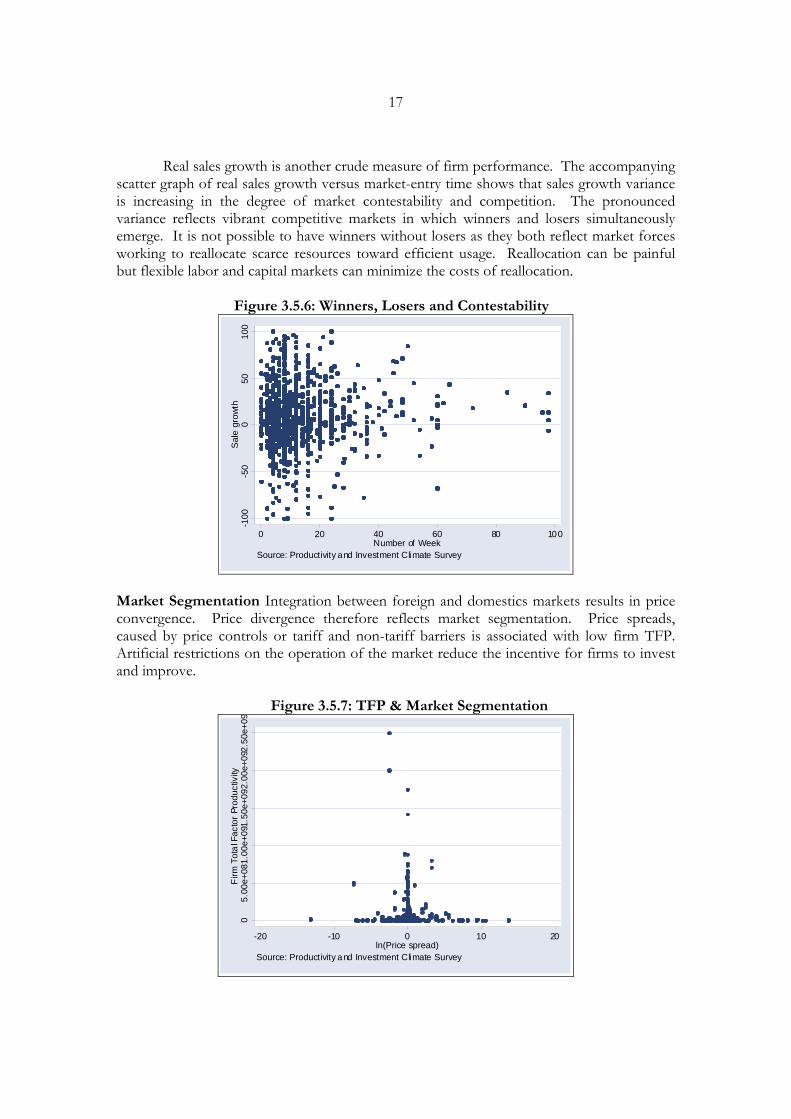
A monopolized market under the constant threat of competition by hit-and-run firms can therefore be considered to be “contestable.” High or concentrated market shares therefore need not reflect lack of market competition. We proxy for market contestability using each firm’s self-reported number of certificates and number of weeks required for market entry.13 The accompanying figure both show that high firm TFP is associated with market contestability, as proxied for by barriers to entry in the form of market-entry paperwork and time. Firms in uncontestable markets have low TFP due to diminished competition. Low competition reduces the incentive to improve efficiency in order to maintain profitability. It is curious why many firms face numerous paperwork and lengthy time requirements for market entry. Many firms face upwards of six months in terms of time to market. There are probably many other unobserved firms that chose not to enter due to costly barriers to entry.
Figure 3.5.3: TFP & Business Entry Time
05.
00e+
081.
00e+
091.
50e+
092.
00e+
092.
50e+
09F
irm T
ota
l Fac
tor
Prod
uctiv
ity
0 20 40 60 80 100Number of Week
Source: Productivity and Investment Climate Survey
13 Unfortunately, our sample does not include firms that were unable to enter because of insurmountable barriers.
17
Real sales growth is another crude measure of firm performance. The accompanying
scatter graph of real sales growth versus market-entry time shows that sales growth variance is increasing in the degree of market contestability and competition. The pronounced variance reflects vibrant competitive markets in which winners and losers simultaneously emerge. It is not possible to have winners without losers as they both reflect market forces working to reallocate scarce resources toward efficient usage. Reallocation can be painful but flexible labor and capital markets can minimize the costs of reallocation.
Figure 3.5.6: Winners, Losers and Contestability
-100
-50
050
100
Sale
gro
wth
0 20 40 60 80 100Number of Week
Source: Productivity and Investment Climate Survey
Market Segmentation Integration between foreign and domestics markets results in price convergence. Price divergence therefore reflects market segmentation. Price spreads, caused by price controls or tariff and non-tariff barriers is associated with low firm TFP. Artificial restrictions on the operation of the market reduce the incentive for firms to invest and improve.
Figure 3.5.7: TFP & Market Segmentation
05.
00e+
081.
00e+
091.
50e+
092.
00e+
092.
50e+
09F
irm T
ota
l Fac
tor
Prod
uctiv
ity
-20 -10 0 10 20ln(Price spread)
Source: Productivity and Investment Climate Survey
18
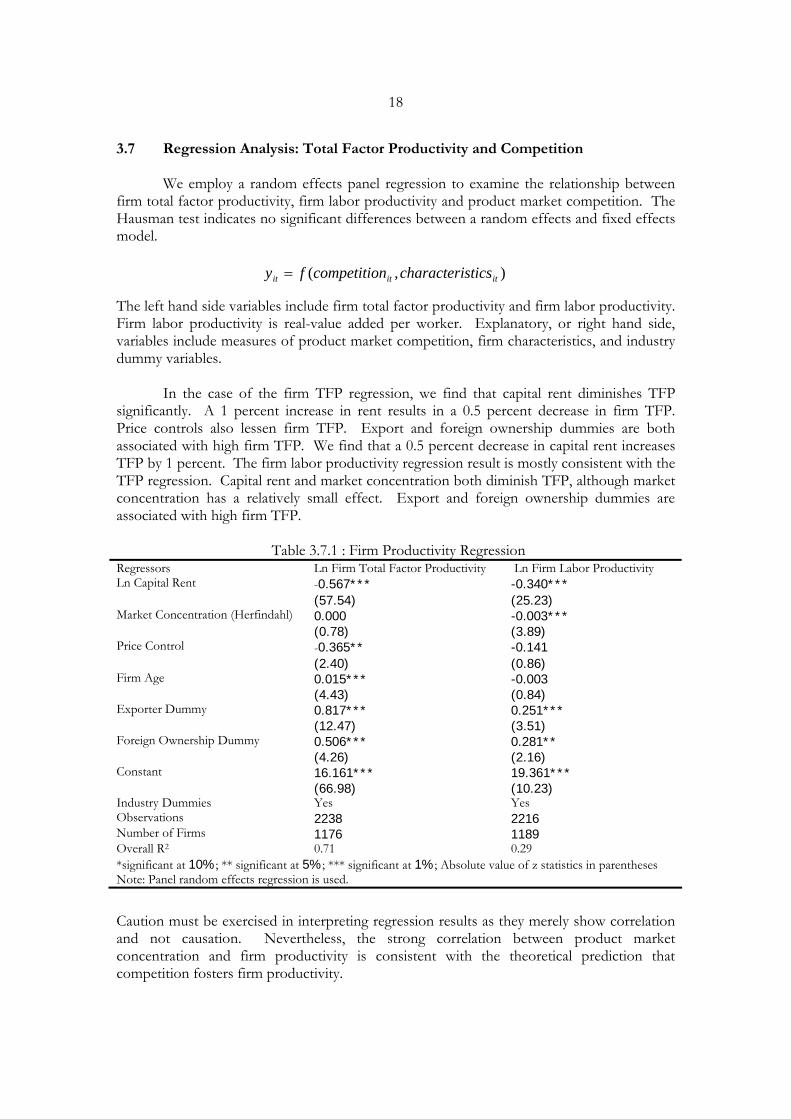
3.7 Regression Analysis: Total Factor Productivity and Competition
We employ a random effects panel regression to examine the relationship between firm total factor productivity, firm labor productivity and product market competition. The Hausman test indicates no significant differences between a random effects and fixed effects model. The left hand side variables include firm total factor productivity and firm labor productivity. Firm labor productivity is real-value added per worker. Explanatory, or right hand side, variables include measures of product market competition, firm characteristics, and industry dummy variables. In the case of the firm TFP regression, we find that capital rent diminishes TFP significantly. A 1 percent increase in rent results in a 0.5 percent decrease in firm TFP. Price controls also lessen firm TFP. Export and foreign ownership dummies are both associated with high firm TFP. We find that a 0.5 percent decrease in capital rent increases TFP by 1 percent. The firm labor productivity regression result is mostly consistent with the TFP regression. Capital rent and market concentration both diminish TFP, although market concentration has a relatively small effect. Export and foreign ownership dummies are associated with high firm TFP. Table 3.7.1 : Firm Productivity Regression Regressors Ln Firm Total Factor Productivity Ln Firm Labor Productivity Ln Capital Rent -0.567*** -0.340*** (57.54) (25.23) Market Concentration (Herfindahl) 0.000 -0.003*** (0.78) (3.89) Price Control -0.365** -0.141 (2.40) (0.86) Firm Age 0.015*** -0.003 (4.43) (0.84) Exporter Dummy 0.817*** 0.251*** (12.47) (3.51) Foreign Ownership Dummy 0.506*** 0.281** (4.26) (2.16) Constant 16.161*** 19.361*** (66.98) (10.23) Industry Dummies Yes Yes Observations 2238 2216 Number of Firms 1176 1189 Overall R2 0.71 0.29 *significant at 10%; ** significant at 5%; *** significant at 1%; Absolute value of z statistics in parentheses Note: Panel random effects regression is used.
Caution must be exercised in interpreting regression results as they merely show correlation and not causation. Nevertheless, the strong correlation between product market concentration and firm productivity is consistent with the theoretical prediction that competition fosters firm productivity.
),( ititit sticscharacterincompetitiofy =
19
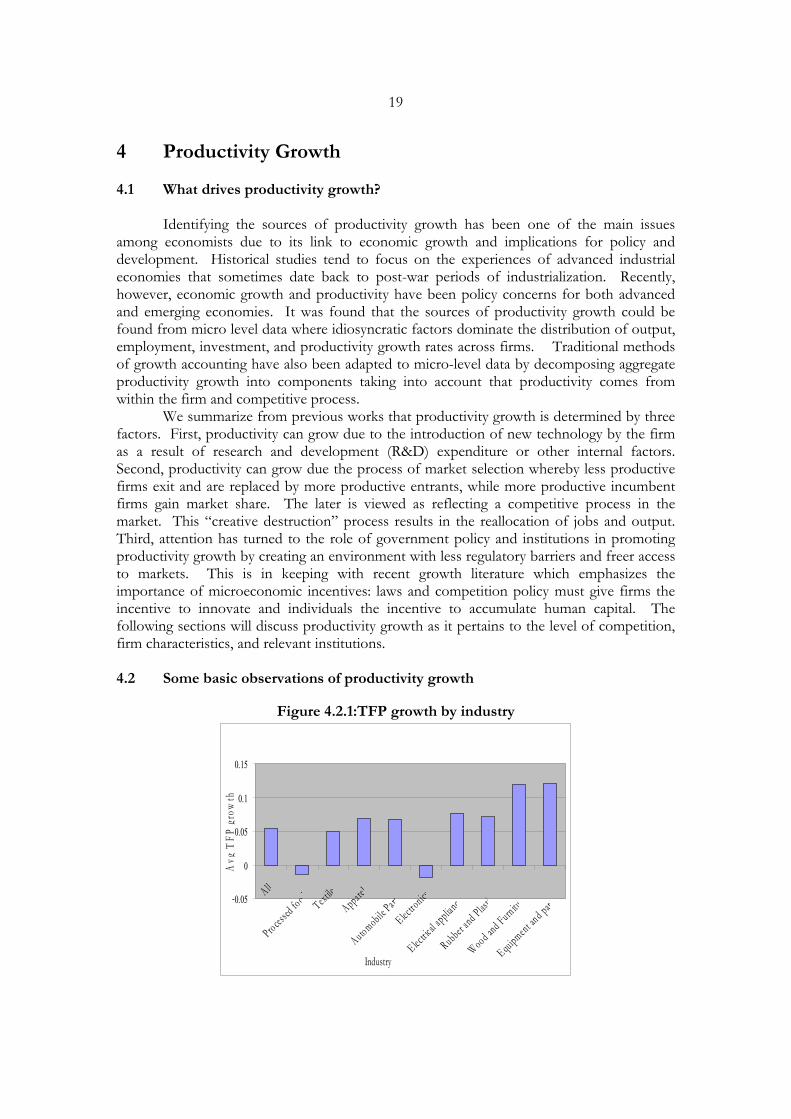
4 Productivity Growth 4.1 What drives productivity growth? Identifying the sources of productivity growth has been one of the main issues among economists due to its link to economic growth and implications for policy and development. Historical studies tend to focus on the experiences of advanced industrial economies that sometimes date back to post-war periods of industrialization. Recently, however, economic growth and productivity have been policy concerns for both advanced and emerging economies. It was found that the sources of productivity growth could be found from micro level data where idiosyncratic factors dominate the distribution of output, employment, investment, and productivity growth rates across firms. Traditional methods of growth accounting have also been adapted to micro-level data by decomposing aggregate productivity growth into components taking into account that productivity comes from within the firm and competitive process.
We summarize from previous works that productivity growth is determined by three factors. First, productivity can grow due to the introduction of new technology by the firm as a result of research and development (R&D) expenditure or other internal factors. Second, productivity can grow due the process of market selection whereby less productive firms exit and are replaced by more productive entrants, while more productive incumbent firms gain market share. The later is viewed as reflecting a competitive process in the market. This “creative destruction” process results in the reallocation of jobs and output. Third, attention has turned to the role of government policy and institutions in promoting productivity growth by creating an environment with less regulatory barriers and freer access to markets. This is in keeping with recent growth literature which emphasizes the importance of microeconomic incentives: laws and competition policy must give firms the incentive to innovate and individuals the incentive to accumulate human capital. The following sections will discuss productivity growth as it pertains to the level of competition, firm characteristics, and relevant institutions.
4.2 Some basic observations of productivity growth
Figure 4.2.1:TFP growth by industry
-0.05
0
0.05
0.1
0.15
All
Pro cessed
fo odText
ileAppare
l
Automobile Part
E lectronics
E lectr ica
l applian
ce
Rubber and Plast
i
Wood and Furn itur
Equipment and par t
Industry
Avg
TFP
gro
wth
20
From available data between 2001 and 2002 it was found that TFP growth varied across industries. For the entire manufacturing sector, TFP growth was 0.054. By industry, the average productivity growth was highest in the equipments and parts and wood and furniture sectors of 0.12 while electrical appliance and rubber and plastic followed with an average growth of approximately 0.07. Apparel had similar productivity growth to automobile parts but higher than textile of 0.07 and 0.05, respectively. Negative increases of productivity growth were found in electronics and processed food industries of -0.01 and –0.02. The results point out that the dispersion of firm productivity is large and there may important factors that contribute to the heterogeneity of firms. Often the sources of productivity growth entail the measurement of the impact of some key firm specific characteristics, such as age and size.
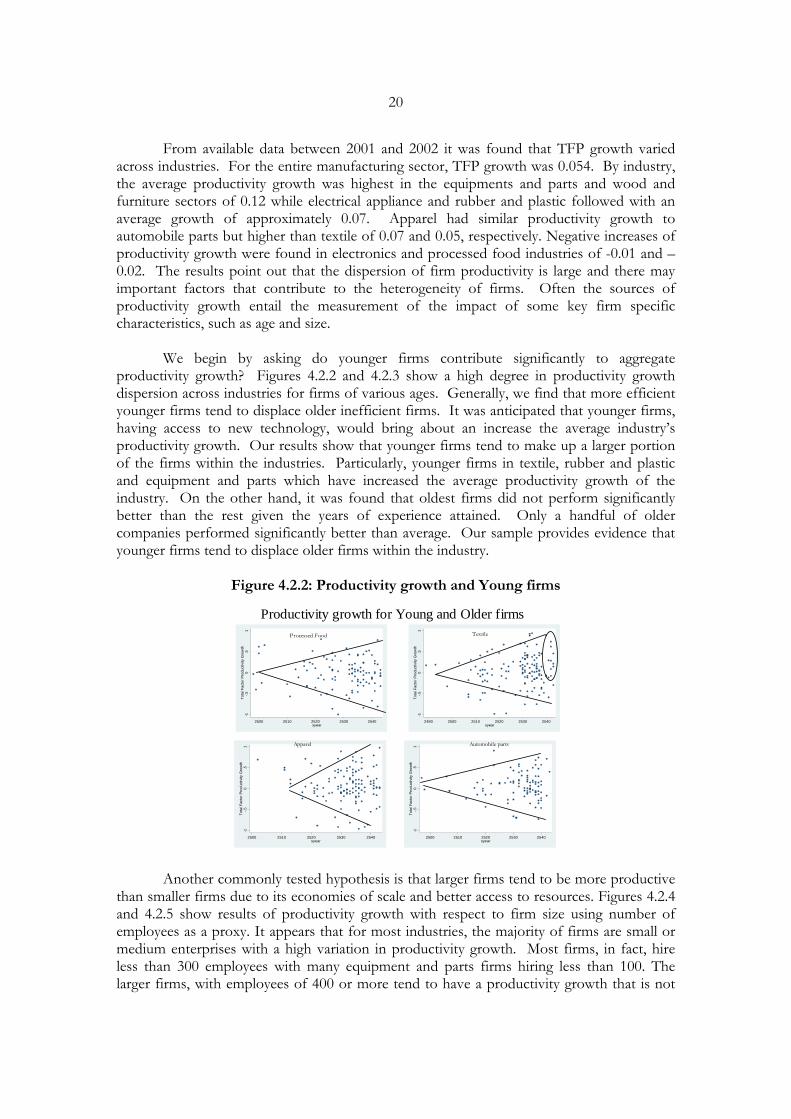
We begin by asking do younger firms contribute significantly to aggregate productivity growth? Figures 4.2.2 and 4.2.3 show a high degree in productivity growth dispersion across industries for firms of various ages. Generally, we find that more efficient younger firms tend to displace older inefficient firms. It was anticipated that younger firms, having access to new technology, would bring about an increase the average industry’s productivity growth. Our results show that younger firms tend to make up a larger portion of the firms within the industries. Particularly, younger firms in textile, rubber and plastic and equipment and parts which have increased the average productivity growth of the industry. On the other hand, it was found that oldest firms did not perform significantly better than the rest given the years of experience attained. Only a handful of older companies performed significantly better than average. Our sample provides evidence that younger firms tend to displace older firms within the industry.
Figure 4.2.2: Productivity growth and Young firms
-1-.5
0.5
1To
tal F
acto
r Pro
duct
ivity
Gro
wth
2500 2510 2520 2530 2540syear
Processed Food
-1-.5
0.5
1To
tal F
acto
r Pro
duct
ivity
Gro
wth
2490 2500 2510 2520 2530 2540syear
Textile
-1-.5
0.5
1To
tal F
acto
r Pro
duct
ivity
Gro
wth
2500 2510 2520 2530 2540syear
Apparel
Productivity growth for Young and Older firms
-1-.5
0.5
1To
tal F
acto
r Pro
duct
ivity
Gro
wth
2500 2510 2520 2530 2540syear
Automobile parts
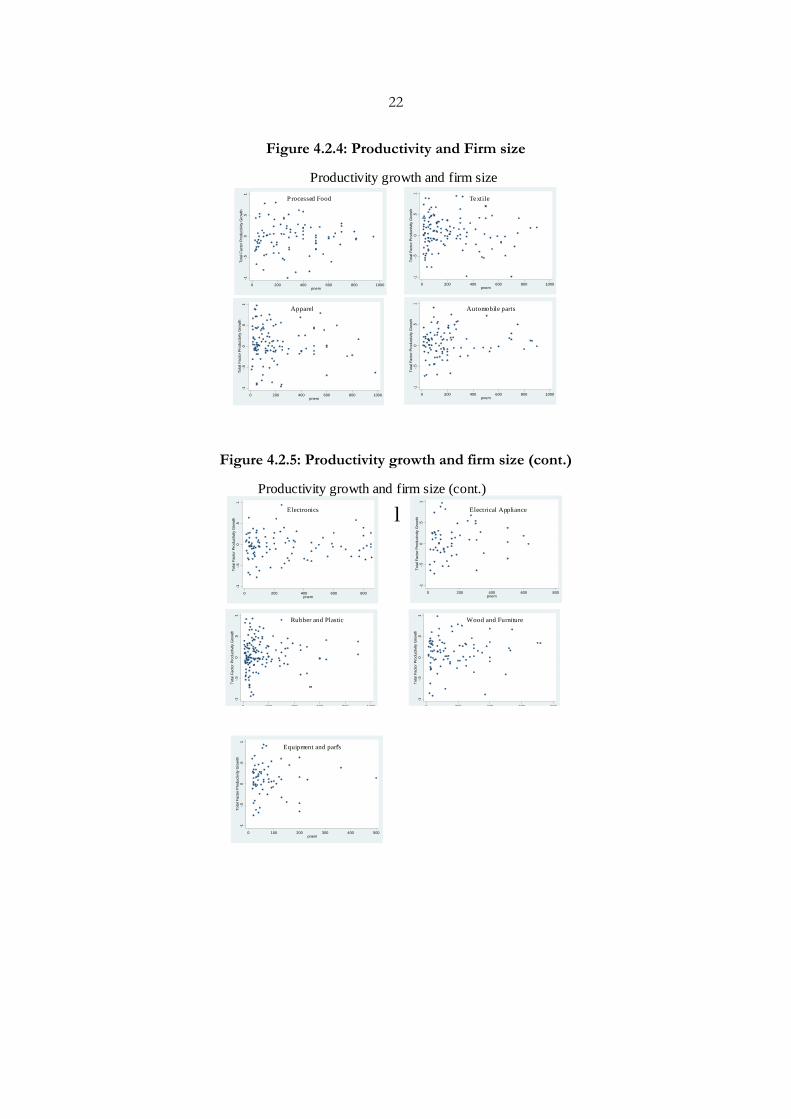
Another commonly tested hypothesis is that larger firms tend to be more productive
than smaller firms due to its economies of scale and better access to resources. Figures 4.2.4 and 4.2.5 show results of productivity growth with respect to firm size using number of employees as a proxy. It appears that for most industries, the majority of firms are small or medium enterprises with a high variation in productivity growth. Most firms, in fact, hire less than 300 employees with many equipment and parts firms hiring less than 100. The larger firms, with employees of 400 or more tend to have a productivity growth that is not
21
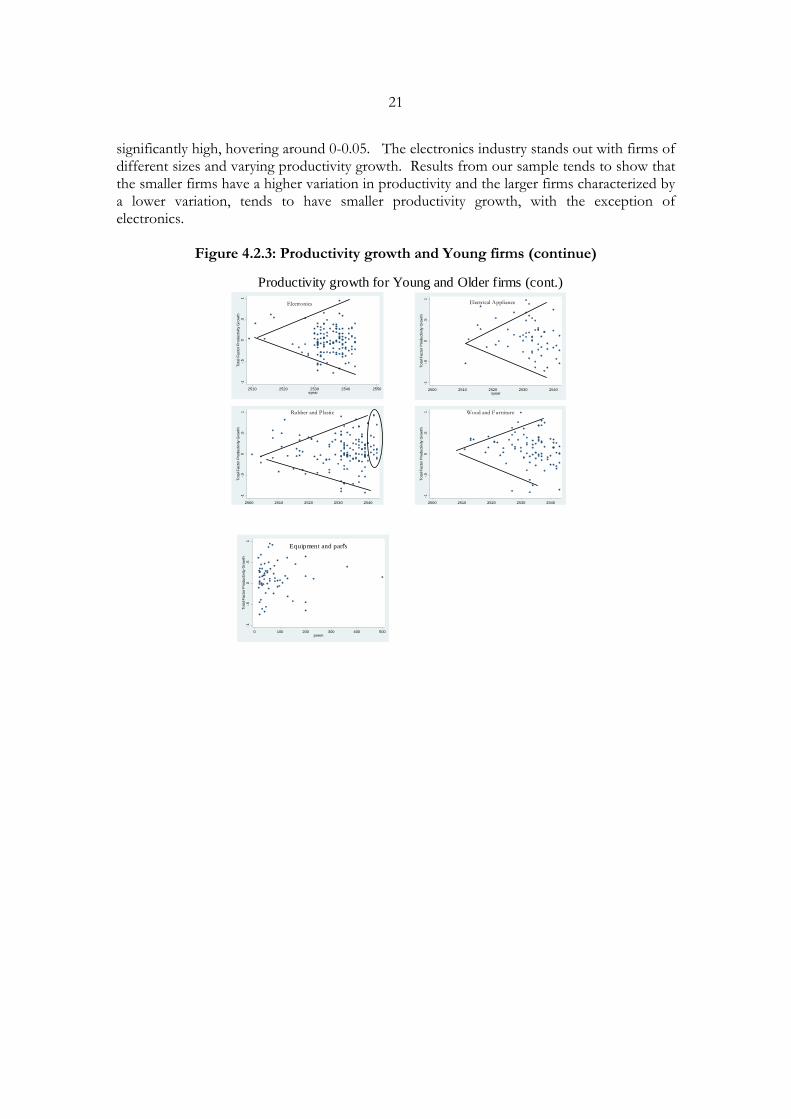
significantly high, hovering around 0-0.05. The electronics industry stands out with firms of different sizes and varying productivity growth. Results from our sample tends to show that the smaller firms have a higher variation in productivity and the larger firms characterized by a lower variation, tends to have smaller productivity growth, with the exception of electronics.
Figure 4.2.3: Productivity growth and Young firms (continue)
-1-.5
0.5
1To
tal F
acto
r Pro
duct
ivity
Gro
wth
2500 2510 2520 2530 2540syear
-1-.5
0.5
1To
tal F
acto
r Pro
duct
ivity
Gro
wth
2500 2510 2520 2530 2540syear
-1-.5
0.5
1To
tal F
acto
r Pro
duct
ivity
Gro
wth
2500 2510 2520 2530 2540syear
-1-.5
0.5
1To
tal F
acto
r Pro
duct
ivity
Gro
wth
2510 2520 2530 2540 2550syear
Electronics Electrical Appliance
Rubber and Plastic
Productivity growth for Young and Older firms (cont.)
Wood and Furniture
-1-.5
0.5
1To
tal F
acto
r Pro
duct
ivity
Gro
wth
0 100 200 300 400 500pnem
Equipment and parts
22
Figure 4.2.4: Productivity and Firm size
-1-.5
0.5
1To
tal F
acto
r Pro
duct
ivity
Gro
wth
0 200 400 600 800 1000pnem
-1-.5
0.5
1To
tal F
acto
r Pro
duct
ivity
Gro
wth
0 200 400 600 800 1000pnem
-1-.5
0.5
1To
tal F
acto
r Pro
duct
ivity
Gro
wth
0 200 400 600 800 1000pnem
-1-.5
0.5
1To
tal F
acto
r Pro
duct
ivity
Gro
wth
0 200 400 600 800 1000pnem
Processed Food Textile
Apparel
Productivity growth and firm size
Automobile parts
Figure 4.2.5: Productivity growth and firm size (cont.)
-1-.5
0.5
1To
tal F
acto
r Pro
duct
ivity
Gro
wth
0 200 400 600 800pnem
-1-.5
0.5
1To
tal F
acto
r Pro
duct
ivity
Gro
wth
0 200 400 600 800 1000pnem
-1-.5
0.5
1To
tal F
acto
r Pro
duct
ivity
Gro
wth
0 200 400 600 800pnem
-1-.5
0.5
1To
tal F
acto
r Pro
duct
ivity
Gro
wth
0 200 400 600 800pnem
lElectronics Electrical Appliance
Rubber and Plastic
Productivity growth and firm size (cont.)
Wood and Furniture
-1-.5
0.5
1To
tal F
acto
r Pro
duct
ivity
Gro
wth
0 100 200 300 400 500pnem
Equipment and parts
23
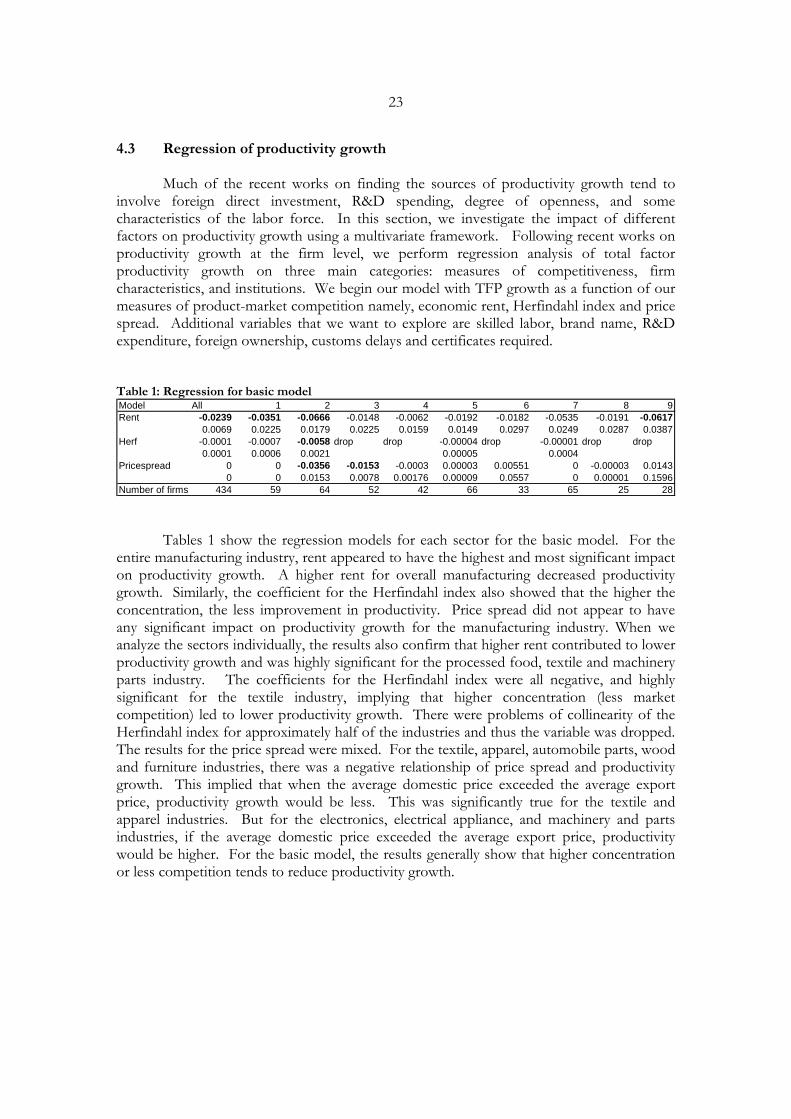
4.3 Regression of productivity growth
Much of the recent works on finding the sources of productivity growth tend to involve foreign direct investment, R&D spending, degree of openness, and some characteristics of the labor force. In this section, we investigate the impact of different factors on productivity growth using a multivariate framework. Following recent works on productivity growth at the firm level, we perform regression analysis of total factor productivity growth on three main categories: measures of competitiveness, firm characteristics, and institutions. We begin our model with TFP growth as a function of our measures of product-market competition namely, economic rent, Herfindahl index and price spread. Additional variables that we want to explore are skilled labor, brand name, R&D expenditure, foreign ownership, customs delays and certificates required. Table 1: Regression for basic model Model All 1 2 3 4 5 6 7 8 9Rent -0.0239 -0.0351 -0.0666 -0.0148 -0.0062 -0.0192 -0.0182 -0.0535 -0.0191 -0.0617
0.0069 0.0225 0.0179 0.0225 0.0159 0.0149 0.0297 0.0249 0.0287 0.0387Herf -0.0001 -0.0007 -0.0058 drop drop -0.00004 drop -0.00001 drop drop
0.0001 0.0006 0.0021 0.00005 0.0004Pricespread 0 0 -0.0356 -0.0153 -0.0003 0.00003 0.00551 0 -0.00003 0.0143
0 0 0.0153 0.0078 0.00176 0.00009 0.0557 0 0.00001 0.1596Number of firms 434 59 64 52 42 66 33 65 25 28
Tables 1 show the regression models for each sector for the basic model. For the entire manufacturing industry, rent appeared to have the highest and most significant impact on productivity growth. A higher rent for overall manufacturing decreased productivity growth. Similarly, the coefficient for the Herfindahl index also showed that the higher the concentration, the less improvement in productivity. Price spread did not appear to have any significant impact on productivity growth for the manufacturing industry. When we analyze the sectors individually, the results also confirm that higher rent contributed to lower productivity growth and was highly significant for the processed food, textile and machinery parts industry. The coefficients for the Herfindahl index were all negative, and highly significant for the textile industry, implying that higher concentration (less market competition) led to lower productivity growth. There were problems of collinearity of the Herfindahl index for approximately half of the industries and thus the variable was dropped. The results for the price spread were mixed. For the textile, apparel, automobile parts, wood and furniture industries, there was a negative relationship of price spread and productivity growth. This implied that when the average domestic price exceeded the average export price, productivity growth would be less. This was significantly true for the textile and apparel industries. But for the electronics, electrical appliance, and machinery and parts industries, if the average domestic price exceeded the average export price, productivity would be higher. For the basic model, the results generally show that higher concentration or less competition tends to reduce productivity growth.
24
Table 2: Regression with firm characteristics Model All 1 2 3 4 5 6 7 8 9Skill -0.0059 0.0398 -0.0022 -0.0874 0.2082 -0.1248 0.1056 0.1335 -0.0219 -0.7668
0.0545 0.1459 0.1628 0.1285 0.1509 0.1733 0.5917 0.2041 0.1406 0.3158Brand 0.0087 0.061 -0.0719 0.0031 0.0501 0.0328 0.1295 0.0268 0.073 0.0747
0.0236 0.095 0.0717 0.073 0.0691 0.0553 0.1259 0.06 0.0802 0.102RD -0.2653 -12.333 -23.309 -9.322 2.622 -7.0111 13.7852 -35.568 24.472 -16.562
2.945 7.517 21.81 9.775 4.155 9.7146 8.881 16.104 32.838 14.934Foreign -0.0025 -0.0148 0.943 -0.1533 0.0577 0.0754 0.1034 -0.00303 0.2156 -0.0328
0.0261 0.091 0.0806 0.0929 0.0678 0.0575 0.115 0.0805 0.1216 0.1187Number of firms 963 105 137 127 96 134 59 150 88 67
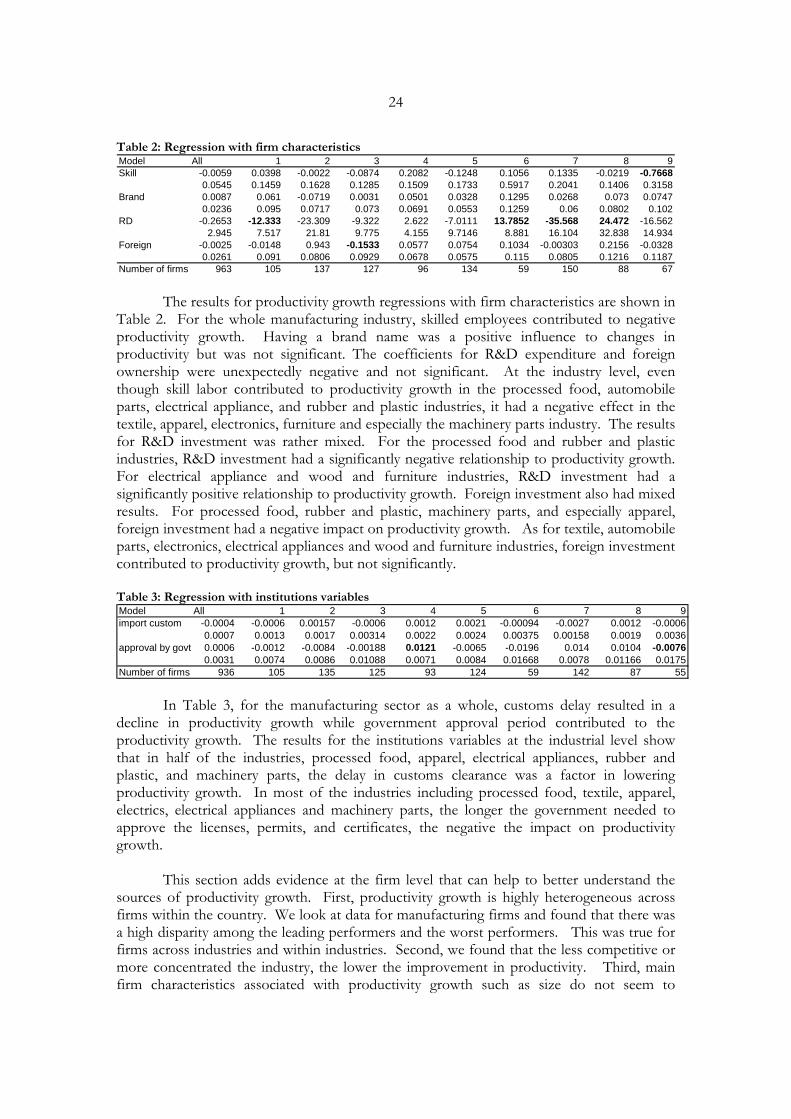
The results for productivity growth regressions with firm characteristics are shown in
Table 2. For the whole manufacturing industry, skilled employees contributed to negative productivity growth. Having a brand name was a positive influence to changes in productivity but was not significant. The coefficients for R&D expenditure and foreign ownership were unexpectedly negative and not significant. At the industry level, even though skill labor contributed to productivity growth in the processed food, automobile parts, electrical appliance, and rubber and plastic industries, it had a negative effect in the textile, apparel, electronics, furniture and especially the machinery parts industry. The results for R&D investment was rather mixed. For the processed food and rubber and plastic industries, R&D investment had a significantly negative relationship to productivity growth. For electrical appliance and wood and furniture industries, R&D investment had a significantly positive relationship to productivity growth. Foreign investment also had mixed results. For processed food, rubber and plastic, machinery parts, and especially apparel, foreign investment had a negative impact on productivity growth. As for textile, automobile parts, electronics, electrical appliances and wood and furniture industries, foreign investment contributed to productivity growth, but not significantly.
Table 3: Regression with institutions variables Model All 1 2 3 4 5 6 7 8 9import custom -0.0004 -0.0006 0.00157 -0.0006 0.0012 0.0021 -0.00094 -0.0027 0.0012 -0.0006
0.0007 0.0013 0.0017 0.00314 0.0022 0.0024 0.00375 0.00158 0.0019 0.0036approval by govt 0.0006 -0.0012 -0.0084 -0.00188 0.0121 -0.0065 -0.0196 0.014 0.0104 -0.0076
0.0031 0.0074 0.0086 0.01088 0.0071 0.0084 0.01668 0.0078 0.01166 0.0175Number of firms 936 105 135 125 93 124 59 142 87 55
In Table 3, for the manufacturing sector as a whole, customs delay resulted in a decline in productivity growth while government approval period contributed to the productivity growth. The results for the institutions variables at the industrial level show that in half of the industries, processed food, apparel, electrical appliances, rubber and plastic, and machinery parts, the delay in customs clearance was a factor in lowering productivity growth. In most of the industries including processed food, textile, apparel, electrics, electrical appliances and machinery parts, the longer the government needed to approve the licenses, permits, and certificates, the negative the impact on productivity growth. This section adds evidence at the firm level that can help to better understand the sources of productivity growth. First, productivity growth is highly heterogeneous across firms within the country. We look at data for manufacturing firms and found that there was a high disparity among the leading performers and the worst performers. This was true for firms across industries and within industries. Second, we found that the less competitive or more concentrated the industry, the lower the improvement in productivity. Third, main firm characteristics associated with productivity growth such as size do not seem to
25
influence productivity changes while younger firms tend to be more productive and displace the older firms. Fourth, gains in productivity seem to be associated with higher capital investment, particularly, R&D investment. Fifth, the higher the governmental barriers, such as customs clearance, paperwork, government red tape, etc., the lower the productivity growth of firms. Sixth, price differentials, especially when there are government controls where the domestic price is lower than the export price, would likely make firms less productive in the long run. 5 Conclusion and Policy Implications
“People of the same trade seldom meet together, even for merriment and diversion, but the conversation ends in a conspiracy against the public, or in some contrivance to raise prices. It is impossible indeed to prevent such
meetings, by any law which either could be executed, or would be consistent with liberty and justice.” –Adam Smith (1776)
The challenge for policymakers will be how to harness the forces of market
competition to ensure that the firm sector, as a whole, can raise its productivity and adapt to rising competition. The importance of this policy objective cannot be overemphasized: long-run growth ultimately depends on total factor productivity growth. We also stress the immediacy of this challenge in view of the inexorable and accelerating march of globalization. Competitive domestic markets can serve to strengthen Thai firms and prepare them for global competition. Delay would be tantamount to courting disaster. History is rife with examples of economies with noncompetitive domestic markets finding trade liberalization to be disruptive in the short run and possibly hurtful in the long run.
Competition policy should focus on building a foundation for vibrant market
competition. The first step would entail removing regulatory impediments to market operation in a timely manner. Examples include price controls, price administration, market entry red-tape, and rationed business licenses. Our study finds that price controls reduce the incentive for firms to invest and improve efficiency.14 Furthermore, as product markets are linked to factor markets, it should also be stressed that policymakers should continue the policy of open capital and labor markets, as flexible capital and labor markets underpin firm sector adaptability and resiliency. Regulatory impediments in factor markets, such as wage control, will hurt firm productivity and, in turn, workers, shareholders, and consumers. 14 Price-administration of goods and services has ostensibly been mostly due to an attempt by authorities to prevent unfair practices in the pricing of essential or necessary goods. Administered prices span over a range of goods and services, including public transportation, utilities, education, medical fees and basic consumer goods. While the Ministry of Commerce monitors most goods and services, other government entities also regulate prices depending on the type of industry to which the goods belong. For consumer products, the Ministry of Commerce imposes administrative price measures in accordance with the Prices of Goods and Services Act 1999 whereby goods and services were subjected to some form of regulation including reports on production quantity, costs, profit margin, and prices, depending on the degree of their importance. As a result, prices of these goods and services have not adjusted in line with the rise in production costs.
26
Restrictions on foreign ownership should be gradually eased to foster competition and technology inflow.
The implementation of competition law falls under the purview of the Trade
Competition Commission (TCC). Thailand’s Trade Competition Law consists of two acts: the Price Determination Act 1999 and the Trade Competition Act 1999. The law is enforced by the Trade Competition Commission (TCC), a government agency consisting of the Minister of Commerce as Chairman, the Permanent Secretary for Ministry of Commerce as Vice-Chairman, Permanent Secretary for the Ministry of Finance, the Director-General of the Department of Internal Trade as Secretary and no less than 8, but not more than 12 qualified persons from the fields of law, economics, commerce, business administration or public administration as commissioners. The Department of Internal Trade is charged with finding qualified and impartial representatives from the private sector.
Interestingly, the search process simply involves requesting that the Federation of
Thai Industries and the Thai Chamber of Commerce each submit three candidates.15 As these trade associations tend to be dominated by big businesses, small and medium businesses stand little chance of being nominated as commissioners. Consequently, the commission is over-represented by large businesses. Other experts on the Commission; be they academics, professionals or other private sector representatives, are nominated by the Minister of Commerce and appointed by the Cabinet. To ensure effective implementation, the TCC should be composed of commissioners representing all relevant interest groups: small and large firms, entrepreneurs, and consumers. A more attractive alternative may be to bestow the burden of legal implementation to the judiciary. Competition law should be implemented in a transparent and non-discriminatory manner.
Competition law design can also benefit from greater clarity. Anti-competitive
practices such as explicit collusion should be targeted. Quantitative measures of appropriate market competition, especially for non-traded goods, should be defined so as to serve as an objective and transparent aid for assessing anti-competitive practices.
Ensuring product market competition is no easy task. It is in the nature of firms to
seek profit and rent by lobbying regulators to erect artificial barriers and regulatory roadblocks for the purpose of limiting competition.16 As firms are profit maximizing entities, we can expect no less of them. However, it is the duty of the policymaker to safeguard the public interest by resisting regulatory capture17 and the temptation to equate firm interest with national interest. Only by doing so, will firms be forced to meet the 15 Adam Smith (1776) would have viewed such a gathering with suspicion and puzzlement: “People of the same trade seldom meet together, even for merriment and diversion, but the conversation ends in a conspiracy against the public, or in some contrivance to raise prices. It is impossible indeed to prevent such meetings, by any law which either could be executed, or would be consistent with liberty and justice. But though the law cannot hinder people of the same trade from sometimes assembling together, it ought to do nothing to facilitate such assemblies; much less to render them necessary (my italics)”. 16 This is not a recent phenomenon. Adam Smith (1776) observed that “To widen the market and to narrow the competition is always the interest of the dealers. The proposal of any new law or regulation of commerce which comes from this order, ought always to be listened to with great precaution, and ought never to be adopted, till after having been long and carefully examined, not only with the most scrupulous, but with the most suspicious attention. It comes from an order of men, whose interest is never exactly the same with that of the public, who have generally an interest to deceive and even to oppress the public, and who accordingly have, upon many occasions, both deceived and oppressed it..” 17 One should not assume that the regulator has the public interest at heart. The public choice literature sees the regulator as an economic agent and explains how regulators may become “captured” or co-opted. The literature finds that regulators are more likely to act in the interest of firms, rather than the public at large, as firms under the threat of regulation can coordinate to push their interests more effectively than dispersed consumers. Regulations that give rise to opportunities for rent-seeking on the part of firms should be reviewed carefully. In fact, regulators and policymakers may conspire in the creation and sharing of non-quasi rents. Ultimately, it is the responsibility of civil society and electoral competition to ensure that regulators and policymakers safeguard the national interest.
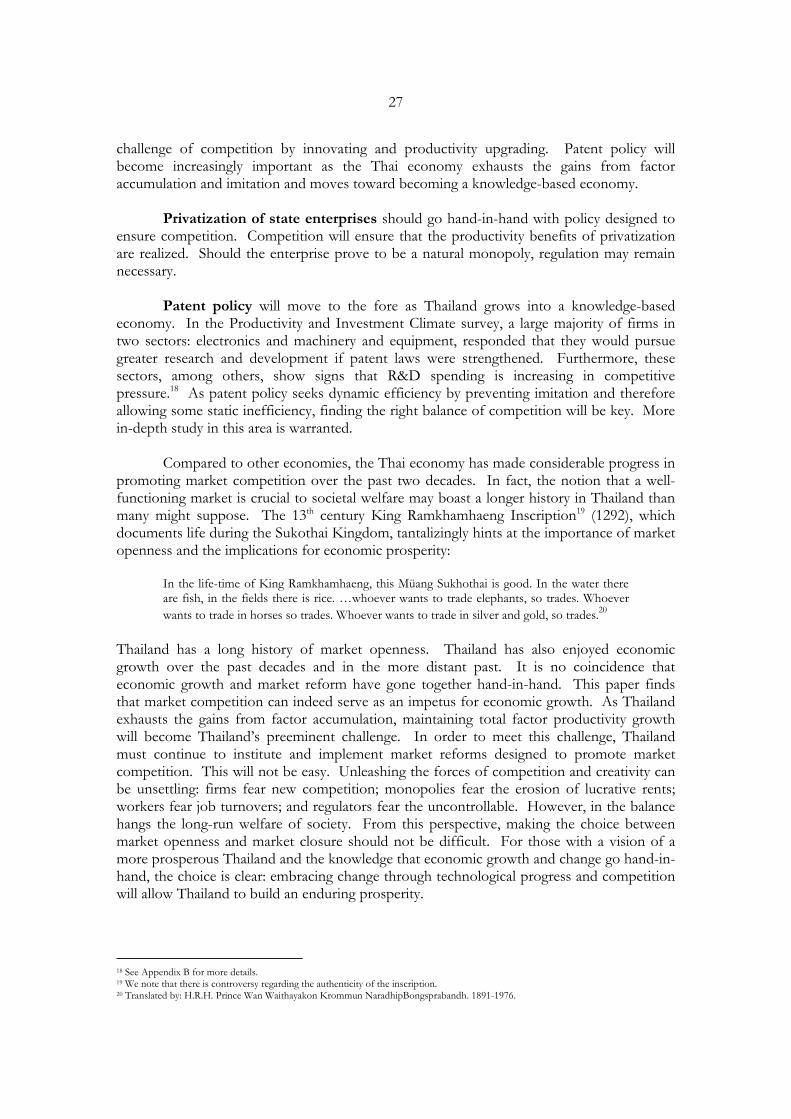
27
challenge of competition by innovating and productivity upgrading. Patent policy will become increasingly important as the Thai economy exhausts the gains from factor accumulation and imitation and moves toward becoming a knowledge-based economy.
Privatization of state enterprises should go hand-in-hand with policy designed to ensure competition. Competition will ensure that the productivity benefits of privatization are realized. Should the enterprise prove to be a natural monopoly, regulation may remain necessary. Patent policy will move to the fore as Thailand grows into a knowledge-based economy. In the Productivity and Investment Climate survey, a large majority of firms in two sectors: electronics and machinery and equipment, responded that they would pursue greater research and development if patent laws were strengthened. Furthermore, these sectors, among others, show signs that R&D spending is increasing in competitive pressure.18 As patent policy seeks dynamic efficiency by preventing imitation and therefore allowing some static inefficiency, finding the right balance of competition will be key. More in-depth study in this area is warranted.
Compared to other economies, the Thai economy has made considerable progress in promoting market competition over the past two decades. In fact, the notion that a well-functioning market is crucial to societal welfare may boast a longer history in Thailand than many might suppose. The 13th century King Ramkhamhaeng Inscription19 (1292), which documents life during the Sukothai Kingdom, tantalizingly hints at the importance of market openness and the implications for economic prosperity:
In the life-time of King Ramkhamhaeng, this Müang Sukhothai is good. In the water there are fish, in the fields there is rice. …whoever wants to trade elephants, so trades. Whoever wants to trade in horses so trades. Whoever wants to trade in silver and gold, so trades.20
Thailand has a long history of market openness. Thailand has also enjoyed economic growth over the past decades and in the more distant past. It is no coincidence that economic growth and market reform have gone together hand-in-hand. This paper finds that market competition can indeed serve as an impetus for economic growth. As Thailand exhausts the gains from factor accumulation, maintaining total factor productivity growth will become Thailand’s preeminent challenge. In order to meet this challenge, Thailand must continue to institute and implement market reforms designed to promote market competition. This will not be easy. Unleashing the forces of competition and creativity can be unsettling: firms fear new competition; monopolies fear the erosion of lucrative rents; workers fear job turnovers; and regulators fear the uncontrollable. However, in the balance hangs the long-run welfare of society. From this perspective, making the choice between market openness and market closure should not be difficult. For those with a vision of a more prosperous Thailand and the knowledge that economic growth and change go hand-in-hand, the choice is clear: embracing change through technological progress and competition will allow Thailand to build an enduring prosperity.
18 See Appendix B for more details. 19 We note that there is controversy regarding the authenticity of the inscription. 20 Translated by: H.R.H. Prince Wan Waithayakon Krommun NaradhipBongsprabandh. 1891-1976.

28
6 References AGHION, PHILIPPE NICHOLAS BLOOM, RICHARD BLUNDELL, RACHEL GRIFFITH, AND PETER HOWITT (2003). “Competition and Innovation: An Inverted U Relationship,” manuscript. AGHION, PHILIPPE; PETER HOWITT (1990). A Model of Growth Through Creative Destruction. NBER Working Papers 3223, (Cambridge: National Bureau of Economic Research). AGHION, PHILIPPE; RACHEL GRIFFITH (2005). Competition and Growth: Reconciling Theory and Evidence, (Cambridge: MIT Press). BARTELSMAN, ERIC J., MARK DOMS (2000). “Understanding Productivity: Lessons from Longitudinal Microdata,” Washington DC, Federal Reserve Board. BEASON, RICHARD; DAVID E. WEINSTEIN (1996). “Growth, Economies of Scale and Targeting in Japan (1955-1990),” Review of Economics and Statistics (78)2. BRENNAN, TIMOTHY J. (2000). “The Economics of Competition Policy: Recent
Developments and Cautionary Notes in Antitrust and Regulation,” Discussion Paper, (Washington D.C.: Resources for the Future).
BRYNJOLFSSON, ERIK, LORIN HITT (2003). Computing Productivity: Firm-Level Evidence, Review of Economics and Statistics, November. BAILY, MARTIN NEIL, ROBERT M. SOLOW (2001). “International Productivity Comparisons Built from the Firm Level,” Journal of Economic Perspectives, 3. BERNAND, A.; J. JENSEN (1999). “Exceptional Export Performance: Cause, Effect, or Both?,” Journal of International Economics 47. BHAGWATI JAGDISH (2005). “A New Vocabulary for Trade,” The Wall Street Journal, 4 August 2005. BOSWORTH, BARRY; COLLINS, SUSAN (2003). “The Empirics of Growth: An Update” Brookings Working Paper (Washington D.C.: Brookings Institution) ELBADAWI, IBRAHIM (1994). “Estimating Long-Run Equilibrium Real Exchange Rates,” in Estimating Equilibrium Exchange Rates, ed. by John Williamson, Washington, Institute for International Economics. CREPON, BRUNO, EMMANUEL DUGUET, JACQUES MAIRESSE (1998) “Research, Innovation, and Productivity: An Econometric Analysis at the Firm Level” August 1. NBER Working Paper No. W6696 GRILICHES, ZVI (1986). “Productivity, R&D, and Basic Research at the Firm Level in the 1970s,” NBER Working Paper No. W1547 HALLWARD-DRIEMEIER, IAROSSI, GIUSEPPE, SOKOLOFF, KENNETH L. (2002). “Exports and manufacturing productivity in East Asia: a comparative analysis with firm-level data,” NBER Working Paper No. W8894 HSIEH, CHANG-TAI (2002) “What Explains the Industrial Revolution in East Asia? Evidence from Factor Markets.” American Economic Review JORGENSION, DALE and MASAHIRO KURODA (1990). “Productivity and International Competitiveness in Japan and the United States, 1960-1985.” In PRODUCTIVITY IN THE U.S. AND JAPAN, ed. C. R. Hulten. Studies in Income and Wealth, vol. 51. (Chicago, IL: University of Chicago Press). JOVANOVIC, BOYAN (1982). “Selection and the Evolution of Industry.” Econometrica 50 (May 1982): 649-70. LEVINSOHN J.; A. PETRIN (2003). “Estimating Production Functions Using Inputs to Control for Unobservables,” Review of Economics Studies Vol. 70(2), No. 243. LICHTENBERG, F.; SIEGEL (1991) “The Impact of R&D Investment on Productivity”
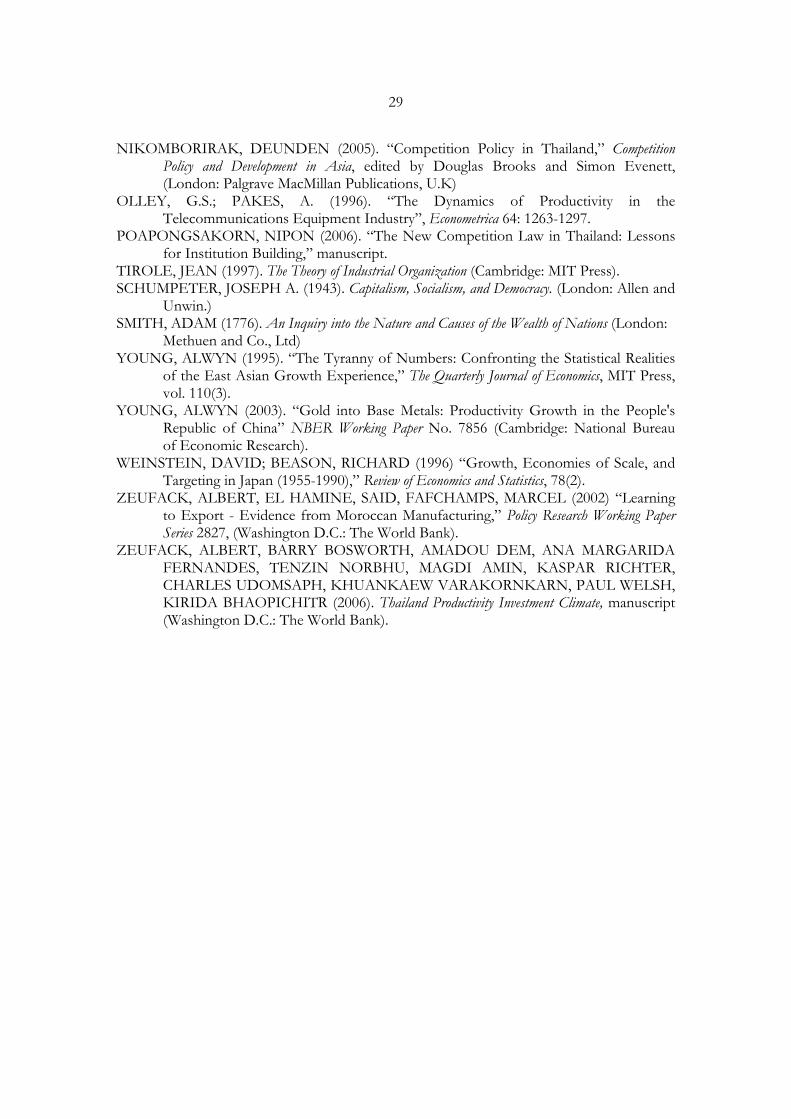
29
NIKOMBORIRAK, DEUNDEN (2005). “Competition Policy in Thailand,” Competition Policy and Development in Asia, edited by Douglas Brooks and Simon Evenett, (London: Palgrave MacMillan Publications, U.K) OLLEY, G.S.; PAKES, A. (1996). “The Dynamics of Productivity in the Telecommunications Equipment Industry”, Econometrica 64: 1263-1297. POAPONGSAKORN, NIPON (2006). “The New Competition Law in Thailand: Lessons for Institution Building,” manuscript. TIROLE, JEAN (1997). The Theory of Industrial Organization (Cambridge: MIT Press). SCHUMPETER, JOSEPH A. (1943). Capitalism, Socialism, and Democracy. (London: Allen and Unwin.) SMITH, ADAM (1776). An Inquiry into the Nature and Causes of the Wealth of Nations (London: Methuen and Co., Ltd) YOUNG, ALWYN (1995). “The Tyranny of Numbers: Confronting the Statistical Realities of the East Asian Growth Experience,” The Quarterly Journal of Economics, MIT Press, vol. 110(3). YOUNG, ALWYN (2003). “Gold into Base Metals: Productivity Growth in the People's Republic of China” NBER Working Paper No. 7856 (Cambridge: National Bureau of Economic Research). WEINSTEIN, DAVID; BEASON, RICHARD (1996) “Growth, Economies of Scale, and Targeting in Japan (1955-1990),” Review of Economics and Statistics, 78(2). ZEUFACK, ALBERT, EL HAMINE, SAID, FAFCHAMPS, MARCEL (2002) “Learning to Export - Evidence from Moroccan Manufacturing,” Policy Research Working Paper Series 2827, (Washington D.C.: The World Bank). ZEUFACK, ALBERT, BARRY BOSWORTH, AMADOU DEM, ANA MARGARIDA FERNANDES, TENZIN NORBHU, MAGDI AMIN, KASPAR RICHTER, CHARLES UDOMSAPH, KHUANKAEW VARAKORNKARN, PAUL WELSH, KIRIDA BHAOPICHITR (2006). Thailand Productivity Investment Climate, manuscript (Washington D.C.: The World Bank).
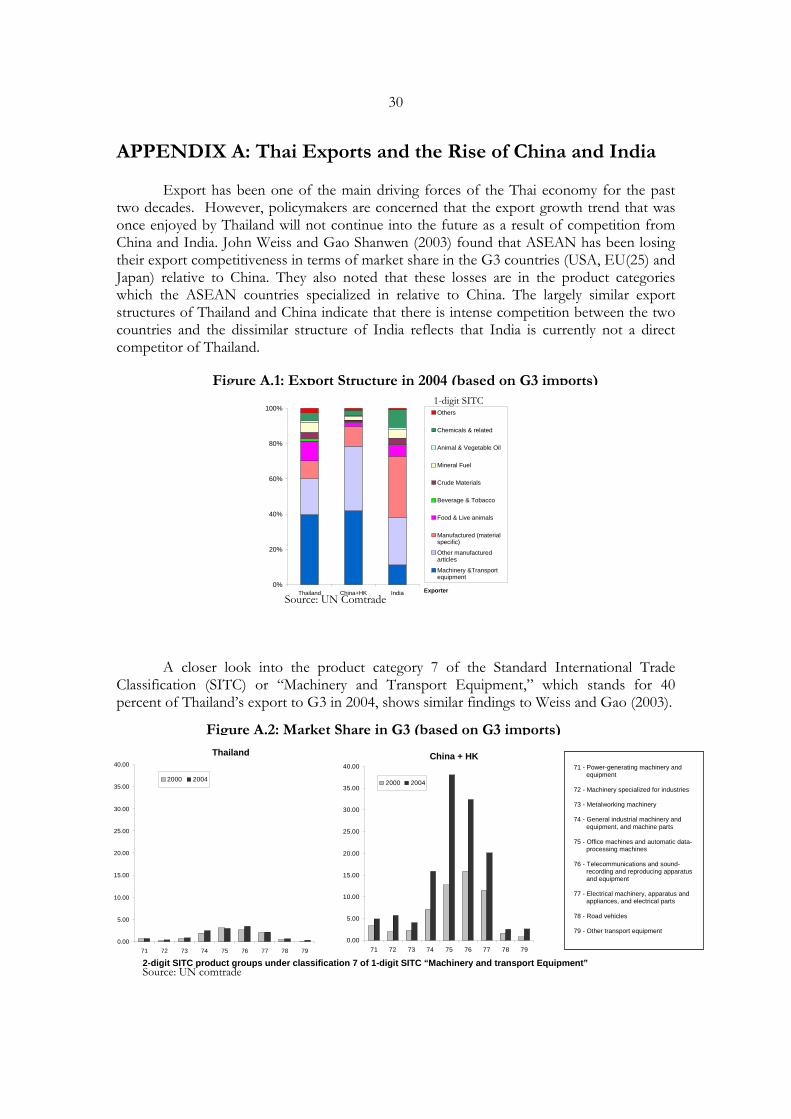
30
APPENDIX A: Thai Exports and the Rise of China and India
Export has been one of the main driving forces of the Thai economy for the past two decades. However, policymakers are concerned that the export growth trend that was once enjoyed by Thailand will not continue into the future as a result of competition from China and India. John Weiss and Gao Shanwen (2003) found that ASEAN has been losing their export competitiveness in terms of market share in the G3 countries (USA, EU(25) and Japan) relative to China. They also noted that these losses are in the product categories which the ASEAN countries specialized in relative to China. The largely similar export structures of Thailand and China indicate that there is intense competition between the two countries and the dissimilar structure of India reflects that India is currently not a direct competitor of Thailand.
A closer look into the product category 7 of the Standard International Trade Classification (SITC) or “Machinery and Transport Equipment,” which stands for 40 percent of Thailand’s export to G3 in 2004, shows similar findings to Weiss and Gao (2003).
0%
20%
40%
60%
80%
100%
Thailand China+HK India Exporter
Others
Chemicals & related
Animal & Vegetable Oil
Mineral Fuel
Crude Materials
Beverage & Tobacco
Food & Live animals
Manufactured (materialspecific)
Other manufacturedarticles
Machinery &Transportequipment
0.00
5.00
10.00
15.00
20.00
25.00
30.00
35.00
40.00
71 72 73 74 75 76 77 78 79
2000 2004
Figure A.2: Market Share in G3 (based on G3 imports)
Figure A.1: Export Structure in 2004 (based on G3 imports) 1-digit SITC
Source: UN Comtrade
Source: UN comtrade
Thailand
0.00
5.00
10.00
15.00
20.00
25.00
30.00
35.00
40.00
71 72 73 74 75 76 77 78 79
2000 2004
71 - Power-generating machinery and equipment 72 - Machinery specialized for industries 73 - Metalworking machinery 74 - General industrial machinery and equipment, and machine parts 75 - Office machines and automatic data- processing machines 76 - Telecommunications and sound- recording and reproducing apparatus and equipment 77 - Electrical machinery, apparatus and appliances, and electrical parts 78 - Road vehicles 79 - Other transport equipment
China + HK
2-digit SITC product groups under classification 7 of 1-digit SITC “Machinery and transport Equipment”
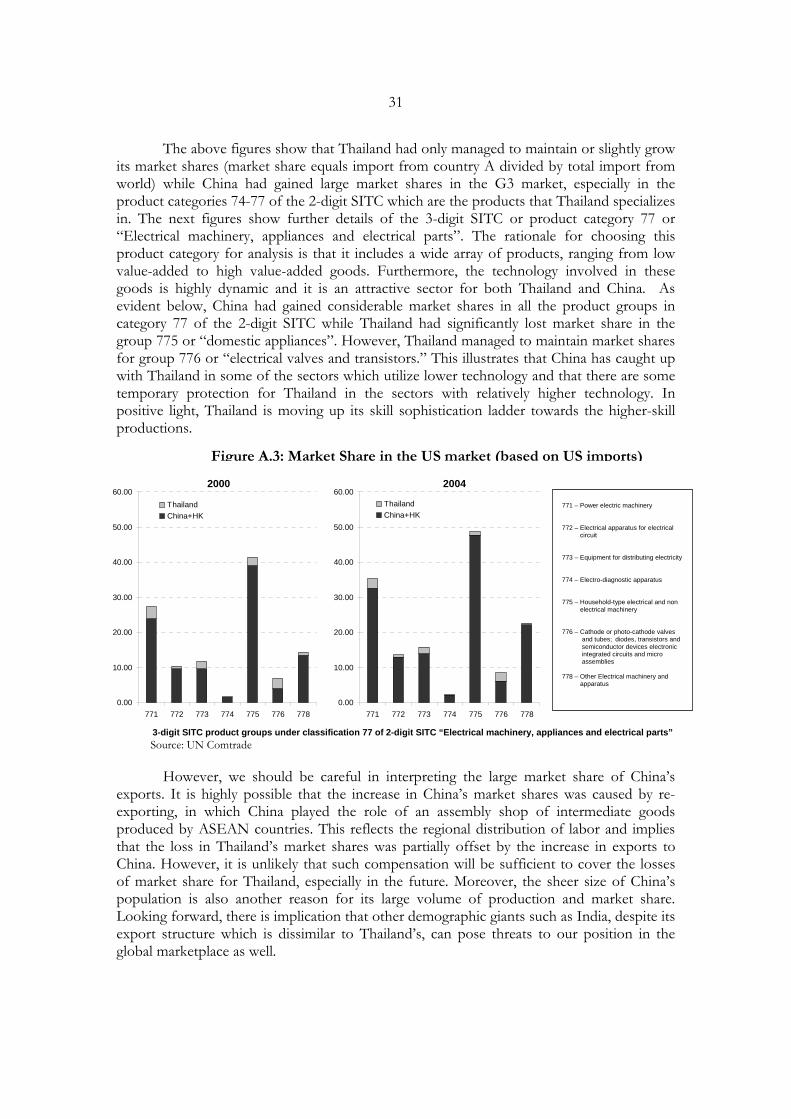
31
The above figures show that Thailand had only managed to maintain or slightly grow its market shares (market share equals import from country A divided by total import from world) while China had gained large market shares in the G3 market, especially in the product categories 74-77 of the 2-digit SITC which are the products that Thailand specializes in. The next figures show further details of the 3-digit SITC or product category 77 or “Electrical machinery, appliances and electrical parts”. The rationale for choosing this product category for analysis is that it includes a wide array of products, ranging from low value-added to high value-added goods. Furthermore, the technology involved in these goods is highly dynamic and it is an attractive sector for both Thailand and China. As evident below, China had gained considerable market shares in all the product groups in category 77 of the 2-digit SITC while Thailand had significantly lost market share in the group 775 or “domestic appliances”. However, Thailand managed to maintain market shares for group 776 or “electrical valves and transistors.” This illustrates that China has caught up with Thailand in some of the sectors which utilize lower technology and that there are some temporary protection for Thailand in the sectors with relatively higher technology. In positive light, Thailand is moving up its skill sophistication ladder towards the higher-skill productions.
However, we should be careful in interpreting the large market share of China’s exports. It is highly possible that the increase in China’s market shares was caused by re-exporting, in which China played the role of an assembly shop of intermediate goods produced by ASEAN countries. This reflects the regional distribution of labor and implies that the loss in Thailand’s market shares was partially offset by the increase in exports to China. However, it is unlikely that such compensation will be sufficient to cover the losses of market share for Thailand, especially in the future. Moreover, the sheer size of China’s population is also another reason for its large volume of production and market share. Looking forward, there is implication that other demographic giants such as India, despite its export structure which is dissimilar to Thailand’s, can pose threats to our position in the global marketplace as well.
0.00
10.00
20.00
30.00
40.00
50.00
60.00
771 772 773 774 775 776 778
ThailandChina+HK
0.00
10.00
20.00
30.00
40.00
50.00
60.00
771 772 773 774 775 776 778
ThailandChina+HK
Figure A.3: Market Share in the US market (based on US imports)
2000 2004
Source: UN Comtrade 3-digit SITC product groups under classification 77 of 2-digit SITC “Electrical machinery, appliances and electrical parts”
771 – Power electric machinery 772 – Electrical apparatus for electrical circuit 773 – Equipment for distributing electricity 774 – Electro-diagnostic apparatus 775 – Household-type electrical and non electrical machinery 776 – Cathode or photo-cathode valves and tubes; diodes, transistors and semiconductor devices electronic integrated circuits and micro assemblies 778 – Other Electrical machinery and apparatus

32
The rise of China and India are inevitable dynamics which all ASEAN countries, including Thailand, must face. The findings above point towards the fact that competition is rising as China and India catch up with Thailand in terms of productivity and technology. If Thailand wishes to thrive in the world export market, she will need to redefine her competitive edge by innovating or move out of sectors where its competitive advantage is diminishing and re-focus its energy on other sectors where opportunities exist.
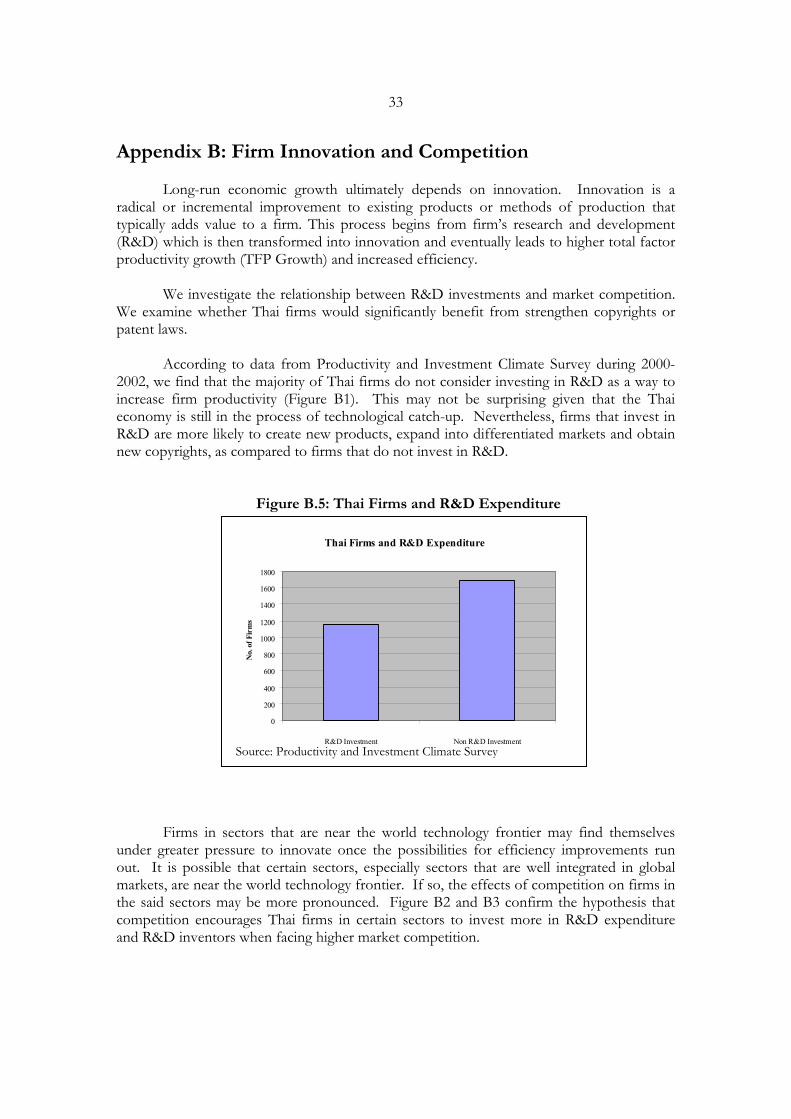
33
Appendix B: Firm Innovation and Competition
Long-run economic growth ultimately depends on innovation. Innovation is a radical or incremental improvement to existing products or methods of production that typically adds value to a firm. This process begins from firm’s research and development (R&D) which is then transformed into innovation and eventually leads to higher total factor productivity growth (TFP Growth) and increased efficiency.
We investigate the relationship between R&D investments and market competition. We examine whether Thai firms would significantly benefit from strengthen copyrights or patent laws.
According to data from Productivity and Investment Climate Survey during 2000-2002, we find that the majority of Thai firms do not consider investing in R&D as a way to increase firm productivity (Figure B1). This may not be surprising given that the Thai economy is still in the process of technological catch-up. Nevertheless, firms that invest in R&D are more likely to create new products, expand into differentiated markets and obtain new copyrights, as compared to firms that do not invest in R&D.
Figure B.5: Thai Firms and R&D Expenditure
Thai Firms and R&D Expenditure
0200400
600800
10001200
140016001800
R&D Investment Non R&D Investment
No. o
f Firm
s
Firms in sectors that are near the world technology frontier may find themselves
under greater pressure to innovate once the possibilities for efficiency improvements run out. It is possible that certain sectors, especially sectors that are well integrated in global markets, are near the world technology frontier. If so, the effects of competition on firms in the said sectors may be more pronounced. Figure B2 and B3 confirm the hypothesis that competition encourages Thai firms in certain sectors to invest more in R&D expenditure and R&D inventors when facing higher market competition.
Source: Productivity and Investment Climate Survey
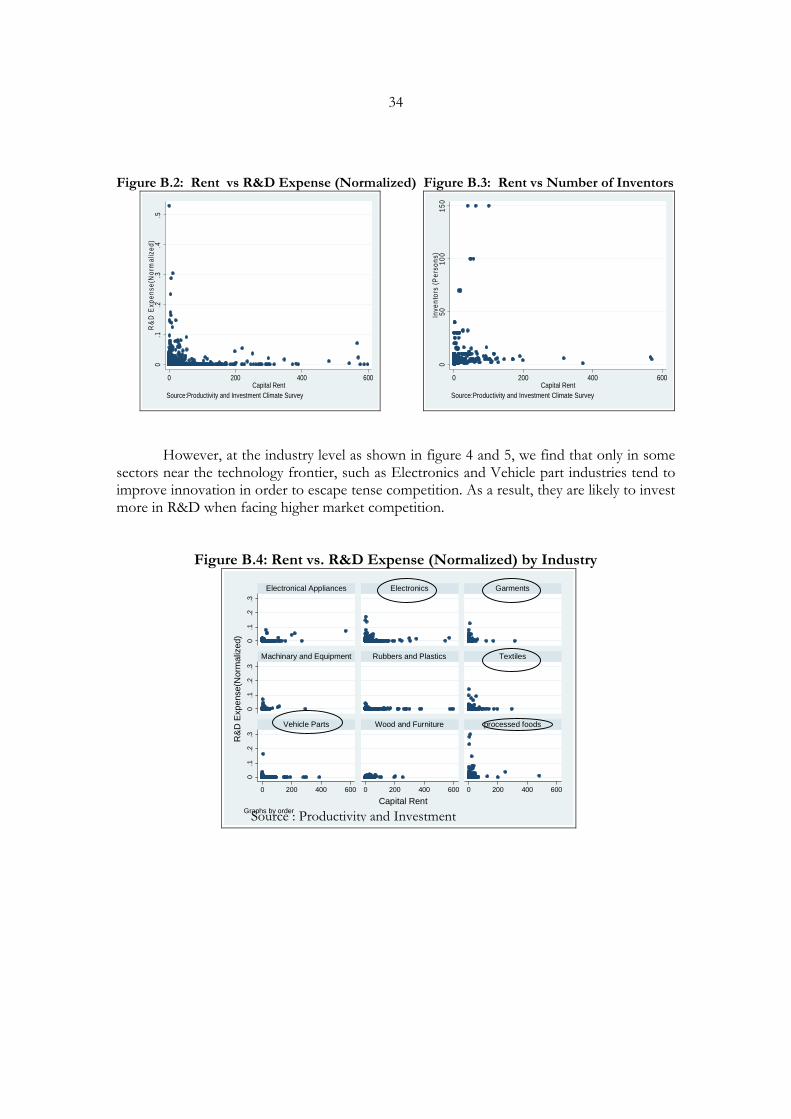
34
Figure B.2: Rent vs R&D Expense (Normalized) Figure B.3: Rent vs Number of Inventors
0.1
.2.3
.4.5
R&
D E
xpen
se(N
orm
aliz
ed)
0 200 400 600Capital Rent
Source:Productivity and Investment Climate Survey
050
100
150
Inve
ntor
s (P
erso
ns)
0 200 400 600Capital Rent
Source:Productivity and Investment Climate Survey
However, at the industry level as shown in figure 4 and 5, we find that only in some sectors near the technology frontier, such as Electronics and Vehicle part industries tend to improve innovation in order to escape tense competition. As a result, they are likely to invest more in R&D when facing higher market competition.
Figure B.4: Rent vs. R&D Expense (Normalized) by Industry
0.1
.2.3
0.1
.2.3
0.1
.2.3
0 200 400 600 0 200 400 600 0 200 400 600
Electronical Appliances Electronics Garments
Machinary and Equipment Rubbers and Plastics Textiles
Vehicle Parts Wood and Furniture processed foods
R&D
Exp
ense
(Nor
mal
ized
)
Capital RentGraphs by order
Source : Productivity and Investment

35
Figure B.5: Rent vs. Number of Inventors
050
100
150
050
100
150
050
100
150
0 200 400 600 0 200 400 600 0 200 400 600
Electronical Appliances Electronics Garments
Machinary and Equipment Rubbers and Plastics Textiles
Vehicle Parts Wood and Furniture processed foodsInve
ntor
s (P
erso
ns)
Capital RentGraphs by order
The ownership of copyrights and patent laws could be regarded as incentives for firms to improve innovation. However, in Figure 6, we find that only in some industries, for instance, Electrical Appliances and Machinery & Equipment, significantly show that they are likely to benefit from these laws, and hence, increase investment in R&D if copyrights and patent laws are strengthened.
Figure B.6: Copyrights Law and R&D Investment
Electronical Appliances Electronics Garments
Machinary and Equipment Rubbers and Plastics Textiles
Vehicle Parts Wood and Furniture processed foods
YES NO
Graphs by order
According to our findings, copyrights and patent laws are factors that can affect
firms’ decision in R&D investment. Hence, it is crucial that appropriate policies be implemented by policy-makers in order to motivate firms to innovate. Successful policies will eventually give rise to a healthy competitive environment as well as result in the enhancement of firms’ efficiency in the long run.
Source : Productivity and Investment
Source : Productivity Investment Climate Survey
Do firms invest in R&D More if Copyright Laws are Strengthened?