strategies to keep public transport affordable · 2020-02-13 · system like bmtc, fare income can...
TRANSCRIPT

Strategies to Keep Public Transport
Affordable
Balancing Affordability V/s Sustainability
Gautam Patel Founder and Principal Consultant
Coordinates ConsultingAhmedabad

Contents
02 Affordability
03 Sustainability
04 Towards Solutions
01 The Crisis

Rising City Sizes
• Underestimation of Urban Populations
• Run-away agglomerations of City Economies
Longer Trip Lengths
• Poor Decentralised Land Use / Renewal
• Rise of CBDs on peripheries
Higher Expense on
Transit
• Rising Fares
• Absence of integration
• High Interchange and last mile costs
Poor Affordability
The Crisis in PT Financing : Affordability V/s Sustainability
Occupancy Issue of Shared Transit
Sustainability Pressures on
Transit Systems
Absence of Planned Funding
for Capacity Creation in PT
Need to make Transit Affordable without compromising Financial Sustainability
Impact on Ridership

Affordability in Public Transport

India Ranked Second in Household Spending on Transport related Expense (15%)
• In the expenditure basket, Indian households spend highest onfood followed by transport
• Higher spending on transport leads to lower spending onaccess housing, health and education and hampering inclusivegrowth of the society.
• This necessitates need for Affordable Transport System.
Household Spending as a % of Total, 2013
Transport
Crisis
Affordability Sustainability Solutions
Sou
rce:
Eu
rost
at,
Dir
ecto
r G
ener
al o
f Eu
rop
ean
Co
mm
issi
on
30.5
10.5
15
3
7.3
4
2.5
Overall, the working definition of affordable transport is that expenditure on transport should be not hgiher than 10-15% of household expenditure.

City Monthly Income (Rs. pm)(As per Minimum Wages)
Average Trip Length (KM)**
Fare required to travel average trip length
Monthly Expenditure on
PT (Rs.)
% of Transportation expenses over Total income
Skilled Manpower
Unskilled Manpower PT Mode
Fare (Rs per Trip)
Skilled Manpower Unskilled Manpower
Delhi 16848 13884 14 Bus (Non AC) 15 1170 7% 8%
Bus (AC) 25 1950 12% 14%
Metro 40 3120 19% 22%
Bangalore 14704 12271 12 Non AC Bus 23 1794 12% 15%
AC Bus (Suvarna) 251950
13% 16%
AC Bus (Vajra) 50 3900 27% 32%
Ahmedabad 8559 8112 10 BRTS 20 1560 18% 19%
City Bus 12 936 11% 12%
Premium PT services are beyond reach for lower income group
*Source: Minimum wage Notification of Delhi, Karnataka and Gujarat as on April, 2018, **Source: Census 2011 and adjustments
• 3 trips per person assumed since each person has at least some non-working dependents who also travel.
• Except in case of Non AC Buses services in Delhi, lower income group needs to spend more than 10% of their monthlyincome on Non Premium Transportation Services.
• Largely, the access to PT for even those earning just minimum wages remains elusive.
Affordability Sustainability Solutions

Share of Income spent on Integrated Journeys for PT for different income classes
Transport
Crisis
Affordability Sustainability Solutions
https://www.statista.com/statistics/658423/share-of-annual-income-in-bengaluru-india/
• In Delhi, for the lowest twoquintiles, the cost is higher thanthe affordable level of 15%.
• Buses in Bangalore are moreexpensive than Delhi inaffordability terms.
• For the high earning classes, thetwo quantiles of people inBangalore and Delhi are spendingapproximately the same from theirwages. (Category 5 & 6)
* Rounding to Nearest 100
*integrated cost of travel assumed to be 25% higher than cost of travel by main mode like bus/rail alone.”
Delhi
Avg. Monthly Income (2015) *
Distribution of income classes
share of income spent on Non AC
Bus
Share of Spending on DTC
Share of Spending on DMRC
< 4100 17% 36% 59% 95%
6,300 to 12,500 17% 16% 26% 41%
12,500 to 25,000 17% 8% 13% 21%
25,000 to 42,000 12% 4% 7% 12%
42,000 to 85,000 14% 2% 4% 6%
>85,000 23% 2% 3% 5%
Bangalore
Avg. Monthly Income (2015) *
Distribution of income classes
share of income spent on Non Ac
Bus
Share of Spending on AC Bus ( Suvarna)
Share of Spending on AC Bus (Vajra)
< 4100 12% 55% 59% 119%
6,300 to 12,500 16% 24% 26% 52%
12,500 to 25,000 19% 12% 13% 26%
25,000 to 42,000 11% 7% 7% 15%
42,000 to 85,000 15% 4% 4% 8%
>85,000 28% 3% 3% 6%

0.219
0.541
0.560
0.684
0.699
0.756
0.762
0.769
1.006
1.026
1.073
1.074
1.083
1.205
1.210
1.276
1.362
1.420
1.445
1.461
1.497
1.548
1.551
1.564
1.593
1.616
1.671
1.774
1.846
1.853
2.097
2.458
2.516
2.833
2.833
3.000
3.003
BeijingNanjing
Mexico CityGuangzhouNew Castle
Buenos AriesBrussels
LisbonVancouver
ShanghaiOslo
MadridShenzhen
SanfranciscoParis Metro / RER
MontrealMoscow
DubaiHong Kong
SeoulDelhi
TorontoNew yorkBarcelonaSingapore
TaipeiIstanbul
SantiagoKuala Lumpur
Sao PauloRio de Jeneiro
SydneyBangkok
London UndergroundLondon DLR
Washington, DCBerlin
Comparison of Fare of Members of Comet- Nova Metro System using Purchasing Power Parity for 10 KM Fare (USD)
Source : Fare derived from websites of different Metro Systems , CSE Analysis
• Prominent Metro system such as Beijing, Brussels,Guangzhou have fare less than 1 USD consideringaffordability.
• Affordability plays an important role in decidingfare. For instance Delhi Metro witnessedsignificant decline of 4.3 lakh daily ridership postfare hike in 2017 (91% hike over 2009 prices).
• Attempt to meet debt servicing plus assetreplacement requirement through fare revenueled to significant increase in fares which causedsignificant decline in ridership.

Co
st P
er K
M
Travel Distance (km)
Chart Title
Travel Distance (km)
Considering DMRC costs including last mile costs *
DMRC Fare as per 2017 DTC Ordinary DTC AC Auto Car 2W
0.00
2.00
4.00
6.00
8.00
10.00
12.00
14.00
0 5.0 10.0 15.0 20.0 25.0 30.0 35.0 40.0 >44
Chart Title
Last mile by DMRC
DTC AC busDTC Ordinary bus
DMRC
2W
Auto
Two wheeler economical than metro up-to 32 km.
Car is economical than metro up-to 7 km.
( Rs. 2.04. Per Km )
DMRC Fares
DTC AC Bus Fares
DTC Ordinary Bus Fares
2W
Car
4W
Delhi: Travel Cost per Km by different modes
Travel Distance (Km)
Co
st p
er
Km
Integrated Cost per Km using marginal cost of Car and Two Wheeler*
* Extra 25% cost is added for last mile connectivity For Metro to Calculate Integrated Cost
* 2W assumptions : Capital Cost : Rs. 60,000 ; Petrol Price Rs. 78.75 per litre . FE- : 40 km/litre ; . Maintenance – Rs. 1000 pa ; Life span - 7Yrs.* Car : Capital cost -Capital Cost : Rs 5 lakh;. FE- : 12 km/litre ; . Maintenance – Rs. 7000 pa ; Life span – 2 lakh km
Car ( Rs. 6.02 Per Km )
Avg. Trip Length= 14 Kms.
Affordability Sustainability Solutions
Two wheeler is more economical than
DTC AC buses up-to 7.5 kms.
Similarly, 2W is cheaper than BMTC Ordinary Bus up- to 13.5 km.

AffordabilityConcerns
Case Study : Singapore
How much do wespend on transportfares as part of ourhousehold income?
• Affordability Indicator = Monthly household expenditure of the household on public transportMonthly household income of that household group
• Cost burden of public transport on the low income households, as aproportion of their overall household incomes, has lessened over the Last10 years.
Source:PTC
Continued……………………………..
Transport
Crisis
Affordability Sustainability Solutions

Source: Rodríguez Hernández and Peralta-Quiros - Balancing financial sustainability and affordability in public transport , Case of Bogota, OECD Discussion Paper 2016
Global Practices in Funding PT : Bogota Model
Transport
Crisis
Affordability Sustainabilit
y
Solutions
• Bogotá’s 2014 Multi-Purpose Survey gave information of poorest householdsand what they spent on transit. They were found to be spending a greaterproportion on transport, between 16% to 27% of their incomes, compared to amaximum of 4% in relatively richer areas.
• Targeted social group identified were therefore identified using wider SISBENsystem
• SISBEN utilizes a proxy-means surveys to determine an individual’s eligibility forassistance. Surveys compose data on socioeconomic indicators—or proxies—(household demographic composition, marital status, education, employment,income, possession of goods and assets, and dwelling characteristics) toestimate household welfare needs.
• Price Elasticity Analysis was done in the poorest neighbourhood to determinewhat should the extent of subsidy. Impact of proposed price subsidy wasanalysed in terms of impact on income and costs.
• Subsidized Pricing at USD 0.5/ride instead of USD 0.79/ride offered usingtransit discount cards.

Global Practices in Funding PT : Latin America Models for Subsidy
Transport
Crisis
Affordability Sustainabilit
y
Solutions
• Bogota, Santiago and Brazil : Targeted subsidies to groupsidentified through surveys and point systems through TransitDiscount Cards
• Vale-Transporte in Brazil : Transit costs are capped at 6% ofincome. Any excess beyond this is re-imbursed by employersto the transiting employees as a tax deductible expense.
• Rio De Janerio and Bogota : Free Feeder Buses and Cable Carsin poorer areas for providing last mile connectivity to mainsystem.
• Around the world : Subsidised Fares for Students, SeniorCitizens, War Veterens and others . Employer tax in france.

• Affordability as understood globally is not used as a input or a capping parameter infare revisions In India. As a result, for large sections of our population, particularlythe lower income groups, PT is becoming unaffordable.
• Fare Revision mechanisms are still evolving around the world, but while India hasproudly adopted best practices in metros in technical areas, our fare revisionpractices need improvements
Affordability – Some conclusions
Some Conclusions
But yet more questions
• If Affordability needs to be accounted for, how will it affect financial sustainability ofthe PT system?
• If it affects it adversely, what could be the policy response or mechanism foraddressing such issues?
Affordability Sustainability Solutions

Sustainability of Public Transport

What Transport Sustainability means
• Financial Sustainability of a transport systemcould be defined as the ability of a transportsystem to plan and provide for meeting itscapacity addition and operation expensesdrawing this from all beneficiaries of thesystem including non-users.
• At the crude level, it means expenditure isbalanced with revenues.
Transport
Crisis
Affordability Sustainabilit
y
Solutions

0
1000
2000
3000
4000
5000
6000
7000
0
1000
2000
3000
4000
5000
6000
7000
Chart Title
Operating Expenditure Fare revenue
Is Fare revenue able to recover the Operating expense?
Transport
Crisis
Affordability Sustainabilit
y
Solutions
Forecasted
considering Fare hike
Source: DMRC 4th FFC Report, 2016
Huge operatingsurpluses projected willbe generated due tofare hike. (Impact of lossin ridership notconsidered)
“ DMRC will be able toincrease depreciationcover up to 45% by2022” - 4 th FFCReport.
Showing an attempt torecover capital expensesfrom operatingsurpluses
Sudden
approximately
Septrevision
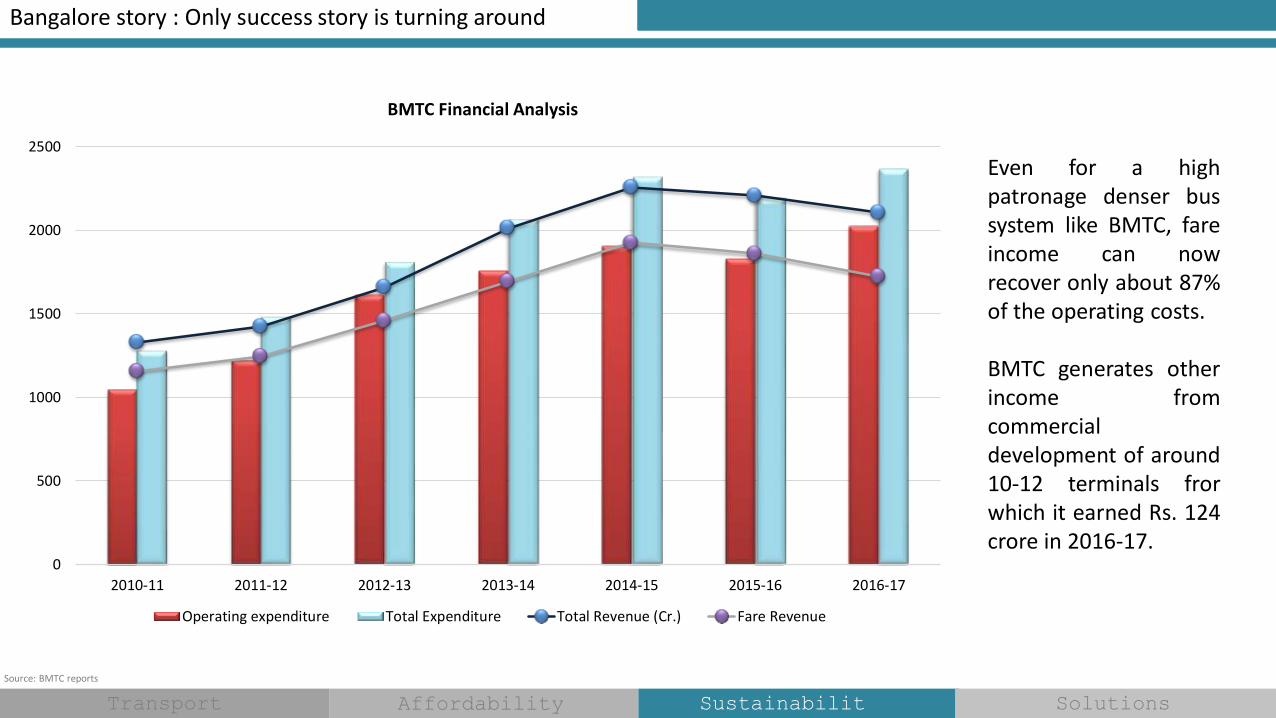
Bangalore story : Only success story is turning around
Transport
Crisis
Affordability Sustainabilit
y
Solutions
Source: BMTC reports
Even for a highpatronage denser bussystem like BMTC, fareincome can nowrecover only about 87%of the operating costs.
BMTC generates otherincome fromcommercialdevelopment of around10-12 terminals frorwhich it earned Rs. 124crore in 2016-17.
0
500
1000
1500
2000
2500
2010-11 2011-12 2012-13 2013-14 2014-15 2015-16 2016-17
BMTC Financial Analysis
Operating expenditure Total Expenditure Total Revenue (Cr.) Fare Revenue

Transport
Crisis
Affordability Sustainabilit
y
Solutions
Source: http://www.wrirosscities.org/sites/default/files/BusKaro-Dec11.pdf
AgenciesCPKM (Rs.)
EPKM (Rs.)
Viability Gap
Ahmedabad MTS 58.38 26.56 -31.82
The Brihan Mumbai Electric Supply &Transport Undertaking (BEST)
77.53 53.75 -23.78
Bangalore Metropolitan Transport Corporation (BMTC) 36.99 35.42 -1.57
Chandigarh Transport Undertaking (CTU) 47.55 30.64 -16.91
Delhi Transport corporation (DTC) 120.67 37.57 -83.1
Metro Transport Corporation (Chennai) (MTC) 39.76 36.38 -3.38
Navi Mumbai Municipal Transport (NMMT) 45.92 39.51 -6.41
Data: Yr. 2013-14
Our Bus based PT Systems are broke.
Table 3:Select Financial Parameters of SRTUs plying in Metropolitan Cities during 2014-I5
Sr. No.Name of State Road Transport
Undertaking (SRTU)Total Revenue
(Lakhs)Total Cost
(Lakhs)Surplus / Deficits
I Ahmedabad MTS 13,011 35413 -22402
2 BEST Undertakings 150,856 235503 -84647
3 Bangalore Metropolitan TC 225,684 232175 -6491
4 Calcutta STC 7,241 23191 -15950
5 Chandigarh TU 11,107 18139.97 -7033
6. Delhi TC 111,321 510468 -399147
7 Metro TC (Chennai) Limited 137,652 159599 -21947
8 Pune Mahamandal 70,738 87507 -16769
Total (SRTUs plying in metropolitan cities)
727,610 1301995.97 -574386
Share of SRTUs plying in metropolitan cities as proportion of
total reporting SRTUs (%)1029 1488 3425
Even at the aggregate levels, all systems live with deficits.
Source: Review of Performance of SRTUs 2014-15
Operating deficits do not allow for accumulated earnings for capacity creation.
Outsourced operations have brought down the CPKM to around Rs..40-60 / km in some systems, leading to lowering of costs. But EPKMs are still lower,

} Investment in Existing
Networks
}0.2
0
0.4
0.6
0.8
1
1.2
1.4
Commercial Income
Expenditure
Other
Infra, stations , Rolling Stock
Administration
Maintenance
Operations
Fare
Non fare Commercial
Total Operating Expenditure =1
Operating Expenditure
Source: Richard J. Anderson, Improving Fares and funding policies to support Sustainable Metros,2011
Total Operating Expenditure and income from COMET and Nova Metros ( Using data 1994-2009)
How to cover high cost of Construction, Operations, Maintenance?........
Study aggregated financial data from 26member metros across 1994-2008. Key lessons :
• Most metros are barely able to cover theusual Operating expenses (average 11%shortfall) using fare revenues +advertisement/retail.
• Other than usual O&M expenses, recurringcapital investments in existing networks is ahuge expense.
• Other common sources of funding• Concessionary fare support,• Operating revenue gap support and• Capital grants
• Other sources such as Congestion charges inLondon, Employment Tax in France and fuellevy in Canada are have provided dependablecash streams to these metros.
Comet and Novaare metromembershiporganisationscomprising 27members.
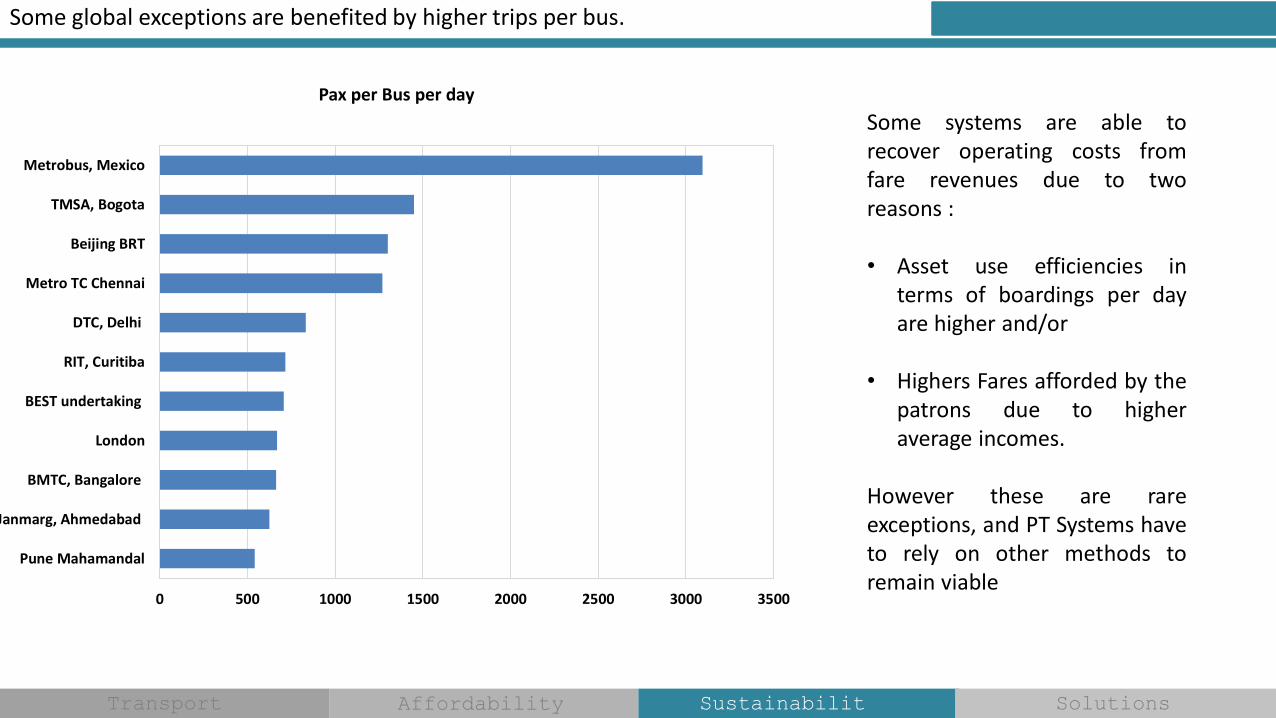
Some global exceptions are benefited by higher trips per bus.
0 500 1000 1500 2000 2500 3000 3500
Pune Mahamandal
Janmarg, Ahmedabad
BMTC, Bangalore
London
BEST undertaking
RIT, Curitiba
DTC, Delhi
Metro TC Chennai
Beijing BRT
TMSA, Bogota
Metrobus, Mexico
Pax per Bus per day
Transport
Crisis
Affordability Sustainabilit
y
Solutions
Some systems are able torecover operating costs fromfare revenues due to tworeasons :
• Asset use efficiencies interms of boardings per dayare higher and/or
• Highers Fares afforded by thepatrons due to higheraverage incomes.
However these are rareexceptions, and PT Systems haveto rely on other methods toremain viable

Operating deficits are evitable in PT operations
• Systems can focus on either higher patronageor higher coverage as a Policy stance.
• Patronage focused systems respond mainly tobusy routes with higher capacity. In such afocus, coverage of sparsely populated areas atthe peripheries suffer.
• Coverage focused systems tend to offerservices to even low density areas withoutregard to ridership.
• Higher coverage leads to lower occupanciesand lead to lower revenues vis-à-vis expenses.
• A conscious policy stance, perhaps towards abalanced approach of both coverage andpatronage needs to be taken, acceptinginevitability of some losses.
The Patronage v/s Coverage trade off
Source: Walker, Jarrett, Purpose-driven public transport: creating a clear conversation about public transport goals, Journal of Transport Geography 16 (2008)Transport
Crisis
Affordability Sustainabilit
y
Solutions

Designing the Solution

Magnitude of Funding required:
Source: DMRC Annual report 2015-16
• Source : 12th Five Year Plan - Working Group onUrban Transport
Nature of Projects Investments (Rs. Crores)
Street Infrastructure 1,67,218
Public Transport 2,02,628
ITS and ATC 8,520
Parking 1,943
Institutions and Capacity Building 5,000
Innovations, R&D & Pilot projects 1,000
NMT and IPT projects 2,000
Total 3,88,308
PT Improvement projects as per CMPs of Cities
Phases Project Cost (Rs crores)
Phase I : Immediate Projects : 2014-2015 125.40
Phase II : Short Term Projects : 2016-2019 549.01
Phase III : Medium Term Projects : 2020-2025
2022.53
Phase IV : Long Term Projects : 2026-2031 3051.99
Total 5748.93
Investments required in Urban Transport
during 12th Five Year Plan
The timidness of the proposals in CMPs show thecities are not yet fully seized of the UrbanTransport crisis facing them.
Transport
Crisis
Affordability Sustainabilit
y
Solutions

Indian Practices in Funding PT : Process
At National/State Level
General budget funding
National level funding (like
JnNURM)
Viability gap funding upto 40% of
the project cost
At Local Level
ULBs own resources
Advertisement
Fare box revenue
Cities identify urban transport projects; essential for improving urban mobility
Feasibility/ Detailed Project Report
Public Funding Non Government Funding
• Grants/ Loans from agencies
such as World Bank/ADB
• Financial Institution/ Banks
• Advertisements
• Commercial development
• PPPs
Poor clarity on policy orprinciples based on whichcities are allocated orsupported for funding. Ad hocmechanisms for each type ofproject.
First time funding for busescame in 2007-09 underJnNURM. Now FAME.
Funding tends to move fromdept to dept (MORTH,MOHUA, DHI)
Generally, larger fundingneeds tend to move up toCentral Govt.
Transport
Crisis
Affordability Sustainabilit
y
Solutions

Indian Practices in Funding PT : Public Sector Metros
ProjectLength
(Km)
Status Total Project
CostGovt. Equity Multilateral Debt Other Sources
Rs. Crore
Kolkata Metro (N-S Corridor
and Extension)16.5 + 8.7 Operational NA 100% Nil Nil
Kolkata Metro (E-W corridor) 13.74 Under Imp. 4676 55%45%
(JICA- ODA)Nil
Delhi Metro (Phase 1) 65.1 Operational
NA
30% 60% (JICA- ODA)10% Sub debt by
GOI
Delhi Metro (Phase 2) 82.11 Operational
44% (Equity,
Internal Acc.,
Property Dev.)
46% (JICA- ODA)10% GOI
Sub debt
Chennai Metro 45 Under Imp. 1460030% (15% GOI
and GOTN each)59% (JICA- ODA)
11%
Sub debt by GOI
& GOTN
Bangalore Metro 41.7Under
Imp/Oper..8156
30% (15% GOI
and GOKN each)45% (JICA- ODA)
25%
Sub debt by GOI
and GOKN
Jaipur Metro 12+23 Operational3151 (Ph I)6581 (Ph II)
43.3% 56.7% (JICA) Nil
Transport
Crisis
Affordability Sustainabilit
y
Solutions

Projects ConcessionaireProject cost VGF
Revenue Share
(pa)Means of Finance
Rs. Crore Equity Debt
Delhi Metro Airport
Express Link (Revenue
Share Model)
JV of Reliance Infra. Ltd.
and Construcciones y
Auxiliar De Ferrocarriles
(CAF) of Spain
TPC Rs. 5700
crore.
Cost for the
concessionaire:
Rs. 2800 Crore
Nil Approx Rs. 51
Crore pa and 1%
to 5% share in
gross revenue
30% 70%
17.25 years Term
loan by
consortium of 8
banks lead by
Axis bank
Hyderabad Metro
(VGF Model)
L&T Metro Rail
(Hyderabad) Ltd.
16378 1458
(9% of TPC)
Nil 21%
(Rs. 3440 Crore)
70%
(Rs. 11480
Crore)
Mumbai Metro - VAG
Corridor
(VGF Model)
Mumbai Metro One
Pvt. Ltd. –JV of Reliance
Energy Ltd and Violia
Transport of France
2356 650
(28% of the
TPC)
Nil 22%
(Rs.513 Crore)
50%
(Rs. 1194 Crore)
Indian Practices in Funding PT : PPP Metros
Transport
Crisis
Affordability Sustainabilit
y
Solutions

Global Practices in Funding PT
1. Using Property Development [Hong Kong/London (partly) ]
2. Govt. supply of capital items or capital costs and outsourcing of transitoperations on GCC to reduce cost (Singapore, London)
3. Congestion Pricing / Property Taxes (London)
4. Direct Subsidies to target groups (Bogota) combined with full pricing oftransit services
5. Paris transit system, RATP, charges local and national governmentsa "compensatory indemnity" for keeping fares below the break-even price.Governments recover this from an employment tax.
6. Land Value Capture
Transport
Crisis
Affordability Sustainabilit
y
Solutions
Transportation Improvement
Increased accessibility to destinations,
lower travel times
Higher Land values
Value capture

Global Practices in Funding PT : Bogota Model
Transport
Crisis
Affordability Sustainabilit
y
Solutions
• Bogota Model is Higher Version of GCC. The entire revenue generated from the system is distributedamong the vendors in proportion to their operational costs through an Escrow arrangement.
• The Payment System in Bogotá is broadly as follows;
• Determination of Technical Fare: Total System Cost per km / Estimated passengers per km.
Total System Cost includes bus operation cost (Trunk + Feeder lines), ITMS cost and FareCollection Cost.
• Technical Fare is paid to operator on per km basis and is revised every six months
• Actual Fare = Technical Fare to start with
• Revision to Technical fare is based on two components
• Change in Inflation of fuel, consumables and Minimum wages decreed by the Govt. fromtime to time
• Change in ridership levels for which, for losses in ridership upto a point, actual fares arerevised to recoup the loss in system revenue
• The risk of change in ridership levels up to a point is thus shared by the operator.
Colombian law (Law 86 of 1989, Article 14) requires that public transport systems operate at self sufficient levels with fares set at “ cost recovery” and that city government does not subsidize the system

Source: DMRC Annual report 2015-16
Global Practices in Funding PT :Transport for London
Transport
Crisis
Affordability Sustainabilit
y
Solutions
Three Sources of TfL Funding
Head Sources
Revenue • Fares from Buses, Tube• Over ground and DLR revenues • Congestion Charging • Cycle Hire • Emirates Cable Car • Commercial Dev and Property Rental • Advertising
Grant • Central Govt.’s Transport Grants• Business Rates • Third Party Funding for Specific Projects
Borrowings • Subject to Local and Central Govt. limits

Global Practices in Funding PT :Transport for London
Transport
Crisis
Affordability Sustainabilit
y
Solutions
TfL Budget for Year 2014-15
Expenditure Income
Service improvments 4.25 Grant Funding 2.73
Cross Rail Funding 1.64
Operating Exp. 6.65 Fares 4.36
Other Income 0.76
Borrowings 1.42
Total Expenditure 10.9 Total Income 10.9
Billion Pounds
• TfL budgets required to be balanced by law • Deficit in Operating Expenditure financed through borrowings.• TfL has unlimited backup to Central Funds as emergency liquidity support by law• Based on budgets such as above, Govt has entered into a multi year Funding Agreement with TfL. • Almost all Capacity additions financed through Grants and Budgets .

Designing the Solution : Identifying the Beneficiaries
• Direct PT Users
• Non PT users who benefit from Lower congestion
- Employers of PT users who benefit since they don’t have to pay higher wages
- Rise in property prices of residents near PT stations
- Education, health and recreation bodies for whose services access is created
• Social services which become accessible
Wider society which benefits from lower pollution, lower accident risk, increased employment opportunities and enhancement of competitiveness and GDP due to augmented productivities.
Transport
Crisis
Affordability Sustainabilit
y
Solutions

OPERATIONS NEW CAPACITY CREATION
Direct Beneficiaries
Indirect Beneficiaries Public Funds
PT Commuter
Private Vehicle
Commuter
Property Owners near
PT
Employers & Business
Tax payer monies
Supported Borrowings
Fares , ads, retail rentals
Fuel Taxes, Parking, Tolls
Property Dev.Land Value Cap., Dev Charges
Employers Tax, Corporate contributions
Funds Allocation under Long Term Commitment
URBAN TRANSPORT FUND
RENEWALS AND ENHANCMENTS

Designing the Solution :Proposed Model for Funding
Dedicated Urban Transport
Fund
–Rs/2lite Green Cess on
Petrol
– UT Levy on private vehicle
–Green cess on existing
private vehicles
–Congestion pricing
–Property development
–TOD / Sale of FAR Vacant
land tax
–Cess on property
transactions
Fixed in affordable and balanced manner through FFC
Funding Needs of Passenger carrying PT Systems
Operations Cost Capital Cost
• Budget supports
• Grants/ Loans from agencies
such as World Bank/ADB/
Financial Institution/ Banks
• Property Development (IF
surplus exists)
Transfers from UTF (25%)
Fare Revenue (50%)
Proximity Value Capture (25%)
–Property development
by UT Authority
– Advertisements
–Station properties
–Sale of given land
– Consultancy
Transport
Crisis
Affordability Sustainabilit
y
Solutions
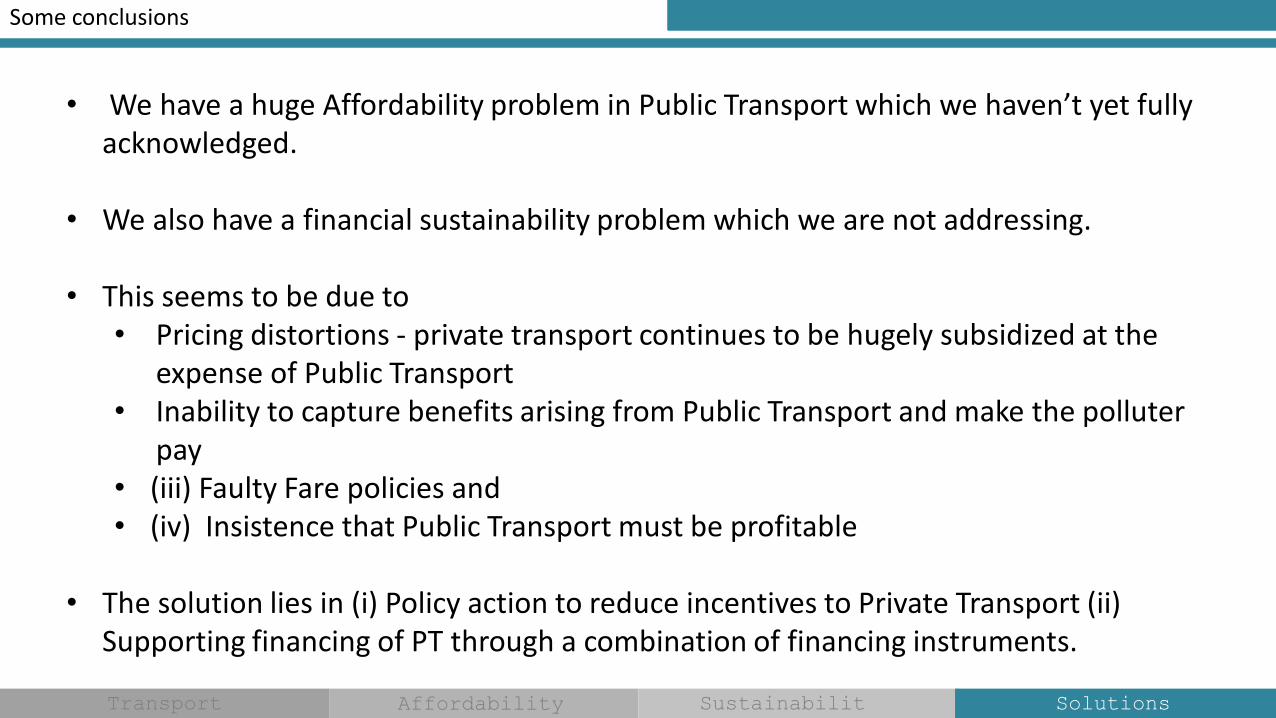
Some conclusions
Transport
Crisis
Affordability Sustainabilit
y
Solutions
• We have a huge Affordability problem in Public Transport which we haven’t yet fully acknowledged.
• We also have a financial sustainability problem which we are not addressing.
• This seems to be due to • Pricing distortions - private transport continues to be hugely subsidized at the
expense of Public Transport• Inability to capture benefits arising from Public Transport and make the polluter
pay • (iii) Faulty Fare policies and • (iv) Insistence that Public Transport must be profitable
• The solution lies in (i) Policy action to reduce incentives to Private Transport (ii) Supporting financing of PT through a combination of financing instruments.

Thank You