the effects of income and fare variation on the …
TRANSCRIPT

1595a
THE EFFECTS OF INCOME AND FARE VARIATION ON THE DEMAND FOR BUS TRANSIT SERVICES IN BRAZIL
Carlos Henrique Ribeiro de CarvalhoRafael Henrique Moraes Pereira
DISCUSSION PAPER

DISCUSSION PAPER
THE EFFECTS OF INCOME AND FARE VARIATION ON THE DEMAND FOR BUS TRANSIT SERVICES IN BRAZIL*
Carlos Henrique Ribeiro de Carvalho**
Rafael Henrique Moraes Pereira**
B r a s í l i a , J u l y 2 0 1 1
1 5 9 5 a
* Paper presented at the 12th WCTR (World Conference on Transport Research), July 2010 – Lisbon, Portugal.** Researcher at the Institute of Applied Economic Research (Ipea), Brazil.

Federal Government
Secretariat of Strategic Affairs of thePresidency of the Republic
Minister Wellington Moreira Franco
Institute for Applled Economic Research
A public foundation linked to the Secretariat of Strategic Affairs of the Presidency of the Republic, Ipea provides technical and institutional support to government actions – enabling the formulation of numerous public policies and programs for Brazilian development – and makes research and studies conducted by its technicians available to society.
PresidentMarcio Pochmann
Director of Institutional DevelopmentFernando Ferreira
Director of Studies and Economic Relations and International PoliciesMário Lisboa Theodoro
Director of Studies and Policies of the State,Institutions and DemocracyJosé Celso Pereira Cardoso Júnior
Director of Macroeconomic Studies and PoliciesJoão Sicsú
Director of Regional, Urban and EnvironmentalStudies and PoliciesLiana Maria da Frota Carleial
Director of Sectoral Studies and Policies,Innovation, Production and InfrastructureMárcio Wohlers de Almeida
Director of Social Studies and PoliciesJorge Abrahão de Castro
Chief of StaffPersio Marco Antonio Davison
Chief Press and Communications OfficerDaniel Castro
URL: http://www.ipea.gov.brOmbudsman: http://www.ipea.gov.br/ouvidoria
DISCUSSION PAPER
A publication to disseminate the findings of research
directly or indirectly conducted by the Institute for
Applied Economic Research (Ipea). Due to their
relevance, they provide information to specialists and
encourage contributions.
The authors are exclusively and entirely responsible for the
opinions expressed in this volume. These do not necessarily
reflect the views of the Institute for Applied Economic
Research or of the Secretariat of Strategic Affairs of the
Presidency of the Republic.
Reproduction of this text and the data it contains is allowed
as long as the source is cited. Reproductions for commercial
purposes are prohibited.
ISSN 1415-4765
JEL: R4, R41, R48. H2, H25, H21, H24.
H3, H31, H32.

SUMMARY
ABSTRACT
SINOPSE
1 INTRODUCTION ........................................................................................................7
2 COST STRUCTURE OF URBAN BUS FARES..................................................................8
3 THE EVOLUTION OF BUS FARES AND POPULATION INCOME BETWEEN 1995 AND 2008 .......................................................................14
4 FARE AND INCOME ELASTICITIES OF DEMAND FOR BUS TRANSIT SERVICE .....................................................................................19
5 CONCLUSIONS........................................................................................................24
REFERENCES ..............................................................................................................26

ABSTRACT
The public policies on mass transit and other economic policies have been unable to avoid increasing mass transit costs and urban bus fares, which places a burden on a majority of the population depending on public transit. This study analyzes the variations in urban bus fares and households income, as well as their effects on the demand of paying commuters in 9 large Brazilian cities between 1995 and 2008. The study shows that a gap between the rise of urban bus fares and the population’s income led to a decrease of more than 30% of the paying demand between 1995 and 2003. According to the price elasticity estimated in this study, the demand for bus services has exhibited elastic behavior since 2001. Since then, the gradual increase observed in population income seems to buffer against the persistent fare increases. The recovery of the average household per capita income since then seems to support a reversal of downward trends in the number of paying passengers and an increase access to public bus services. The number of paying passengers increased about 9.5% between 2003 and 2008.The evolution of the sector’s main costs complement the study, permitting an analysis of the many factors that have caused the continuous increases of bus fares in metropolitan Brazil during this period. The study concludes highlighting some public policies that could provide a better economic environment for the provision of efficient and affordable transit services.
SINOPSE
Este estudo analisa as variações nas tarifas de ônibus urbanos e na renda das famílias entre 1995 e 2008, avaliando seus efeitos sobre a demanda de passageiros pagantes nas nove maiores cidades brasileiras. Observou-se que o aumento dos preços de alguns dos principais itens que compõem a estrutura de custos do setor contribuiu para um aumento das tarifas em cerca de 60% acima da inflação medida pelo Índice Nacional de Preços ao Consumidor (INPC). Ao longo desse período, o aumento no preço das tarifas foi absorvido com diferentes intensidades pela demanda de passageiros pagantes, podendo-se destacar dois períodos: o primeiro, quando houve aumento das tarifas acompanhado por uma depreciação da renda das famílias, entre 1995 e 2003, culminando com a queda de mais de 30% da demanda de transporte público urbano (TPU); e o segundo, ocorrido desde meados de 2003, quando o aumento dos custos permaneceu, mas houve certo amortecimento dos seus efeitos sobre a demanda devido ao crescimento da renda da população. Isso refletiu na estabilização da demanda do

TPU e, mais recentemente, na inversão da tendência de queda observada anteriormente. O estudo busca reacender o debate sobre políticas de melhoria e redução dos custos do transporte público de forma a aproveitar o atual contexto econômico do país em que se faz possível aproveitar as condições gerais da economia para dar uma trajetória mais sustentada à recuperação do transporte público.

Discussion Paper1 5 9 5 a
7
The Effects of Income and Fare Variation on the Demand for Bus Transit Services in Brazil
1 INTRODUCTION
The fast urbanization process in Brazil during the last 60 years has contributed to the consolidation of socio-economic inequalities in the development of urban areas. The lower classes occupy most of these segregated suburban areas in which transportation plays a central role. The public policies on mass transit and other economic policies have been unable to avoid increasing mass transit costs and urban bus fares, which places a burden on a majority of the population depending on public transit. The rise of these costs can undermine the financial management of operating companies, the quality of services and full access of poor people to these services, primarily during times when family incomes are decreasing.
The decreased purchasing power of minimum wage as compared to urban bus fares was observed between 1995 and 2003. This decrease is closely related to a decreased number of paying passengers1 occurring in the same period when examining operating bus transit systems in 9 large Brazilian cities.2 Despite a persistent rise in Brazilian urban bus fares during the last 15 years, available data point to a reversal of the downward trend in passenger numbers observed since the beginning of 2003. This inversion seems to be motivated by the recovery of the purchasing power of minimum wage and rising average per capita income.
This study aims to analyze the variations in urban bus fares and households income and analyze their effects on the demand of paying commuters in 9 large Brazilian cities during the last 15 years. The evolution of the sector’s main costs complement the study, permitting an analysis of the many factors that have caused the continuous increases of bus fares in metropolitan Brazil during this period.
The next section of this paper analyzes the structure of urban bus fares by evaluating the influence of each component on its final price. This analysis quantifies the factors of continuous bus fare increases in metropolitan Brazil during the last 15 years.
1. Brazilian laws guarantee to some users the right to use public transport without paying for it. For instance, one of this law applie to people over 65 years old, who have that right written in Brazil’s constitution.
2. Belo Horizonte, Curitiba, Fortaleza, Goiânia, Porto Alegre, Recife, Rio de Janeiro, Salvador e São Paulo.

8
B r a s í l i a , J u l y 2 0 1 1
The study also shows that a gap between the rise of urban bus fares and the population’s income led to a decrease of more than 30% of the paying demand between 1995 and 2003. A closer analysis of population income also suggests that, while fare prices are still rising, recovery of the purchasing power of minimum wage and general household income since 2003 has increased the population’s access to public bus services.
Considering all factors, the study suggests that the recovery of the purchasing power of minimum wage occurring since 2003 alone cannot sustain continuous growth of the number of bus passengers. A combination of many factors, such as the intensification of automobile-oriented policies (i.e., the recent reduction of automobile taxes) and the lack of policies promoting fare reduction in urban public transportation, ends up causing serious mobility problems in large Brazilian urban areas.
2 COST STRUCTURE OF URBAN BUS FARES
In Brazil, the costs of public bus transportation are covered exclusively by fare revenue. The bus transport system in the city of São Paulo is an exception, which covers about 20% of its costs with municipal budget resources.3 The final calculation of bus fare is an apportionment of the total transportation system cost among paying passengers (incorporating different fare levels).4
In systems without subsidies, as in most Brazilian cities, market equilibrium is reached when bus fare charged to paying passengers ensures revenues equal to the total cost of the system during a given time period. This calculation is usually based on mileage, that is, the mileage cost divided by the IPK5 of the system. Thus, the rise in any
3. This percentage varies from month to month, according to the expense and receipts reports disclosed by SPTrans <www.sptrans.com.br>, São Paulo agency for public transportation by bus.
4. For a theoretical review of public transport charging in Brazil, see the study of Lima (1992).
5. IPK is the Passenger per Kilometer Index. It is calculated as the mean number of paying passengers transported per kilometer and reflects a proxy for productivity.

Discussion Paper1 5 9 5 a
9
The Effects of Income and Fare Variation on the Demand for Bus Transit Services in Brazil
transport input costs and the fall of service demands (or IPK) can both lead to financial imbalance of the transportation system, which tends to recover by raising fares.6
From 1995 to 2003, the demand for urban bus transport fell over 30% in 9 major national cities. The number of paying passengers per month in these cities dropped from 445,373 million in September 1995 to 299,107 million in September 2003. Main transport input costs have also been rising since 1994, which is reflected in the persistent increase of urban bus fares in Brazil during the last 15 years. As Figure 1 shows, public bus transportation fares in Brazil have increased about 60% above inflation since 1995, as measured by INPC.7
FIGURE 1Evolution of Inflation (INPC), urban buses and subway fares from 1995 to 2008 in Brazil’s Metropolitan Areas8 – Index Number
0,5
1
1,5
2
2,5
3
3,5
4
Sep
t./1
995
Mar
./199
6
Sep
t./1
996
Mar
./199
7
Sep
t./1
997
Mar
./199
8
Sep
t./1
998
Mar
./199
9
Sep
t./1
999
Mar
./200
0
Sep
t./2
000
Mar
./200
1
Sep
t./2
001
Mar
./200
2
Sep
t./2
002
Mar
./200
3
Sep
t./2
003
Mar
./200
4
Sep
t./2
004
Mar
./200
5
Sep
t./2
005
Mar
./200
6
Sep
t./2
006
Mar
./200
7
Sep
t./2
007
Mar
./200
8
Sep
t./2
008
Ind
ex n
um
ber
(Se
pt.
/199
5 =
1)
Inflation (INPC) Bus fares metro fares
Source: authors’ elaboration with INPC data (IBGE – Brazilian Institute of Geography and Statistics).
6. For a more detailed look at the diversity of regulation and remuneration models for public transportation services in some Brazilian cities, see the study by Azambuja (2002) and the study by Gomide, A. A. (2004). Economic regulation and organization of urban public transport in Brazilian cities: case studies: final report. Brasília: Ipea and the Ministry of Cities. [in Portuguese].
7. INPC (in Portuguese) is the National Index of Consumer Prices monthly calculated by Brazilian Institute of Geography and Statistics (IBGE). It reflects price evolution in the 10 largest metropolitan areas of the country (Belém, Fortaleza, Recife, Salvador, Belo Horizonte, Rio de Janeiro, São Paulo, Curitiba, Porto Alegre, Brasília) plus the city of Goiânia.
8. In this study, we understand that ‘Brazil’s Metropolitan Areas’ includes only the 10 most important Metropolitan Areas in the country (Belém, Fortaleza, Recife, Salvador, Belo Horizonte, Rio de Janeiro, Sao Paulo, Curitiba, Porto Alegre, Brasília).

10
B r a s í l i a , J u l y 2 0 1 1
The rise in railway system fares also overtook inflation between 1995 and 2008 but was still lower than the rise in bus fares. An explanation is that, unlike urban bus systems (which obtain remuneration exclusively through fares), the urban metropolitan railway systems are largely subsidized by the state. While government participation in the financial management of urban trains poses accounting challenges for public finances, it also ensures that these transportation systems adopt less aggressive pricing evolution. As a result, trains can gain market share more easily than bus services.
The National Secretariat for Urban Development (SEDU in Portuguese) was formerly the government agency responsible for federal urban transportation policies. SEDU recognized in 2002 that higher prices were the central problem that hindered competitiveness in public transport services as compared with informal and private transport. Despite two federal government proposals (in 2002 and 2006)9 and pressure from other sectors of Brazilian society to reduce the tax burden on urban bus services, the persistent rise of bus fares was not addressed by any effective federal policy.
Like general market dynamics, a bus fare increase causes demand to decrease, which in turn generates new fare increases in an attempt to recover the system’s revenue and cost balance. This is the vicious cycle experienced by the urban transportation sector in the last decade, compounded by heavy cost pressures from its inputs, as described below.
Table 1 shows the average cost structure of the major Brazilian urban bus systems. The two main components representing more than half of total service costs are fuel and labor (which includes wages, Social Security and other payroll taxes). The cost of vehicles is included in Depreciation and Compensation, which together represent about 8% of the total cost.
9. According to Gomide (2008), the official proposals for exemption of urban transport were drawn by SEDU (with a publication in 2002 called ‘National Policy for Urban Transport’) and by the Urban Mobility Secretariat of the current Ministry of Cities (with a publication in 2006 called ‘ Proposal for a cheapening of rates of urban public transport’).

Discussion Paper1 5 9 5 a
11
The Effects of Income and Fare Variation on the Demand for Bus Transit Services in Brazil
TABLE 1Average cost structure of urban bus fares – Brazil, 2008
Components cost Portion of the bus fare (%)
Labor Force (include wages, Social Security and other payroll taxes) 40 a 50
Fuel 22 a 30
Taxes and fees 4 a 10
Administrative expenses 2 a 3
Depreciation 4 a 7
Company remuneration 3 a 4
Lubricants 2 a 3
Parts and accessories 3 a 5
Source: authors’ elaboration based on data from the Ministry of Transport and National Association of Urban Bus Transport Companies (NTU in Portuguese).
The main component of bus fare pricing is the labor expense. The urban transport sector is labor-intensive and incurs a large amount of social security expenses. In a sense, these expenses make the problem worse because the contribution base for social security is the payroll, rather than the company’s turnover.10
The second major cost component of urban bus fares is diesel fuel, which accounts for about 28% of total costs. Bus fares get even more expensive due to the high tax burdens of indirect taxes such as ICMS and CIDE, which raise diesel prices by at least 40%.11 Direct taxes on bus services are the third largest cost component, accounting for 9% of the total fare cost. These include taxes like Pis, Cofins, and ISS.12
2.1 EVOLUTION OF TRANSPORT PRIMARY INPUT PRICES
The recent price evolution of the transport sector’s primary inputs gives us some insight into bus fare trends. Since opening its oil market in the late 1990s and gradually moving
10. In recent years, there has been some discussions inside the government about taking companies’ turnover as the contribution basis for social security in order to relieve the cost of hiring staff in Brazil, which would have important benefits for the transport sector.
11. Both in Portuguese, ICMS (Tax on Circulation of Goods and Services) and CIDE (Contribution for Intervention in the Economic Domain) are a federal and a state tax, respectively.
12. All in Portuguese, PIS (Social Integration Program), COFINS (Contribution for Social Security Financing) and ISS (Tax over Services).

12
B r a s í l i a , J u l y 2 0 1 1
public subsidies to diesel, the fuel prices in Brazil’s domestic market has increased 70% during the last 15 years (adjusted for inflation). In addition, trade policies in the fuel sector have more effectively contained gasoline prices since 2002 as compared to diesel prices (see Figure 2). As a result, the share of fuel expenses in the total cost of public transport rose from approximately 10% to 20%. This rise in public transportation costs restrains the mobility of the poorest populations and stimulates the use of private transportation, all while lowering the use of collective means.
FIGURE 2Evolution of gasoline and diesel prices from 1999 to 2009 in Brazil’s Metropolitan Areas – Index Number
0,8
1
1,2
1,4
1,6
1,8
2
Jul./1
999
Jan./2
000
Jul./2
000
Jan./2
001
Jul./2
001
Jan./2
002
Jul./2
002
Jan./2
003
Jul./2
003
Jan./2
004
Jul./2
004
Jan./2
005
Jul./2
005
Jan./2
006
Jul./2
006
Jan./2
007
Jul./2
007
Jan./2
008
Jul./2
008
Jan./2
009
Jul./2
009
Ind
ex n
um
ber
(Ju
l./19
99 =
1)
Gasoline Diesel
Source: authors’ elaboration with INPC data (IBGE).
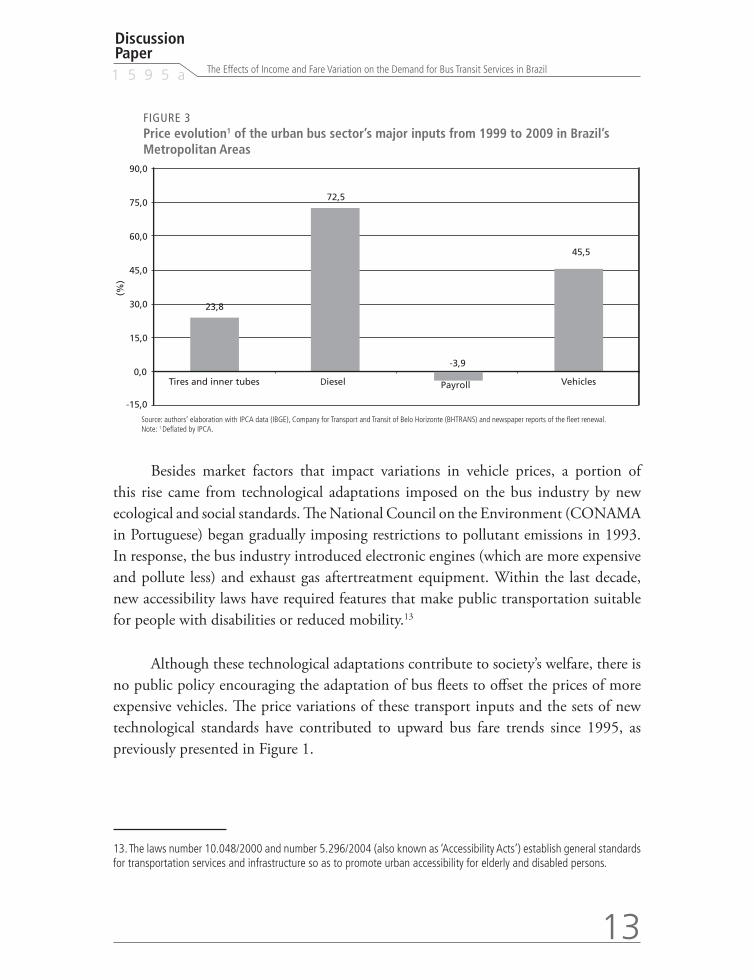
Figure 3 shows the price evolution of the major inputs in the urban bus sector, deflated by the official IPCA inflation index (broad consumer price index in Portuguese). With the exception of payroll, which remained virtually at the same level, other inputs significantly increased in price over the past 10 years. Since companies have no control over exogenous costs variations (such as fuel and vehicles), their efforts to rebalance bus system finances are based on administrating endogenous costs through controlling wages, rationalizing bus routes and managing fleet renewal rates.
Discussion Paper1 5 9 5 a
13
The Effects of Income and Fare Variation on the Demand for Bus Transit Services in Brazil
FIGURE 3Price evolution1 of the urban bus sector’s major inputs from 1999 to 2009 in Brazil’s Metropolitan Areas
23,8
72,5
-3,9
45,5
-15,0
0,0
15,0
30,0
45,0
60,0
75,0
90,0
Tires and inner tubes Diesel Payroll Vehicles
(%)
Source: authors’ elaboration with IPCA data (IBGE), Company for Transport and Transit of Belo Horizonte (BHTRANS) and newspaper reports of the fleet renewal.Note: 1 Deflated by IPCA.
Besides market factors that impact variations in vehicle prices, a portion of this rise came from technological adaptations imposed on the bus industry by new ecological and social standards. The National Council on the Environment (CONAMA in Portuguese) began gradually imposing restrictions to pollutant emissions in 1993. In response, the bus industry introduced electronic engines (which are more expensive and pollute less) and exhaust gas aftertreatment equipment. Within the last decade, new accessibility laws have required features that make public transportation suitable for people with disabilities or reduced mobility.13
Although these technological adaptations contribute to society’s welfare, there is no public policy encouraging the adaptation of bus fleets to offset the prices of more expensive vehicles. The price variations of these transport inputs and the sets of new technological standards have contributed to upward bus fare trends since 1995, as previously presented in Figure 1.
13. The laws number 10.048/2000 and number 5.296/2004 (also known as ‘Accessibility Acts’) establish general standards for transportation services and infrastructure so as to promote urban accessibility for elderly and disabled persons.

14
B r a s í l i a , J u l y 2 0 1 1
Another important element to consider when analysis bus fares trends is the decline in the number of paying passengers between 1995 and 2003. This decline may have caused fares to rise even more since bus fares are calculated by an apportionment of total system costs and the total number of paying passengers. Figure 4 suggests that urban bus systems in Brazil during this period experienced a vicious cycle in which rising fares reduced the number of paying passengers, in turn reducing fare revenues appreciating fare unit costs, causing further reductions in demand, and so on.
FIGURE 4Evolution of Inflation (INPC), urban buses fares and number of paying passengers14 from 1995 to 2008 in Brazil’s Metropolitan Areas – Index Number
0,5
1,0
1,5
2,0
2,5
3,0
3,5
4,0
Sept
./199
5 M
ar./1
996
Sept
./199
6 M
ar./1
997
Sept
./199
7 M
ar./1
998
Sept
./199
8 M
ar./1
999
Sept
./199
9 M
ar./2
000
Sept
./200
0 M
ar./2
001
Sept
./200
1 M
ar./2
002
Sept
./200
2 M
ar./2
003
Sept
./200
3 M
ar./2
004
Sept
./200
4 M
ar./2
005
Sept
./200
5 M
ar./2
006
Sept
./200
6 M
ar./2
007
Sept
./200
7 M
ar./2
008
Sept
./200
8
Ind
ex n
um
ber
(Se
pt.
/199
5 =
1)
Bus fares
Number of paying passengers (NTU)
Number of paying passengers (IDET/CNT/Fipe)
Inflation (INPC)
Source: authors’ elaboration with INPC data (IBGE), 2008 Statistical Yearbook (NTU) and Index of Economic Performance of Transport (IDET-CNT/FIPE).
3 THE EVOLUTION OF BUS FARES AND POPULATION INCOME BETWEEN 1995 AND 2008
It is widely accepted in Brazil that the pricing policy of public transport services must cover their costs and be efficiency-oriented. Nevertheless, it is also important to consider
14. Available data on the number of paying passengers capture only the passengers transported in the 9 largest Brazilian cities of those 10 metropolitan areas.
Discussion Paper1 5 9 5 a
15
The Effects of Income and Fare Variation on the Demand for Bus Transit Services in Brazil
the affordability of fares when establishing prices (SANT´ANNA, 1991; LIMA, 1992; VIVIER, 1999; GOMIDE et al., 2004; CARRUTHERS et al., 2005; MITRIC et al., 2005; ESTUPIÑÁN, et al., 2007).
Carruthers et al. (2005, p. 2) define the notion of affordability broadly as “ (…) the ability to undertake transport movements without significantly constraining the ability to undertake other activities of importance.” In more objective terms, this ability reflects the level of financial accessibility that people have to urban transportation services.
Affordability measures commonly have two methods of calculation. In the first method, household affordability is measured by the proportion of household spending on transportation within total household income. In the second method, the proportion of household spending on transportation is considered within total household expenditures. However, these methods require information about expenditure profiles that is only available through household expenditure surveys. When such data is missing, it is common to estimate these expenditures by making certain assumptions about family transport demands, such as an estimated of number of trips per month (MITRIC et al., 2005).
In order to avoid fragile assumptions, this paper analyzes the historic evolution of urban bus fares and household per capita income rather than using an affordability index. The study nonetheless draws on the concept of affordability, which is implicit in the analysis of the purchasing power of household income with regard to public transport.
It is especially important to remember the affordability concept with countries such as Brazil, where public transport services are used primarily by the lower and middle classes. In such cases, the pricing policy of bus fares may be useful in combating social exclusion and facilitating urban mobility. This observation is supported by the fact that variation in the number of paying passengers in Brazilian urban bus systems is highly influenced by income level changes.
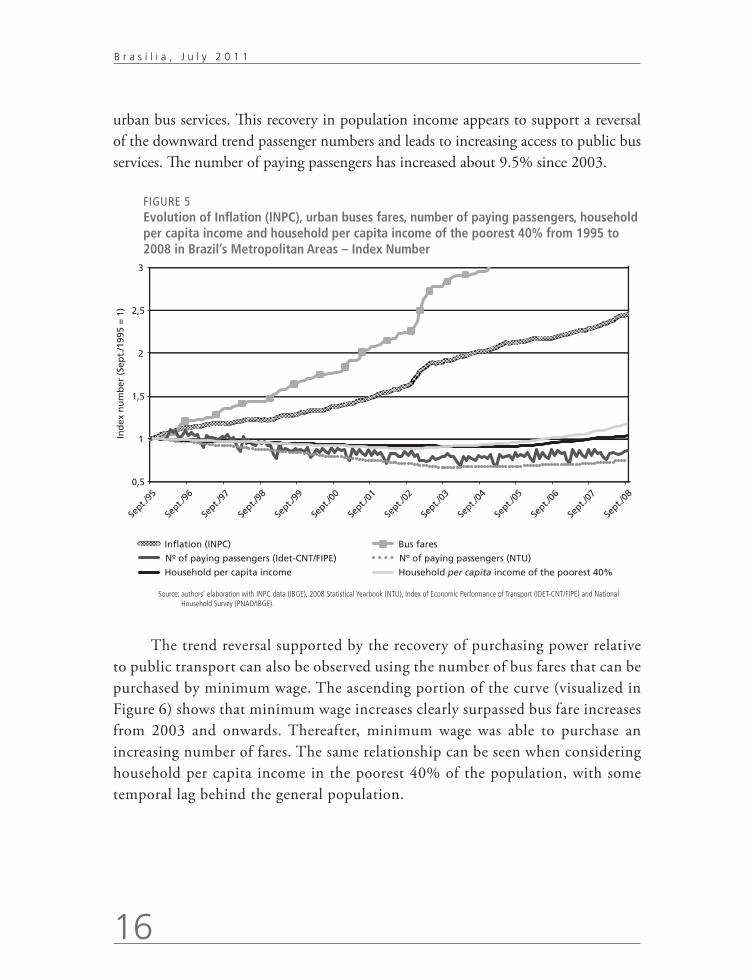
Figure 5 shows that bus fare increases that occured simultaneously with decreases in family income during 1995-2003 were preceded by a significant decline in the number of paying passengers. However, the recovery of average per capita income since 2003 has appeared to deaden the effects of fare increases on the demand for
16
B r a s í l i a , J u l y 2 0 1 1
urban bus services. This recovery in population income appears to support a reversal of the downward trend passenger numbers and leads to increasing access to public bus services. The number of paying passengers has increased about 9.5% since 2003.
FIGURE 5Evolution of Inflation (INPC), urban buses fares, number of paying passengers, household per capita income and household per capita income of the poorest 40% from 1995 to 2008 in Brazil’s Metropolitan Areas – Index Number
0,5
1
1,5
2
2,5
3
Sept./
95
Sept./
96
Sept./
97
Sept./
98
Sept./
99
Sept./
00
Sept./
01
Sept./
02
Sept./
03
Sept./
04
Sept./
05
Sept./
06
Sept./
07
Sept./
08
Ind
ex n
um
ber
(Se
pt.
/199
5 =
1)
Inflation (INPC) Bus fares
Nº of paying passengers (Idet-CNT/FIPE) Nº of paying passengers (NTU)
Household per capita income Household per capita income of the poorest 40%
Source: authors’ elaboration with INPC data (IBGE), 2008 Statistical Yearbook (NTU), Index of Economic Performance of Transport (IDET-CNT/FIPE) and National Household Survey (PNAD/IBGE).
The trend reversal supported by the recovery of purchasing power relative to public transport can also be observed using the number of bus fares that can be purchased by minimum wage. The ascending portion of the curve (visualized in Figure 6) shows that minimum wage increases clearly surpassed bus fare increases from 2003 and onwards. Thereafter, minimum wage was able to purchase an increasing number of fares. The same relationship can be seen when considering household per capita income in the poorest 40% of the population, with some temporal lag behind the general population.

Discussion Paper1 5 9 5 a
17
The Effects of Income and Fare Variation on the Demand for Bus Transit Services in Brazil
FIGURE 6Number of Bus Fares that can be purchased by the minimum wage and by the household per capita income of the poorest 40% from 1995 to 2008 in Brazil’s Metropolitan Areas
50
100
150
200
250
Nu
mb
er o
f b
us
fare
s (R
$)
Minimum wage
Household per capita income of the poorest 40% Polynominal (minimum wage)
Polynominal (Renda domiciliar per capita dos 40% mais pobres)
Mar
./200
9 Se
t./20
09
Sept
./199
5 M
ar./1
996
Sept
./199
6 M
ar./1
997
Sept
./199
7 M
ar./1
998
Sept
./199
8 M
ar./1
999
Sept
./199
9 M
ar./2
000
Sept
./200
0 M
ar./2
001
Sept
./200
1 M
ar./2
002
Sept
./200
2 M
ar./2
003
Sept
./200
3 M
ar./2
004
Sept
./200
4 M
ar./2
005
Sept
./200
5 M
ar./2
006
Sept
./200
6 M
ar./2
007
Sept
./200
7 M
ar./2
008
Sept
./200
8
Ind
ex n
um
ber
(Se
pt.
/199
5 =
1)
Source: authors’ elaboration with INPC data (IBGE) and National Household Survey (PNAD/IBGE).
The rising costs of primary inputs for urban buses have pushed firms to consistently increase fares in order to balance revenues and costs. Data shows the importance of income growth, especially for the poorest 40%, as an inducement of downward trend reversal in the number of paying passengers since 2003 despite persistent fare increases. It is likely that these fare increases during the last 6 years are being supported by general rises in income and employment levels in the country. This should alert public agents to a possible discontinuity in urban bus demands when facing a possible reversal of the current national economic environment.
New federal laws enacted during the 1980s15 created the Vale-transporte (VT in Portuguese), a type of transit voucher that could make worker demands for urban public transport less sensitive to fare changes. The VT is a worker’s right, according to which an employer must cover all monthly commute expenditures (traveling to and from work only) that exceed 6% of a worker’s salary. For all practical purposes, the VT is a direct subsidy that employers are required to pay to their workers (GOMIDE et al., 2004).
15. The laws number 7.418/1985 and number 7.619/1987.

18
B r a s í l i a , J u l y 2 0 1 1
It is noteworthy, however, that this benefit is not guaranteed to a large part of Brazilian population because they either work in the informal labor market or are unemployed. According to Brazilian National Household Survey (PNAD), more then 57% of the economically-active population (EAP) living in the 10 largest metropolitan areas during 2008 were either informally employed or unemployed.
Although the portion of EAP receiving any kind of transportation voucher (in which VT is included) has been growing since 1992, this ratio has never exceeded 41% (as shown in Table 2). It should also be emphasized that VT only applies to commute to and from work. Other trips are not covered.
TABLE 2Economically active population that received any kind of transportation voucher (VT included) – Brazil’s Metropolitan Areas, 1992 to 2008
Received any kind of
transportation voucher (VT included)?
1992 1997 2005 2008
Yes 6.253.984 30,2% 6.924.940 34,9% 10.875.270 35,9% 12.767.879 40,7%
No 14.420.560 69,8% 12.904.717 65,1% 19.388.173 64,1% 18.580.722 59,3%
Total EAP 20.674.544 100% 19.829.657 100% 30.263.443 100% 31.348.601 100%
Source: authors’ elaboration with PNAD microdata (IBGE) 1992, 1997, 2002, 2005 e 2008.
Variations in bus fares tend to play an important role for most people in their decisions regarding transportation mode. For these people, expensive bus fares may lead to suppression of trips or enforced mode changes to walking or cycling, even though these transport modes are inappropriate for large distance travel. In such cases, the high cost of bus fares clearly acts as an additional barrier to accessing urban public transport. According to the 2007 Origin/Destination Survey of São Paulo Metropolitan Area, about 635,000 trips per day during a typical workday were accomplished by walking mode because transit fares were considered expensive.
At the same time, it may be argued that the persistent rise of urban bus fares, combined with the improvement in general income conditions (particularly in the last 8 years), also stimulates the substitution of individual modes of transportation. This effect is known in economic theory as the substitution effect, as we are reminded by Lima (1992). Detailed analyses can gauge this substitution effect and its impact on traffic conditions but will depend on further Consumer Expenditure Surveys and Origin/Destination Surveys.

Discussion Paper1 5 9 5 a
19
The Effects of Income and Fare Variation on the Demand for Bus Transit Services in Brazil
It is evident that some of these effects are already noticeable. For example, cars and motorcycle sales have grown at average annual rates of 9% and 20%, respectively, driven mainly by sales of popular cars and easy access to credit. Certainly, public policies that exempted federal taxes helped the automotive sector to hit record new car sales during 2008-2009.
4 FARE AND INCOME ELASTICITIES OF DEMAND FOR BUS TRANSIT SERVICE
Many factors influence how prices affect consumer decisions. The decision to catch a bus, for example, is influenced not only by the fare, but also by the person’s social class, features of the trip (e.g., period of the day, distance, etc.), service quality, cost of a related service (e.g., other transport modes), traffic conditions and weather conditions. These are among the factors that affect elasticity of demand for transit services (LITMAN, 2007).
The present study focus on the effects of household income and bus fare variations on the demand for bus transit services in Brazil. Income and price are the traditional variables used in elasticity analyses, and both variables have shown considerable variation since 1995. In order to assess the impact of income and bus fares variation on the number of paying bus passengers, price elasticities and income elasticities for urban bus transportation were calculated based on a demand function adjusted by linear regression, considering all other factors constant. Average bus fares and average per capita income of the population living in 9 large Brazilian cities16 were taken as independent variables (constant prices, base = Sept./2009). The number of paying passengers in these areas was taken as dependent variable.17
Demand function estimated:
16. Belo Horizonte, Curitiba, Fortaleza, Goiânia, Porto Alegre, Recife, Rio de Janeiro, Salvador e São Paulo.
17. Two stated limitations of the model are the correlation between transit fare price and transit demanded and the high degree of data aggregation. Since this study is focused on providing a trend analysis, we understand that these shortcomings do not compromise the general conclusions of the paper.

20
B r a s í l i a , J u l y 2 0 1 1
Where:
q = Number of monthly paying passengers (millions)
r = Average household per capita income (constant prices, base = Sept./2009)
p = Average bus fare (constant prices, base = Sept./2009)
Adherence Test: R2 = 0,94; F = 1391,5; P value ≈0 — F test indicates a good fit of the model to the data
Considering this function, it was possible to estimate the elasticity values corresponding to each combination of bus fare and income level during the last 15 years, as presented in Figures 7 and 8.
FIGURE 7Price elasticity of demand for public transport by bus
0
0,2
0,4
0,6
0,8
1
1,2
1,4
1,6
1,8
1,02
1,
11
1,15
1,
17
1,25
1,
28
1,39
1,
41
1,52
1,
55
1,64
1,
69
1,72
1,
78
1,82
1,
83
1,92
1,
93
1,95
2 2,
05
2,07
2,
11
2,15
2,
18
Elas
tici
ty (
mo
du
le)
Average bus fare (R$) – constant prices, base = Sept./2009
Elastic regime
Source: authors’ elaboration with INPC data (IBGE), 2008 Statistical Yearbook (NTU) and National Household Survey (PNAD/IBGE).

Discussion Paper1 5 9 5 a
21
The Effects of Income and Fare Variation on the Demand for Bus Transit Services in Brazil
FIGURE 8Income elasticity of demand for public transport by bus
0
0,2
0,4
0,6
0,8
1
1,2
1,4
600
607
614
621
628
635
642
649
656
663
670
677
684
691
698
705
712
719
726
733
740
747
754
761
768
775
782
789
Elas
tici
ty
Average household per capita income (constant prices, base = Sept./2009)
Elastic regime
Source: authors’ elaboration with INPC data (IBGE), 2008 Statistical Yearbook (NTU) and National Household Survey (PNAD/IBGE).
Figures 7 and 8 indicate that, all other factors constant, the demand for bus services has displayed elastic behavior since 2001, when bus fares exceeded R$ 1.75 (constant prices, base = Sept./2009). Considering this context with constant income, any increase in bus fares leads to a more than proportional reduction in bus service demand, which means that revenues fell despite fare increases.
An analysis of the curve that would maximize revenue could bring us to the same conclusion by deriving the revenue function and estimating the maximum points on the curve, considering household per capita income observations.

22
B r a s í l i a , J u l y 2 0 1 1
Where:
pmax = fare that would maximize revenue at a specific level of household per capita income
v = bus transit system revenue = p x q
= derived revenue
As Figure 9 shows, the average fare charged by the bus systems was lower than the optimal price for maximizing revenues until 2001. During that period, companies could raise bus fares in order to increase profits. However, this scenario has changed, and fares charged since then are higher than the optimal revenue-maximizing price, partially because of pressure from transportation inputs and an inertial inflation of bus fares.
FIGURE 9Average bus fare that would maximize revenue compared with the average fare charged in 9 large Brazilian cities1 – 1995-2008
1
1,2
1,4
1,6
1,8
2
2,2
Sept./
1992
Sept./
1993
Sept./
1994
Sept./
1995
Sept./
1996
Sept./
1997
Sept./
1998
Sept./
1999
Sept./
2000
Sept./
2001
Sept./
2002
Sept./
2003
Sept./
2004
Sept./
2005
Sept./
2006
Sept./
2007
Sept./
2008
R$
(co
nst
ants
= S
ept.
/200
9)
Average bus fare charged Average bus fare that would maximize revenue
Source: authors’ elaboration with INPC data (IBGE), 2008 Statistical Yearbook (NTU) and National Household Survey (PNAD/IBGE).Note: 1 Cities included: Belo Horizonte, Curitiba, Fortaleza, Goiânia, Porto Alegre, Recife, Rio de Janeiro, Salvador e São Paulo.
It is noteworthy that revenue maximization does not necessarily lead to profit maximization. In situations where transit systems operate at full capacity, an eventual raise in service demand due to fare decreases may imply a cost increase that exceeds a proportional revenue increase. In any case, it seems clear that bus transit companies

Discussion Paper1 5 9 5 a
23
The Effects of Income and Fare Variation on the Demand for Bus Transit Services in Brazil
have not had many options in avoiding revenue decreases while reducing fares since 2001. A tough decision to be made without the basis of a strong policy that supports costs reduction.18
An illustrative example of a tax reduction policy and the effects that such policy might have over demand can be seen in city of Fortaleza. The Municipality and State authorities implemented some measures to relief system costs, such as a 50% reduction in both Tax over Services (incident to bus transit services) and in Tax on Circulation of Goods and Services (incident to diesel consumed by the operating companies).19 Moreover, there was greater effort of controlling bus operations with the implementation of electronic monitoring system of the fleet. Doing so, the public authorities were able to freeze bus fares at level of R$ 1.60 from 01/12/2004 to 25/05/2009.
After more than four years of frozen fares and rising inflation, bus fare prices fell 21% in real terms. As a result, the policy led to an increase of about 20% of paying passengers demand in 2008 compared to 2004 when the policy first began (Table 3). This Boost in Demand might have been generated a strong positive effect on the financial balance of the city’s transportation system.
TABLE 3Monthly average number of paying passengers transported by urban bus systems – Fortaleza, 2004-2008
Number of paying passengers
Year
2004 2005 2006 2007 2008
Monthly average (in millions)
21,3 21,7 23,2 24,6 25,7
% Variation (base = Sept./2004)
– 1,9 8,9 15,5 20,7
Source: authors’ elaboration with data from the Urban Transportation Company of Fortaleza (ETUFOR – Empresa de Transporte Urbano de Fortaleza).
18. As discussed, this situation may lead to the suppression of trips or enforced mode changes to walking or cycling (for lower income populations) and stimulate the substitution of mass transit options for individual transportation modes (for higher income populations).
19. Both in Portuguese: Tax over Services (ISS – Imposto sobre Serviços), and Tax on Circulation of Goods and Services (ICMS – Imposto Sobre Circulação de Mercadorias e Prestação de Serviços).

24
B r a s í l i a , J u l y 2 0 1 1
FIGURE 10 Evolution of Inflation (INPC), urban buses fares, monthly average of paying passengers from 2004 to 2008 – Fortaleza, Index Number
1
1,1
1,2
1,3
1,4
Sept./
2004
Nov./20
04
Jan./2
005
Mar
./200
5
May
/2005
Jul./2
005
Sept./
2005
Nov./20
05
Jan./2
006
Mar
./200
6
May
/2006
Jul./2
006
Sept./
2006
Nov./20
06
Jan./2
007
Mar
./200
7
May
/2007
Jul./2
007
Sept./
2007
Nov./20
07
Jan./2
008
Mar
./200
8
May
/2008
Jul./2
008
Sept./
2008
Ind
ex n
um
ber
(Se
pt.
/200
4 =
1)
Inflation (INPC) Bus fare (national average)
Bus fare Fortaleza average Number of paying passengers
Source: authors’ elaboration with INPC data from IBGE and paying passengers data from the Urban Transportation Company of Fortaleza (ETUFOR – Empresa de Transporte Urbano de Fortaleza).
5 CONCLUSIONS
Recently analyzed data indicate that people’s capacity to afford transit services was somewhat compromised by a combination of two factors between 1995 and 2003: a marked rise in urban bus fares and a general decline in population income, especially in the poorest populations. The study also showed that the gap between rising fares and income led to a decrease of more than 30% of paying demand in 9 large Brazilian cities during that period.
As we have seen, however, the recovery of average household per capita income since 2003 seems to support a reversal of downward trends in the number of paying passengers and increase access to public bus services. The number of paying passengers increased about 9.5% between 2003 and 2008.
According to the price elasticity estimated in this study, demand for bus services has exhibited elastic behavior since 2001. Since then, the gradual increase observed in
Discussion Paper1 5 9 5 a
25
The Effects of Income and Fare Variation on the Demand for Bus Transit Services in Brazil
population income seems to buffer against persistent fare increases. It is possible that with ongoing upward income trends, a strong policy supporting bus fare reduction could trigger greater demand for transit services, leading to a virtuous cycle.
For all intents and purposes, it is important to highlight the fragility of urban mobility conditions in major Brazilian metropolitan areas due to the persistent fare increases. In a scenario where this trajectory continues, a possible worsening of current economic conditions (e.g., a decrease in family income) could seriously compromise the basis for a sustainable raise in transit services demand.
Given this possibility, it may be appropriate to review public policies that could provide a better economic environment for the provision of transit services. This could lead to more affordable services and more efficient services, which are financially attractive to companies. Some of these possible policies are highlighted below.
Promoting fare integration, for instance, can facilitate access to transit services because this integration enables users to perform a greater number of trips with less expenditure. Other studies also advocate tax reductions and the formation of alternative funding (not linked to fare charging) in order to recover the costs of non-paying passengers and drive the reduction of transit fares (ANTP, 2006; NTU, 2009; GOMIDE et al. 2004; MCIDADES, 2004).
As discussed, public subsidies can play important role in access to transit services. According to Cropper & Bhattacharya (2007), unsubsidized urban bus fare in Mubai (India) would have to rise almost 30% to cover the costs of these services. As an objection to this kind of policy, the authors agree with the argument of Estupiñán et al. (2007) that most these subsidies benefit middle and high-income classes. A similar objection was noted by Gomide (2003) with respect to transportation vouchers in Brazil. Mitric et al. (2005) also highlight that, unless these subsidies have a reliable and sustainable source of funding, the negative impact of subsidies on a service operator can more than offset the benefits derived from low-income passengers.
Regarding Bill no 1.687/2007 (known as Urban Mobility Bill), Gomide (2008) also stresses some proposals for a regulatory reform in mass transit services. Among these are proposals for annual fare adjustments based on inflation and productivity factors and proposals to disengage bus fares from operating costs.
26
B r a s í l i a , J u l y 2 0 1 1
Another policy that could help reduce bus fares has been discussed inside the government is a proposal that would establish transit company turnover as the contribution basis for Social Security. Because the largest transit cost is labor expenses, this policy will likely have a positive effect in fare pricing.
These are some of the possible policies that could be adopted to make mass transit services more affordable and accessible. It is important to note that these policies are complementary. Thus, the application of only one of those policies alone may result in a compromise in effectiveness. Either way, the combination of these policies requires a thorough study of their possible impact on urban mobility conditions and the urban economy as a whole.
REFERENCES
ASSOCIAÇÃO NACIONAL DAS EMPRESAS DE TRANSPORTES URBANOS (NTU). Novas tendências em política tarifária. Brasília, 2005.
––––––. Anuário da NTU 2008/2009. Brasília, 2009.
ASSOCIAÇÃO NACIONAL DE TRANSPORTES PÚBLICOS (ANTP). panorama da mobilidade urbana no Brasil: tendências e desafios. São Paulo, 2006.
BRASIL. Ministério dos Transportes (MT). Cálculo das tarifas de transportes de ônibus urbanos. GEIPOT, 1996.
––––––. Ministério das Cidades (MCidades). Política nacional de mobilidade urbana sustentável. Brasília, 2004 (Cadernos MCidades Mobilidade Urbana, n. 6).
CARRUTHERS, R.; DICK, M.; SAURKAR, A. Affordability of Public Transport in Developing Countries. Washington, DC: World Bank Publications, Jan. 2005. World Bank Group Transport Sector Board.
COTTA, J. L. Elasticidade: demanda e preço. Monografia (Graduação) – Universidade Federal de Minas Gerais, Belo Horizonte, 2005.
CROPPER, M.; BHATTACHARYA, S. Public Transport Subsidies and Affordability in Mumbai. India: The World Bank, 2007 (Policy Research Working Paper, n. 4395).
GOMIDE, A. A. Transporte urbano e inclusão social: elementos para políticas públicas. Brasília: Ipea, 2003 (Texto para Discussão, n. 960).
––––––. Agenda governamental e o processo de políticas públicas: o projeto de lei de diretrizes da política nacional de mobilidade urbana. Brasília: Ipea, 2008 (Texto para discussão, n. 1334).

Discussion Paper1 5 9 5 a
27
The Effects of Income and Fare Variation on the Demand for Bus Transit Services in Brazil
GOMIDE, A. A.; LEITE, S.; REBELO, J. Public Transport and Urban Poverty: a Synthetic Index of Adequate Service. Washington, DC: World Bank Publications, 2004.
ÍNDICE DE DESEMPENHO ECONÔMICO DO TRANSPORTE (IDET-CNT/FIPE). Disponível em: <www.cnt.org.br>.
INSTITUTO BRASILEIRO DE GEOGRAFIA E ESTATÍSTICA (IBGE). Banco de Dados Sidra/IBGE. Disponível em: <www.ibge.gov.br>.
INSTITUTO DE DESENVOLVIMENTO E INFORMAÇÃO EM TRANSPORTE (ITRANS). Mobilidade e pobreza: relatório final. Brasília, 2004.
LIMA, I. M. O. Transporte urbano de passageiros: a tarifa como fonte de recursos. Brasília: Ipea, 1992 (Texto para discussão, n. 273).
LITMAN, T. Transit Price Elasticities and Cross-Elasticities. Victoria Transport Policy Institute, 2007.
SANT’ANNA, J. A. Reordenamento urbano pelo transporte. Brasília: Ipea, 1991 (Texto para Discussão, n. 225).
VIVIER, J. Urban Transport Pricing. Public Transport International, 5. 1999.
VUCHIC, V. R. Urban Transit Operations, Planning and Economics. John Wiley & Sons, 2005.

© Institute for Applied Economic Research – Ipea 2011
PUBLISHING DEPARTMENT
CoordinationCláudio Passos de Oliveira
Njobs Comunicação
SupervisionCida Taboza Fábio Oki Thayse Lamera
RevisionÂngela de OliveiraCristiana de Sousa da SilvaLizandra Deusdará FelipeRegina Marta de Aguiar
TypesettingAnderson Reis
Graphic designLuís Cláudio Cardoso da Silva
Cover designRenato Rodrigues Bueno
Bookstore
SBS – Quadra 1 - Bloco J - Ed. BNDES, Térreo. 70076-900 – Brasília – DFTel: + 55 (61) 3315-5336
E-mail: [email protected]

1595a
THE EFFECTS OF INCOME AND FARE VARIATION ON THE DEMAND FOR BUS TRANSIT SERVICES IN BRAZIL
Carlos Henrique Ribeiro de CarvalhoRafael Henrique Moraes Pereira
DISCUSSION PAPER