stephen sexauer jan 1411 (2)
DESCRIPTION
Superhero and Profits Maker Stephen Sexauer GIC Santiago Chile January 2010 The Grand Teton and Mount Rainier A Sudden Stop in Everything Everywhere The Superheroes Arrive Corporate Profits: What Recession? 2 Stephen Sexauer GIC January 2010TRANSCRIPT
Stephen Sexauer
GIC Santiago Chile
January 2010
The US Central Bank:
Superhero and Profits Maker
Stephen Sexauer GIC January 2010
2
2008 to 2010
A Stunningly Large Non-bank Bank Run
A Sudden Stop in Everything Everywhere
The Superheroes Arrive
Corporate Profits: What Recession?
The Grand Teton and Mount Rainier
Stephen Sexauer GIC January 2010
3
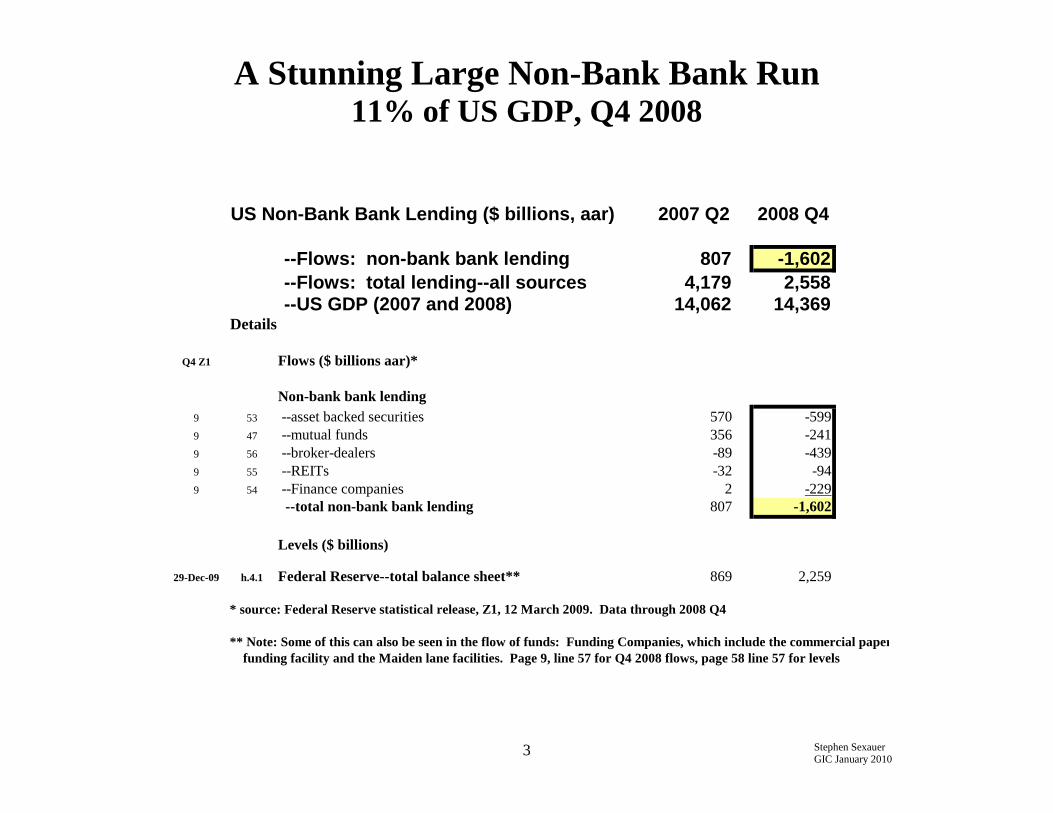
A Stunning Large Non-Bank Bank Run 11% of US GDP, Q4 2008
US Non-Bank Bank Lending ($ billions, aar) 2007 Q2 2008 Q4
--Flows: non-bank bank lending 807 -1,602
--Flows: total lending--all sources 4,179 2,558
--US GDP (2007 and 2008) 14,062 14,369
Details
Q4 Z1 Flows ($ billions aar)*
Non-bank bank lending
9 53 --asset backed securities 570 -599
9 47 --mutual funds 356 -241
9 56 --broker-dealers -89 -439
9 55 --REITs -32 -94
9 54 --Finance companies 2 -229
--total non-bank bank lending 807 -1,602
Levels ($ billions)
29-Dec-09 h.4.1 Federal Reserve--total balance sheet** 869 2,259
* source: Federal Reserve statistical release, Z1, 12 March 2009. Data through 2008 Q4
** Note: Some of this can also be seen in the flow of funds: Funding Companies, which include the commercial paper
funding facility and the Maiden lane facilities. Page 9, line 57 for Q4 2008 flows, page 58 line 57 for levels
Stephen Sexauer GIC January 2010
4
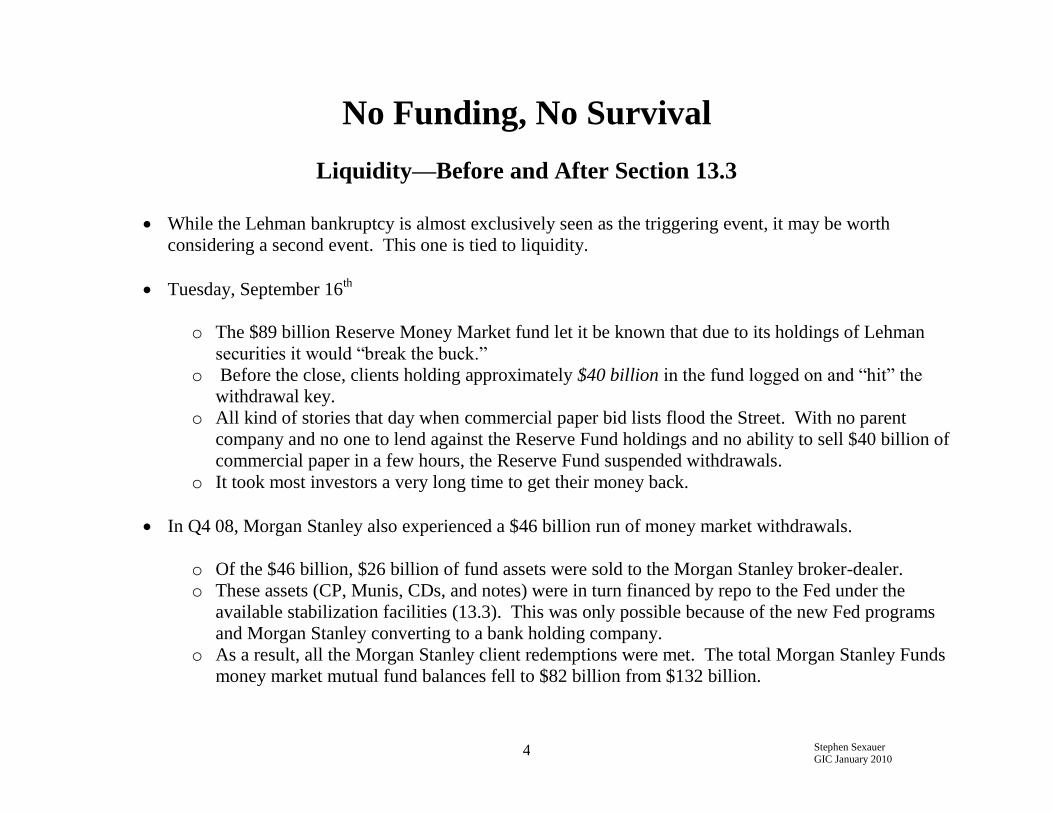
No Funding, No Survival
Liquidity—Before and After Section 13.3
While the Lehman bankruptcy is almost exclusively seen as the triggering event, it may be worth
considering a second event. This one is tied to liquidity.
Tuesday, September 16th
o The $89 billion Reserve Money Market fund let it be known that due to its holdings of Lehman
securities it would “break the buck.”
o Before the close, clients holding approximately $40 billion in the fund logged on and “hit” the
withdrawal key.
o All kind of stories that day when commercial paper bid lists flood the Street. With no parent
company and no one to lend against the Reserve Fund holdings and no ability to sell $40 billion of
commercial paper in a few hours, the Reserve Fund suspended withdrawals.
o It took most investors a very long time to get their money back.
In Q4 08, Morgan Stanley also experienced a $46 billion run of money market withdrawals.
o Of the $46 billion, $26 billion of fund assets were sold to the Morgan Stanley broker-dealer.
o These assets (CP, Munis, CDs, and notes) were in turn financed by repo to the Fed under the
available stabilization facilities (13.3). This was only possible because of the new Fed programs
and Morgan Stanley converting to a bank holding company.
o As a result, all the Morgan Stanley client redemptions were met. The total Morgan Stanley Funds
money market mutual fund balances fell to $82 billion from $132 billion.
Stephen Sexauer GIC January 2010
5
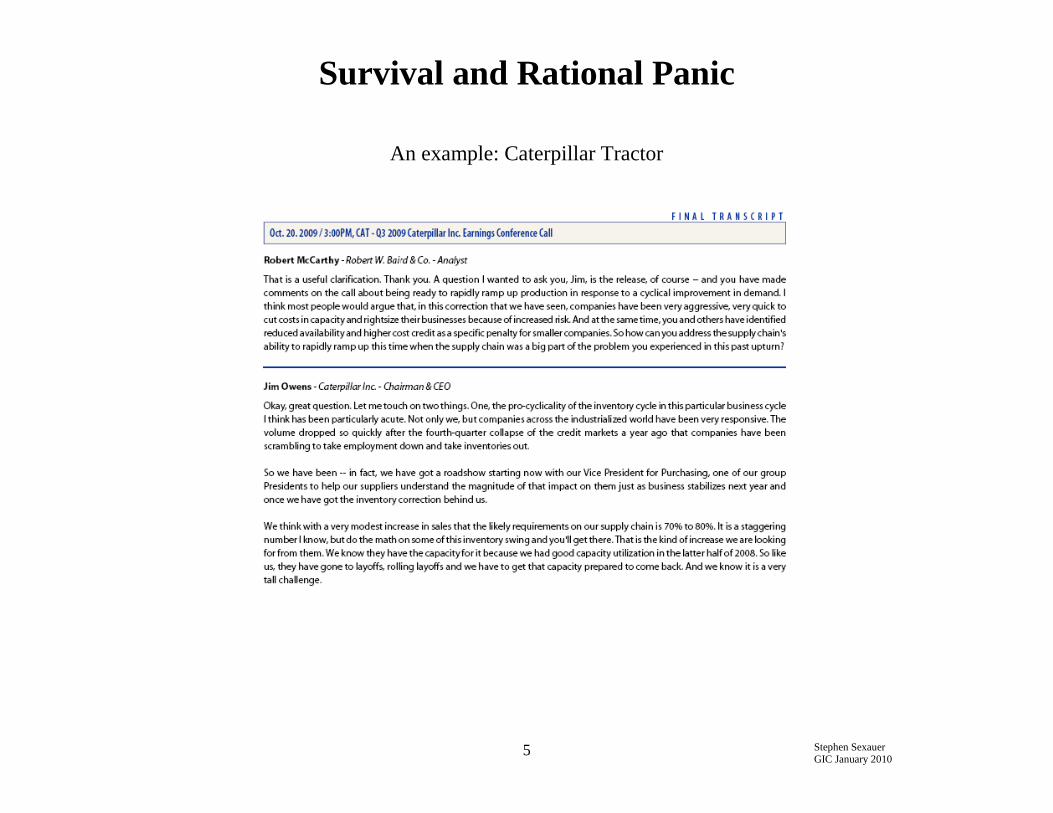
Survival and Rational Panic
An example: Caterpillar Tractor
Stephen Sexauer GIC January 2010
6
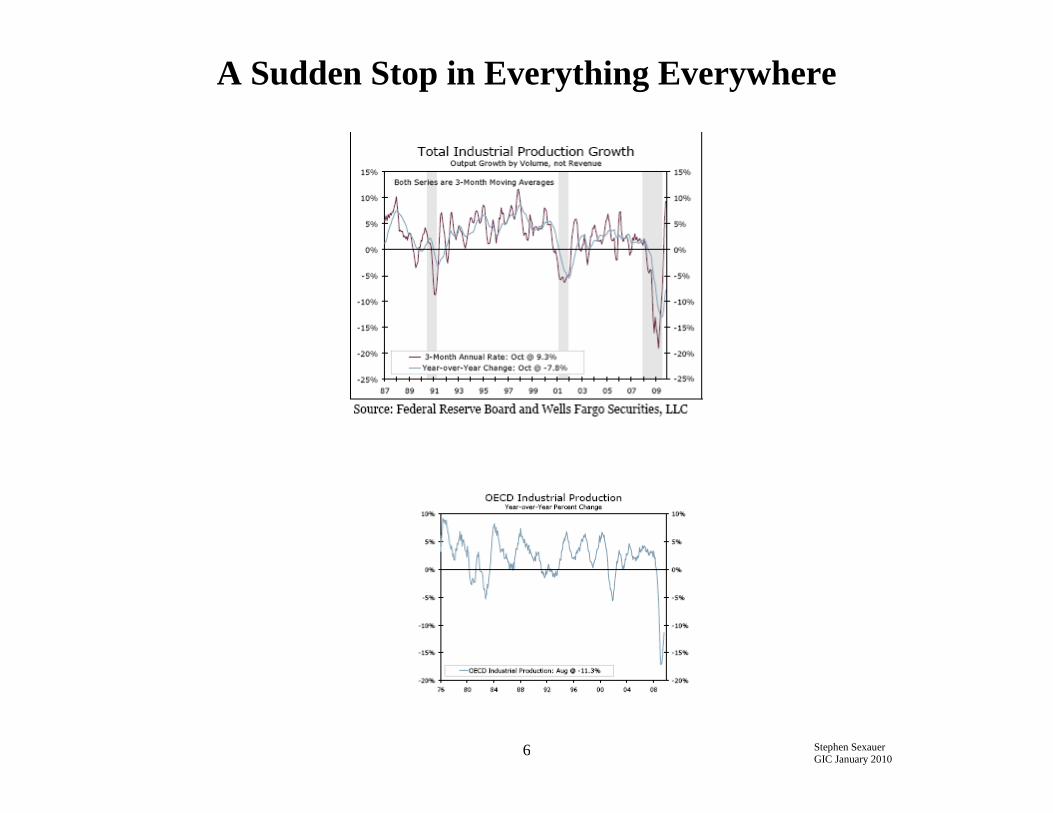
A Sudden Stop in Everything Everywhere
Stephen Sexauer GIC January 2010
7
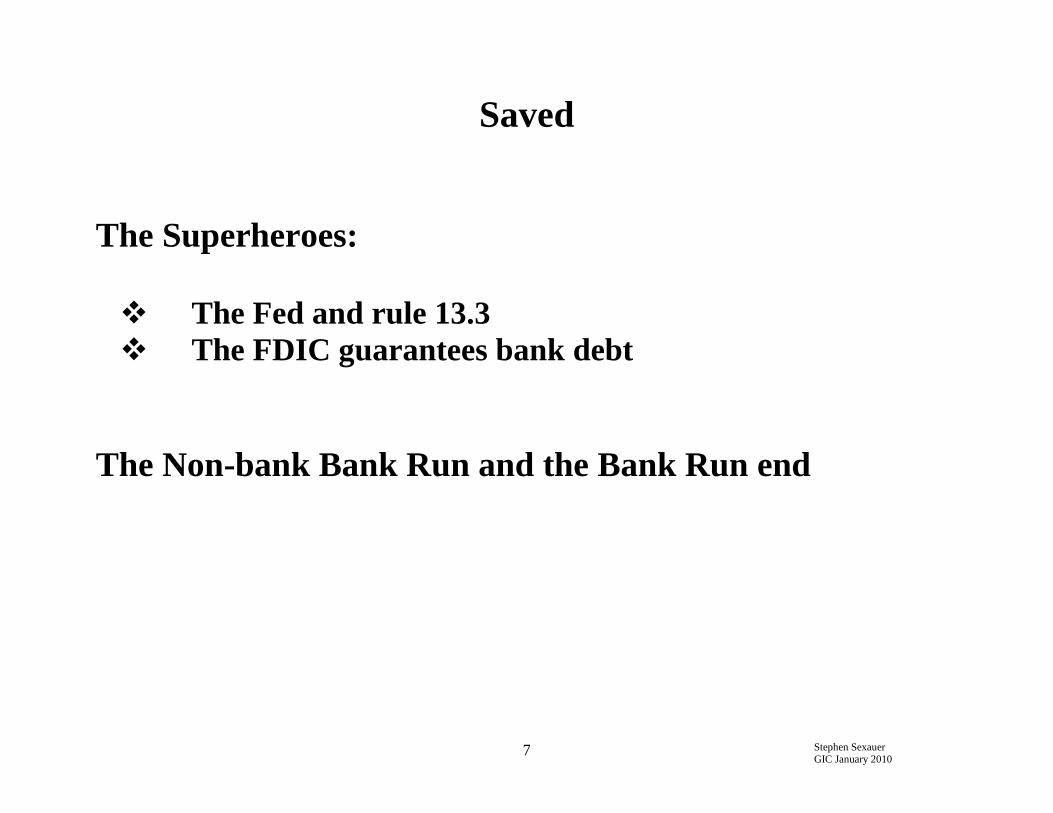
Saved
The Superheroes:
The Fed and rule 13.3
The FDIC guarantees bank debt
The Non-bank Bank Run and the Bank Run end
Stephen Sexauer GIC January 2010
8
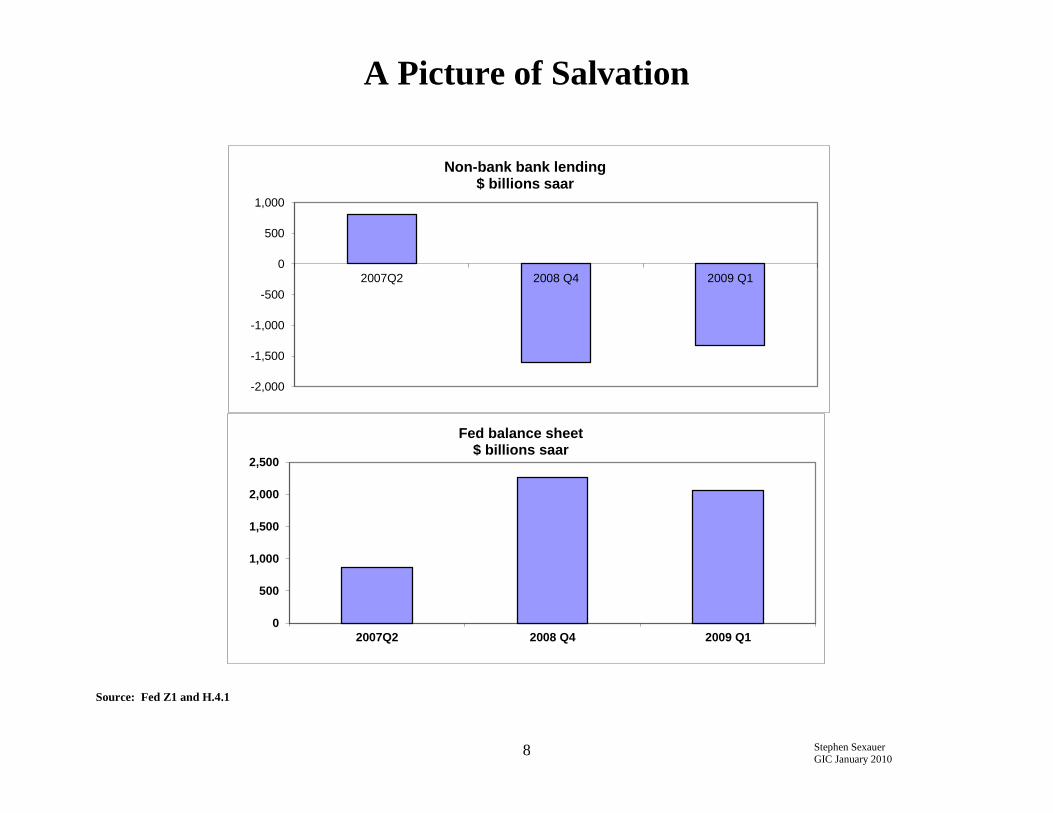
A Picture of Salvation
-2,000
-1,500
-1,000
-500
0
500
1,000
2007Q2 2008 Q4 2009 Q1
Non-bank bank lending$ billions saar
0
500
1,000
1,500
2,000
2,500
2007Q2 2008 Q4 2009 Q1
Fed balance sheet$ billions saar
Source: Fed Z1 and H.4.1
Stephen Sexauer GIC January 2010
9
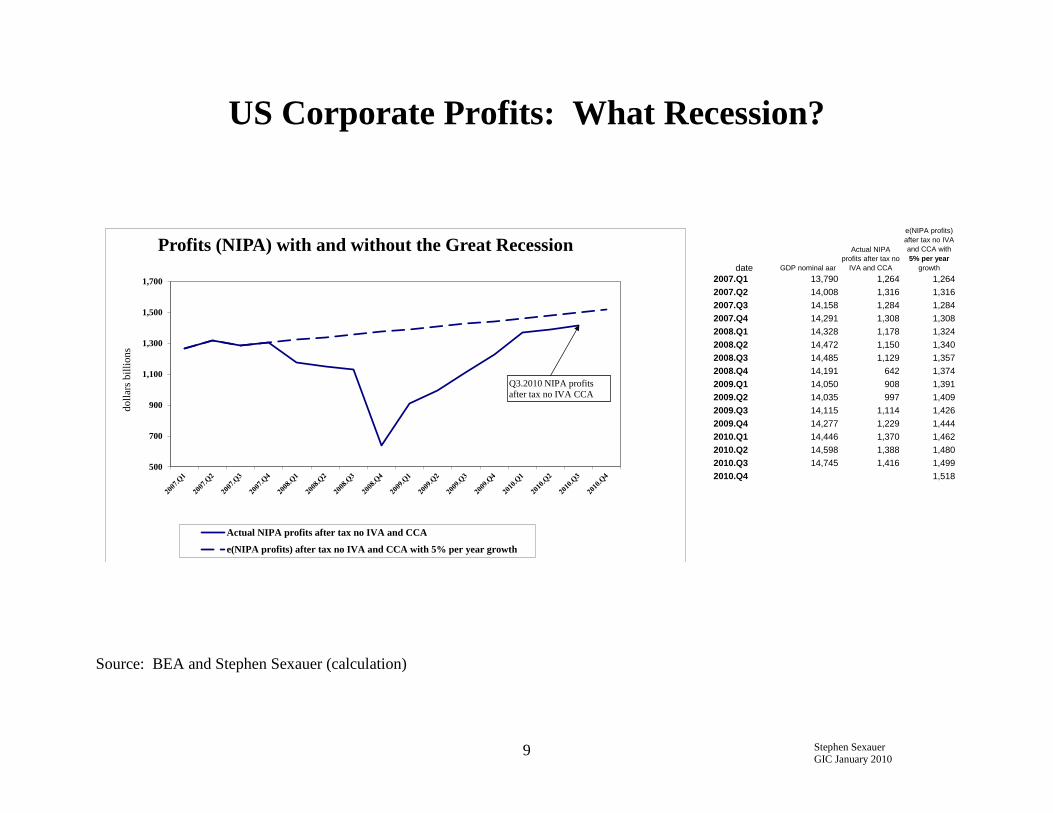
US Corporate Profits: What Recession?
date GDP nominal aar
Actual NIPA
profits after tax no
IVA and CCA
e(NIPA profits)
after tax no IVA
and CCA with
5% per year
growth
2007.Q1 13,790 1,264 1,264
2007.Q2 14,008 1,316 1,316
2007.Q3 14,158 1,284 1,284
2007.Q4 14,291 1,308 1,308
2008.Q1 14,328 1,178 1,324
2008.Q2 14,472 1,150 1,340
2008.Q3 14,485 1,129 1,357
2008.Q4 14,191 642 1,374
2009.Q1 14,050 908 1,391
2009.Q2 14,035 997 1,409
2009.Q3 14,115 1,114 1,426
2009.Q4 14,277 1,229 1,444
2010.Q1 14,446 1,370 1,462
2010.Q2 14,598 1,388 1,480
2010.Q3 14,745 1,416 1,499
2010.Q4 1,518500
700
900
1,100
1,300
1,500
1,700
do
llar
s b
illi
on
s
Profits (NIPA) with and without the Great Recession
Actual NIPA profits after tax no IVA and CCA
e(NIPA profits) after tax no IVA and CCA with 5% per year growth
Q3.2010 NIPA profits
after tax no IVA CCA
Source: BEA and Stephen Sexauer (calculation)
Stephen Sexauer GIC January 2010
10
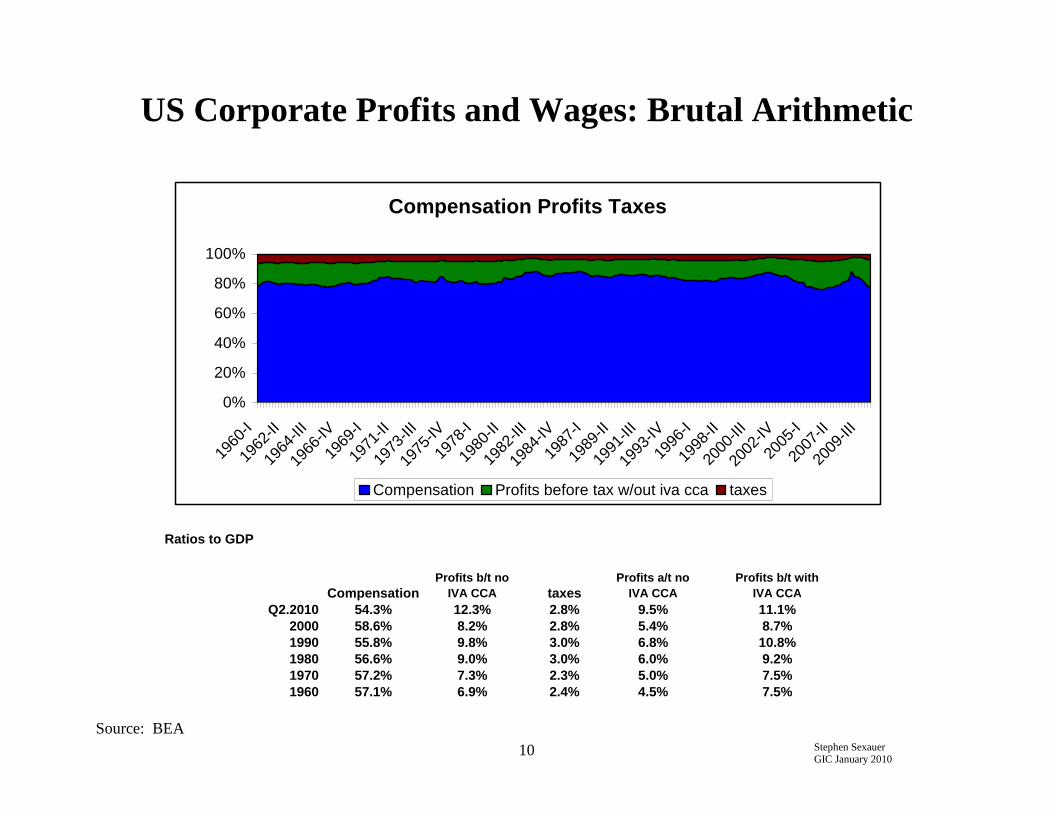
US Corporate Profits and Wages: Brutal Arithmetic
Ratios to GDP
Compensation
Profits b/t no
IVA CCA taxes
Profits a/t no
IVA CCA
Profits b/t with
IVA CCA
Q2.2010 54.3% 12.3% 2.8% 9.5% 11.1%
2000 58.6% 8.2% 2.8% 5.4% 8.7%
1990 55.8% 9.8% 3.0% 6.8% 10.8%
1980 56.6% 9.0% 3.0% 6.0% 9.2%
1970 57.2% 7.3% 2.3% 5.0% 7.5%
1960 57.1% 6.9% 2.4% 4.5% 7.5%
Compensation Profits Taxes
0%
20%
40%
60%
80%
100%
196
0-I
196
2-II
196
4-III
196
6-IV
196
9-I
197
1-II
197
3-III
197
5-IV
197
8-I
198
0-II
198
2-III
198
4-IV
198
7-I
198
9-II
199
1-III
199
3-IV
199
6-I
199
8-II
200
0-III
200
2-IV
200
5-I
200
7-II
200
9-III
Compensation Profits before tax w/out iva cca taxes
Source: BEA
Stephen Sexauer GIC January 2010
11
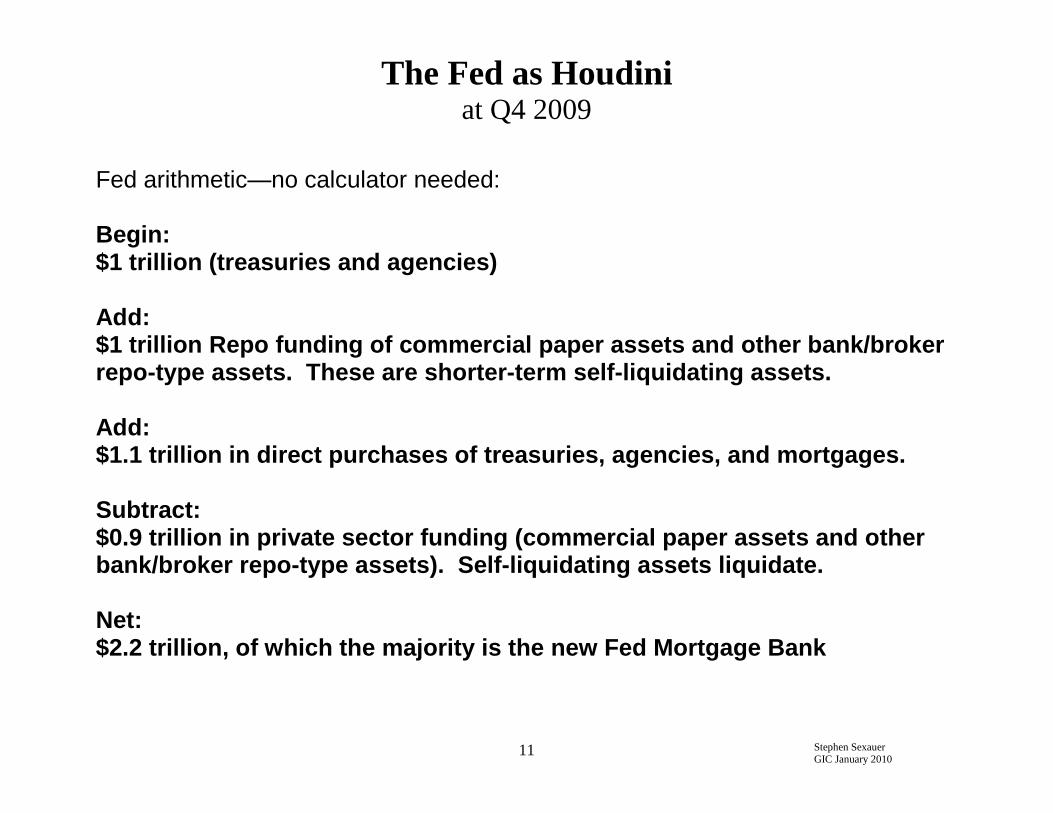
The Fed as Houdini at Q4 2009
Fed arithmetic—no calculator needed: Begin: $1 trillion (treasuries and agencies) Add: $1 trillion Repo funding of commercial paper assets and other bank/broker repo-type assets. These are shorter-term self-liquidating assets. Add: $1.1 trillion in direct purchases of treasuries, agencies, and mortgages. Subtract: $0.9 trillion in private sector funding (commercial paper assets and other bank/broker repo-type assets). Self-liquidating assets liquidate. Net: $2.2 trillion, of which the majority is the new Fed Mortgage Bank
Stephen Sexauer GIC January 2010
12
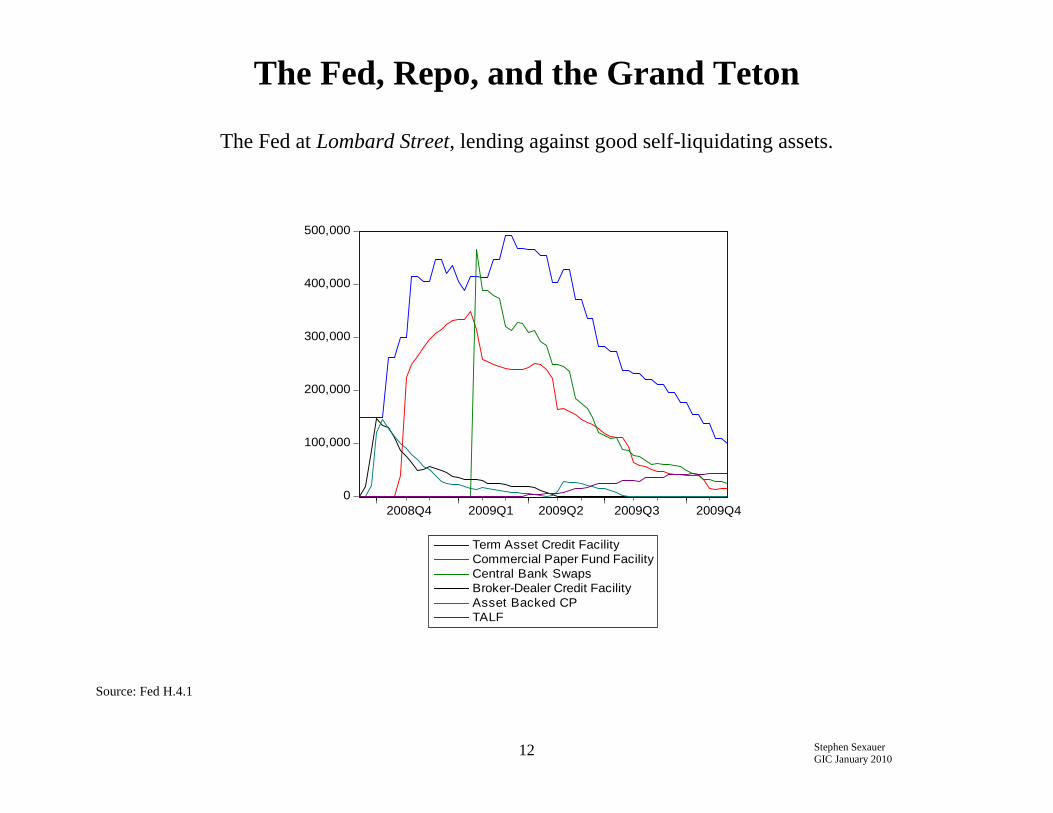
The Fed, Repo, and the Grand Teton
The Fed at Lombard Street, lending against good self-liquidating assets.
0
100,000
200,000
300,000
400,000
500,000
2008Q4 2009Q1 2009Q2 2009Q3 2009Q4
Term Asset Credit Facility
Commercial Paper Fund Facility
Central Bank Swaps
Broker-Dealer Credit Facility
Asset Backed CP
TALF
Source: Fed H.4.1
Stephen Sexauer GIC January 2010
13
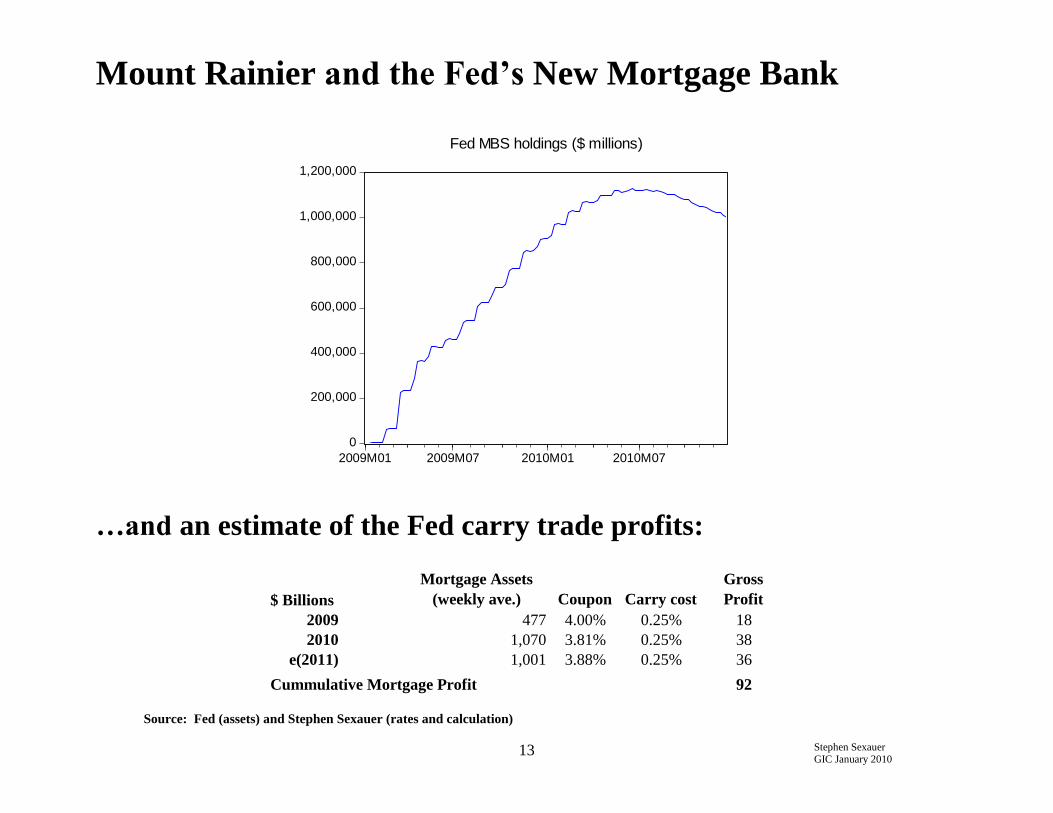
Mount Rainier and the Fed’s New Mortgage Bank
0
200,000
400,000
600,000
800,000
1,000,000
1,200,000
2009M01 2009M07 2010M01 2010M07
Fed MBS holdings ($ millions)
…and an estimate of the Fed carry trade profits:
$ Billions
Mortgage Assets
(weekly ave.) Coupon Carry cost
Gross
Profit
2009 477 4.00% 0.25% 18
2010 1,070 3.81% 0.25% 38
e(2011) 1,001 3.88% 0.25% 36
Cummulative Mortgage Profit 92
Source: Fed (assets) and Stephen Sexauer (rates and calculation)
Stephen Sexauer GIC January 2010
14
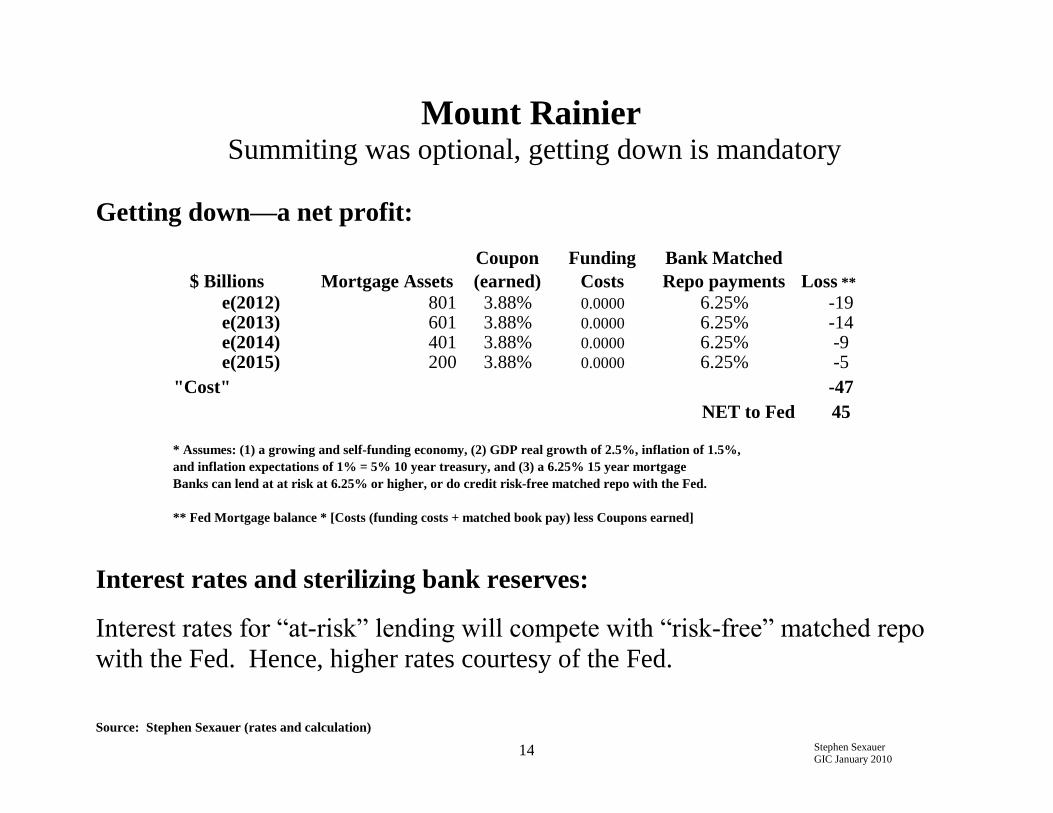
Mount Rainier Summiting was optional, getting down is mandatory
Getting down—a net profit:
$ Billions Mortgage Assets
Coupon
(earned)
Funding
Costs
Bank Matched
Repo payments Loss **
e(2012) 801 3.88% 0.0000 6.25% -19e(2013) 601 3.88% 0.0000 6.25% -14e(2014) 401 3.88% 0.0000 6.25% -9e(2015) 200 3.88% 0.0000 6.25% -5
"Cost" -47
NET to Fed 45
* Assumes: (1) a growing and self-funding economy, (2) GDP real growth of 2.5%, inflation of 1.5%,
and inflation expectations of 1% = 5% 10 year treasury, and (3) a 6.25% 15 year mortgage
Banks can lend at at risk at 6.25% or higher, or do credit risk-free matched repo with the Fed.
** Fed Mortgage balance * [Costs (funding costs + matched book pay) less Coupons earned]
Interest rates and sterilizing bank reserves:
Interest rates for “at-risk” lending will compete with “risk-free” matched repo
with the Fed. Hence, higher rates courtesy of the Fed.
Source: Stephen Sexauer (rates and calculation)
Stephen Sexauer GIC January 2010
15
How Long Does a Growing Global Economy Stay on the Fed’s “Rope Team”?
Stephen Sexauer GIC January 2010
16
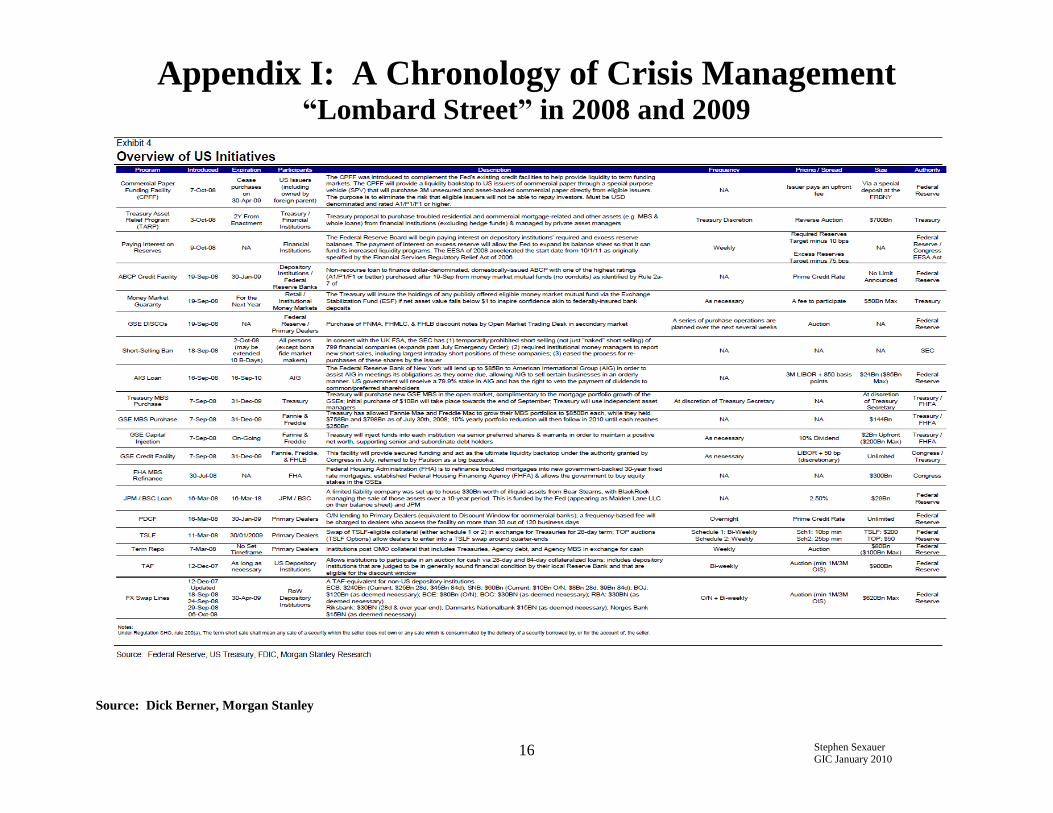
Appendix I: A Chronology of Crisis Management “Lombard Street” in 2008 and 2009
Source: Dick Berner, Morgan Stanley
Stephen Sexauer GIC January 2010
17
Stephen Sexauer
Allianz Global Investors Solutions: Chief Investment Officer
Allianz Global Investors: Performance and Risk: Performance Portal and Risk-Return analysis for AGI WW equity portfolios
(2007-2008)
Allianz Global Investors-Nicholas Applegate Capital Management: Portfolio manager Large-cap Core and Large-cap Value
(2003-2004)
Morgan Stanley Asset Management (1989 – 2002)
Portfolio manager Large-cap value; application of optimization techniques
Risk structures for US Value and Growth portfolios
Salomon Brothers: (1988-1989)
Mr. Sexauer holds an MBA from the University of Chicago (economics and statistics) and a BS (economics) from the
University of Illinois.
Economic data in this presentation are derived from internal research publicly available statistics published by the U.S.
Federal Reserve, the Government of Canada, the U.S. Department of Commerce and the International Monetary Fund.
The information herein is provided for informational purposes only and should not be construed as a recommendation of any
security, strategy or investment product, nor an offer or solicitation for the purchase or sale of any financial instrument. This
material contains the current opinions of the author, which are subject to change without notice.