aleman-chile_latin_america_us_policy jan 1411
DESCRIPTION
“Monetary Policy, Fiscal Policy, Devaluation & The China/Wal-Mart Effect” Eugenio J. Aleman, Director and Senior Economist January 17, 2011 0.00 0.50 1.00 1.50 2.00 2.50 3.00 3.50 4.00 4.50 2 Source: BCRA, Wells Fargo Securities, LLC 6 Jan-9 1 Jan-0 2 Jan-0 Economics 4 J an-9 8 J an-0 4 J an-0 8 J an-9 3 J an-0 J an-9 3 -10 10 20 30 40 50 (% change year-over-year) Source: INDEC, Wells Fargo Securities, LLC 0 -0 -1 0TRANSCRIPT

“Monetary Policy, Fiscal Policy, Devaluation & The China/Wal-Mart Effect”Eugenio J. Aleman, Director and Senior EconomistJanuary 17, 2011

Economics 2
Argentina: Large Currency Devaluation
Abandonment of the Convertibility Law:
Devaluation of 70 percent in one year
Source: BCRA, Wells Fargo Securities, LLC
Argentine Peso (pesos per U.S. dollar)
0.00
0.50
1.00
1.50
2.00
2.50
3.00
3.50
4.00
4.50
Jan-94
Jan-95
Jan-96
Jan-97
Jan-98
J an-99
Jan-00
Jan-01
J an-02
Jan-03
Jan-04
Jan-05
J an-06
Jan-07
Jan-08
Jan-09
Jan-10
Economics 3
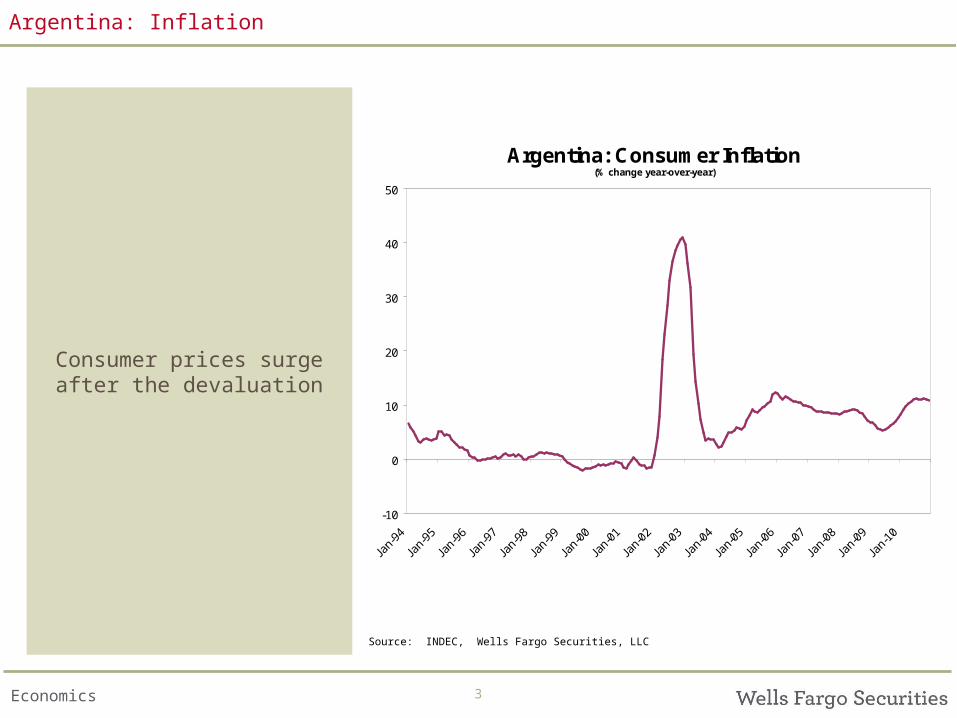
Argentina: Inflation
Consumer prices surge after the devaluation
Argentina: Consumer Inflation(% change year-over-year)
-10
0
10
20
30
40
50
Jan-9
4
Jan-9
5
Jan-9
6
Jan-9
7
Jan-9
8
Jan-9
9
Jan-0
0
Jan-0
1
Jan-0
2
Jan-0
3
Jan-0
4
Jan-0
5
Jan-0
6
Jan-0
7
Jan-0
8
Jan-0
9
Jan-1
0
Source: INDEC, Wells Fargo Securities, LLC
Economics 4
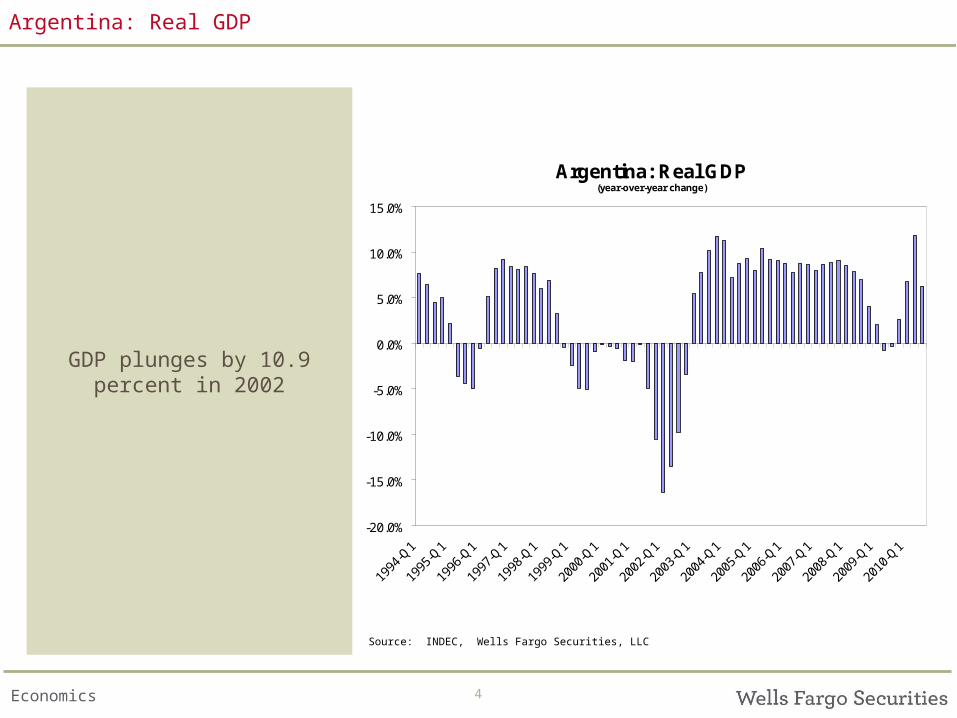
Argentina: Real GDP
GDP plunges by 10.9 percent in 2002
Argentina: Real GDP(year-over-year change)
-20.0%
-15.0%
-10.0%
-5.0%
0.0%
5.0%
10.0%
15.0%
1994
-Q1
1995
-Q1
1996
-Q1
1997
-Q1
1998
-Q1
1999
-Q1
2000
-Q1
2001
-Q1
2002
-Q1
2003
-Q1
2004
-Q1
2005
-Q1
2006
-Q1
2007
-Q1
2008
-Q1
2009
-Q1
2010
-Q1
Source: INDEC, Wells Fargo Securities, LLC
Economics 5
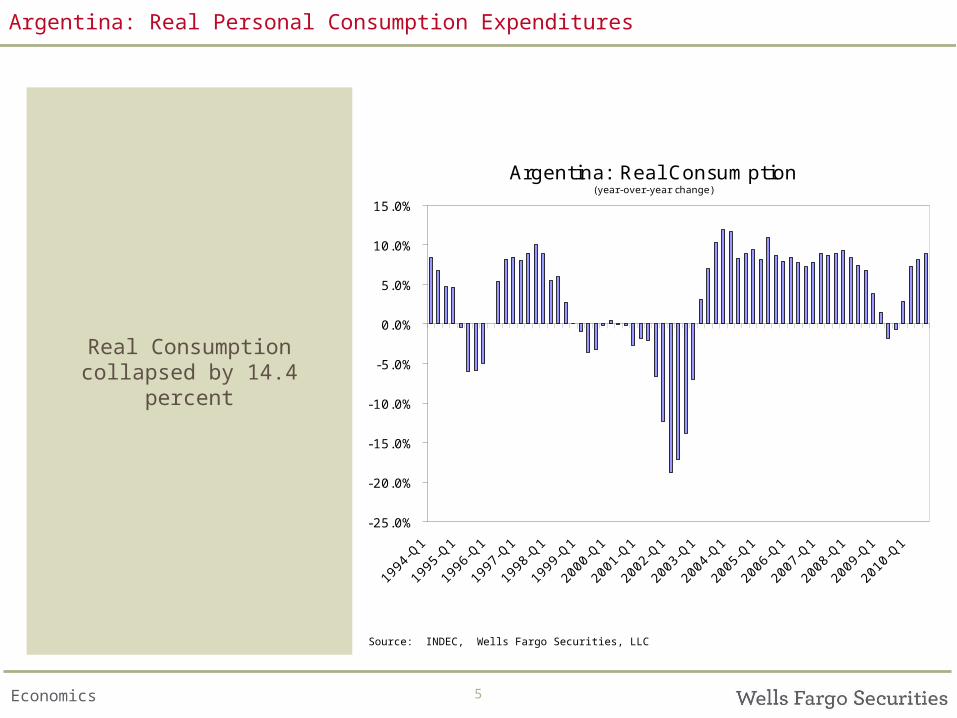
Argentina: Real Personal Consumption Expenditures
Real Consumption collapsed by 14.4 percent
Argentina: Real Consumption(year-over-year change)
-25.0%
-20.0%
-15.0%
-10.0%
-5.0%
0.0%
5.0%
10.0%
15.0%
1994
-Q1
1995
-Q1
1996
-Q1
1997
-Q1
1998
-Q1
1999
-Q1
2000
-Q1
2001
-Q1
2002
-Q1
2003
-Q1
2004
-Q1
2005
-Q1
2006
-Q1
2007
-Q1
2008
-Q1
2009
-Q1
2010
-Q1
Source: INDEC, Wells Fargo Securities, LLC

Economics 6
Argentina: Current Account
The Current Account changes from a deficit to a
strong positive
Argentina: Current Account(percentage of GDP)
-2.0
-1.5
-1.0
-0.5
0.0
0.5
1.0
1.5
2.0
2.5
3.0
3.5
1994
-Q1
1995
-Q1
1996
-Q1
1997
-Q1
1998
-Q1
1999
-Q1
2000
-Q1
2001
-Q1
2002
-Q1
2003
-Q1
2004
-Q1
2005
-Q1
2006
-Q1
2007
-Q1
2008
-Q1
2009
-Q1
2010
-Q1
Source: INDEC, Wells Fargo Securities, LLC

Economics 7
Brazil: Devaluation of the Real in two periods
Brazil abandons the “managed peg” in January
of 1999
Brazilian Currency (reais per U.S. dollars, monthly average)
0.0
0.5
1.0
1.5
2.0
2.5
3.0
3.5
4.0
Jan-94
J an-95
Jan-96
Jan-97
Jan-98
Jan-99
J an-00
J an-01
Jan-02
Jan-03
J an-04
Jan-05
Jan-06
J an-07
J an-08
J an-09
Jan-10
Source: BCB, Wells Fargo Securities, LLC
Economics 8
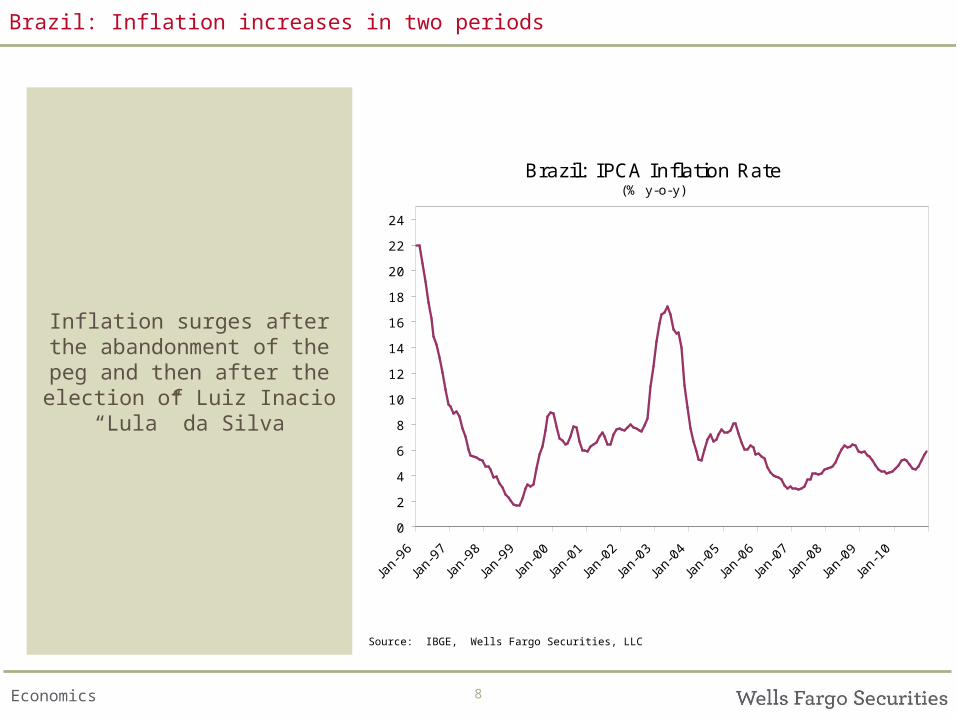
Brazil: Inflation increases in two periods
Inflation surges after the abandonment of the peg
and then after the election of Luiz Inacio “Lula” da
Silva
Brazil: IPCA Inflation Rate(% y-o-y)
02468
1012141618202224
Jan-96
Jan-97
Jan-98
J an-99
Jan-00
Jan-01
J an-02
Jan-03
Jan-04
J an-05
Jan-06
Jan-07
Jan-08
J an-09
Jan-10
Source: IBGE, Wells Fargo Securities, LLC
Economics 9
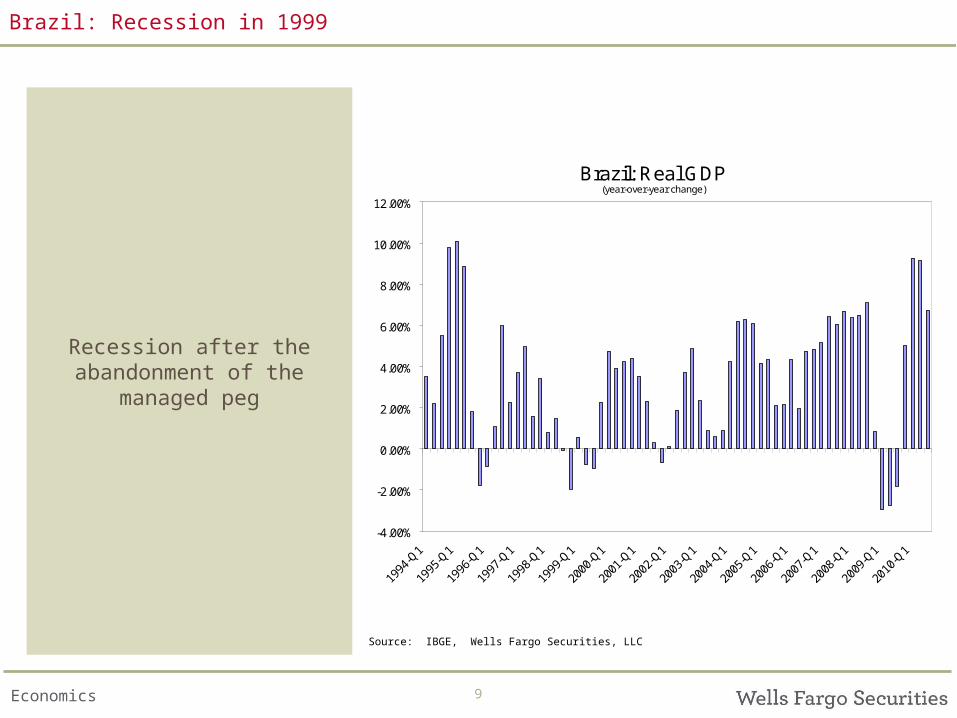
Brazil: Recession in 1999
Recession after the abandonment of the
managed peg
Brazil: Real GDP(year-over-year change)
-4.00%
-2.00%
0.00%
2.00%
4.00%
6.00%
8.00%
10.00%
12.00%
1994
-Q1
1995
-Q1
1996
-Q1
1997
-Q1
1998
-Q1
1999
-Q1
2000
-Q1
2001
-Q1
2002
-Q1
2003
-Q1
2004
-Q1
2005
-Q1
2006
-Q1
2007
-Q1
2008
-Q1
2009
-Q1
2010
-Q1
Source: IBGE, Wells Fargo Securities, LLC

Economics 10
Brazil: Real Personal Consumption Expenditures
Real personal consumption expenditures drops after the
abandonment of the managed peg
Brazil: Real Consumption(year-over-year change)
-10.00%
-5.00%
0.00%
5.00%
10.00%
15.00%
20.00%
1994
-Q1
1995
-Q1
1996
-Q1
1997
-Q1
1998
-Q1
1999
-Q1
2000
-Q1
2001
-Q1
2002
-Q1
2003
-Q1
2004
-Q1
2005
-Q1
2006
-Q1
2007
-Q1
2008
-Q1
2009
-Q1
2010
-Q1
Source: IBGE, Wells Fargo Securities, LLC

Economics 11
Brazil: Current Account
Current account is not affected by the
abandonment of the managed peg but it is after
the second round of devaluation after the
election of Lula
Brazil: Current Account (percentage of GDP)
-1.5
-1.0
-0.5
0.0
0.5
1.0
1995
-Q1
1996
-Q1
1997
-Q1
1998
-Q1
1999
-Q1
2000
-Q1
2001
-Q1
2002
-Q1
2003
-Q1
2004
-Q1
2005
-Q1
2006
-Q1
2007
-Q1
2008
-Q1
2009
-Q1
2010
-Q1
Source: IBGE, Wells Fargo Securities, LLC
Economics 12
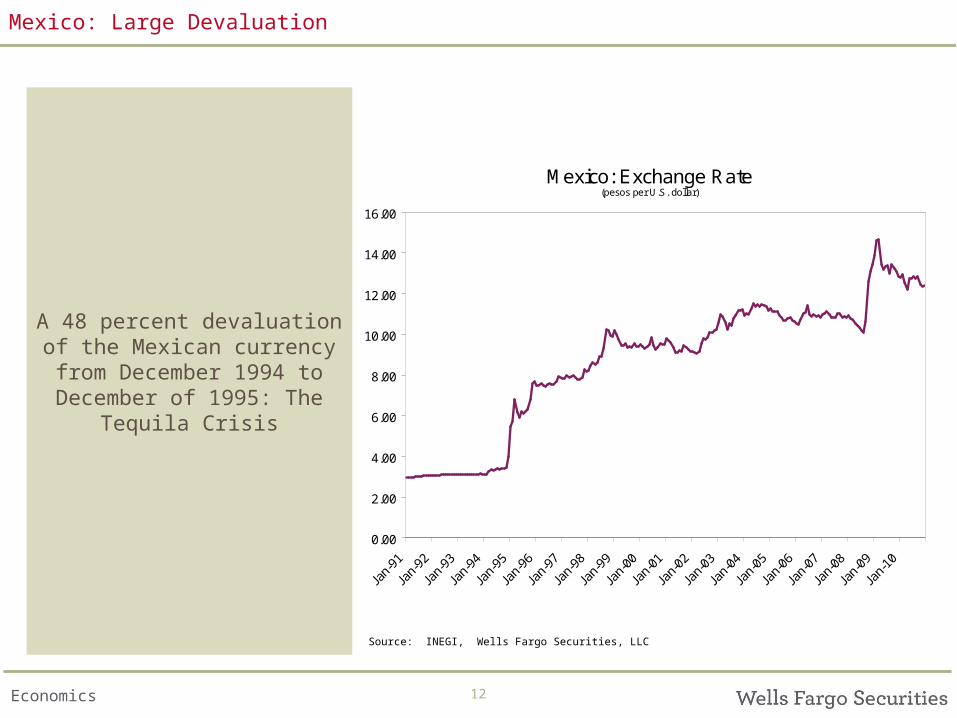
Mexico: Large Devaluation
A 48 percent devaluation of the Mexican currency from
December 1994 to December of 1995: The
Tequila Crisis
Mexico: Exchange Rate(pesos per U.S. dollar)
0.00
2.00
4.00
6.00
8.00
10.00
12.00
14.00
16.00
Jan-9
1
Jan-9
2
Jan-9
3
Jan-9
4
Jan-9
5
Jan-9
6
Jan-9
7
Jan-9
8
Jan-9
9
Jan-0
0
Jan-0
1
Jan-0
2
Jan-0
3
Jan-0
4
Jan-0
5
Jan-0
6
Jan-0
7
Jan-0
8
Jan-0
9
Jan-1
0
Source: INEGI, Wells Fargo Securities, LLC

Economics 13
Mexico: High Inflation
Inflation surges after the devaluation in 1994
Mexico:Consumer Inflation (% change year-over-year)
0.0
10.0
20.0
30.0
40.0
50.0
60.0
Jan-91
Jan-92
Jan-93
J an-94
J an-95
Jan-96
J an-97
Jan-98
Jan-99
Jan-00
J an-01
Jan-02
J an-03
Jan-04
J an-05
J an-06
Jan-07
J an-08
Jan-09
Jan-10
Source: INEGI, Wells Fargo Securities, LLC

Economics
Mexico: Real GDP plunges
Real GDP plunges by 6.2 percent after the
devaluation
Mexico: Real GDP(year-over-year change)
-10.0%
-8.0%
-6.0%
-4.0%
-2.0%
0.0%
2.0%
4.0%
6.0%
8.0%
10.0%
1994
-Q1
1995
-Q1
1996
-Q1
1997
-Q1
1998
-Q1
1999
-Q1
2000
-Q1
2001
-Q1
2002
-Q1
2003
-Q1
2004
-Q1
2005
-Q1
2006
-Q1
2007
-Q1
2008
-Q1
2009
-Q1
2010
-Q1
Source: INEGI, Wells Fargo Securities, LLC

Economics 15
Mexico: Real Personal Consumption Expenditures
Real personal consumption expenditures collapses by
9.5 percent
Mexico: Real Consumption(year-over-year change)
-15.0%
-10.0%
-5.0%
0.0%
5.0%
10.0%
1994
-Q1
1995
-Q1
1996
-Q1
1997
-Q1
1998
-Q1
1999
-Q1
2000
-Q1
2001
-Q1
2002
-Q1
2003
-Q1
2004
-Q1
2005
-Q1
2006
-Q1
2007
-Q1
2008
-Q1
2009
-Q1
2010
-Q1
Source: INEGI, Wells Fargo Securities, LLC
Economics 16
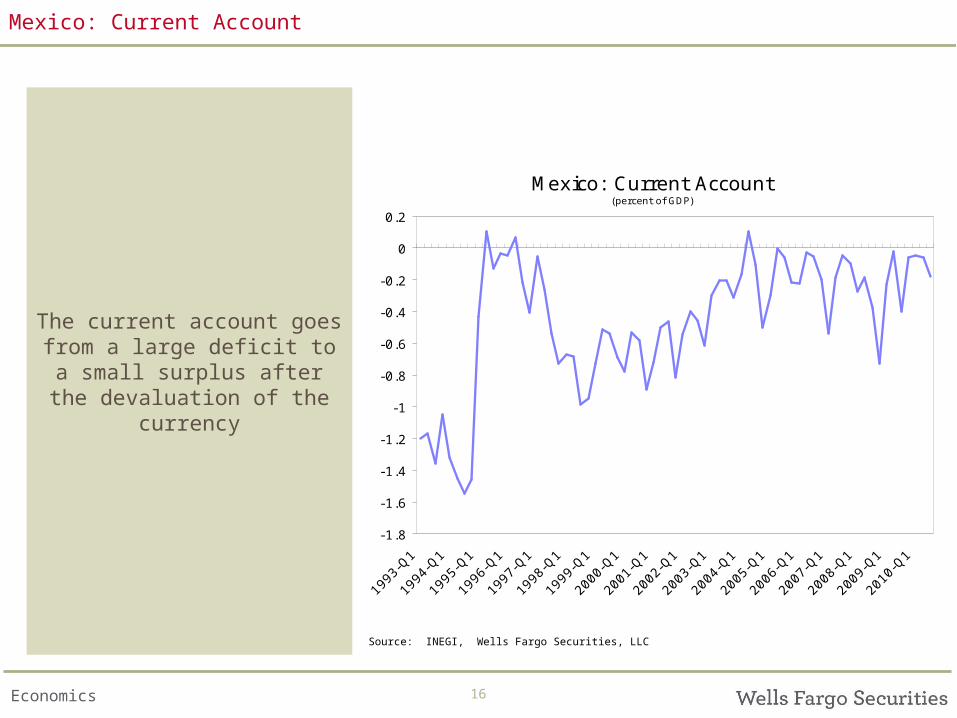
Mexico: Current Account
The current account goes from a large deficit to a small surplus after the
devaluation of the currency
Mexico: Current Account(percent of GDP)
-1.8
-1.6
-1.4
-1.2
-1
-0.8
-0.6
-0.4
-0.2
0
0.2
1993
-Q1
1994
-Q1
1995
-Q1
1996
-Q1
1997
-Q1
1998
-Q1
1999
-Q1
2000
-Q1
2001
-Q1
2002
-Q1
2003
-Q1
2004
-Q1
2005
-Q1
2006
-Q1
2007
-Q1
2008
-Q1
2009
-Q1
2010
-Q1
Source: INEGI, Wells Fargo Securities, LLC
Economics 17
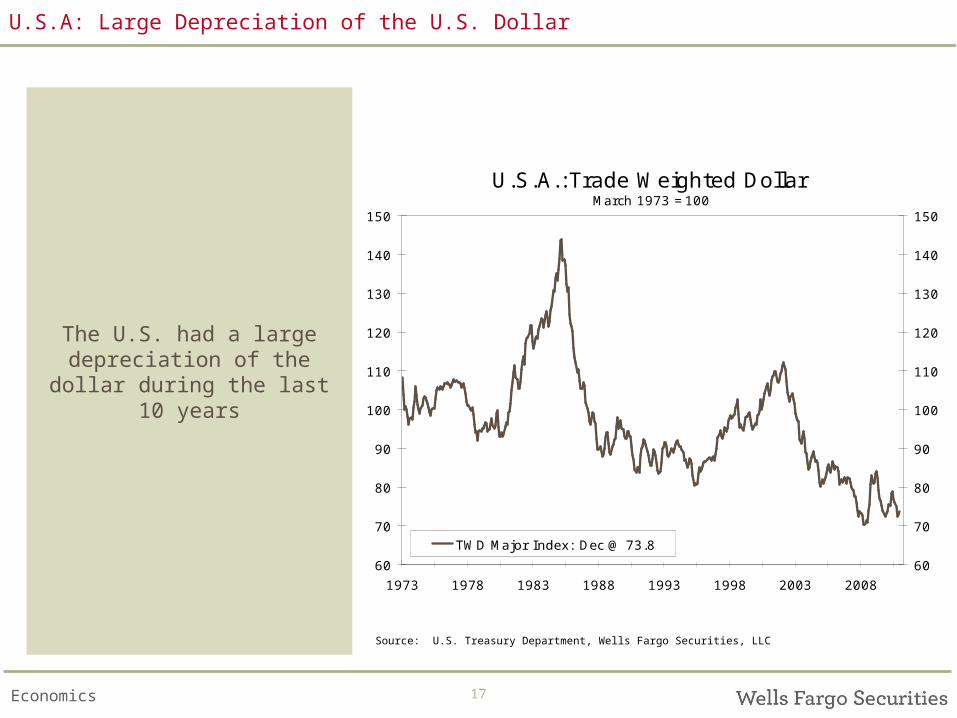
U.S.A: Large Depreciation of the U.S. Dollar
The U.S. had a large depreciation of the dollar during the last 10 years
U.S.A.:Trade Weighted Dollar March 1973 =100
60
70
80
90
100
110
120
130
140
150
1973 1978 1983 1988 1993 1998 2003 200860
70
80
90
100
110
120
130
140
150
TWD Major Index: Dec @ 73.8
Source: U.S. Treasury Department, Wells Fargo Securities, LLC
Economics 18
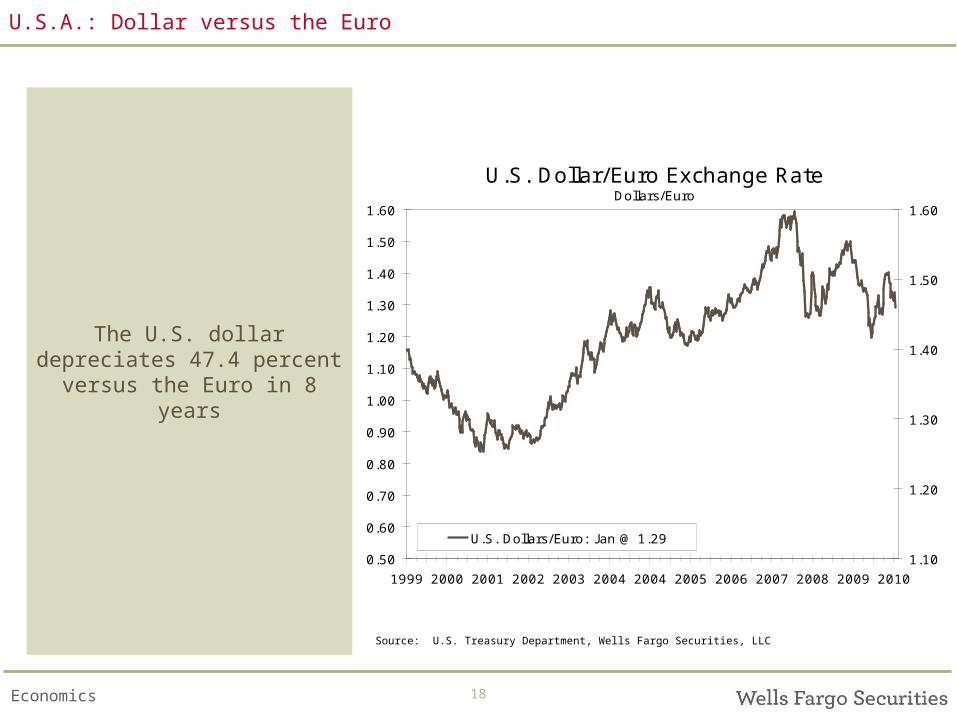
U.S.A.: Dollar versus the Euro
The U.S. dollar depreciates 47.4 percent versus the
Euro in 8 years
U.S. Dollar/Euro Exchange RateDollars/Euro
0.50
0.60
0.70
0.80
0.90
1.00
1.10
1.20
1.30
1.40
1.50
1.60
1999 2000 2001 2002 2003 2004 2004 2005 2006 2007 2008 2009 20101.10
1.20
1.30
1.40
1.50
1.60
U.S. Dollars/Euro: J an @ 1.29
Source: U.S. Treasury Department, Wells Fargo Securities, LLC

Economics 19
U.S.A.: Consumer Prices
U.S. Consumer Prices are not affected significantly by the depreciation of the U.S.
dollar
U.S. Consumer Price IndexYear-over-Year Percent Change
-3.0%
-2.0%
-1.0%
0.0%
1.0%
2.0%
3.0%
4.0%
5.0%
6.0%
92 94 96 98 00 02 04 06 08 10-3.0%
-2.0%
-1.0%
0.0%
1.0%
2.0%
3.0%
4.0%
5.0%
6.0%
CPI : Dec @ 1.5%
Source: U.S. Department of Labor, Wells Fargo Securities, LLC

Economics 20
U.S.A.: Real GDP
While Real GDP weakens during the short recession
in 2001 it continues to grow until the Great Recession in
2008
U.S.A.: Real GDPBars = Compound Annual Rate Line = Yr/Yr % Change
-8%
-6%
-4%
-2%
0%
2%
4%
6%
8%
10%
96 97 98 99 00 01 02 03 04 05 06 07 08 09 10-8%
-6%
-4%
-2%
0%
2%
4%
6%
8%
10%
Real GDP: Q3 @ 2.6%Real GDP: Q3 @ 3.2%
Source: U.S. Department of Commerce, Wells Fargo Securities, LLC
Economics 21
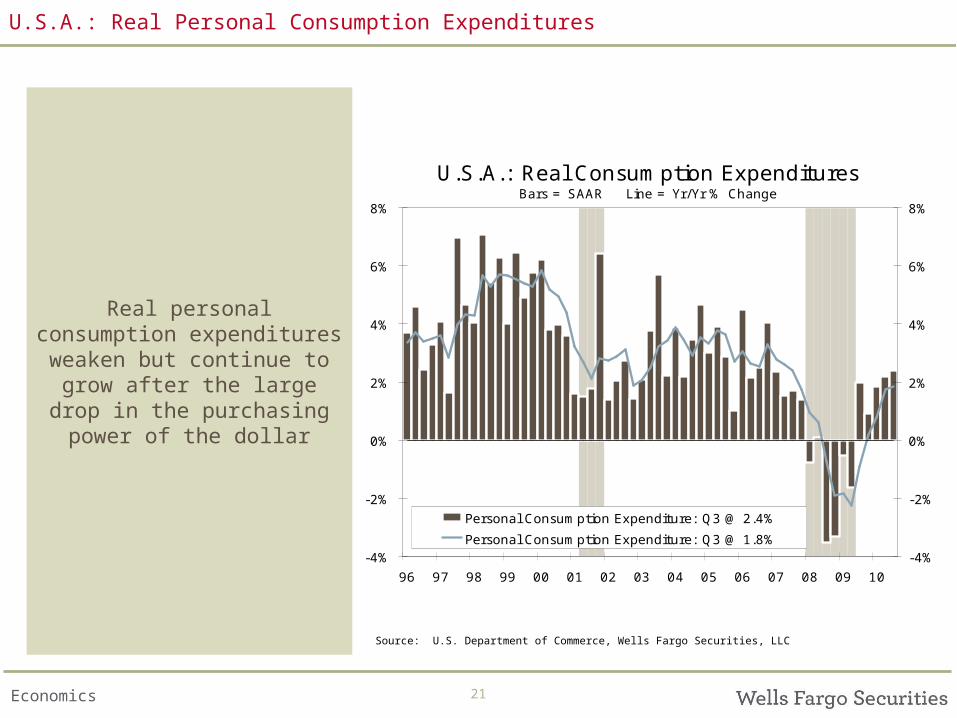
U.S.A.: Real Personal Consumption Expenditures
Real personal consumption expenditures weaken but continue to grow after the
large drop in the purchasing power of the
dollar
U.S.A.: Real Consumption ExpendituresBars = SAAR Line = Yr/Yr % Change
-4%
-2%
0%
2%
4%
6%
8%
96 97 98 99 00 01 02 03 04 05 06 07 08 09 10-4%
-2%
0%
2%
4%
6%
8%
Personal Consumption Expenditure: Q3 @ 2.4%Personal Consumption Expenditure: Q3 @ 1.8%
Source: U.S. Department of Commerce, Wells Fargo Securities, LLC

Economics 22
U.S.A.: Monetary Policy Helps
The U.S. Federal Reserve conducts a very expansive
monetary policy
Source: U.S. Department of Commerce, Wells Fargo Securities, LLC
U.S. Federal Reserve Target Rate
0.00%
1.00%
2.00%
3.00%
4.00%
5.00%
6.00%
7.00%
2000 2002 2004 2006 2008 20100.00%
1.00%
2.00%
3.00%
4.00%
5.00%
6.00%
7.00%US Federal Reserve: J an @ 0.25%
Economics 23
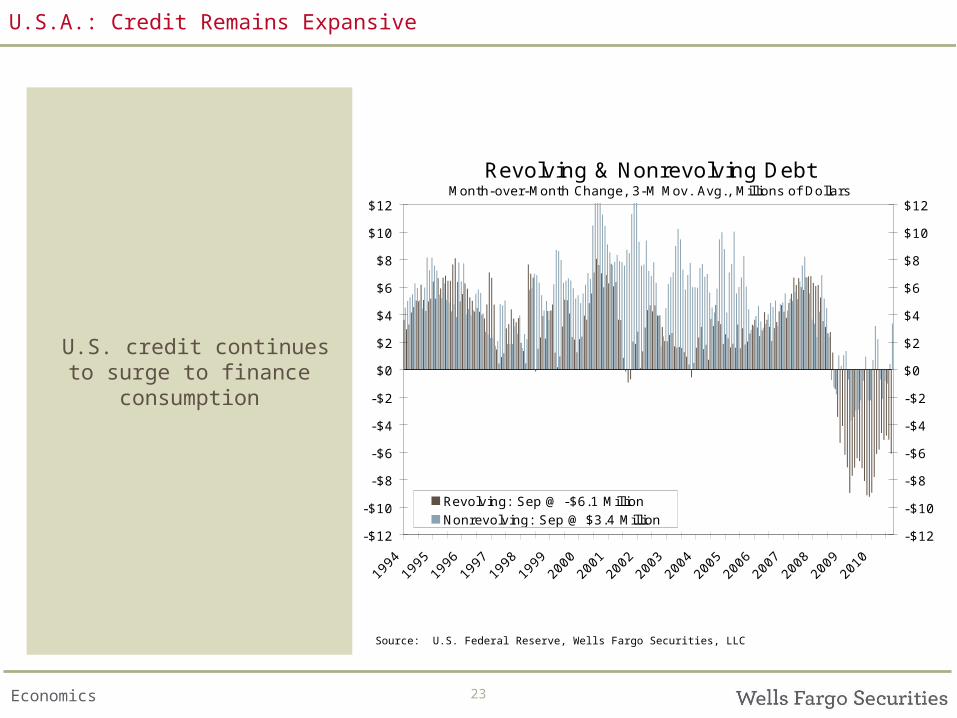
U.S.A.: Credit Remains Expansive
U.S. credit continues to surge to finance
consumption
Revolving & Nonrevolving DebtMonth-over-Month Change, 3-M Mov. Avg., Millions of Dollars
-$12
-$10
-$8
-$6
-$4
-$2
$0
$2
$4
$6
$8
$10
$12
1994
1995
1996
1997
1998
1999
2000
2001
2002
2003
2004
2005
2006
2007
2008
2009
2010
-$12
-$10
-$8
-$6
-$4
-$2
$0
$2
$4
$6
$8
$10
$12
Revolving: Sep @ -$6.1 MillionNonrevolving: Sep @ $3.4 Million
Source: U.S. Federal Reserve, Wells Fargo Securities, LLC
Economics 24
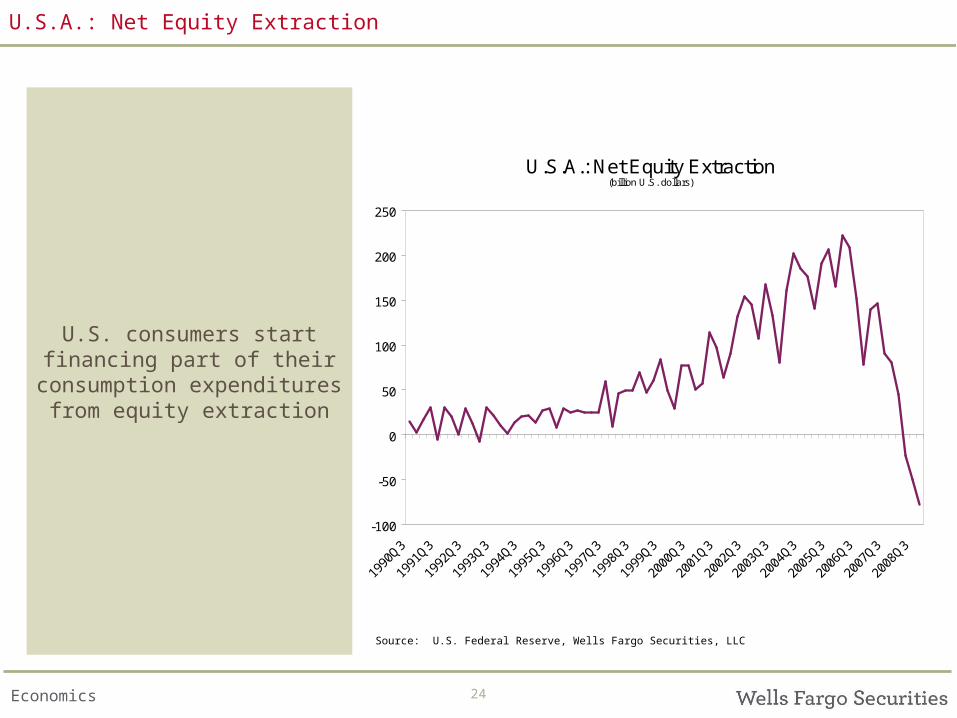
U.S.A.: Net Equity Extraction
U.S. consumers start financing part of their
consumption expenditures from equity extraction
U.S.A.: Net Equity Extraction(billion U.S. dollars)
-100
-50
0
50
100
150
200
250
1990
Q3
1991
Q3
1992
Q3
1993
Q3
1994
Q3
1995
Q3
1996
Q3
1997
Q3
1998
Q3
1999
Q3
2000
Q3
2001
Q3
2002
Q3
2003
Q3
2004
Q3
2005
Q3
2006
Q3
2007
Q3
2008
Q3
Source: U.S. Federal Reserve, Wells Fargo Securities, LLC

Economics 25
U.S.A.: Fiscal Policy Helps
The U.S. government contributes its share with
tax rebates during the Bush administration
Real Disposable IncomeMonth-over-Month Percent Change
-4%
-2%
0%
2%
4%
6%
94 95 96 97 98 99 00 01 02 03 04 05 06 07 08 09 10-4%
-2%
0%
2%
4%
6%Real Disposable Income: Nov @ 0.2%
Source: U.S. Department of Commerce, Wells Fargo Securities, LLC

Economics 26
U.S.A.: Household Debt
U.S. household mortgage debt surges to keep up with
expenditures
Household Debt - Consumer & MortgageAs a Percent of Disposable Personal Income
0%
20%
40%
60%
80%
100%
120%
60 65 70 75 80 85 90 95 00 05 100%
20%
40%
60%
80%
100%
120%Consumer Credit: Q3 @ 21.1%Home Mortgages: Q3 @ 88.6%
Source: U.S. Federal Reserve, Wells Fargo Securities, LLC

Economics 27
U.S.A.: Debt Service Ratio
U.S. household debt to service ratio increases
considerably during the period and up until the
Great Recession
Household Debt Service RatioAs a Percent of Disposable Personal Income
10.0%
10.5%
11.0%
11.5%
12.0%
12.5%
13.0%
13.5%
14.0%
90 91 92 93 94 95 96 97 98 99 00 01 02 03 04 05 06 07 08 09 1011.5%
12.0%
12.5%
13.0%
13.5%
14.0%DSR: Q3 @ 11.9%
Source: U.S. Federal Reserve, Wells Fargo Securities, LLC
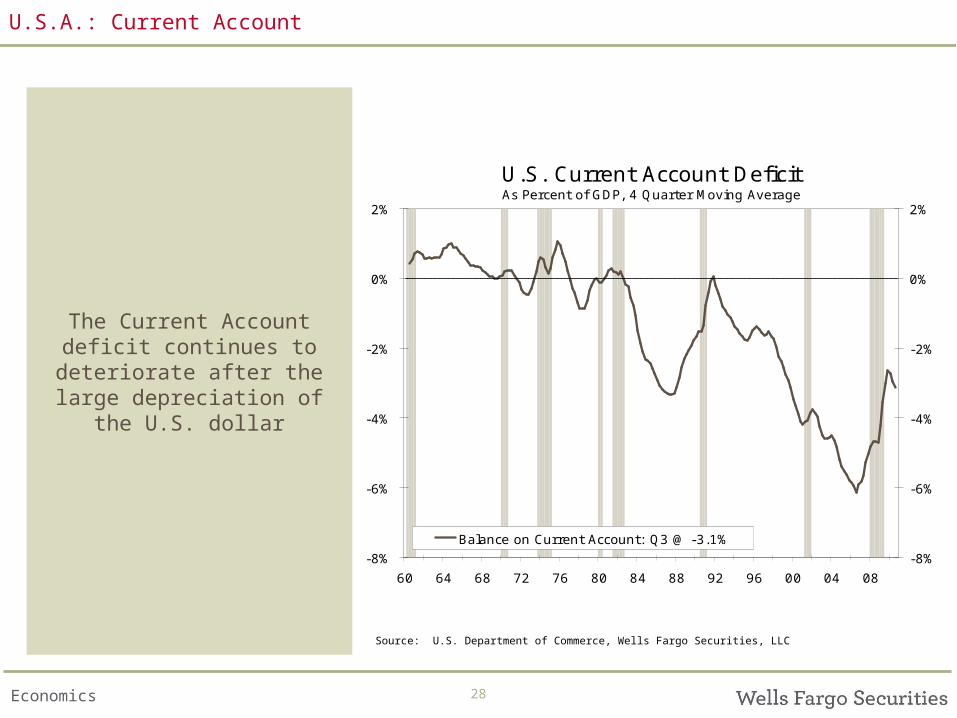
Economics 28
U.S.A.: Current Account
The Current Account deficit continues to deteriorate
after the large depreciation of the U.S. dollar
U.S. Current Account Deficit As Percent of GDP, 4 Quarter Moving Average
-8%
-6%
-4%
-2%
0%
2%
60 64 68 72 76 80 84 88 92 96 00 04 08-8%
-6%
-4%
-2%
0%
2%
Balance on Current Account: Q3 @ -3.1%
Source: U.S. Department of Commerce, Wells Fargo Securities, LLC

Economics 29
U.S.A.: The China/Wal-Mart Effect
Another reason why there was little inflation and little
change in personal consumption expenditures:
The Chinese keep their currency undervalued
Chinese Exchange RateCNY per USD
4.5
5.0
5.5
6.0
6.5
7.0
7.5
8.0
8.5
9.0
1990 1994 1998 2002 2006 20104.5
5.0
5.5
6.0
6.5
7.0
7.5
8.0
8.5
9.0
CNY per USD: J an @ 6.60
Source: U.S. Department of Commerce, Wells Fargo Securities, LLC

Economics 30
Conclusion
The Day of Reckoning for the U.S. economy is here!
• The Great Recession is just the delayed response to the almost 50 percent devaluation of the U.S. dollar• Monetary policy and fiscal policy, together with lax regulation, contributed to delay the day of reckoning for the U.S. consumer and the U.S. economy• The U.S. current account deficit is deteriorating again which means that U.S. consumers are still consuming too much compared to U.S. production • U.S. savings are increasing, which is good for the medium to long run, even though this is actually hoarding rather than saving• But policies, both fiscal and monetary, remain extremely expansive and could make the U.S. recovery very volatile, especially if consumers start to reduce savings again

Economics 31
Wells Fargo Securities, LLC Economics Group
John Silvia, Chief Economist [email protected] Mark Vitner, Senior Economist [email protected] Jay Bryson, Global Economist [email protected] Scott Anderson, Senior Economist [email protected] Eugenio Aleman, Senior Economist [email protected] Sam Bullard, Senior Economist [email protected]
Anika Khan, Economist [email protected] Azhar Iqbal, Econometrician [email protected] Ed Kashmarek, Economist [email protected] Tim Quinlan, Economist [email protected] Michael Brown, Economist [email protected]
Tyler Kruse, Economic Analyst [email protected] Joe Seydl, Economic Analyst [email protected] Sarah Watt, Economic Analyst [email protected]
Peg Gavin [email protected] Carol Nighengale [email protected]
Economists
Senior Economists
Executive Assistant
Global Head of Research and Economics: Diane Schumaker-Krieg
Chief Economist: John Silvia
301 S. College StreetMAC D1053-077
Charlotte, NC28288
a
Wells Fargo Securities Economics Group publications are produced by Wells Fargo Securities, LLC, a U.S broker-dealer registered with the U.S. Securities and Exchange Commission, the Financial Industry Regulatory Authority, and the Securities Investor Protection Corp. Wells Fargo Securities, LLC, distributes these publications directly and through subsidiaries including, but not limited to, Wells Fargo & Company, Wells Fargo Bank N.A, Wells Fargo Advisors, LLC, and Wells Fargo Securities International Limited. The information and opinions herein are for general information use only. Wells Fargo Securities, LLC does not guarantee their accuracy or completeness, nor does Wells Fargo Securities, LLC assume any liability for any loss that may result from the reliance by any person upon any such information or opinions. Such information and opinions are subject to change without notice, are for general information only and are not intended as an offer or solicitation with respect to the purchase or sales of any security or as personalized investment advice. Wells Fargo Securities, LLC is a separate legal entity and distinct from affiliated banks and is a wholly owned subsidiary of Wells Fargo & Company © 2010 Wells Fargo Securities, LLC.
SECURITIES: NOT FDIC-INSURED/NOT BANK-GUARANTEED/MAY LOSE VALUE
Economic Analysts