statement of coal resources foxleigh coal mine and
TRANSCRIPT
Company Announcements ASX Limited By Electronic Lodgement 19 October 2018 Statement of Coal Resources
Foxleigh Coal Mine and adjacent tenements
Realm Resources Limited (Realm, ASX: RRP) announces an updated Statement of Coal Resources for Foxleigh Coal Mine and adjacent tenements (Foxleigh) in accordance with the JORC Code 2012. Relevant information is summarised below and detail is given in the attached Competent Person Report prepared by McElroy Bryan Geological Services (MBGS) dated 31 August 2018.
The last Coal Resources total for Foxleigh was 42.5Mt Measured, 79.9Mt Indicated and 31.9Mt Inferred, reported as follows:
o 22 December 2017, 28.5Mt Measured, 24.5Mt Indicated and 10Mt Inferred (Foxleigh Plains: ML70431 & ML70470)
o 13 September 2017, 42Mt Indicated and 6Mt Inferred (Roper Creek: EPC855 & EPC1669)
o 20 December 2016, 14.0Mt Measured, 13.4Mt Indicated and 15.9Mt Inferred (One Tree/Pipeline, Far South & Dagger’s Tip: ML70309, ML70431, ML70470, ML70171 & EPC11
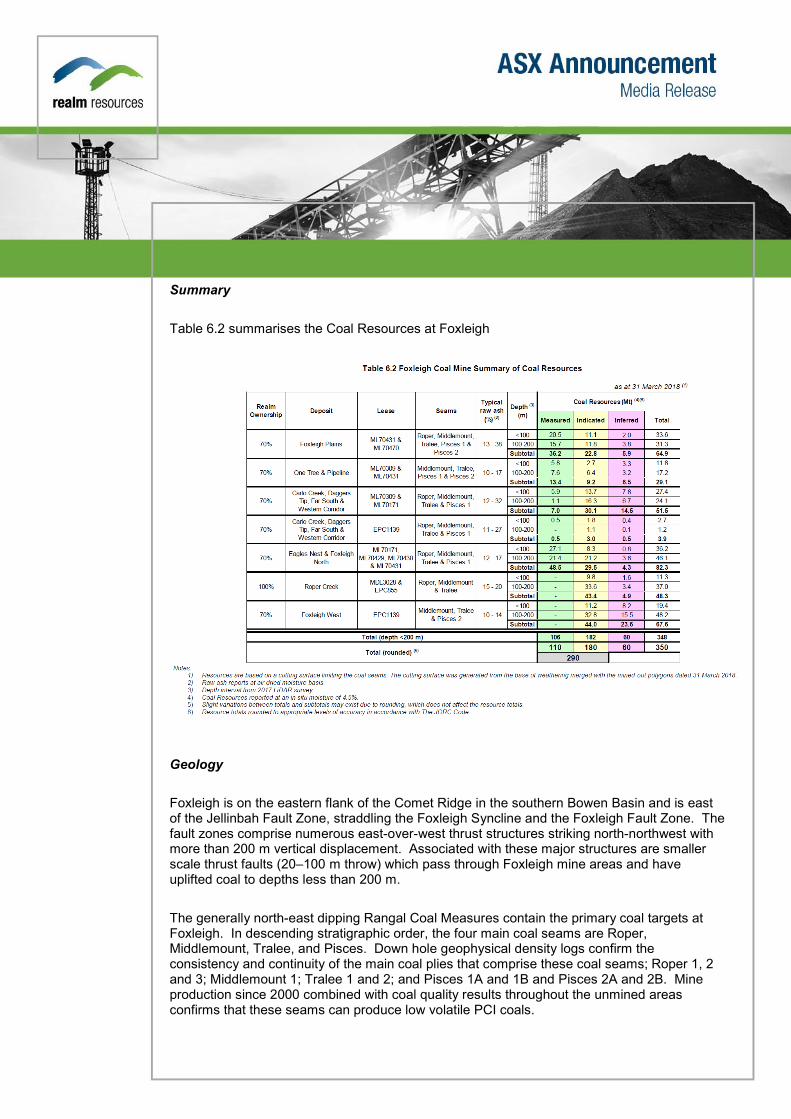
Coal Resources to 200 m depth now total 110Mt Measured, 180Mt Indicated and 60Mt Inferred, as shown in Table 6.2 below.
The updated Statement of Coal Resources includes approximately 48.5Mt Measured, 73.5Mt Indicated and 27.9Mt Inferred Resource from areas not previously included in a Statement of Resources for Foxleigh, ie Foxleigh West (44Mt Indicated and 23.6Mt Inferred) and Foxleigh North/Eagle’s Nest (48.5Mt Measured, 29.5Mt Indicated and 4.3Mt Inferred). Coal occurrences in these areas were identified by previous owners but not reported as Coal Resources in accordance with the JORC Code due to insufficient supporting data being available. With strategic focused exploration drilling and further geological interpretation, Realm has advanced the earlier reconnaissance work and been able to classify a reasonable proportion of these coal occurrences as Coal Resources in accordance with the JORC Code.
This Statement of Coal Resources will be used to prioritise areas for further exploration, mine design and economic analyses to determine whether the Statement of Coal Reserves for Foxleigh should be updated (other than to record depletion due to mining). No timetable has been set for such a determination at this time.
Directors advise caution in making inferences for possible conversion of Resources to Reserves under the JORC Code in the future. Significant factors that will impact potential conversion at Foxleigh include existing surface infrastructure (major third-party water pipelines), natural watercourses through the areas and complex geological structures.
Summary
Table 6.2 summarises the Coal Resources at Foxleigh
Geology Foxleigh is on the eastern flank of the Comet Ridge in the southern Bowen Basin and is east of the Jellinbah Fault Zone, straddling the Foxleigh Syncline and the Foxleigh Fault Zone. The fault zones comprise numerous east-over-west thrust structures striking north-northwest with more than 200 m vertical displacement. Associated with these major structures are smaller scale thrust faults (20–100 m throw) which pass through Foxleigh mine areas and have uplifted coal to depths less than 200 m. The generally north-east dipping Rangal Coal Measures contain the primary coal targets at Foxleigh. In descending stratigraphic order, the four main coal seams are Roper, Middlemount, Tralee, and Pisces. Down hole geophysical density logs confirm the consistency and continuity of the main coal plies that comprise these coal seams; Roper 1, 2 and 3; Middlemount 1; Tralee 1 and 2; and Pisces 1A and 1B and Pisces 2A and 2B. Mine production since 2000 combined with coal quality results throughout the unmined areas confirms that these seams can produce low volatile PCI coals.
Sequences of Tertiary clays, sands and gravels that overlie the Permian coal sequentially increase in thickness from several metres up to 80 m, with the thickest Tertiary sediments occurring in the Roper Creek area. The base of weathering of the Permian strata ranges from <5 m to 90 m from surface. Deeper weathering profiles are associated with thick Tertiary sediments. Permian weathering below the Tertiary cover is generally 10-15 m thick. The coal seams subcrop along strike to the north-northwest and, in general, dip at 5° - 15°, with significantly steeper dips adjacent to the thrust faults and associated with fold structures. Geological interpretation The geology of the Foxleigh deposits is understood with a reasonable level of confidence and it is believed that coal volume estimations are sound. Confidence in the geological interpretation is directly related to the relative complexity of the geological structure, the drill hole spacing and the availability of seismic data. The eastern deposits of Foxleigh Plains, One Tree, Pipeline and Carlo Creek are structurally complex and have closer spaced drill holes than the western deposits of Roper Creek, Eagle’s Nest, Foxleigh North, Western Corridor, Far South and Foxleigh West. Drill hole spacing is generally 25–150, but holes are up to 250 m apart in the eastern deposits and along the seam subcrop areas of the western deposits. In the down-dip areas of the western deposits, the southern area of Foxleigh West and at Roper Creek the drill hole spacing is generally 250–500 m but can also be up to 1,000 m. The consistency of the geophysical long-spaced density signature provides confidence in the consistency, continuity and general quality of each seam. The Foxleigh deposits are predominantly affected by large thrusts faults and numerous smaller thrust faults which locally thicken and/or repeat the coal seams. The structural interpretation is complemented by numerous high quality 2D seismic lines which provide a good understanding of the nature and extent of faulting and folding. Small to large thrust faults striking north-northwest have been interpreted from the 2D seismic survey and drill hole information. Larger thrust faults have been modelled, however due to the complexity of the deposit not all observed thrust faults could be modelled. The combination of the very close spaced drilling and seismic data provides confidence in the geological interpretation where there is data coverage, however there may be local variations to the interpretation due to smaller faults. Seam quality has not been changed due to the thrust faulting. Igneous sill intrusions have been identified in drill holes in the northern deposits. Further drilling is required to improve confidence in the extent of the sills and their influence on the coal seam quality. Sampling and sub-sampling techniques Approximately 1,300 coal core samples from 320 drill holes have been analysed for quality at Foxleigh. The cores from most of these holes has been sampled on a lithology basis, analysed for apparent relative density and then combined to a full seam/ply representative sample for a full suite of analyses to be undertaken. All coal core and parting samples were
despatched for analysis. Whole cylindrical coal core sections were sampled individually into bags and labelled. LOX chip samples were analysed to determine the base of weathering and the oxidised coal zone prior to mining. Core sampling was undertaking in conjunction with the geophysical logs to ensure ply sample intervals are consistent from hole to hole. The coal core was not split as the whole seam core was sampled for analysis. Sub-sampling of the sampled core is part of the treatment procedure at the laboratory where a portion of the sample is reserved for sample analysis checks and or additional testing. Drilling techniques Almost 7,000 holes have been drilled in the various Foxleigh coal deposits since the mid-1960s, with most of the drilling undertaken by CAML and AAMC from 1997 - 2016. Whilst the large proportion of holes (95%) are non-core, there are approximately 320 core holes with coal analysis of the major seams. Core diameters varied from HQ (61 mm), HMLC (63 mm), PQ (83 mm), 4C (100 mm) and 8C (200 mm). All holes were drilled vertically. Exploration drilling at Foxleigh includes:
• Non-core holes; • Fully cored holes for geotechnical and coal quality; • Partially cored holes for coal quality; • Large diameter (200mm) core for washability studies; and • Limit of Oxidation (LOX) holes
Non-core holes recovered chip samples at 1m intervals for lithological logging while core holes were logged for geological and geotechnical purposes. Quantitative logging of lithology, stratigraphy, texture and hardness were conducted using standard dictionary definitions.
Criteria used for classification, including drill and data spacing and distribution Coal Resources have been classified as Measured, Indicated or Inferred based on spacing of drill hole data and confidence in seam continuity, consistency, grade and predictability. Drilling is supported by extensive 2D seismic surveys, regional geological knowledge and nearby mining. Drill hole spacings range from approximately 25 m to over 500 m, with more closely-spaced holes (<20 m) used to accurately delineate seam subcrops in the mined areas. Where drill hole data is closely spaced and supported by seismic data, confidence in coal seam continuity, grade and predictability is sufficient to allow resources to be classified as Measured or Indicated. Where data spacing increases, confidence in coal seam continuity and predictability decreases and resources in these areas are classified as Indicated or Inferred. Continuity of seam character is based on consistency of the geophysical signature of coal seams and continuity apparent in the seismic sections.
Structural complexity is the main factor that determines confidence in geological knowledge and drives drill hole spacing at Foxleigh. Cross sections through drill holes in all areas were examined to incorporate structural complexity/simplicity into the confidence of classification. Classification was modified based on structural complexity using the cross-section analysis. The Foxleigh area is divided into three domains: -
• Foxleigh Syncline, Eastern Domain - high structural complexity. Includes Foxleigh Plains, One Tree, Pipeline, Carlo Creek and Dagger’s Tip.
• Foxleigh Syncline, Western Domain - low to moderate structural complexity. Includes low structural complexity with Far South and Western Corridor becoming moderately structured in the Foxleigh North, Eagle’s Nest and Roper Creek deposits.
• Foxleigh West Domain - moderate to highly structured. Includes the Foxleigh West deposit only.
Coal Resources were limited to the lateral and vertical extent of drill holes because of the highly complex faulted geology of Foxleigh. Coal occurrences that may be present through extrapolation beyond the drill holes were not included as a resource. This method of resource assessment is appropriate to represent the geological seam complexity and variation within the Foxleigh Project deposits. Sample analysis method The types of testing undertaken historically and by Realm are industry standard tests used internationally as part of the analysis and assessment of black coal deposits and conform to Australian standards for coal exploration. The control procedures are primarily with the NATA accredited laboratories which undertake the testing to Australian Standard testing procedures. The testing program procedures have sufficient in-built reserve sampling to allow for QA/QC checks of anomalous results if required. While different laboratories have undertaken the historical coal analytical testing at Foxleigh no laboratory specific anomalies have been identified. Coal cores have been analysed for apparent relative density then combined to a full seam/ply representative sample for full suite analysis. Combined full seam/ply analysis was modelled for Coal Resource reporting. Coal quality data has been modelled where available for raw and clean coal proximate analysis, including a derived in-situ density using the Preston Sanders equation, raw ash, volatiles, moisture, energy, total sulphur and phosphorous. Petrography, ultimate analysis, simulated ash and yield have also been modelled. All coal quality data is reported at an air-dried moisture basis except for insitu density, which was reported at insitu moisture of 4.5%.
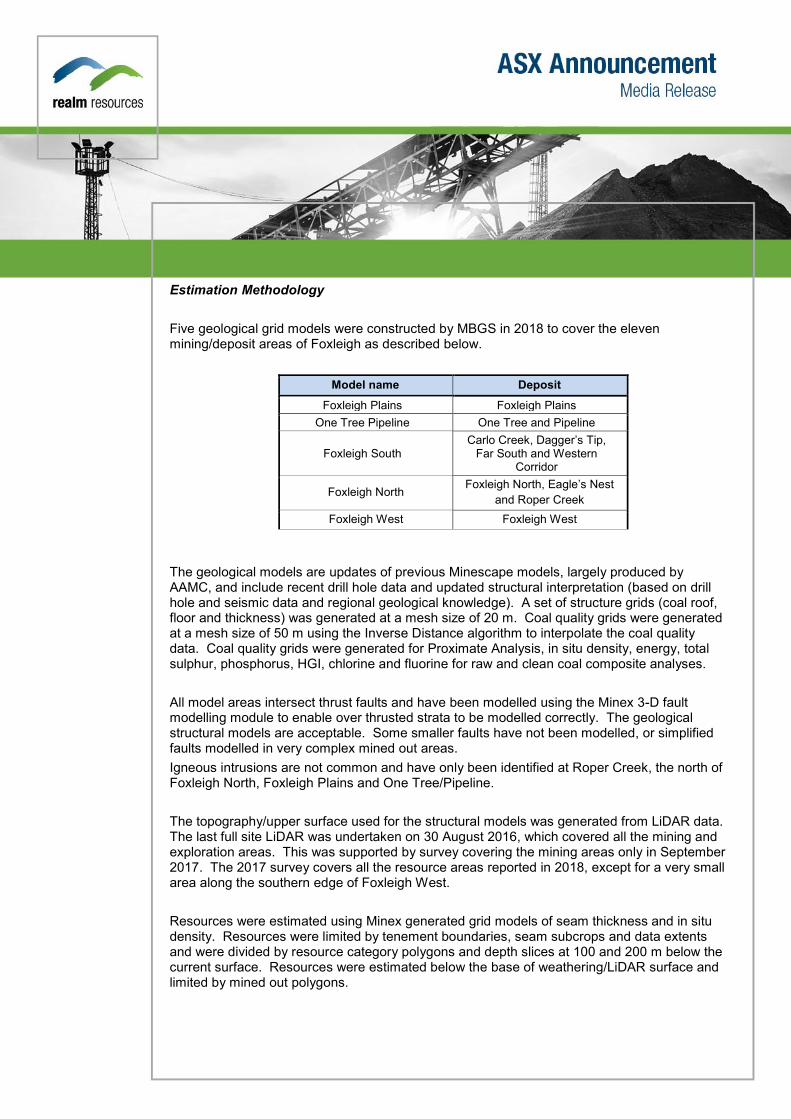
Estimation Methodology Five geological grid models were constructed by MBGS in 2018 to cover the eleven mining/deposit areas of Foxleigh as described below.
The geological models are updates of previous Minescape models, largely produced by AAMC, and include recent drill hole data and updated structural interpretation (based on drill hole and seismic data and regional geological knowledge). A set of structure grids (coal roof, floor and thickness) was generated at a mesh size of 20 m. Coal quality grids were generated at a mesh size of 50 m using the Inverse Distance algorithm to interpolate the coal quality data. Coal quality grids were generated for Proximate Analysis, in situ density, energy, total sulphur, phosphorus, HGI, chlorine and fluorine for raw and clean coal composite analyses. All model areas intersect thrust faults and have been modelled using the Minex 3-D fault modelling module to enable over thrusted strata to be modelled correctly. The geological structural models are acceptable. Some smaller faults have not been modelled, or simplified faults modelled in very complex mined out areas. Igneous intrusions are not common and have only been identified at Roper Creek, the north of Foxleigh North, Foxleigh Plains and One Tree/Pipeline. The topography/upper surface used for the structural models was generated from LiDAR data. The last full site LiDAR was undertaken on 30 August 2016, which covered all the mining and exploration areas. This was supported by survey covering the mining areas only in September 2017. The 2017 survey covers all the resource areas reported in 2018, except for a very small area along the southern edge of Foxleigh West. Resources were estimated using Minex generated grid models of seam thickness and in situ density. Resources were limited by tenement boundaries, seam subcrops and data extents and were divided by resource category polygons and depth slices at 100 and 200 m below the current surface. Resources were estimated below the base of weathering/LiDAR surface and limited by mined out polygons.
Model name Deposit Foxleigh Plains Foxleigh Plains
One Tree Pipeline One Tree and Pipeline
Foxleigh South Carlo Creek, Dagger’s Tip,
Far South and Western Corridor
Foxleigh North Foxleigh North, Eagle’s Nest and Roper Creek
Foxleigh West Foxleigh West
Cut-off grades and basis No seam thickness or coal quality cut-offs were used in resource estimations. Such cut-offs may be applied during mining reserve estimations. In most areas, coal seams had low to moderate ash contents and all would be suitable to produce marketable products with beneficiation as required.
Mining and metallurgical methods and parameters and other material modifying factors considered to date Infrastructure and environmental features were not used as limits to the resource. This includes waterways such as Roper Creek and Oaky Creek and the pipeline from Bingegang Weir to BMA towns and mines. Mining studies will assess limits and economic cut-offs in such circumstances. Mining is currently by open cut methods and given average seam thicknesses (typically 1 – 5 m), depth to the seams and structural complexity in the defined deposit areas, future mining will continue by open cut methods. Current operations use trucks and shovels to handle the structural complexity and this is expected to continue. Foxleigh Mine has an onsite CHPP and all coal is currently processed through the plant to achieve the target products. The ranks of the coal seams in the resource areas are similar to those currently mined at Foxleigh and the coal preparation and handling characteristics are also expected to be similar. A drill core laboratory testing programme designed to test the coal washability and clean coal product was carried out on a selection of cores. The program was designed to establish likely product types from the coal seams at Foxleigh. Analysis of float/sink and clean coal composite results confirmed that the coal will require washing to meet the target product market specifications and indicated that a low ash, low volatile PCI product could be beneficiated at economic yields. Current production and sale of this coal product type at Foxleigh Mine from the same seams as the resource areas is confirmation that the resource seams could be sold into these markets. The Foxleigh Project deposits target the same coal measures and it is likely that the overburden geochemistry and coal processing rejects from the current mining operation and the coal handling facilities will be similar. The environmental impacts will be similar.
Foxleigh Coal Mine Coal Resources, Competent Person Statement
The information contained in this report, which relates to estimates of Coal Resources, is based on data compiled by Mr Rowan Johnson who holds a Bachelor of Science degree and is a Member of the Australasian Institute of Mining and Metallurgy (AusIMM).
Rowan Johnson is a Senior Geologist with McElroy Bryan Geological Services Pty Limited. Mr Johnson has over 30 years’ experience in coal exploration and 20 years experience in resource estimation. Mr Johnson has sufficient experience that is relevant to the style of mineralisation and type of deposit under consideration and to the activity being undertaken to qualify as Competent Person as defined in the JORC Code 2012.
Neither Mr Johnson, nor McElroy Bryan Geological Services Pty Limited, has any material interest or entitlement, direct or indirect, in the securities of Realm Resources Limited or any associated companies.
The estimates of Coal Resources presented in this report have been reported in accordance with the JORC Code 2012. Mr Johnson consents to the release of the report, in the form and context in which it appears. Authorised by Mr Gordon Galt Chairman, Realm Resources Limited For further information, please contact: Graham Yerbury – Chief Financial Officer Phone: +61 (07) 3022 9600 Email: [email protected] About Realm Information on Realm Resources Limited is available on the Company’s website at www.realmresources.com.au
Level 2 ● 5 – 7 Havilah Street ● CHATSWOOD ● NSW ● 2067 ● (+61 2) 8440 7800 PO Box 34 ● WILLOUGHBY ● NSW ● 2068 ● e:[email protected] ● www.mbgs.com.au
COMPETENT PERSON REPORT
COAL RESOURCES
Foxleigh Coal Mine
Bowen Basin, Queensland
Prepared for:
Realm Resources Limited
Prepared by:
McElroy Bryan Geological Services Pty Ltd
31 August 2018
Foxleigh Coal Mine Competent Person Report, August 2018 Page i
COPYRIGHT NOTICE
© McElroy Bryan Geological Services Pty Ltd (2018). Except as provided by the Copyright Act 1968,
no part of this report may be reproduced, copied, stored in a retrieval system or transmitted in any
form or by any means without the prior written permission of McElroy Bryan Geological Services Pty
Ltd (MBGS).
This report is for the use only of the party to whom it is addressed (Realm Resources Limited) and for
no other purpose. If Middlemount South Pty Ltd wishes to make this report, or the information
contained in the report, available to a third party, it must obtain McElroy Bryan Geological Services’
written consent, unless McElroy Bryan Geological Services advises The Client otherwise in writing.
No responsibility is accepted to any third party who may use or rely on the whole or any part of the
content of this report.
Report author/s: Rowan Johnson, Doyle Pryde and Janet Bartolo
Peer reviewed by: Kerry Whitby
Document number: 433/16/03
Date issued: 31 August 2018
Distributed to: Mitch Barnes, Middlemount South Pty Ltd
Foxleigh Coal Mine Competent Person Report, August 2018 Page ii
TABLE OF CONTENTS
1 INTRODUCTION............................................................................................................................... 1
1.1 Purpose ...................................................................................................................................... 1
1.2 Location, tenement and ownership ............................................................................................ 1
2 COAL RESOURCE DECLARATION ............................................................................................... 6
3 EXPLORATION HISTORY ............................................................................................................... 8
3.1 Historical exploration ................................................................................................................. 8
3.2 Middlemount South exploration ................................................................................................. 9
3.2.1 Drilling .......................................................................................................................... 10
3.2.2 Seismic ........................................................................................................................ 10
4 GEOLOGY ...................................................................................................................................... 12
4.1 Regional geology ..................................................................................................................... 12
4.2 Local geology ........................................................................................................................... 12
4.2.1 Stratigraphy ................................................................................................................. 12
4.2.2 Structure ...................................................................................................................... 13
4.2.3 Weathering .................................................................................................................. 13
4.2.4 Igneous intrusions ....................................................................................................... 13
4.3 Coal seams .............................................................................................................................. 14
4.3.1 Foxleigh Syncline ........................................................................................................ 14
4.3.2 Foxleigh West .............................................................................................................. 14
4.4 Foxleigh project deposits ......................................................................................................... 15
4.4.1 Foxleigh Plains ............................................................................................................ 16
4.4.2 One Tree ..................................................................................................................... 16
4.4.3 Pipeline ........................................................................................................................ 16
4.4.4 Carlo Creek ................................................................................................................. 17
4.4.5 Dagger’s Tip ................................................................................................................ 17
4.4.6 Far South ..................................................................................................................... 17
4.4.7 Western Corridor ......................................................................................................... 17
4.4.8 Foxleigh North ............................................................................................................. 18
4.4.9 Eagle’s Nest ................................................................................................................ 18
4.4.10 Roper Creek ................................................................................................................ 18
4.4.11 Foxleigh West .............................................................................................................. 18
4.5 Coal quality .............................................................................................................................. 32
4.5.1 Foxleigh Syncline ........................................................................................................ 32
4.5.2 Foxleigh West .............................................................................................................. 34
5 GEOLOGICAL DATA ..................................................................................................................... 35
5.1 Geological data ........................................................................................................................ 35
5.1.1 Survey and mapping.................................................................................................... 35
Foxleigh Coal Mine Competent Person Report, August 2018 Page iii
5.1.2 Drill hole information .................................................................................................... 35
5.1.3 Geophysical data ......................................................................................................... 35
5.1.4 Geological logging ....................................................................................................... 36
5.2 Geological modelling ............................................................................................................... 36
6 COAL RESOURCES ...................................................................................................................... 38
6.1 Resource classification and limitations .................................................................................... 38
6.2 Coal Resources ....................................................................................................................... 39
6.3 Coal Resource reconciliation ................................................................................................... 40
FIGURES
Figure 1.1 Location plan ................................................................................................................ 3
Figure 1.2 Tenure plan .................................................................................................................. 4
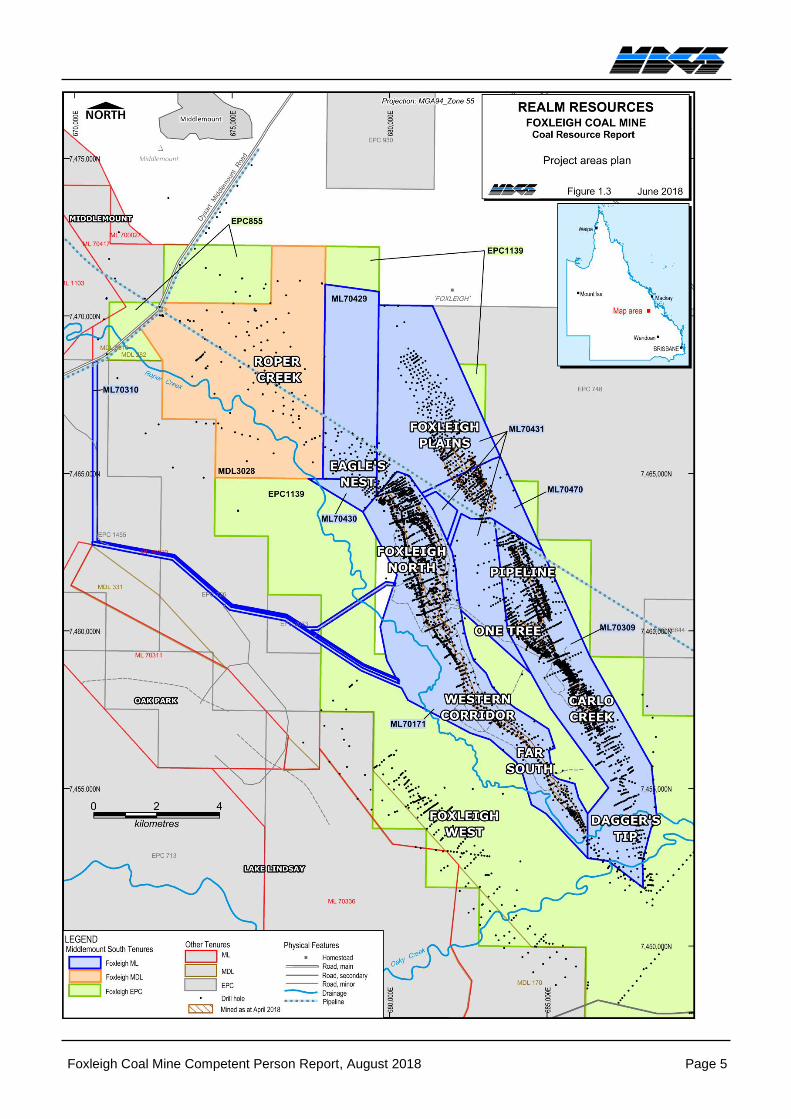
Figure 1.3 Project areas plan ......................................................................................................... 5
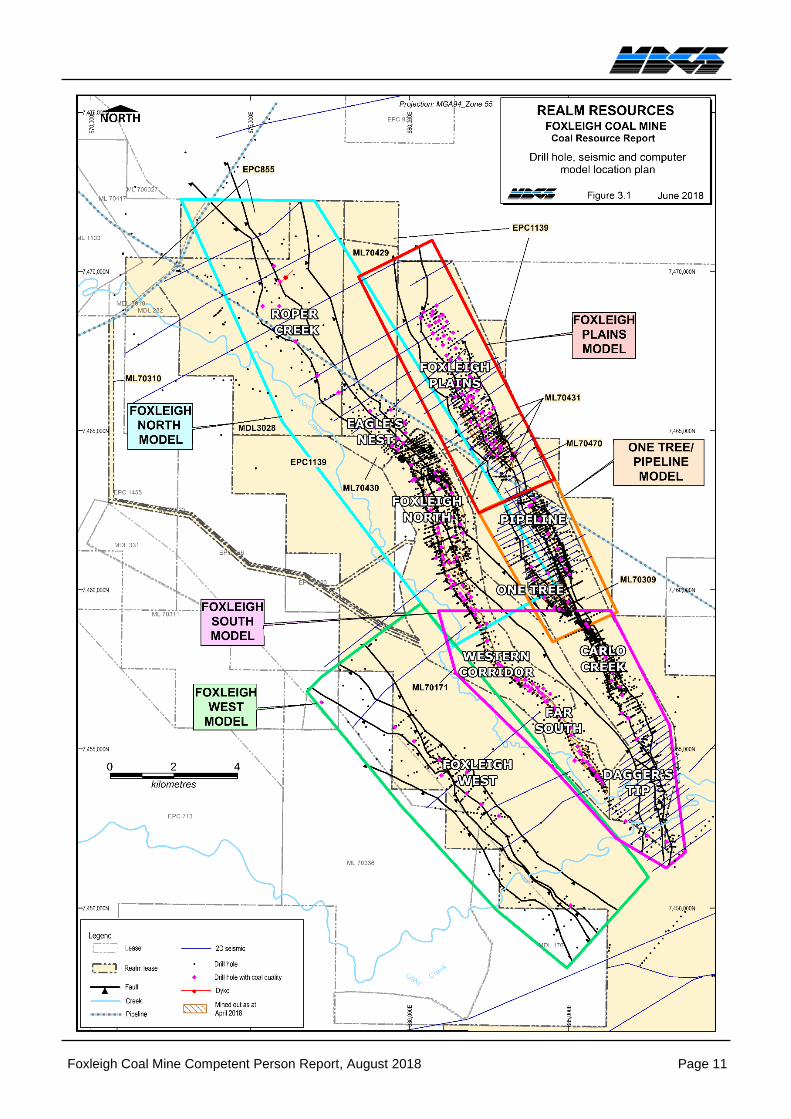
Figure 3.1 Drill hole, seismic and computer model location plan ............................................... 11
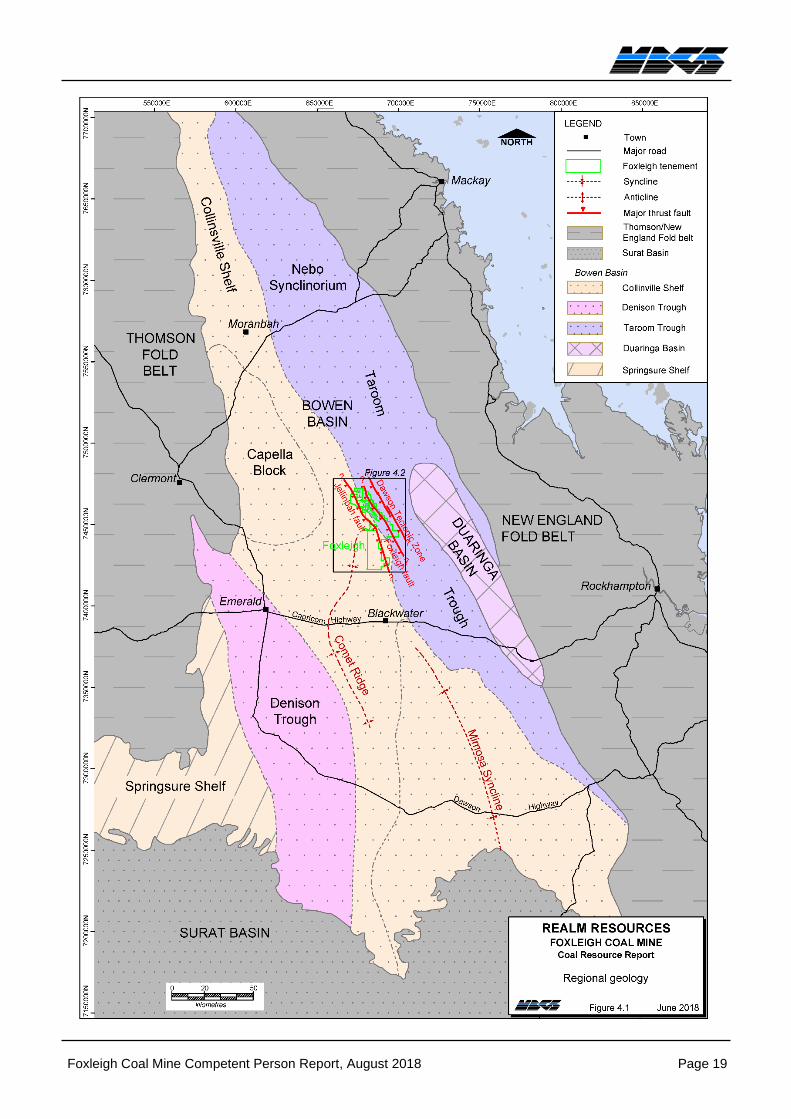
Figure 4.1 Regional geology ........................................................................................................ 19
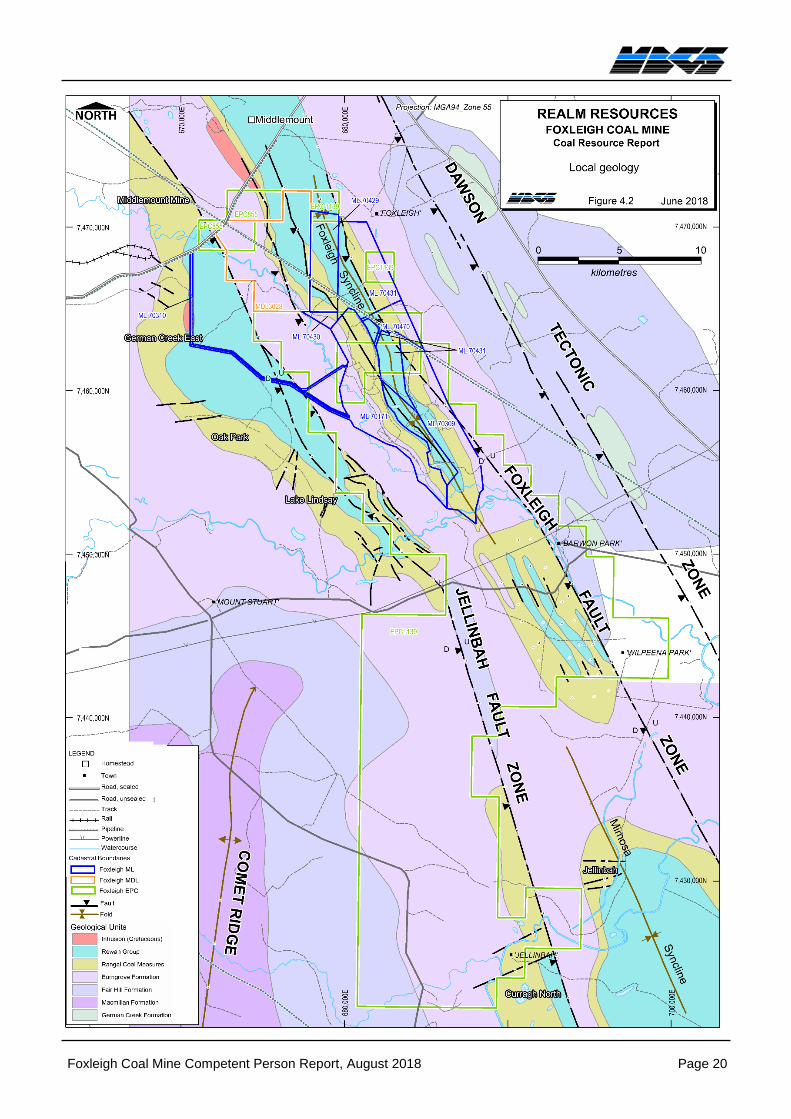
Figure 4.2 Local geology .............................................................................................................. 20
Figure 4.3 Typical stratigraphic section – Foxleigh Syncline ....................................................... 21
Figure 4.4 Typical stratigraphic section – Foxleigh West ............................................................ 22
Figure 4.5 Geological cross section, Foxleigh Plains ................................................................... 23
Figure 4.6 Geological cross section, One Tree/Pipeline .............................................................. 24
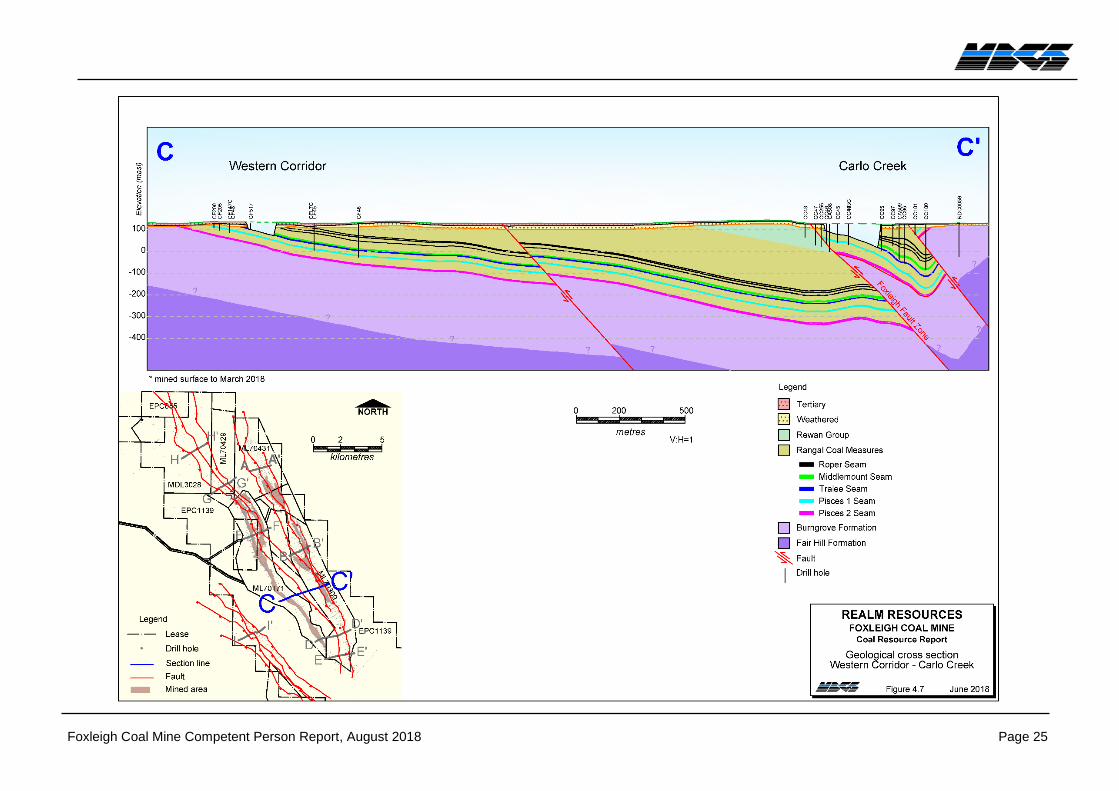
Figure 4.7 Geological cross section, Western Corridor to Carlo Creek ....................................... 25
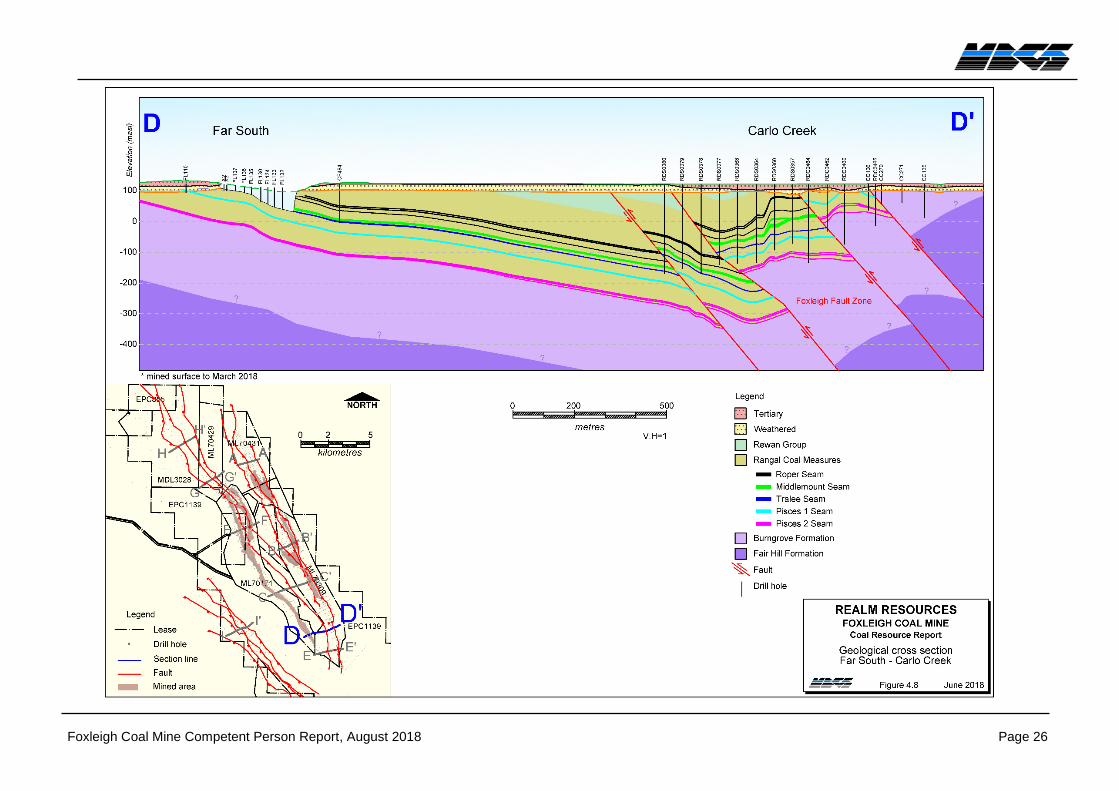
Figure 4.8 Geolgoical cross section, Far South to Carlo Creek .................................................... 26
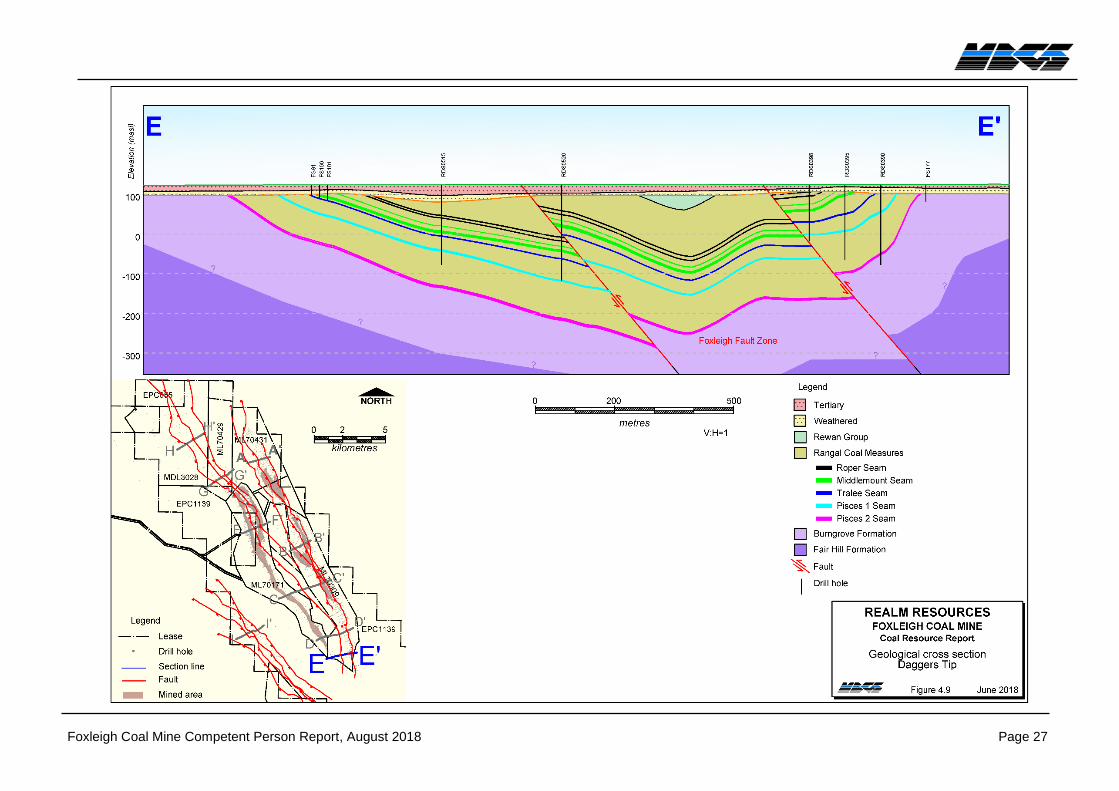
Figure 4.9 Geological cross section, Dagger’s Tip ....................................................................... 27
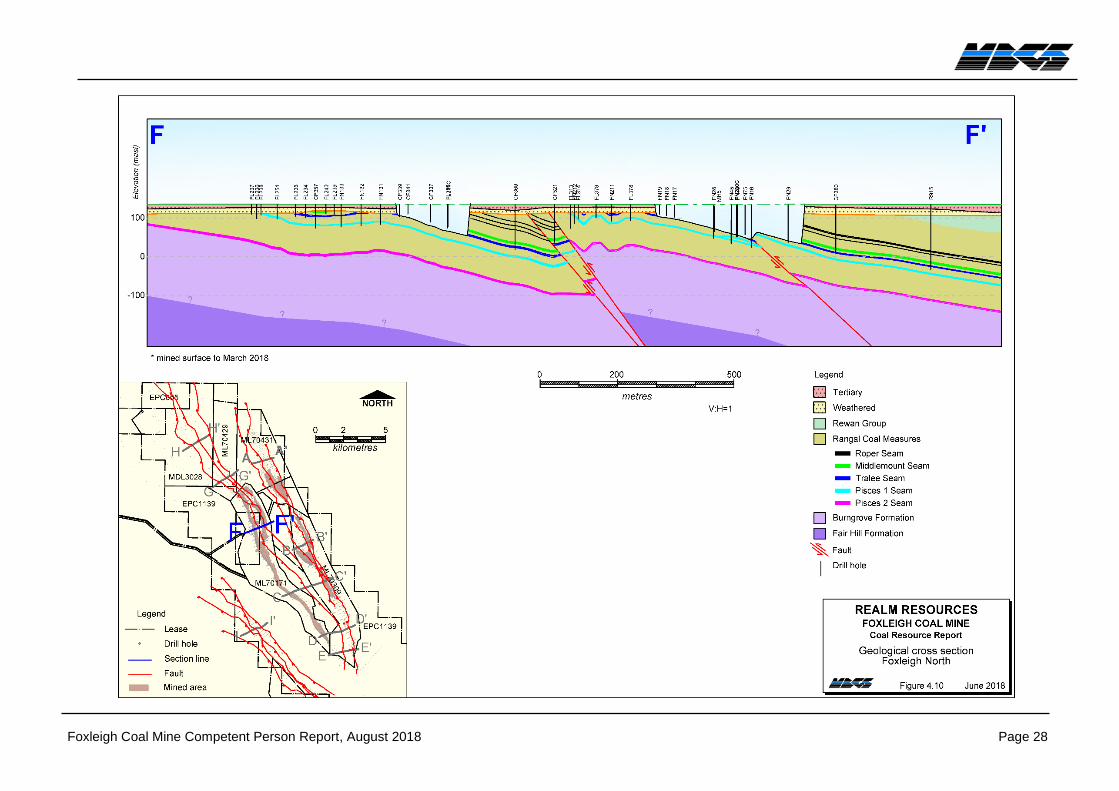
Figure 4.10 Geological cross section, Foxleigh North ................................................................... 28
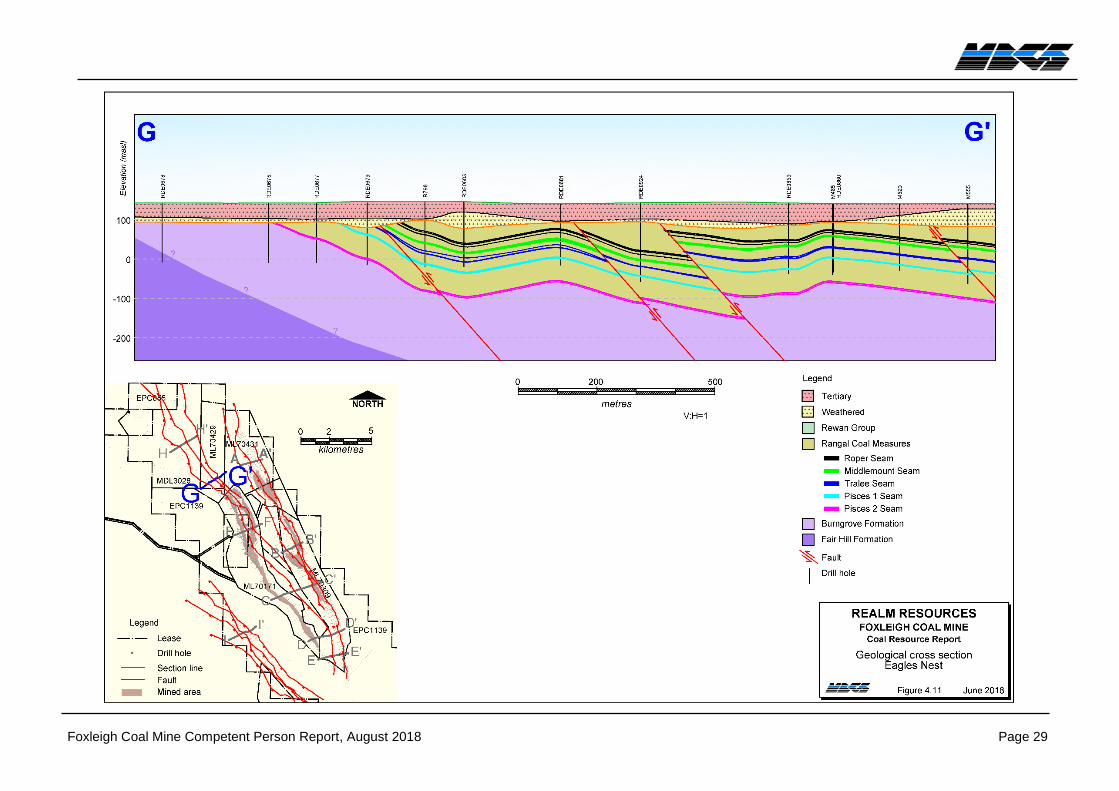
Figure 4.11 Geological cross section, Eagle’s Nest ........................................................................ 29
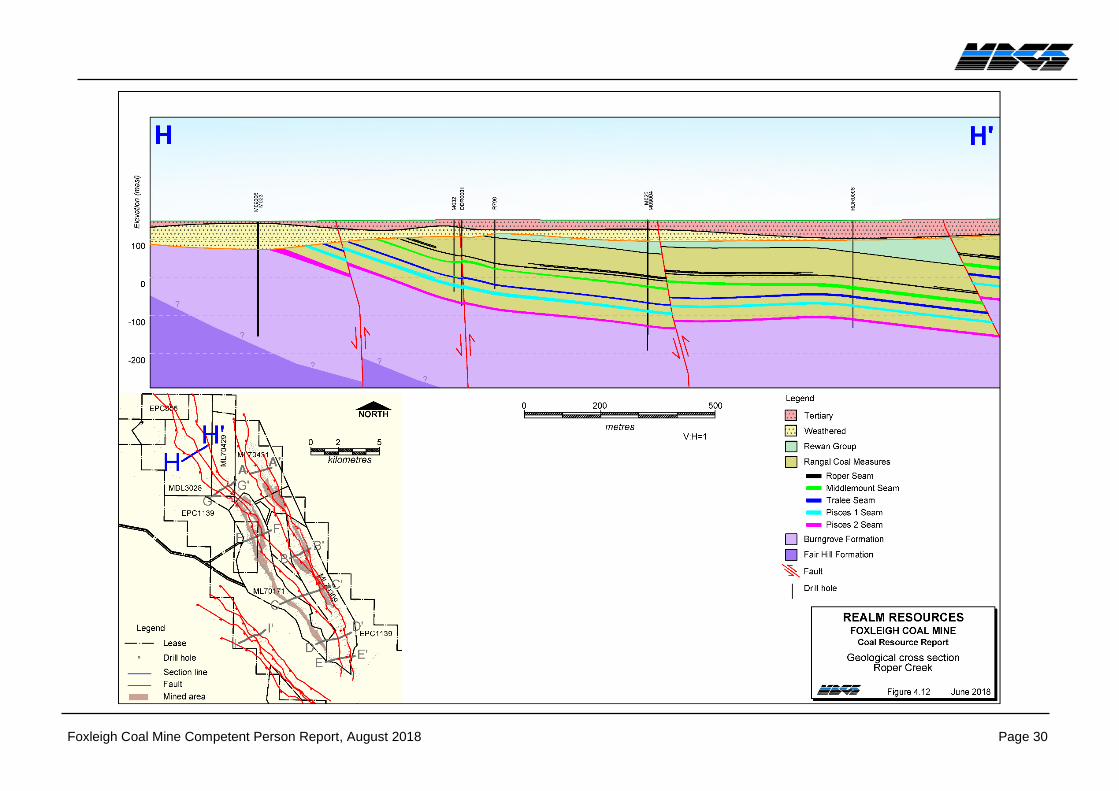
Figure 4.12 Geological cross section, Roper Creek ....................................................................... 30
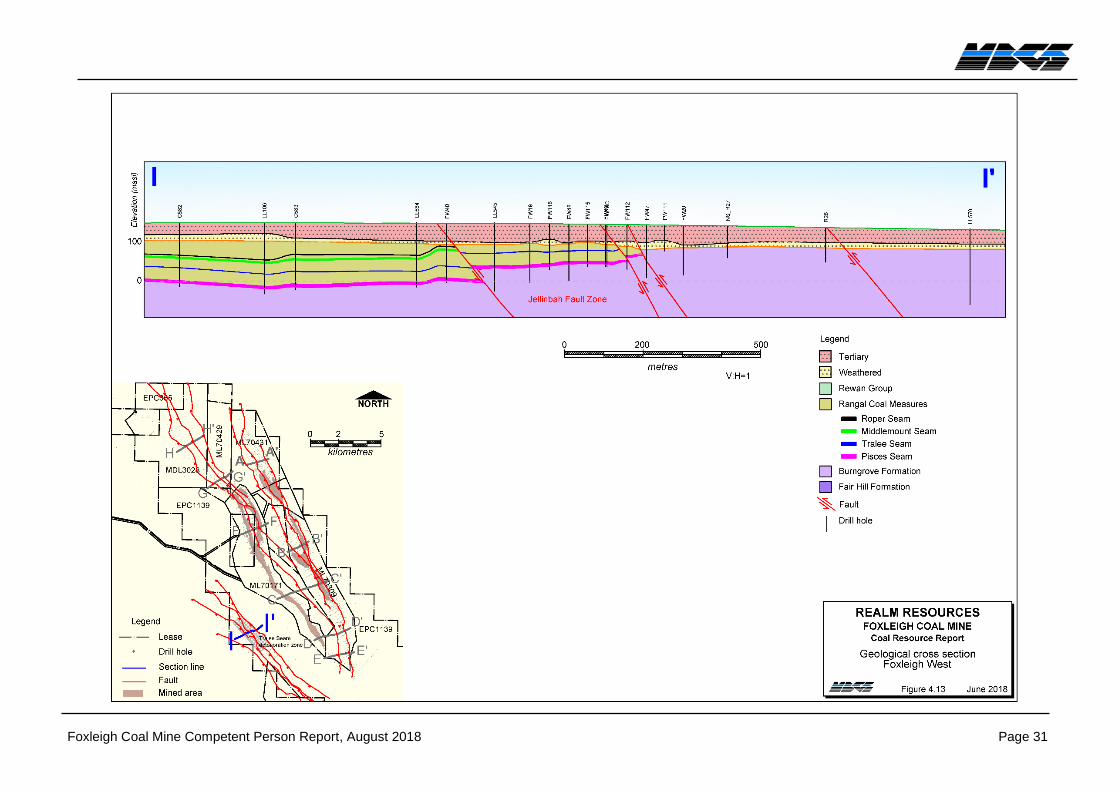
Figure 4.13 Geological cross section, Foxleigh West .................................................................... 31
Figure 6.1 Coal Resources, Roper Seam ...................................................................................... 48
Figure 6.2 Coal Resources, Middlemount Seam ......................................................................... 49
Figure 6.3 Coal Resources, Tralee Seam...................................................................................... 50
Figure 6.4 Coal Resources, Pisces 1 Seam ................................................................................... 51
Figure 6.5 Coal Resources, Pisces 2 Seam ................................................................................... 52
TABLES
Table 1.1 Foxleigh tenement summary ............................................................................................... 2
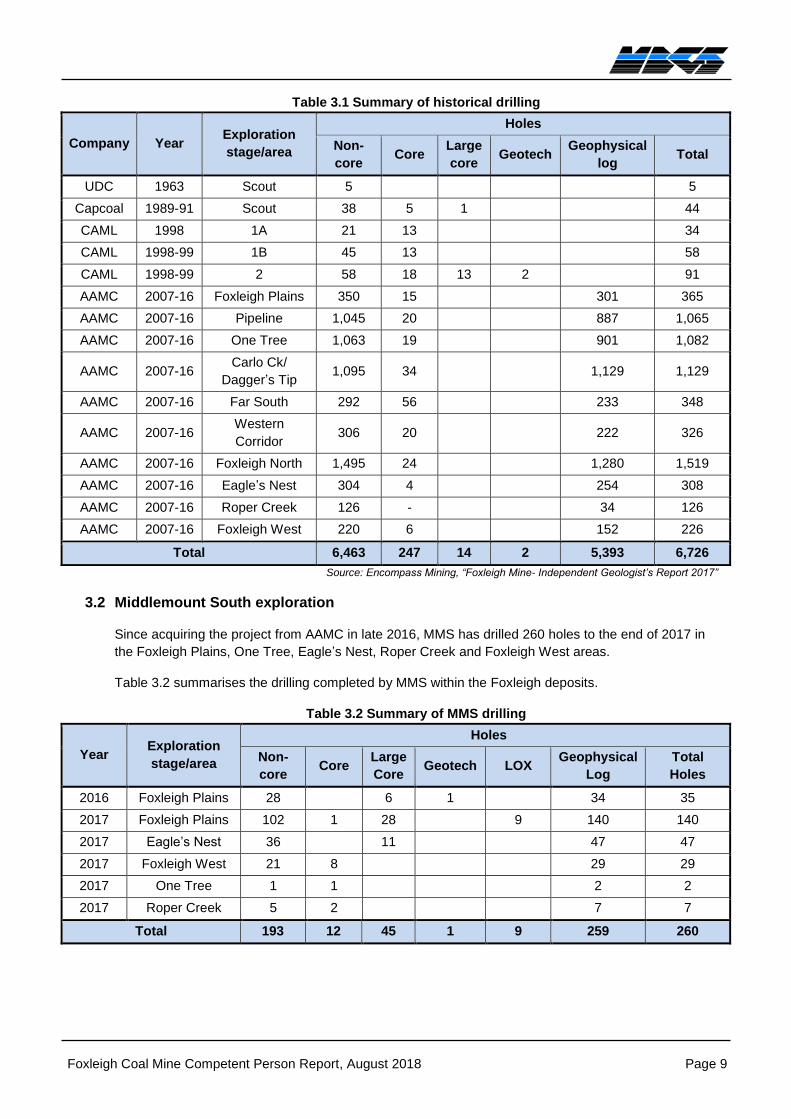
Table 3.1 Summary of historical drilling .............................................................................................. 9
Table 3.2 Summary of MMS drilling ..................................................................................................... 9
Table 4.1 Typical seam thickness ....................................................................................................... 15
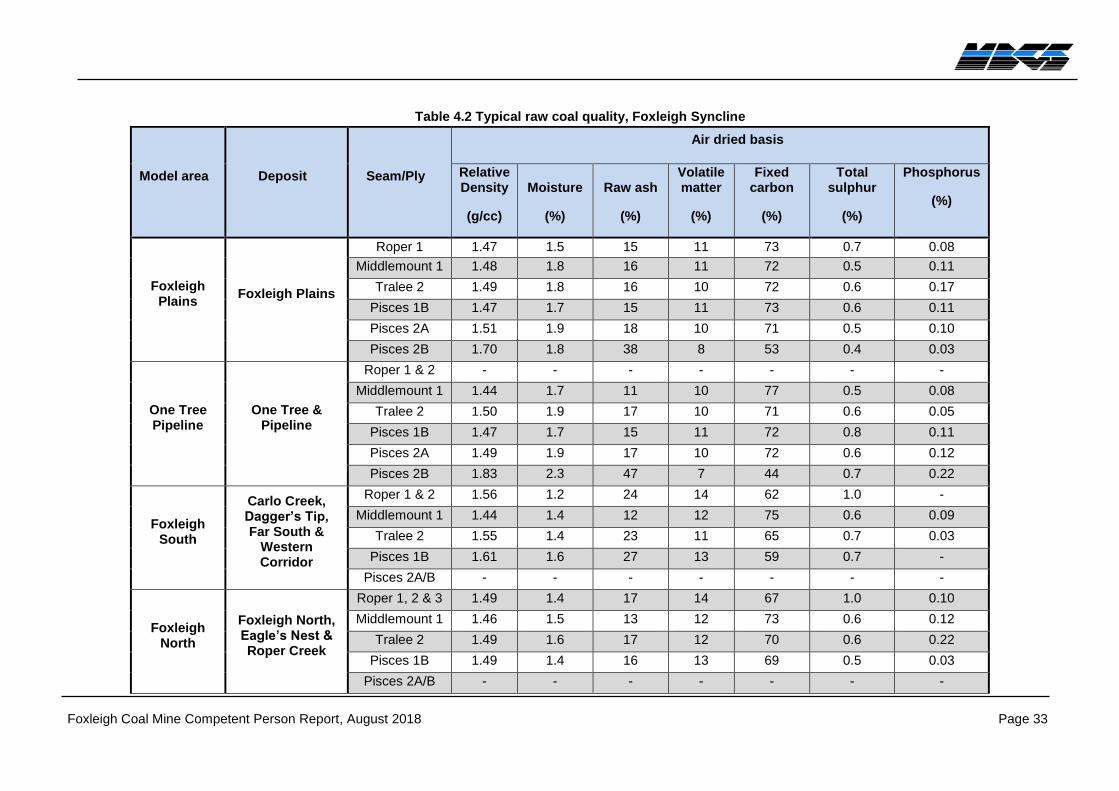
Table 4.2 Typical raw coal quality, Foxleigh Syncline ........................................................................ 33
Table 4.3 Typical raw coal quality, Foxleigh West ............................................................................. 34
Table 5.1 Foxleigh geological computer models ................................................................................ 36
Table 6.1 Typical drill hole spacing .................................................................................................... 38

Foxleigh Coal Mine Competent Person Report, August 2018 Page iv
Table 6.2 Foxleigh Coal Mine Summary of Coal Resources ............................................................... 41
Table 6.3 Foxleigh Plains Coal Resources ........................................................................................... 42
Table 6.4 One Tree and Pipeline Coal Resources ............................................................................... 43
Table 6.5 Foxleigh South area Coal Resources (Carlo Creek, Dagger’s Tip, Far South and Western
Corridor) ..................................................................................................................... 44
Table 6.6 Foxleigh North area Coal Resources (Foxleigh North, Eagle’s Nest and Roper Creek) ...... 45
Table 6.7 Foxleigh West Coal Resources ............................................................................................ 46
Table 6.8 Foxleigh Coal Mine, Coal Resource reconciliation ............................................................. 47
APPENDICES
Appendix A JORC Code, 2012 Edition Table 1 ............................................................................... 53
Appendix B Australasian Code for Reporting of Exploration Results, Mineral Resources and Ore
Reserves ‘The JORC Code, 2012 Edition’ .................................................................... 67
Foxleigh Coal Mine Competent Person Report, August 2018 Page 1
1 INTRODUCTION
1.1 Purpose
This Competent Person Report prepared by McElroy Bryan Geological Services Pty Ltd (MBGS) was
commissioned by Middlemount South Pty Ltd (MMS) a subsidiary of Realm Resources Limited, a
publicly listed company on the Australian Stock Exchange.
The purpose of the report was to provide MMS with an assessment of Coal Resources in the Rangal
Coal Measures within their Foxleigh Coal Mine (Foxleigh) tenure. Coal Resources for five of Foxleigh’s
deposit areas; (Foxleigh Plains, One Tree, Pipeline, Far South and Dagger’s Tip) were reported as at
October 2016 by Encompass Mining. An update of Foxleigh Plains Coal Resources was reported by
Measured Group as at 30 September 2017. MBGS has previously reported Coal Resources for
Foxleigh’s Roper Creek deposit in August 2017. The last report that included resource and reserve
estimates for all the Foxleigh deposits was prepared by Anglo American Metallurgical Coal Pty Ltd
(AAMC) and reported as at 31 December 2013.
The 2018 Coal Resources are reported in accordance with the Australasian Code for Reporting of
Exploration Results, Mineral Resources and Ore Reserves, 2012 edition (JORC Code). A copy of the
JORC Code is included as Appendix B. Coal Resources reported herein are estimated as at 31 March
2018 (Section 2 Coal Resource Declaration).
1.2 Location, tenement and ownership
On 31 August 2016 MMS completed the Foxleigh Transaction with Anglo American Metallurgical Coal
Assets Pty Ltd Coal (Foxleigh) and renamed it Foxleigh Coal Pty Ltd (a 100% owned subsidiary of
MMS), obtaining 100% ownership of EPC1669 (now MDL3028) and EPC855). Ownership of
EPC1139 and the MLs is:
• Foxleigh Coal Pty Ltd 70%
• POSCO Australia Pty Ltd 20%
• Nippon Steel and Sumitomo Metal Australia Pty Ltd 10%
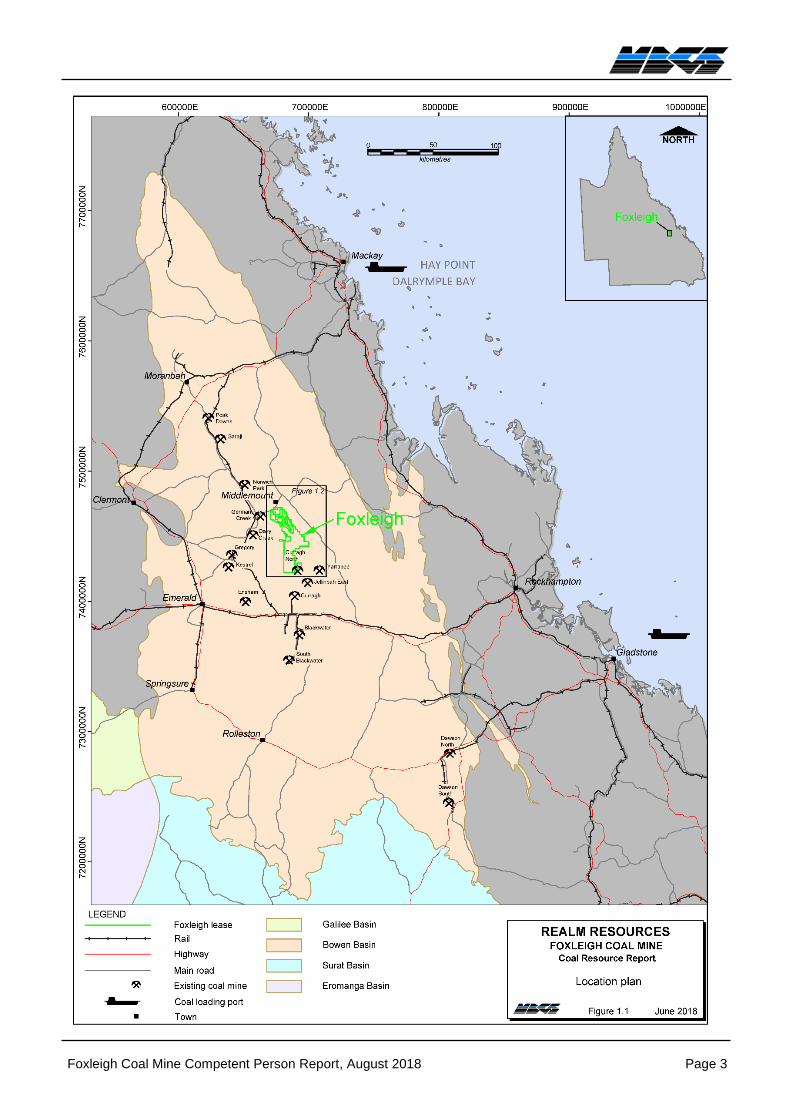
Foxleigh Mine, which currently produces approximately 3 million tonnes per annum (Mtpa) of
Pulverised Coal Injection (PCI) coal from two deposits - One Tree and Foxleigh Plains, is located
approximately 240 km southwest of Mackay and 270 km northwest of Rockhampton, in Central
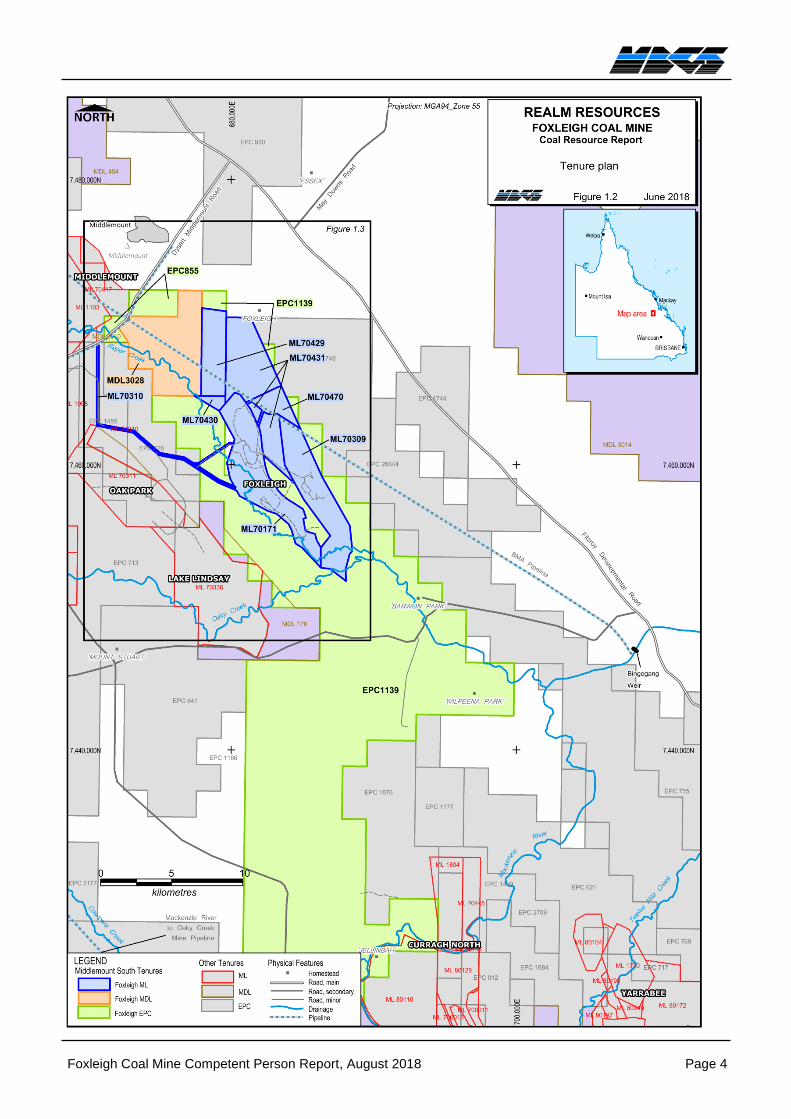
Queensland’s Bowen Basin (Figure 1.1). The 11 identified coal deposits lie within seven Mining
Leases (MLs), a Mineral Development Licence (MDL) and two Exploration Permits for Coal (EPCs)
(Table 1.1); extending for approximately 50 km to the south of the town of Middlemount (Figure 1.2).
Mining has occurred at Foxleigh Plains, Pipeline, One Tree, Carlo Creek, Far South, Western Corridor
and Foxleigh North deposits (Figure 1.3). No mining has been conducted at Eagle’s Nest and
Dagger’s Tip deposits. Other deposits within an adjacent Foxleigh MDL and EPCs include Roper
Creek and Foxleigh West.
Foxleigh mining tenements are adjacent to AAMC’s mining operations at German Creek East, Oak
Park and Lake Lindsay. Lake Lindsay’s MDL170 takes precedence over Foxleigh’s EPC1139 where
they overlap in the west of EPC1139. The Peabody/Yancoal Middlemount Mine adjoins the Roper
Creek EPC/MDL on the north of the Middlemount Road, with their MDL282 and MDL3010 taking
precedence over a portion of EPC855 where it is bisected by the Dysart-Middlemount Road.
Access to Foxleigh is initially via the sealed Dysart to Middlemount Road and at about 10 km south-
west of Middlemount via the Barwon Middlemount Road, which passes through the northern part of
the tenure and provides access to the mining areas. Property tracks provide access for field
operations throughout the remainder of the area.
Foxleigh Coal Mine Competent Person Report, August 2018 Page 2
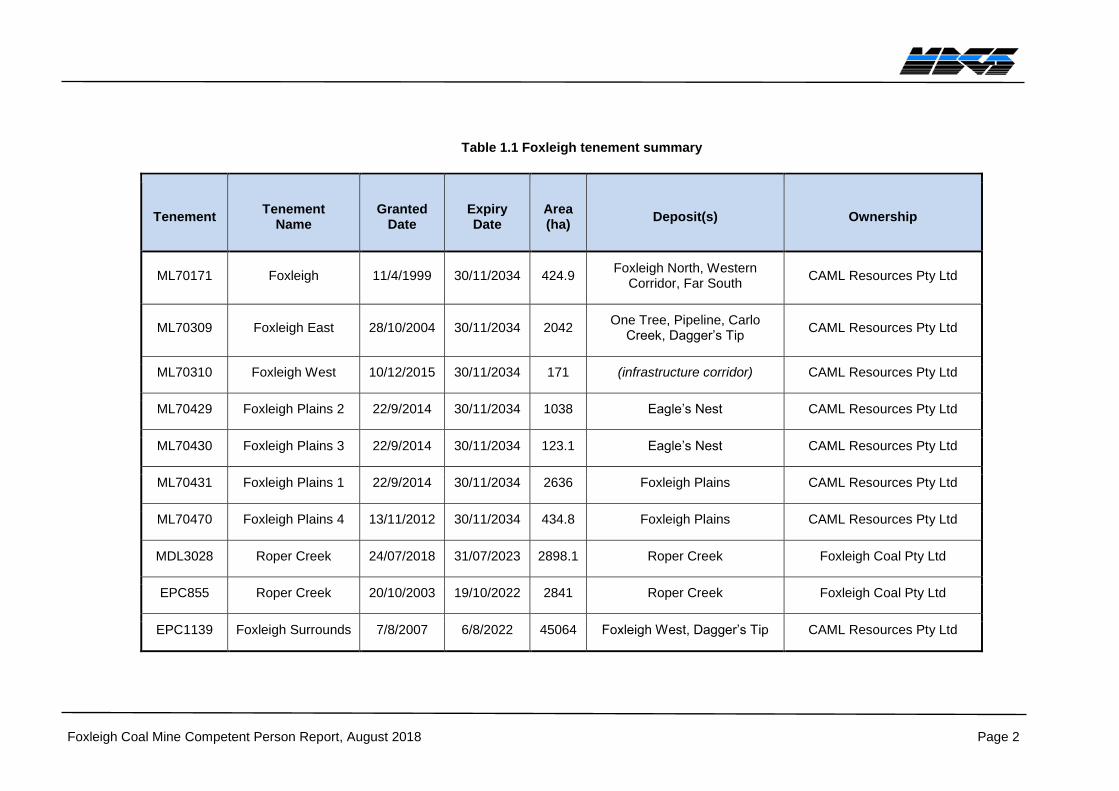
Table 1.1 Foxleigh tenement summary
Tenement Tenement
Name Granted
Date Expiry Date
Area (ha)
Deposit(s) Ownership
ML70171 Foxleigh 11/4/1999 30/11/2034 424.9 Foxleigh North, Western
Corridor, Far South CAML Resources Pty Ltd
ML70309 Foxleigh East 28/10/2004 30/11/2034 2042 One Tree, Pipeline, Carlo
Creek, Dagger’s Tip CAML Resources Pty Ltd
ML70310 Foxleigh West 10/12/2015 30/11/2034 171 (infrastructure corridor) CAML Resources Pty Ltd
ML70429 Foxleigh Plains 2 22/9/2014 30/11/2034 1038 Eagle’s Nest CAML Resources Pty Ltd
ML70430 Foxleigh Plains 3 22/9/2014 30/11/2034 123.1 Eagle’s Nest CAML Resources Pty Ltd
ML70431 Foxleigh Plains 1 22/9/2014 30/11/2034 2636 Foxleigh Plains CAML Resources Pty Ltd
ML70470 Foxleigh Plains 4 13/11/2012 30/11/2034 434.8 Foxleigh Plains CAML Resources Pty Ltd
MDL3028 Roper Creek 24/07/2018 31/07/2023 2898.1 Roper Creek Foxleigh Coal Pty Ltd
EPC855 Roper Creek 20/10/2003 19/10/2022 2841 Roper Creek Foxleigh Coal Pty Ltd
EPC1139 Foxleigh Surrounds 7/8/2007 6/8/2022 45064 Foxleigh West, Dagger’s Tip CAML Resources Pty Ltd
Foxleigh Coal Mine Competent Person Report, August 2018 Page 3
Figure 1.1 Location plan
Foxleigh Coal Mine Competent Person Report, August 2018 Page 4
Figure 1.2 Tenure plan
Foxleigh Coal Mine Competent Person Report, August 2018 Page 5
Figure 1.3 Project areas plan
Foxleigh Coal Mine Competent Person Report, August 2018 Page 6
2 COAL RESOURCE DECLARATION
5: COMPETENT PERSON
Name: ROWAN JOHNSON Membership of AusIMM/AIG:
AusIMM (Membership No. 203211)
Title / Employer:
Senior Geologist, McElroy Bryan Geological Services Pty Ltd
Telephone: (+61) 2 8440 7800
Qualifications:
BSc James Cook University, Townsville (1980) Email: [email protected]
Brief Description of Relevant Experience:
Over 30 years’ experience in coal exploration and more than 20 years in coal resource evaluation.
Signed:
The information in this report that relates to Coal Resources, is based on information compiled under the supervision of, and reviewed by the Competent Person, Rowan Johnson, who is a full-time employee of McElroy Bryan Geological Services and a Member of the Australasian Institute of Mining and Metallurgy. He has no conflict of interest with Middlemount South Pty Ltd. The Coal Resource report for Foxleigh has been prepared in accordance with the “Australasian Code for Reporting of Exploration Results, Mineral Resources and Ore Reserves 2012 Edition” (The JORC Code).
Rowan Johnson has sufficient experience that is relevant to the style of mineralisation and type of deposit under consideration and to the activity being undertaken to qualify as a Competent Person as defined in the JORC Code’.
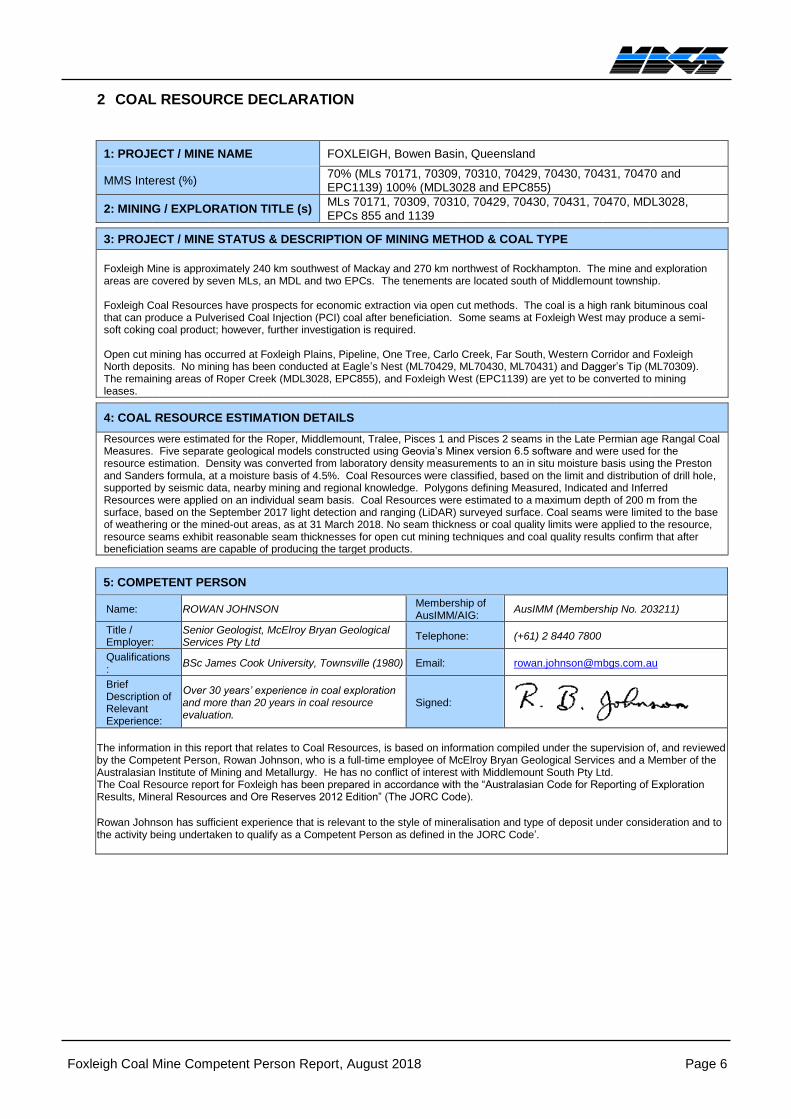
1: PROJECT / MINE NAME FOXLEIGH, Bowen Basin, Queensland
MMS Interest (%) 70% (MLs 70171, 70309, 70310, 70429, 70430, 70431, 70470 and EPC1139) 100% (MDL3028 and EPC855)
2: MINING / EXPLORATION TITLE (s) MLs 70171, 70309, 70310, 70429, 70430, 70431, 70470, MDL3028, EPCs 855 and 1139
3: PROJECT / MINE STATUS & DESCRIPTION OF MINING METHOD & COAL TYPE
Foxleigh Mine is approximately 240 km southwest of Mackay and 270 km northwest of Rockhampton. The mine and exploration areas are covered by seven MLs, an MDL and two EPCs. The tenements are located south of Middlemount township. Foxleigh Coal Resources have prospects for economic extraction via open cut methods. The coal is a high rank bituminous coal that can produce a Pulverised Coal Injection (PCI) coal after beneficiation. Some seams at Foxleigh West may produce a semi-soft coking coal product; however, further investigation is required. Open cut mining has occurred at Foxleigh Plains, Pipeline, One Tree, Carlo Creek, Far South, Western Corridor and Foxleigh North deposits. No mining has been conducted at Eagle’s Nest (ML70429, ML70430, ML70431) and Dagger’s Tip (ML70309). The remaining areas of Roper Creek (MDL3028, EPC855), and Foxleigh West (EPC1139) are yet to be converted to mining leases.
4: COAL RESOURCE ESTIMATION DETAILS
Resources were estimated for the Roper, Middlemount, Tralee, Pisces 1 and Pisces 2 seams in the Late Permian age Rangal Coal Measures. Five separate geological models constructed using Geovia’s Minex version 6.5 software and were used for the resource estimation. Density was converted from laboratory density measurements to an in situ moisture basis using the Preston and Sanders formula, at a moisture basis of 4.5%. Coal Resources were classified, based on the limit and distribution of drill hole, supported by seismic data, nearby mining and regional knowledge. Polygons defining Measured, Indicated and Inferred Resources were applied on an individual seam basis. Coal Resources were estimated to a maximum depth of 200 m from the surface, based on the September 2017 light detection and ranging (LiDAR) surveyed surface. Coal seams were limited to the base of weathering or the mined-out areas, as at 31 March 2018. No seam thickness or coal quality limits were applied to the resource, resource seams exhibit reasonable seam thicknesses for open cut mining techniques and coal quality results confirm that after beneficiation seams are capable of producing the target products.
Foxleigh Coal Mine Competent Person Report, August 2018 Page 7
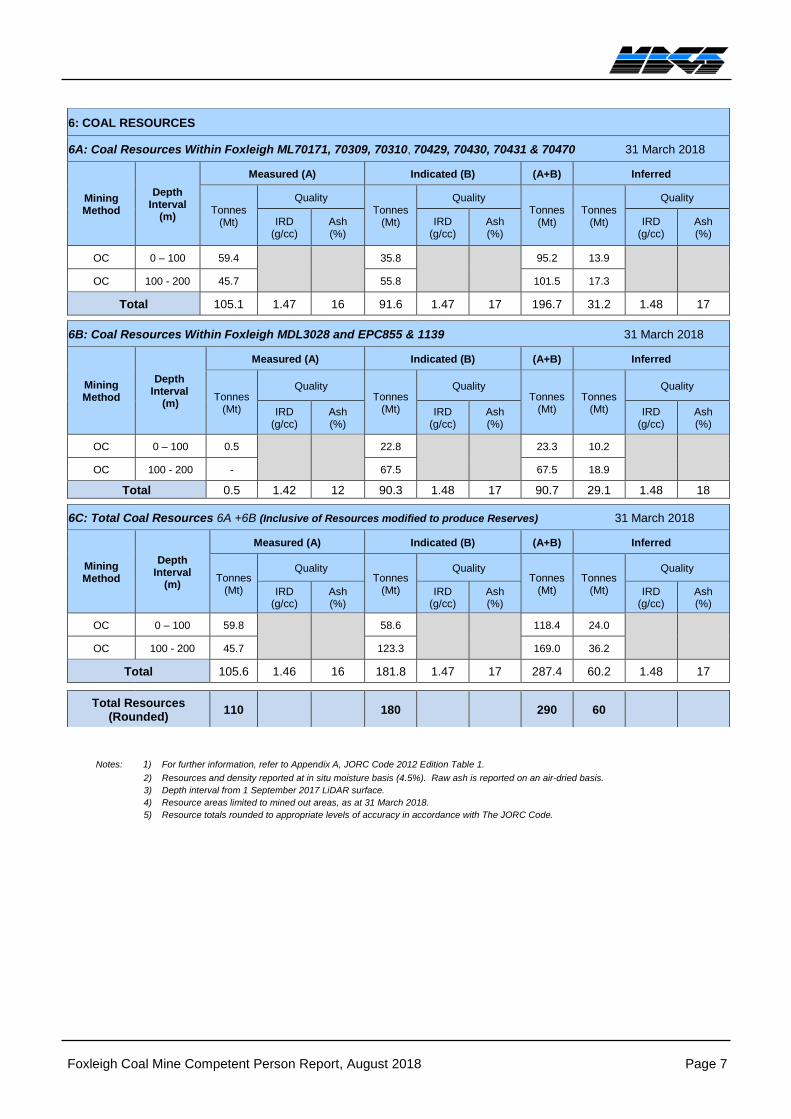
Notes: 1) For further information, refer to Appendix A, JORC Code 2012 Edition Table 1.
2) Resources and density reported at in situ moisture basis (4.5%). Raw ash is reported on an air-dried basis.
3) Depth interval from 1 September 2017 LiDAR surface.
4) Resource areas limited to mined out areas, as at 31 March 2018.
5) Resource totals rounded to appropriate levels of accuracy in accordance with The JORC Code.
6: COAL RESOURCES
6A: Coal Resources Within Foxleigh ML70171, 70309, 70310, 70429, 70430, 70431 & 70470 31 March 2018
Mining Method
Depth Interval
(m)
Measured (A) Indicated (B) (A+B) Inferred
Tonnes (Mt)
Quality Tonnes
(Mt)
Quality Tonnes
(Mt) Tonnes
(Mt)
Quality
IRD (g/cc)
Ash (%)
IRD (g/cc)
Ash (%)
IRD (g/cc)
Ash (%)
OC 0 – 100 59.4
35.8
95.2 13.9
OC 100 - 200 45.7 55.8 101.5 17.3
Total 105.1 1.47 16 91.6 1.47 17 196.7 31.2 1.48 17
6B: Coal Resources Within Foxleigh MDL3028 and EPC855 & 1139 31 March 2018
Mining Method
Depth Interval
(m)
Measured (A) Indicated (B) (A+B) Inferred
Tonnes (Mt)
Quality Tonnes
(Mt)
Quality Tonnes
(Mt) Tonnes
(Mt)
Quality
IRD (g/cc)
Ash (%)
IRD (g/cc)
Ash (%)
IRD (g/cc)
Ash (%)
OC 0 – 100 0.5
22.8
23.3 10.2
OC 100 - 200 - 67.5 67.5 18.9
Total 0.5 1.42 12 90.3 1.48 17 90.7 29.1 1.48 18
6C: Total Coal Resources 6A +6B (Inclusive of Resources modified to produce Reserves) 31 March 2018
Mining Method
Depth Interval
(m)
Measured (A) Indicated (B) (A+B) Inferred
Tonnes (Mt)
Quality Tonnes
(Mt)
Quality Tonnes
(Mt) Tonnes
(Mt)
Quality
IRD (g/cc)
Ash (%)
IRD (g/cc)
Ash (%)
IRD (g/cc)
Ash (%)
OC 0 – 100 59.8
58.6
118.4 24.0
OC 100 - 200 45.7 123.3 169.0 36.2
Total 105.6 1.46 16 181.8 1.47 17 287.4 60.2 1.48 17
Total Resources (Rounded)
110 180 290 60
Foxleigh Coal Mine Competent Person Report, August 2018 Page 8
3 EXPLORATION HISTORY
3.1 Historical exploration
Exploration at Foxleigh commenced in the mid-1960s by Utah Development Corporation (Utah), with
five non-core holes drilled on one traverse line east of the Jellinbah Fault.
The Geological Survey of Queensland (GSQ) conducted scout drilling programmes in the German
Creek East area (Roper Series holes) as part of regional coal exploration during the mid to late 1960s.
Capricorn Coal Management (Capcoal) held EPCs 315, 414 and 470 and conducted exploration
drilling programmes from 1980 – 1991, involving 180 holes drilled in German Creek East, Middlemount
(now Middlemount Mine), Roper Creek (EPC855/MDL3028) and Foxleigh Mine areas. Although only
approximately 45 holes were drilled in the tenements currently held by MMS. Shell Coal of Australia
(SCOA) completed a Pre-feasibility Mining Study (PFS) at Foxleigh on behalf of Capcoal. Capcoal
acquired the Lake Lindsay lease in the latter 1990s, after extensive exploration had been carried out
by the leaseholder, Lendlease.
Australian Bulk Minerals (ABM) conducted an exploration drilling programme at Duneed (Wilpeena),
south of the Foxleigh prospect within what is currently EPC1139.
Kanematsu, C.O.A.L. and Ingwe were tenure holders from early 1996 to late 1996 of EPC598, (now
EPC1139), but conducted no field work.
C.A.M.L. Resources Pty Ltd (CAML) acquired the Foxleigh area under EPCs 617 and 955 and, after
conducting exploration drilling programmes involving about 200 holes from early 1997 to 1999,
commercialized mining at Foxleigh in February 2000.
AAMC acquired the Foxleigh lease in 2007 and conducted extensive exploration in the Mining Lease
areas from 2007 - 2016 to increase geological knowledge in the Foxleigh Plains, One Tree/Pipeline,
Carlo Creek, Dagger’s Tip, Far South, Western Corridor, Foxleigh North and Eagle’s Nest deposits.
AAMC also conducted exploration in Roper Creek, Foxleigh West and the central and southern areas
of EPC1139. The exploration combined open holes and cored holes supplemented with 2D seismic
surveys to investigate the Foxleigh project area. AAMC successfully used 2D seismic across much of
the proposed mine areas to provide additional geological control and enhance the understanding of
the intense structuring in these areas.
Table 3.1 summarises the drilling conducted by all the historical explorers within the Foxleigh project
tenements.
Foxleigh Coal Mine Competent Person Report, August 2018 Page 9
Table 3.1 Summary of historical drilling
Company Year Exploration
stage/area
Holes
Non-
core Core
Large
core Geotech
Geophysical
log Total
UDC 1963 Scout 5 5
Capcoal 1989-91 Scout 38 5 1 44
CAML 1998 1A 21 13 34
CAML 1998-99 1B 45 13 58
CAML 1998-99 2 58 18 13 2 91
AAMC 2007-16 Foxleigh Plains 350 15 301 365
AAMC 2007-16 Pipeline 1,045 20 887 1,065
AAMC 2007-16 One Tree 1,063 19 901 1,082
AAMC 2007-16 Carlo Ck/
Dagger’s Tip 1,095 34 1,129 1,129
AAMC 2007-16 Far South 292 56 233 348
AAMC 2007-16 Western
Corridor 306 20 222 326
AAMC 2007-16 Foxleigh North 1,495 24 1,280 1,519
AAMC 2007-16 Eagle’s Nest 304 4 254 308
AAMC 2007-16 Roper Creek 126 - 34 126
AAMC 2007-16 Foxleigh West 220 6 152 226
Total 6,463 247 14 2 5,393 6,726
Source: Encompass Mining, “Foxleigh Mine- Independent Geologist’s Report 2017”
3.2 Middlemount South exploration
Since acquiring the project from AAMC in late 2016, MMS has drilled 260 holes to the end of 2017 in
the Foxleigh Plains, One Tree, Eagle’s Nest, Roper Creek and Foxleigh West areas.
Table 3.2 summarises the drilling completed by MMS within the Foxleigh deposits.
Table 3.2 Summary of MMS drilling
Year Exploration
stage/area
Holes
Non-
core Core
Large
Core Geotech LOX
Geophysical
Log
Total
Holes
2016 Foxleigh Plains 28 6 1 34 35
2017 Foxleigh Plains 102 1 28 9 140 140
2017 Eagle’s Nest 36 11 47 47
2017 Foxleigh West 21 8 29 29
2017 One Tree 1 1 2 2
2017 Roper Creek 5 2 7 7
Total 193 12 45 1 9 259 260
Foxleigh Coal Mine Competent Person Report, August 2018 Page 10
3.2.1 Drilling
Almost 7,000 holes have been drilled in the Foxleigh deposits by all explorers since the mid-1960s to
2017 with most of the drilling undertaken by later explorers CAML and AAMC from 1997 - 2016.
Whilst a large proportion of holes (95%) are non-core there are approximately 320 core holes with coal
analysis of the major seams. Core diameters varied from HQ (61 mm), HMLC (63 mm), PQ (83 mm),
4C (100 mm) and 8C (200 mm).
Drill hole spacing ranges from approximately 25 m to more than 500 m, with close-spaced holes (<20
m) mostly used to delineate the seam subcrops in the mined areas. The distance between core holes
with coal analysis varies from 150 m - 1,500+ m (Figure 3.1).
3.2.2 Seismic
Approximately 110 2D seismic lines, oriented southwest to northeast across the major structures, have
been acquired throughout the Foxleigh tenements, including approximately 70 in the resource
deposits. Most of these were acquired by Velseis for AAMC from 2009 to 2014 along the eastern
mining deposits. Seismic lines are spaced from approximately 70 m up to 500 m apart to assist with
the delineation of faults in this structurally complex region (Figure 3.1). The seismic response and
resolution of the Rangal Coal Measures strata are excellent at Foxleigh. Reflectors represented by
the coal seams are distinguishable in the seismic sections and numerous large thrust fault zones have
been identified and resolved with confidence.
Foxleigh Coal Mine Competent Person Report, August 2018 Page 11
Figure 3.1 Drill hole, seismic and computer model location plan
Foxleigh Coal Mine Competent Person Report, August 2018 Page 12
4 GEOLOGY
4.1 Regional geology
Foxleigh is located on the eastern flank of the Comet Ridge, a major structural feature of the southern
Bowen Basin, and west of the complexly folded and faulted Dawson Tectonic Zone (Figure 4.1). The
mine mainly occurs east of the Jellinbah Fault Zone and within the Foxleigh Fault Zone (Figure 4.2).
These fault zones comprise numerous east over west thrust structures that trend north-northwest with
considerable cumulative vertical displacements, often exceeding 200 m. Associated with these major
structures are smaller thrust faults (20 – 100 m displacement). Several occurrences of upthrust
shallow coal measures have been identified within the Foxleigh area and considerable coal within the
area occurs at depths less than 200 m.
4.2 Local geology
Late Permian Blackwater Group coal-bearing formations, specifically the Rangal Coal Measures and
Burngrove Formation have been folded and uplifted by major thrust faults within Foxleigh.
Conformably overlying the Rangal Coal Measures are the Early Triassic age Rewan Group strata,
which are barren of coal occurrences and consist predominantly of siltstones and sandstones.
Sequences of Quaternary/Tertiary clays, sands and gravels form a thin veneer at surface.
The generally northeast dipping Rangal Coal Measures contain the primary coal targets in the
Foxleigh area. In descending stratigraphic order; the four main coal seams are Roper, Middlemount,
Tralee, and Pisces. Down hole geophysical density logs confirm the consistency and continuity of the
main coal plies that comprise these coal seams; Roper 1, 2 and 3; Middlemount 1; Tralee 1 and 2; and
Pisces 1A and 1B and Pisces 2A and 2B.
4.2.1 Stratigraphy
4.2.1.1. Quaternary
Unconsolidated Quaternary alluvial sediments comprise sand, clay, and basal gravels, with a
thickness of 8 - 12 m, but can exceed 20 m adjacent to Roper Creek and Oaky Creek which dissect
the area.
4.2.1.2. Tertiary
Tertiary strata overlie the Permian coal measures in the Foxleigh area. The Tertiary sediments
comprise clay and poorly cemented, fine to coarse quartz sand and gravels. Within the Foxleigh
Syncline, Tertiary strata vary in thickness from a few metres up to 80 m. The thicker sediments occur
in the north in the Roper Creek deposit and generally thin southwards but can be variable (average
cover in the south is 10 m increasing to an average of 30 m in the north). At Foxleigh West Tertiary
cover averages 30 m and ranges up to 60 m. Tertiary clay and highly weathered Permian strata can
be similar in colour and texture, making them difficult to distinguish. The contact between Tertiary and
weathered Permian is not always sharp and the boundary is often best picked from a combination of
the natural gamma and the density logs.
4.2.1.3. Triassic
The Triassic, Rewan Group comprises two units,
• upper Arcadia Formation typified by its red brown claystones with lesser greyish green
siltstone and sandstone
Foxleigh Coal Mine Competent Person Report, August 2018 Page 13
• lower Sagittarius Sandstone, which is distinctively grey-green coloured quartz lithic
sandstone and sandy claystone with chert bands.
The Rewan Group is present in the synclinal areas adjacent to the major thrust faults particularly in the
eastern parts of the Foxleigh project area (Figure 4.2).
4.2.1.4. Permian
The Rangal Coal Measures consist of lithic sandstone, siltstone, claystone, carbonaceous mudstone
and coal. Within the Foxleigh area, the formation is typically 150 - 200 m thick and contains five main
coal seams in descending stratigraphic order, Roper, Middlemount, Tralee, Pisces 1 and Pisces 2 of
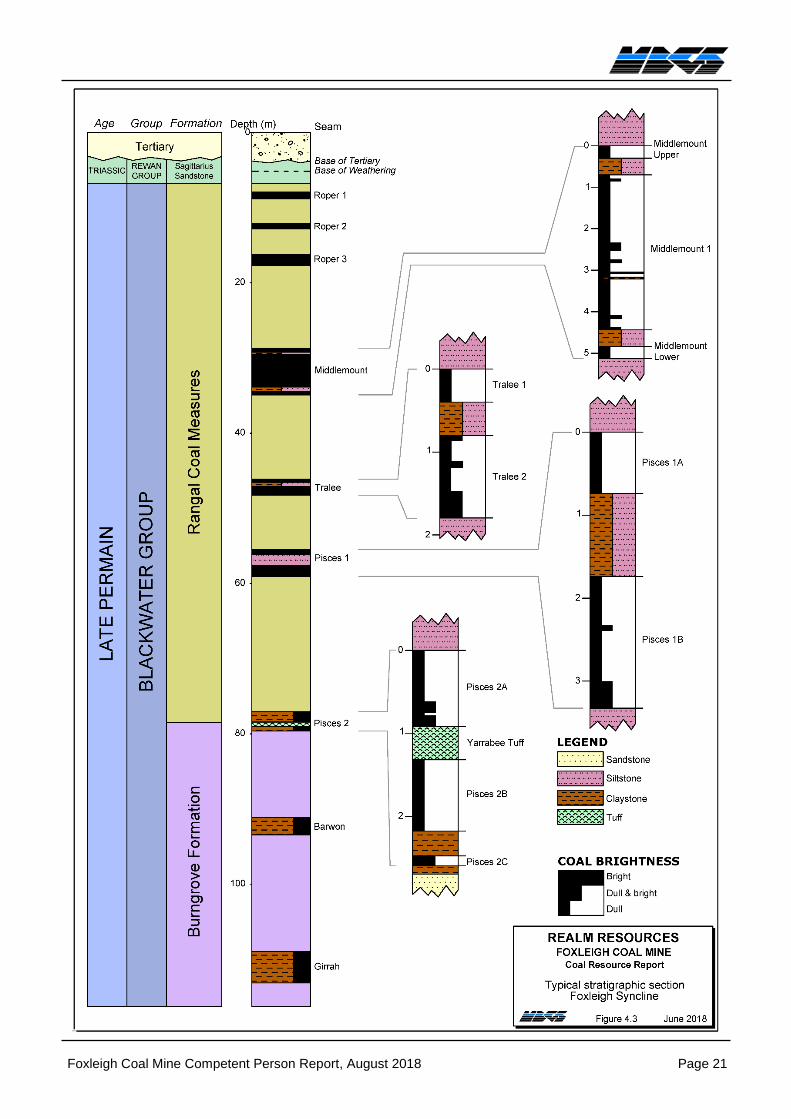
which Middlemount 1, Tralee and Pisces 1 seams are the most significant, (Figure 4.3).
Conformably underlying the Rangal Coal Measures is the Burngrove Formation, which comprises
siltstone and sandstone units but is typified by the unusually thick coal seams that are interbedded
with abundant carbonaceous claystones and white to buff coloured tuffaceous bands. The upper
Burngrove Formation is characterised by hard, grey, sandstone and minor siltstone with several
banded coal seams, including the Barwon Seam, Girrah Seam and basal plies of Pisces 2 Seam. The
top of the Burngrove Formation is marked by the pinkish brown Yarrabee Tuff Bed, which has a
prominent and characteristic high natural gamma geophysical log response within the Pisces 2 Seam.
4.2.2 Structure
The Foxleigh deposits are largely bounded by the Jellinbah Fault Zone in the west and the Foxleigh
Fault Zone in the east.
The Foxleigh Fault Zone strikes north northwest along the eastern edge of the Foxleigh Syncline.
Within Foxleigh there are several thrust faults of similar orientation, which resulted in the Rangal Coal
Measures being thrust from the northeast over the underlying strata to the southwest. The up-
thrusting of the coal sequence brings the coal seams closer to the surface and presents an opportunity
for repeated extraction of the same coal seams by open cut mining methods. This is the case for the
deposits that are situated along the eastern limb of the Foxleigh Syncline.
The north northwest striking Jellinbah Fault Zone cuts through EPC1139 along the edge of AAMC’s
Lake Lindsay, Oak Park and German Creek East deposits. Foxleigh West is located on the edge of
the Jellinbah Fault Zone and contains several east over west faulted blocks of Rangal Coal Measures
and Burngrove Formation strata.
Structure at Foxleigh has been interpreted and confirmed using data from mining, exploration drill hole
intersections and 2D seismic surveys. The 2D seismic data was generally of very high quality.
4.2.3 Weathering
The base of weathering (BOW) in Permian strata has been recorded in the lithology log of most drill
holes. At Foxleigh, the depth to BOW ranges from less than 5 m to approximately 90 m, increasing
from south to north within the Foxleigh Syncline. Depth to BOW at Foxleigh West ranges 20 – 75 m
averaging approximately 40 m. The 10 – 15 m thick weathered Permian strata are overlain by loosely
consolidated Tertiary sediments.
4.2.4 Igneous intrusions
Igneous intrusions (sills and dykes) are not common at Foxleigh. The known sills at Foxleigh are more
pervasive in the north and north eastern deposits. In the north at Roper Creek, an igneous sill
(interpreted as Cretaceous age) has intruded Pisces 1 Seam between the Pisces 1A and Pisces 1B
plies. One drill hole (M682) in the centre of Roper Creek appears to have intersected a dyke over an
Foxleigh Coal Mine Competent Person Report, August 2018 Page 14
interval of approximately 30 m. At Roper Creek the occurrence of igneous material within drill holes
decreases towards Eagle’s Nest to the south. In the north of Foxleigh Plains, an igneous sill
approximately 2 m thick intrudes the Tralee Seam, between the Tralee 2 and Tralee 2 Lower plies. At
the Pipeline deposit, igneous rocks have been observed in several drill holes, suggesting a sill is
present largely at the Pisces 2 Seam level.
4.3 Coal seams
4.3.1 Foxleigh Syncline
Figure 4.3 presents the typical stratigraphy and sequence of coal seams within the Foxleigh Syncline.
The uppermost seam in the Rangal Coal Measures is the Roper Seam. There are up to three coal
plies in the Roper Seam (Roper 1, Roper 2 and Roper 3). The development and thickness of these
plies varies within the syncline, with ply average thicknesses ranging from <0.1 – 1.3 m across the
deposits.
Historically, the Middlemount Seam (Middlemount 1) has been the target seam at Foxleigh Mine and
has been the focus of much of the exploration. In terms of thickness and coal quality it is the most
consistent of the coal seams at Foxleigh, providing a recognisable geophysical signature. In places,
thin (approximately 0.5 m) plies split from the roof and floor of the main Middlemount 1 Ply forming the
Middlemount Upper and Lower plies. Middlemount 1 is typically about 5 m thick. Where the
Middlemount Upper and Lower plies are not coalesced with Middlemount 1, both are generally less
than 1 m thick.
The Tralee Seam comprises an upper Tralee 1 Ply and lower Tralee 2 Ply. Tralee 1 is generally
thinner (0.3 m – 1 m) and higher in raw ash, often pinching out in the southwest of the Foxleigh
Syncline. Tralee 2 averages 1 – 3 m thick. Along much of the western limb of the Foxleigh Syncline
(Foxleigh North, Western Corridor and Far South) the Tralee Seam coalesces with the overlying
Middlemount Seam.
Pisces 1 Seam has two plies, an upper Pisces 1A and a lower Pisces 1B. Pisces 1A tends to be
stonier with higher raw ash and thinner (approximately 0.5 - 1 m) than Pisces 1B. Pisces 1B is
approximately 2 -3 m thick and therefore constitutes a suitable mining target in parts of the Foxleigh
Syncline.
Pisces 2 Seam is the basal seam of the Rangal Coal Measures at Foxleigh and is often developed as
three coal plies; Pisces 2A, 2B and 2C. Pisces 2A and 2B are separated by the Yarrabee Tuff Bed,
generally readily identified by its high gamma response on geophysical logs. A secondary tuffaceous
claystone band is often present between the Pisces 2B and the thin Pisces 2C Ply, when the Pisces
2C is developed. The Pisces 2A has an average thickness ranging 1 - 2.5 m and Pisces 2B Ply
averages 1.5 m. The Pisces 2B Ply has a consistently higher ash than the overlying target seams
(raw ash ranging up to approximately 45%), however is still a target, largely due to its proximity to the
Pisces 2A Ply and potential to produce a thermal product.
The top of the Yarrabee Tuff Bed is recognised as the boundary between the Rangal Coal Measures
and the underlying Burngrove Formation. At Foxleigh, two coal seams have been intersected below
the Pisces 2 within the Burngrove Formation; the Barwon and Girrah seams. There are few
intersections of these seams across the Foxleigh Syncline and they have not been considered for Coal
Resources.
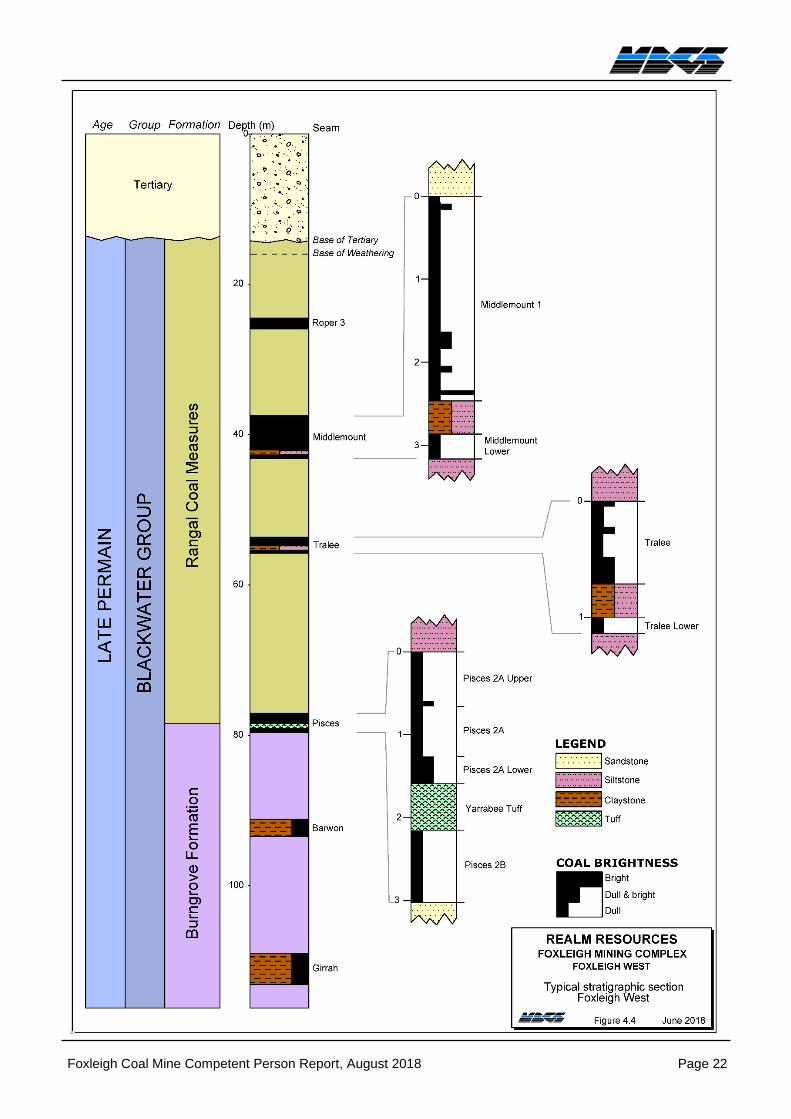
4.3.2 Foxleigh West
Figure 4.4 shows the typical stratigraphy of the Foxleigh West deposit. In contrast to the Foxleigh
Syncline, a single Roper ply is present, the Middlemount Seam is thinner than at Foxleigh Syncline
(approximately 3 – 3.5 m) and the Tralee Seam is only developed in the southern portion of Foxleigh
Foxleigh Coal Mine Competent Person Report, August 2018 Page 15
West. In the north, the Tralee Seam occurs as a poorly developed carbonaceous band <1.5 m and in
the south occurs as a 3 – 5 m seam. The Pisces 1 Seam is absent at Foxleigh West and the Pisces 2
Seam occurs as two plies, Pisces 2A and Pisces 2B, separated by the Yarrabee Tuff. Two Burngrove
Formation coal seams, the Barwon and Girrah seams, have been intersected in several drill holes,
however due to the limited intersections and banded nature, they were not considered as Coal
Resources at this stage.
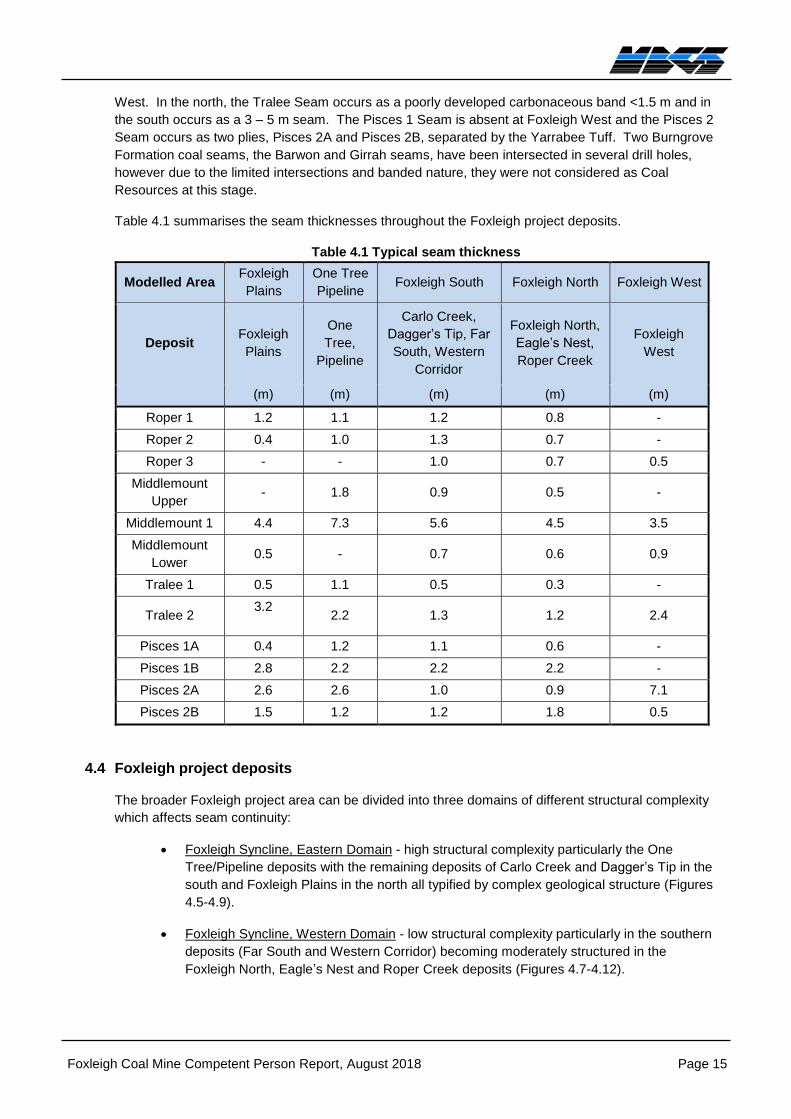
Table 4.1 summarises the seam thicknesses throughout the Foxleigh project deposits.
Table 4.1 Typical seam thickness
Modelled Area Foxleigh
Plains
One Tree
Pipeline Foxleigh South Foxleigh North Foxleigh West
Deposit Foxleigh
Plains
One
Tree,
Pipeline
Carlo Creek,
Dagger’s Tip, Far
South, Western
Corridor
Foxleigh North,
Eagle’s Nest,
Roper Creek
Foxleigh
West
(m) (m) (m) (m) (m)
Roper 1 1.2 1.1 1.2 0.8 -
Roper 2 0.4 1.0 1.3 0.7 -
Roper 3 - - 1.0 0.7 0.5
Middlemount
Upper - 1.8 0.9 0.5 -
Middlemount 1 4.4 7.3 5.6 4.5 3.5
Middlemount
Lower 0.5 - 0.7 0.6 0.9
Tralee 1 0.5 1.1 0.5 0.3 -
Tralee 2 3.2
2.2 1.3 1.2 2.4
Pisces 1A 0.4 1.2 1.1 0.6 -
Pisces 1B 2.8 2.2 2.2 2.2 -
Pisces 2A 2.6 2.6 1.0 0.9 7.1
Pisces 2B 1.5 1.2 1.2 1.8 0.5
4.4 Foxleigh project deposits
The broader Foxleigh project area can be divided into three domains of different structural complexity
which affects seam continuity:
• Foxleigh Syncline, Eastern Domain - high structural complexity particularly the One
Tree/Pipeline deposits with the remaining deposits of Carlo Creek and Dagger’s Tip in the
south and Foxleigh Plains in the north all typified by complex geological structure (Figures
4.5-4.9).
• Foxleigh Syncline, Western Domain - low structural complexity particularly in the southern
deposits (Far South and Western Corridor) becoming moderately structured in the
Foxleigh North, Eagle’s Nest and Roper Creek deposits (Figures 4.7-4.12).
Foxleigh Coal Mine Competent Person Report, August 2018 Page 16
• Foxleigh West Domain - moderate to highly structured with several significant thrust faults
dissecting the deposit (Figure 4.13).
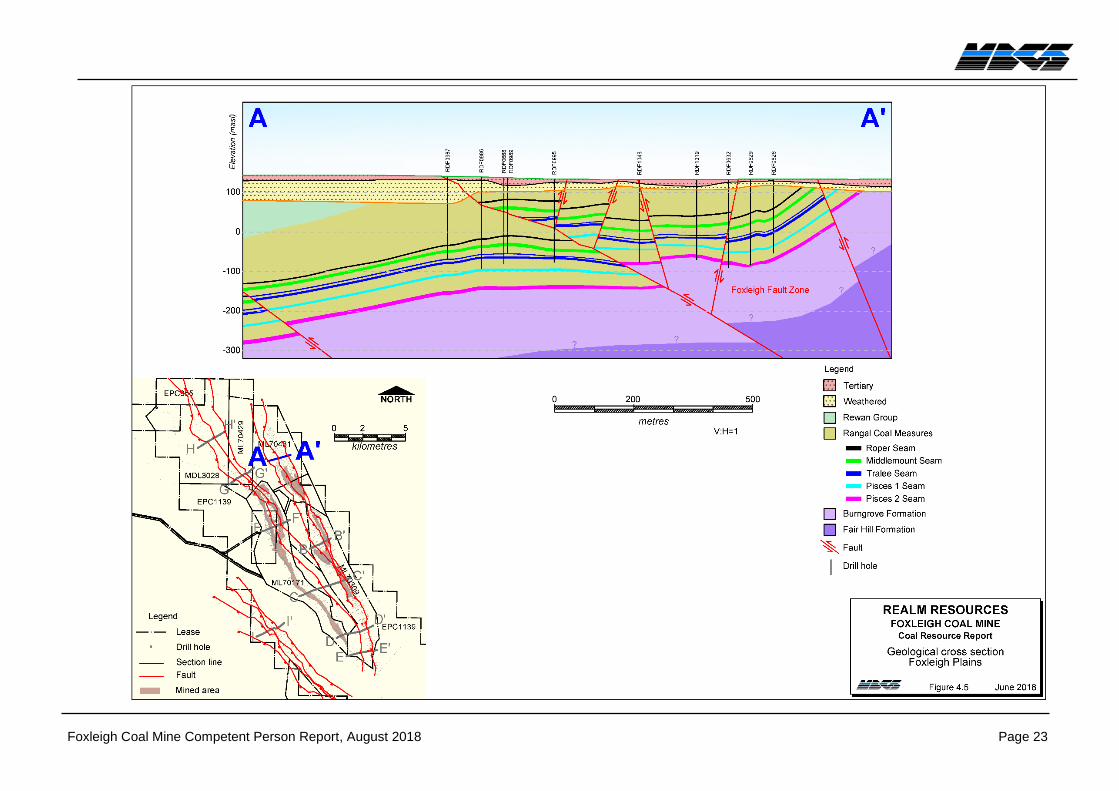
4.4.1 Foxleigh Plains
Foxleigh Plains covers an area approximately 6 km2 in the north on the eastern limb of the Foxleigh
Syncline and extends across ML70431 and ML70470 (Figure 1.3). Foxleigh Plains is a structurally
complex area divided into three structural domains, (eastern, central and western) separated by major
structures oriented north northwest. The eastern domain is complexly structured with steeply inclined
strata where seams are locally tilted with dips up to vertical. The central domain is more consistent,
with shallower, more uniform dips and smaller offset faults. The western domain is structurally
complex; dominated by the Foxleigh Fault Zone, with 100 – 200 m displacements. This fault zone
forms the western limit of Foxleigh Plains and contains numerous thrusted repetitions of the Rangal
Coal Measures seams.
Exploration drill holes are nominally 75 – 150 m apart (but can be <30 - 300 m apart) on east
northeast trending drill lines which are spaced at 75 - 130 m apart. Core holes are spaced 100 – 500
m apart. Mining at Foxleigh Plains has exploited the Roper, Middlemount, Tralee, Pisces 1 and Pisces
2 seams. An igneous sill has both completely and partially intruded the Tralee 2 Seam in the north of
Foxleigh Plains where parts of this seam has been heat affected.
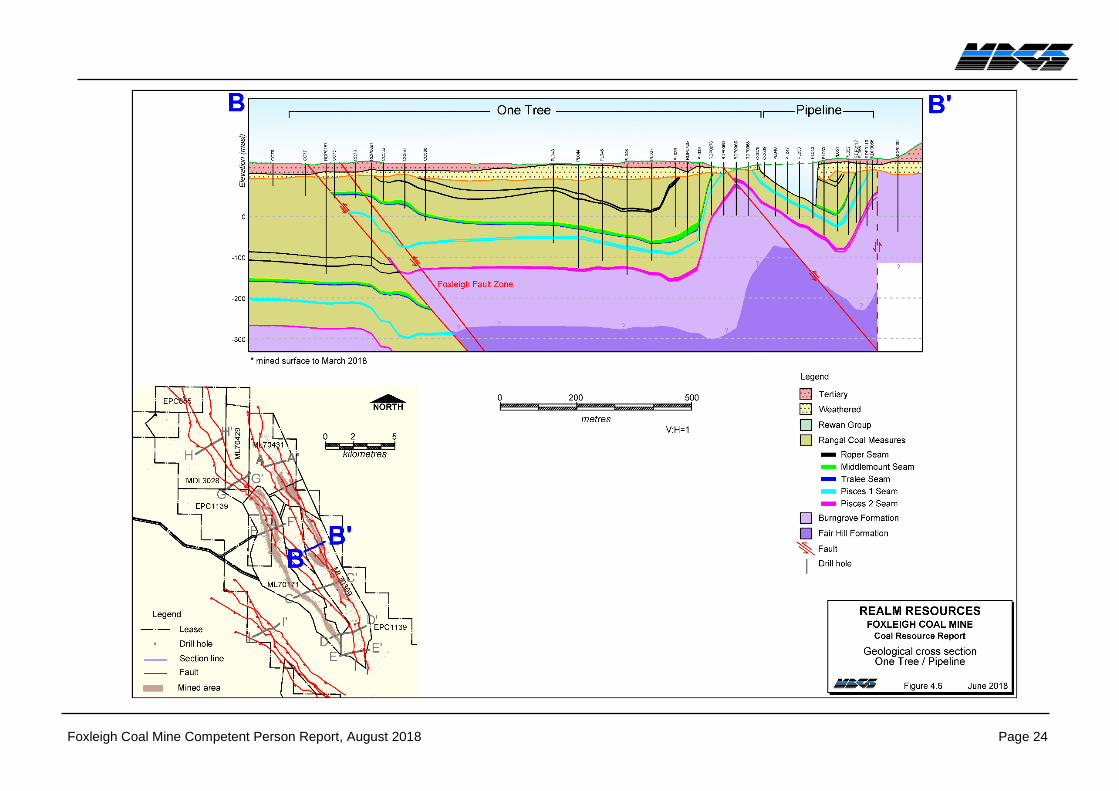
4.4.2 One Tree
One Tree extends over an area of approximately 4 km2 covering ML70431 and ML70309. The deposit
is on the eastern flank of the Foxleigh Syncline; comprising folds and thrust faults. One Tree lies on a
broad syncline structure with the axis plunging towards the northwest at a shallow angle (<20°). The
close of the structure in the southeast contains an open cut mining operation advancing to the north.
One Tree is limited to the west by a major thrust fault and to the east by the steep (>80°) syncline-
anticline limb which marks the boundary with the Pipeline deposit. Several smaller thrusts faults,
probably part of the Foxleigh Fault zone, (approximately 50 m offset) dissect the One Tree deposit on
the western boundary. The coal measures are relatively flat in the synclinal axis, moderately steep
(<50°) on the western limb and very steeply dipping (80°) on the eastern limb.
Exploration drill holes in the south of One Tree are spaced nominally 25 – 400 m apart on east
northeast trending lines varying from 50 – 400 m apart. Drill hole spacing increases from south to
north. Core holes with coal analyses are spaced from 150 - 900 m along the strike of the deposit.
Mining at One Tree has exploited the Middlemount, Tralee and a small portion of Roper Creek seams.
4.4.3 Pipeline
Pipeline covers ML70309 and ML70470 within an area of approximately 1 km2. The deposit is on the
eastern flank of the Foxleigh Syncline, immediately south of Foxleigh Plains and east of One Tree.
Pipeline is located on two northwest trending tight folds: an asymmetrical anticline and a syncline.
Open cut mining operations were carried out on the moderately dipping (approximately 40°) eastern
limb of the anticline while the steep (>80°) western limb marks the boundary with the One Tree
deposit. Towards the east the syncline marks the eastern boundary of the deposit, where it is abruptly
terminated by the regional Foxleigh Fault on the east, which uplifts the eastern block juxtaposing the
Rangal Coal Measures (in the west) with the older Burngrove Formation (in the east). Several smaller
sub-parallel thrust faults dissect the Pipeline deposit mainly in the north.
Exploration drill holes in the Pipeline deposit are nominally 25 - 350 m apart on east northeast trending
drill lines that are spaced between 50 - 200 m apart. Core holes with coal analyses are spaced up to 1
km apart along the strike of the deposit. Middlemount 1, Tralee 2 and Pisces 1B seams have been
historically mined by previous owners at Pipeline. A sill has been identified in the north within the
Foxleigh Coal Mine Competent Person Report, August 2018 Page 17
eastern limb of the anticline and follows the same dip as the coal seams towards the east. The sill is
usually above or within PI2A Ply of the Pisces 2 Seam and reaches up to 4 m in thickness.
4.4.4 Carlo Creek
The Carlo Creek deposit extends over an area of approximately 3 km2 within ML70309. The deposit is
on the eastern flank of the Foxleigh Syncline in a small synclinal fold structure created by several
parallel thrust faults that strike north northwest. The deposit is adjacent to the Foxleigh Fault Zone
and north of the Dagger’s Tip deposit. The northern limit of Carlo Creek is defined by another thrust
fault zone that separates the area from One Tree to the north. The coal measures are complexly
structured adjacent to the thrusts and dip to the east and west adjacent to the drag folded thrust
ramps.
Exploration drill holes in Carlo Creek deposit vary from 10 – 600 m apart on east northeast trending
drill lines, that are generally less than 100 m apart. Drill holes are further apart to the south, where the
structure is less complex. Holes with coal analyses range from 150 - 900 m apart along strike. Roper
and Middlemount 1 seams have been mined at Carlo Creek. Carlo Creek appears to be the most
structurally complex area of Foxleigh, particularly in the north where it joins the southern end of the
One Tree deposit.
4.4.5 Dagger’s Tip
Dagger’s Tip covering approximately 1.5 km2 in ML70309 and EPC1139, straddles the southern
closure of the Foxleigh Syncline and is dissected by at least three major north northwest striking thrust
faults. Structure in the eastern part of Dagger’s Tip is complex, similar to Carlo Creek to the north. In
contrast, on the western flank of the Foxleigh Syncline near its closure to the south Dagger’s Tip
exhibits only moderate structuring.
Exploration drill hole spacing ranges from 25 - 280 m on drill lines spaced at approximately 70 - 200
m. The limit of oxidation (LOX) is poorly defined in this area. Core holes with coal quality are sparse,
where present 800 m apart. No mining has been carried out at Dagger’s Tip and part of the area is
still held under EPC1139.
4.4.6 Far South
The Far South deposit is on the less structured western flank of the Foxleigh Syncline and covers
approximately 3 km2 in ML70171, ML70309 and EPC1139. The coal measures dip to the east
northeast at 8 - 15°.
Exploration drill holes are still close, ranging from 25 - 200 m apart even though the dip is more
reasonably uniform. LOX drill holes targeting the Middlemount 1 Seam are nominally spaced at 20 m
on drill lines spaced 25 – 75 m apart, along the strike of the entire deposit. Core holes with analytical
results are spaced 25 - 400 m along the strike of the deposit. The Roper, Middlemount and Tralee 2
seams have previously been mined at Far South.
4.4.7 Western Corridor
Situated on the less structured western flank of the Foxleigh Syncline, Western Corridor covers an
area of approximately 2.5 km2 within ML70171 and EPC1139. The coal measures dip to the east
northeast at about 10°.
Exploration drill holes are 25 – 170 m apart and detailed LOX holes to the Middlemount 1 Seam are
spaced at about 20 m on closely spaced drill lines (25 – 75 m) along the strike of the entire Western
Corridor deposit. Core holes with analytical results are spaced 50 - 500 m along the strike of the
deposit. Roper, Middlemount and Tralee 2 seams have been mined in the past at Western Corridor.
Foxleigh Coal Mine Competent Person Report, August 2018 Page 18
4.4.8 Foxleigh North
Foxleigh North occurs within ML70171and ML70431 in an area of approximately 6 km2 on the north
western flank of the Foxleigh Syncline. The deposit is dissected by four north northwest striking thrust
faults. In the north, the geology is complex, with drag folding associated with significant thrust faulting
forming a synclinal-anticlinal structure. The southern part of the deposit is less structurally complex
with strata dipping moderately to the east, although locally steepening adjacent to thrust faults.
Exploration drill hole spacing is close, ranging 25 - 150 m apart on east northeast trending drill lines
spaced 200 – 250 m apart. Core holes with analytical results are spaced 100 – 500 m along the strike
of the deposit. The principal mined seam in Foxleigh North is the Middlemount 1. Roper 1 and
portions of Tralee 2 have also been mined.
4.4.9 Eagle’s Nest
Eagle’s Nest covers an area approximately 3 km2 in parts of ML70429, ML70430, ML70431 and
MDL3028. The deposit is structurally complex with drag folding associated with significant thrust
faulting, forming synclinal-anticlinal structures.
Exploration drill hole spacing is broader than Foxleigh North at 100 – 400 m on east northeast trending
drill lines spaced 250 – 500 m apart. Core holes with analytical results are spaced from to 500 to
1,200 m along the strike of the deposit. No mining has been conducted at Eagle’s Nest.
4.4.10 Roper Creek
Roper Creek covers an area approximately 10 km2 within MDL3028 and EPC855, on the western flank
of the Foxleigh Syncline. Roper Creek is situated along strike to the north of Eagle’s Nest and is
dissected by three of the persistent north northwest striking thrust faults present in Eagle’s Nest and
Foxleigh North to the south. The unconsolidated clay-rich Tertiary strata that overlie the Permian coal
measures tend to be thicker in the north of Roper Creek compared to the south.
Exploration drill hole spacing is sparse, ranging 200 - 500m on east northeast trending drill lines
nominally spaced 500 m apart. Core holes with analytical results are spaced from to 500 to 1,200 m.
The seams of economic interest in Roper Creek are Roper 3, Middlemount 1 and Tralee 2. An
igneous sill that has locally heat affected the Pisces 1 Seam, has been identified at Roper Creek.
4.4.11 Foxleigh West
Foxleigh West, covering an area of approximately 17 km2 in the north western part of EPC1139,
straddles the Jellinbah Fault Zone. Foxleigh West is situated to the east of AAMC’s Lake Lindsay
Mine and is dissected by three persistent north northwest striking thrust faults of the Jellinbah Fault
Zone. Strata dip to the southwest at approximately 5 - 12°.
Exploration drill hole spacing is sparse, ranging 100 – 400 m on northeast trending drill lines spaced
200 - 500 m apart. The seams of economic interest in Foxleigh West are Middlemount 1, Tralee and
Pisces 2.
Foxleigh Coal Mine Competent Person Report, August 2018 Page 19
Figure 4.1 Regional geology
Foxleigh Coal Mine Competent Person Report, August 2018 Page 20
Figure 4.2 Local geology
Foxleigh Coal Mine Competent Person Report, August 2018 Page 21
Figure 4.3 Typical stratigraphic section – Foxleigh Syncline
Foxleigh Coal Mine Competent Person Report, August 2018 Page 22
Figure 4.4 Typical stratigraphic section – Foxleigh West
Foxleigh Coal Mine Competent Person Report, August 2018 Page 23
Figure 4.5 Geological cross section, Foxleigh Plains
Foxleigh Coal Mine Competent Person Report, August 2018 Page 24
Figure 4.6 Geological cross section, One Tree/Pipeline
Foxleigh Coal Mine Competent Person Report, August 2018 Page 25
Figure 4.7 Geological cross section, Western Corridor to Carlo Creek
Foxleigh Coal Mine Competent Person Report, August 2018 Page 26
Figure 4.8 Geolgoical cross section, Far South to Carlo Creek
Foxleigh Coal Mine Competent Person Report, August 2018 Page 27
Figure 4.9 Geological cross section, Dagger’s Tip
Foxleigh Coal Mine Competent Person Report, August 2018 Page 28
Figure 4.10 Geological cross section, Foxleigh North
Foxleigh Coal Mine Competent Person Report, August 2018 Page 29
Figure 4.11 Geological cross section, Eagle’s Nest
Foxleigh Coal Mine Competent Person Report, August 2018 Page 30
Figure 4.12 Geological cross section, Roper Creek
Foxleigh Coal Mine Competent Person Report, August 2018 Page 31
Figure 4.13 Geological cross section, Foxleigh West
Foxleigh Coal Mine Competent Person Report, August 2018 Page 32
4.5 Coal quality
4.5.1 Foxleigh Syncline
Approximately 1,300 samples from 270 drill holes are available with raw coal quality information for the
Foxleigh Syncline area. The cores from most of these holes has been sampled on a lithology basis,
analysed for apparent relative density and then combined to a full seam/ply representative sample for
a full suite of analysis to be undertaken. For the purposes of this report the individual sample density
values were not used, only the combined full seam/ply analysis was loaded and modelled for Coal
Resource reporting.
Coal from the mining areas of the Foxleigh Syncline produce a low volatile PCI product when
beneficiated to a marketable target ash. Simulated ashes target 8 - 10% for the Roper, Middlemount,
Tralee and Pisces 1 seams and slightly higher for the Pisces 2A Seam at 12% ash. A target ash of
25% is used for the Pisces 2B Seam, to potentially target a thermal product. Raw coal ash of the
seams typically 10 - 30% (although higher for the Pisces 2B Ply at 40 - 45%) with an average volatile
matter content of approximately 11% on the eastern domain of the Foxleigh Syncline and 13% on the
western domain of the syncline.
Distribution of phosphorus within the Foxleigh Syncline is variable and ranges from moderate to very
high (generally ranging 0.005 - 0.300%).
Float/sink testing of coal cores indicate theoretical lab yields typically vary between 50 - 90%, with
typical product target ashes ranges from 8 - 12% (except Pisces 2B – 25% ash) with calorific values
averaging 32 MJ/kg (except Pisces 2B - 25 MJ/kg). Phosphorus in the clean coal composite varies,
typically ranging from 0.007 - 0.200%, with higher phosphorus generally associated with the Tralee 2
Seam.
Coal seams in Foxleigh are high rank, with vitrinite reflectance values ranging 1.86 – 2.30%, with
highest reflectance values in the eastern domain of the syncline, and typically low volatile matter (10 -
12%).
Foxleigh Coal Mine Competent Person Report, August 2018 Page 33
Table 4.2 Typical raw coal quality, Foxleigh Syncline
Model area Deposit Seam/Ply
Air dried basis
Relative Density
(g/cc)
Moisture
(%)
Raw ash
(%)
Volatile matter
(%)
Fixed carbon
(%)
Total sulphur
(%)
Phosphorus
(%)
Foxleigh Plains
Foxleigh Plains
Roper 1 1.47 1.5 15 11 73 0.7 0.08
Middlemount 1 1.48 1.8 16 11 72 0.5 0.11
Tralee 2 1.49 1.8 16 10 72 0.6 0.17
Pisces 1B 1.47 1.7 15 11 73 0.6 0.11
Pisces 2A 1.51 1.9 18 10 71 0.5 0.10
Pisces 2B 1.70 1.8 38 8 53 0.4 0.03
One Tree Pipeline
One Tree & Pipeline
Roper 1 & 2 - - - - - - -
Middlemount 1 1.44 1.7 11 10 77 0.5 0.08
Tralee 2 1.50 1.9 17 10 71 0.6 0.05
Pisces 1B 1.47 1.7 15 11 72 0.8 0.11
Pisces 2A 1.49 1.9 17 10 72 0.6 0.12
Pisces 2B 1.83 2.3 47 7 44 0.7 0.22
Foxleigh South
Carlo Creek, Dagger’s Tip, Far South &
Western Corridor
Roper 1 & 2 1.56 1.2 24 14 62 1.0 -
Middlemount 1 1.44 1.4 12 12 75 0.6 0.09
Tralee 2 1.55 1.4 23 11 65 0.7 0.03
Pisces 1B 1.61 1.6 27 13 59 0.7 -
Pisces 2A/B - - - - - - -
Foxleigh North
Foxleigh North, Eagle’s Nest & Roper Creek
Roper 1, 2 & 3 1.49 1.4 17 14 67 1.0 0.10
Middlemount 1 1.46 1.5 13 12 73 0.6 0.12
Tralee 2 1.49 1.6 17 12 70 0.6 0.22
Pisces 1B 1.49 1.4 16 13 69 0.5 0.03
Pisces 2A/B - - - - - - -
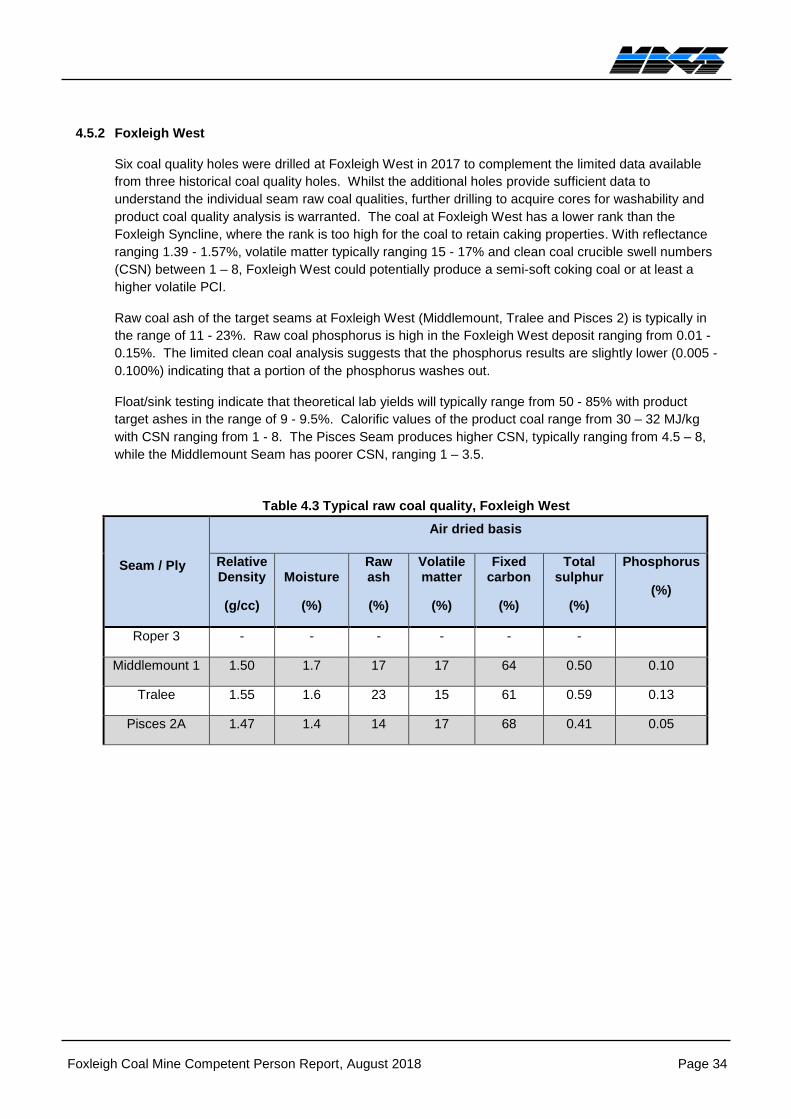
Foxleigh Coal Mine Competent Person Report, August 2018 Page 34
4.5.2 Foxleigh West
Six coal quality holes were drilled at Foxleigh West in 2017 to complement the limited data available
from three historical coal quality holes. Whilst the additional holes provide sufficient data to
understand the individual seam raw coal qualities, further drilling to acquire cores for washability and
product coal quality analysis is warranted. The coal at Foxleigh West has a lower rank than the
Foxleigh Syncline, where the rank is too high for the coal to retain caking properties. With reflectance
ranging 1.39 - 1.57%, volatile matter typically ranging 15 - 17% and clean coal crucible swell numbers
(CSN) between 1 – 8, Foxleigh West could potentially produce a semi-soft coking coal or at least a
higher volatile PCI.
Raw coal ash of the target seams at Foxleigh West (Middlemount, Tralee and Pisces 2) is typically in
the range of 11 - 23%. Raw coal phosphorus is high in the Foxleigh West deposit ranging from 0.01 -
0.15%. The limited clean coal analysis suggests that the phosphorus results are slightly lower (0.005 -
0.100%) indicating that a portion of the phosphorus washes out.
Float/sink testing indicate that theoretical lab yields will typically range from 50 - 85% with product
target ashes in the range of 9 - 9.5%. Calorific values of the product coal range from 30 – 32 MJ/kg
with CSN ranging from 1 - 8. The Pisces Seam produces higher CSN, typically ranging from 4.5 – 8,
while the Middlemount Seam has poorer CSN, ranging 1 – 3.5.
Table 4.3 Typical raw coal quality, Foxleigh West
Seam / Ply
Air dried basis
Relative Density
(g/cc)
Moisture
(%)
Raw ash
(%)
Volatile matter
(%)
Fixed carbon
(%)
Total sulphur
(%)
Phosphorus
(%)
Roper 3 - - - - - -
Middlemount 1 1.50 1.7 17 17 64 0.50 0.10
Tralee 1.55 1.6 23 15 61 0.59 0.13
Pisces 2A 1.47 1.4 14 17 68 0.41 0.05
Foxleigh Coal Mine Competent Person Report, August 2018 Page 35
5 GEOLOGICAL DATA
5.1 Geological data
5.1.1 Survey and mapping
Drill hole collar locations at Foxleigh have historically been surveyed using various datums. All collar
locations have been converted to and stored in the GDA94 MGA Zone 55 coordinate projection
system and Australian Height Datum (AHD).
Collar elevations were checked against a topographic surface generated from LiDAR data acquired by
site in September 2017. Most drill collar elevations were within 2 m of the topographic surface, where
not effected by mining.
In-pit mapping of coal seams and structures was previously carried out on a local scale in each
operating pit. This mapping data has not been located.
5.1.2 Drill hole information
Exploration drilling at Foxleigh has included non-core holes, fully cored holes (for geotechnical and
coal quality purposes), partially cored holes for coal quality, large diameter (200 mm) core holes for
washability studies and Limit of Oxidation (LOX) holes. Not all non-core or partially cored holes
intersect all the target seams (Roper to Pisces 2). A low proportion of core holes (5%) to non-core
holes (95%) has been drilled across the area, largely in attempts to resolve the complex structure.
The Foxleigh mine area occurs within a north-northwest plunging syncline, that closes to the south in
Dagger’s Tip. The eastern limb is highly structured and as a result, drill holes are closely spaced (25 -
100 m) on drill lines between 75 - 150 m apart in the mining areas. The western limb is less structured
in the south although the structural complexity increases towards the north. Exploration drill holes are
spaced 25 - 500 m apart on drill lines that are spaced 100 - 500 m along strike. This excludes mine
development (LOX) drilling along the subcrop, which is spaced <20 m. At Foxleigh West, holes area
spaced 50 – 500 m apart on drill lines spaced approximately 500 m apart.
5.1.3 Geophysical data
5.1.3.1. Down hole geophysical logs
Most exploration holes drilled since the 1980s (>80%) were geophysically logged with natural gamma,
long and short spaced density and caliper tools. Neutron and multichannel sonic logs were run in
geotechnical holes to provide additional lithological information and rock strength respectively.
Selected holes were logged with a deviation tool.
All geophysical logging is currently recorded digitally, with data provided both as hard copy prints and
in digital LAS format. Foxleigh is undertaking a process of scanning historical hard copy geophysical
logs to convert them into digital LAS data for holes where the digital data does not already exist.
Coal seam depths were reconciled to the geophysical density logs before geological modelling.
5.1.3.2. Seismic
AAMC commissioned four campaigns of 2D seismic surveys from 2009 - 2012 across the Foxleigh
project areas (Figure 3.1).
Foxleigh Coal Mine Competent Person Report, August 2018 Page 36
The 2D seismic traverses have resolved the location of the major faults, fault zones and associated
fold structures across the syncline. The seismic data have been used to aid the geological
interpretation, provide structural control in the models and confidence in seam continuity.
AAMC also undertook a helicopter magnetometer (heli-mag) survey in 2008 which identified bedding
features and resolved several intrusions.
5.1.4 Geological logging
Current and historical geological data has been logged using conventional lithological codes and
logging standards applied by the various explorers. Most of the geological and geophysical drill hole
information prior to September 2016 was acquired by AAMC with the quality of logging and data
capture considered to be high. MMS have adopted many of the routines established by AAMC and
have maintained that standard. Open holes recovered chip samples every metre for lithological
logging while all core holes were logged for geological and geotechnical purposes. Quantitative
logging of lithology, stratigraphy, texture and hardness was conducted using standard dictionary
definitions. Colour and any additional qualitative comments were also recorded.
The base of weathering (BOW) data was determined from either visual observation or analytical
testing of coal properties in LOX holes.
5.2 Geological modelling
Five geological grid models were constructed by MBGS in 2018, to cover the eleven mining/deposit
areas of Foxleigh (Table 5.1 and Figure 3.1).
Table 5.1 Foxleigh geological computer models
Model name Deposit
Foxleigh Plains Foxleigh Plains
One Tree Pipeline One Tree and Pipeline
Foxleigh South Carlo Creek, Dagger’s Tip,
Far South and Western Corridor
Foxleigh North Foxleigh North, Eagle’s Nest
and Roper Creek
Foxleigh West Foxleigh West
These models were constructed using Minex software, and are an update of the previous Minescape
models produced by AAMC, prior to acquisition of Foxleigh mine by Middlemount South. The
exception being the Foxleigh Plains model which was updated in 2017 by the Measured Group. The
Minex models were constructed from drill hole and seismic data and regional geological
understanding. The orientation and displacements for several significant thrust faults were interpreted
from cross sectional studies using both drill hole and seismic information and incorporated into each
3D faulted model. Accurate modelling of the thrust faults is important in this complex geological
setting to allow seam/strata repetition, through over thrusting, to be well represented in each of the
models. The faults strike north northwest, with displacements ranging from a few metres up to
hundreds of metres. Grids of the roof, floor and thickness were generated for all coal plies for Roper,
Middlemount, Tralee and Pisces seams.
The upper topographic surface used for all model areas was the current LiDAR surface, dated
September 2017. Base of Tertiary and base of weathering was generated for all models (based on
drill hole database information and the original topography surface). All seam grids in the geological
model are uncut to topographic/weathering/mined surfaces, however an upper limit surface for all coal

Foxleigh Coal Mine Competent Person Report, August 2018 Page 37
seams was generated to limit the upper extension of coal seams for resource and reserve estimation.
Polygons defining the mined-out areas were used to merge the structure floor of the lowest mined
seam in that area with the base of weathering surface.
Coal quality data has been modelled where available for raw and clean coal proximate analysis, which
includes a derived in situ density using the Preston Sanders equation, raw ash, volatiles, moisture,
energy, total sulphur, phosphorus, etc. Also, petrography, ultimates, simulated ash and simulated
yield have been modelled. All coal quality data is modelled/reported at an air-dried moisture basis,
except for in situ density, which was gridded at an in situ moisture basis of 4.5%. Coal quality data
has been extrapolated over the entire area covered by the geological models.
Foxleigh Coal Mine Competent Person Report, August 2018 Page 38
6 COAL RESOURCES
6.1 Resource classification and limitations
Resources at Foxleigh were classified based on confidence in the understanding of geological
structure, seam thickness and coal quality integrity, using drill hole and coal quality data supported by
the consistency and continuity of coal seam character based on the down hole geophysical logs.
Confidence in continuity of the coal seams and the disposition of the seams because of widespread
thrust faulting, was complemented by extensive 2D seismic lines across the Foxleigh deposits (Figure
3.1). The seismic lines display high-quality resolution of the seams and structure and confidence is
high that the coal seams have continuity between drill holes. Resources have not been extrapolated
beyond the last drill hole intersection for each seam.
Using geophysical logs, the consistency of the coal seam character, thickness and indicative in situ
quality was able to be assessed between holes. A comparison of the geophysical density logs, for
open holes and core holes with analytical results, was used to confirm that the signature was very
similar and therefore the coal quality was consistent. This demonstrated continuity within each of the
seams in the deposit. The coal quality of each individual seam in the Foxleigh area was relatively
consistent and was identifiable and therefore comparable across faulted domains. The coal character
did not change across the fault boundaries indicating the consistency of coal quality in each seam
over extensive areas.
Coal seams at Foxleigh demonstrate reasonable consistency in thickness and quality, on a
seam/deposit basis. Structural complexity is the main factor that determines confidence in geological
knowledge and drives drill hole spacing at Foxleigh. Across the Foxleigh area the structural
complexity can be divided into three domains:
• Foxleigh Syncline, Eastern Domain - high structural complexity. Includes Foxleigh Plains,
One Tree, Pipeline, Carlo Creek and Dagger’s Tip.
• Foxleigh Syncline, Western Domain - low to moderate structural complexity. Includes low
structural complexity with Far South and Western Corridor becoming moderately
structured in the Foxleigh North, Eagle’s Nest and Roper Creek deposits.
• Foxleigh West Domain - moderate to highly structured, includes the Foxleigh West deposit
only.
Table 6.1 summarises drill hole spacings typically observed in the resource categories.
Table 6.1 Typical drill hole spacing
Domain Measured Indicated Inferred
Syncline – East
Structure holes 25-150 m,
can be up to 250 m.
Core holes up to 600 m.
Structure holes 25-250, can
be up to 400 m. Core holes
up to approx.1,500 m.
Structure holes up to
500 m.
Core holes sparse.
Syncline - West
Structure holes 25-200 m,
can be up to 500 m.
Core holes up to 1,500 m.
Structure holes 25-500 m,
can be up to 1,000 m.
Core holes 250-1,500 m
can be up to 2,500 m.
Structure holes up to
1,250 m.
Core holes sparse.
West
- Structure holes 50-500 m.
Core holes 500-2,000 m
Structure holes up to
1,800 m.
Core holes sparse.
Foxleigh Coal Mine Competent Person Report, August 2018 Page 39
Using the principles of continuity and consistency of seam character, it was determined that there was
enough drill hole density, adequate coal quality analyses and confidence in coal seam continuity to
categorise Coal Resources in each area for most of the target seams. Areas where there were
abundant coal seam intersections but a paucity of coal quality analyses, geophysical logs or a
difference in seam character, were classified as Inferred. These areas were of relatively limited
extent.
Coal Resources were limited to a depth of 200 m below topography. MBGS consider these resources
to have reasonable prospects for eventual economic extraction. No seam thickness or coal quality
limit was applied to the resource estimate. Seams included in the resource estimate have thicknesses
considered reasonable for extraction by open cut methods. All coal is assumed to be beneficiated on
site with variations in coal quality largely addressed through blending at site or the port.
Coal Resources have been estimated and reported using in situ density, which was calculated from
the laboratory relative density by applying the Preston and Sanders formula at an in situ moisture of
4.5%.
Previous resource studies have used an in situ moisture basis of 4.5% (AAMC, Measured Group,
Encompass Mining). After review of the moisture holding capacity data it was agreed that 4.5% was a
reasonable estimate for in situ moisture.
6.2 Coal Resources
Coal Resources within the Foxleigh area total 350 Mt, of which 110 Mt are classified as Measured
Resources and 180 Mt as Indicated Resources. A further 60 Mt of Inferred Resources are present
(Table 6.2). Approximately 140 Mt of coal, or 40% of the total, occur at depths less than 100 m. Table
6.2 summarises the resources by deposit and depth, and Tables 6.3 – 6.7 provide a detailed
breakdown of each of the resources for each deposit at Foxleigh on a seam and depth basis. Figures
6.1 – 6.5 present the resource areas for each seam, including geological data supporting the resource
classification.
In each of the resource areas, the Middlemount Seam contains most of the Coal Resources and is the
main target seam at Foxleigh. Total Coal Resources of approximately 146 Mt were estimated for the
Middlemount Seam, of which approximately 53 Mt were classified as Measured, 73 Mt as Indicated
and 17 Mt Inferred (Figure 6.2). These resources are within the Middlemount 1 Ply and only include
the Middle Upper and Lower plies where they were coalesced with Middlemount 1.
The Roper Seam includes up to three relatively thin (<1.5 m) coal plies in different parts of Foxleigh.
The main Roper ply in each deposit has been reported as a resource due to the consistency of coal
quality and thickness. The name of the main ply can differ from deposit to deposit. Due to the
relatively thin nature of the Roper Seam, it comprises only a small portion of the total resource at
Foxleigh, totalling 19 Mt, of which 6 Mt are classified as Inferred (Figure 6.1).
The main Tralee Seam, Tralee 2, varies in thickness and quality across the Foxleigh deposits, with
total resources of 63 Mt (21 Mt Measured; 34 Mt Indicated; 8 Mt Inferred - Figure 6.3). There are no
Tralee Seam resources in the north of Foxleigh West due to deterioration of the seam.
Pisces 1 Seam resources primarily occur in the 1.5 -3 m thick PI1B Ply. The PI1A Ply was not
considered a resource because of its generally thin and banded nature. Pisces 1B Seam comprises a
total resource of approximately 64 Mt, (23 Mt Measured; 33 Mt Indicated; 9 Mt Inferred - Figure 6.4).
Pisces 1 Seam at Roper Creek is intruded by an igneous sill and at Foxleigh West, only Pisces 2 is
present.
Pisces 2 Seam is the deepest of the resource seams and drill hole intersections are largely limited to
the northeast of the Foxleigh area. The exception to this is at Foxleigh West which is a separate
Foxleigh Coal Mine Competent Person Report, August 2018 Page 40
structural domain to the Foxleigh Syncline area. Coal Resources for the Pisces 2 Seam have been
reported at Foxleigh Plains, One Tree, Pipeline and Foxleigh West. Approximately, 54 Mt of coal have
been estimated for Pisces 2 Seam (5 Mt Measured; 30 Mt Indicated; 19 Mt Inferred) (Figure 6.5).
6.3 Coal Resource reconciliation
In 2015, AAMC reported Coal Resources for Foxleigh, covering Foxleigh Plains, One Tree/Pipeline,
Carlo Creek, Dagger’s Tip and Eagle’s Nest deposits. AAMC reported a total of 2.7 Mt Indicated and
32.5 Mt Inferred Resources for the combined areas. A breakdown of Coal Resources on a deposit
basis was not provided. In 2016, after acquiring Foxleigh from AAMC, MMS enlisted Encompass
Mining to provide an updated Coal Resources estimate for Foxleigh Plains, One Tree/Pipeline,
Dagger’s Tip and Far South. This report provides the source of the previous estimates for One
Tree/Pipeline, Dagger’s Tip and Far South. In 2017, Measured Group updated resources for Foxleigh
Plains and MBGS reported the initial resource estimate for Roper Creek. These have been used as
the previous estimates for Foxleigh Plains and Roper Creek.
Whilst production has extracted approximately 1.75 Mt from Foxleigh Plains and 0.57 Mt from One
Tree since previous estimates were reported, overall Coal Resources have increased by
approximately 200 Mt. This increase is largely due to the inclusion of new resources classified after
further exploration and modelling, such as approximately 80 Mt in the Eagle’s Nest deposit and 70 Mt
in the Foxleigh West deposit.
The 2018 Coal Resources at Foxleigh were reconciled against the most recent previous resource
report for each deposit. Table 6.8 summarises the differences in Coal Resources, reported in
accordance with the JORC Code, for Foxleigh mine.
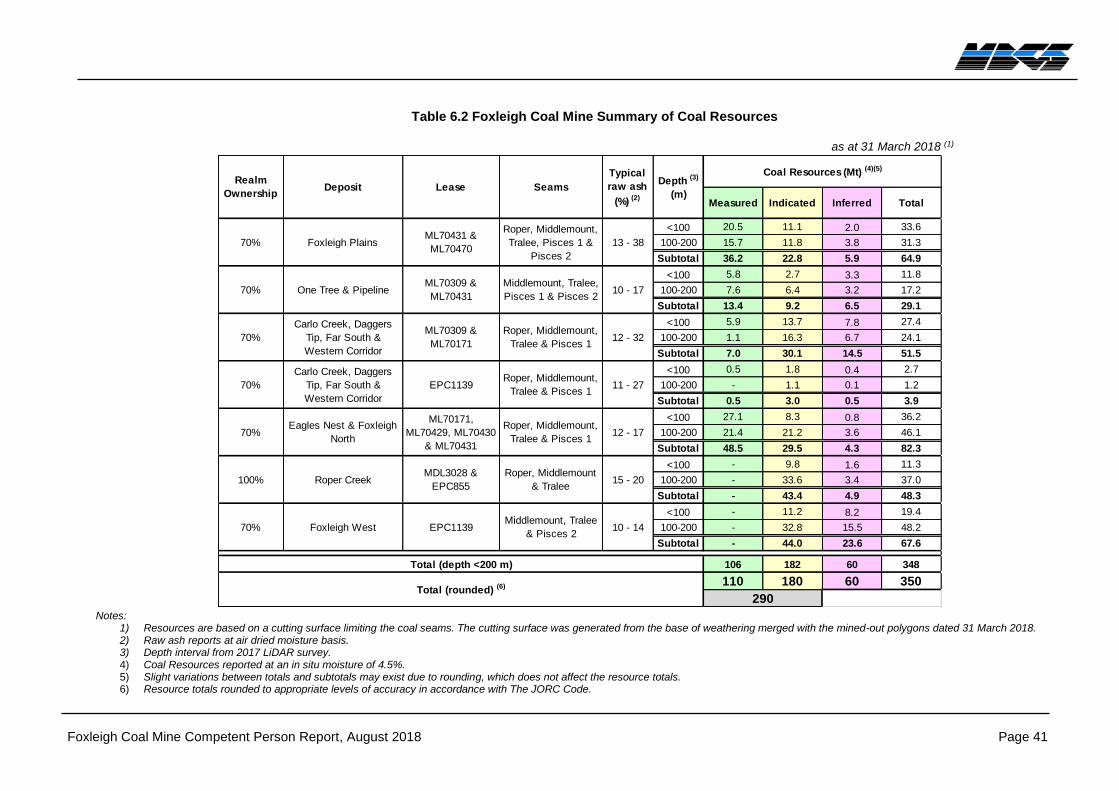
Foxleigh Coal Mine Competent Person Report, August 2018 Page 41
Table 6.2 Foxleigh Coal Mine Summary of Coal Resources
as at 31 March 2018 (1)
Notes:
1) Resources are based on a cutting surface limiting the coal seams. The cutting surface was generated from the base of weathering merged with the mined-out polygons dated 31 March 2018. 2) Raw ash reports at air dried moisture basis. 3) Depth interval from 2017 LiDAR survey. 4) Coal Resources reported at an in situ moisture of 4.5%. 5) Slight variations between totals and subtotals may exist due to rounding, which does not affect the resource totals. 6) Resource totals rounded to appropriate levels of accuracy in accordance with The JORC Code.
Measured Indicated Inferred Total
<100 20.5 11.1 2.0 33.6
100-200 15.7 11.8 3.8 31.3
Subtotal 36.2 22.8 5.9 64.9
<100 5.8 2.7 3.3 11.8
100-200 7.6 6.4 3.2 17.2
Subtotal 13.4 9.2 6.5 29.1
<100 5.9 13.7 7.8 27.4
100-200 1.1 16.3 6.7 24.1
Subtotal 7.0 30.1 14.5 51.5
<100 0.5 1.8 0.4 2.7
100-200 - 1.1 0.1 1.2
Subtotal 0.5 3.0 0.5 3.9
<100 27.1 8.3 0.8 36.2
100-200 21.4 21.2 3.6 46.1
Subtotal 48.5 29.5 4.3 82.3
<100 - 9.8 1.6 11.3
100-200 - 33.6 3.4 37.0
Subtotal - 43.4 4.9 48.3
<100 - 11.2 8.2 19.4
100-200 - 32.8 15.5 48.2
Subtotal - 44.0 23.6 67.6
106 182 60 348
110 180 60 350
290
70% Foxleigh West EPC1139Middlemount, Tralee
& Pisces 2
Total (depth <200 m)
Total (rounded) (6)
Roper, Middlemount,
Tralee & Pisces 1
Roper, Middlemount,
Tralee & Pisces 1
Roper, Middlemount,
Tralee & Pisces 1
100% Roper CreekMDL3028 &
EPC855
Roper, Middlemount
& Tralee
Carlo Creek, Daggers
Tip, Far South &
Western Corridor
Carlo Creek, Daggers
Tip, Far South &
Western Corridor
Eagles Nest & Foxleigh
North
ML70309 &
ML70171
EPC1139
ML70171,
ML70429, ML70430
& ML70431
70%
70%
70%
70%
70%
Coal Resources (Mt) (4)(5)
Foxleigh Plains
One Tree & Pipeline
ML70431 &
ML70470
ML70309 &
ML70431
Middlemount, Tralee,
Pisces 1 & Pisces 2
Roper, Middlemount,
Tralee, Pisces 1 &
Pisces 2
13 - 38
10 - 17
Realm
OwnershipDeposit Lease Seams
Depth (3)
(m)
Typical
raw ash
(%) (2)
12 - 32
11 - 27
12 - 17
15 - 20
10 - 14
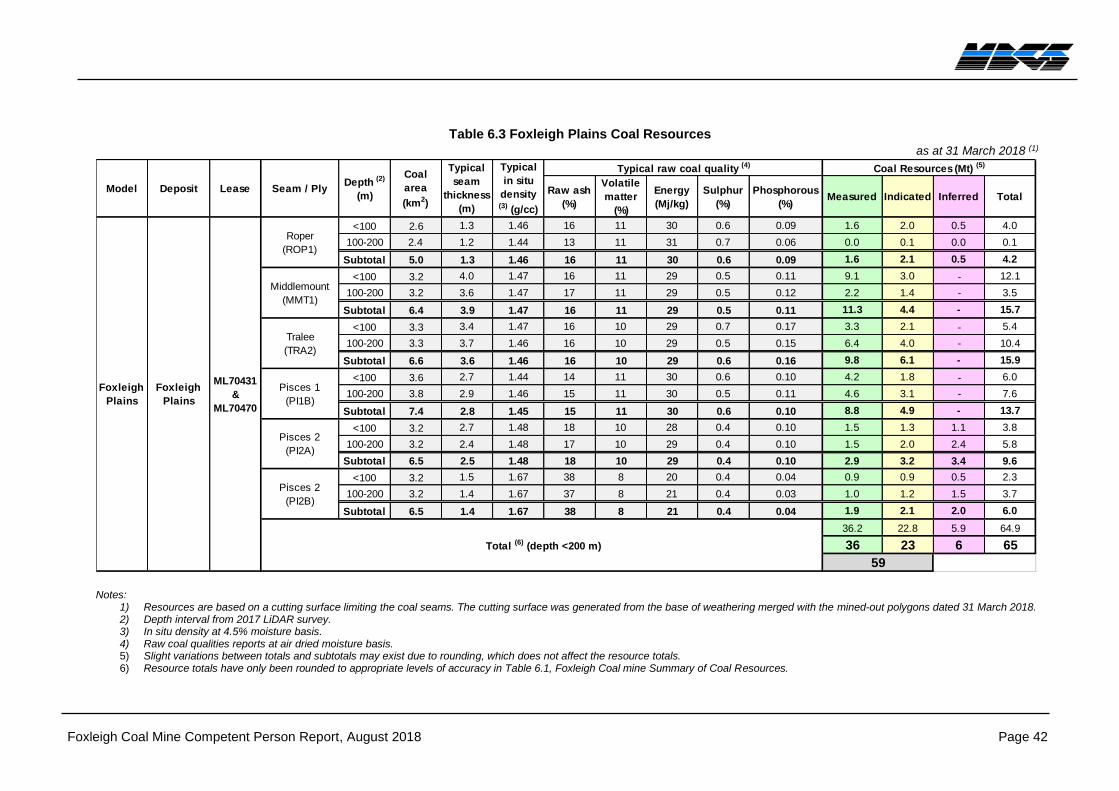
Foxleigh Coal Mine Competent Person Report, August 2018 Page 42
Table 6.3 Foxleigh Plains Coal Resources
as at 31 March 2018 (1)
Notes: 1) Resources are based on a cutting surface limiting the coal seams. The cutting surface was generated from the base of weathering merged with the mined-out polygons dated 31 March 2018. 2) Depth interval from 2017 LiDAR survey. 3) In situ density at 4.5% moisture basis. 4) Raw coal qualities reports at air dried moisture basis. 5) Slight variations between totals and subtotals may exist due to rounding, which does not affect the resource totals. 6) Resource totals have only been rounded to appropriate levels of accuracy in Table 6.1, Foxleigh Coal mine Summary of Coal Resources.
Raw ash
(%)
Volatile
matter
(%)
Energy
(Mj/kg)
Sulphur
(%)
Phosphorous
(%)Measured Indicated Inferred Total
<100 2.6 1.3 1.46 16 11 30 0.6 0.09 1.6 2.0 0.5 4.0
100-200 2.4 1.2 1.44 13 11 31 0.7 0.06 0.0 0.1 0.0 0.1
Subtotal 5.0 1.3 1.46 16 11 30 0.6 0.09 1.6 2.1 0.5 4.2
<100 3.2 4.0 1.47 16 11 29 0.5 0.11 9.1 3.0 - 12.1
100-200 3.2 3.6 1.47 17 11 29 0.5 0.12 2.2 1.4 - 3.5
Subtotal 6.4 3.9 1.47 16 11 29 0.5 0.11 11.3 4.4 - 15.7
<100 3.3 3.4 1.47 16 10 29 0.7 0.17 3.3 2.1 - 5.4
100-200 3.3 3.7 1.46 16 10 29 0.5 0.15 6.4 4.0 - 10.4
Subtotal 6.6 3.6 1.46 16 10 29 0.6 0.16 9.8 6.1 - 15.9
<100 3.6 2.7 1.44 14 11 30 0.6 0.10 4.2 1.8 - 6.0
100-200 3.8 2.9 1.46 15 11 30 0.5 0.11 4.6 3.1 - 7.6
Subtotal 7.4 2.8 1.45 15 11 30 0.6 0.10 8.8 4.9 - 13.7
<100 3.2 2.7 1.48 18 10 28 0.4 0.10 1.5 1.3 1.1 3.8
100-200 3.2 2.4 1.48 17 10 29 0.4 0.10 1.5 2.0 2.4 5.8
Subtotal 6.5 2.5 1.48 18 10 29 0.4 0.10 2.9 3.2 3.4 9.6
<100 3.2 1.5 1.67 38 8 20 0.4 0.04 0.9 0.9 0.5 2.3
100-200 3.2 1.4 1.67 37 8 21 0.4 0.03 1.0 1.2 1.5 3.7
Subtotal 6.5 1.4 1.67 38 8 21 0.4 0.04 1.9 2.1 2.0 6.0
36.2 22.8 5.9 64.9
36 23 6 65
59
Coal Resources (Mt) (5)
Foxleigh
Plains
ML70431
&
ML70470
Roper
(ROP1)
Middlemount
(MMT1)
Tralee
(TRA2)
Pisces 1
(PI1B)
Pisces 2
(PI2A)
Pisces 2
(PI2B)
Deposit Lease Seam / PlyDepth (2)
(m)
Coal
area
(km2)
Typical
seam
thickness
(m)
Typical
in situ
density (3) (g/cc)
Typical raw coal quality (4)
Total (6) (depth <200 m)
Model
Foxleigh
Plains
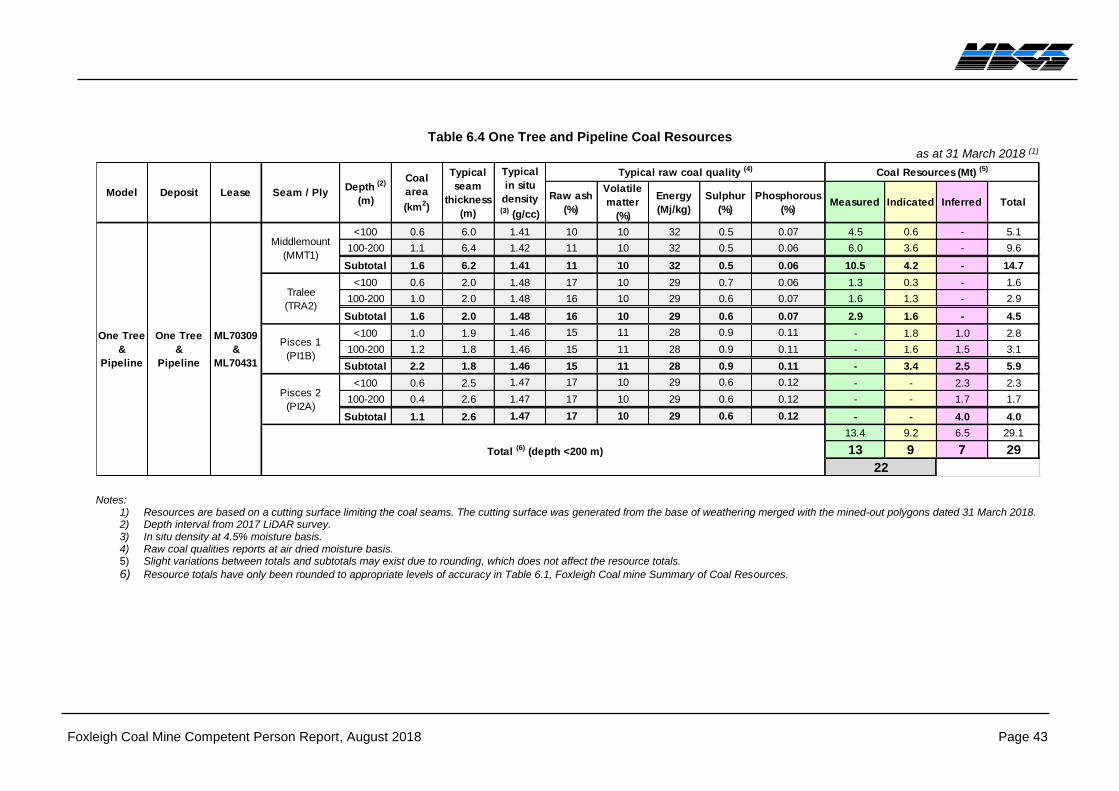
Foxleigh Coal Mine Competent Person Report, August 2018 Page 43
Table 6.4 One Tree and Pipeline Coal Resources
as at 31 March 2018 (1)
Notes: 1) Resources are based on a cutting surface limiting the coal seams. The cutting surface was generated from the base of weathering merged with the mined-out polygons dated 31 March 2018. 2) Depth interval from 2017 LiDAR survey. 3) In situ density at 4.5% moisture basis. 4) Raw coal qualities reports at air dried moisture basis. 5) Slight variations between totals and subtotals may exist due to rounding, which does not affect the resource totals.
6) Resource totals have only been rounded to appropriate levels of accuracy in Table 6.1, Foxleigh Coal mine Summary of Coal Resources.
Raw ash
(%)
Volatile
matter
(%)
Energy
(Mj/kg)
Sulphur
(%)
Phosphorous
(%)Measured Indicated Inferred Total
<100 0.6 6.0 1.41 10 10 32 0.5 0.07 4.5 0.6 - 5.1
100-200 1.1 6.4 1.42 11 10 32 0.5 0.06 6.0 3.6 - 9.6
Subtotal 1.6 6.2 1.41 11 10 32 0.5 0.06 10.5 4.2 - 14.7
<100 0.6 2.0 1.48 17 10 29 0.7 0.06 1.3 0.3 - 1.6
100-200 1.0 2.0 1.48 16 10 29 0.6 0.07 1.6 1.3 - 2.9
Subtotal 1.6 2.0 1.48 16 10 29 0.6 0.07 2.9 1.6 - 4.5
<100 1.0 1.9 1.46 15 11 28 0.9 0.11 - 1.8 1.0 2.8
100-200 1.2 1.8 1.46 15 11 28 0.9 0.11 - 1.6 1.5 3.1
Subtotal 2.2 1.8 1.46 15 11 28 0.9 0.11 - 3.4 2.5 5.9
<100 0.6 2.5 1.47 17 10 29 0.6 0.12 - - 2.3 2.3
100-200 0.4 2.6 1.47 17 10 29 0.6 0.12 - - 1.7 1.7
Subtotal 1.1 2.6 1.47 17 10 29 0.6 0.12 - - 4.0 4.0
13.4 9.2 6.5 29.1
13 9 7 29
22
One Tree
&
Pipeline
ML70309
&
ML70431
Middlemount
(MMT1)
Tralee
(TRA2)
Pisces 1
(PI1B)
Pisces 2
(PI2A)
Deposit Lease Seam / Ply
Typical
in situ
density (3) (g/cc)
Typical raw coal quality (4) Coal Resources (Mt) (5)
Depth (2)
(m)
Coal
area
(km2)
Typical
seam
thickness
(m)
Total (6) (depth <200 m)
Model
One Tree
&
Pipeline
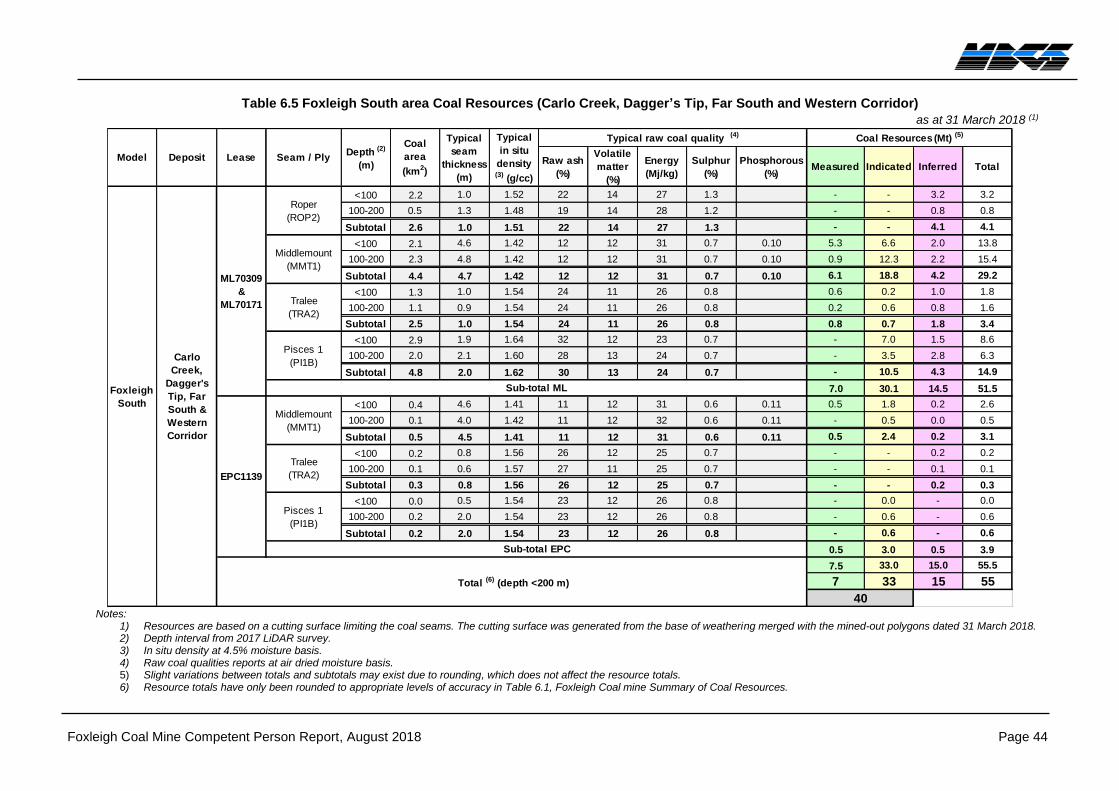
Foxleigh Coal Mine Competent Person Report, August 2018 Page 44
Table 6.5 Foxleigh South area Coal Resources (Carlo Creek, Dagger’s Tip, Far South and Western Corridor)
as at 31 March 2018 (1)
Notes:
1) Resources are based on a cutting surface limiting the coal seams. The cutting surface was generated from the base of weathering merged with the mined-out polygons dated 31 March 2018. 2) Depth interval from 2017 LiDAR survey. 3) In situ density at 4.5% moisture basis. 4) Raw coal qualities reports at air dried moisture basis. 5) Slight variations between totals and subtotals may exist due to rounding, which does not affect the resource totals. 6) Resource totals have only been rounded to appropriate levels of accuracy in Table 6.1, Foxleigh Coal mine Summary of Coal Resources.
Raw ash
(%)
Volatile
matter
(%)
Energy
(Mj/kg)
Sulphur
(%)
Phosphorous
(%)Measured Indicated Inferred Total
<100 2.2 1.0 1.52 22 14 27 1.3 - - 3.2 3.2
100-200 0.5 1.3 1.48 19 14 28 1.2 - - 0.8 0.8
Subtotal 2.6 1.0 1.51 22 14 27 1.3 - - 4.1 4.1
<100 2.1 4.6 1.42 12 12 31 0.7 0.10 5.3 6.6 2.0 13.8
100-200 2.3 4.8 1.42 12 12 31 0.7 0.10 0.9 12.3 2.2 15.4
Subtotal 4.4 4.7 1.42 12 12 31 0.7 0.10 6.1 18.8 4.2 29.2
<100 1.3 1.0 1.54 24 11 26 0.8 0.6 0.2 1.0 1.8
100-200 1.1 0.9 1.54 24 11 26 0.8 0.2 0.6 0.8 1.6
Subtotal 2.5 1.0 1.54 24 11 26 0.8 0.8 0.7 1.8 3.4
<100 2.9 1.9 1.64 32 12 23 0.7 - 7.0 1.5 8.6
100-200 2.0 2.1 1.60 28 13 24 0.7 - 3.5 2.8 6.3
Subtotal 4.8 2.0 1.62 30 13 24 0.7 - 10.5 4.3 14.9
7.0 30.1 14.5 51.5
<100 0.4 4.6 1.41 11 12 31 0.6 0.11 0.5 1.8 0.2 2.6
100-200 0.1 4.0 1.42 11 12 32 0.6 0.11 - 0.5 0.0 0.5
Subtotal 0.5 4.5 1.41 11 12 31 0.6 0.11 0.5 2.4 0.2 3.1
<100 0.2 0.8 1.56 26 12 25 0.7 - - 0.2 0.2
100-200 0.1 0.6 1.57 27 11 25 0.7 - - 0.1 0.1
Subtotal 0.3 0.8 1.56 26 12 25 0.7 - - 0.2 0.3
<100 0.0 0.5 1.54 23 12 26 0.8 - 0.0 - 0.0
100-200 0.2 2.0 1.54 23 12 26 0.8 - 0.6 - 0.6
Subtotal 0.2 2.0 1.54 23 12 26 0.8 - 0.6 - 0.6
0.5 3.0 0.5 3.9
7.5 33.0 15.0 55.5
7 33 15 55
40
EPC1139
Middlemount
(MMT1)
Tralee
(TRA2)
Deposit Lease Seam / PlyDepth (2)
(m)
Coal
area
(km2)
Typical
seam
thickness
(m)
Pisces 1
(PI1B)
Roper
(ROP2)
Middlemount
(MMT1)
Carlo
Creek,
Dagger's
Tip, Far
South &
Western
Corridor
Tralee
(TRA2)
Pisces 1
(PI1B)
Typical
in situ
density (3) (g/cc)
Typical raw coal quality (4) Coal Resources (Mt) (5)
ML70309
&
ML70171
Sub-total ML
Sub-total EPC
Model
Foxleigh
South
Total (6) (depth <200 m)
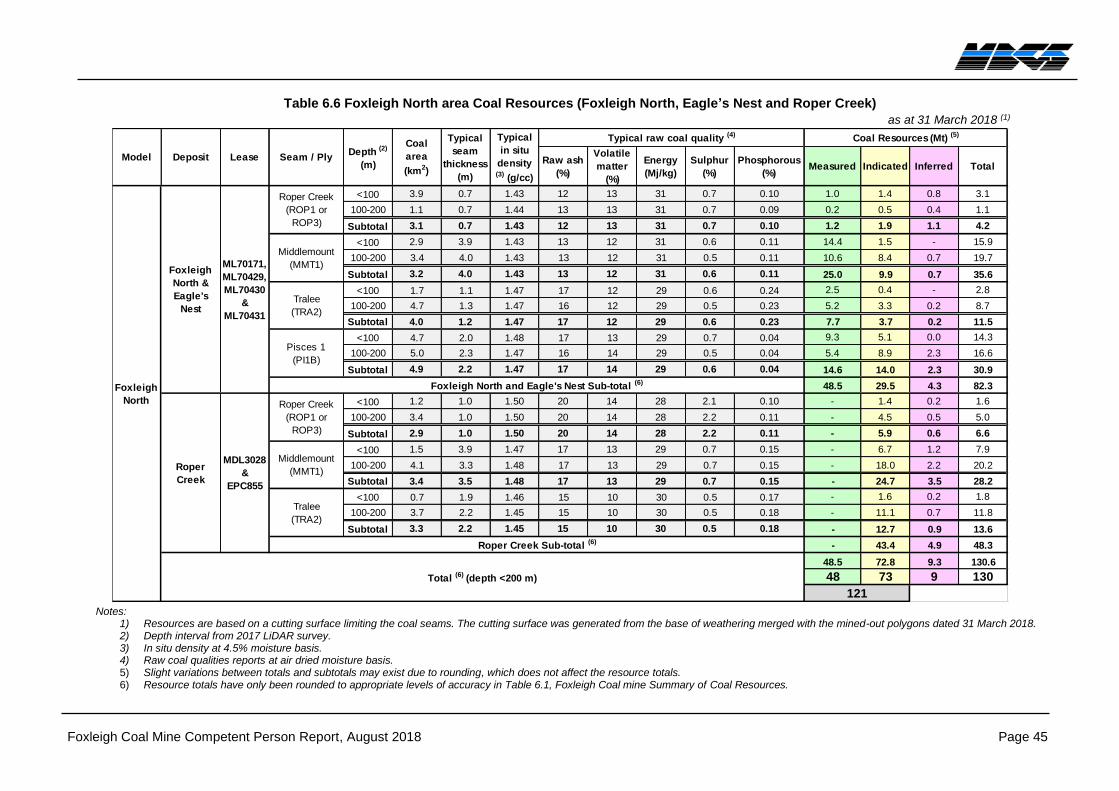
Foxleigh Coal Mine Competent Person Report, August 2018 Page 45
Table 6.6 Foxleigh North area Coal Resources (Foxleigh North, Eagle’s Nest and Roper Creek)
as at 31 March 2018 (1)
Notes:
1) Resources are based on a cutting surface limiting the coal seams. The cutting surface was generated from the base of weathering merged with the mined-out polygons dated 31 March 2018. 2) Depth interval from 2017 LiDAR survey. 3) In situ density at 4.5% moisture basis. 4) Raw coal qualities reports at air dried moisture basis. 5) Slight variations between totals and subtotals may exist due to rounding, which does not affect the resource totals. 6) Resource totals have only been rounded to appropriate levels of accuracy in Table 6.1, Foxleigh Coal mine Summary of Coal Resources.
Raw ash
(%)
Volatile
matter
(%)
Energy
(Mj/kg)
Sulphur
(%)
Phosphorous
(%)Measured Indicated Inferred Total
<100 3.9 0.7 1.43 12 13 31 0.7 0.10 1.0 1.4 0.8 3.1
100-200 1.1 0.7 1.44 13 13 31 0.7 0.09 0.2 0.5 0.4 1.1
Subtotal 3.1 0.7 1.43 12 13 31 0.7 0.10 1.2 1.9 1.1 4.2
<100 2.9 3.9 1.43 13 12 31 0.6 0.11 14.4 1.5 - 15.9
100-200 3.4 4.0 1.43 13 12 31 0.5 0.11 10.6 8.4 0.7 19.7
Subtotal 3.2 4.0 1.43 13 12 31 0.6 0.11 25.0 9.9 0.7 35.6
<100 1.7 1.1 1.47 17 12 29 0.6 0.24 2.5 0.4 - 2.8
100-200 4.7 1.3 1.47 16 12 29 0.5 0.23 5.2 3.3 0.2 8.7
Subtotal 4.0 1.2 1.47 17 12 29 0.6 0.23 7.7 3.7 0.2 11.5
<100 4.7 2.0 1.48 17 13 29 0.7 0.04 9.3 5.1 0.0 14.3
100-200 5.0 2.3 1.47 16 14 29 0.5 0.04 5.4 8.9 2.3 16.6
Subtotal 4.9 2.2 1.47 17 14 29 0.6 0.04 14.6 14.0 2.3 30.9
48.5 29.5 4.3 82.3
<100 1.2 1.0 1.50 20 14 28 2.1 0.10 - 1.4 0.2 1.6
100-200 3.4 1.0 1.50 20 14 28 2.2 0.11 - 4.5 0.5 5.0
Subtotal 2.9 1.0 1.50 20 14 28 2.2 0.11 - 5.9 0.6 6.6
<100 1.5 3.9 1.47 17 13 29 0.7 0.15 - 6.7 1.2 7.9
100-200 4.1 3.3 1.48 17 13 29 0.7 0.15 - 18.0 2.2 20.2
Subtotal 3.4 3.5 1.48 17 13 29 0.7 0.15 - 24.7 3.5 28.2
<100 0.7 1.9 1.46 15 10 30 0.5 0.17 - 1.6 0.2 1.8
100-200 3.7 2.2 1.45 15 10 30 0.5 0.18 - 11.1 0.7 11.8
Subtotal 3.3 2.2 1.45 15 10 30 0.5 0.18 - 12.7 0.9 13.6
- 43.4 4.9 48.3
48.5 72.8 9.3 130.6
48 73 9 130
Deposit Lease Seam / PlyDepth (2)
(m)
Coal
area
(km2)
Typical
seam
thickness
(m)
121
Typical
in situ
density (3) (g/cc)
Typical raw coal quality (4) Coal Resources (Mt) (5)
Pisces 1
(PI1B)
ML70171,
ML70429,
ML70430
&
ML70431
Roper Creek
(ROP1 or
ROP3)
Middlemount
(MMT1)
Tralee
(TRA2)
Foxleigh North and Eagle's Nest Sub-total (6)
Roper Creek Sub-total (6)
Model
Roper
Creek
MDL3028
&
EPC855
Foxleigh
North
Total (6) (depth <200 m)
Foxleigh
North &
Eagle's
Nest
Roper Creek
(ROP1 or
ROP3)
Middlemount
(MMT1)
Tralee
(TRA2)
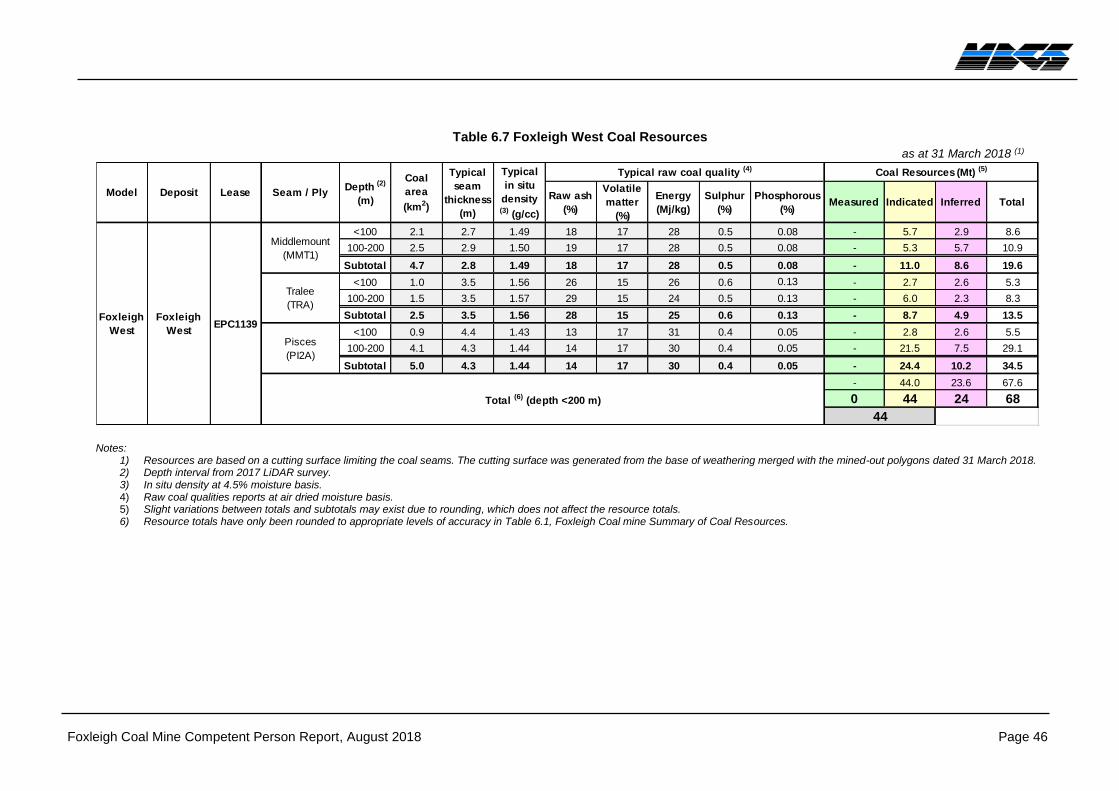
Foxleigh Coal Mine Competent Person Report, August 2018 Page 46
Table 6.7 Foxleigh West Coal Resources
as at 31 March 2018 (1)
Notes: 1) Resources are based on a cutting surface limiting the coal seams. The cutting surface was generated from the base of weathering merged with the mined-out polygons dated 31 March 2018. 2) Depth interval from 2017 LiDAR survey. 3) In situ density at 4.5% moisture basis. 4) Raw coal qualities reports at air dried moisture basis. 5) Slight variations between totals and subtotals may exist due to rounding, which does not affect the resource totals. 6) Resource totals have only been rounded to appropriate levels of accuracy in Table 6.1, Foxleigh Coal mine Summary of Coal Resources.
Raw ash
(%)
Volatile
matter
(%)
Energy
(Mj/kg)
Sulphur
(%)
Phosphorous
(%)Measured Indicated Inferred Total
<100 2.1 2.7 1.49 18 17 28 0.5 0.08 - 5.7 2.9 8.6
100-200 2.5 2.9 1.50 19 17 28 0.5 0.08 - 5.3 5.7 10.9
Subtotal 4.7 2.8 1.49 18 17 28 0.5 0.08 - 11.0 8.6 19.6
<100 1.0 3.5 1.56 26 15 26 0.6 0.13 - 2.7 2.6 5.3
100-200 1.5 3.5 1.57 29 15 24 0.5 0.13 - 6.0 2.3 8.3
Subtotal 2.5 3.5 1.56 28 15 25 0.6 0.13 - 8.7 4.9 13.5
<100 0.9 4.4 1.43 13 17 31 0.4 0.05 - 2.8 2.6 5.5
100-200 4.1 4.3 1.44 14 17 30 0.4 0.05 - 21.5 7.5 29.1
Subtotal 5.0 4.3 1.44 14 17 30 0.4 0.05 - 24.4 10.2 34.5
- 44.0 23.6 67.6
0 44 24 68
44
Coal Resources (Mt) (5)
Foxleigh
WestEPC1139
Middlemount
(MMT1)
Tralee
(TRA)
Pisces
(PI2A)
Deposit Lease Seam / PlyDepth (2)
(m)
Coal
area
(km2)
Model
Foxleigh
West
Total (6) (depth <200 m)
Typical
seam
thickness
(m)
Typical
in situ
density (3) (g/cc)
Typical raw coal quality (4)
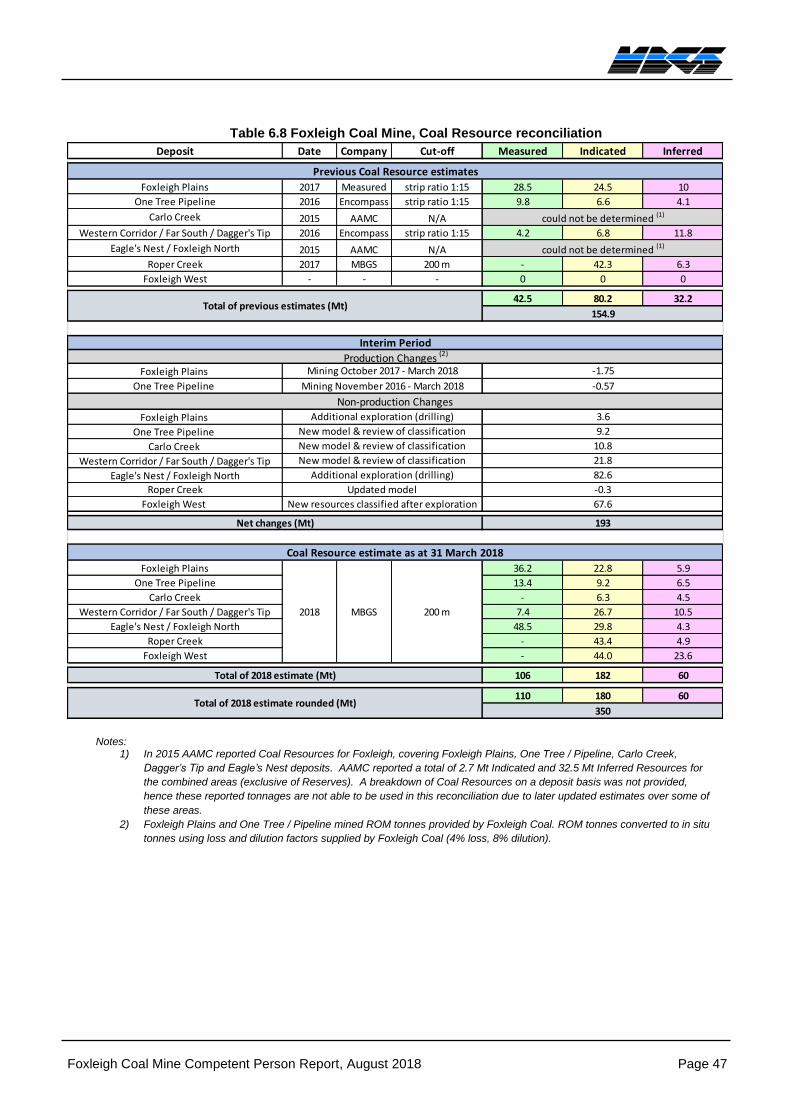
Foxleigh Coal Mine Competent Person Report, August 2018 Page 47
Table 6.8 Foxleigh Coal Mine, Coal Resource reconciliation
Notes: 1) In 2015 AAMC reported Coal Resources for Foxleigh, covering Foxleigh Plains, One Tree / Pipeline, Carlo Creek,
Dagger’s Tip and Eagle’s Nest deposits. AAMC reported a total of 2.7 Mt Indicated and 32.5 Mt Inferred Resources for
the combined areas (exclusive of Reserves). A breakdown of Coal Resources on a deposit basis was not provided,
hence these reported tonnages are not able to be used in this reconciliation due to later updated estimates over some of
these areas.
2) Foxleigh Plains and One Tree / Pipeline mined ROM tonnes provided by Foxleigh Coal. ROM tonnes converted to in situ
tonnes using loss and dilution factors supplied by Foxleigh Coal (4% loss, 8% dilution).
Deposit Date Company Cut-off Measured Indicated Inferred
Foxleigh Plains 2017 Measured strip ratio 1:15 28.5 24.5 10
One Tree Pipeline 2016 Encompass strip ratio 1:15 9.8 6.6 4.1
Carlo Creek 2015 AAMC N/A
Western Corridor / Far South / Dagger's Tip 2016 Encompass strip ratio 1:15 4.2 6.8 11.8
Eagle's Nest / Foxleigh North 2015 AAMC N/A
Roper Creek 2017 MBGS 200 m - 42.3 6.3
Foxleigh West - - - 0 0 0
42.5 80.2 32.2
Foxleigh Plains
One Tree Pipeline
Foxleigh Plains
One Tree Pipeline
Carlo Creek
Western Corridor / Far South / Dagger's Tip
Eagle's Nest / Foxleigh North
Roper Creek
Foxleigh West
Foxleigh Plains 36.2 22.8 5.9
One Tree Pipeline 13.4 9.2 6.5
Carlo Creek - 6.3 4.5
Western Corridor / Far South / Dagger's Tip 7.4 26.7 10.5
Eagle's Nest / Foxleigh North 48.5 29.8 4.3
Roper Creek - 43.4 4.9
Foxleigh West - 44.0 23.6
106 182 60
110 180 60
could not be determined (1)
could not be determined (1)
Net changes (Mt) 193
Interim Period
Production Changes (2)
Non-production Changes
10.8New model & review of classification
3.6Additional exploration (drilling)
New model & review of classification 9.2
New model & review of classification
Previous Coal Resource estimates
154.9Total of previous estimates (Mt)
Total of 2018 estimate (Mt)
Total of 2018 estimate rounded (Mt)
Coal Resource estimate as at 31 March 2018
2018 MBGS 200 m
350
-1.75
-0.57
67.6
-0.3
82.6
Mining October 2017 - March 2018
Mining November 2016 - March 2018
New resources classified after exploration
Additional exploration (drilling)
Updated model
21.8
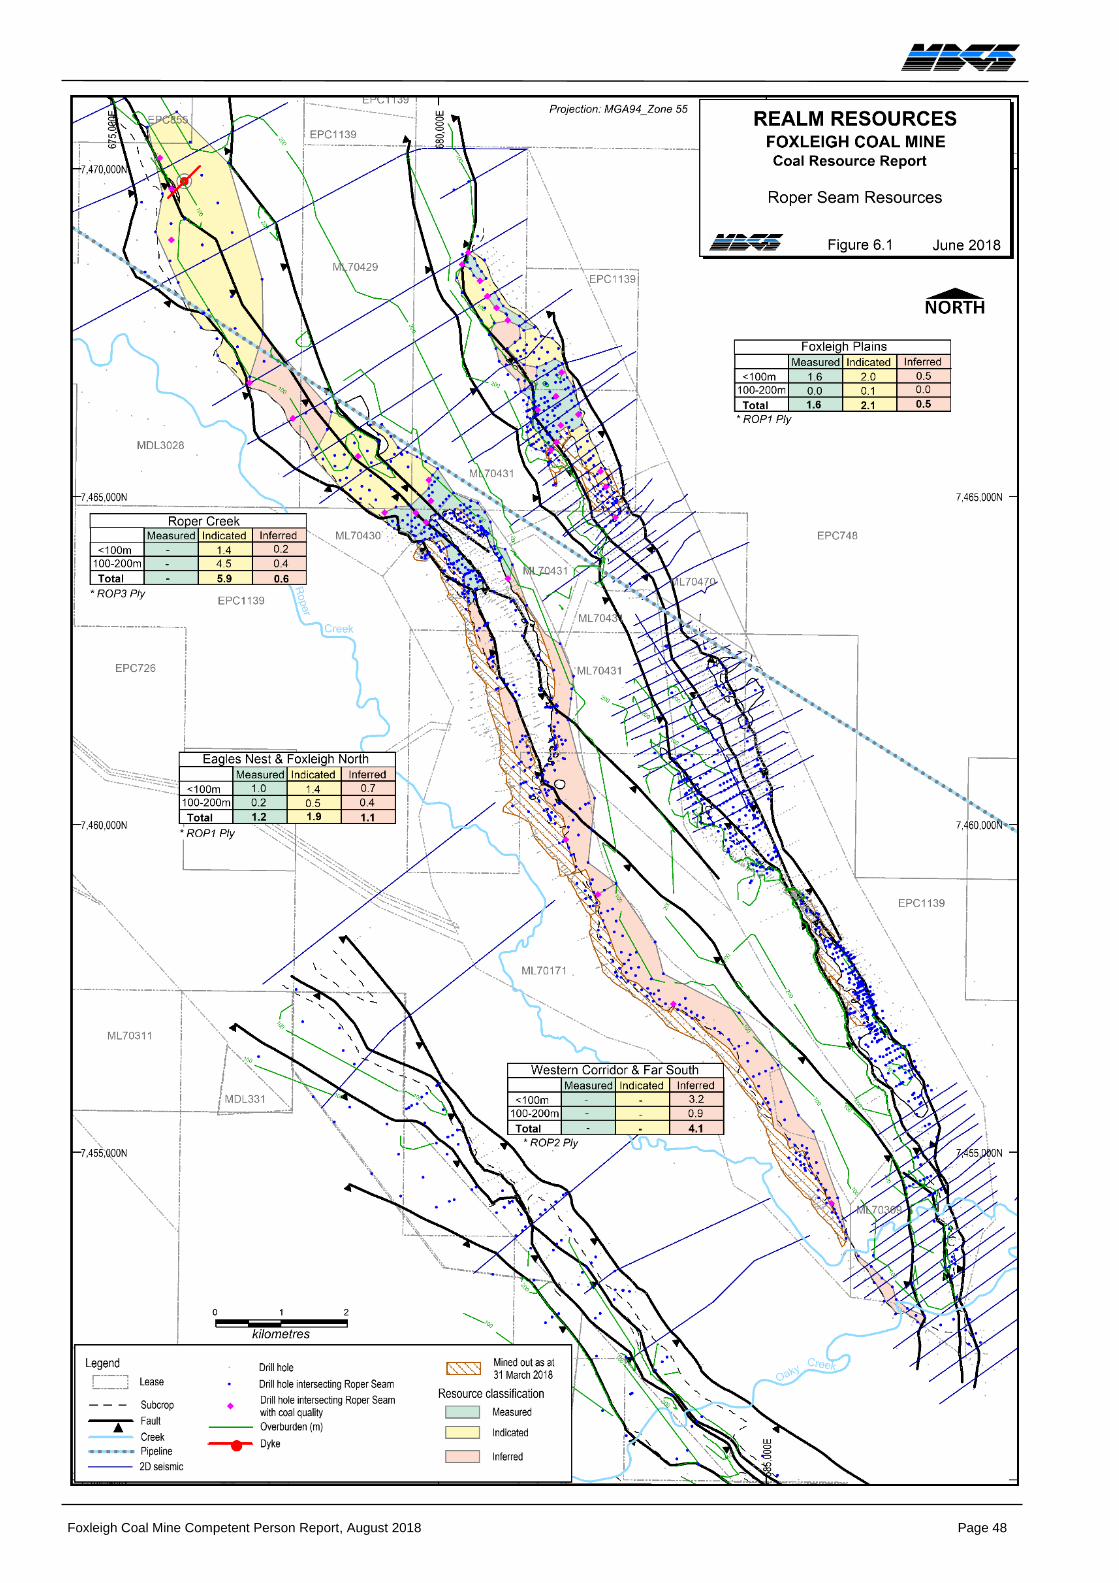
Foxleigh Coal Mine Competent Person Report, August 2018 Page 48
Figure 6.1 Coal Resources, Roper Seam
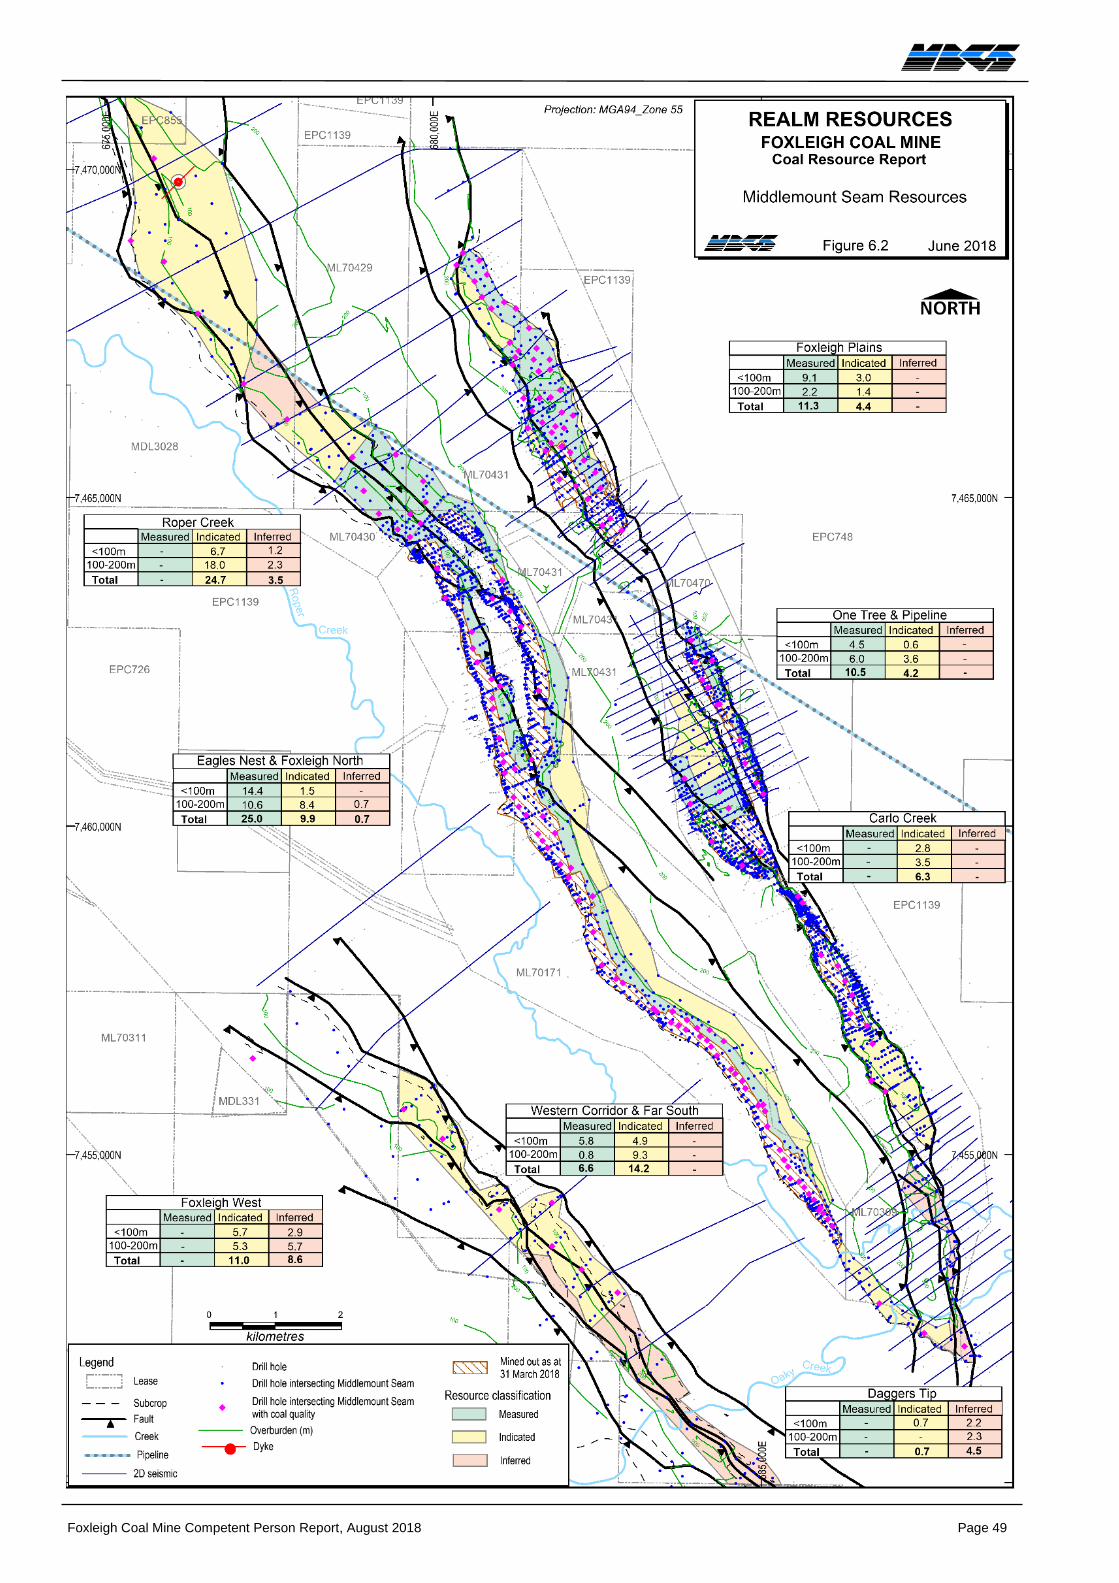
Foxleigh Coal Mine Competent Person Report, August 2018 Page 49
Figure 6.2 Coal Resources, Middlemount Seam
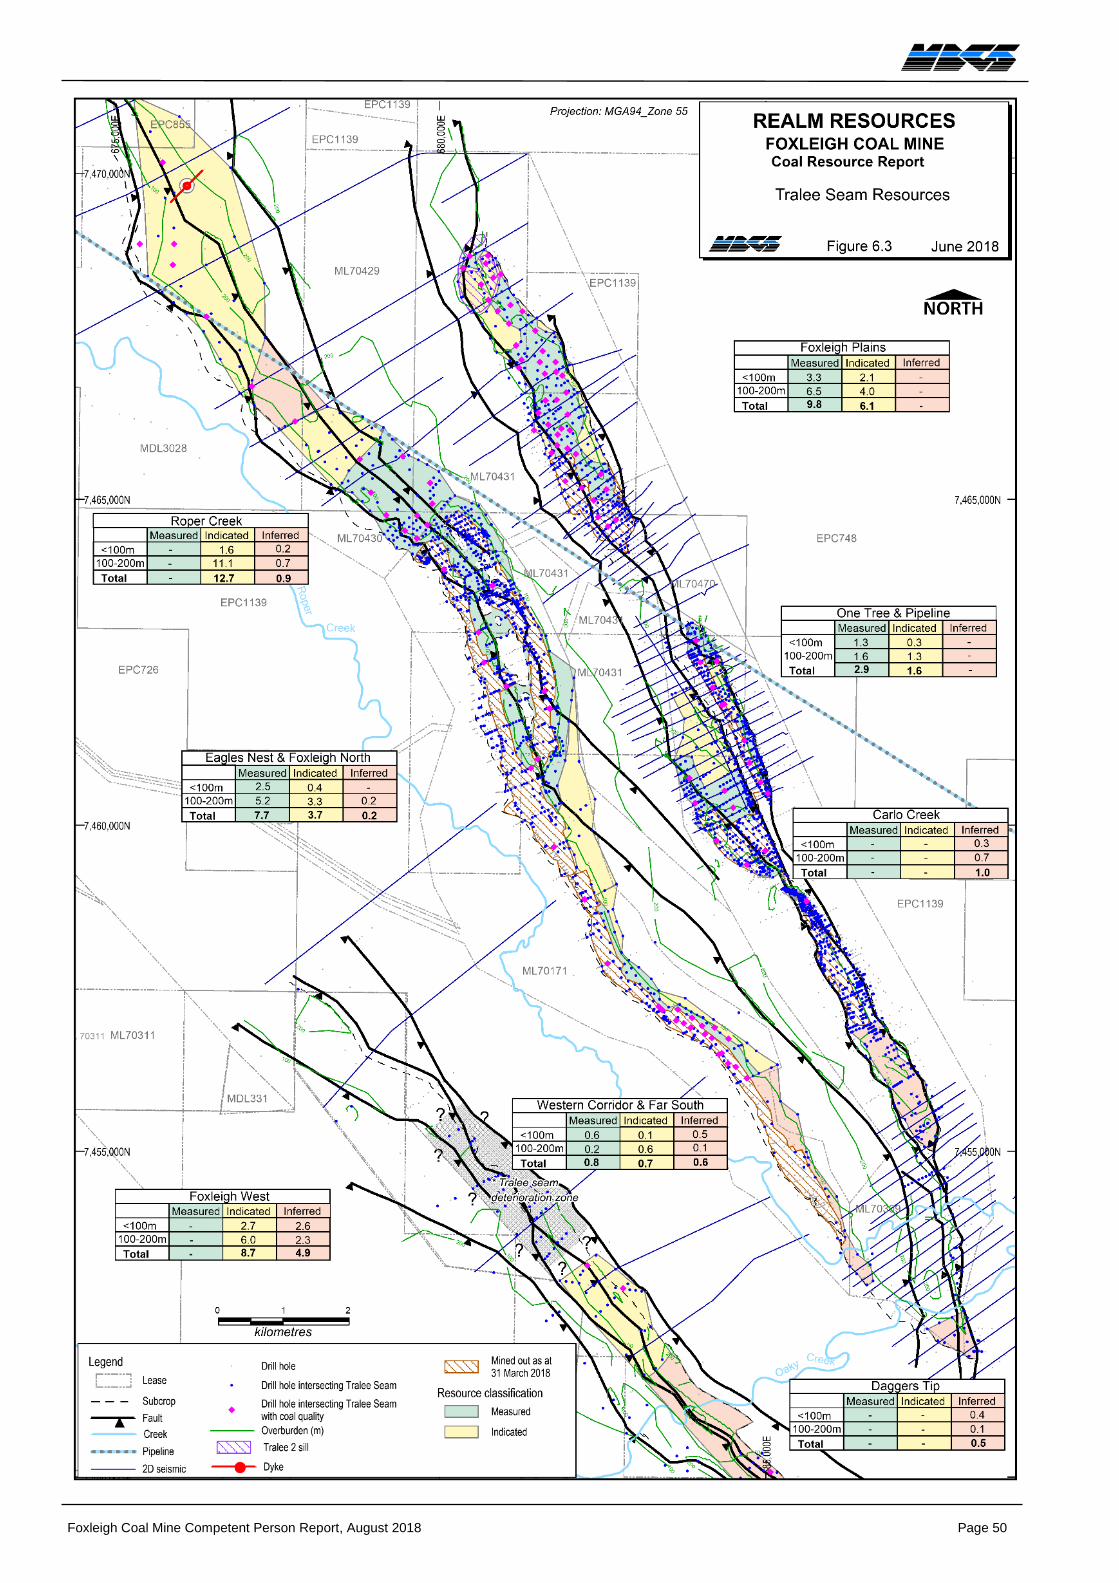
Foxleigh Coal Mine Competent Person Report, August 2018 Page 50
Figure 6.3 Coal Resources, Tralee Seam
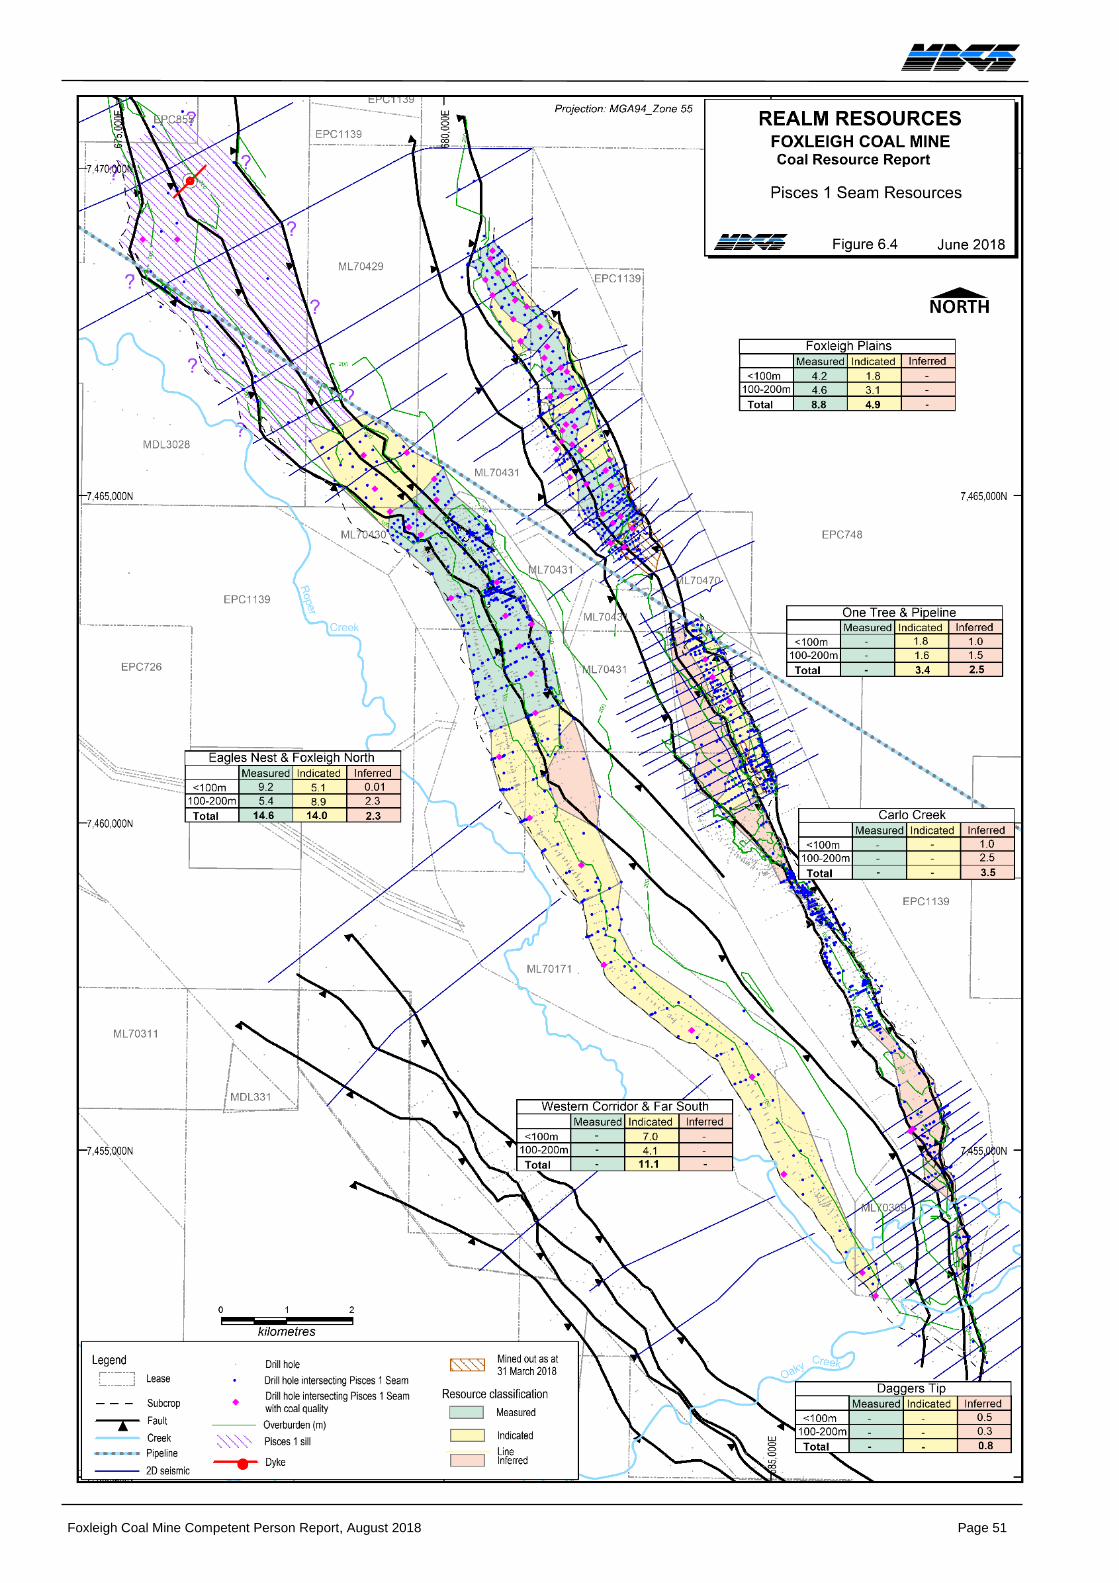
Foxleigh Coal Mine Competent Person Report, August 2018 Page 51
Figure 6.4 Coal Resources, Pisces 1 Seam
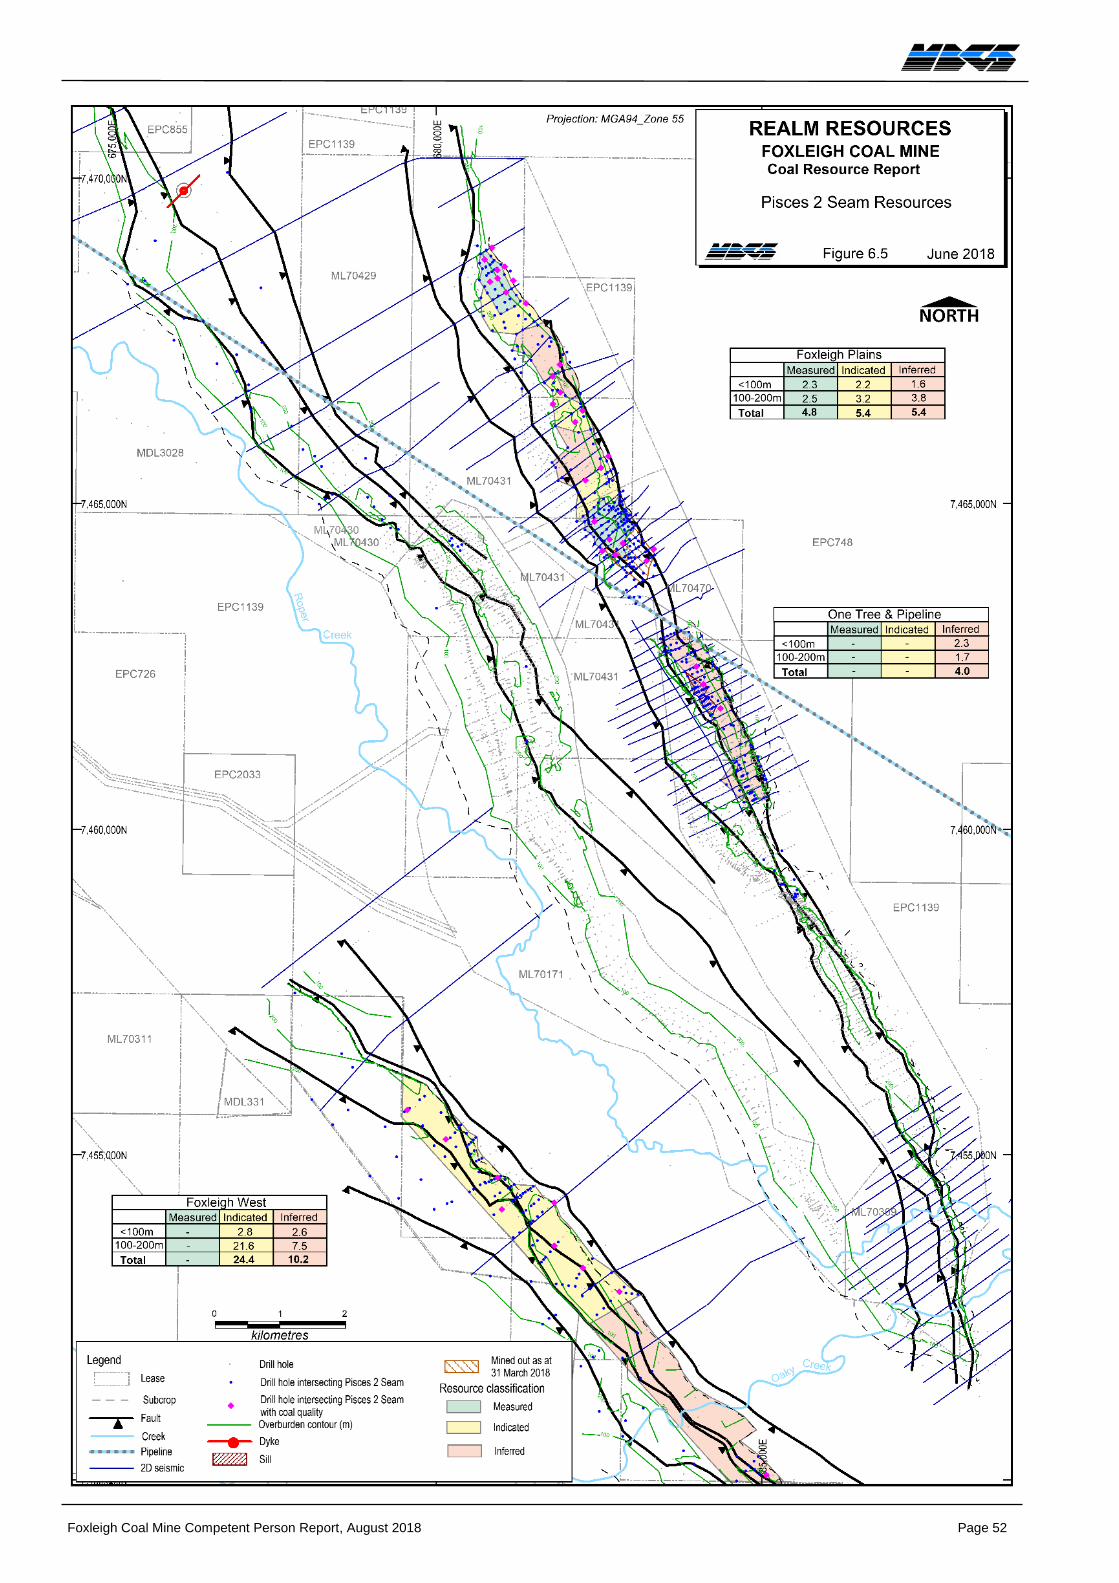
Foxleigh Coal Mine Competent Person Report, August 2018 Page 52
Figure 6.5 Coal Resources, Pisces 2 Seam
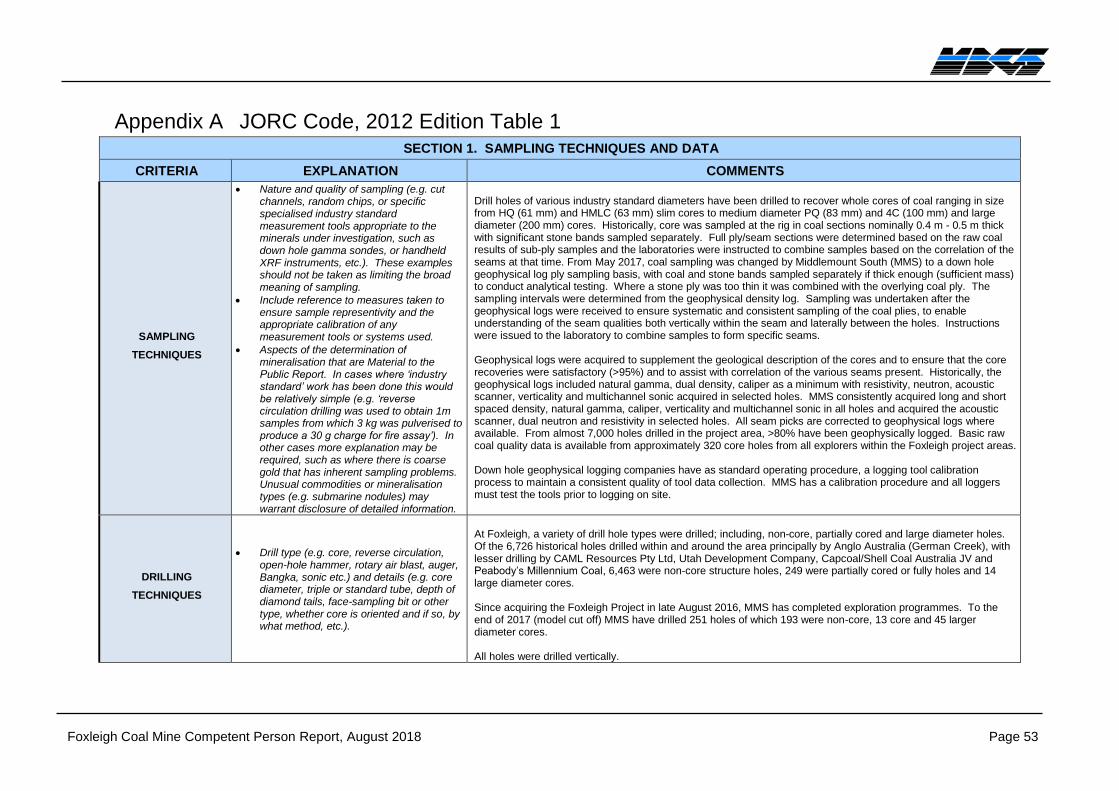
Foxleigh Coal Mine Competent Person Report, August 2018 Page 53
Appendix A JORC Code, 2012 Edition Table 1 SECTION 1. SAMPLING TECHNIQUES AND DATA
CRITERIA EXPLANATION COMMENTS
SAMPLING
TECHNIQUES
• Nature and quality of sampling (e.g. cut channels, random chips, or specific specialised industry standard measurement tools appropriate to the minerals under investigation, such as down hole gamma sondes, or handheld XRF instruments, etc.). These examples should not be taken as limiting the broad meaning of sampling.
• Include reference to measures taken to ensure sample representivity and the appropriate calibration of any measurement tools or systems used.
• Aspects of the determination of mineralisation that are Material to the Public Report. In cases where ‘industry standard’ work has been done this would be relatively simple (e.g. ‘reverse circulation drilling was used to obtain 1m samples from which 3 kg was pulverised to produce a 30 g charge for fire assay’). In other cases more explanation may be required, such as where there is coarse gold that has inherent sampling problems. Unusual commodities or mineralisation types (e.g. submarine nodules) may warrant disclosure of detailed information.
Drill holes of various industry standard diameters have been drilled to recover whole cores of coal ranging in size from HQ (61 mm) and HMLC (63 mm) slim cores to medium diameter PQ (83 mm) and 4C (100 mm) and large diameter (200 mm) cores. Historically, core was sampled at the rig in coal sections nominally 0.4 m - 0.5 m thick with significant stone bands sampled separately. Full ply/seam sections were determined based on the raw coal results of sub-ply samples and the laboratories were instructed to combine samples based on the correlation of the seams at that time. From May 2017, coal sampling was changed by Middlemount South (MMS) to a down hole geophysical log ply sampling basis, with coal and stone bands sampled separately if thick enough (sufficient mass) to conduct analytical testing. Where a stone ply was too thin it was combined with the overlying coal ply. The sampling intervals were determined from the geophysical density log. Sampling was undertaken after the geophysical logs were received to ensure systematic and consistent sampling of the coal plies, to enable understanding of the seam qualities both vertically within the seam and laterally between the holes. Instructions were issued to the laboratory to combine samples to form specific seams. Geophysical logs were acquired to supplement the geological description of the cores and to ensure that the core recoveries were satisfactory (>95%) and to assist with correlation of the various seams present. Historically, the geophysical logs included natural gamma, dual density, caliper as a minimum with resistivity, neutron, acoustic scanner, verticality and multichannel sonic acquired in selected holes. MMS consistently acquired long and short spaced density, natural gamma, caliper, verticality and multichannel sonic in all holes and acquired the acoustic scanner, dual neutron and resistivity in selected holes. All seam picks are corrected to geophysical logs where available. From almost 7,000 holes drilled in the project area, >80% have been geophysically logged. Basic raw coal quality data is available from approximately 320 core holes from all explorers within the Foxleigh project areas. Down hole geophysical logging companies have as standard operating procedure, a logging tool calibration process to maintain a consistent quality of tool data collection. MMS has a calibration procedure and all loggers must test the tools prior to logging on site.
DRILLING
TECHNIQUES
• Drill type (e.g. core, reverse circulation, open-hole hammer, rotary air blast, auger, Bangka, sonic etc.) and details (e.g. core diameter, triple or standard tube, depth of diamond tails, face-sampling bit or other type, whether core is oriented and if so, by what method, etc.).
At Foxleigh, a variety of drill hole types were drilled; including, non-core, partially cored and large diameter holes. Of the 6,726 historical holes drilled within and around the area principally by Anglo Australia (German Creek), with lesser drilling by CAML Resources Pty Ltd, Utah Development Company, Capcoal/Shell Coal Australia JV and Peabody’s Millennium Coal, 6,463 were non-core structure holes, 249 were partially cored or fully holes and 14 large diameter cores. Since acquiring the Foxleigh Project in late August 2016, MMS has completed exploration programmes. To the end of 2017 (model cut off) MMS have drilled 251 holes of which 193 were non-core, 13 core and 45 larger diameter cores. All holes were drilled vertically.
Foxleigh Coal Mine Competent Person Report, August 2018 Page 54
DRILL
SAMPLE
RECOVERY
• Method of recording and assessing core and chip sample recoveries and results assessed.
• Measures taken to maximise sample recovery and ensure representative nature of the samples.
• Whether a relationship exists between sample recovery and coal quality and whether sample bias may have occurred due to preferential loss/gain of fine/coarse material.
A detailed review of the historical and MMS core data and recoveries on a seam by seam basis has not been undertaken. The coal quality data were accepted on the basis that if the analysed sampled intervals matched or overlapped the seam intervals, with at least 90% overlap at each intersection, it was utilised in the model. Core recovery for drill holes at Foxleigh are generally satisfactory (>95 %), except in drill holes affected by faulting. All core was described lithologically and the coal seam roof and floor depths were reconciled to geophysical density logs and core loss allocated accordingly. Where core recovery was unsatisfactory, a re-drill was undertaken. No sample bias was generated by the method of sampling applied at Foxleigh. Historical sampling was undertaken at the drill site by the geologist. MMS geologists loaded the coal core samples into core boxes for storage at the core shed, where the core was later sampled as soon as possible after the geophysical logs were acquired. It is not possible to comment on how soon the coal cores were despatched to the laboratory or the preservation methods of historical cores. MMS double bagged coal cores to minimise moisture loss which could generate unreliable analytical results for estimation of grade and resources. Coal cores were couriered to the laboratory for testing as soon as possible to limit the effects of oxidation.
LOGGING
• Whether core and chip samples have been geologically and geotechnically logged to a level of detail to support appropriate Coal Resource estimation, mining studies and metallurgical studies.
• Whether logging is qualitative or quantitative in nature. Core (or costean, channel, etc.) photography.
• The total length and percentage of the relevant intersections logged.
Lithological descriptions of all drill cuttings and core for each hole have been recorded either on hand written sheets or encoding sheets. These hand-written logs were later encoded and loaded into a computer geological database. Historical drill holes contain a range of qualitative data from brief hand-written lithological logs of non-core holes to detailed lithological logs of core intervals. The recent exploration by Anglo (2007-2016) and MMS (2016-present), ensured the holes were logged with sufficient detail for the respective sample drill type; i.e. core sections were logged to centimetric accuracy; while non-core holes were described in lesser detail, based on 1 m chip samples. Recently, Anglo and MMS adopted the CoalLog V2.0 dictionaries (released 2014) to conform to a standard recording methodology and all field logs have been recorded on hand written geological encoding sheets. Logging of core samples is detailed and qualitative. Included in the logging is a record of the recovered core length, the drilled core length, lithology type and lithology descriptions. Lithology descriptions describe the sample in terms of colour, grainsize, bedding and bedding spacing, bedding dip, mechanical state, weathering, bedding relationship, structure, dip of structures, mineral forms and their associations, primary bedding forms, sedimentary contacts, defects and spacing. Information recorded is adequate to describe the various lithologies and coal samples to support the coal resource estimation from a geological, geotechnical and coal quality consideration. Cores were photographed. Base of weathering was estimated from visual descriptive lithological logging and determined where available in LOX holes by chemical testing.
SUB-SAMPLING
TECHNIQUES
AND SAMPLE
PREPARATION
• If core, whether cut or sawn and whether quarter, half or all core taken.
• If non-core whether riffled, tube sampled, rotary split, etc. and whether sampled wet or dry.
• For all sample types, the nature, quality and appropriateness of the sample preparation technique.
• Quality control procedures adopted for all sub-sampling stages to maximise representivity of samples.
• Measures taken to ensure that the sampling is representative of the in situ material collected, including for instance
All coal core and parting samples were despatched for analysis. Whole cylindrical coal core sections were sampled individually into bags and labelled. LOX chip samples have been analysed to determine the base of weathering and the oxidised coal zone. Core sampling by MMS has been undertaken in conjunction with the geophysical logs to ensure the ply sampling intervals are consistent from hole to hole for comparison of the coal properties of the coal seams. Prior to MMS, historical sampling was not ply based. The core was sampled into coal and non-coal (minimum core length of 5 cm) sections where possible. Sampling used a nominal maximum thickness and numerous samples were taken for each seam. The testing laboratory was issued with instructions to combine samples to form ply/seam sections for detailed testing based on the results of the initial raw testing of the plies. The coal core was not split as the whole seam core was sampled for analysis.
Foxleigh Coal Mine Competent Person Report, August 2018 Page 55
results for field duplicate/second-half sampling.
• Whether sample sizes are appropriate to the grain size of the material being sampled.
Sub-sampling of the sampled core is part of the treatment procedure at the laboratory where a portion of the sample is reserved for sample analysis checks and or additional testing. Historically HQ (61 mm diameter), HMLC (63 mm), PQ (83 mm), 4C (100 mm) and 8C (200 mm) core diameters were acquired, which provided sufficient sample mass for the suite of coal quality testing analysis conducted. MMS recovered PQ size (83 mm) diameter cores, which provides the necessary sample to complete the standard analytical testing programme. All cores are industry standard diameters suitable for the analysis of coal core and washability studies respectively and are appropriate sizes for the typical analysis of Foxleigh coal.
QUALITY OF
ASSAY DATA
AND
LABORATORY
TESTS
• The nature, quality and appropriateness of the assaying and laboratory procedures used and whether the technique is considered partial or total.
• For geophysical tools, spectrometers, handheld XRF instruments, etc., the parameters used in determining the analysis including instrument make and model, reading times, calibrations factors applied and their derivation, etc.
• Nature of quality control procedures adopted (e.g. standards, blanks, duplicates, external laboratory checks) and whether acceptable levels of accuracy (i.e. lack of bias) and precision have been established).
The types of testing undertaken historically and by MMS are industry standard tests used internationally as part of the analysis and assessment of black coal deposits and conform to the Australian Standard. Historically, coal quality testing programmes have varied with the explorer, although the fundamental tests conducted were often similar. The control procedures are primarily with the NATA accredited laboratories, which undertake the testing to Australian Standard testing procedures. The testing programme procedures have sufficient reserve sampling in-built in the programme to allow for checks of the analytical testing to be undertaken as required if the result is anomalous. External testing will be undertaken when required. Different laboratories have undertaken the analytical testing over the history of the exploration in the area. No obvious laboratory specific anomalies have been identified.
VERIFICATION
OF SAMPLING
AND ASSAYING
• The verification of significant intersections by either independent or alternative company personnel.
• The use of twinned holes.
• Documentation of primary data, data entry procedures, data verification, data storage (physical and electronic) protocols.
• Discuss any adjustment to assay data.
All historical and MMS coal analytical testing has been conducted by NATA accredited laboratories. All primary coal quality analyses have been compiled in spreadsheet by the testing laboratory with reference to sample numbers and supplied to the client. Historically data was stored in an acQuire database, since MMS ownership a database was developed in GDB using exports of the acQuire database as well as loading in of new data. Both acQuire and GDB have validation processes for the data. Hardcopy data is stored at Foxleigh Mine site. Drill hole data exported from previous Minescape models or the GDB database was used to generate the Minex geological database/models. Foxleigh coal deposits are stratiform and relatively homogenous, although complexly faulted locally. Seam intervals include both geophysical logged non-core holes (structure data points) and geophysically logged cored holes with valid coal analyses (quality data points). Significant values either geophysical (coal structure thickness) and or coal quality were checked before generation of recent Minex computer models and retained if valid or excluded if incorrect or causing incorrect extrapolation in the model. The correlation and naming of the seams has been established by historical explorers. Checks of the seam correlation was conducted by MBGS with some correlation changes determined and updated in the models. No twinned holes have been drilled to date at Foxleigh (twinned holes are not standard practice for the coal industry). Relative density values were adjusted to an in situ moisture value of 4.5% generating an in situ density that was used to convert the coal volumes to tonnages for resource estimation. Other raw coal quality variables were loaded at an air-dried moisture basis into the Minex database/model (no moisture adjustment was applied).
Foxleigh Coal Mine Competent Person Report, August 2018 Page 56
LOCATION
OF DATA
POINTS
• Accuracy and quality of surveys used to locate drill holes (collar and down-hole surveys), trenches, mine workings and other locations used in Coal Resource estimation.
• Specification of the grid system used.
• Quality and adequacy of topographic control.
Historical drill hole collars were surveyed originally to either AGD66 or AGD84 and have been converted to MGA94. All MMS drill holes were surveyed to MGA94 datum, Zone 55. Elevations use a reduced level (RL) based on the Australian Height Datum (AHD). Survey collars of historical holes are poorly documented; however, the land surface is relatively flat with no apparent collar RL discrepancies. All holes since 2003 have been surveyed using GPS by a licenced surveyor or the mine surveyor. The last full site LiDAR survey was undertaken 30 August 2016, which covered Foxleigh MLs and much of the EPC areas. This was followed up with a partial survey in September 2017 that covers all the resource areas reported in 2018, except for a very small area along the southern edge of Foxleigh West. The LiDAR survey, with an accuracy of +/- 0.1 - 0.2 m, was used to construct a topographic DTM surface in Minex. Due to mining there may be discrepancies between drill hole collars and the LiDAR surface. The topographic surface is of reasonable quality across the Foxleigh Project and satisfactory for construction of a detailed geological model suitable for resource estimation and detailed mine planning.
DATA
SPACING
AND
DISTRIBUTION
• Data spacing for reporting of Exploration Results.
• Whether the data spacing and distribution is sufficient to establish the degree of geological and coal quality continuity appropriate for the Coal Resource and Coal Reserve estimation procedure(s) and classification applied.
• Whether sample compositing has been applied.
The eastern limb of the Foxleigh Syncline (Foxleigh Plains, One Tree, Pipeline, Carlo Creek and eastern domain of Dagger’s Tip)) is structurally more complex than the western areas (Roper Creek, Eagle’s Nest, Foxleigh North, Western Corridor, Far South, western domain of Dagger’s Tip and Foxleigh West), and hence the spacing of data is more closely spaced in the east compared to the west. Drilling has been conducted mostly on northeast trending drill lines spaced from 70 - 500 m apart along the strike of the Foxleigh Project deposits. Typical drill hole spacing along the drill lines ranges from 25 - 250 m depending on structural complexity, although along the seam subcrop areas drill holes tend to be more closely drilled. Drill spacing tends to increase to 250 - >500 m in down-dip areas the southern area of Foxleigh West and the Roper Creek deposit. Most holes have been drilled to the Tralee 2 Seam, with reasonable coverage but lesser to the Pisces 1 Seam. Drill hole intersections to the Pisces 2 Seam are largely limited to Foxleigh Plains and Foxleigh West. Approximately 70 2D seismic surveys have been acquired across the Foxleigh mine areas in a southwest to northeast orientation. Spacing of the 2D seismic lines varies from approximately 200 m spacing in the Foxleigh mine areas of Foxleigh Plains, One Tree, Pipeline, south of Carlo Creek and Dagger’s Tip on the eastern side of the Foxleigh Fault Zone. Seismic line spacing ranges 500 - 2000 m in the north of Foxleigh Plains and at Roper Creek and 1,000 – 4,000 m at Foxleigh West. Seismic data is almost absent from Eagle’s Nest, Foxleigh North, Western Corridor, and Far South. The data spacing is sufficient to establish confidence appropriate for the classification applied by the Competent Person. Only vertical coal sample compositing within a single hole has been undertaken to represent a ply or seam section. No samples have been composited together from several holes or over several sites to form a single composite sample.
ORIENTATION
OF DATA IN
RELATION
TO GEOLOGICAL
• Whether the orientation of sampling achieves unbiased sampling of possible structures and the extent to which this is known, considering the deposit type.
• If the relationship between the drilling orientation and the orientation of key
The orientation of the drill lines and the 2D seismic lines is approximately perpendicular to the regional structural features in the project area (Jellinbah and Foxleigh Thrust Fault zones). This has enabled a good assessment/interpretation of several major thrust structures that are present along the strike of the deposit. All structure and stratigraphic drilling has been undertaken using vertical holes. Many drill holes have been logged with a verticality tool to measure drill hole trajectory. Thickened sections of seams have been intersected in drill
Foxleigh Coal Mine Competent Person Report, August 2018 Page 57
STRUCTURE mineralised structures is considered to have introduced a sampling bias, this should be assessed and reported if material.
holes due to very steep strata dips or fault repeated sections. These could locally affect the thickness of modelled seams. This drilling method will not bias the coal quality sampling as core samples require a complete cylindrical section of the coal intervals in the drill hole.
SAMPLE/DATA
SECURITY • The measures taken to ensure sample
security
Recent core and drill cuttings have been geologically described by an MMS project geologist. The core samples are double-bagged, and a sample ID tag included and referenced to that bag by a geologist trained in the procedures to undertake this role. The reference tag is recorded by the sampling geologist and the tag numbers loaded into the GDB database to track the “chain of custody” of the sample. The tag is also used to identify the analytical testing requirements of the individual sample. The complete measures taken to ensure sample security of cored intervals in historical holes is unknown. It is understood that the core was sampled at the drill site and moved to an onsite storage area, before transportation to the laboratory.
AUDITS OR REVIEWS • The results of any audits or reviews of sampling techniques and data.
In May 2017, the MBGS Competent Person, Rowan Johnson, undertook a site visit to check the field drilling operations, acquisition methodology of the geological information, the geophysical logging and the coal sampling routines and strategies to ensure they were conducted competently and consistently to an acceptable standard. MBGS modified the sampling methodology and refined the geophysical log output template at the time of the site visit. A summary of the findings and recommendations were provided to MMS. Overall the acquisition of the geological and geophysical data used sound, acceptable industry standard practices.
SECTION 2. REPORTING OF EXPLORATION RESULTS
CRITERIA JORC CODE 2012 EXPLANATION COMMENTS
MINERAL
TENEMENT
AND LAND
TENURE STATUS
• Type, reference name/number, location and ownership including agreements or material issues with third parties such as joint ventures, partnerships, overriding royalties, native title interests, historical sites, wilderness or national park and environmental settings.
• The security of the tenure held at the time of reporting along with any known impediments to obtaining a licence to operate in the area.
Foxleigh Project tenements are all held by Foxleigh Coal Pty Ltd, a wholly owned subsidiary of Middlemount South (MMS), of which MMS is 100% owned by Realm Resources Ltd. In late August 2016, MMS purchased the rights to Foxleigh from Anglo American Metallurgical Coal Assets Pty Ltd (AAMC). MMS currently manages the tenure. Lease Expiry date Ownership All Foxleigh ML’s 30 November 2034 70% Foxleigh Coal Pty Ltd, 20% POSCO Australia Pty Ltd, 10% Nippon Steel and Sumitomo Metal Australia Pty Ltd MDL3028 31 July 2023 100% ownership by Foxleigh Coal Pty Ltd EPC855 19 October 2017 100% ownership by Foxleigh Coal Pty Ltd EPC1139 6 August 2022 70% Foxleigh Coal Pty Ltd, 20% POSCO Australia Pty Ltd, 10% Nippon Steel and Sumitomo Metal Australia Pty Ltd EPC1669 was recently superseded by the grant of MDL3028 in July 2018. Restricted Area 384 (urban) extends into two of the northern sub-blocks CLER 2505 “g and h”, which are within EPC855. Areas of Strategic Cropping Land are present within Foxleigh Project area, mostly within the southern part of
Foxleigh Coal Mine Competent Person Report, August 2018 Page 58
EPC1139 and a small portion of ML70309. No State Forests or Conservation Reserve areas lie within the current project area. Portions of Endangered Regional Ecosystems (ERE’s) lie within the Foxleigh Project tenements, particularly along the creeks and rivers that traverse the area. The south western blocks of EPC1139 are overlain by adjacent leases MDL170 and ML70336 (Lake Lindsay/Oak Park) owned by AAMC. The Lake Lindsay ML and MDL take precedence over EPC1139 where they overlap. No resources have been estimated for the areas where the overlap occurs. BMA’s water pipeline crosses Foxleigh’s tenements. The pipeline predates the leases at Foxleigh.
EXPLORATION
DONE BY
OTHER PARTIES
• Acknowledgement and appraisal of exploration by other parties.
Utah Development Company Pty Ltd (UDC)under Authority to Prospect (ATP) 6C commenced exploration in the Middlemount area in the mid-1960s. UDC considered the area too structurally complex with folding, faulting and acidic intrusions negatively impacting Coal Resources and relinquished this part of ATP6C in 1966. There was little exploration in the area until Capricorn Coal Management Pty Ltd (Capcoal) acquired several tenements, (ATP3i5, ATP414 and ATP470. In the late 1980s exploration drilling programmes were undertaken (approximately 45 holes, largely non-core drilling with some core holes were drilled) and a preliminary mining feasibility study at Foxleigh South was undertaken. CAML Resources Pty Ltd (CAML) completed exploration drilling in the late 1990s, drilling approximately 200 holes (again largely non-core but included slim core, large diameter and geotechnical holes). CAML completed Feasibility Studies and commenced mining in February 2000. AAMC purchased 70% of the project from CAML in 2007 and undertook the large majority of exploration at Foxleigh during their ownership from 2007 - 2016. The programme of work included exploration programmes consisting of >6,000 non-core holes and approximately 200 core holes. AAMC also carried out seismic investigations across the area with approximately 160 km of 2D seismic along approximately 70 lines over the mining/resource areas and a Heli-mag survey in 2008. The seismic sections were valuable in identifying major structural features as well as many lesser faults present and in providing confidence in the continuity of coal seams through areas where there is a paucity of drill hole intersections.
GEOLOGY
• Deposit type, geological setting and style of mineralisation.
Foxleigh is located on the eastern flank of the Comet Ridge, a major structural feature of the southern Bowen Basin, and west of the structurally complex Dawson Tectonic Zone. Locally, Foxleigh lies to the east of the major structural feature, the Jellinbah Fault Zone, straddling the Foxleigh Syncline and the Foxleigh Fault Zone. These fault zones comprise numerous east over west thrust structures striking north-northwest with considerable cumulative vertical displacements, in excess of 400 m, with individual faults reaching up to 200 m. Associated with these major structures are smaller scale thrust faults (20 m – 100 m), which have up-thrown coal-bearing strata on their eastern side. Several of these smaller faults pass through Foxleigh mine areas and because of the up-thrusting, most of the coal within the area occurs at depths less than 200 m. Two Late Permian bituminous coal-bearing formations are present within the area; the Rangal Coal Measures and the underlying Burngrove Formation. Overlying the Rangal Coal Measures are the Triassic Rewan Group sediments, which do not contain any coal occurrences and consist predominantly of siltstones and sandstones. Sequences of Tertiary clays, sands and gravels increase in thickness from several metres up to 80 m, with the thickest Tertiary sediments occurring in the Roper Creek area. The Permian base of weathering ranges from <5 m - 90 m from surface. Deeper weathering profiles are usually associated with thick Tertiary sediments. Thickness of Permian weathering below the Tertiary is likely 10- 15 m. The Rangal Coal Measures contain the primary coal targets in the Foxleigh area – the five coal seams, in descending stratigraphic order, are Roper, Middlemount, Tralee Pisces1 and Pisces 2. Down hole geophysical
Foxleigh Coal Mine Competent Person Report, August 2018 Page 59
density logs confirm the consistency and continuity throughout the area of the main coal plies within these seams. Mine production since 2000 combined with coal quality results throughout the unmined areas confirms that these seams can produce low volatile PCI coals. The underlying Burngrove Formation typically contains highly banded coal seams that have high raw ash and low product yields. Nevertheless, some thin bands within these seams tend to display some coking/plastic properties (high CSN and fluidity) when washed, and therefore attract some interest within the industry. Despite the widespread occurrence of Burngrove coals throughout the southern Bowen Basin, and the active exploration of numerous deposits throughout the area that has included trial mining at some existing operations, there has been no successful economic exploitation of these coals. The seams subcrop along strike to the north-northwest with structural dips often ranging from 5° - 15°, although they can steepen significantly adjacent to the thrust faults and associated with fold structures.
DRILL HOLE
INFORMATION
• A summary of all information material to the understanding of the exploration results including a tabulation of the following information for all Material drill holes: o easting and northing of the drill hole
collar o elevation or RL (Reduced Level-
elevation above sea level in metres) of the drill hole collar
o dip and azimuth of the hole o down hole length and interception
depth o hole length.
• If the exclusion of this information is justified on the basis that the information is not Material and this exclusion does not detract from the understanding of the report, the Competent Person should clearly explain why this is the case.
Approximately 7,000 holes have been drilled at Foxleigh, approximately 5,800 have been used to generate the geological models used for resource estimation (>1,000 holes don’t have available down hole geophysical log data and were not included in models). Drill holes have all been drilled vertically. Detailed drill hole information has not been tabulated as the exclusion of this data does not detract from the understanding of the resource. Several hundred drill holes are now within mined out areas. Mined areas support the geological understanding of the area and the interpretation/models of the deposit. Where considered material to Coal Resources, these modelled data are shown on figures within the body of this report. The resource figures present the modelled drill hole locations, including drill holes intersecting reported seams and coal quality holes for the reported seams and justify why the Competent Person has defined the resource category areas. Coal Resource plots in the report show spatially the information pertinent to that seam. Drill hole data that pertains to coal seams has been loaded and modelled in the five geological computer models used to estimate Coal Resources in the various deposits. The coal resource table presented in this report contains a summary of thickness and grade information (average thickness, raw ash, in situ density, volatile matter, total sulphur and phosphorus) relating to each reported seam in each modelled area.
DATA
AGGREGATION
METHODS
• In reporting Exploration Results, weighting averaging techniques, maximum and/or minimum grade truncations (e.g. cutting of high grades) and cut-off grades are usually Material and should be stated.
• Where aggregate intercepts incorporate short lengths of high grade results and longer lengths of low grade results, the procedure used for such aggregation should be stated and some typical examples of such aggregations should be shown in detail.
• The assumptions used for any reporting of metal equivalent values should be clearly stated.
The seams have been modelled as individual coal layers, which can be correlated throughout the tenements. Available laboratory data from the GDB database was loaded into the Minex database and no data was excluded (except for sampling/recovery/verification issues). No quality limits were applied to the modelling or resource estimation process. Compositing of individual sub-ply qualities was undertaken in Minex software for the full ply/seam sections and a length/density weighting method used. These composited qualities were modelled and used for resource reporting. There are no metal equivalents used to report the Coal Resources. This is not a standard reporting requirement for coal.
Foxleigh Coal Mine Competent Person Report, August 2018 Page 60
RELATIONSHIP
BETWEEN
MINERALISATION
WIDTHS AND
INTERCEPT
LENGTHS
• These relationships are particularly important in the reporting of Exploration Results.
• If the geometry of the mineralisation with respect to the drill hole angle is known, its nature should be reported.
• If it is not known and only the down hole lengths are reported, there should be a clear statement to this effect (e.g. ‘down hole length, true width not known).
All holes have been drilled vertically. With the slight up-dip deviation of the drill string during drilling, many coal intersections will be almost vertical. Dip of the coal seams in the Foxleigh areas often varies from 5° - 15°. At these structural dips, down hole intersections of coal seams are close to the true vertical thickness of the coal seam. The exception to this is where seam dips can steepen up to 80° close to thrusts faults or associated with folding. In these localised areas, thick apparent seam lengths can be intersected. In the case of the One Tree/Pipeline model, where thickened intercepts of coal affected interpolated areas, steeply dipping thickened seam intercepts were controlled to minimise their impact on the modelled thickness grids.
DIAGRAMS
• Appropriate maps and sections (with scales) and tabulations of intercepts should be included for any significant discovery being reported. These should include, but not limited to a plan view of drill hole collar locations and appropriate sectional views.
Diagrams and cross sections considered material to the coal resource description are incorporated within the body of the report and include, location, geology and resource plans and several geological cross sections.
BALANCED
REPORTING
• Where comprehensive reporting of all Exploration Results is not practicable, representative reporting of both low and high coal quality and/or widths should be practiced to avoid misleading reporting of Exploration Results.
Validated coal quality results have been included in the modelled data used to estimate and report on Coal Resources. Typical thickness and coal quality values have been reported in resource tables in this report, and whilst some outlying values may exist the averages are considered representative of the Foxleigh Coal Resources. For the coal seams, raw coal in situ density generally ranges 1.43 - 1.51 g/cc, and air-dried ashes range 12% - 22% for each of the Roper 1, Middlemount 1, Tralee 2, Pisces 1B and Pisces 2A plies, with exceptions to this in Foxleigh West for the Tralee 2 and Foxleigh South for the Tralee 2 and Pieces 1B, where the seams are slightly stonier and density generally ranges 1.54 - 1.62 g/cc, and ash 24% - 30%. The Pisces 2B (only reported at Foxleigh Plains) has distinctly poorer coal quality to other seams in the Foxleigh deposit, with density generally approximating 1.67 g/cc and ashes averaging 38%. Overall this represents a reasonably consistent range of qualities throughout the Foxleigh areas.
OTHER
SUBSTANTIVE
EXPLORATION
DATA
• Other exploration data, if meaningful and material, should be reported including (but not limited to): geological observations; geophysical survey results; geochemical survey results; bulk samples – size and method of treatment; metallurgical test results; bulk density, groundwater; geotechnical and rock characteristics; potential deleterious or contaminating substances.
AAMC undertook a Heli-mag survey in the north of the Foxleigh area in 2008 and conducted seismic investigations throughout the area from 2009 to 2014 so there are now some 70 2D seismic lines within the Foxleigh mine/deposit areas. The high-quality seismic sections were useful in understanding the seam structure and provided confidence in the continuity of coal seams. The seismic sections were invaluable in defining the major structural features. In 2005, Millennium Coal (Peabody) flew an aeromagnetic survey over the Roper Creek area, from which faults and intrusions were interpreted.
FURTHER WORK
• The nature and scale of planned further work (e.g. tests for lateral extensions or depth extensions or large-scale step-out drilling).
• Diagrams clearly highlighting the areas of possible extensions, including the main geological interpretations and future drilling areas, provided this information is not commercially sensitive.
MMS continues to conduct further exploration drilling within the Foxleigh Project areas where there is commercial potential; acquiring additional geological and coal quality information to define additional Coal Resources or to increase their confidence to a higher status for mine feasibility planning and commercial evaluation. Additional 2D seismic surveys may be acquired, which have been used effectively at Foxleigh to assist with structural interpretation and seam continuity.
Foxleigh Coal Mine Competent Person Report, August 2018 Page 61
SECTION 3. ESTIMATION AND REPORTING OF COAL RESOURCES
CRITERIA JORC CODE 2012 EXPLANATION COMMENTS
DATABASE INTEGRITY
• Measures taken to ensure that data has not been corrupted by, for example, transcription or keying errors, between its initial collection and its use for Coal Resource estimation purposes.
• Data validation procedures used.
Historical hole drill information was compiled by AAMC into an acQuire database. This data was exported from acQuire to generate the Minescape computer models constructed by AAMC. With purchase of the project by MMS, a database was exported from the acQuire database into spreadsheets and imported into ABB’s Minescape GDB database system. All MMS exploration data is loaded into this GDB database. The GDB database contains several validations that are performed before data can be successfully loaded into the database. For the creation of the updated geological models for the 2018 resource estimate, data was exported from individual AAMC Minescape models (survey, seam picks, lithology, weathering, Tertiary, original topography). The exception to this was a model generated by Measured Group for the Foxleigh Plains area. Any new data was provided from the newly developed GDB database. This information was loaded into Minex databases for structural interpretation and generation of models. MBGS conducted a check of the seam nomenclature and found the naming of the coal seams was inconsistent in parts and renamed where relevant to produce models with consistent naming across all Foxleigh deposits. Detailed geological cross sections through all holes, including recent holes drilled by MMS, were generated in all model areas and used to confirm the seam correlations and to develop a structural interpretation, prior to the generation of the Minex models. Geophysical logs were referenced, and seam correlation was adjusted for a number of holes. Overall seam correlations and depths to roof and floor appear consistent with the geophysical logs. Coal quality data was supplied by MMS, exported from the GDB database for all available holes and were loaded into the Minex databases. Profiles through drill holes were generated to validate against raw data.
SITE VISITS
• Comment on any site visits undertaken by the Competent Person and the outcome of those visits.
• If no site visits have been undertaken indicate why this is the case.
MBGS personnel visited the site in March 2017 to acquire data, develop an understanding of the mine operations and the procedures used in drilling, logging and sampling of the core for the Roper Creek area. During MBGS’ visit to the Foxleigh Mine site a large quantity of additional information and reports was provided for review. This set of data was particularly significant as it included the many high-quality seismic exploration survey sections acquired by AAMC to 2014. Another site visit in May 2107 was conducted by Rowan Johnson (MBGS), the Competent Person for this resource report, to check the field drilling operations, acquisition methodology of the geological information, the geophysical logging and the coal sampling routines and strategies to ensure they were conducted competently and consistently to an acceptable standard.
GEOLOGICAL
INTERPRETATION
• Confidence in (or conversely, the uncertainty of) the geological interpretation of the coal deposit.
• Nature of the data used and any assumptions made.
Geology of the Foxleigh deposits is understood with a reasonable level of confidence and it is believed that coal volume estimations are sound. Confidence in the geological interpretation is directly related to the simplicity or complexity of the structure, the drill hole spacing and the availability of seismic data. The eastern deposits of Foxleigh Plains, One Tree, Pipeline and Carlo Creek are structurally complex and have closer spaced drill holes
Foxleigh Coal Mine Competent Person Report, August 2018 Page 62
• The effect, if any, of alternative interpretations on Coal Resource estimation.
• The use of geology in guiding and controlling Mineral Resource estimation.
• The factors affecting continuity both of grade and geology.
than the western deposits of Roper Creek, Eagle’s Nest, Foxleigh North, Western corridor, Far South and Foxleigh West. Drill hole spacing is generally 25 m – 150, but up to 250 m apart in the eastern deposits and along the seam subcrop areas of the western deposits. Drill hole spacing increases to 250 m – 500 m, but up to 1,000 m apart in the down-dip areas of the western deposits, southern area of Foxleigh West and at Roper Creek deposit. Also, the consistency of the geophysical long spaced density signature provides confidence in the consistency, continuity and the general quality of each seam. The Foxleigh deposits are predominantly affected by large thrusts faults and numerous smaller sympathetic thrust faults, which can locally thicken or repeat the coal seams. The structural interpretation is complemented by numerous high quality 2D seismic lines that provide a good understanding of the nature and extent of faulting and folding. Small to large thrust faults striking north-northwest have been interpreted from the 2D seismic survey and drill hole information. Larger thrust faults have been modelled, however due to the complexity of the deposit not all observed thrust faults could be modelled. The combination of the very close spaced drilling, and seismic data, provide confidence in the geological interpretation where there is data coverage, however there may be local variations to the interpretation due to lesser faults. No significant changes in seam character, thickness or quality have been observed due to the thrust faulting. Intrusions have been identified in the northern deposits, largely sills. There are several intersections of each identified sill, however further drilling is required to improve confidence in the interpretation.
DIMENSIONS
• The extent and variability of the Coal Resource expressed as length (along strike or otherwise), plan width, and depth below surface to the upper and lower limits of the Coal Resource.
The Rangal Coal Measures contain the reported Coal Resources of the Foxleigh Project deposits. The coal measures extend over a strike length of approximately 20 km. The width of the shallow measures varies with regional structure and the structural dip of the strata and is nominally 500 m – 2,000 m (represents a width from subcrop to approximately 200 m below the surface. Overall the Foxleigh resource has a high aspect ratio (width to length) comprising three elongate, narrow areas separated by major regional thrust faults. Additional coal tonnes are present in the deeper (>200 m) down-dip areas of the tenements but have not been included in this report.
ESTIMATION AND
MODELLING
TECHNIQUES
• The nature and appropriateness of the estimation technique(s) applied and key assumptions, including treatment of extreme grade values, domaining, interpolation parameters and maximum distance of extrapolation from data points. If a computer assisted estimation method was chosen include a description of computer software and parameters used.
• The availability of check estimates, previous estimates and/or mine production records and whether the Coal Resource estimate takes appropriate account of such data.
• The assumptions made regarding recovery of by-products.
• Estimation of deleterious elements or other non-grade variables of economic significance (e.g. sulphur for acid mine
The models are updates of previous Minescape models, largely produced by AAMC, and include recent drill hole data and updated structural interpretation (based on drill hole and seismic data and regional geological knowledge). The stratigraphic nomenclature of some areas was adjusted to ensure seam naming continuity across all Foxleigh areas (e.g. Lindsay Seam in Foxleigh West, is a deteriorated Tralee Seam and was named such in the updated model). A set of structure grids (coal roof, floor and thickness) were generated at a mesh size of 20 m. ECS Growth Technique algorithms (also called General Purpose) were used for interpolation of data to generate the structure grids. Coal quality grids were generated at a mesh size of 50 m using the Inverse Distance algorithm to interpolate the coal quality data. Coal quality grids were generated for; Proximate Analysis parameters, in situ density, energy, total sulphur, phosphorus, HGI, chlorine and fluorine for raw and clean coal composite analyses. Also, petrography, ultimate analysis and simulated ash and yield data were gridded. Coal quality data was extrapolated to cover the model areas, (to allow mining studies to use the gridded data) and in some cases for up to several kilometers. Coal quality of each seam is generally consistent across Foxleigh and as such the extrapolated grids appeared reasonable. All model areas intersect thrust faults and have been modelled using the Minex 3-D fault modelling module, to enable over thrusted strata to be modelled correctly. Fault strings were designed with a throw and direction of throw to offset the structure grids. The geological structural models are acceptable, although some smaller faults have not been modelled, or simplified faults modeled in very complex mined out areas. More drilling and/or seismic may be warranted to delineate the complex faulting at Foxleigh.
Foxleigh Coal Mine Competent Person Report, August 2018 Page 63
drainage characterisation).
• In the case of block model interpolation, the block size in relation to the average sample spacing and the search employed
• Any assumptions behind modelling of selective mining units.
• Any assumptions about correlations between variables.
• Description of how the geological interpretation was used to control the resource estimates.
• Discussion of basis for using or not using coal quality cutting or capping.
• The process of validation, the checking process used, the comparison of model data to drill hole data, and use of reconciliation data if available.
Intrusions are present at Foxleigh but are not common and have only been identified in Roper Creek, the northern areas of Foxleigh North, Foxleigh Plains and One Tree/Pipeline. Where interpreted they have been modelled extraneous to the coal seam or excluded from resource polygons. The topography/upper surface used for the structural models was generated from LiDAR data. The last full site LiDAR was undertaken on 30 August 2016, which covered all the mining and exploration areas. This was followed up by a survey covering the mining areas only in September 2017. The 2017 survey covers all the resource areas reported in 2018, with the exception of a very small area, along the southern edge of Foxleigh West. Base of weathering and base of Tertiary surfaces were generated from visual observations from drill hole data. A small number of drill holes were excluded in some models due to unresolved correlations or small-scale structures difficult to model. Control holes have been used in some of the models to assist with control of structure of the coal seams. Resources were estimated using the Minex generated grid models of seam thickness and in situ density. Resources were limited by tenement boundaries, seam subcrops, data extents, and divided by resource category polygons and depth slices at 100 and 200 m below the current surface. Resources were estimated below the base of weathering/LiDAR surface and limited by mined out polygons. No seam thickness or coal quality cut-offs were used. In most areas, coal seams had low to moderate ash contents and all would be suitable to produce marketable products. An exception to this is the Pisces 2B, where the raw ash is higher than other resource seams, however due to its proximity to the overlying Pisces 2A Ply and the potential to produce a thermal product, the coal in the Pisces 2B is a target. Manual checks were undertaken to confirm the computer derived estimates. There are no by-products from the processing and beneficiation of the coal. No estimation of the deleterious elements was undertaken as part of this statement. No block models have been constructed from the five separate Minex grid models. No selective mining working sections were modelled. No assumptions have been made about correlations between variables.
MOISTURE
• Whether the tonnages are estimated on a dry basis or with natural moisture, and the method of determination of the moisture content.
Coal tonnages have been estimated at an in situ moisture basis of 4.5% with relative density data adjusted to an in situ basis for the estimation. This in situ moisture value was used by AAMC and subsequently by Encompass Mining and Measured Group. MBGS assessed the available the moisture holding capacity measurements and found the estimate of 4.5% for in situ moisture is reasonable and is considered appropriate for the rank of the Rangal Coal Measures coals in this region. Moisture holding capacity was tested on numerous samples across the project area, which has enabled a reasonable assessment of the in situ moisture. All reported qualities in this report are at an air dried moisture basis, with the exception of in situ density.
CUT-OFF
PARAMETERS • The basis of the adopted cut-off or quality
parameters applied.
Resources were limited to 200 m below the latest surveyed LiDAR surface. No seam thickness, coal quality or strip ratio limits were applied. Raw ash of the resource seams is reasonable, and mining and processing has confirmed that with benefaction Foxleigh coal can produce a saleable low volatile PCI product. There is also potential to produce a thermal product in the lower ply of the Pisces 2 Seam.
Foxleigh Coal Mine Competent Person Report, August 2018 Page 64
Infrastructure and environmental features were not used as limits to the resource. This includes waterways such as Roper Creek and Oaky Creek and the pipeline from Bingegang Weir to BMA towns and mines. Mining studies will assess limits and economic cut-offs for diversions.
MINING FACTORS
OR ASSUMPTIONS
• Assumptions made regarding possible mining methods, minimum mining dimensions and internal (or, if applicable, external) mining dilution. It is always necessary as part of the process of determining reasonable prospects for eventual economic extraction to consider potential mining methods, but the assumptions made regarding mining methods and parameters when estimating Coal Resources may not always be rigorous. Where this is the case, this should be reported with an explanation of the basis of the mining assumptions made.
Mining is currently by open cut methods and given average seam thicknesses (typically 1 – 5 m), depth to the seams and structural complexity in the defined deposit areas, future mining will continue by open cut methods. Current operations use truck and shovel methods and due to the structural complexity are expected to continue as such. The Yarrabee Tuff Bed is located below the Pisces 2A Ply and consideration of this unit is required for mining practices due to the swelling and dispersive nature of this tuffaceous claystone. The Pisces 2B Ply is located below the Yarrabee Tuff and selective mining of this tuffaceous claystone maybe required if extraction of the Pieces 2B Ply is undertaken.
METALLURGICAL
FACTORS OR
ASSUMPTIONS
• The basis for assumptions or predictions regarding metallurgical amenability. It is always necessary as part of the process of determining reasonable prospects for eventual economic extraction to consider potential metallurgical methods, but the assumptions regarding metallurgical treatment processes and parameters made when reporting Coal Resources may not always be rigorous. Where this is the case, this should be reported with an explanation of the basis of the metallurgical assumptions made.
Foxleigh Mine has an onsite CHPP and all coal is currently processed through the plant to achieve the target products. The rank of the coal seams in the resource areas are the same as those currently mined at Foxleigh (except for Foxleigh West) and the coal preparation and handling is expected to be the same or similar. Foxleigh West has a slightly lower rank than the rest of the deposit and further work may be required to determine potential products from this area. A drill core laboratory testing programme designed to test the coal washability and clean coal product was carried out on a selection of cores. The programme was designed to establish likely product types from the coal seams at Foxleigh. Analysis of float/sink and clean coal composite results confirmed that the coal will require washing to meet the target product market specifications and indicated that a low ash, low volatile PCI product could be beneficiated at economic yields. MMS’ current production and sale of this coal product type at Foxleigh Mine from the same seams as the resource areas is confirmation that the resource seams could be sold into these markets. The exception to this is Foxleigh West, which warrants further investigation.
ENVIRONMENTAL
FACTORS OR
ASSUMPTIONS
• Assumptions made regarding possible waste and process residue disposal options. It is always necessary as part of the process of determining reasonable prospects for eventual economic extraction to consider the potential environmental impacts of the mining and processing operation. While at this stage the determination of potential environmental impacts, particularly for a greenfields project, may not always be well advanced, the status of early consideration of these potential environmental impacts should be reported. Where these aspects have not been considered this should be reported with an explanation of the environmental assumptions made.
AAMC had an extensive environmental and heritage approval process. This is now overseen by MMS. The Foxleigh Project deposits target the same coal measures and it is likely that the overburden geochemistry and coal processing rejects from the current mining operation and the coal handling facilities will be the same. It is therefore assumed that the expected environmental impacts will be similar and the methods and costs to manage will also be the same. Waterways dissecting Roper Creek in the north and Dagger’s Tip in the south of the project area were not used as limiting factors to estimation of Coal Resources. Resources in these areas would have to be assessed during mining studies.
Foxleigh Coal Mine Competent Person Report, August 2018 Page 65
BULK DENSITY
• Whether assumed or determined. If assumed, the basis for the assumptions. If determined, the method used, whether wet or dry, the frequency of the measurements, the nature, size and representativeness of the samples.
• The bulk density for bulk material must have been measured by methods that adequately account for void spaces (vugs, porosity, etc.), moisture and differences between rock and alteration zones within the deposit.
• Discuss assumptions for bulk density estimates used in the evaluation process of the different materials.
A mixture of relative density and apparent relative density was available on coal cores throughout the project areas. Apparent relative density, historically, was undertaken on sub-ply samples to enable correct combination of samples for more thorough testing on a ply/seam basis. The composited samples were tested for a wide range of analyses including relative density, but not apparent relative density. Only relative density data was used for the development of an in situ density. Relative density and raw ash measurements were determined systematically on composited samples from the Foxleigh deposit coal core samples, however there were some where ash was analysed, but not relative density. An ash vs relative density regression was developed to enable estimation of relative density for all samples with raw ash data. Using the Preston Sanders equation, regressed relative density data was converted to an in situ moisture basis (4.5%) to account for loss of void spaced during laboratory testing. In situ density data was loaded into the Minex borehole databases and in situ density grids generated. In situ density grids were applied to convert volumes to tonnes for resource estimation.
CLASSIFICATION
• The basis for the classification of the Coal Resources into varying confidence categories.
• Whether appropriate account has been taken of all relevant factors (i.e. relative confidence in tonnage/coal quality estimations, reliability of input data, confidence in continuity of geology and metal values, quality, quantity and distribution of the data).
• Whether the result appropriately reflects the Competent Person’s view of the deposit.
Coal Resources have been classified into Measured, Indicated and Inferred resources based on the spacing of drill hole data and confidence in seam continuity, consistency, grade and predictability. This has been supported by 2D seismic data, regional geological knowledge and nearby mining. Where drill hole data are closely spaced and supported by seismic data, confidence in coal seam continuity, grade and predictability is sufficient to allow these resources to be classified as Measured and/or Indicated. Where data spacing has increased, confidence in coal seam continuity and predictability decreases and Coal Resources in these areas are classified as either Indicated or Inferred Resources. Continuity of seam character is based on the consistency of the geophysical signature of the coal seams. This method of defining the resources is inherently based on geological principles of correlating and comparing like geological and geophysical data which produces very similar coal analytical data. Detailed cross sections through all drill holes in all areas were examined to incorporate structural complexity or simplicity into the confidence of classification. From the results of the cross-sectional analysis, different limits of drill hole spacing were accepted for the various areas due to differing structural complexity across the deposits. Resources are limited to the last line of down-dip geophysically logged holes and by the subcrops of each of the seams, i.e. resources are not classified beyond usable drill hole information. This method of resource assessment is appropriate to represent the geological seam complexity and variation within the Foxleigh Project deposits.
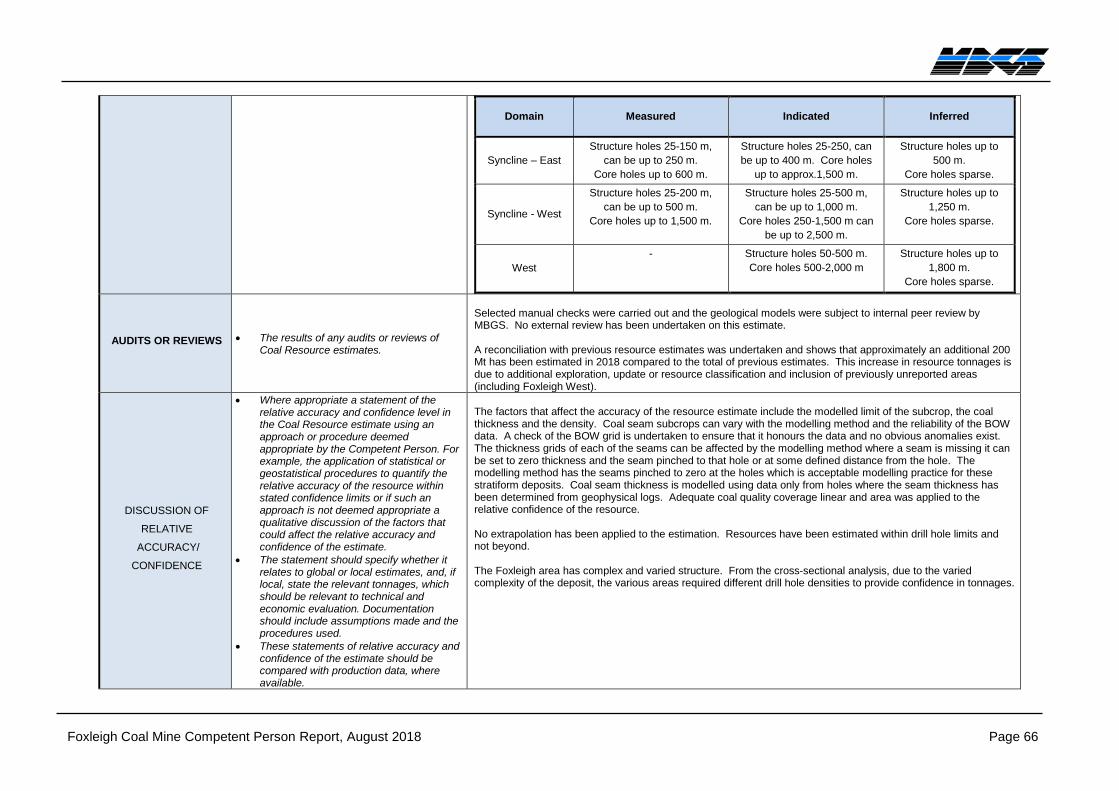
Foxleigh Coal Mine Competent Person Report, August 2018 Page 66
Domain Measured Indicated Inferred
Syncline – East
Structure holes 25-150 m,
can be up to 250 m.
Core holes up to 600 m.
Structure holes 25-250, can
be up to 400 m. Core holes
up to approx.1,500 m.
Structure holes up to
500 m.
Core holes sparse.
Syncline - West
Structure holes 25-200 m,
can be up to 500 m.
Core holes up to 1,500 m.
Structure holes 25-500 m,
can be up to 1,000 m.
Core holes 250-1,500 m can
be up to 2,500 m.
Structure holes up to
1,250 m.
Core holes sparse.
West
- Structure holes 50-500 m.
Core holes 500-2,000 m
Structure holes up to
1,800 m.
Core holes sparse.
AUDITS OR REVIEWS • The results of any audits or reviews of Coal Resource estimates.
Selected manual checks were carried out and the geological models were subject to internal peer review by MBGS. No external review has been undertaken on this estimate. A reconciliation with previous resource estimates was undertaken and shows that approximately an additional 200 Mt has been estimated in 2018 compared to the total of previous estimates. This increase in resource tonnages is due to additional exploration, update or resource classification and inclusion of previously unreported areas (including Foxleigh West).
DISCUSSION OF
RELATIVE
ACCURACY/
CONFIDENCE
• Where appropriate a statement of the relative accuracy and confidence level in the Coal Resource estimate using an approach or procedure deemed appropriate by the Competent Person. For example, the application of statistical or geostatistical procedures to quantify the relative accuracy of the resource within stated confidence limits or if such an approach is not deemed appropriate a qualitative discussion of the factors that could affect the relative accuracy and confidence of the estimate.
• The statement should specify whether it relates to global or local estimates, and, if local, state the relevant tonnages, which should be relevant to technical and economic evaluation. Documentation should include assumptions made and the procedures used.
• These statements of relative accuracy and confidence of the estimate should be compared with production data, where available.
The factors that affect the accuracy of the resource estimate include the modelled limit of the subcrop, the coal thickness and the density. Coal seam subcrops can vary with the modelling method and the reliability of the BOW data. A check of the BOW grid is undertaken to ensure that it honours the data and no obvious anomalies exist. The thickness grids of each of the seams can be affected by the modelling method where a seam is missing it can be set to zero thickness and the seam pinched to that hole or at some defined distance from the hole. The modelling method has the seams pinched to zero at the holes which is acceptable modelling practice for these stratiform deposits. Coal seam thickness is modelled using data only from holes where the seam thickness has been determined from geophysical logs. Adequate coal quality coverage linear and area was applied to the relative confidence of the resource. No extrapolation has been applied to the estimation. Resources have been estimated within drill hole limits and not beyond. The Foxleigh area has complex and varied structure. From the cross-sectional analysis, due to the varied complexity of the deposit, the various areas required different drill hole densities to provide confidence in tonnages.
Foxleigh Coal Mine Competent Person Report, August 2018 Page 67
Appendix B Australasian Code for Reporting of Exploration
Results, Mineral Resources and Ore Reserves ‘The JORC
Code, 2012 Edition’
Can be viewed at
http://www.jorc.org/docs/jorc_code2012.pdf