state of ict connectivity in asia and the pacific - · pdf filestate of ict connectivity in...
TRANSCRIPT
2 0 1 7
Artificial Intelligence and Broadband Divide
State of ict Connectivity in Asia and the Pacific
The Economic and Social Commission for Asia and the Pacific (ESCAP) serves as the United Nations’ regional hub promoting cooperation among countries to achieve inclusive and sustainable development. The largest regional intergovernmental platform with 53 Member States and 9 associate members, ESCAP has emerged as a strong regional think-tank offering countries sound analytical products that shed insight into the evolving economic, social and environmental dynamics of the region. The Commission’s strategic focus is to deliver on the 2030 Agenda for Sustainable Development, which it does by reinforcing and deepening regional cooperation and integration to advance connectivity, financial cooperation and market integration. ESCAP’s research and analysis coupled with its policy advisory services, capacity building and technical assistance to governments aims to support countries’ sustainable and inclusive development ambitions.
Disclaimer: This report of the Information and Communications Technology and Disaster Risk Reduction Division provides policy-relevant analysis on regional trends and challenges in support of the development of the Asia-Pacific Information Superhighway and inclusive development. The views expressed herein are those of the authors, and do not necessarily reflect the views of the United Nations. This report has been issued without formal editing, and the designations employed and material presented do not imply the expression of any opinion whatsoever on the part of the Secretariat of the United Nations concerning the legal status of any country, territory, city or area, or of its authorities, or concerning the delimitation of its frontiers or boundaries. Correspondence concerning this report should be addressed to the e-mail: [email protected].
Contact: ICT and Development Section Information and Communications Technology and Disaster Risk Reduction Division United Nations Economic and Social Commission for Asia and the Pacific United Nations Building Rajadamnern Nok AvenueBangkok 10200, Thailand Email: [email protected]
The shaded areas of the map indicate ESCAP members and associate members.
Foreword
Our region has moved stridently into, and is a key part of a technological revolution that will profoundly transform the way we live, work, and relate to one another. The Asia-Pacific region has become a source of the innovation behind the Internet of Things, artificial intelligence (AI), robotics and automation, also known as the “fourth industrial revolution” or “industry 4.0”. As traditional infrastructures, the manufacturing and services sectors reconfigure, new whole-of-economy efficiencies and value-added are emerging, that can be harnessed to address long intractable problems such as our altered climate and degraded environment.
There are now 5 leading research institutions on AI and robotics in Asia-Pacific with numerous private sector companies, many in global joint venture or public-private-partnership setups, that are advancing machine learning, taking advantage of the Internet of Things and embracing cloud and cognitive computing. In its scale, scope, and complexity, this technological transformation will be unlike anything our vast and diverse region has experienced before. If the technological race in the 1960s was about space exploration, today it would appear to be all about AI.
Key sources of concern also emerge. One is that it is a revolution that could widen inequalities. While the advanced countries use their scale and network effects to reinvent technology and ensure continued expansion of their mature markets, that otherwise would be prone to stagnation, some developing countries risk continued stagnation with ever widening lag gaps, as the advanced economies in the region pull away. The report underlines that AI seems to grow rapidly once all the key technology pieces are put in place. This means that without robust broadband connectivity, leveraging on the AI dividend will be much more difficult. Only half of the region’s 4.4 billion people have access to mobile broadband services, while access to fixed-broadband service is only 0.5 billion. Eighteen countries have fixed-broadband penetration of less than 2 per cent at prices that are unaffordable. Investing in supply-side infrastructure is thus the critical, albeit insufficient condition, for the uptake of AI in lagging countries. ESCAP has thus prioritized implementation of its Asia-Pacific Information Superhighway Initiative which seeks to augment broadband infrastructure connectivity seamlessly across Asia-Pacific.
A second prominent source of concern is cybersecurity. AI can identify security threats and risks, and provide solutions, but the introduction of various digital components of AI without security measures also increases exposure. As society becomes more dependent on AI, digital frictions, mistrust and vulnerabilities are on the rise.
A third top concern especially for lower-income countries with large populations is the potential displacement of labor which without a corresponding increase in total factor productivity can ignite “new poverty” and marginalization, creating fertile ground for conflict. This needs to be addressed through a prevention agenda that anticipates the most vulnerable sectors and job categories and finds ways to mitigate the impacts in a holistic way, by interalia, retooling education systems, promoting existing talent and nurturing latent talent which is in abundance in these countries, especially among the youth.
The emergence of AI and its double-edged impacts underlines the centrality of public policy and the need to shape priorities in more specific and strategically deliberate ways. This is certainly the pattern that is emerging in those countries in the region that are experiencing high digital and AI dividends. At the same time, for inclusiveness and sustainable development, governments need to work in partnership with the people, putting in place strong mechanisms for multi-stakeholder cooperation and improved transparency and accountability. In this context, regional platforms could be a particularly important mechanism to address common policy challenges, share experience, promote knowledge and technology exchanges, and come up with common solutions and approaches.
Against this dynamic and game-changing trajectory, it is our hope that the findings in this report will help policy makers anticipate where the region is going and that through the baseline set out, it will facilitate a continuous assessment of regional innovation capacities and their sustainable development impacts, over the SDG implementation period for shared prosperity and human solidarity.
Shamshad AkhtarUnder-Secretary-General of the United Nations andExecutive Secretary, United Nations Economic and Social Commission for Asia and the Pacific
Executive Summary
Artificial Intelligence (AI), consisting of digital technologies and machine intelligence, is increasingly transforming the way we live and work in the region and beyond. Faster and more versatile connectivity, together
with exponential increases in the availability and type of data collected and analysed in real time, provide us with unprecedented opportunities—but also new challenges—as we strive to achieve the Sustainable Development Goals by 2030.
AI is expected to create an increasing range of new services, products and value-added in various socioeconomic sectors. However, the changes induced by AI are still ongoing, and new AI technologies and solutions are being brought to the market on a weekly, if not daily, basis. With this dynamic and game-changing trajectory, assessing the nature and magnitude of AI’s impact on the economy and society at this early stage is tentative, but nevertheless vital. It is more important to understand where the region is going than where it stands today and as such, analysis can help establish a baseline against which regional developments in the future will be assessed.
Given this background, the report aims first to deepen our understanding of the digital components of AI and how they relate to AI. The main digital components supporting AI include: (1) the Internet of Things; (2) cloud computing; (3) broadband connectivity; and (4) big data. This report gives a summary of their characteristics, applications and benefits to various socioeconomic sectors of the region. An important observation is that AI expands rapidly and brings about transformative impacts, once all the components are put in place.1
Second, the report provides selected examples of AI-induced transformations that have contributed to accelerating implementation of Sustainable Development Goals (SDGs). It looks at how AI is contributing to increased agricultural productivity, improved health and well-being, better water quality and sanitation, and enhanced energy efficiency, through inter alia, driverless transport systems and smart logistics. In fact, AI-related technologies have already proven to be instrumental in optimizing supply chain performance and in automating some manufacturing process resulting in resource use efficiencies and increases in total factor productivity. This technological approach helps identify gaps and shape public policy priorities in more specific and strategically deliberate ways.
1 MIT Technology Review, “Asia’s AI agenda. How Asia is speeding up global artificial intelligence adoption”, November 2016. Available from https:// .amazonaws.com trasia/AsiaAI.pdf.

Conditions, prerequisites and drivers of AI development and growth
The report goes on to analyse some of the conditions, prerequisites and drivers of AI development and uptake. First, the findings show that the quantity of AI research, is positively related to market size. Second, countries that produce a large amount of AI research are also those that have better technology absorption capacity. Third, there is a positive correlation between the quantity of AI research and investment in ICT services. Thus, the returns on investment in AI among those countries with high technology absorption capacity and investment in ICT services are likely to be significantly higher than in other countries without them. Fourth, the telecommunication sector appears to be one of the key drivers of AI research, compared with other sectors. The telecommunication industry remains the most strongly correlated to productivity in AI research when the share of sectors/subsectors in GDP is examined. Fifth, with the exceptions of US island territories, the most economically-advanced economies of the region such as Australia, Japan and the Republic of Korea unsurprisingly exhibit large numbers of patents, as well as a high number of patents relative to their population size. Finally, broadband connectivity is one of the foundations and essential requirements for AI development and uptake. In this context, it is not surprising to find that broadband connectivity has a positive linear correlation with the quality of AI research, which demonstrates the importance of the underlying ICT infrastructure for the development and uptake of AI.
Broadband divide as a critical constraint
At the heart of this emerging ICT landscape is the expectation that affordable and resilient broadband connectivity would provide ubiquitous access to connect people and devices. While least developed countries, landlocked developing countries and small island developing states in Asia and the Pacific stand to benefit from these emerging technologies, the digital divide among countries continues to widen. The fixed-broadband subscriptions per 100 inhabitants in the Asia-Pacific region is still far lower than Europe and North America, and remains below the world’s average of 12.4 in 2016. Advanced economies in the region have increased their subscriptions and the quality of their broadband networks, with the Republic of Korea having more than 40 fixed-broadband subscriptions per 100 inhabitants. However, 18 ESCAP member countries still have less than 2 fixed-broadband subscriptions per 100 inhabitants, and this situation has not changed much over the past decade.
Furthermore, notwithstanding the dynamic development and rapid uptake in mobile broadband, the Asia-Pacific region as a whole still remains behind Latin America, Europe and North America, based on subscriptions per 100 inhabitants. While some of the low-income countries are quickly catching up and surpassing other higher income group countries, overall rates remain relatively low, and the high-income countries are showing slower growth due to market saturation. When progress is assessed by subregion, it is clear that a number of subregions continue to grow at slower rates than others.
In terms of empirical evidence for the widening divide in broadband subscriptions both the standard deviation and the interquartile range have increased considerably since 2010, even as the regional mean rose significantly during the same period. While East and North-East Asia is leading the Asia-Pacific region as a whole in broadband growth (largely driven by the Republic of Korea, Japan and China), South and South-West Asia and the Pacific need to catch up on both fixed- and mobile-broadband connectivity. This widening gap among subregions in Asia and the Pacific is an alarming trend, considering that the widespread introduction of AI and related digital technologies can only happen when prerequisite broadband infrastructure is in place. In sum, the advanced countries in the region, and across the globe are using their scale and network effects as a means of reinventing themselves and ensuring continued expansion of their mature markets, while some developing countries risk continued stagnation with widening lag gaps as the advanced countries pull away.
Challenges and way forward
Despite the benefits that AI can bring to the region, there are formidable challenges ahead for the majority of ESCAP member countries. While some of the challenges identified in this report are not entirely new, the context has changed with the emergence of AI, and it has become more urgent to take actions before opportunities for developing countries to catch up dissipate.
As illustrated in the report, AI seems to grow rapidly once all the key technology pieces identified earlier, are in place. This means that without robust broadband connectivity, development and expansion of the digital components of AI would be much more difficult. Investing in supply infrastructure is thus the critical, albeit insufficient condition, for enhanced AI-momentum.
Second, innovation capacities help set countries apart. Innovation creates new demand and in those countries, where supply-side elements provide solutions to meet the demand, forward momentum is triggered. In this regard, context matters as there is no one-size-fits-all approach to AI. Advancing AI calls for better algorithms, products, applications and implementations in diverse linguistic, social, cultural, economic and political environments. Subsequently, this would require a shift in focus on context-specific AI-enabling education and an investment environment that provides the culture, and incentives for greater risk-taking. These are the signals investors look for before making the necessary supply side investments within specific country contexts.
Third, it would be critical to plan for and implement measures to mitigate against known negative impacts of AI. A prominent source of concern is the displacement of labor which without a corresponding increase in total factor productivity can lead to “new poverty” and marginalization, creating fertile grounds for conflict. It is important to identify these areas and explore ways to mitigate the impact by interalia, retooling existing talent and attracting new talent especially among the youth.
Fourth, in the process of AI uptake, another prominent source of concern is cybersecurity. AI can identify security threats and risks, and provide solutions, but the introduction of various digital components of AI without security measures also increases exposure and as society becomes more dependant on AI, vulnerabilities are increasing rapidly.
Fifth, the emergence of AI has helped underline the centrality for public policy.2 Significant levels of involvement by the government and policymakers in the shaping of AI and development of the digital economy is important for inclusiveness and sustainable development. This is the pattern that is emerging in those countries of the region that are experiencing high digital development and AI momentum. Public policy needs to put in place strong mechanisms for multi-stakeholder cooperation and collaboration so as to identify challenges and opportunities from various socioeconomic angles. Cooperation and collaboration should not only take place at national levels but also at regional levels. In this context, regional cooperation platforms could be a particularly important mechanism to address common policy challenges, share experience, promote knowledge and technology exchanges, and come up with common solutions and approaches.
2 Bhaskar Chakravorti and Ravi Shankar Chaturvedi, Digital Planet 2017: How Competitiveness and Trust in Digital Economies Vary Across the World (The Fletcher School, Tufts University, 2017). Available from https://sites.tufts.edu/digitalplanet files/2017/05/Digital_Planet_2017_FINAL.pdf.

Acknowledgements
The report was prepared by Atsuko Okuda, Dongjung Lee, Siope Vakataki ‘Ofa, Eric Roeder, Achara Jantarasaengaram, Alexey Kravchenko, Jonas Flake, Jeremy Marand, Cristina Puntaru, Yaroslav Makarov, Audrey Combelle, Jijun Wang and Liu Yongwang under the general direction of Tiziana Bonapace, Director of the Information and Communications Technology and Disaster Risk Reduction Division, ESCAP.
This report benefited from internal and external reviews by Kaveh Zahedi, Deputy Executive Secretary; Hongjoo Hahm, Deputy Executive Secretary; Jonathan Tsuen Yip Wong of the Trade, Investment and Innovation Division; Oliver Paddison and Yusuke Tateno of the Macroeconomic Policy and Financing for Development Division; Ermina Sokou and Marco Roncarati of the Social Development Division; and Hong Pum Chung of the Statistics Division of ESCAP; Richard Kerby of DESA; Mohamad Nawar Alawa of ESCWA,; and Rajnesh Singh, Naveed Haq and Noelle Francesca de Guzman of the Internet Society. Tarnkamon Chantarawat, Sakollerd Limkriangkrai and Pradtana Limkrailassiri provided administrative support and other necessary assistance for the issuance of this report.
October 2017
ix
1Introduction
1
2Demystifying Artificial
Intelligence5
3Artificial Intelligence in
Asia and the Pacific9
9Conclusion
65
Table of Contents
AI and GDP 14AI, Investment in ICT Services and Technology Absorption 17The Telecommunication Sector 18AI Patents 18Broadband Connectivity 23
Internet of Things 28Cloud Computing 29Big Data 33
Agriculture 36Health and Well-Being 37Water and Sanitation 37Energy 38Decent Work and Economic Growth 38Resilient Infrastructure, Sustainable Industrialization and Innovation 39Sustainable Cities and Communities 39Life Below Water 40Connectivity 60
Capacity at Various Levels 61Training Required to Address Skill Gaps in AI-Related Technologies 61Investment and Research 62Cybersecurity 62Biases Vulnerabilities 63
Fixed Broadband 42Mobile Broadband 49Fixed or Mobile Broadband? 54Broadband Subscriptions and Social Media Users 56
4Empirical Evidence: The Driving Forces
and Conditions for AI Development in the Asia-Pacific Region
13
7Foundation for AI: Broadband Connectivity
41
5Digital Components
of AI27
8Challenges
59
6Achieving the SDGs through AI-Induced
Transformations35
Artificial Intelligence and Broadband Divide: State of ICT Connectivity in Asia and the Pacific
x
List of Boxes
Box 1. AI Technologies 7Box 2. Supporting Technologies to
Broaden the Internet of Things 29
Annexes
Annex 1 The Evolution of Artificial Intelligence 68
Annex 2 Sectoral Size and AI Research 69Annex 3 Artificial Intelligence Research
and ICT Adoption, Economic and Technological Indicators 70
Annex 4 AI Patents 72Annex 5 Cloud Computing Challenges 76Annex 6 Econometric Analysis on Fixed- and
Mobile-Broadband Adoption 77Annex 7 Additional Graphical Evidence on
the Digital Divide 78Annex 8 Social Media Users and Broadband
Adoption 83Annex 9 Subregional Analysis on the Digital
Divide in Asia and the Pacific 84Annex 10 Artificial Intelligence and Medical
Research 98Annex 11 Artificial Intelligence for Broadband
Innovation 100Annex 12 Recent Research on the Impact of
Innovation on Labour Markets in Developing Countries 101
Annex 13 Country Groupings 102Annex 14 Definitions 105
xi
List of Figures
Figure 1. AI and the emerging ICT landscape 6
Figure 2. The US and the health-care sector lead the way in AI application 8
Figure 3. AI’s impact on industries in Asia 11Figure 4. The relationship between AI research
and size of the economy, 2016 15Figure 5. The relationship between the h-index
in AI research and GDP per capita, 2016 16
Figure 6. The relationship between AI research and investment in ICT services, 2016 (excluding China) 17
Figure 7. The relationship between the h-index in AI research and the firm-level technological absorption index, 2016 18
Figure 8. The relationship between the h-index in AI research and revenues from telecommunication services, 2015 (excluding China) 19
Figure 9. The relationship between AI research and revenues from telecommunication services, 2015 (excluding China) 19
Figure 10. The number of patents with terms linked to AI in the abstracts of patent applications filed in selected countries, 2017 20
Figure 11. The number of patents with terms linked to AI in the abstracts of patent applications filed in selected countries, per million inhabitants, 2017 21
Figure 12. The relationship between h-index in AI research and mobile-broadband subscriptions per 100 inhabitants in the Asia-Pacific region, 2016 23
Figure 13. The relationship between the h-index in AI research and the percentage of Internet users in the Asia-Pacific region, 2016 24
Figure 14. The relationship between the h-index in AI research and fixed-broadband subscriptions per 100 inhabitants in the Asia-Pacific region, 2016 25
Figure 15. Most important technology trends identified by private and public sector leaders in South-East Asia, 2016 28
Figure 16. The Importance of cloud computing in various socioeconomic sectors, 2016 32
Figure 17. Fixed-broadband subscriptions by ESCAP subregion in 2016 42
Figure 18. Fixed-broadband subscriptions per 100 inhabitants (average) by region, 2000-2016 43
Figure 19. Fixed-broadband subscriptions per 100 inhabitants by ESCAP subregion in 2016 43
Figure 20. Total fixed-broadband subscriptions by income group in 2000-2016, excluding China 44
Figure 21. Fixed-broadband subscriptions per 100 inhabitants in ESCAP member countries, 2016 45
Figure 22. Network quality improvement between 10+Mbits/s and fixed-broadband subscriptions per 100 inhabitants in selected Asia-Pacific countries, 2016 46
Figure 23. Progress made in fixed-broadband subscriptions per 100 inhabitants and 10+Mbits-broadband subscriptions in 2012 and 2016 47
Figure 24. Progress made in fixed-broadband subscriptions per 100 inhabitants and 10+Mbits-broadband subscriptions, East and North-East Asia in 2012 and 2016 47
Figure 25. Progress made in fixed-broadband subscriptions per 100 inhabitants and 10+Mbits-broadband subscriptions, North and Central Asia in 2012 and 2016 48
Figure 26. Progress made in fixed-broadband subscriptions per 100 inhabitants and 10+Mbits-broadband subscriptions, South and South-West Asia in 2012 and 2016 48
Figure 27. Mobile-broadband subscriptions per 100 inhabitants by region, 2010-2016 49
Artificial Intelligence and Broadband Divide: State of ICT Connectivity in Asia and the Pacific
xii
Figure 28. Mobile-broadband subscriptions per 100 inhabitants by subregion, 2007-2016 50
Figure 29. Mobile-broadband subscriptions per 100 inhabitants by subregion, 2007-2016 50
Figure 30. Standard deviation on fixed-broadband subscriptions per 100 inhabitants in Asia and the Pacific, 2010-2016 51
Figure 31. Standard deviation on mobile-broadband subscriptions per 100 inhabitants in Asia and the Pacific, 2010-2016 52
Figure 32. Active social media users and fixed-broadband subscriptions per 100 inhabitants 57
Figure 33. Active social media users and mobile-broadband subscriptions per 100 inhabitants 58
Figure 34. ICT challenges in the public sector 60
Annex 4
Figure 4.1. “Cloud Computing” hits in the abstracts of patent applications filed in individual countries 72
Figure 4.2. AI patent applications in United States, assignee country 73
Figure 4.3. Number of AI patents by company, November 2016 73
Figure 4.4. Number of AI patents by company, February 2017 74
Annex 7
Figure 7.1. Global share of total fixed-broadband subscriptions in 2006 and 2016 78
Figure 7.2. Fixed-broadband subscriptions per 100 inhabitants by income group, 2000-2016 79
Figure 7.3. Total mobile-broadband subscriptions by region, 2007-2016 79
Figure 7.4. Mobile-broadband subscriptions per 100 inhabitants by region, 2007-2016 80
Figure 7.5. Proportion of fixed-broadband subscriptions with an advertised speed greater than 256 Kbit/s and less than 2 Mbit/s in ESCAP countries, 2015 81
Figure 7.6. Proportion of fixed-broadband subscriptions with an advertised speed greater than or equal to 10 Mbit/s in ESCAP countries, 2015 82
Annex 8
Figure 8.1. Fixed-broadband adoption and social media use in the population in ESCAP countries, 2016 83
Figure 8.2. Mobile-broadband adoption and social media use in the population in ESCAP countries, 2016 83
Annex 9
Figure 9.1. Box and whiskers plot of the East and North Asia sample of six countries, 2010-2016 84
Figure 9.2. Box and whiskers plot of the South-East Asia sample of 10 countries, 2010-2016 85
Figure 9.3. Box and whiskers plot of the South and South-West Asia sample of 10 countries, 2010-2016 86
Figure 9.4. Box and whiskers plot of the North and Central Asia sample of nine countries, 2010-2016 87
Figure 9.5. Box and whiskers plot of the Pacific sample of 10 countries, 2010-2016 88
Figure 9.6. Box and whiskers plot of the East and North Asia sample of five countries, 2010-2016 89
Figure 9.7. Box and whiskers plot of the South-East Asia sample of nine countries, 2010-2016 90
Figure 9.8. Box and whiskers plot of the South and South-West Asia sample of eight countries, 2010-2016 91
Figure 9.9. Box and whiskers plot of the North and Central Asia sample of seven countries, 2010-2016 92
Figure 9.10. Box and whiskers plot of the Pacific sample of 10 countries, 2010-2016 93
Figure 9.11. Digital divide dispersion (relative to mean) 94
xiii
List of Tables
Table 1. The number of AI-related patent applications in selected countries between the periods 2005-2009 and 2010-2014 22
Table 2. Cloud Readiness Index, 2016 30Table 3. Standard deviation on fixed-
broadband subscriptions per 100 inhabitants in Asia and the Pacific, 2010-2016 51
Table 4. Standard deviation on mobile-broadband subscriptions per 100 inhabitants in Asia and the Pacific, 2010-2016 53
Table 5. Standard deviation on mobile-broadband subscriptions per 100 inhabitants in Asia and the Pacific, excluding Macao, China, 2010-2016 53
Table 6. Comparison of standard deviation analysis of fixed- and mobile-broadband subscriptions by subregion, 2016 53
Table 7. The number of users of social media, mobile broadband and fixed-broadband in Asia and the Pacific, 2016-2017 56
Annex 3
Table 3.1. Coefficients of correlation, 2016 or most recent data 71
Annex 4
Table 4.1. Number of multinational companies or research organizations headquartered in ESCAP member countries with the most patents, by category 74
Table 4.2. Leading universities/research institutions in AI research in the Asia-Pacific region, 2017 75
Annex 6
Table 6.1. Fixed- and mobile-broadband subscriptions per 100 inhabitants, econometric results 77
Annex 9
Table 9.1. Fixed-broadband subscriptions per 100 inhabitants in the East and North Asia sample of six countries, 2010-2016 84
Table 9.2. Fixed-broadband subscriptions per 100 inhabitants in the South-East Asia sample of 10 countries, 2010-2016 85
Table 9.3. Fixed-broadband subscriptions per 100 inhabitants in the South and South-West Asia sample of 10 countries, 2010-2016 86
Table 9.4. Fixed-broadband subscriptions per 100 inhabitants in the North and Central Asia sample of nine countries, 2010-2016 87
Table 9.5. Fixed-broadband subscriptions per 100 inhabitants in the Pacific sample of 10 countries, 2010-2016 88
Table 9.6. Mobile-broadband subscriptions per 100 inhabitants in the East and North Asia sample of five countries, 2010-2016 89
Table 9.7. Mobile-broadband subscriptions per 100 inhabitants in the South-East Asia sample of nine countries, 2010-2016 90
Table 9.8. Mobile-broadband subscriptions per 100 inhabitants in the South and South-West Asia sample of eight countries, 2010-2016 91
Table 9.9. Mobile-broadband subscriptions per 100 inhabitants in the North and Central Asia sample of seven countries, 2010-2016 92
Table 9.10. Box and whiskers plot of the Pacific sample of 10 countries, 2010-2016 93
Table 9.11. Fixed-broadband, measures of dispersion, 2010-2016 95
Table 9.12. Mobile-broadband, measures of dispersion, 2010-2016 96
Artificial Intelligence and Broadband Divide: State of ICT Connectivity in Asia and the Pacific
xiv
Acronyms
AI Artificial Intelligence
ESCAP Economic and Social Commission for Asia and the Pacific (United Nations)
GDP Gross Domestic Product
ICT Information and Communications Technology
IoT Internet of Things
IT Information Technology
ITU International Telecommunication Union
LDC Least Developed Country
LLDC Landlocked Developing Country
LPWA Low-Power, Wide-Area Wireless Technology
MIT Massachusetts Institute of Technology
OECD The Organisation for Economic Co-operation and Development
SDG Sustainable Development Goal
SIDS Small Island Developing States
WEF World Economic Forum
xv
1 Introduction
Artificial Intelligence (AI) has been transforming the way we live and work in the region and beyond. Faster and versatile connectivity,
together with exponential increase in the availability and type of data collected and analysed in real time, provide us with unprecedented opportunities—and challenges—to social, economic and environmental development in Asia and the Pacific.
1
Examples of AI abound: AI in transportation systems manages and predicts traffic flows and volumes, and enables the effective use of infrastructure. Network of sensors embedded in bridges and highways helps to identify wears and tears for preventive maintenance. Driverless car is expected to reduce human error, enhance safety and cut commuting time, thus indirectly increasing human productivity. In agriculture, AI is used to optimize farm management and increase productivity through the use of sensors to monitor soil conditions and the weather in real time. In health, AI improves clinical diagnosis by analysing complex medical data.
As exciting developments in AI unfold, they are also instilling fear. People from all over the world fear that AI-enabled robots and automated factories will replace their jobs, as depicted in a 2016 report of the World Economic Forum (WEF).3 This fear of mass unemployment is not only felt among blue-collar workers, but also permeates in the traditional domains of white-collar workers, such as lawyers, doctors, information technology (IT) programmers and financial
3 WEF, “The Future of Jobs. Employment, Skills and Workforce Strategy for the Fourth Industrial Revolution”, January 2016. Available from http://www3.weforum.org/docs/WEF_Future_of_Jobs.pdf.
specialists. Moreover, the scale and complexity of online risks and threats associated with AI, including privacy and personal data protection breaches, cybercrimes and cyberattacks, along with AI-assisted warfare, are increasing, thus further raising this sense of fear and uncertainty.
Worst of all, AI seems to be widening the already pervasive development gaps among countries and people by providing exponentially expanding transformative opportunities to those with infrastructure, access, capacity, resources and knowledge, while those without are left further behind. AI uptake is characterized as a big bang phenomenon in a report by the Massachusetts Institute of Technology (MIT) due to the significant impact that AI will have on every industry, simultaneously, once all the right conditions are in place.4
If the development gaps are left unaddressed, they will soon become un-bridgeable.
This report is intended to provide the United Nations Economic and Social Commission for Asia and the Pacific (ESCAP) member countries with insights to begin considering possible development paths, embracing AI-related
4 MIT Technology Review, “Asia’s AI agenda. How Asia is speeding up global artificial intelligence adoption”, November 2016. Available from https://s3.amazonaws.com/mittrasia/AsiaAI.pdf.
Artificial Intelligence and Broadband Divide: State of ICT Connectivity in Asia and the Pacific
2
Introduction
technologies, and mitigating the risks and widening inequalities. In this context, this report will first aim to demystify AI and analyse the technology components of AI. Secondly, it will provide an empirical analysis of the characteristics of AI and the conditions needed for AI uptake. Thirdly, the report will demonstrate the opportunities and challenges of using AI to help achieve the Sustainable Development Goals (SDGs) in Asia and the Pacific, and it will be followed by some recommendations and possible way forward.
This report builds on the data analysis methodology used in the previous year for the State of ICT in Asia and the Pacific 20165
that alerted member countries of the peril of not addressing the widening digital divide in the region. In the data analysis this year, there is evidence showing that AI, and its associated digital technologies, is developed and flourishes on ubiquitous, reliable and resilient broadband networks. The lack of such broadband networks in many parts of the region means that AI uptake is and will continue to be uneven. For this reason, this
5 ESCAP, “State of ICT in Asia and the Pacific 2016: Uncovering the Widening Broadband Divide”, Technical Paper by the Information and Communications Technology and Disaster Risk Reduction Division, 2016. Available from http://www.unescap.org/resources/state-ict-asia-and-pacific-2016-uncovering-widening-broadband-divide.
report stresses the urgency to collectively and collaboratively address the broadband divide in the region, and urges member countries to put in place policies and regulatory frameworks for the uptake of AI, before it is too late. It also emphasizes the need for member countries, and regional and international partners, including donors, to prioritize funding support for building the broadband infrastructure, particularly in least developed countries (LDCs), landlocked developing countries (LLDCs) and small island developing states (SIDS).
The findings from this report will be presented to member states, in particular, information and communications technology (ICT) policymakers and decision makers, during the first Asia-Pacific Information Superhighway Steering Committee meeting in Dhaka, Bangladesh in November 2017—for informed regional, subregional and national policy dialogues on ICT development and regional cooperation. It will also be shared with researchers and academia and other stakeholders via ESCAP’s website and various online platforms.
3

Artificial Intelligence and Broadband Divide: State of ICT Connectivity in Asia and the Pacific
4
2 Demystifying Artificial Intelligence
AI is expected to create an increasing range of new services, products and value in various socioeconomic sectors. The changes induced
by AI are still ongoing, and new AI technologies and solutions are brought to the market and society on a weekly, if not daily, basis. With this dynamic and game-changing development of AI technologies, it may be premature to fully understand and assess the impact of AI on the economy and society at this point in time. Instead, it would be more beneficial to deepen our understanding of the technological components of AI and how they relate to AI.
5
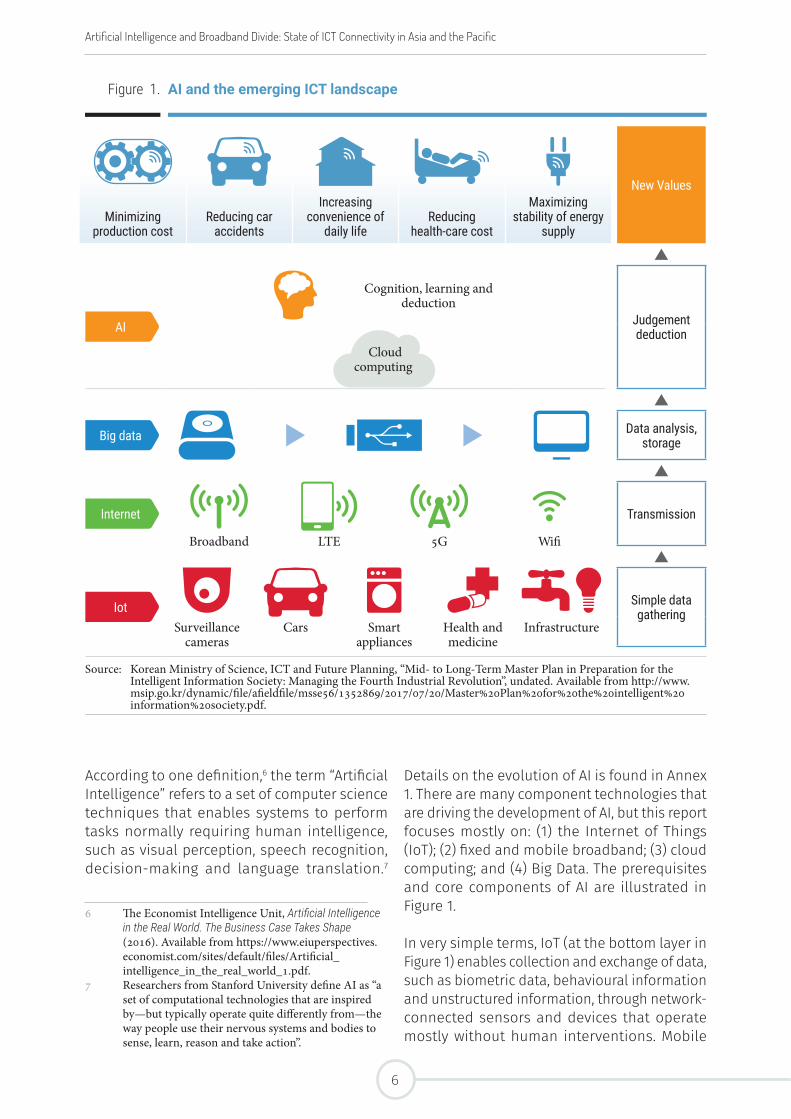
Details on the evolution of AI is found in Annex 1. There are many component technologies that are driving the development of AI, but this report focuses mostly on: (1) the Internet of Things (IoT); (2) fixed and mobile broadband; (3) cloud computing; and (4) Big Data. The prerequisites and core components of AI are illustrated in Figure 1.
In very simple terms, IoT (at the bottom layer in Figure 1) enables collection and exchange of data, such as biometric data, behavioural information and unstructured information, through network-connected sensors and devices that operate mostly without human interventions. Mobile
According to one definition,6 the term “Artificial Intelligence” refers to a set of computer science techniques that enables systems to perform tasks normally requiring human intelligence, such as visual perception, speech recognition, decision-making and language translation.7
6 The Economist Intelligence Unit, Artificial Intelligence in the Real World. The Business Case Takes Shape (2016). Available from https://www.eiuperspectives.economist.com/sites/default/files/Artificial_intelligence_in_the_real_world_1.pdf.
7 Researchers from Stanford University define AI as “a set of computational technologies that are inspired by—but typically operate quite differently from—the way people use their nervous systems and bodies to sense, learn, reason and take action”.
Figure 1. AI and the emerging ICT landscape
Minimizing production cost
Reducing car accidents
Increasing convenience of
daily lifeReducing
health-care cost
Maximizing stability of energy
supply
New Values
AI
Cognition, learning and deduction
Judgement deduction
Cloud computing
Big data Data analysis, storage
Internet
Broadband LTE 5G Wifi
Transmission
Iot Simple data gathering
Surveillance cameras
Cars Smart appliances
Health and medicine
Infrastructure
Source: Korean Ministry of Science, ICT and Future Planning, “Mid- to Long-Term Master Plan in Preparation for the Intelligent Information Society: Managing the Fourth Industrial Revolution”, undated. Available from http://www.msip.go.kr/dynamic/file/afieldfile/msse56/1352869/2017/07/20/Master%20Plan%20for%20the%20intelligent%20information%20society.pdf.
Artificial Intelligence and Broadband Divide: State of ICT Connectivity in Asia and the Pacific
6
Demystifying Artificial Intelligence
and broadband technologies enable voice and data transmissions to data storage locations, mostly using cloud computing technologies. The collected data, known as Big Data, is then provided for analysis.
Each of the above components is important on its own, but when aggregated and consolidated, the components can produce synergistic and transformative impacts, culminating into AI applications that bring new value, as illustrated in the top layer in Figure 1. It is important to note that AI technology generally has the capability to improve on past iterations, thereby enhancing its capability without necessarily relying on pre-defined behavioural algorithms, characterized as
machine learning or deep learning (described in more detail in the subsequent sections).
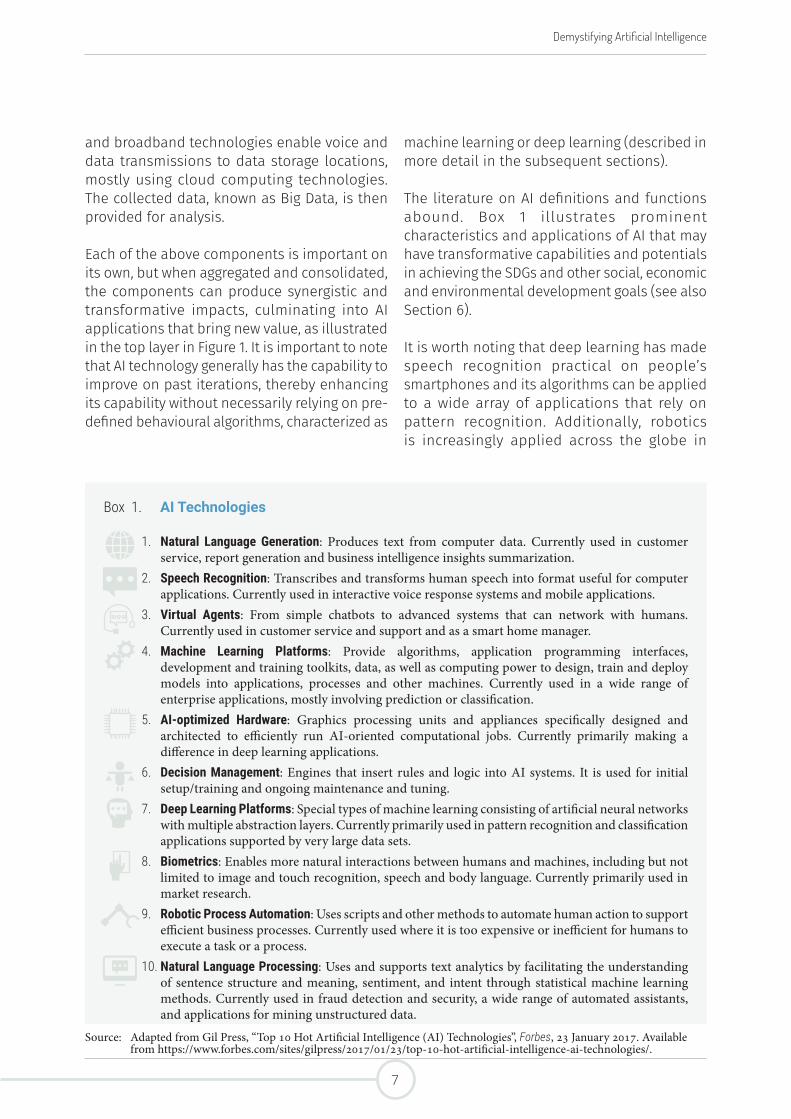
The literature on AI definitions and functions abound. Box 1 illustrates prominent characteristics and applications of AI that may have transformative capabilities and potentials in achieving the SDGs and other social, economic and environmental development goals (see also Section 6).
It is worth noting that deep learning has made speech recognition practical on people’s smartphones and its algorithms can be applied to a wide array of applications that rely on pattern recognition. Additionally, robotics is increasingly applied across the globe in
Box 1. AI Technologies
1. Natural Language Generation: Produces text from computer data. Currently used in customer service, report generation and business intelligence insights summarization.
2. Speech Recognition: Transcribes and transforms human speech into format useful for computer applications. Currently used in interactive voice response systems and mobile applications.
3. Virtual Agents: From simple chatbots to advanced systems that can network with humans. Currently used in customer service and support and as a smart home manager.
4. Machine Learning Platforms: Provide algorithms, application programming interfaces, development and training toolkits, data, as well as computing power to design, train and deploy models into applications, processes and other machines. Currently used in a wide range of enterprise applications, mostly involving prediction or classification.
5. AI-optimized Hardware: Graphics processing units and appliances specifically designed and architected to efficiently run AI-oriented computational jobs. Currently primarily making a difference in deep learning applications.
6. Decision Management: Engines that insert rules and logic into AI systems. It is used for initial setup/training and ongoing maintenance and tuning.
7. Deep Learning Platforms: Special types of machine learning consisting of artificial neural networks with multiple abstraction layers. Currently primarily used in pattern recognition and classification applications supported by very large data sets.
8. Biometrics: Enables more natural interactions between humans and machines, including but not limited to image and touch recognition, speech and body language. Currently primarily used in market research.
9. Robotic Process Automation: Uses scripts and other methods to automate human action to support efficient business processes. Currently used where it is too expensive or inefficient for humans to execute a task or a process.
10. Natural Language Processing: Uses and supports text analytics by facilitating the understanding of sentence structure and meaning, sentiment, and intent through statistical machine learning methods. Currently used in fraud detection and security, a wide range of automated assistants, and applications for mining unstructured data.
Source: Adapted from Gil Press, “Top 10 Hot Artificial Intelligence (AI) Technologies”, Forbes, 23 January 2017. Available from https://www.forbes.com/sites/gilpress/2017/01/23/top-10-hot-artificial-intelligence-ai-technologies/.
7
sectors such as agriculture, manufacturing and e-commerce. Various developments in AI-based technologies, including driverless cars, health-care diagnostics and physical assistance for elder care, are making rapid progress.
According to Forrester,8 businesses that use AI, Big Data and IoT technologies to uncover new business insights “will steal USD 1.2 trillion per annum from their less informed peers by 2020”. They also predicted that there will be a 300 per cent increase in AI investment in 2017 compared with 2016, and the number of digital analytics vendors offering IoT insights capabilities will double in 2017. The increased investment in IoT will lead to new types of analytics, which in turn will lead to new business insights and opportunities.
8 Gil Press, “Forrester Predicts Investment in Artificial Intelligence will Grow 300% in 2017”, Forbes, 1 November 2016. Available from https://www.forbes.com/sites/gilpress/2016/11/01/forrester-predicts-investment-in-artificial-intelligence-will-grow-300-in-2017/.
Research conducted by McKinsey9 found that industries that are digitally ready and willing to invest in new technologies tend to be the lead adopters of machine learning and AI, particularly those in financial services, high technology and telecommunication sectors.
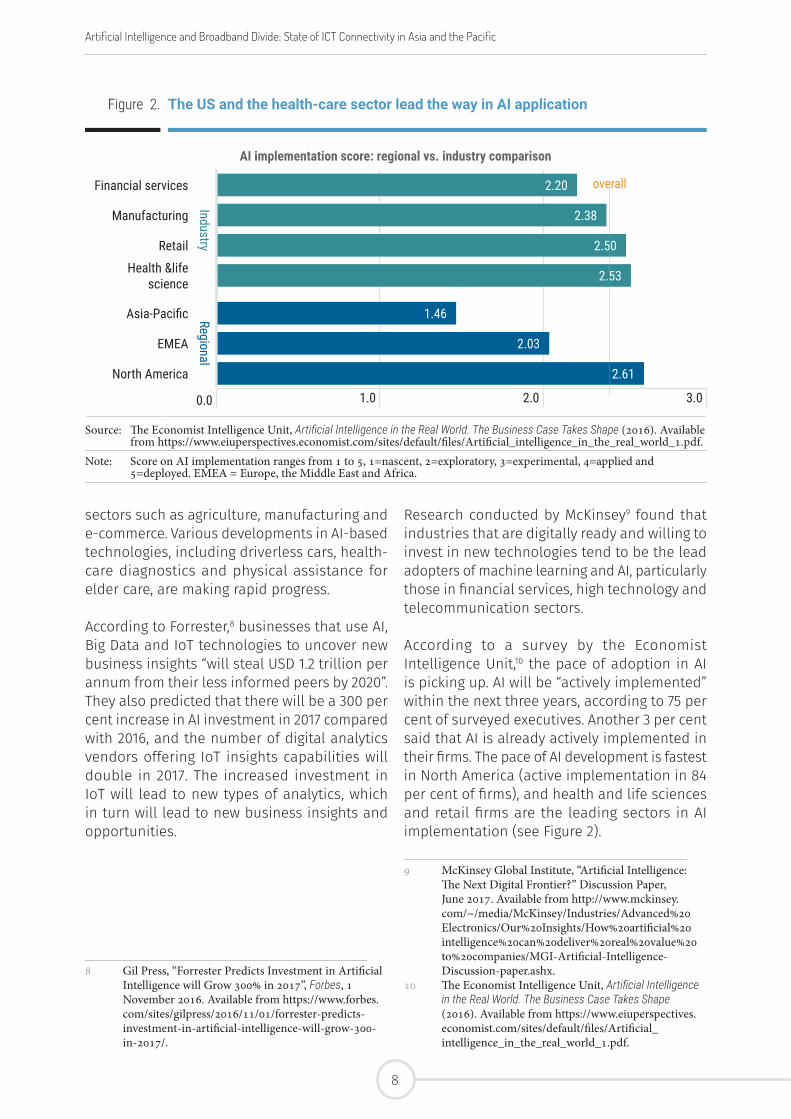
According to a survey by the Economist Intelligence Unit,10 the pace of adoption in AI is picking up. AI will be “actively implemented” within the next three years, according to 75 per cent of surveyed executives. Another 3 per cent said that AI is already actively implemented in their firms. The pace of AI development is fastest in North America (active implementation in 84 per cent of firms), and health and life sciences and retail firms are the leading sectors in AI implementation (see Figure 2).
9 McKinsey Global Institute, “Artificial Intelligence: The Next Digital Frontier?” Discussion Paper, June 2017. Available from http://www.mckinsey.com/~/media/McKinsey/Industries/Advanced%20Electronics/Our%20Insights/How%20artificial%20intelligence%20can%20deliver%20real%20value%20to%20companies/MGI-Artificial-Intelligence-Discussion-paper.ashx.
10 The Economist Intelligence Unit, Artificial Intelligence in the Real World. The Business Case Takes Shape (2016). Available from https://www.eiuperspectives.economist.com/sites/default/files/Artificial_intelligence_in_the_real_world_1.pdf.
Figure 2. The US and the health-care sector lead the way in AI application
AI implementation score: regional vs. industry comparison
Financial services
Industry
2.20
Manufacturing 2.38
Retail 2.50
Health &life science 2.53
Asia-Pacific Regional
1.46
EMEA 2.03
North America 2.61
0.0 1.0 2.0 3.0
Source: The Economist Intelligence Unit, Artificial Intelligence in the Real World. The Business Case Takes Shape (2016). Available from https://www.eiuperspectives.economist.com/sites/default/files/Artificial_intelligence_in_the_real_world_1.pdf.
Note: Score on AI implementation ranges from 1 to 5, 1=nascent, 2=exploratory, 3=experimental, 4=applied and 5=deployed. EMEA = Europe, the Middle East and Africa.
overall
Artificial Intelligence and Broadband Divide: State of ICT Connectivity in Asia and the Pacific
8
3 Artificial Intelligence in Asia and the Pacific
The Asia-Pacific region is witnessing an upsurge in attention to AI. The region has recently overtaken Europe in the number of innovation centres built
and operated, with the region now hosting 29 per cent of all such centres globally, thereby contesting Silicon Valley’s innovation leadership.11 In parallel, the private sector in the Asia-Pacific region has been investing heavily in AI recently. In the Republic of Korea, SK Telecom announced in early 2017 that it would invest USD 4.2 billion on new businesses based around AI, such as driverless cars and IoT.12 Simultaneously, educational institutions, such as Nanyang Technological University in Singapore, are promoting AI-focused programmes to build an AI talent pool in the region.
11 Capgemini Consulting, “The Spread of Innovation around the World: How Asia Now Rivals Silicon Valley as New Home to Global Innovation Centers”, December 2016. Available from https://www.capgemini-consulting.com/resource-file-access/resource/pdf/asia-innovation-centers-research.pdf.
12 Lachlan Colquhoun, “The road to 5G”, Telecom Asia, 7 March 2017. Available from http://www.telecomasia.net/content/road-5g.
9

Governments in the Asia-Pacific region are also realizing the opportunities of AI. China has recently vowed to boost growth of the AI sector in the upcoming years, with its government departments mapping out supportive fiscal policies and an international cooperation framework for the sector.13 In India, a total of nine new innovation centres14 opened their doors in the period from March to October 2016, securing second place in the world for newly opened innovation centres over that period.15 This has been supported by the Indian government’s push to nurture a digitally-empowered society and become an important innovation hub in the region. In the Republic of Korea, the government has laid out the Artificial Intelligence Information Industry Development Strategy and Master Plan in Preparation for the Intelligent Information Society, which aim to strengthen the foundation for AI growth in the country.16
While AI holds promise for substantial societal and economic benefits and may significantly affect how people live, work, learn and communicate in the future, it is of paramount importance to be aware of the challenges associated with AI in the region. It is argued that economic inequality and polarization will deepen as economies
13 State Council of the People’s Republic of China, “China rolls out three-year program for AI growth”, 23 May 2016. Available from english.gov.cn/state_council/ministries/2016/05/23/content_281475355720632.htm.
14 In March-October 2016, innovation centres in India were opened in Jaipur, Pune, Bangalore and Hyderabad.
15 Capgemini Consulting, “The Spread of Innovation around the World: How Asia Now Rivals Silicon Valley as New Home to Global Innovation Centers”, December 2016. Available from https://www.capgemini-consulting.com/resource-file-access/resource/pdf/asia-innovation-centers-research.pdf.
16 Hyea Won Lee and Young-jin Choi, “What is Korea’s Strategy to Manage the Implications of Artificial Intelligence?” World Bank, 29 August 2016. Available from http://blogs.worldbank.org/ic4d/what-korea-s-strategy-manage-implications-artificial-intelligence.
continue to be automated.17 The technological progress of AI may put least developed and emerging economies in the region at risk of losing opportunities for manufacturing and customer service employment, among others. Telemarketing jobs, for example, are highly susceptible to computerization. This is worrisome for countries such as the Philippines, where the business process outsourcing industry employs some 1.2 million people and accounts for about 8 per cent of gross domestic product (GDP).18
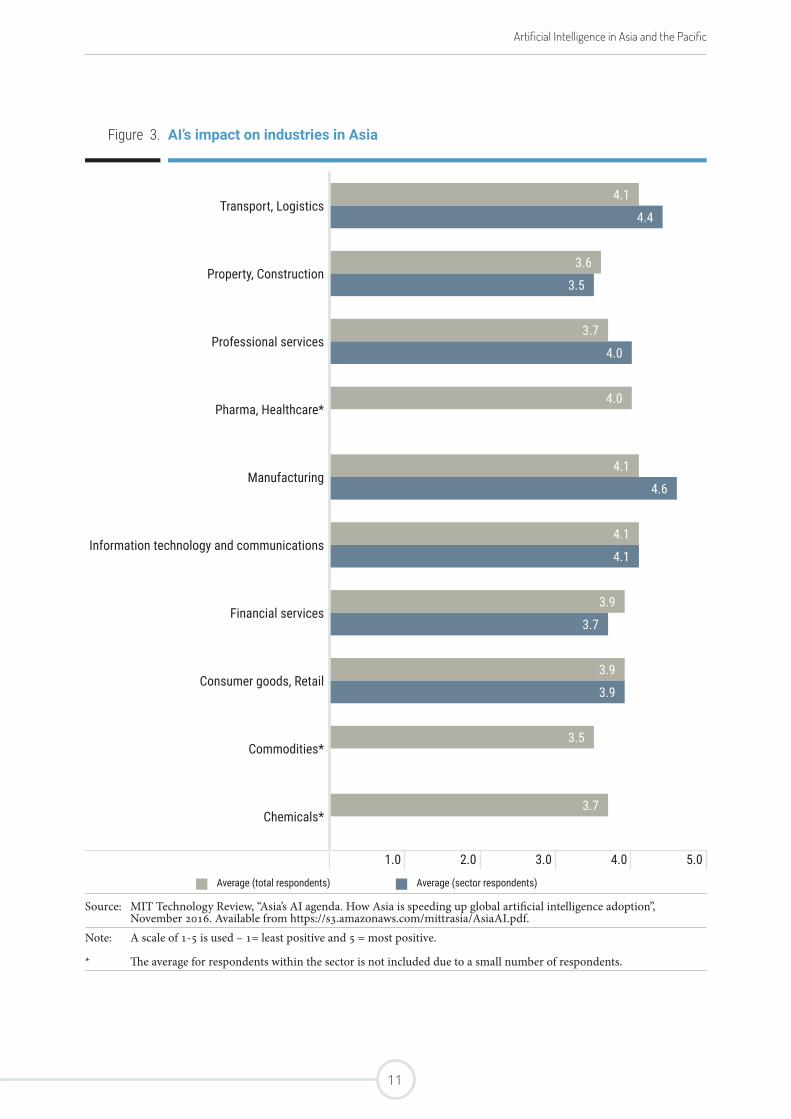
Developed economies in the region may also be affected by AI. According to a 2015 report by the Nomura Research Institute, by 2035 nearly half of all jobs in Japan could be performed by robots.19 Moreover, not only blue-collar work, but also jobs currently carried out by highly trained white-collar workers may be automated as a result of advances in deep learning and other forms of AI. The Asia-based senior executives and experts of multinational companies that participated in a recent MIT survey on AI adoption believe that the impact of AI will be felt most in manufacturing and transport/logistics, followed by ICT and other professional services (see Figure 3).
17 Ibid.18 The Economist, “Call centres: The end of the line”, 6
February 2016. Available from http://www.economist.com/news/international/21690041-call-centres-have-created-millions-good-jobs-emerging-world-technology-threatens.
19 Andrew Tarantola, “Robots expected to run half of Japan by 2035”, Engadget, 12 April 2015. Available from https://www.engadget.com/2015/12/04/robots-expected-to-run-half-of-japan-by-2035.
Artificial Intelligence and Broadband Divide: State of ICT Connectivity in Asia and the Pacific
10
Artificial Intelligence in Asia and the Pacific
Figure 3. AI’s impact on industries in Asia
Transport, Logistics4.1
4.4
Property, Construction3.6
3.5
Professional services3.7
4.0
Pharma, Healthcare*4.0
Manufacturing4.1
4.6
Information technology and communications4.1
4.1
Financial services3.9
3.7
Consumer goods, Retail3.9
3.9
Commodities*3.5
Chemicals*3.7
1.0 2.0 3.0 4.0 5.0
Average (total respondents) Average (sector respondents)
Source: MIT Technology Review, “Asia’s AI agenda. How Asia is speeding up global artificial intelligence adoption”, November 2016. Available from https://s3.amazonaws.com/mittrasia/AsiaAI.pdf.
Note: A scale of 1-5 is used – 1= least positive and 5 = most positive.
* The average for respondents within the sector is not included due to a small number of respondents.
11

Artificial Intelligence and Broadband Divide: State of ICT Connectivity in Asia and the Pacific
12
4 Empirical Evidence: The Driving Forces and Conditions for AI Development in the Asia-Pacific Region
Although AI is still evolving, this report aims to assess some characteristics and conditions of AI growth based on the data available. The findings
can help deepen our understanding of AI attributes and guide future interventions.
13
AI and GDP
Since AI research and development require financial and human resources, among other elements, it can be assumed that GDP has an impact on the development and uptake of AI. At the same time, AI is expected to generate both direct and indirect economic gains.20 Direct economic effects will come from the industries developing AI technologies. While there could be job losses, new employment as well as revenue may be created in these and other industries, which will boost GDP growth. Indirect economic growth can be spurred by AI through three different channels. First, an innovation cascade in multiple industries can be driven by advancements in the AI sector. For example, traditional companies such as car manufacturers are trying to innovate and improve their products by incorporating AI solutions. Subsequently, this may create opportunities to innovate in associated sectors, such as the insurance sector. Second, the efficiency of the labour force and capital can be enhanced with AI. AI is not necessarily a substitute to existing inputs in the production process. Rather, AI has the potential to complement labour and capital. For example, AI-based industrial robotics can reduce factory downtime and help employees augment their natural intelligence by providing new tools. Third, a new virtual workforce can be brought into existence through AI solutions, which will be able to solve problems and perform complex tasks across job functions and industries with more adaptability and agility than traditional solutions.
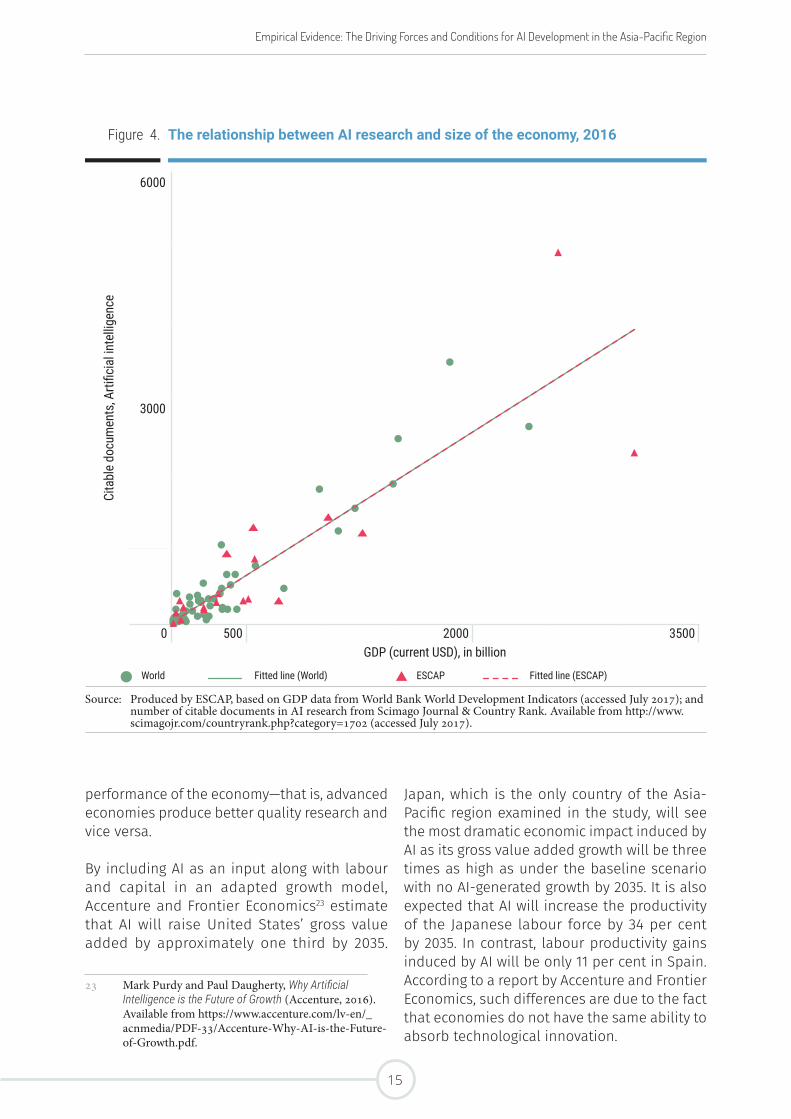
In this context, Figure 4 looks at the relationship between AI research, measured by the number of research documents, and the size of economies in 2016 using the data of Scimago
20 Nicholas Chen and others, “Global Economic Impacts Associated with Artificial Intelligence”, Study by Analysis Group, Boston, MA, 25 February 2016. Available from http://www.analysisgroup.com/uploadedfiles/content/news_and_events/news/ag_executive_summary_economic_impact_of_ai.pdf.
Journal & Country Rank.21 The result shows that countries with a big market size tend to produce a large number of AI-related research papers. Large markets also mean that the size of the labour force is likely to be large (e.g., China and India), which may suggest the higher likelihood for introducing AI-based automated solutions in production processes.22 Additionally, in countries with a large GDP, companies tend to have access to a larger market to sell AI-based products and solutions.
Countries with a large GDP are more likely to have better qualified researchers who will be able to tailor AI solutions and applications to meet the local needs and contexts. Better and more AI-related research may translate to a faster adoption rate of AI-based solutions, which in turn may contribute to an increase in economic activities, and eventually GDP per capita.
In this scenario, developed economies that are equipped with AI capabilities are expected to grow wealthier. On the other hand, less developed economies from LDCs, LLDCs and SIDS could be further marginalized and unable to exploit opportunities provided by AI-based solutions for sustainable development.
However, for countries with a lot of research done on AI, some may question their quality. Figure 5 shows the relationship between research performance, measured using the h-index, and GDP per capita. The h-index is the total number of articles (h) that has at least been cited h times. This index developed by Jorge Hirsch is widely used in academia as a metric to assess research performance and it can be used at the country level. As shown in Figure 5, there is a positive correlation between the quality of research and the
21 See http://www.scimagojr.com.22 See McKinsey Global Institute, “A Future
that Works: Automation, Employment and Productivity”, 2017. Available from http://www.mckinsey.com/global-themes/digital-disruption/harnessing-automation-for-a-future-that-works.
Artificial Intelligence and Broadband Divide: State of ICT Connectivity in Asia and the Pacific
14
Empirical Evidence: The Driving Forces and Conditions for AI Development in the Asia-Pacific Region
Japan, which is the only country of the Asia-Pacific region examined in the study, will see the most dramatic economic impact induced by AI as its gross value added growth will be three times as high as under the baseline scenario with no AI-generated growth by 2035. It is also expected that AI will increase the productivity of the Japanese labour force by 34 per cent by 2035. In contrast, labour productivity gains induced by AI will be only 11 per cent in Spain. According to a report by Accenture and Frontier Economics, such differences are due to the fact that economies do not have the same ability to absorb technological innovation.
performance of the economy—that is, advanced economies produce better quality research and vice versa.
By including AI as an input along with labour and capital in an adapted growth model, Accenture and Frontier Economics23 estimate that AI will raise United States’ gross value added by approximately one third by 2035.
23 Mark Purdy and Paul Daugherty, Why Artificial Intelligence is the Future of Growth (Accenture, 2016). Available from https://www.accenture.com/lv-en/_acnmedia/PDF-33/Accenture-Why-AI-is-the-Future-of-Growth.pdf.
Figure 4. The relationship between AI research and size of the economy, 2016
Cita
ble
docu
men
ts, A
rtific
ial in
tellig
ence
6000
3000
0 500 2000 3500GDP (current USD), in billion
World Fitted line (World) ESCAP Fitted line (ESCAP)
Source: Produced by ESCAP, based on GDP data from World Bank World Development Indicators (accessed July 2017); and number of citable documents in AI research from Scimago Journal & Country Rank. Available from http://www.scimagojr.com/countryrank.php?category=1702 (accessed July 2017).
15
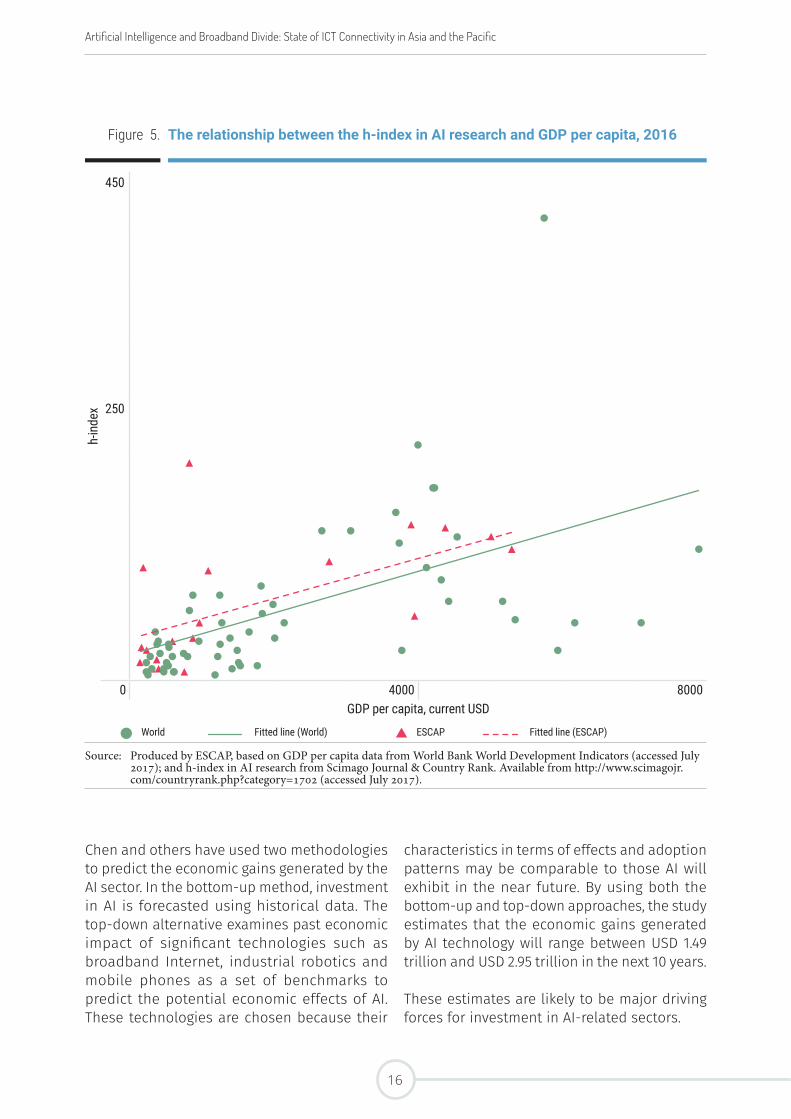
Chen and others have used two methodologies to predict the economic gains generated by the AI sector. In the bottom-up method, investment in AI is forecasted using historical data. The top-down alternative examines past economic impact of significant technologies such as broadband Internet, industrial robotics and mobile phones as a set of benchmarks to predict the potential economic effects of AI. These technologies are chosen because their
characteristics in terms of effects and adoption patterns may be comparable to those AI will exhibit in the near future. By using both the bottom-up and top-down approaches, the study estimates that the economic gains generated by AI technology will range between USD 1.49 trillion and USD 2.95 trillion in the next 10 years.
These estimates are likely to be major driving forces for investment in AI-related sectors.
Figure 5. The relationship between the h-index in AI research and GDP per capita, 2016
h-in
dex
450
250
0 4000 8000GDP per capita, current USD
World Fitted line (World) ESCAP Fitted line (ESCAP)
Source: Produced by ESCAP, based on GDP per capita data from World Bank World Development Indicators (accessed July 2017); and h-index in AI research from Scimago Journal & Country Rank. Available from http://www.scimagojr.com/countryrank.php?category=1702 (accessed July 2017).
Artificial Intelligence and Broadband Divide: State of ICT Connectivity in Asia and the Pacific
16
Empirical Evidence: The Driving Forces and Conditions for AI Development in the Asia-Pacific Region
AI, Investment in ICT Services and Technology Absorption
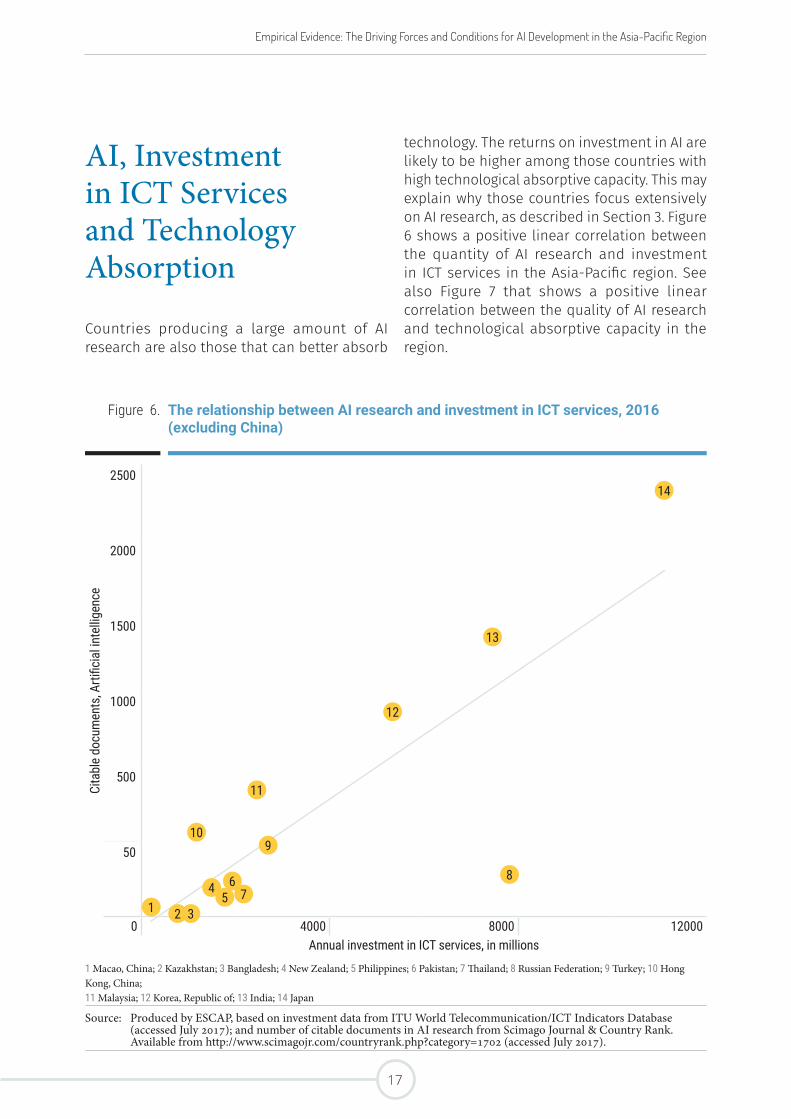
Countries producing a large amount of AI research are also those that can better absorb
technology. The returns on investment in AI are likely to be higher among those countries with high technological absorptive capacity. This may explain why those countries focus extensively on AI research, as described in Section 3. Figure 6 shows a positive linear correlation between the quantity of AI research and investment in ICT services in the Asia-Pacific region. See also Figure 7 that shows a positive linear correlation between the quality of AI research and technological absorptive capacity in the region.
Figure 6. The relationship between AI research and investment in ICT services, 2016 (excluding China)
Cita
ble
docu
men
ts, A
rtific
ial in
tellig
ence
2500
2000
1500
1000
500
50
0 4000 8000 12000Annual investment in ICT services, in millions
1 Macao, China; 2 Kazakhstan; 3 Bangladesh; 4 New Zealand; 5 Philippines; 6 Pakistan; 7 Thailand; 8 Russian Federation; 9 Turkey; 10 Hong Kong, China; 11 Malaysia; 12 Korea, Republic of; 13 India; 14 Japan
Source: Produced by ESCAP, based on investment data from ITU World Telecommunication/ICT Indicators Database (accessed July 2017); and number of citable documents in AI research from Scimago Journal & Country Rank. Available from http://www.scimagojr.com/countryrank.php?category=1702 (accessed July 2017).
3
10
13
14
2
12
1
11
4 65
87
9
17

Annex 2). In addition, the telecommunication industry remains the most strongly correlated to productivity in AI research when the share of sectors/subsectors in GDP is examined.
AI Patents
Although there is no universal repository of AI patents, this study attempted to collect data on the number and origin of AI-related patents as another indication of AI research and development. As shown in Figure 10, countries with large markets such as China, India and Indonesia tend to have a large number of AI
The Telecommunication Sector
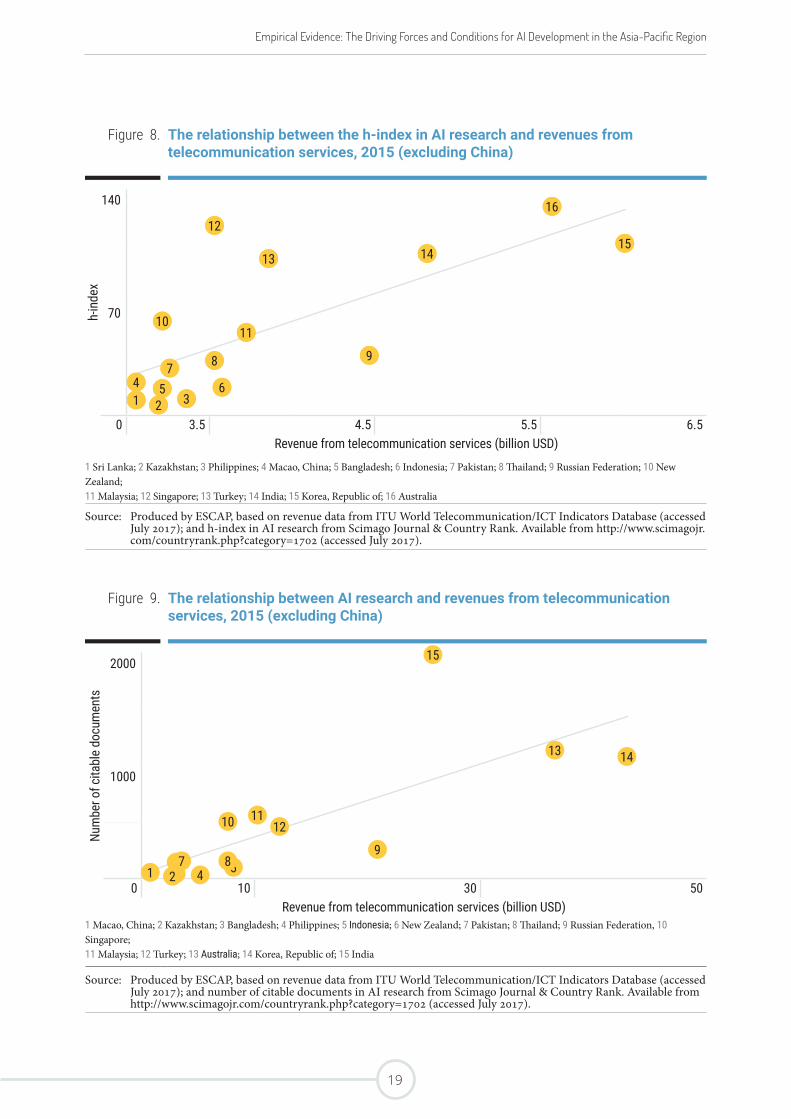
The telecommunication sector appears to be one of the key drivers of AI research (see Figures 8 and 9). Countries with a larger telecommunication sector have higher research productivity and a larger number of citable documents in the AI field in the Asia-Pacific region.
Analysis using coefficients of correlation corroborates this conclusion. The correlation between the size of the telecommunication industry and the h-index in AI research is the strongest, both in terms of magnitude and statistical significance, when compared with other sectors/subsectors in the economy (see
Figure 7. The relationship between the h-index in AI research and the firm-level technological absorption index, 2016
h-in
dex
200
100
0 3.5 4.5 5.5 6.5Firm-level technology absorption
1 Viet Nam; 2 Bangladesh; 3 Kazakhstan; 4 Sri Lanka; 5 Philippines; 6 Russian Federation; 7 Pakistan; 8 Thailand; 9 Indonesia; 10 Malaysia; 11 New Zealand; 12 Iran, Islamic Republic; 13 India; 14 Turkey; 15 Korea, Republic of; 16 Singapore; 17 Australia; 18 Hong Kong, China; 19 Japan; 20 China
Source: Produced by ESCAP, based on the firm-level technology adoption index from the WEF Executive Opinion Survey (accessed July 2017); and h-index in AI research from Scimago Journal & Country Rank. Available from http://www.scimagojr.com/countryrank.php?category=1702 (accessed July 2017).
Note: The WEF Executive Opinion Survey 2015 captured the opinions of over 14,000 business leaders in 144 economies between February and June 2015. Question asked: “In your country, to what extent do businesses adopt new technology? (1 = not at all; 7 = adopt extensively)”.
17
2
20
18
13
9
12
19
3
15
10 11
75
6
16
4
8
14
1
Artificial Intelligence and Broadband Divide: State of ICT Connectivity in Asia and the Pacific
18
Empirical Evidence: The Driving Forces and Conditions for AI Development in the Asia-Pacific Region
Figure 8. The relationship between the h-index in AI research and revenues from telecommunication services, 2015 (excluding China)
h-in
dex
140
70
0 3.5 4.5 5.5 6.5Revenue from telecommunication services (billion USD)
1 Sri Lanka; 2 Kazakhstan; 3 Philippines; 4 Macao, China; 5 Bangladesh; 6 Indonesia; 7 Pakistan; 8 Thailand; 9 Russian Federation; 10 New Zealand; 11 Malaysia; 12 Singapore; 13 Turkey; 14 India; 15 Korea, Republic of; 16 Australia
Source: Produced by ESCAP, based on revenue data from ITU World Telecommunication/ICT Indicators Database (accessed July 2017); and h-index in AI research from Scimago Journal & Country Rank. Available from http://www.scimagojr.com/countryrank.php?category=1702 (accessed July 2017).
Figure 9. The relationship between AI research and revenues from telecommunication services, 2015 (excluding China)
Num
ber o
f cita
ble
docu
men
ts
2000
1000
0 10 30 50Revenue from telecommunication services (billion USD)
1 Macao, China; 2 Kazakhstan; 3 Bangladesh; 4 Philippines; 5 Indonesia; 6 New Zealand; 7 Pakistan; 8 Thailand; 9 Russian Federation, 10 Singapore; 11 Malaysia; 12 Turkey; 13 Australia; 14 Korea, Republic of; 15 India
Source: Produced by ESCAP, based on revenue data from ITU World Telecommunication/ICT Indicators Database (accessed July 2017); and number of citable documents in AI research from Scimago Journal & Country Rank. Available from http://www.scimagojr.com/countryrank.php?category=1702 (accessed July 2017).
16
5
14
62
15
4
1110
7
3
9
12
1
8
13
13
3
15
5
14
1
11
674
9
10
8
12
2
19
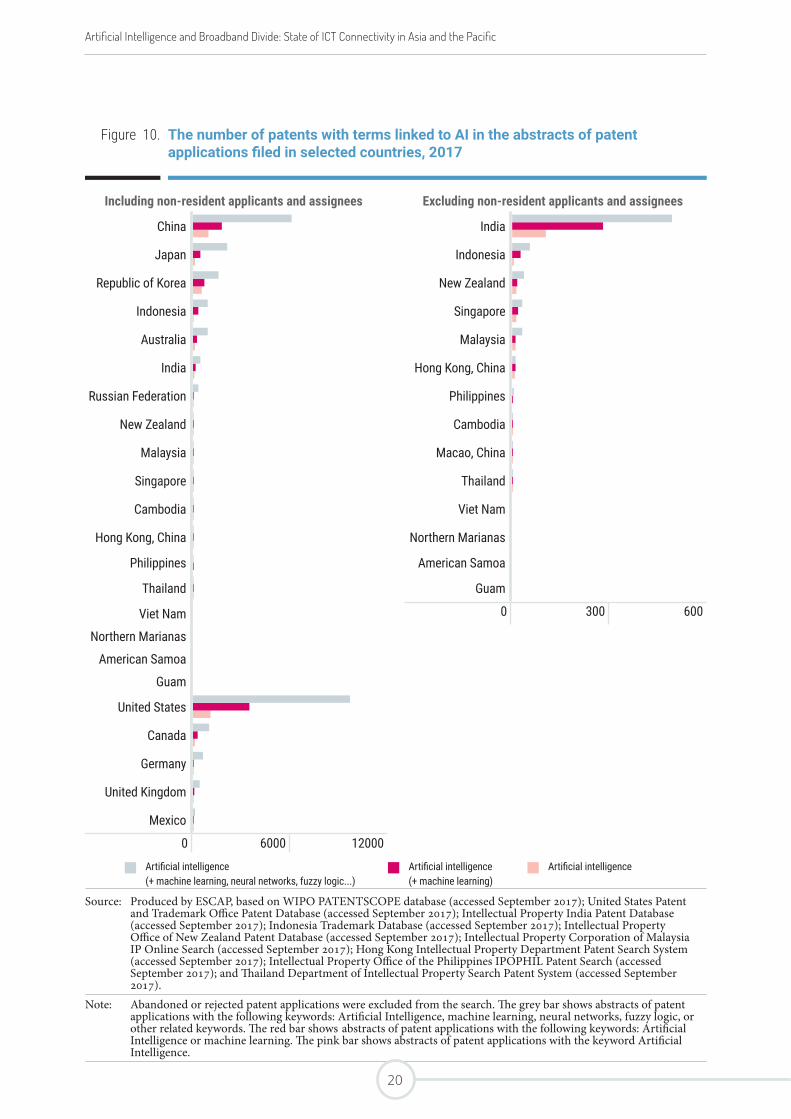
Figure 10. The number of patents with terms linked to AI in the abstracts of patent applications filed in selected countries, 2017
Including non-resident applicants and assignees Excluding non-resident applicants and assignees
China India
Japan Indonesia
Republic of Korea New Zealand
Indonesia Singapore
Australia Malaysia
India Hong Kong, China
Russian Federation Philippines
New Zealand Cambodia
Malaysia Macao, China
Singapore Thailand
Cambodia Viet Nam
Hong Kong, China Northern Marianas
Philippines American Samoa
Thailand Guam
Viet Nam 0 300 600
Northern Marianas
American Samoa
Guam
United States
Canada
Germany
United Kingdom
Mexico
0 6000 12000
Artificial intelligence (+ machine learning, neural networks, fuzzy logic...)
Artificial intelligence(+ machine learning)
Artificial intelligence
Source: Produced by ESCAP, based on WIPO PATENTSCOPE database (accessed September 2017); United States Patent and Trademark Office Patent Database (accessed September 2017); Intellectual Property India Patent Database (accessed September 2017); Indonesia Trademark Database (accessed September 2017); Intellectual Property Office of New Zealand Patent Database (accessed September 2017); Intellectual Property Corporation of Malaysia IP Online Search (accessed September 2017); Hong Kong Intellectual Property Department Patent Search System (accessed September 2017); Intellectual Property Office of the Philippines IPOPHIL Patent Search (accessed September 2017); and Thailand Department of Intellectual Property Search Patent System (accessed September 2017).
Note: Abandoned or rejected patent applications were excluded from the search. The grey bar shows abstracts of patent applications with the following keywords: Artificial Intelligence, machine learning, neural networks, fuzzy logic, or other related keywords. The red bar shows abstracts of patent applications with the following keywords: Artificial Intelligence or machine learning. The pink bar shows abstracts of patent applications with the keyword Artificial Intelligence.
Artificial Intelligence and Broadband Divide: State of ICT Connectivity in Asia and the Pacific
20

Empirical Evidence: The Driving Forces and Conditions for AI Development in the Asia-Pacific Region
Figure 11. The number of patents with terms linked to AI in the abstracts of patent applications filed in selected countries, per million inhabitants, 2017
Including non-resident applicants and assignees Excluding non-resident applicants and assignees
Australia New Zealand
Republic of Korea Singapore
Japan Macao, China
New Zealand Hong Kong, China
China Malaysia
Indonesia India
Singapore Indonesia
Russian Federation Cambodia
Hong Kong, China Philippines
Cambodia Thailand
Malaysia 0 4 8
India
Philippines
Thailand
United States
Canada
Germany
United Kingdom
Mexico
0 20 40
Artificial intelligence (+ machine learning, neural networks, fuzzy logic...)
Artificial intelligence(+ machine learning)
Artificial intelligence
Source: Produced by ESCAP, based on WIPO PATENTSCOPE database (accessed September 2017); United States Patent and Trademark Office Patent Database (accessed September 2017); Intellectual Property India Patent Database (accessed September 2017); Indonesia Trademark Database (accessed September 2017); Intellectual Property Office of New Zealand Patent Database (accessed September 2017); Intellectual Property Corporation of Malaysia IP Online Search (accessed September 2017); Hong Kong Intellectual Property Department Patent Search System (accessed September 2017); Intellectual Property Office of the Philippines IPOPHIL Patent Search (accessed September 2017); and Thailand Department of Intellectual Property Search Patent System (accessed September 2017). Population data from World Bank World Development Indicators (accessed September 2017).
Note: Abandoned or rejected patent applications were excluded from the search. The grey bar shows abstracts of patent applications with the following keywords: Artificial Intelligence, machine learning, neural networks, fuzzy logic, or other related keywords. The red bar shows abstracts of patent applications with the following keywords: Artificial Intelligence or machine learning. The pink bar shows abstracts of patent applications with the keyword Artificial Intelligence.
21
patents.24 With the exceptions of US island territories, the most economically-advanced economies of the region such as Australia, Japan and the Republic of Korea, unsurprisingly, also exhibit a high number of patents (Figure 10), as well as a high number of patents relative to their population size (Figure 11).
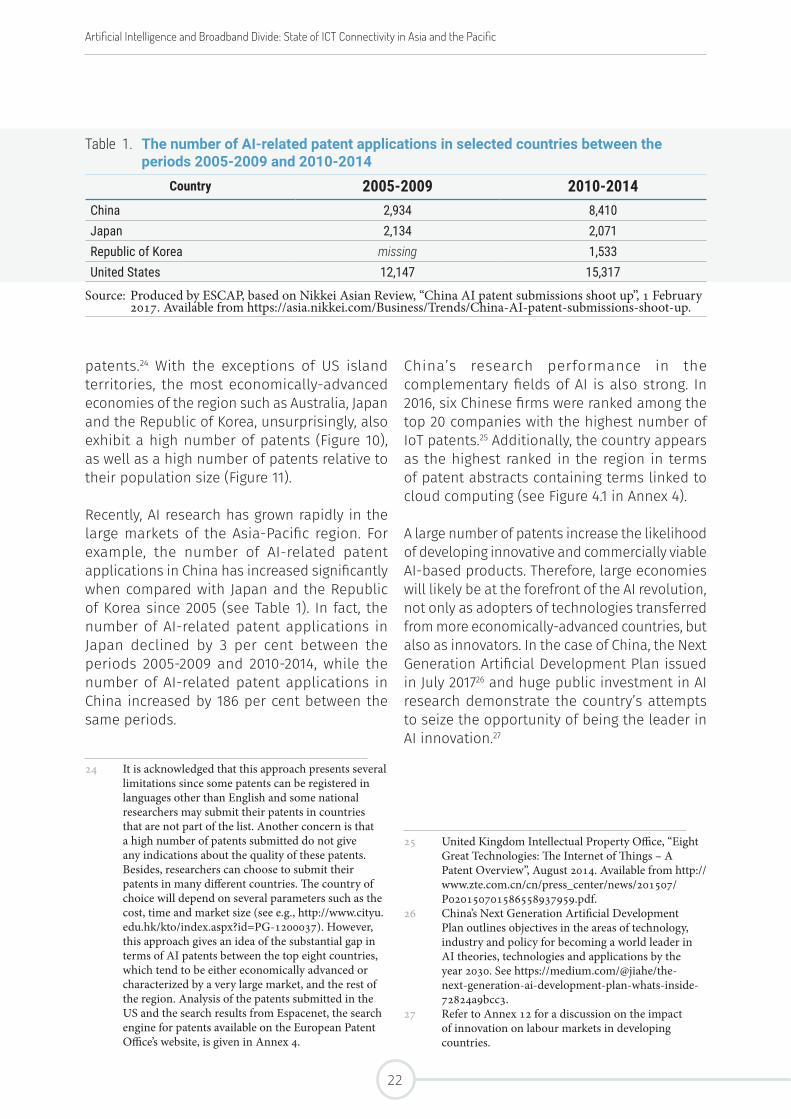
Recently, AI research has grown rapidly in the large markets of the Asia-Pacific region. For example, the number of AI-related patent applications in China has increased significantly when compared with Japan and the Republic of Korea since 2005 (see Table 1). In fact, the number of AI-related patent applications in Japan declined by 3 per cent between the periods 2005-2009 and 2010-2014, while the number of AI-related patent applications in China increased by 186 per cent between the same periods.
24 It is acknowledged that this approach presents several limitations since some patents can be registered in languages other than English and some national researchers may submit their patents in countries that are not part of the list. Another concern is that a high number of patents submitted do not give any indications about the quality of these patents. Besides, researchers can choose to submit their patents in many different countries. The country of choice will depend on several parameters such as the cost, time and market size (see e.g., http://www.cityu.edu.hk/kto/index.aspx?id=PG-1200037). However, this approach gives an idea of the substantial gap in terms of AI patents between the top eight countries, which tend to be either economically advanced or characterized by a very large market, and the rest of the region. Analysis of the patents submitted in the US and the search results from Espacenet, the search engine for patents available on the European Patent Office’s website, is given in Annex 4.
China’s research performance in the complementary fields of AI is also strong. In 2016, six Chinese firms were ranked among the top 20 companies with the highest number of IoT patents.25 Additionally, the country appears as the highest ranked in the region in terms of patent abstracts containing terms linked to cloud computing (see Figure 4.1 in Annex 4).
A large number of patents increase the likelihood of developing innovative and commercially viable AI-based products. Therefore, large economies will likely be at the forefront of the AI revolution, not only as adopters of technologies transferred from more economically-advanced countries, but also as innovators. In the case of China, the Next Generation Artificial Development Plan issued in July 201726 and huge public investment in AI research demonstrate the country’s attempts to seize the opportunity of being the leader in AI innovation.27
25 United Kingdom Intellectual Property Office, “Eight Great Technologies: The Internet of Things – A Patent Overview”, August 2014. Available from http://www.zte.com.cn/cn/press_center/news/201507/P020150701586558937959.pdf.
26 China’s Next Generation Artificial Development Plan outlines objectives in the areas of technology, industry and policy for becoming a world leader in AI theories, technologies and applications by the year 2030. See https://medium.com/@jiahe/the-next-generation-ai-development-plan-whats-inside-72824a9bcc3.
27 Refer to Annex 12 for a discussion on the impact of innovation on labour markets in developing countries.
Table 1. The number of AI-related patent applications in selected countries between the periods 2005-2009 and 2010-2014
Country 2005-2009 2010-2014China 2,934 8,410Japan 2,134 2,071Republic of Korea missing 1,533United States 12,147 15,317
Source: Produced by ESCAP, based on Nikkei Asian Review, “China AI patent submissions shoot up”, 1 February 2017. Available from https://asia.nikkei.com/Business/Trends/China-AI-patent-submissions-shoot-up.
Artificial Intelligence and Broadband Divide: State of ICT Connectivity in Asia and the Pacific
22
Empirical Evidence: The Driving Forces and Conditions for AI Development in the Asia-Pacific Region
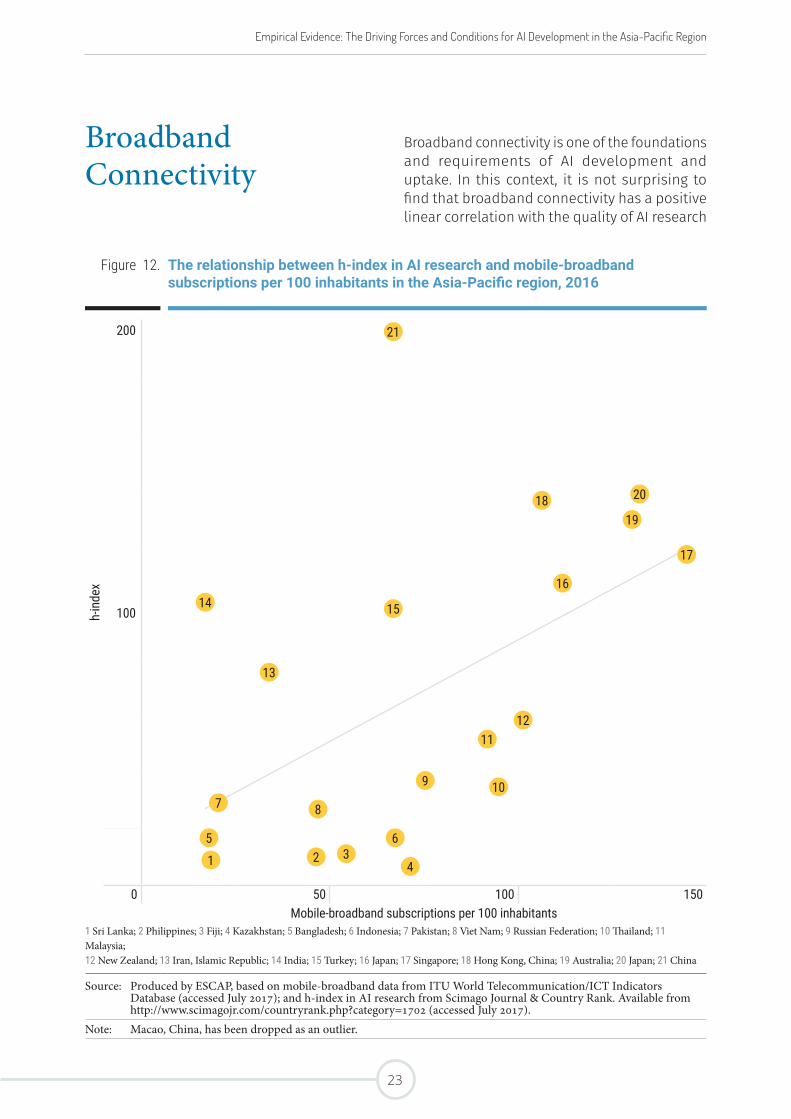
Broadband Connectivity
Broadband connectivity is one of the foundations and requirements of AI development and uptake. In this context, it is not surprising to find that broadband connectivity has a positive linear correlation with the quality of AI research
Figure 12. The relationship between h-index in AI research and mobile-broadband subscriptions per 100 inhabitants in the Asia-Pacific region, 2016
h-in
dex
200
100
0 50 100 150Mobile-broadband subscriptions per 100 inhabitants
1 Sri Lanka; 2 Philippines; 3 Fiji; 4 Kazakhstan; 5 Bangladesh; 6 Indonesia; 7 Pakistan; 8 Viet Nam; 9 Russian Federation; 10 Thailand; 11 Malaysia; 12 New Zealand; 13 Iran, Islamic Republic; 14 India; 15 Turkey; 16 Japan; 17 Singapore; 18 Hong Kong, China; 19 Australia; 20 Japan; 21 China
Source: Produced by ESCAP, based on mobile-broadband data from ITU World Telecommunication/ICT Indicators Database (accessed July 2017); and h-index in AI research from Scimago Journal & Country Rank. Available from http://www.scimagojr.com/countryrank.php?category=1702 (accessed July 2017).
Note: Macao, China, has been dropped as an outlier.
5
14
13
7
1
19
21
3
18
6
20
4
16
1112
2
9
17
10
15
8
Table 1. The number of AI-related patent applications in selected countries between the periods 2005-2009 and 2010-2014
Country 2005-2009 2010-2014China 2,934 8,410Japan 2,134 2,071Republic of Korea missing 1,533United States 12,147 15,317
Source: Produced by ESCAP, based on Nikkei Asian Review, “China AI patent submissions shoot up”, 1 February 2017. Available from https://asia.nikkei.com/Business/Trends/China-AI-patent-submissions-shoot-up.
23
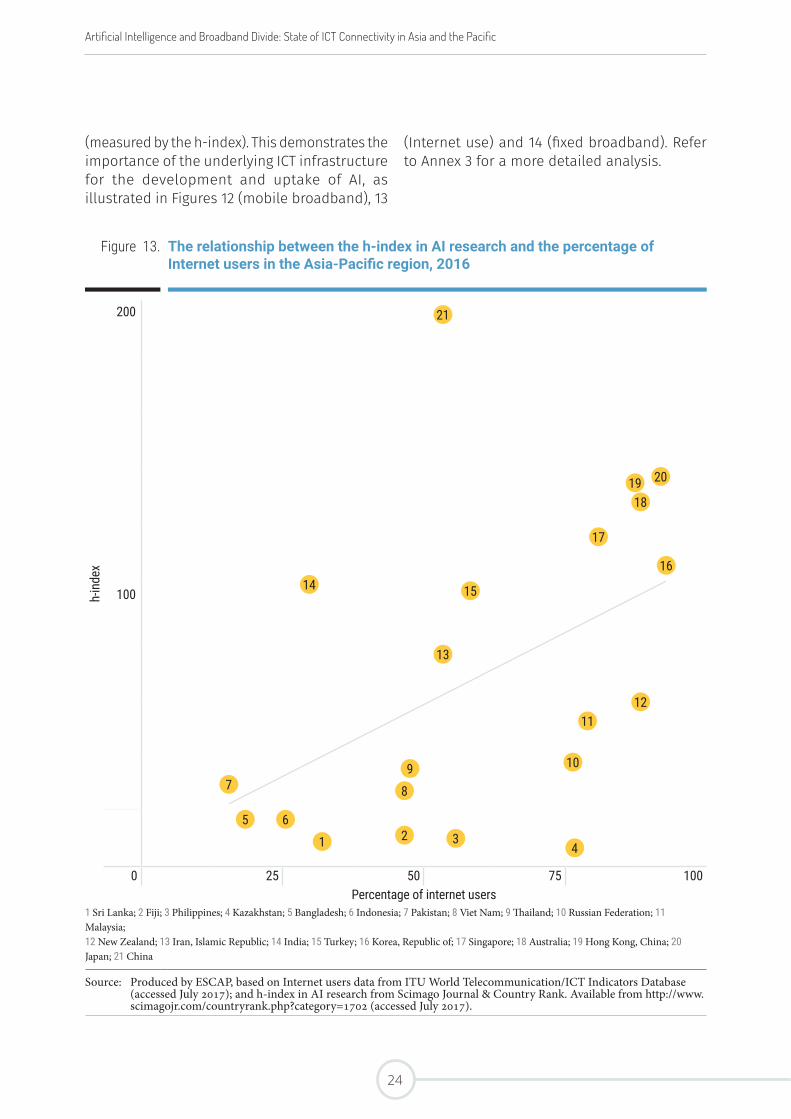
(measured by the h-index). This demonstrates the importance of the underlying ICT infrastructure for the development and uptake of AI, as illustrated in Figures 12 (mobile broadband), 13
(Internet use) and 14 (fixed broadband). Refer to Annex 3 for a more detailed analysis.
Figure 13. The relationship between the h-index in AI research and the percentage of Internet users in the Asia-Pacific region, 2016
h-in
dex
200
100
0 25 50 75 100Percentage of internet users
1 Sri Lanka; 2 Fiji; 3 Philippines; 4 Kazakhstan; 5 Bangladesh; 6 Indonesia; 7 Pakistan; 8 Viet Nam; 9 Thailand; 10 Russian Federation; 11 Malaysia;12 New Zealand; 13 Iran, Islamic Republic; 14 India; 15 Turkey; 16 Korea, Republic of; 17 Singapore; 18 Australia; 19 Hong Kong, China; 20 Japan; 21 China
Source: Produced by ESCAP, based on Internet users data from ITU World Telecommunication/ICT Indicators Database (accessed July 2017); and h-index in AI research from Scimago Journal & Country Rank. Available from http://www.scimagojr.com/countryrank.php?category=1702 (accessed July 2017).
18
5
21
2
19
14
6
13
20
4
16
1112
7
3
10
17
1
9
15
8
Artificial Intelligence and Broadband Divide: State of ICT Connectivity in Asia and the Pacific
24
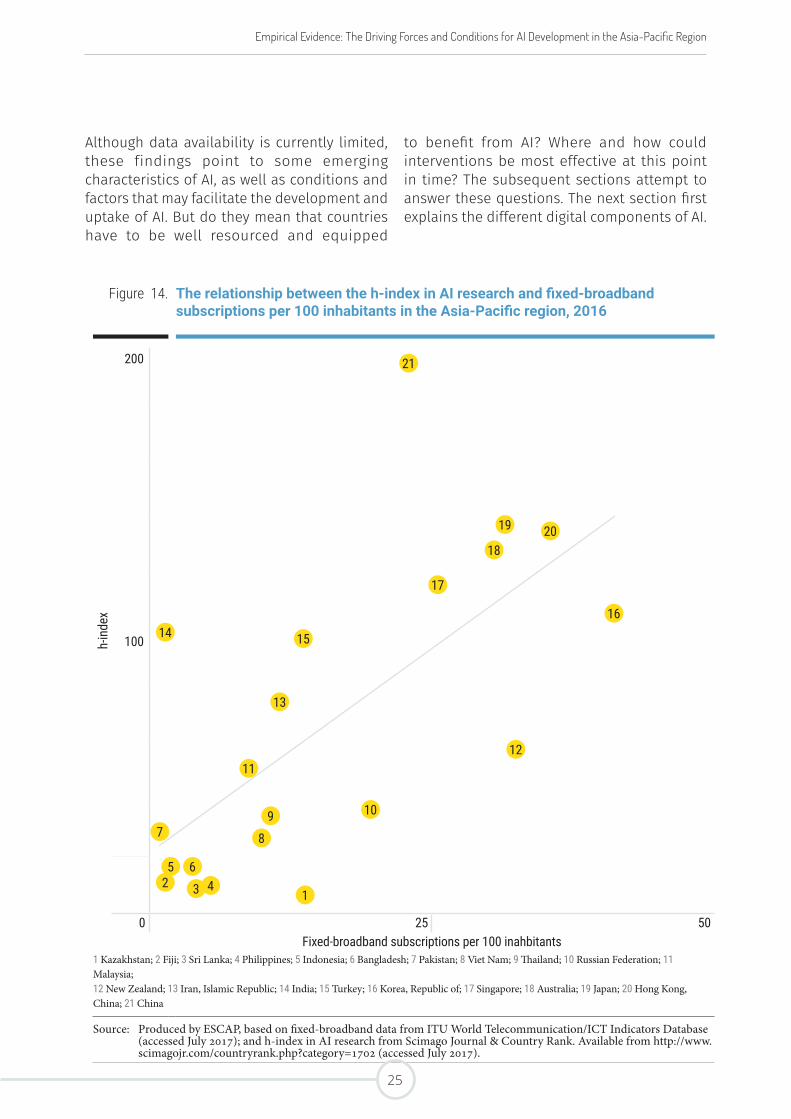
Empirical Evidence: The Driving Forces and Conditions for AI Development in the Asia-Pacific Region
Although data availability is currently limited, these findings point to some emerging characteristics of AI, as well as conditions and factors that may facilitate the development and uptake of AI. But do they mean that countries have to be well resourced and equipped
to benefit from AI? Where and how could interventions be most effective at this point in time? The subsequent sections attempt to answer these questions. The next section first explains the different digital components of AI.
Figure 14. The relationship between the h-index in AI research and fixed-broadband subscriptions per 100 inhabitants in the Asia-Pacific region, 2016
h-in
dex
200
100
0 25 50Fixed-broadband subscriptions per 100 inahbitants
1 Kazakhstan; 2 Fiji; 3 Sri Lanka; 4 Philippines; 5 Indonesia; 6 Bangladesh; 7 Pakistan; 8 Viet Nam; 9 Thailand; 10 Russian Federation; 11 Malaysia;12 New Zealand; 13 Iran, Islamic Republic; 14 India; 15 Turkey; 16 Korea, Republic of; 17 Singapore; 18 Australia; 19 Japan; 20 Hong Kong, China; 21 China
Source: Produced by ESCAP, based on fixed-broadband data from ITU World Telecommunication/ICT Indicators Database (accessed July 2017); and h-index in AI research from Scimago Journal & Country Rank. Available from http://www.scimagojr.com/countryrank.php?category=1702 (accessed July 2017).
18
6
21
2
20
14
5
13
19
1
16
1112
7
4
10
17
3
9
15
8
25

Artificial Intelligence and Broadband Divide: State of ICT Connectivity in Asia and the Pacific
26
5 Digital Components of AI
This section summarizes the characteristics, applications and benefits of the digital components that contribute to AI, introduced
at the beginning of this report (see Figure 1). Each digital component has its own distinctive functions, benefits and technological requirements, and each individual component is an important contributor to the achievement of the SDGs. But when combined, the components can produce transformative AI applications.
27
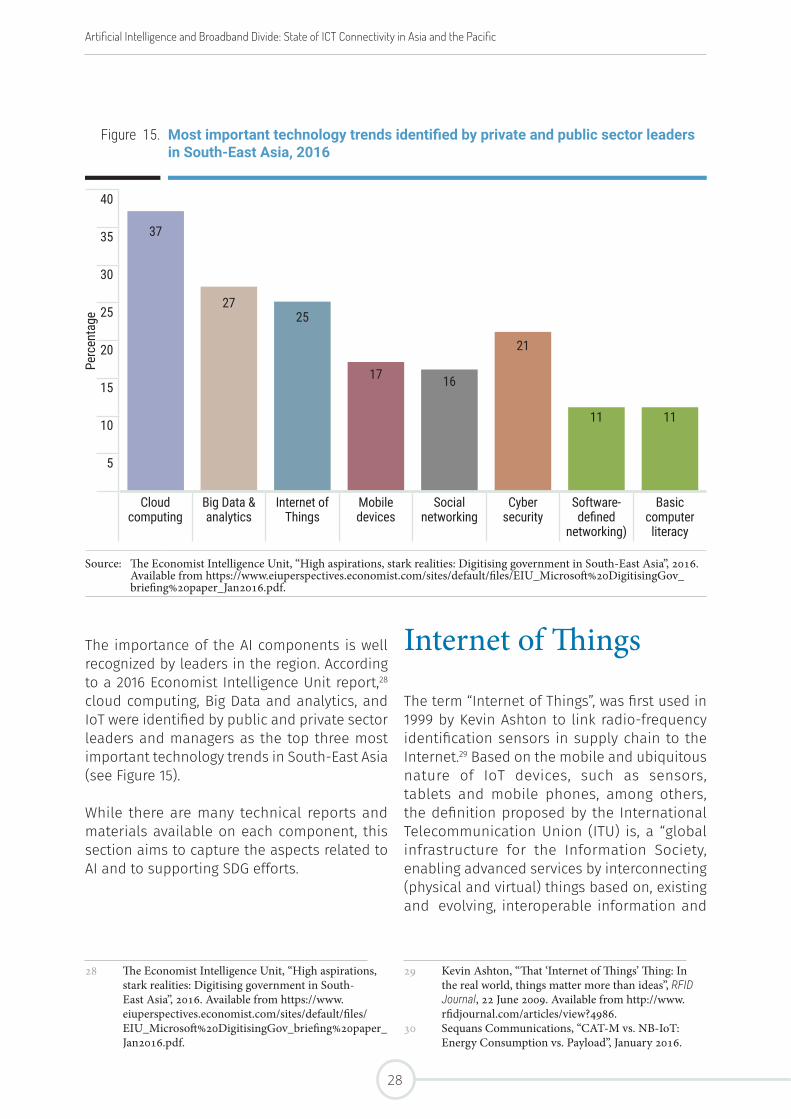
Internet of Things
The term “Internet of Things”, was first used in 1999 by Kevin Ashton to link radio-frequency identification sensors in supply chain to the Internet.29 Based on the mobile and ubiquitous nature of IoT devices, such as sensors, tablets and mobile phones, among others, the definition proposed by the International Telecommunication Union (ITU) is, a “global infrastructure for the Information Society, enabling advanced services by interconnecting (physical and virtual) things based on, existing and30evolving, interoperable information and
29 Kevin Ashton, “That ‘Internet of Things’ Thing: In the real world, things matter more than ideas”, RFID Journal, 22 June 2009. Available from http://www.rfidjournal.com/articles/view?4986.
30 Sequans Communications, “CAT-M vs. NB-IoT: Energy Consumption vs. Payload”, January 2016.
The importance of the AI components is well recognized by leaders in the region. According to a 2016 Economist Intelligence Unit report,28 cloud computing, Big Data and analytics, and IoT were identified by public and private sector leaders and managers as the top three most important technology trends in South-East Asia (see Figure 15).
While there are many technical reports and materials available on each component, this section aims to capture the aspects related to AI and to supporting SDG efforts.
28 The Economist Intelligence Unit, “High aspirations, stark realities: Digitising government in South-East Asia”, 2016. Available from https://www.eiuperspectives.economist.com/sites/default/files/EIU_Microsoft%20DigitisingGov_briefing%20paper_Jan2016.pdf.
Figure 15. Most important technology trends identified by private and public sector leaders in South-East Asia, 2016
Perc
enta
ge
40
37
2725
17 16
21
11 11
35
30
25
20
15
10
5
Cloud computing
Big Data & analytics
Internet of Things
Mobile devices
Social networking
Cyber security
Software-defined
networking)
Basic computer literacy
Source: The Economist Intelligence Unit, “High aspirations, stark realities: Digitising government in South-East Asia”, 2016. Available from https://www.eiuperspectives.economist.com/sites/default/files/EIU_Microsoft%20DigitisingGov_briefing%20paper_Jan2016.pdf.
Artificial Intelligence and Broadband Divide: State of ICT Connectivity in Asia and the Pacific
28
Digital Components of AI
communication technologies”.31 A report by the Internet Society32 highlighted that concerns related to IoT security and privacy, devices interoperability and standards, and regulatory, legal and rights issues, are inhibiting individuals and economies from fully realizing the potential benefits of IoT.
IoT offers the AI layer of connecting data collection and transmission in an ever growing range of socioeconomic sectors, such as agriculture, disaster management, energy, health, trade, transport and infrastructure maintenance, just to name a few. Since there is no standard definition, estimates on the current and future number of IoT devices vary considerably—from 2.1 billion by 2020 (Analysys Mason), to 50 billion by 2020 (Ericsson).33 The International Data Cooperation estimates that there will be 8.6 billion devices driven by IoT in Asia and the
31 ITU, “New ITU standards define the Internet of Things and provide the blueprints for its development”, 4 July 2012. Available from http://www.itu.int/ITU-T/newslog/New+ITU+Standards+Define+The+Internet+Of+Things+And+Provide+The+Blueprints+For+Its+Development.aspx.
32 Internet Society, “The Internet of Things: An Internet Society Public Policy Briefing”, 2 August 2016. Available from https://www.internetsociety.org/wp-content/uploads/2017/09/ISOC-PolicyBrief-IoT.pdf.
33 ITU and Cisco Systems, Harnessing the Internet of Things for Global Development: A Contribution to the UN Broadband Commission for Sustainable Development (Geneva, 2016). Available from https://www.itu.int/en/action/broadband/Documents/Harnessing-IoT-Global-Development.pdf.
Pacific (excluding Japan) by 2020. China alone is predicted to reach 486 million IoT connections by 2025.34 How ever IoT is defined though, there is consensus that IoT is a disruptive technology with transformative impact on the economy and society, and has the potential to increase both the efficiency and effectiveness of development interventions.
Cloud Computing
Cloud computing is defined as a model for enabling a shared pool of computing resources (e.g., networks, servers, storage, applications and services) on demand that can be rapidly released.35 Cloud services have become a powerful architecture to perform complex large-scale computing tasks, and span a range of ICT functions from storage and computation
34 James Barton, “GSMA Mobile IoT Initiative underway with China at forefront of LPWA development”, Developing Telecoms, 28 June 2017. Available from https://www.developingtelecoms.com/tech/iot-m2m-uc/7155-gsma-mobile-iot-initiative-underway-with-china-at-forefront-of-lpwa-development.html.
35 Peter Mell and Tim Grance, “The NIST Definition of Cloud Computing”, 10 July 2009. Available from https://www.nist.gov/sites/default/files/documents/itl/cloud/cloud-def-v15.pdf.
Box 2. Supporting Technologies to Broaden the Internet of Things
In leveraging IoT, supporting technologies such as the low-power, wide–area wireless technology (LPWA), Narrowband IoT, LoRa technology and Sigfox networks play an important role. These modern technologies have been designed to connect a significantly higher number of devices (tens of billions) to support the development of IoT at lower costs and higher coverage. They are likely to have a notable impact on the future of IoT innovation and offer solutions to the challenges of deploying IoT, such as communication distance, power consumption, monthly fee and infrastructure installation cost.
For example, LPWA provides an alternative to the traditional wide-area network technologies that have relatively short range coverage and limited battery efficiency. LPWA is characterized by very low-power consumption and improved battery efficiency, which means that a battery life can reach 10 years or more. LPWA is optimized to transfer data at very low unit cost, and provides extended coverage, enabling connectivity in rural and underground locations. LPWA’s security is also well adapted to ensure appropriate authentication to the IoT applications.23
29
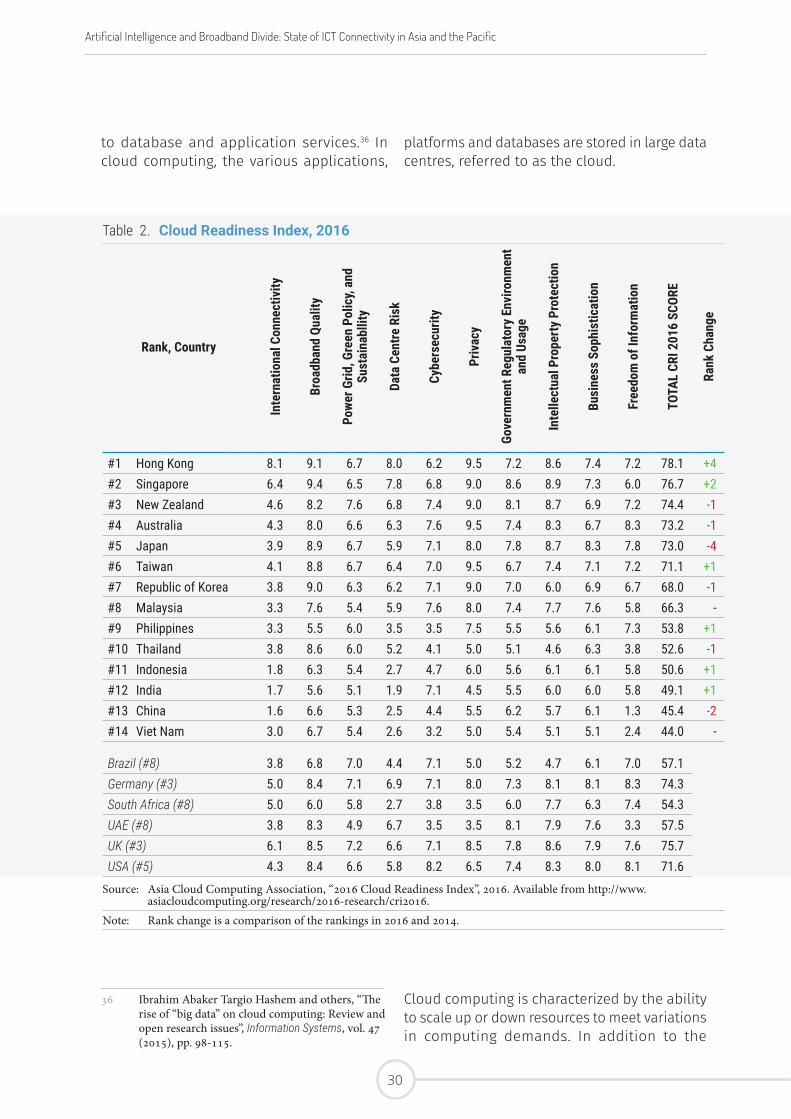
to database and application services.36 In cloud computing, the various applications,
36 Ibrahim Abaker Targio Hashem and others, “The rise of “big data” on cloud computing: Review and open research issues”, Information Systems, vol. 47 (2015), pp. 98-115.
Table 2. Cloud Readiness Index, 2016
Rank, Country
Inte
rnat
iona
l Con
nect
ivity
Broa
dban
d Qu
ality
Powe
r Grid
, Gre
en P
olic
y, an
d Su
stai
nabl
lity
Data
Cen
tre R
isk
Cybe
rsec
urity
Priv
acy
Gove
rnm
ent R
egul
ator
y En
viro
nmen
t an
d Us
age
Inte
llect
ual P
rope
rty P
rote
ctio
n
Busi
ness
Sop
hist
icat
ion
Free
dom
of I
nfor
mat
ion
TOTA
L CR
I 201
6 SC
ORE
Rank
Cha
nge
#1 Hong Kong 8.1 9.1 6.7 8.0 6.2 9.5 7.2 8.6 7.4 7.2 78.1 +4#2 Singapore 6.4 9.4 6.5 7.8 6.8 9.0 8.6 8.9 7.3 6.0 76.7 +2#3 New Zealand 4.6 8.2 7.6 6.8 7.4 9.0 8.1 8.7 6.9 7.2 74.4 -1#4 Australia 4.3 8.0 6.6 6.3 7.6 9.5 7.4 8.3 6.7 8.3 73.2 -1#5 Japan 3.9 8.9 6.7 5.9 7.1 8.0 7.8 8.7 8.3 7.8 73.0 -4#6 Taiwan 4.1 8.8 6.7 6.4 7.0 9.5 6.7 7.4 7.1 7.2 71.1 +1#7 Republic of Korea 3.8 9.0 6.3 6.2 7.1 9.0 7.0 6.0 6.9 6.7 68.0 -1#8 Malaysia 3.3 7.6 5.4 5.9 7.6 8.0 7.4 7.7 7.6 5.8 66.3 -#9 Philippines 3.3 5.5 6.0 3.5 3.5 7.5 5.5 5.6 6.1 7.3 53.8 +1#10 Thailand 3.8 8.6 6.0 5.2 4.1 5.0 5.1 4.6 6.3 3.8 52.6 -1#11 Indonesia 1.8 6.3 5.4 2.7 4.7 6.0 5.6 6.1 6.1 5.8 50.6 +1#12 India 1.7 5.6 5.1 1.9 7.1 4.5 5.5 6.0 6.0 5.8 49.1 +1#13 China 1.6 6.6 5.3 2.5 4.4 5.5 6.2 5.7 6.1 1.3 45.4 -2#14 Viet Nam 3.0 6.7 5.4 2.6 3.2 5.0 5.4 5.1 5.1 2.4 44.0 -
Brazil (#8) 3.8 6.8 7.0 4.4 7.1 5.0 5.2 4.7 6.1 7.0 57.1 Germany (#3) 5.0 8.4 7.1 6.9 7.1 8.0 7.3 8.1 8.1 8.3 74.3 South Africa (#8) 5.0 6.0 5.8 2.7 3.8 3.5 6.0 7.7 6.3 7.4 54.3 UAE (#8) 3.8 8.3 4.9 6.7 3.5 3.5 8.1 7.9 7.6 3.3 57.5 UK (#3) 6.1 8.5 7.2 6.6 7.1 8.5 7.8 8.6 7.9 7.6 75.7 USA (#5) 4.3 8.4 6.6 5.8 8.2 6.5 7.4 8.3 8.0 8.1 71.6
Source: Asia Cloud Computing Association, “2016 Cloud Readiness Index”, 2016. Available from http://www.asiacloudcomputing.org/research/2016-research/cri2016.
Note: Rank change is a comparison of the rankings in 2016 and 2014.
platforms and databases are stored in large data centres, referred to as the cloud.
Cloud computing is characterized by the ability to scale up or down resources to meet variations in computing demands. In addition to the
Artificial Intelligence and Broadband Divide: State of ICT Connectivity in Asia and the Pacific
30
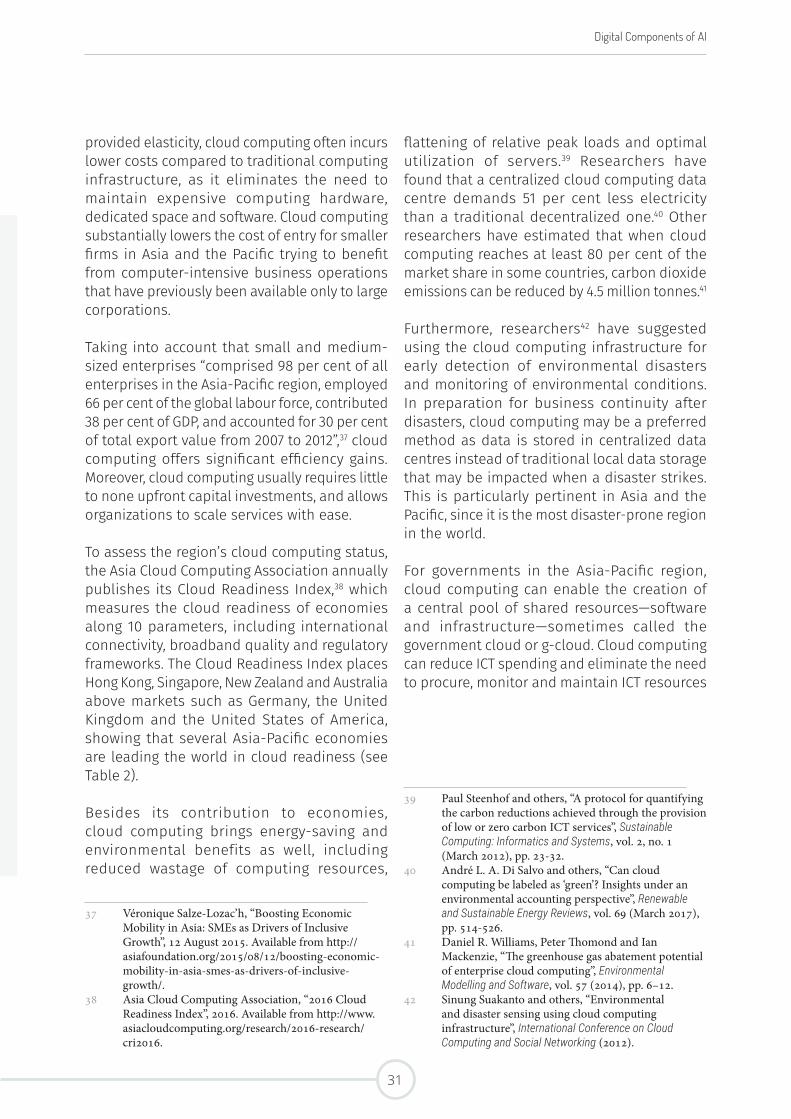
Digital Components of AI
provided elasticity, cloud computing often incurs lower costs compared to traditional computing infrastructure, as it eliminates the need to maintain expensive computing hardware, dedicated space and software. Cloud computing substantially lowers the cost of entry for smaller firms in Asia and the Pacific trying to benefit from computer-intensive business operations that have previously been available only to large corporations.
Taking into account that small and medium-sized enterprises “comprised 98 per cent of all enterprises in the Asia-Pacific region, employed 66 per cent of the global labour force, contributed 38 per cent of GDP, and accounted for 30 per cent of total export value from 2007 to 2012”,37 cloud computing offers significant efficiency gains. Moreover, cloud computing usually requires little to none upfront capital investments, and allows organizations to scale services with ease.
To assess the region’s cloud computing status, the Asia Cloud Computing Association annually publishes its Cloud Readiness Index,38 which measures the cloud readiness of economies along 10 parameters, including international connectivity, broadband quality and regulatory frameworks. The Cloud Readiness Index places Hong Kong, Singapore, New Zealand and Australia above markets such as Germany, the United Kingdom and the United States of America, showing that several Asia-Pacific economies are leading the world in cloud readiness (see Table 2).
Besides its contribution to economies, cloud computing brings energy-saving and environmental benefits as well, including reduced wastage of computing resources,
37 Véronique Salze-Lozac’h, “Boosting Economic Mobility in Asia: SMEs as Drivers of Inclusive Growth”, 12 August 2015. Available from http://asiafoundation.org/2015/08/12/boosting-economic-mobility-in-asia-smes-as-drivers-of-inclusive-growth/.
38 Asia Cloud Computing Association, “2016 Cloud Readiness Index”, 2016. Available from http://www.asiacloudcomputing.org/research/2016-research/cri2016.
flattening of relative peak loads and optimal utilization of servers.39 Researchers have found that a centralized cloud computing data centre demands 51 per cent less electricity than a traditional decentralized one.40 Other researchers have estimated that when cloud computing reaches at least 80 per cent of the market share in some countries, carbon dioxide emissions can be reduced by 4.5 million tonnes.41
Furthermore, researchers42 have suggested using the cloud computing infrastructure for early detection of environmental disasters and monitoring of environmental conditions. In preparation for business continuity after disasters, cloud computing may be a preferred method as data is stored in centralized data centres instead of traditional local data storage that may be impacted when a disaster strikes. This is particularly pertinent in Asia and the Pacific, since it is the most disaster-prone region in the world.
For governments in the Asia-Pacific region, cloud computing can enable the creation of a central pool of shared resources—software and infrastructure—sometimes called the government cloud or g-cloud. Cloud computing can reduce ICT spending and eliminate the need to procure, monitor and maintain ICT resources
39 Paul Steenhof and others, “A protocol for quantifying the carbon reductions achieved through the provision of low or zero carbon ICT services”, Sustainable Computing: Informatics and Systems, vol. 2, no. 1 (March 2012), pp. 23-32.
40 André L. A. Di Salvo and others, “Can cloud computing be labeled as ‘green’? Insights under an environmental accounting perspective”, Renewable and Sustainable Energy Reviews, vol. 69 (March 2017), pp. 514-526.
41 Daniel R. Williams, Peter Thomond and Ian Mackenzie, “The greenhouse gas abatement potential of enterprise cloud computing”, Environmental Modelling and Software, vol. 57 (2014), pp. 6–12.
42 Sinung Suakanto and others, “Environmental and disaster sensing using cloud computing infrastructure”, International Conference on Cloud Computing and Social Networking (2012).
Table 2. Cloud Readiness Index, 2016
Rank, Country
Inte
rnat
iona
l Con
nect
ivity
Broa
dban
d Qu
ality
Powe
r Grid
, Gre
en P
olic
y, an
d Su
stai
nabl
lity
Data
Cen
tre R
isk
Cybe
rsec
urity
Priv
acy
Gove
rnm
ent R
egul
ator
y En
viro
nmen
t an
d Us
age
Inte
llect
ual P
rope
rty P
rote
ctio
n
Busi
ness
Sop
hist
icat
ion
Free
dom
of I
nfor
mat
ion
TOTA
L CR
I 201
6 SC
ORE
Rank
Cha
nge
#1 Hong Kong 8.1 9.1 6.7 8.0 6.2 9.5 7.2 8.6 7.4 7.2 78.1 +4#2 Singapore 6.4 9.4 6.5 7.8 6.8 9.0 8.6 8.9 7.3 6.0 76.7 +2#3 New Zealand 4.6 8.2 7.6 6.8 7.4 9.0 8.1 8.7 6.9 7.2 74.4 -1#4 Australia 4.3 8.0 6.6 6.3 7.6 9.5 7.4 8.3 6.7 8.3 73.2 -1#5 Japan 3.9 8.9 6.7 5.9 7.1 8.0 7.8 8.7 8.3 7.8 73.0 -4#6 Taiwan 4.1 8.8 6.7 6.4 7.0 9.5 6.7 7.4 7.1 7.2 71.1 +1#7 Republic of Korea 3.8 9.0 6.3 6.2 7.1 9.0 7.0 6.0 6.9 6.7 68.0 -1#8 Malaysia 3.3 7.6 5.4 5.9 7.6 8.0 7.4 7.7 7.6 5.8 66.3 -#9 Philippines 3.3 5.5 6.0 3.5 3.5 7.5 5.5 5.6 6.1 7.3 53.8 +1#10 Thailand 3.8 8.6 6.0 5.2 4.1 5.0 5.1 4.6 6.3 3.8 52.6 -1#11 Indonesia 1.8 6.3 5.4 2.7 4.7 6.0 5.6 6.1 6.1 5.8 50.6 +1#12 India 1.7 5.6 5.1 1.9 7.1 4.5 5.5 6.0 6.0 5.8 49.1 +1#13 China 1.6 6.6 5.3 2.5 4.4 5.5 6.2 5.7 6.1 1.3 45.4 -2#14 Viet Nam 3.0 6.7 5.4 2.6 3.2 5.0 5.4 5.1 5.1 2.4 44.0 -
Brazil (#8) 3.8 6.8 7.0 4.4 7.1 5.0 5.2 4.7 6.1 7.0 57.1 Germany (#3) 5.0 8.4 7.1 6.9 7.1 8.0 7.3 8.1 8.1 8.3 74.3 South Africa (#8) 5.0 6.0 5.8 2.7 3.8 3.5 6.0 7.7 6.3 7.4 54.3 UAE (#8) 3.8 8.3 4.9 6.7 3.5 3.5 8.1 7.9 7.6 3.3 57.5 UK (#3) 6.1 8.5 7.2 6.6 7.1 8.5 7.8 8.6 7.9 7.6 75.7 USA (#5) 4.3 8.4 6.6 5.8 8.2 6.5 7.4 8.3 8.0 8.1 71.6
Source: Asia Cloud Computing Association, “2016 Cloud Readiness Index”, 2016. Available from http://www.asiacloudcomputing.org/research/2016-research/cri2016.
Note: Rank change is a comparison of the rankings in 2016 and 2014.
31
within government offices.43 Cloud computing is considered “a key resource to achieve ICT development”.44
Figure 16 summarizes the responses to a survey conducted by the Economist Intelligence Unit in 2016 in which public and private sector leaders and managers in South-East Asia were asked
43 Arun Chandrasekaran and Mayank Kapoor, “State of Cloud Computing in the Public Sector – A Strategic analysis of the business case and overview of initiatives across Asia Pacific”, Frost & Sullivan, 11 May 2011. Available from http://www.frost.com/sublib/display-market-insight.do?id=232651031.
44 ITU, “How can cloud computing help with sustainable development? Microsoft’s Astrid Tuminez explains at #ITUWorld (VIDEO)”, 16 November 2016. Available from http://news.itu.int/how-can-cloud-computing-help-with-sustainable-development-microsofts-astrid-tuminez-explains-at-ituworld-video/.
about the importance of cloud computing in various sectors. It shows that social sectors, such as health and education, are expected to benefit from cloud computing.
Broadband connectivity is generally recognized as a key requisite to reaping the full benefits of cloud computing. Given the fact that Asia and the Pacific is characterized by a significant digital divide, and many people and organizations are not yet subscribed to broadband connectivity,45 the potential benefits of cloud computing are
45 ESCAP, “State of ICT in Asia and the Pacific 2016: Uncovering the Widening Broadband Divide”, Technical Paper by the Information and Communications Technology and Disaster Risk Reduction Division, 2016. Available from http://www.unescap.org/resources/state-ict-asia-and-pacific-2016-uncovering-widening-broadband-divide.
Figure 16. The Importance of cloud computing in various socioeconomic sectors, 2016
Perc
enta
ge
100
59
5145
3126
33
3
50
0.0 Health Education Finance (e.g. taxes)
Social security welfare
Labour/employment
Security/policing
Don’t know
Source: The Economist Intelligence Unit, “High aspirations, stark realities: Digitising government in South-East Asia”, 2016. Available from https://www.eiuperspectives.economist.com/sites/default/files/EIU_Microsoft%20DigitisingGov_briefing%20paper_Jan2016.pdf.
Artificial Intelligence and Broadband Divide: State of ICT Connectivity in Asia and the Pacific
32
Digital Components of AI
not accessible to everyone in the region, as Section 7 illustrates.46 Before discussing the infrastructural layer, this section reviews the implication of Big Data, as cloud computing is intricately linked to it.
Big Data
Data is considered the “new oil”47 that provides strategic insights and new knowledge in a wide variety of socioeconomic contexts, including predicting customer preferences, medical diagnostics and conflict prevention. With an ever increasing range of Big Data analytics tools and capabilities, the importance of data as a resource is expected to intensify in the coming years. This section aims to illustrate some of the features and strands of Big Data that are expected to impact socioeconomic development in the region.
There are a number of definitions of Big Data, but perhaps the most well-known one comes from IBM,48 which suggests that Big Data can be characterized by any or all of three “V” words—volume, variety and velocity—to investigate situations and events. Big Data is also an umbrella term for, “the large amounts of digital data continually generated from various devices being used by the global population, often including emerging technological capabilities, in solving complex tasks”.49 Here, Big Data is linked to IoT in that the sensors and devices are channels for data collection. The extremely large data sets are then analysed using various
46 See Annex 5 for a discussion on cloud computing challenges.
47 The Economist, “The world’s most valuable resource is no longer oil, but data”, 6 May 2017. Available from https://www.economist.com/news/leaders/21721656-data-economy-demands-new-approach-antitrust-rules-worlds-most-valuable-resource.
48 Paul Zikopoulos and others, Harness the Power of Big Data: The IBM Big Data Platform (McGraw-Hill Companies, 2013). Available from ftp://public.dhe.ibm.com/software/pdf/at/SWP10/Harness_the_Power_of_Big_Data.pdf.
49 United Nations Global Pulse, June 2013.
tools. Data analysis tools have become more advanced in the last few years, including predictive analytics, data mining, case-based reasoning and machine learning.
Predictive analytics50 is increasingly being used by organizations in the decision-making process to drive their returns on investment. The process that underlies predictive analytics is predictive modelling, a machine learning technique. Based on a large volume of data, the software uses algorithms to find patterns and produce accurate predictions. When the data available is unstructured (i.e., text, video, images, sound), extraction techniques are employed to pull out useful data that can ensure meaningful analyses. These results provide support for decision makers or even allow for the automation of decision-making, speeding the business flow without increasing risks.
Data mining tools and processes are playing an increasingly important role in various decision-making. Data mining adds value to businesses as it allows users to gain competitive edge by providing real-time analysis of large data sets to predict trends and behaviours,andidentifyunknown patterns.51 But predictive analytics goes beyond data mining, increasing efficiency in a wide range of fields including banking, health care and marketing through applications such as credit scoring (predicting the risk of taking a loss), cardiac risk (assessing the risk of a heart attack for a patient), and pricing optimizer (determining the best price strategy).52 These tools can help companies discover new business opportunities by providing insight into customers’ behaviours.
50 CGI, “Predictive analytics: The rise and value of predictive analytics in enterprise decision making”, White Paper, 2013. Available from https://www.cgi.com/sites/default/files/white-papers/Predictive-analytics-white-paper.pdf.
51 An Introduction to Data Mining. Available from http://www.thearling.com/text/dmwhite/dmwhite.htm.
52 CGI, “Predictive analytics: The rise and value of predictive analytics in enterprise decision making”, White Paper, 2013. Available from https://www.cgi.com/sites/default/files/white-papers/Predictive-analytics-white-paper.pdf.
33
Case-based reasoning is an AI technique that uses concrete problem-solving experience (cases) to solve current problems that have similar characteristics. Case-based reasoning has applications in many fields, particularly in the experimental sciences where problem-solving experience is abundant. In the medical domain, for example, knowledge from prior cases can be used by clinicians to diagnose and treat patients. In the past two decades, over 130major companies have used case-based reasoning applications to enhance their problem-solving techniques.53
Machine learning refers to the ability of computers to learn from examples and apply that knowledge to solve a particular problem. The experience is obtained through interaction with a user who trains the computer to look for a particular answer (target function). Depending on the given problem and target function, different machine learning algorithms54 may be used to ensure the best performance. Machine learning techniques benefit from the ability to adapt to a changing environment and can bring practical value to data mining challenges, for example in dealing with large data sets, or to domains that are not well understood by humans or require effective algorithms that can dynamically adapt to new situations.
53 Shaker H. El-Sappagh and Mohammed Elmogy, “Case Based Reasoning: Case Representation Methodologies”, International Journal of Advanced Computer Science and Applications, vol.6, no. 11 (2015), pp. 192-208. Available from https://thesai.org/Downloads/Volume6No11/Paper_26-Case_Based_Reasoning_Case_Representation_Methodologies.pdf.
54 A detailed description of how the algorithms function can be found in: Maja Pantic, “Introduction to Machine Learning and Case-Based Reasoning”, Computing Department, Imperial College London, undated, pp. 5-7. Available from https://ibug.doc.ic.ac.uk/media/uploads/documents/courses/syllabus-CBR.pdf.
Machines are increasingly able to understand speech. Apple’s Siri and Microsoft’s Cortana assistants are already able to understand and react to various commands. Amazon’s Echo is able to order products off Amazon. IBM has recently announced a new industry record in speech recognition of 5.5 per cent error rate. While efforts have focused mainly on widely-spoken languages, strides have also been made in automatic speech recognition for under-resourced languages. In the not too distant future, AI-based speech recognition and processing will enable the disadvantaged to gain access to services currently available only to the literate. Some examples of the actual applications and usage of Big Data can be found in Section 6, which includes detecting illnesses and enhancing business insights, among others.
Artificial Intelligence and Broadband Divide: State of ICT Connectivity in Asia and the Pacific
34
6 Achieving the SDGs through AI-Induced Transformations
AI and its digital components provide untapped opportunities towards achieving the SDGs. Through interconnected IoTs using broadband
Internet, Big Data (from various sectors at the household level) can be collected and then analysed by programmed codes and software (AI) to provide timely smart solutions for society. AI-enabled smart solutions promise to transform many sectors including health care, education and agriculture, accelerate the alleviation of poverty, and help deal with humanitarian crises and violent conflicts.55
55 Anwaar Ali and others, “Big data for development: Applications and techniques”, Big Data Analytics (2016).
35

AI technologies to power image recognition, precision agriculture and chatbots (using natural language) could arguably be the most significant poverty alleviation strategy to date.
A number of initiatives in the Asia-Pacific region are using AI in agriculture, For example, Xinjiang, China is rolling out a mobile application that uses IoT for agriculture. Many districts in Xinjiang have used the application for building and monitoring greenhouses, for automatic water-saving drip irrigation, and for water quality monitoring of fresh water aquaculture.
An India-based company is providing remote control access to farmers’ irrigation pumps, discontinuing the need for manual operation, which often requires laborious and time-consuming journeys. The sensors can also check the availability of water and electricity.
In Sri Lanka’s tea plantations, wireless sensor networks are being used to monitor soil moisture, and nutrient and acidity levels. The networks are powered by solar panels and the data is transmitted wirelessly.61
Myanmar, one of the LDCs, has used drones to effectively plant a million mangrove trees. The drones record aerial pictures and capture soil and humidity conditions. The analysed data is then used to select appropriate species and locations for planting.62
Thailand’s Ministry of Agriculture has provided analysed data to farmers to help them make decisions on the type of crops to harvest in order
61 ITU and Cisco Systems, Harnessing the Internet of Things for Global Development: A Contribution to the UN Broadband Commission for Sustainable Development (Geneva, 2016). Available from https://www.itu.int/en/action/broadband/Documents/Harnessing-IoT-Global-Development.pdf.
62 Thin Lei Win, “Mangrove-planting drones on a mission to restore Myanmar delta”, Reuters, 21 August 2017. Available from https://www.reuters.com/article/us-myanmar-environment-mangroves-tech/mangrove-planting-drones-on-a-mission-to-restore-myanmar-delta-idUSKCN1B10EQ.
AI-enabled smart solutions have contributed to smart farming in China56 to enhance agricultural productivity; smart business banking in Fiji;57 smart energy strategy being developed in the Russian Federation to improve energy efficiency;58 and smart nation building in Singapore59 to empower people and improve lives, among other initiatives. Selected AI-enabled opportunities and challenges for the Asia-Pacific region are discussed below.
Agriculture
AI technologies have been contributing to increased agricultural productivity in developing countries. Recent advances in image recognition, for instance, have allowed researchers to use a database of more than 50,000 photos of diseased plants to identify crop diseases on site with over 99 per cent accuracy.60
IoT devices have enabled precision agriculture through their collection and processing of data in real time to help farmers make decisions on planting and harvesting, irrigation, fertilization, and pesticide application, which can significantly increase crop yields.
Given that a substantial portion of employment in the Asia-Pacific region is in agriculture (generally, the less developed the country, the greater is that economy’s reliance on agriculture), having
56 Far Eastern Agriculture, “Chinese province launches smart farm”, 5 May 2015. Available from http://www.fareasternagriculture.com/crops/agriculture/chinese-province-launches-smart-farm.
57 Bank South Pacific, “Smart Business Banking”. Available from http://www.bsp.com.fj/Smart-Business-Banking/Smart-Business-Banking.aspx.
58 Analytical Center for the Government of the Russian Federation, “Russia is Developing a Smart Energy System”, 15 November 2016. Available from http://ac.gov.ru/en/events/010635.html.
59 Smart Nation Singapore. Available from https://www.smartnation.sg.
60 News Mediacom, “PlantVillage: A deep-learning app diagnoses crop diseases”, 4 October 2016. Available from https://actu.epfl.ch/news/plantvillage-a-deep-learning-app-diagnoses-crop-di/.
Artificial Intelligence and Broadband Divide: State of ICT Connectivity in Asia and the Pacific
36
Achieving the SDGs through AI-Induced Transformations
to maintain food prices stability.63 Additionally, an initiative on precision agriculture led by Mahidol University is helping farmers reduce the cost of farming and the environmental effect of chemical waste.64
Health and Well-Being
Many developing countries are endemically short of medical professionals, and AI applications have the potential to fill the gap. Advances in ICT have already improved the diagnosis of diseases, and a number of applications that analyse medical images are being used to substitute and complement highly educated and expensive expertise. The application of AI in medical research has enhanced the accuracy and efficiency of diagnosis of diseases like breast and thyroid cancers, which in turn contributes to the improvement of health and well-being, particularly women’s (see Annex 10). An experiment that tested the use of AI algorithms against 21 trained oncologists to detect cancer found that the AI application performed just as well as the doctors.65 The emergence of AI services in the Asia-Pacific countries has not only supported doctors to monitor and diagnose more efficiently, but has also expanded medical care services to the rural areas.
63 Charlene Chin, “Why is Smart Farming Asia’s big new trend?” GovInsider, 31 August 2016. Available from https://govinsider.asia/smart-gov/why-is-smart-farming-suddenly-so-cool/.
64 Jon Fernquest, “Farming with robots & drones”, Bangkok Post, 19 March 2015. Available from http://www.bangkokpost.com/learning/learning-news/501958/farming-with-robots-drones.
65 James Gallagher, “Artificial intelligence ‘as good as cancer doctors’”, BBC, 26 January 2017. Available from http://www.bbc.com/news/health-38717928.
Water and Sanitation
One in ten people in the world do not have access to clean water, and 2.4 billion people worldwide do not have access to improved sanitation facilities.66 In less developed countries, particularly, access to clean water and sanitation is a serious concern, and IoTs can help improve the access and quality of water and sanitation.67 For example in Bangladesh, where tens of millions of people in the Ganges Delta drink groundwater that is contaminated with arsenic, a network of 48 sensors is being used to monitor water quality.68 Smart water meters are helping to remotely monitor water quality and quantity. Instead of costly and infrequent visits to monitor water sources, such as hand pumps, sensors ensure continuous monitoring so that issues can be addressed in a timely manner.69 It is reported that over 1,000 sensors
66 UNICEF and WHO, Progress on Sanitation and Drinking Water: 2015 Update and MDG Assessment (Geneva and New York, 2015). Available from http://apps.who.int/iris/bitstream/10665/177752/1/9789241509145_eng.pdf.
67 Mercy Corps, as part of an intervention programme in Indonesia, installed sensors to monitor the use of handwashing stations after using the toilets, and results showed that self-reported data on handwashing practices was consistently higher than actual practices. The authors of the study argue that remote data access may have the potential to enhance data collection and complement survey and observation methods at a lower per-sample cost. See Evan A. Thomas and Kay Mattson, “Instrumented Monitoring with Traditional Public Health Evaluation Methods: An application to a Water, Sanitation and Hygiene Program in Jakarta, Indonesia”, Mercy Corps, undated. Available from https://www.mercycorps.org/sites/default/files/Instrumented%20Monitoring%20Indonesia.pdf.
68 Marco Zennaro, Bjorn Pehrson and Antoine Bagula, “Wireless Sensor Networks: A great opportunity for researchers in Developing Countries”, Proceedings of WCITD2008 Conference, Pretoria, South Africa, vol. 67 (2008). Available from http://users.ictp.it/~mzennaro/WSN4D.pdf.
69 SweetSense, “SweetSense Inc. measures impact in global health programs”. Available from http://www.sweetsensors.com.
37
have been installed on water pumps, latrines and hand-washing stations in 15 countries.70
Energy
Energy is a cornerstone for sustainable development in the region. Faced with an increasing demand for renewable energy, countries in the region may benefit from AI in hybrid energy system optimization.71 Smart grids, in particular, present an important opportunity to transform the energy sector by making the electrical system more reliable, safe and cost-effective. The introduction of ICT into electricity grids allows for the collection of data that can help both consumers and producers better understand the dynamics of energy use, enabling them to optimize the service. Data collected from smart grids makes possible the automated and real-time management of the electrical network, leading to opportunities for energy efficiency that can impact both the costs and the environment in a positive manner.72
70 Catherine Cheney, “The ‘internet of things’ is narrowing the gap between data and action”, Devex, 13 June 2016. Available from https://www.devex.com/news/the-internet-of-things-is-narrowing-the-gap-between-data-and-action-88243.
71 Seyed Mojib Zahraee, Morteza Khalaji Assadi and Saidur Rahman, “Application of Artificial Intelligence Methods for Hybrid Energy System Optimization”, Renewable and Sustainable Energy Reviews, vol. 66 (2016), pp. 617-630.
72 Houda Daki and others, “Big data management in smart grid: Concepts, requirements and implementation”, Journal of Big Data (2017). Available from https://journalofbigdata.springeropen.com/articles/10.1186/s40537-017-0070-y.
Decent Work and Economic Growth
A 2016 WEF report73 stated that AI and automation will replace 5 million human jobs in major developed and emerging economies by 2020. The WEF report estimated that 7.1 million jobs could be lost through redundancy and automation, while 2.1 million new jobs will be created mainly in more specialized areas such as computing, mathematics, architecture and engineering. According to McKinsey,74 78 per cent of predictable physical work (e.g., welding and soldering on an assembly line) and 25 per cent of unpredictable physical work (e.g., construction and forestry) can be automated by adapting currently demonstrated technology.
Automation enabled by advances in the AI field will change production processes, as well as the type of human activities needed in the production of goods and services. In this regard, whether manual or cognitive, high-routine occupations will be directly challenged by automation. However, the threat posed by automation on existing jobs in economically-advanced countries is likely to be less marked than previously thought. Taking into account the diversity of task content within jobs, a recent study estimated that 9 per cent of occupations in a sample of 21 countries of the Organisation for Economic Co-operation and Development (OECD) are at high risk of automation. In the Republic of Korea and Japan, which are the only two ESCAP member countries examined in the study, 6 and 7 per cent of jobs are automatable, respectively. The two countries are ranked in the
73 WEF, “The Future of Jobs. Employment, Skills and Workforce Strategy for the Fourth Industrial Revolution”, January 2016. Available from http://www3.weforum.org/docs/WEF_Future_of_Jobs.pdf.
74 McKinsey Global Institute, “Artificial Intelligence: The Next Digital Frontier?” Discussion Paper, June 2017. Available from http://www.mckinsey.com/~/media/McKinsey/Industries/Advanced%20Electronics/Our%20Insights/How%20artificial%20intelligence%20can%20deliver%20real%20value%20to%20companies/MGI-Artificial-Intelligence-Discussion-paper.ashx.
Artificial Intelligence and Broadband Divide: State of ICT Connectivity in Asia and the Pacific
38
Achieving the SDGs through AI-Induced Transformations
top four of OECD countries with the lowest risk of automation on jobs.75
Middle-income countries in the Asia-Pacific region are likely to be subject to different dynamics and effects induced by AI-based automation compared to OECD economies. Countries such as China, India, Indonesia, Malaysia and Thailand tend to show a large potential for automation due to the size of their respective workforce and their relatively high share of automatable activities. Nonetheless, factors such as modest ICT infrastructure development, low education levels and unfavourable institutional environments may significantly hinder automation adoption. Notably, the cost of labour-saving technologies relative to wages will be a critical parameter in determining the extent and speed at which companies will adopt AI-based automation solutions in middle-income countries.
Resilient Infrastructure, Sustainable Industrialization and Innovation
Given that Asia and the Pacific is the most disaster prone region in the world with 1.4 billion people affected by disasters in the period from 2005-2014,76 disaster risk reduction is of
75 The study also notes that the heterogeneity in terms of the share of automatable occupations across countries in the sample may be attributable to various parameters such as differences in terms of educational attainment in the workforce and investment in technologies, in addition to the fact that countries are characterized by different ways of organizing work.
76 ESCAP, “Asia-Pacific Disaster Report 2015”, 2015. Available from http://www.unescap.org/publications/asia-pacific-disaster-report-2015.
great importance. AI-based methods are being applied to regional flood frequency analysis, which is critical for the design, planning and operation of infrastructure projects such as bridges and dams. Artificial neural networks have proven useful in regional flood modelling and have been applied successfully to a range of hydrological problems in Australia.77
IoT technologies have been used to enhance the region’s resilience to disasters, particularly through the real-time monitoring of hazards and assessment of risks. Kinetic sensors have been installed at the bottom of the Indian Ocean to detect waves and water flows, and transmit data via sonic buoys and satellite links to emergency agencies. Drones have been used to effectively assess damage after disasters, such as the series of earthquakes in Nepal in 2015.78 In the south of Thailand, a network of cameras provides real-time monitoring of water flows, and uses close-circuit television to aid with warnings of potential floods.79
Sustainable Cities and Communities
Some countries in Asia and the Pacific are investing in smart cities that harness the digital components of AI to improve urban policies and operations. At the same time, smart buildings and homes, smart grids, smart transportation
77 Kashif Aziz and others, “Flood estimation in ungauged catchments: Application of artificial intelligence based methods for Eastern Australia”, Stochastic Environmental Research and Risk Assessment (2016), pp. 1-16.
78 ESCAP, “ICT in Disaster Risk Management Initiatives in Asia and the Pacific”, 2016. Available from http://www.unescap.org/sites/default/files/ICT4DRR%20Iniatives%20in%20Asia-Pacific_0.pdf.
79 IPSTAR, “IPSTAR CCTV solution assists Thai Flood Relief Operations Center keep an eye on flood water levels”, Case Study on Disaster Recovery and Emergency Communication, December 2011. Available from http://www.ipstar.com/pdf/case_study/cs_ip_cctv_thai_flood2011.pdf.
39
and smart manufacturing have emerged that leverage AI technologies to not only improve energy efficiency, but also minimize environmental degradation. In smart homes, for example, machine learning can recognize and learn patterns of the various home activities, and adapt to provide smart usage of the connected devices and appliances that saves energy.
AI is expected to transform the transport sector, which is likely to lead to substantial benefits for both consumers and companies. For example, in some countries, the shortage of truck drivers is high due to the growth of the freight sector and the large number of retiring drivers.80 AI can help address the issue and various approaches are currently being pursued by tech companies to develop driverless trucks.81 However, some challenges must first be tackled before making driverless vehicles available. For example, new computing and network infrastructure will be needed to handle and store the data in a secure way, as the amount of data between the cloud and vehicles is forecasted to be 10,000 times bigger by 2025.82
Besides enabling driverless cars, AI can also help to reduce traffic congestion experienced by many developing countries in the region. For example, Google Maps that relies on live sensors and traffic information can suggest optimal routes. Moreover, machine learning based on current and predicted traffic flows can be used to optimize traffic signals and sometimes even road closure, which paradoxically can lead to improved traffic flows.
An urban IoT system requires the existence of a vast network linking all existing technologies
80 In Japan, approximately 75 per cent of the truck drivers are over 40 years old, and there are two openings per person looking for a job in the Japanese transportation sector.
81 Alex Davies, “How Tesla’s self-driving truck scheme can dump human drivers”, Wired, 10 August 2017. Available from https://www.wired.com/story/tesla-self-driving-truck-musk/.
82 Jon Russell, “Toyota, Intel and others form big data group for automotive tech”, TechCrunch, 11 August 2017. Available from https://techcrunch.com/2017/08/11/toyota-intel-automotive-big-data/.
through multiple layers and covering a large geographical zone. This network also needs to carry large data flows.83 Thus, the deployment of fixed- and mobile-broadband infrastructure and technologies is essential to realizing an urban IoT system. In addition, participatory innovation processes to develop applications that run the infrastructure and sectors of activity are necessary in order for cities to become smart.84
Life Below Water
To ensure the sustainability of life below water, machine learning can be used to simultaneously process various data sources such as climate data and the movement of fishing vessels, and provide recommendations to protect marine ecosystems. Various AI-related technologies are also used in marine resource management. For example, to combat illegal fishing off the coast of Timor-Leste, low-cost personal locator beacons have been introduced as part of a community-based illegal, unreported and unregulated fishing reporting system. With a touch of one button on the personal locator beacons, local fisherfolks can anonymously alert authorities when they encounter illegal fishing. This application is also used to enhance fisherfolks’ safety when they are out at sea as there is a second button on the personal locator beacons for sending an emergency distress signal. The signal together with the geocoordinates are transmitted via satellite to the relevant authorities.85
83 Andrea Zanella and others, “Internet of things for smart cities”, IEEE Internet of Things Journal, vol. 1, no. 1 (2014), pp. 22-32.
84 Hans Schaffers and others, “Smart cities and the future internet: Towards cooperation frameworks for open innovation”, The Future Internet (2011), pp. 431-446.
85 Gerard Sylvester, ed., Success Stories on Information and Communication Technologies for Agriculture and Rural Development (Bangkok, Food and Agriculture Organization of the United Nations, 2015). Available from http://www.fao.org/3/a-i4622e.pdf.
Artificial Intelligence and Broadband Divide: State of ICT Connectivity in Asia and the Pacific
40
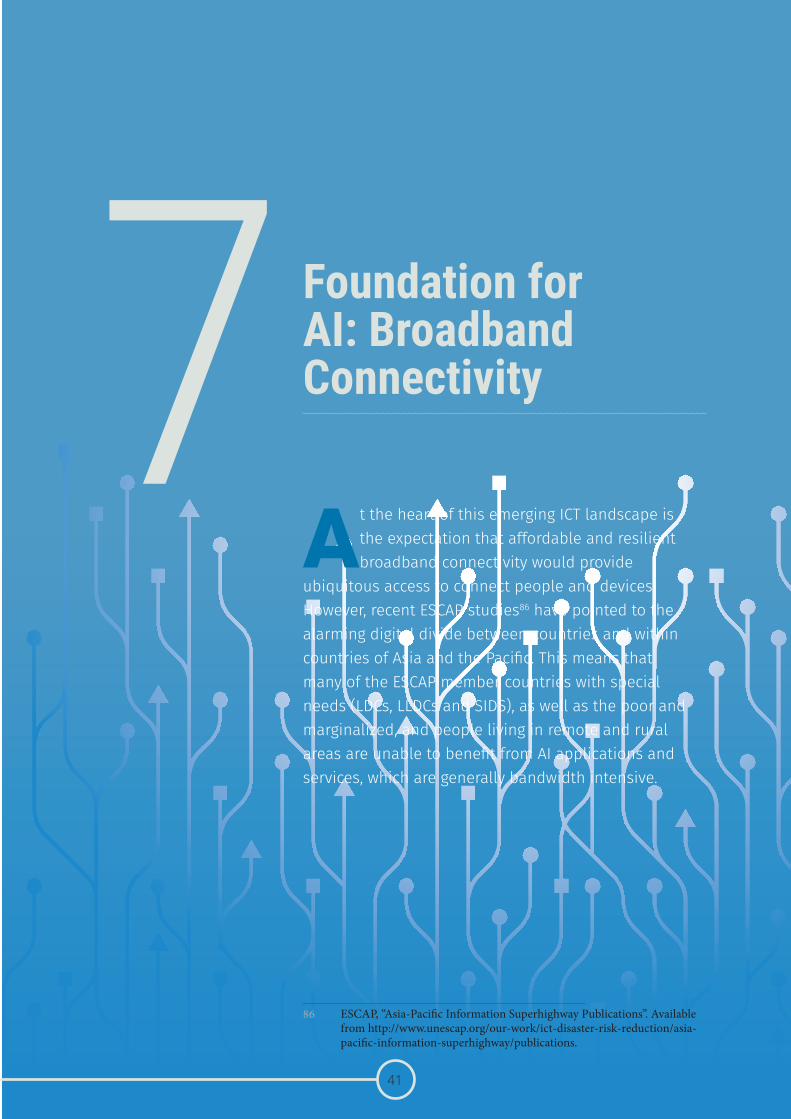
7 Foundation for AI: Broadband Connectivity
At the heart of this emerging ICT landscape is the expectation that affordable and resilient broadband connectivity would provide
ubiquitous access to connect people and devices. However, recent ESCAP studies86 have pointed to the alarming digital divide between countries and within countries of Asia and the Pacific. This means that many of the ESCAP member countries with special needs (LDCs, LLDCs and SIDS), as well as the poor and marginalized, and people living in remote and rural areas are unable to benefit from AI applications and services, which are generally bandwidth intensive.
86 ESCAP, “Asia-Pacific Information Superhighway Publications”. Available from http://www.unescap.org/our-work/ict-disaster-risk-reduction/asia-pacific-information-superhighway/publications.
41
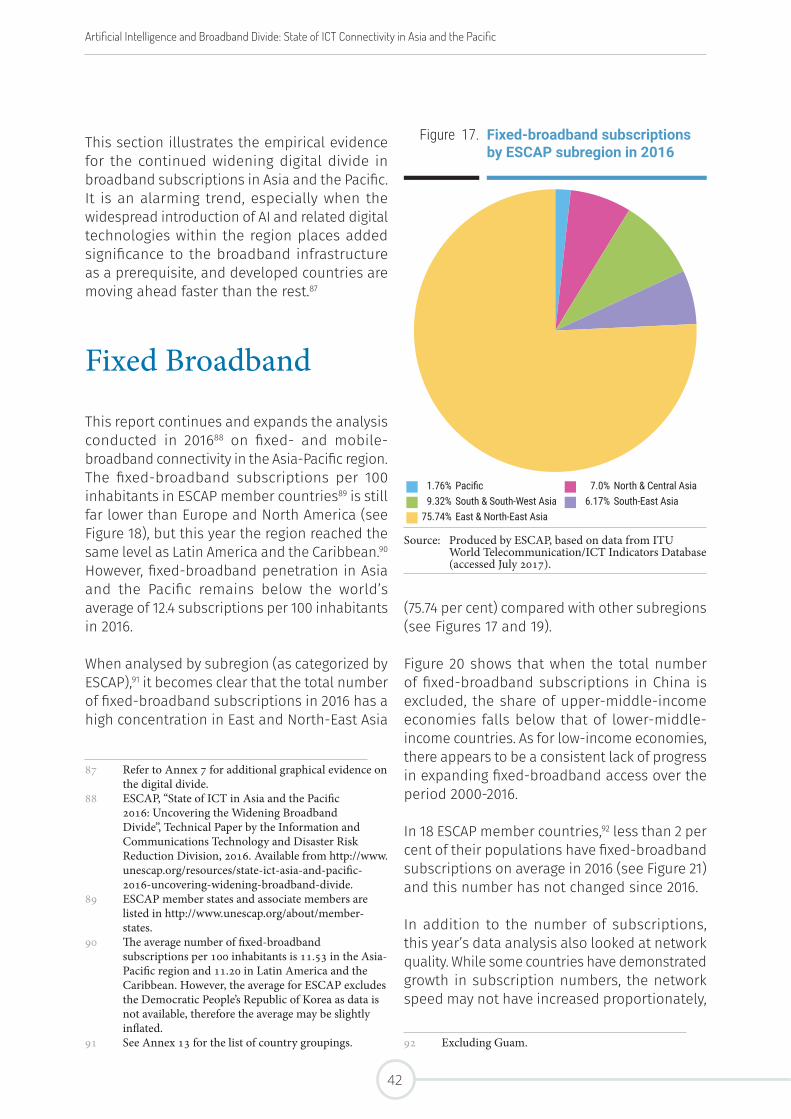
This section illustrates the empirical evidence for the continued widening digital divide in broadband subscriptions in Asia and the Pacific. It is an alarming trend, especially when the widespread introduction of AI and related digital technologies within the region places added significance to the broadband infrastructure as a prerequisite, and developed countries are moving ahead faster than the rest.87
Fixed Broadband
This report continues and expands the analysis conducted in 201688 on fixed- and mobile-broadband connectivity in the Asia-Pacific region. The fixed-broadband subscriptions per 100 inhabitants in ESCAP member countries89 is still far lower than Europe and North America (see Figure 18), but this year the region reached the same level as Latin America and the Caribbean.90 However, fixed-broadband penetration in Asia and the Pacific remains below the world’s average of 12.4 subscriptions per 100 inhabitants in 2016.
When analysed by subregion (as categorized by ESCAP),91 it becomes clear that the total number of fixed-broadband subscriptions in 2016 has a high concentration in East and North-East Asia
87 Refer to Annex 7 for additional graphical evidence on the digital divide.
88 ESCAP, “State of ICT in Asia and the Pacific 2016: Uncovering the Widening Broadband Divide”, Technical Paper by the Information and Communications Technology and Disaster Risk Reduction Division, 2016. Available from http://www.unescap.org/resources/state-ict-asia-and-pacific-2016-uncovering-widening-broadband-divide.
89 ESCAP member states and associate members are listed in http://www.unescap.org/about/member-states.
90 The average number of fixed-broadband subscriptions per 100 inhabitants is 11.53 in the Asia-Pacific region and 11.20 in Latin America and the Caribbean. However, the average for ESCAP excludes the Democratic People’s Republic of Korea as data is not available, therefore the average may be slightly inflated.
91 See Annex 13 for the list of country groupings.
(75.74 per cent) compared with other subregions (see Figures 17 and 19).
Figure 20 shows that when the total number of fixed-broadband subscriptions in China is excluded, the share of upper-middle-income economies falls below that of lower-middle-income countries. As for low-income economies, there appears to be a consistent lack of progress in expanding fixed-broadband access over the period 2000-2016.
In 18 ESCAP member countries,92 less than 2 per cent of their populations have fixed-broadband subscriptions on average in 2016 (see Figure 21) and this number has not changed since 2016.
In addition to the number of subscriptions, this year’s data analysis also looked at network quality. While some countries have demonstrated growth in subscription numbers, the network speed may not have increased proportionately,
92 Excluding Guam.
Figure 17. Fixed-broadband subscriptions by ESCAP subregion in 2016
1.76% Pacific 7.0% North & Central Asia9.32% South & South-West Asia 6.17% South-East Asia
75.74% East & North-East Asia
Source: Produced by ESCAP, based on data from ITU World Telecommunication/ICT Indicators Database (accessed July 2017).
Artificial Intelligence and Broadband Divide: State of ICT Connectivity in Asia and the Pacific
42
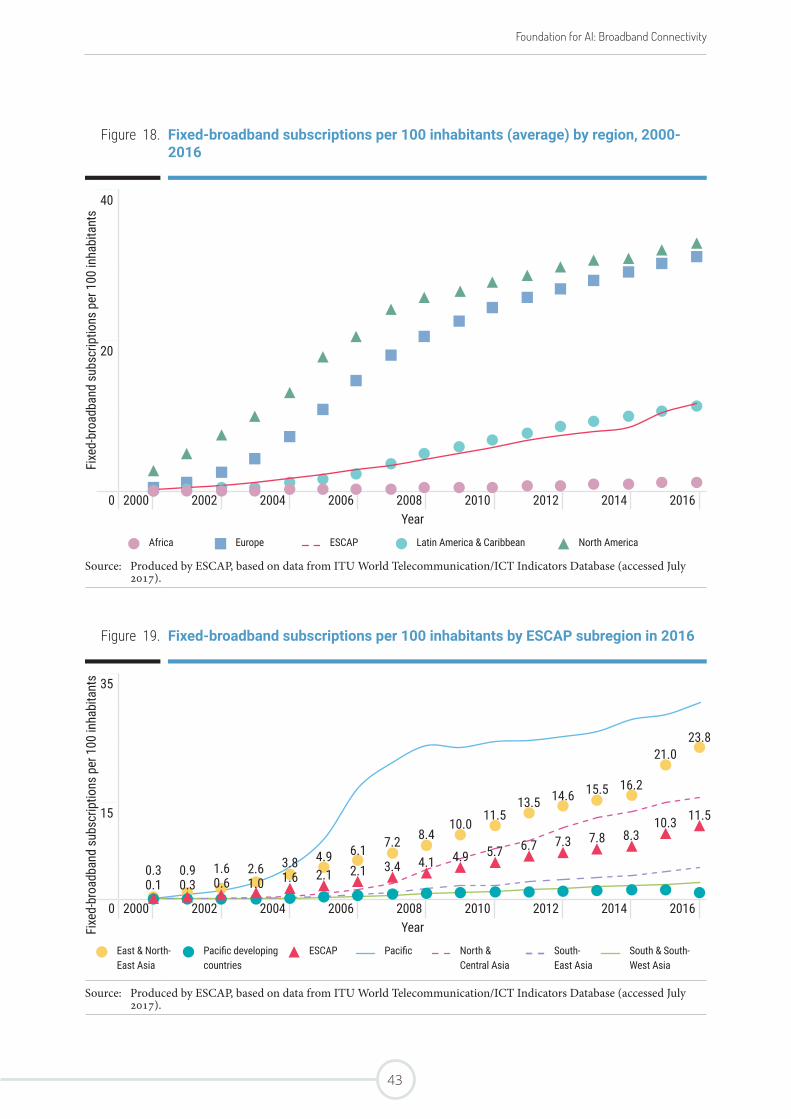
Foundation for AI: Broadband Connectivity
Figure 18. Fixed-broadband subscriptions per 100 inhabitants (average) by region, 2000-2016
Fixe
d-br
oadb
and
subs
crip
tions
per
100
inha
bita
nts
40
20
0 2000 2002 2004 2006 2008 2010 2012 2014 2016Year
Africa Europe ESCAP Latin America & Caribbean North America
Source: Produced by ESCAP, based on data from ITU World Telecommunication/ICT Indicators Database (accessed July 2017).
Figure 19. Fixed-broadband subscriptions per 100 inhabitants by ESCAP subregion in 2016
Fixe
d-br
oadb
and
subs
crip
tions
per
100
inha
bita
nts 35
15
0 2000 2002 2004 2006 2008 2010 2012 2014 2016Year
East & North-East Asia
Pacific developing countries
ESCAP Pacific North & Central Asia
South-East Asia
South & South-West Asia
Source: Produced by ESCAP, based on data from ITU World Telecommunication/ICT Indicators Database (accessed July 2017).
0.30.1
0.90.3
1.60.6
2.61.0
3.81.6 2.1
4.9 6.1 7.2 8.410.0
11.513.5 14.6 15.5 16.2
21.023.8
2.1 3.4 4.1 4.9 5.7 6.7 7.3 7.8 8.310.3 11.5
43
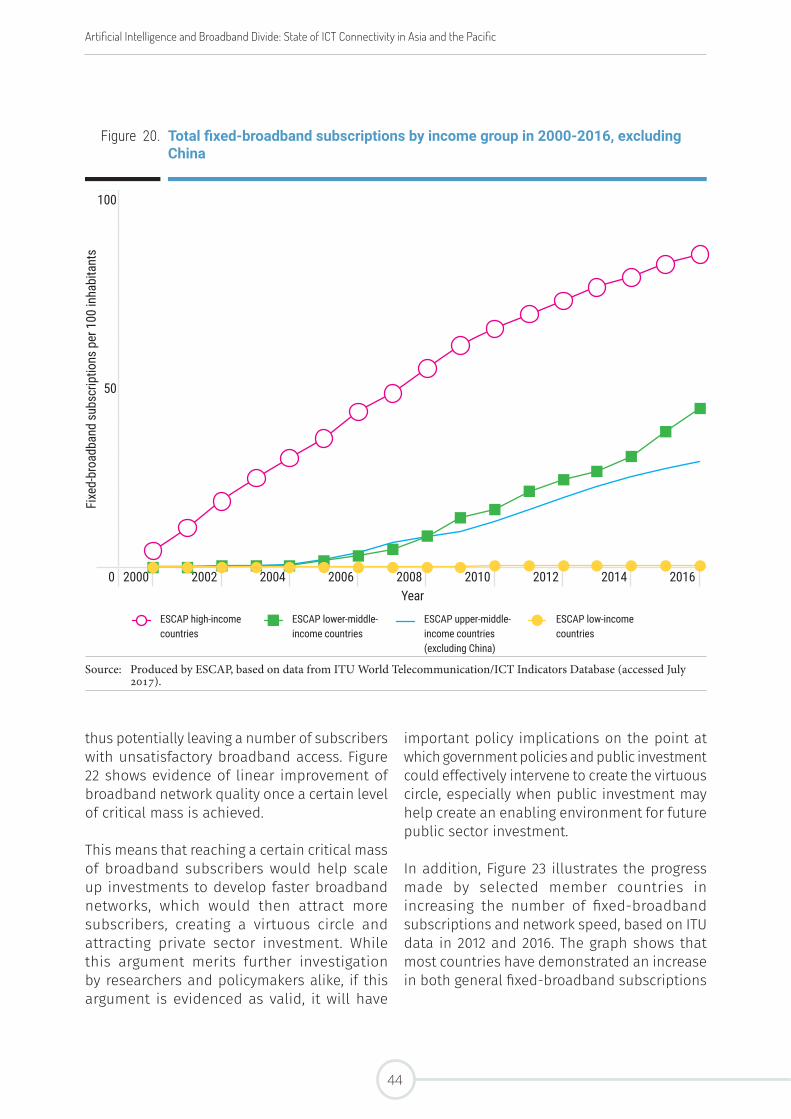
important policy implications on the point at which government policies and public investment could effectively intervene to create the virtuous circle, especially when public investment may help create an enabling environment for future public sector investment.
In addition, Figure 23 illustrates the progress made by selected member countries in increasing the number of fixed-broadband subscriptions and network speed, based on ITU data in 2012 and 2016. The graph shows that most countries have demonstrated an increase in both general fixed-broadband subscriptions
thus potentially leaving a number of subscribers with unsatisfactory broadband access. Figure 22 shows evidence of linear improvement of broadband network quality once a certain level of critical mass is achieved.
This means that reaching a certain critical mass of broadband subscribers would help scale up investments to develop faster broadband networks, which would then attract more subscribers, creating a virtuous circle and attracting private sector investment. While this argument merits further investigation by researchers and policymakers alike, if this argument is evidenced as valid, it will have
Figure 20. Total fixed-broadband subscriptions by income group in 2000-2016, excluding China
Fixe
d-br
oadb
and
subs
crip
tions
per
100
inha
bita
nts
100
50
0 2000 2002 2004 2006 2008 2010 2012 2014 2016Year
ESCAP high-income countries
ESCAP lower-middle-income countries
ESCAP upper-middle-income countries (excluding China)
ESCAP low-income countries
Source: Produced by ESCAP, based on data from ITU World Telecommunication/ICT Indicators Database (accessed July 2017).
Artificial Intelligence and Broadband Divide: State of ICT Connectivity in Asia and the Pacific
44
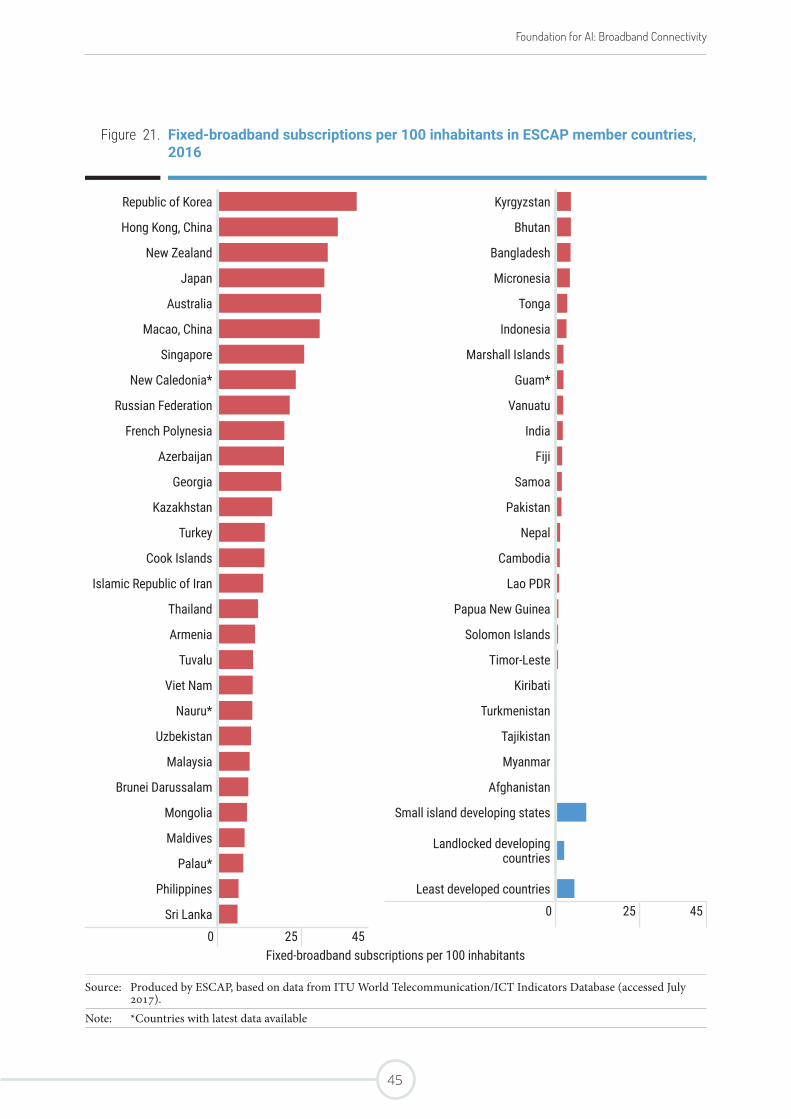
Foundation for AI: Broadband Connectivity
Figure 21. Fixed-broadband subscriptions per 100 inhabitants in ESCAP member countries, 2016
Republic of Korea Kyrgyzstan
Hong Kong, China Bhutan
New Zealand Bangladesh
Japan Micronesia
Australia Tonga
Macao, China Indonesia
Singapore Marshall Islands
New Caledonia* Guam*
Russian Federation Vanuatu
French Polynesia India
Azerbaijan Fiji
Georgia Samoa
Kazakhstan Pakistan
Turkey Nepal
Cook Islands Cambodia
Islamic Republic of Iran Lao PDR
Thailand Papua New Guinea
Armenia Solomon Islands
Tuvalu Timor-Leste
Viet Nam Kiribati
Nauru* Turkmenistan
Uzbekistan Tajikistan
Malaysia Myanmar
Brunei Darussalam Afghanistan
Mongolia Small island developing states
Maldives Landlocked developing countriesPalau*
Philippines Least developed countries
Sri Lanka 0 25 45
0 25 45Fixed-broadband subscriptions per 100 inhabitants
Source: Produced by ESCAP, based on data from ITU World Telecommunication/ICT Indicators Database (accessed July 2017).
Note: *Countries with latest data available
45
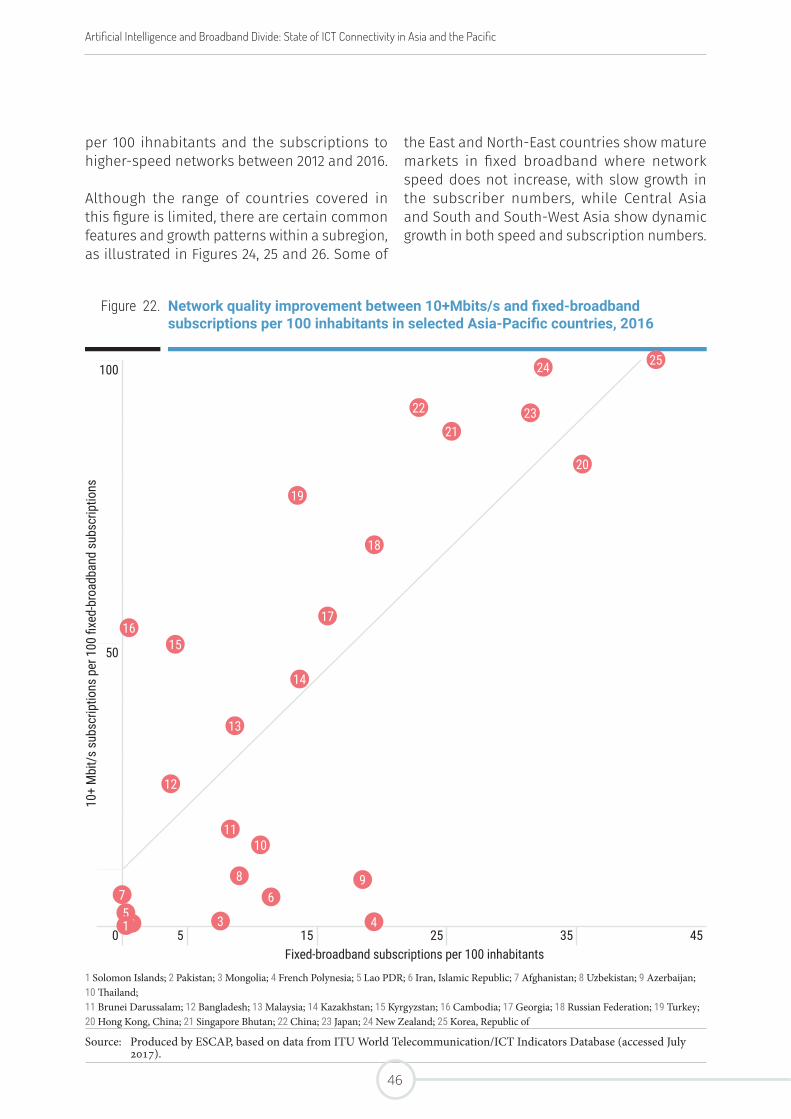
per 100 ihnabitants and the subscriptions to higher-speed networks between 2012 and 2016.
Although the range of countries covered in this figure is limited, there are certain common features and growth patterns within a subregion, as illustrated in Figures 24, 25 and 26. Some of
the East and North-East countries show mature markets in fixed broadband where network speed does not increase, with slow growth in the subscriber numbers, while Central Asia and South and South-West Asia show dynamic growth in both speed and subscription numbers.
Figure 22. Network quality improvement between 10+Mbits/s and fixed-broadband subscriptions per 100 inhabitants in selected Asia-Pacific countries, 2016
10+
Mbi
t/s s
ubsc
riptio
ns p
er 1
00 fi
xed-
broa
dban
d su
bscr
iptio
ns
100
50
0 5 15 25 35 45Fixed-broadband subscriptions per 100 inhabitants
1 Solomon Islands; 2 Pakistan; 3 Mongolia; 4 French Polynesia; 5 Lao PDR; 6 Iran, Islamic Republic; 7 Afghanistan; 8 Uzbekistan; 9 Azerbaijan; 10 Thailand; 11 Brunei Darussalam; 12 Bangladesh; 13 Malaysia; 14 Kazakhstan; 15 Kyrgyzstan; 16 Cambodia; 17 Georgia; 18 Russian Federation; 19 Turkey; 20 Hong Kong, China; 21 Singapore Bhutan; 22 China; 23 Japan; 24 New Zealand; 25 Korea, Republic of
Source: Produced by ESCAP, based on data from ITU World Telecommunication/ICT Indicators Database (accessed July 2017).
2
22
18
20
15
6
19
9
4
25
11
13
5
12
23
1716
3
24
14
7
1
8
21
10
Artificial Intelligence and Broadband Divide: State of ICT Connectivity in Asia and the Pacific
46
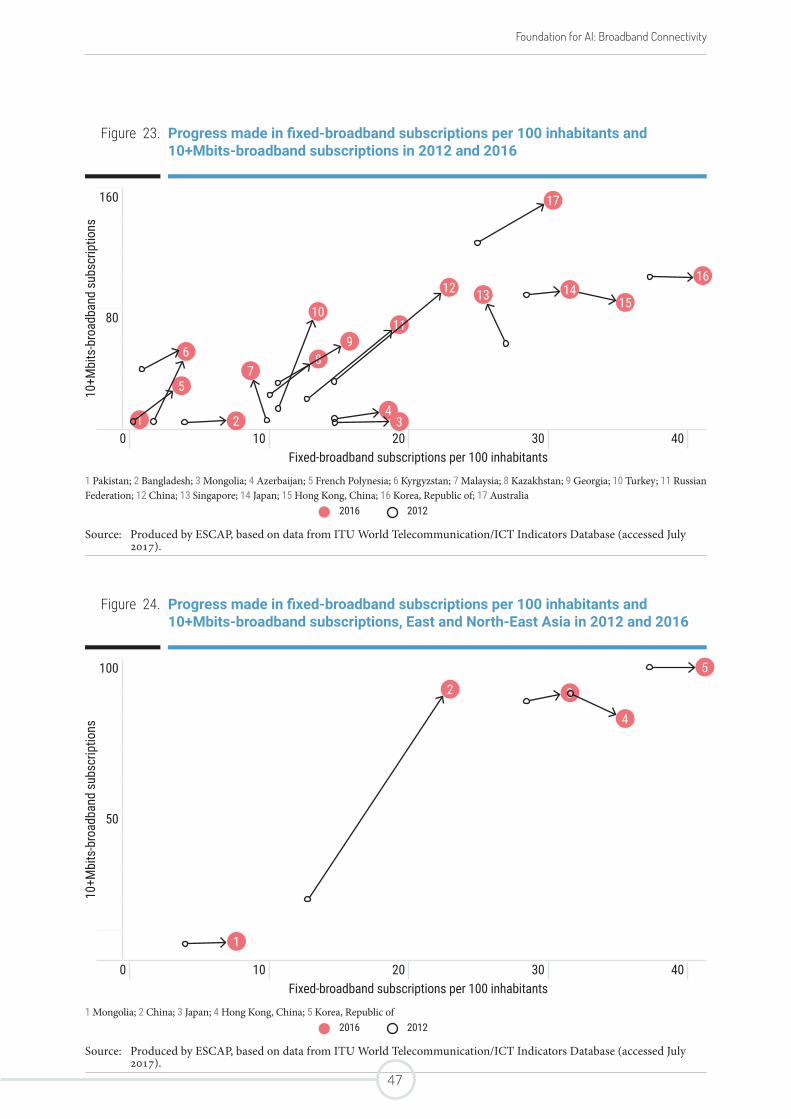
Foundation for AI: Broadband Connectivity
Figure 23. Progress made in fixed-broadband subscriptions per 100 inhabitants and 10+Mbits-broadband subscriptions in 2012 and 2016
10+M
bits
-bro
adba
nd s
ubsc
riptio
ns
160
80
0 10 20 30 40Fixed-broadband subscriptions per 100 inhabitants
1 Pakistan; 2 Bangladesh; 3 Mongolia; 4 Azerbaijan; 5 French Polynesia; 6 Kyrgyzstan; 7 Malaysia; 8 Kazakhstan; 9 Georgia; 10 Turkey; 11 Russian Federation; 12 China; 13 Singapore; 14 Japan; 15 Hong Kong, China; 16 Korea, Republic of; 17 Australia
2016 2012
Source: Produced by ESCAP, based on data from ITU World Telecommunication/ICT Indicators Database (accessed July 2017).
Figure 24. Progress made in fixed-broadband subscriptions per 100 inhabitants and 10+Mbits-broadband subscriptions, East and North-East Asia in 2012 and 2016
10+M
bits
-bro
adba
nd s
ubsc
riptio
ns
100
50
0 10 20 30 40Fixed-broadband subscriptions per 100 inhabitants
1 Mongolia; 2 China; 3 Japan; 4 Hong Kong, China; 5 Korea, Republic of2016 2012
Source: Produced by ESCAP, based on data from ITU World Telecommunication/ICT Indicators Database (accessed July 2017).
5
1
67
89
1011
12 13 15
16
17
2 34
14
1
2 3
4
5
47
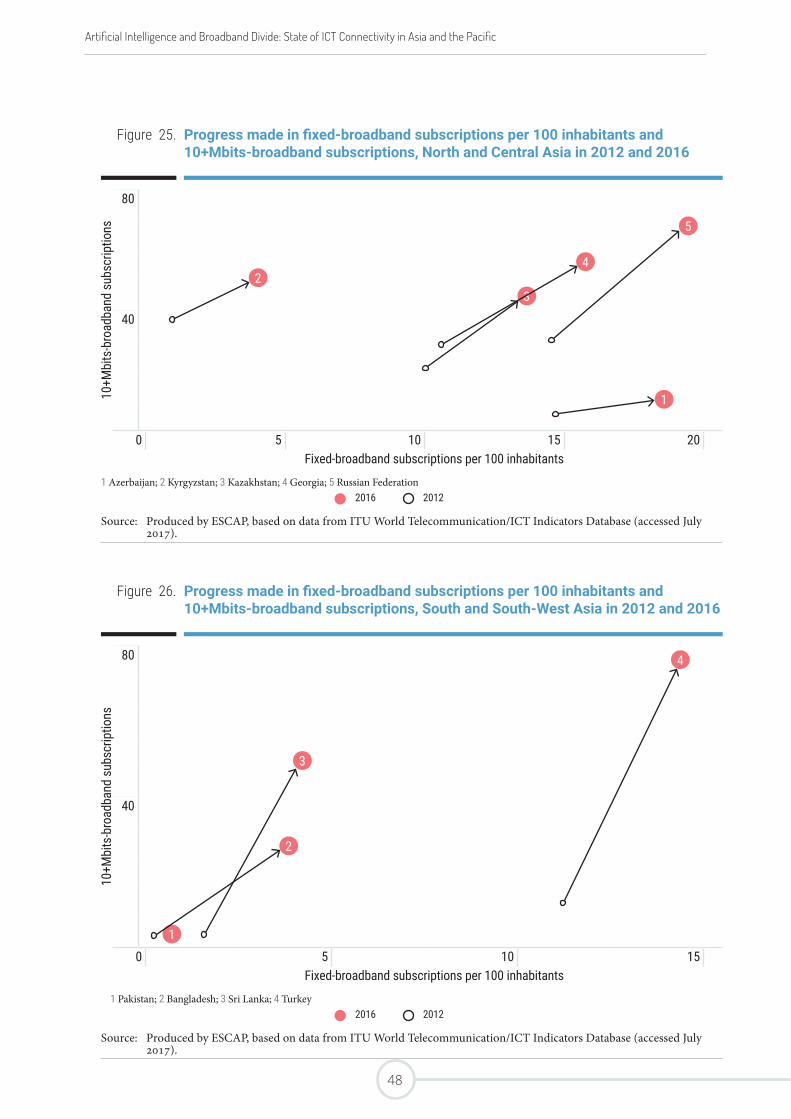
Figure 25. Progress made in fixed-broadband subscriptions per 100 inhabitants and 10+Mbits-broadband subscriptions, North and Central Asia in 2012 and 2016
10+M
bits
-bro
adba
nd s
ubsc
riptio
ns
80
40
0 5 10 15 20Fixed-broadband subscriptions per 100 inhabitants
1 Azerbaijan; 2 Kyrgyzstan; 3 Kazakhstan; 4 Georgia; 5 Russian Federation2016 2012
Source: Produced by ESCAP, based on data from ITU World Telecommunication/ICT Indicators Database (accessed July 2017).
Figure 26. Progress made in fixed-broadband subscriptions per 100 inhabitants and 10+Mbits-broadband subscriptions, South and South-West Asia in 2012 and 2016
10+M
bits
-bro
adba
nd s
ubsc
riptio
ns
80
40
0 5 10 15Fixed-broadband subscriptions per 100 inhabitants
1 Pakistan; 2 Bangladesh; 3 Sri Lanka; 4 Turkey2016 2012
Source: Produced by ESCAP, based on data from ITU World Telecommunication/ICT Indicators Database (accessed July 2017).
1
23
4
5
1
2
3
4
Artificial Intelligence and Broadband Divide: State of ICT Connectivity in Asia and the Pacific
48
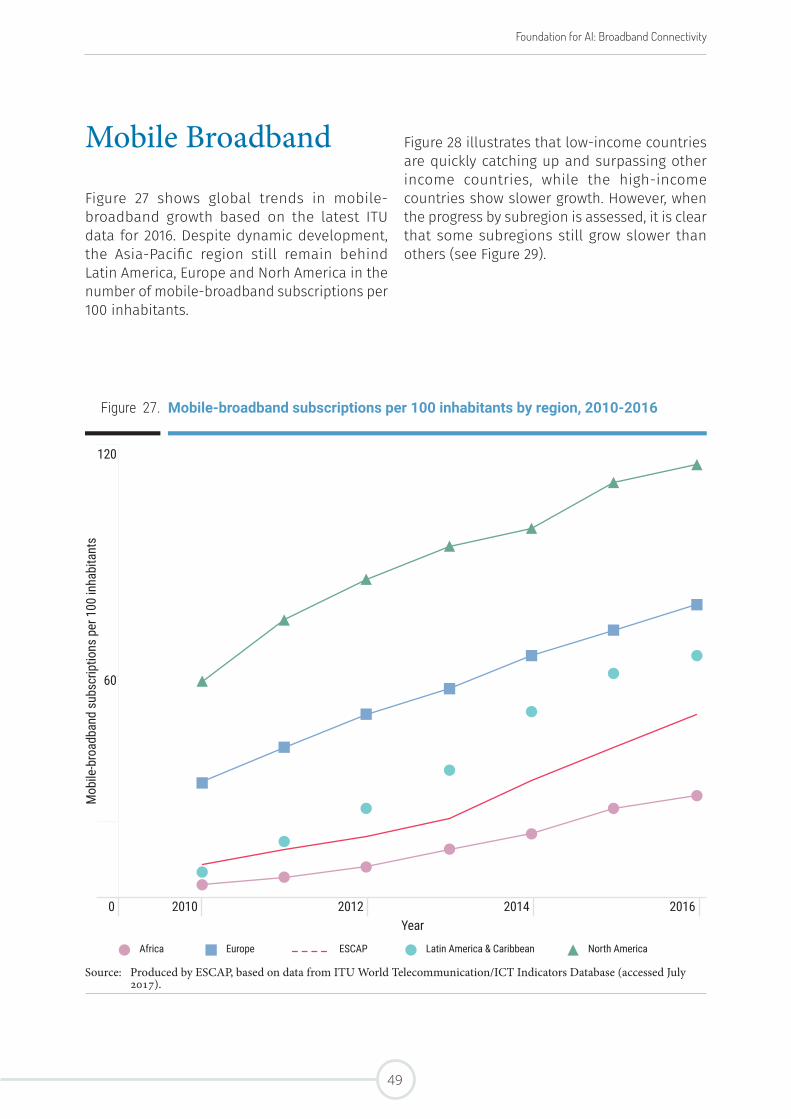
Foundation for AI: Broadband Connectivity
Mobile Broadband
Figure 27 shows global trends in mobile-broadband growth based on the latest ITU data for 2016. Despite dynamic development, the Asia-Pacific region still remain behind Latin America, Europe and Norh America in the number of mobile-broadband subscriptions per 100 inhabitants.
Figure 28 illustrates that low-income countries are quickly catching up and surpassing other income countries, while the high-income countries show slower growth. However, when the progress by subregion is assessed, it is clear that some subregions still grow slower than others (see Figure 29).
Figure 27. Mobile-broadband subscriptions per 100 inhabitants by region, 2010-2016
Mob
ile-b
road
band
sub
scrip
tions
per
100
inha
bita
nts
120
60
0 2010 2012 2014 2016Year
Africa Europe ESCAP Latin America & Caribbean North America
Source: Produced by ESCAP, based on data from ITU World Telecommunication/ICT Indicators Database (accessed July 2017).
49
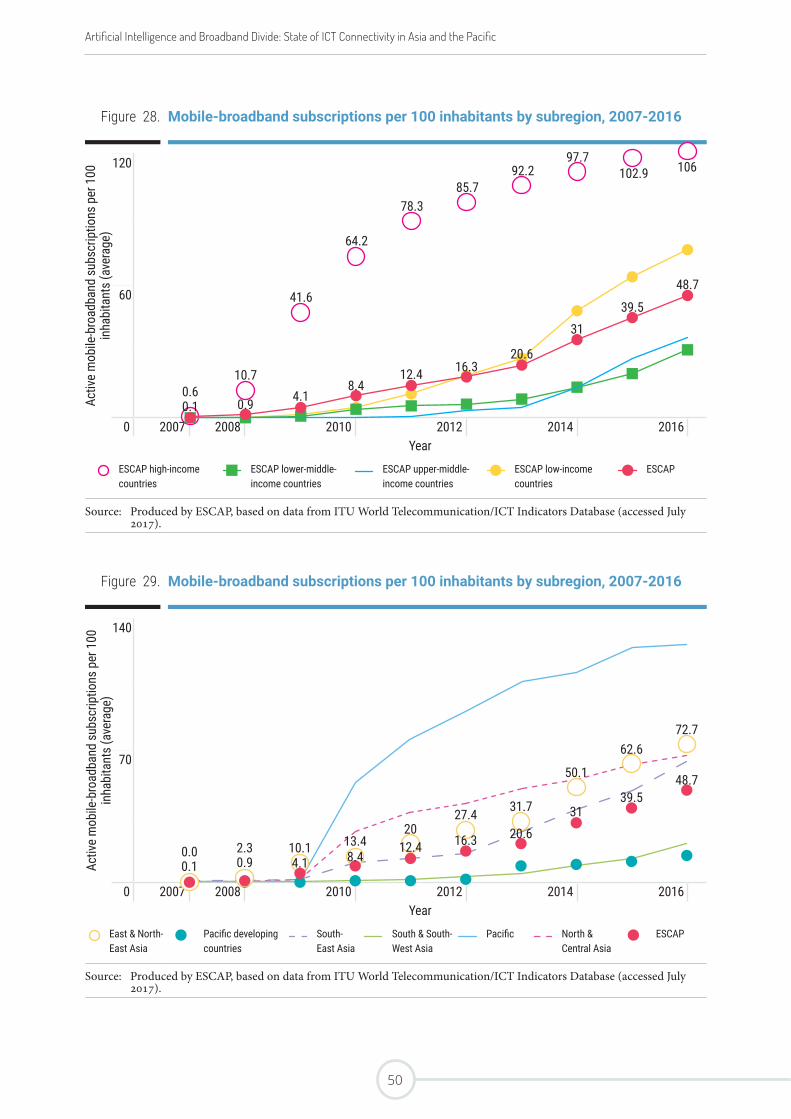
Figure 28. Mobile-broadband subscriptions per 100 inhabitants by subregion, 2007-2016
Activ
e m
obile
-bro
adba
nd s
ubsc
riptio
ns p
er 1
00
inha
bita
nts
(ave
rage
)
120
60
0 2007 2008 2010 2012 2014 2016Year
ESCAP high-income countries
ESCAP lower-middle-income countries
ESCAP upper-middle-income countries
ESCAP low-income countries
ESCAP
Source: Produced by ESCAP, based on data from ITU World Telecommunication/ICT Indicators Database (accessed July 2017).
Figure 29. Mobile-broadband subscriptions per 100 inhabitants by subregion, 2007-2016
Activ
e m
obile
-bro
adba
nd s
ubsc
riptio
ns p
er 1
00
inha
bita
nts
(ave
rage
)
140
70
0 2007 2008 2010 2012 2014 2016Year
East & North-East Asia
Pacific developing countries
South-East Asia
South & South-West Asia
Pacific North & Central Asia
ESCAP
Source: Produced by ESCAP, based on data from ITU World Telecommunication/ICT Indicators Database (accessed July 2017).
106
0.610.7
41.6
64.2
78.385.7
92.297.7
102.9
48.7
0.1 0.9 4.18.4
12.4 16.320.6
3139.5
72.762.6
50.1
31.727.420
13.410.1
48.7
2.30.9
0.00.1 4.1 8.4
12.4 16.3 20.631
39.5
Artificial Intelligence and Broadband Divide: State of ICT Connectivity in Asia and the Pacific
50
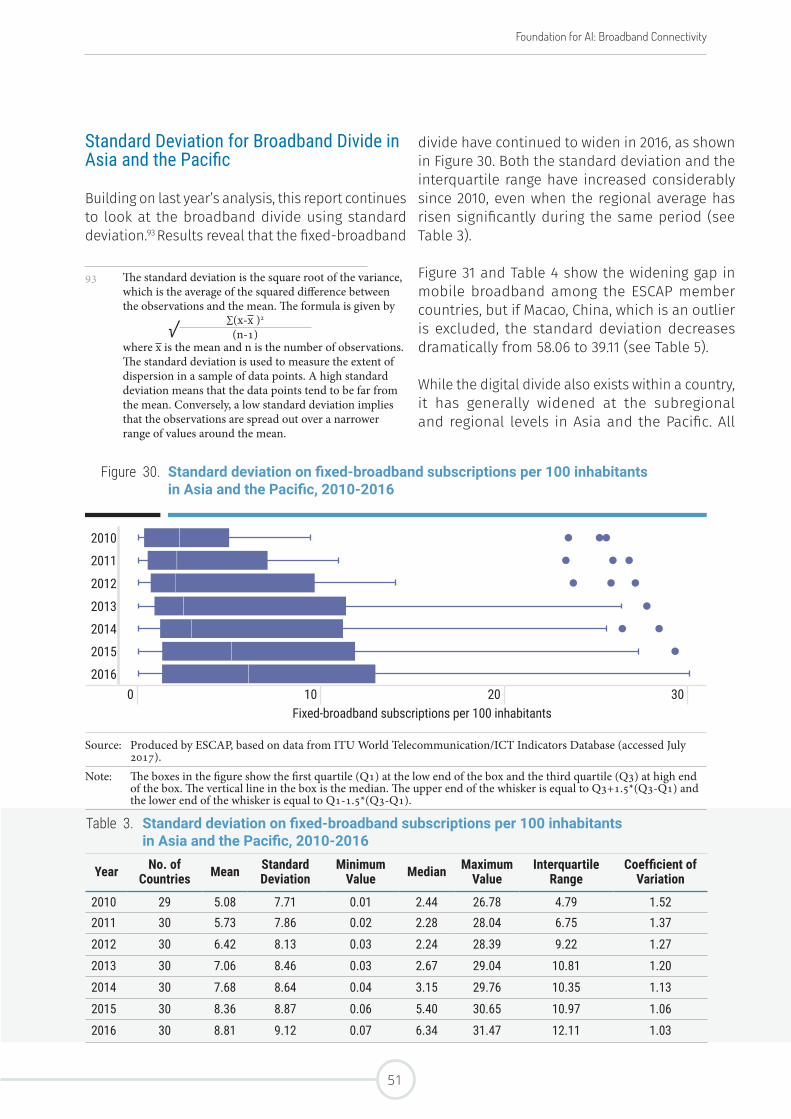
Foundation for AI: Broadband Connectivity
Standard Deviation for Broadband Divide in Asia and the Pacific
Building on last year’s analysis, this report continues to look at the broadband divide using standard deviation.93 Results reveal that the fixed-broadband
93 The standard deviation is the square root of the variance, which is the average of the squared difference between the observations and the mean. The formula is given by
√ ∑(x-x )2
(n-1)where x is the mean and n is the number of observations. The standard deviation is used to measure the extent of dispersion in a sample of data points. A high standard deviation means that the data points tend to be far from the mean. Conversely, a low standard deviation implies that the observations are spread out over a narrower range of values around the mean.
divide have continued to widen in 2016, as shown in Figure 30. Both the standard deviation and the interquartile range have increased considerably since 2010, even when the regional average has risen significantly during the same period (see Table 3).
Figure 31 and Table 4 show the widening gap in mobile broadband among the ESCAP member countries, but if Macao, China, which is an outlier is excluded, the standard deviation decreases dramatically from 58.06 to 39.11 (see Table 5).
While the digital divide also exists within a country, it has generally widened at the subregional and regional levels in Asia and the Pacific. All
Table 3. Standard deviation on fixed-broadband subscriptions per 100 inhabitants in Asia and the Pacific, 2010-2016
Year No. of Countries Mean Standard
DeviationMinimum
Value Median Maximum Value
Interquartile Range
Coefficient of Variation
2010 29 5.08 7.71 0.01 2.44 26.78 4.79 1.522011 30 5.73 7.86 0.02 2.28 28.04 6.75 1.37
2012 30 6.42 8.13 0.03 2.24 28.39 9.22 1.27
2013 30 7.06 8.46 0.03 2.67 29.04 10.81 1.20
2014 30 7.68 8.64 0.04 3.15 29.76 10.35 1.13
2015 30 8.36 8.87 0.06 5.40 30.65 10.97 1.06
2016 30 8.81 9.12 0.07 6.34 31.47 12.11 1.03
Figure 30. Standard deviation on fixed-broadband subscriptions per 100 inhabitants in Asia and the Pacific, 2010-2016
2010
2011
2012
2013
2014
2015
20160 10 20 30
Fixed-broadband subscriptions per 100 inhabitants
Source: Produced by ESCAP, based on data from ITU World Telecommunication/ICT Indicators Database (accessed July 2017).
Note: The boxes in the figure show the first quartile (Q1) at the low end of the box and the third quartile (Q3) at high end of the box. The vertical line in the box is the median. The upper end of the whisker is equal to Q3+1.5*(Q3-Q1) and the lower end of the whisker is equal to Q1-1.5*(Q3-Q1).
51
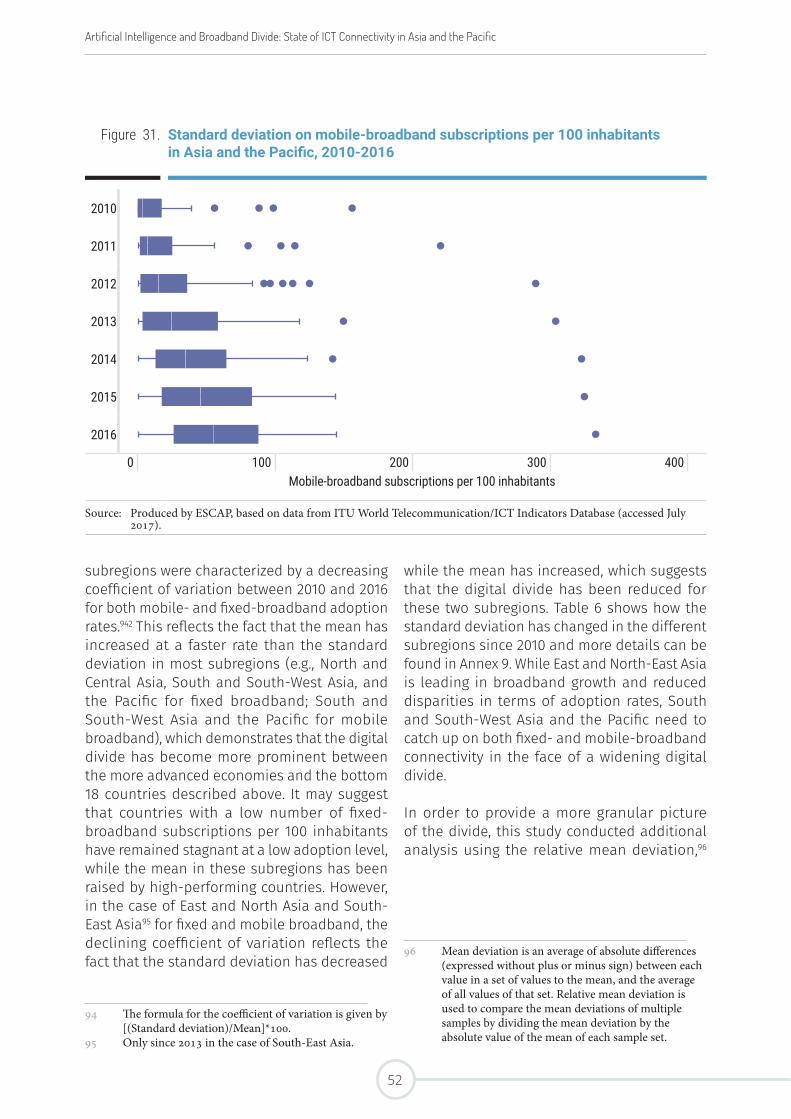
subregions were characterized by a decreasing coefficient of variation between 2010 and 2016 for both mobile- and fixed-broadband adoption rates.942 This reflects the fact that the mean has increased at a faster rate than the standard deviation in most subregions (e.g., North and Central Asia, South and South-West Asia, and the Pacific for fixed broadband; South and South-West Asia and the Pacific for mobile broadband), which demonstrates that the digital divide has become more prominent between the more advanced economies and the bottom 18 countries described above. It may suggest that countries with a low number of fixed-broadband subscriptions per 100 inhabitants have remained stagnant at a low adoption level, while the mean in these subregions has been raised by high-performing countries. However, in the case of East and North Asia and South-East Asia95 for fixed and mobile broadband, the declining coefficient of variation reflects the fact that the standard deviation has decreased
94 The formula for the coefficient of variation is given by [(Standard deviation)/Mean]*100.
95 Only since 2013 in the case of South-East Asia.
while the mean has increased, which suggests that the digital divide has been reduced for these two subregions. Table 6 shows how the standard deviation has changed in the different subregions since 2010 and more details can be found in Annex 9. While East and North-East Asia is leading in broadband growth and reduced disparities in terms of adoption rates, South and South-West Asia and the Pacific need to catch up on both fixed- and mobile-broadband connectivity in the face of a widening digital divide.
In order to provide a more granular picture of the divide, this study conducted additional analysis using the relative mean deviation,96
96 Mean deviation is an average of absolute differences (expressed without plus or minus sign) between each value in a set of values to the mean, and the average of all values of that set. Relative mean deviation is used to compare the mean deviations of multiple samples by dividing the mean deviation by the absolute value of the mean of each sample set.
Figure 31. Standard deviation on mobile-broadband subscriptions per 100 inhabitants in Asia and the Pacific, 2010-2016
2010
2011
2012
2013
2014
2015
2016
0 100 200 300 400Mobile-broadband subscriptions per 100 inhabitants
Source: Produced by ESCAP, based on data from ITU World Telecommunication/ICT Indicators Database (accessed July 2017).
Artificial Intelligence and Broadband Divide: State of ICT Connectivity in Asia and the Pacific
52
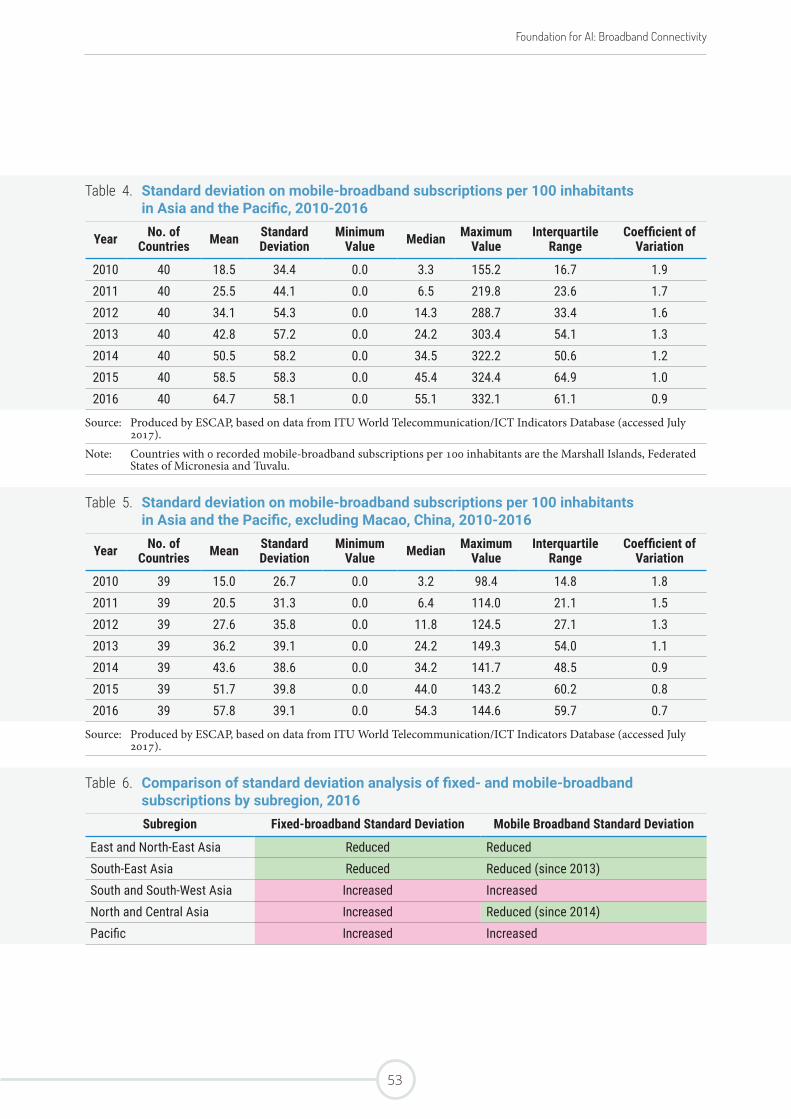
Foundation for AI: Broadband Connectivity
Table 4. Standard deviation on mobile-broadband subscriptions per 100 inhabitants in Asia and the Pacific, 2010-2016
Year No. of Countries Mean Standard
DeviationMinimum
Value Median Maximum Value
Interquartile Range
Coefficient of Variation
2010 40 18.5 34.4 0.0 3.3 155.2 16.7 1.92011 40 25.5 44.1 0.0 6.5 219.8 23.6 1.72012 40 34.1 54.3 0.0 14.3 288.7 33.4 1.62013 40 42.8 57.2 0.0 24.2 303.4 54.1 1.32014 40 50.5 58.2 0.0 34.5 322.2 50.6 1.22015 40 58.5 58.3 0.0 45.4 324.4 64.9 1.02016 40 64.7 58.1 0.0 55.1 332.1 61.1 0.9
Source: Produced by ESCAP, based on data from ITU World Telecommunication/ICT Indicators Database (accessed July 2017).
Note: Countries with 0 recorded mobile-broadband subscriptions per 100 inhabitants are the Marshall Islands, Federated States of Micronesia and Tuvalu.
Table 5. Standard deviation on mobile-broadband subscriptions per 100 inhabitants in Asia and the Pacific, excluding Macao, China, 2010-2016
Year No. of Countries Mean Standard
DeviationMinimum
Value Median Maximum Value
Interquartile Range
Coefficient of Variation
2010 39 15.0 26.7 0.0 3.2 98.4 14.8 1.82011 39 20.5 31.3 0.0 6.4 114.0 21.1 1.52012 39 27.6 35.8 0.0 11.8 124.5 27.1 1.32013 39 36.2 39.1 0.0 24.2 149.3 54.0 1.12014 39 43.6 38.6 0.0 34.2 141.7 48.5 0.92015 39 51.7 39.8 0.0 44.0 143.2 60.2 0.82016 39 57.8 39.1 0.0 54.3 144.6 59.7 0.7
Source: Produced by ESCAP, based on data from ITU World Telecommunication/ICT Indicators Database (accessed July 2017).
Table 6. Comparison of standard deviation analysis of fixed- and mobile-broadband subscriptions by subregion, 2016Subregion Fixed-broadband Standard Deviation Mobile Broadband Standard Deviation
East and North-East Asia Reduced ReducedSouth-East Asia Reduced Reduced (since 2013)South and South-West Asia Increased IncreasedNorth and Central Asia Increased Reduced (since 2014)Pacific Increased Increased
53
the standard deviation of logs97 and Gini coefficient98 to measure dispersion from the mean (see Annex 9). The three measures show improving trends for the majority of countries in both fixed and mobile broadband as the dispersion of data points converge around the mean. Since the mean is improving over time, the convergence around the mean will therefore indicate an improving trend. However, it does not show the trend of the whole sample, namely a widening gap between more advanced economies and the 18 countries that have not made significant progress in fixed-broadband subscriptions over the last 15 years, as described earlier. The divide can also be explained by the widened interquartile range (see Figures 30 and 31). Since 2010, the third quartile has increased at a much faster pace than the first quartile, for both fixed and mobile broadband. Overall, the findings suggest that a significant number of countries characterized by an average or high adoption rate tend to progressively converge, as shown by the improving trends measured by the indicators in Tables 9.11 and 9.12 in Annex 9. However, a number of countries continue to experience sluggish growth in access to broadband connectivity, as shown by the whole sample’s increasing standard deviation, the widening interquartile range, and also the minimum value of access each year, which continues to be close to zero, indicating acute lack of access.
97 Logs transformation improves interpretability by adjusting data to the linear line and making distribution less skewed. The standard deviation of logs is used to measure the extent of dispersion in the logs. A high standard deviation of logs means that the data points tend to be far from the mean. Conversely, a low standard deviation implies that the observations are spread out over a narrower range of values around the mean.
98 The Gini coefficient is a standard measure of inequality defined as the area between the Lorenz curve and the line of perfect equality divided by the area below the perfect equality line. The index lies in the interval 0 (perfect equality) and 1 (perfect inequality). Other notable measures of inequality include: the range, the variance, the squared coefficient of variation, the variance of log incomes, the absolute and relative mean deviations, and Theil’s two inequality indices.
Fixed or Mobile Broadband?
In view of the rapid expansion of mobile broadband across the region, a pertinent question on the issue of fixed broadband being necessary or not at a subscriber’s level has occasionally been raised. According to ITU statistics,99 the fixed-broadband adoption rate for the region was estimated to be 12.3 per cent in 2017, compared to 52 per cent for mobile-broadband adoption. The availability of smartphones together with regulatory reform of the mobile telecommunication industry paved way for impressive growth in mobile-broadband services. Increasingly, consumers today are going online from their mobile devices for e-commerce, e-banking, e-health and e-education services. The future appears to be towards mobile. It therefore begs the question—do we still need fixed-broadband connectivity?
While the phenomenal growth in mobile broadband is seen as achieving broadband for all, there are a few factors that need to be taken into account. One is technological—according to the 2017 Cisco Virtual Networking Index,100 60 per cent of mobile data traffic is offloaded to fixed broadband via Wi-Fi and femtocell in 2016 globally. In 2021, the percentage is expected to increase to 63 per cent. While mobile-broadband services are enjoyed on user devices such as mobile phones and tablets, the data traffic relies on fixed-broadband networks. Fixed-broadband connectivity continues to be an important complementary technology for mobile. A study by CISCO estimated that by 2018, Internet traffic
99 ITU, “Statistics”. Available from http://www.itu.int/ict/statistics.
100 Cisco, “Cisco Visual Networking Index: Global Mobile Data Traffic Forecast Update, 2016–2021”, White Paper, February 2017. Available from https://www.cisco.com/c/en/us/solutions/collateral/service-provider/visual-networking-index-vni/mobile-white-paper-c11-520862.html.
Artificial Intelligence and Broadband Divide: State of ICT Connectivity in Asia and the Pacific
54
Foundation for AI: Broadband Connectivity
via fixed-broadband connections101 will account for 39 per cent of the total, compared with 12 per cent on mobile102 and 49 per cent on Wi-Fi.103
Another factor is financial—as fourth-generation or 4G networks and data services are increasingly introduced, mobile-broadband services may remain unaffordable to the vast majority of people in Asia and the Pacific, at least initially.104 With an imminent increase in the number of IoT devices and their data communication requirements, ESCAP member countries may need to strategically prioritize the network configurations and expansion to enable new and emerging services, and meet various bandwidth demands.
Public Wi-Fi appears to be a primary means of connection for one in five users, as indicated in a recent survey conducted by the Alliance for Affordable Internet on the experiences and perceived benefits of 8,000 mobile Internet users across eight countries on their mobile data services. It is particularly higher in some countries, for example, in the Philippines where 34 per cent of the survey respondents use public Wi-Fi as the source of connection.105
101 The number of consumer fixed-Internet users was not taken directly from an analyst source but was estimated from analyst forecasts for consumer broadband connections.
102 Mobile data traffic includes handset-based data traffic, such as text messaging, multimedia messaging and handset video services.
103 W-Fi hotspots (including homespots). Cisco, “Cisco Visual Networking Index: Global Mobile Data Traffic Forecast Update, 2016–2021”, White Paper, February 2017. Available from https://www.cisco.com/c/en/us/solutions/collateral/service-provider/visual-networking-index-vni/mobile-white-paper-c11-520862.html.
104 ESCAP, “State of ICT in Asia and the Pacific 2016: Uncovering the Widening Broadband Divide”, Technical Paper by the Information and Communications Technology and Disaster Risk Reduction Division, 2016. Available from http://www.unescap.org/resources/state-ict-asia-and-pacific-2016-uncovering-widening-broadband-divide.
105 Wayan Vota, “Is Zero-Rated Internet Access Connecting the Unconnected?” ICT Works, 21 August 2017. Available from https://www.ictworks.org/2017/08/21/is-zero-rated-internet-access-connecting-the-unconnected.
There has been an illustrative debate in the US regarding fixed- and mobile-broadband access,106
in particular if mobile-broadband access can substitute fixed-broadband access. In response to the request for comments by the Federal Communications Commission of the United States of America, citizens shared their views, which can be summarized as follows: (1) mobile-broadband usage is hindered by data cap (which would increase cost); (2) mobile-broadband connections experience less reliability and higher latency (especially for health, home office and business requirements); and (3) Internet speed is faster on fixed broadband than mobile broadband. Although broadband affordability varies from country to country, the same argument may hold true in the region where mobile broadband is not considered as a viable substitute for fixed broadband. Instead, in order to create an enabling Internet environment, both fixed- and mobile-broadband access should be available and affordable.
Preliminary results from ESCAP’s econometric analysis on the predictors of fixed- and mobile-broadband adoption in the world (controlling for other factors) found a statistically significant positive coefficient between the two—pointing to evidence of a complementary relationship107 (see analysis in Annex 6). Firm-level panel data from Japan108 and household-level data from Portugal,109 Hong Kong, China, Seoul, Republic of
106 Jon Brodkin, “FCC faces backlash for saying Americans might not need fast home Internet”, Ars Technica, 12 August 2017. Available from https://arstechnica.com/information-technology/2017/08/mobile-broadband-cant-replace-fast-home-internet-americans-tell-fcc.
107 The results of the estimates are based on country-level panel data set.
108 Jinsoo Bae, Yun Jeong Choi and John-Hee Hahn, “Fixed and mobile broadband: Are they substitutes or complements?” Economic Research Institute, Yonsei University, July 2014. Available from ftp://ftp.repec.org/opt/ReDIF/RePEc/yon/wpaper/2014rwp-68.pdf.
109 ANACOM, “Study on Substitutability between Fixed Broadband and Mobile Broadband: Final Report”, October 2015. Available from https://www.anacom.pt/streaming/subst_fixedmobilebroadband2015.pdf?contentId=1385792&field=ATTACHED_FILE.
55
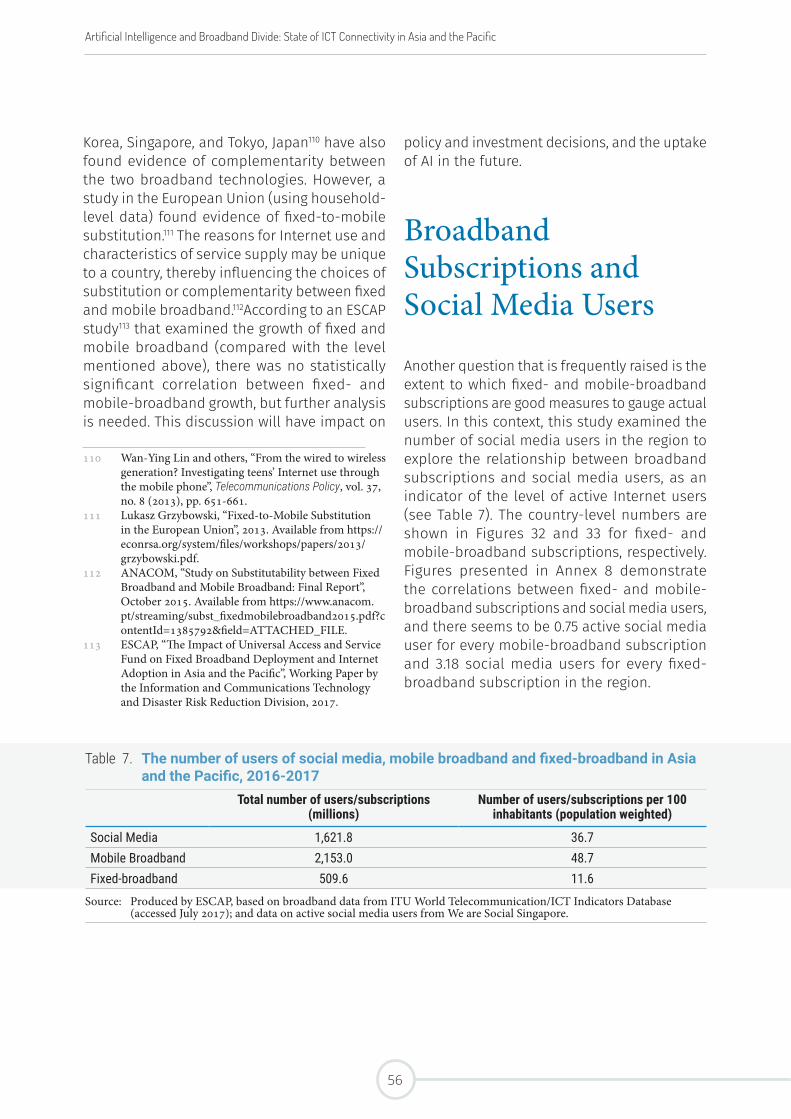
Korea, Singapore, and Tokyo, Japan110 have also found evidence of complementarity between the two broadband technologies. However, a study in the European Union (using household-level data) found evidence of fixed-to-mobile substitution.111 The reasons for Internet use and characteristics of service supply may be unique to a country, thereby influencing the choices of substitution or complementarity between fixed and mobile broadband.112According to an ESCAP study113 that examined the growth of fixed and mobile broadband (compared with the level mentioned above), there was no statistically significant correlation between fixed- and mobile-broadband growth, but further analysis is needed. This discussion will have impact on
110 Wan-Ying Lin and others, “From the wired to wireless generation? Investigating teens’ Internet use through the mobile phone”, Telecommunications Policy, vol. 37, no. 8 (2013), pp. 651-661.
111 Lukasz Grzybowski, “Fixed-to-Mobile Substitution in the European Union”, 2013. Available from https://econrsa.org/system/files/workshops/papers/2013/grzybowski.pdf.
112 ANACOM, “Study on Substitutability between Fixed Broadband and Mobile Broadband: Final Report”, October 2015. Available from https://www.anacom.pt/streaming/subst_fixedmobilebroadband2015.pdf?contentId=1385792&field=ATTACHED_FILE.
113 ESCAP, “The Impact of Universal Access and Service Fund on Fixed Broadband Deployment and Internet Adoption in Asia and the Pacific”, Working Paper by the Information and Communications Technology and Disaster Risk Reduction Division, 2017.
policy and investment decisions, and the uptake of AI in the future.
Broadband Subscriptions and Social Media Users
Another question that is frequently raised is the extent to which fixed- and mobile-broadband subscriptions are good measures to gauge actual users. In this context, this study examined the number of social media users in the region to explore the relationship between broadband subscriptions and social media users, as an indicator of the level of active Internet users (see Table 7). The country-level numbers are shown in Figures 32 and 33 for fixed- and mobile-broadband subscriptions, respectively. Figures presented in Annex 8 demonstrate the correlations between fixed- and mobile-broadband subscriptions and social media users, and there seems to be 0.75 active social media user for every mobile-broadband subscription and 3.18 social media users for every fixed-broadband subscription in the region.
Table 7. The number of users of social media, mobile broadband and fixed-broadband in Asia and the Pacific, 2016-2017
Total number of users/subscriptions (millions)
Number of users/subscriptions per 100 inhabitants (population weighted)
Social Media 1,621.8 36.7Mobile Broadband 2,153.0 48.7Fixed-broadband 509.6 11.6
Source: Produced by ESCAP, based on broadband data from ITU World Telecommunication/ICT Indicators Database (accessed July 2017); and data on active social media users from We are Social Singapore.
Artificial Intelligence and Broadband Divide: State of ICT Connectivity in Asia and the Pacific
56

Foundation for AI: Broadband Connectivity
Figure 32. Active social media users and fixed-broadband subscriptions per 100 inhabitants
Republic of Korea 41.183.9 Sri Lanka 22.5
4.1
Hong Kong, China 35.574.7 Kyrgyzstan 10.4
4.1
New Zealand 32.469.0 Bhutan 36.9
3.9
Japan 31.550.6 Bangladesh 16.0
3.8
Australia 30.466.1 Micronesia 19.0
3.0
Macao, China 30.069.1 Tonga 43.9
2.8
Singapore 25.477.0 Indonesia 41.0
1.9
China 22.955.9 Marshall Islands 39.4
1.9
Russian Federation 19.539.4 Vanuatu 16.3
1.6
French Polynesia 19.452.5 India 14.7
1.4
Azerbaijan 18.621.6 Fiji 47.9
1.4
Georgia 15.851.3 Samoa 42.7
1.2
Kazakhstan 13.718.3 Pakistan 16.2
0.9
Turkey 13.661.9 Nepal 24.7
0.8
Islamic Republic of Iran 11.621.1 Cambodia 30.7
0.6
Thailand 68.110.7 Lao PDR 25.2
0.3
Armenia 36.810.1 Papua New Guinea 8.0
0.2
Tuvalu 28.210.1 Solomon Islands 8.2
0.2
Viet Nam 48.89.9 Timor-Leste 33.5
0.1
Uzbekistan 2.6 9.1 Kiribati 10.3
0.1
Malaysia 70.798.7 Turkmenistan 0.6
0.1
Brunei Darussalam 85.38.3 Tajikistan 1.2
0.1
Mongolia 54.07.6 Myanmar 25.6
0.1
Maldives 85.17.2 Afghanistan 9.2
0.0
Philippines 58.0 5.5
0 45 90 0 45 90Active users/subscriptions per 100 inhabitants
Fixed-broadband subscriptions Active social media users
Source: Produced by ESCAP, based on fixed-broadband data from ITU World Telecommunication/ICT Indicators Database (accessed July 2017); and data on active social media users from We are Social Singapore.
57
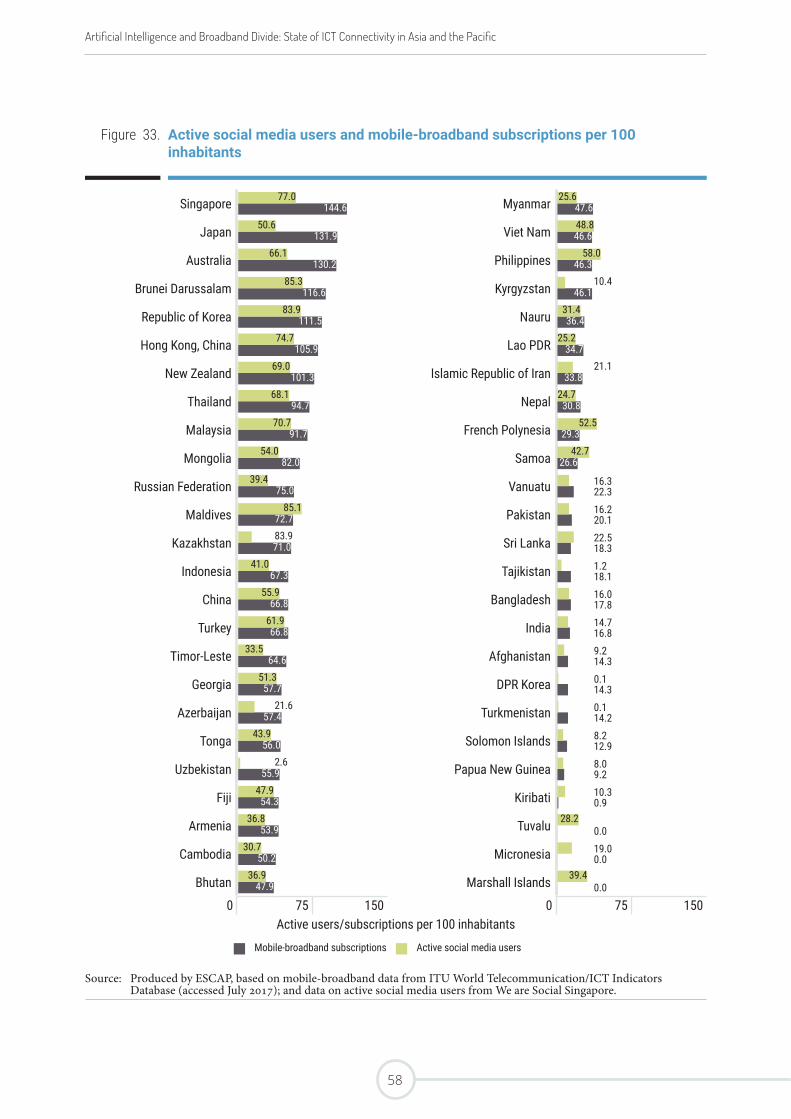
Figure 33. Active social media users and mobile-broadband subscriptions per 100 inhabitants
Singapore 144.677.0 Myanmar 47.6
25.6
Japan 131.950.6 Viet Nam 46.6
48.8
Australia 130.266.1 Philippines 46.3
58.0
Brunei Darussalam 116.685.3 Kyrgyzstan 46.1
10.4
Republic of Korea 111.583.9 Nauru 36.4
31.4
Hong Kong, China 105.974.7 Lao PDR 34.7
25.2
New Zealand 101.369.0 Islamic Republic of Iran 33.8
21.1
Thailand 94.768.1 Nepal 30.8
24.7
Malaysia 91.770.7 French Polynesia 29.3
52.5
Mongolia 82.054.0 Samoa 26.6
42.7
Russian Federation 75.039.4 Vanuatu 16.3
22.3
Maldives 72.785.1 Pakistan 16.2
20.1
Kazakhstan 71.083.9 Sri Lanka 22.5
18.3
Indonesia 67.341.0 Tajikistan 1.2
18.1
China 66.855.9 Bangladesh 16.0
17.8
Turkey 66.861.9 India 14.7
16.8
Timor-Leste 64.633.5 Afghanistan 9.2
14.3
Georgia 57.751.3 DPR Korea 0.1
14.3
Azerbaijan 57.421.6 Turkmenistan 0.1
14.2
Tonga 56.043.9 Solomon Islands 8.2
12.9
Uzbekistan 55.92.6 Papua New Guinea 8.0
9.2
Fiji 54.347.9 Kiribati 10.3
0.9
Armenia 53.936.8 Tuvalu 28.2
0.0
Cambodia 50.230.7 Micronesia 19.0
0.0
Bhutan 47.936.9 Marshall Islands 39.4
0.0
0 75 150 0 75 150Active users/subscriptions per 100 inhabitants
Mobile-broadband subscriptions Active social media users
Source: Produced by ESCAP, based on mobile-broadband data from ITU World Telecommunication/ICT Indicators Database (accessed July 2017); and data on active social media users from We are Social Singapore.
Artificial Intelligence and Broadband Divide: State of ICT Connectivity in Asia and the Pacific
58
8 Challenges
Despite the benefits that AI can bring to the region, there are formidable challenges ahead for the majority of ESCAP member countries.
The targets are shifting when it comes to bridging the digital divide, as additional layers of digital technologies have been added to the equation and the developed countries across the globe have been embracing these technologies by heavily investing in AI. This new “normal”, the world with AI, is expected to affect a number of professions, sectors and countries, but a clear picture has not emerged yet. Some of the challenges identified in this report are not new. However, the context has changed with the emergence of AI, and it has become more urgent to take actions before opportunities for developing countries to catch up dissipate.
59
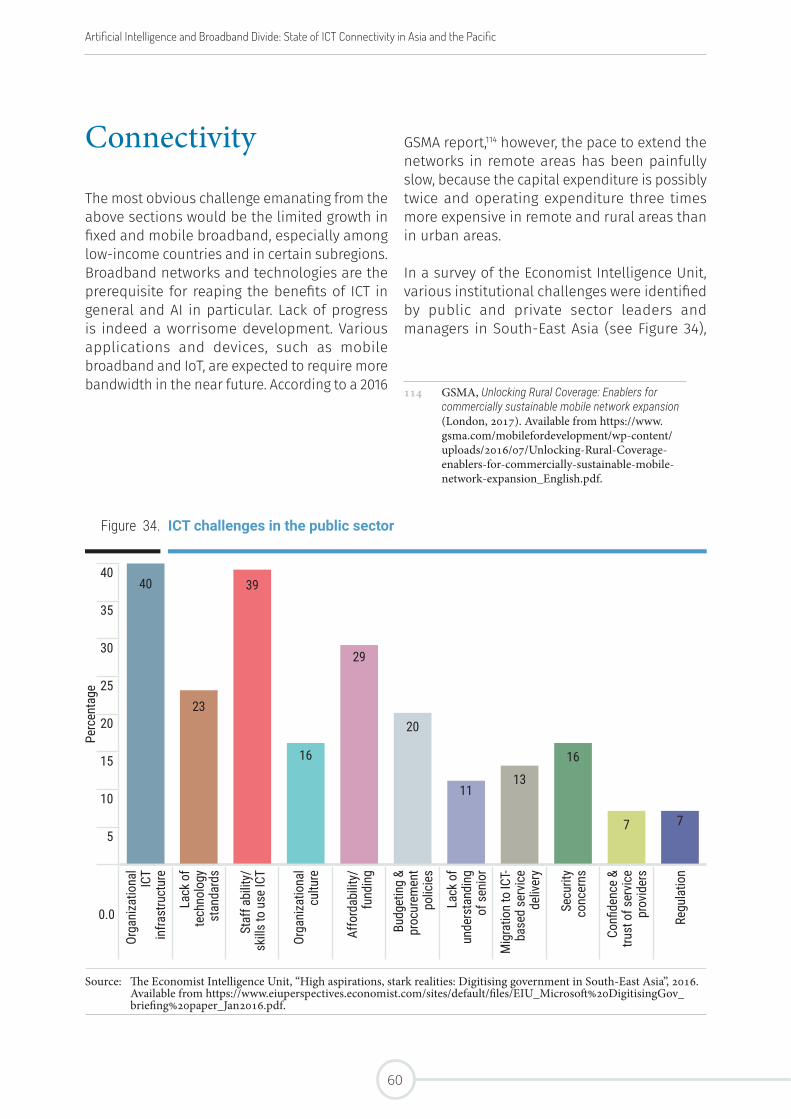
Connectivity
The most obvious challenge emanating from the above sections would be the limited growth in fixed and mobile broadband, especially among low-income countries and in certain subregions. Broadband networks and technologies are the prerequisite for reaping the benefits of ICT in general and AI in particular. Lack of progress is indeed a worrisome development. Various applications and devices, such as mobile broadband and IoT, are expected to require more bandwidth in the near future. According to a 2016
GSMA report,114 however, the pace to extend the networks in remote areas has been painfully slow, because the capital expenditure is possibly twice and operating expenditure three times more expensive in remote and rural areas than in urban areas.
In a survey of the Economist Intelligence Unit, various institutional challenges were identified by public and private sector leaders and managers in South-East Asia (see Figure 34),
114 GSMA, Unlocking Rural Coverage: Enablers for commercially sustainable mobile network expansion (London, 2017). Available from https://www.gsma.com/mobilefordevelopment/wp-content/uploads/2016/07/Unlocking-Rural-Coverage-enablers-for-commercially-sustainable-mobile-network-expansion_English.pdf.
Figure 34. ICT challenges in the public sector
Perc
enta
ge
4040
23
39
16
29
20
1113
16
7 7
35
30
25
20
15
10
5
0.0
Orga
niza
tiona
l IC
T in
frast
ruct
ure
Lack
of
tech
nolo
gy
stan
dard
s
Staf
f abi
lity/
skills
to u
se IC
T
Orga
niza
tiona
l cu
lture
Affo
rdab
ility/
fund
ing
Budg
etin
g &
proc
urem
ent
polic
ies
Lack
of
unde
rsta
ndin
g of
sen
ior
Mig
ratio
n to
ICT-
base
d se
rvic
e de
liver
y
Secu
rity
conc
erns
Confi
denc
e &
trust
of s
ervic
e pr
ovid
ers
Regu
latio
n
Source: The Economist Intelligence Unit, “High aspirations, stark realities: Digitising government in South-East Asia”, 2016. Available from https://www.eiuperspectives.economist.com/sites/default/files/EIU_Microsoft%20DigitisingGov_briefing%20paper_Jan2016.pdf.
Artificial Intelligence and Broadband Divide: State of ICT Connectivity in Asia and the Pacific
60
Challenges
and the ICT infrastructure was identified as the most significant challenge by the respondents.
Capacity at Various Levels
Notwithstanding its potential to drive economic growth, many experts have named AI as a top driver of economic, geopolitical and technological risks. The WEF’s Global Risks Report 2017115 highlighted that while AI may create significant benefits to society, it may also have considerable negative consequences and there is a need for strong governance.
Hence, it is critical that countries in the Asia-Pacific region are equipped with the capacity to recognize and respond to opportunities and challenges as a result of AI technology development. While decision makers at firms based in the Asia-Pacific region are largely convinced of the benefits AI and automation technology will bring to their own prospects and the region’s economy as a whole, many firms have not yet fully committed resources to capitalize on these beliefs. A recent survey conducted by Microsoft116 among youth in 14 markets in the Asia-Pacific region revealed that youth in the region expects AI to have the largest impact on their future lives. However, six in ten youth in the surveyed economies feel their country is not ready to adapt to digital disruptions, mentioning making technology accessible to all citizens as a key priority. In a recent ESCAP study on the
115 WEF, Global Risk Report 2017 (Geneva, 2017). Available from http://www3.weforum.org/docs/GRR17_Report_web.pdf.
116 Microsoft, “Asia Pacific youth expect Artificial Intelligence to have biggest impact on their future: Microsoft survey”, 22 February 2017. Available from https://news.microsoft.com/apac/2017/02/22/asia-pacific-youth-expect-artificial-intelligence-to-have-biggest-impact-on-their-future-microsoft-survey.
teaching of ICT at institutes of higher learning,117 it appears that curriculums and programmes at Asia-Pacific universities may not be fully ready to take up emerging technology and develop human capacities.
Training Required to Address Skill Gaps in AI-Related Technologies
Globally, the shortage of highly-skilled workers could top 40 million by year 2020.118 A recent CompTIA report pointed out that in 2017, there are skills gaps of required human capacity in areas of AI, business process automation and IoT. The skills gaps occurred both in new hire and the existing workforce in the areas of: integrating different applications, data source, platform and devices; cloud infrastructure and cloud application skills; digital business transformation or skills for modernizing legacy hardware or software; and cybersecurity.119 To bridge the skills gaps, it has been recommended that governments provide sufficient infrastructure and support universal education as foundations, build human capacities from the early stage of schooling to higher education, and promote lifelong learning, including through e-learning and access to massive open online courses.
117 ESCAP, “Planning processes, policies and initiatives in ICTD education at institutions of higher learning (IHLs) in Asia and the Pacific”, 2017. Available from http://www.unescap.org/resources/planning-processes-policies-andinitiatives-ictd-education-institutions-higher-learning.
118 Asia-Pacific Economic Cooperation, “Big Data Analytics in Critical Demand Across APEC”, 21 June 2017. Available from https://www.apec.org/Press/Features/2017/0620_DSA.
119 David Weldon, “AI, business process automation the hardest skills to find”, Information Management, 23 June 2017. Available from https://www.information-management.com/news/artificial-intelligence-automation-the-hardest-skills-to-find.
61
Investment and Research
The potential benefits of machine learning and AI in a wide range of fields have led to massive investments in AI research from the private sector as well as from governments. CB Insights found that venture capitalists alone invested more than USD 1.5 billion in AI during the first half of 2016, adding to the billions already invested and planned by governments.120 The investment and research, however, should not only be the prerogative of developed countries. Universities and research institutes across the region should update their research programmes with increased emphasis, and governments and other entities should invest in the development and scale up of AI-enabled applications, solutions and products. For this, multi-stakeholder collaboration, particularly the linkages between academia and research with industry, will be essential.
120 CB Insights, “Artificial Intelligence explodes: New deal activity record for AI startups”, 20 June 2016. Available from https://www.cbinsights.com/research/artificial-intelligence-funding-trends; and Joshua New, “How Governments are Preparing for Artificial Intelligence”, Center for Data Innovation, 18 August 2017. Available from https://www.datainnovation.org/2017/08/how-governments-are-preparing-for-artificial-intelligence/.
Cybersecurity
Cyberattacks and cybercrimes are increasing not only in number but also in magnitude and complexity. Privacy and personal data breaches are of concern due to increase in the connections of infrastructure and enhanced sophistication assisted by AI. While cybercrime is estimated to result in over USD 2 trillion of losses by 2019,121 the global shortage of cybersecurity professionals could reach to two millions within the same time frame.122 AI can offer important benefits in the cybersecurity field in areas such as identity analytics, malware detection and incident response. Furthermore, machine learning has the potential to address traditional cybersecurity challenges like dealing with floods of false alerts (false positives) or solving complex security problems rapidly. While cybersecurity developers and chief information security officers may need months or years to understand a cyberattack and come up with a solution that may not even be feasible anymore due to the changing tactical behaviour of cybercriminals, machine learning systems can detect unusual activities in real time. The IoT, for example, connects devices that have very low security measures (by design) creating vulnerability in the system. Surveillance cameras have often been the entry point for hackers due to the lack of processors to enable security. Machine learning systems developed at MIT are now able to predict 85 per cent of such cyberattacks.123 Some systems use machine learning to learn the behaviour of a network
121 Juniper Research, “Cybercrime will cost businesses over $2 trillion by 2019”, 12 May 2015. Available from https://www.juniperresearch.com/press/press-releases/cybercrime-cost-businesses-over-2trillion.
122 Jeff Kauflin, “The Fast-Growing Job With A Huge Skills Gap: Cyber Security”, Forbes, 16 March 2017. Available from https://www.forbes.com/sites/jeffkauflin/2017/03/16/the-fast-growing-job-with-a-huge-skills-gap-cyber-security/.
123 Nicholas Fearn, “Artificial Intelligence in the workplace: Timesaving, chatbots & security”, IDG Connect, 2 December 2016. Available from http://www.idgconnect.com/abstract/22943/artificial-intelligence-workplace-timesaving-chatbots-security.
Artificial Intelligence and Broadband Divide: State of ICT Connectivity in Asia and the Pacific
62
Challenges
from inside and detect abnormal activities indicative of an attack in real time. This allows developers to respond to the attack efficiently and reduce network vulnerabilities considerably.
Biases Vulnerabilities
Other challenges are related to non-malicious vulnerabilities such as system failure. Like humans, automated systems can also develop biases. When automated systems make decisions bypassing humans, their biases may lead to significant consequences depending on their applications.124 The stock market flash crash of 2010 is an example of automated system failure in the financial system that resulted in a liquidity crisis.125 Consequences can be even more severe when the applications are used in fields like autonomous navigation systems or AI weapon systems.126 Addressing these challenges requires cooperation in the international community.
124 Richard Clarke and R. P. Eddy, “The ‘Internet of Things’ is way more vulnerable than your think—and it’s not just to hackers”, Quartz, 13 June 2017. Available from https://qz.com/1000272/its-not-just-the-nhs-in-the-internet-of-things-everything-is-more-hackable-than-you-think/.
125 The Economist, “What caused the flash crash? One big, bad trade”, 1 October 2010. Available from https://www.economist.com/blogs/newsbook/2010/10/what_caused_flash_crash.
126 WEF, “3.2 Assessing the risk of artificial intelligence”, in The Global Risk Report 2017 (Geneva, 2017). Available from http://reports.weforum.org/global-risks-2017/part-3-emerging-technologies/3-2-assessing-the-risk-of-artificial-intelligence/.
63

Artificial Intelligence and Broadband Divide: State of ICT Connectivity in Asia and the Pacific
64
9 Conclusion
AI will be adopted rapidly once all the right conditions are in place and ignite a big bang effect, according to the above-mentioned
MIT report. However, this means that without robust broadband connectivity, the development and expansion of AI will be close to impossible.
65
Another condition for AI adoption that some authors have noted is the need for continuous learning in all sectors, as there is not a one-size-fits-all approach to AI. It is therefore necessary to learn and continue developing better algorithms, products, applications and implementations in diverse linguistic, social, cultural, economic and political environments. Subsequently, this would require a shift in focus on AI-enabling education, investment and infrastructure.
It is critical to plan and implement measures to mitigate known negative impacts and foster positive influences of AI on society. As mentioned in this report, many predict that low-skilled and labour intensive work, as well as some specialized professions may be vulnerable to automation and AI-supported services. It is important to identify these areas and explore ways to mitigate the impact by creating new training, employment and businesses. This also includes acceleration of the introduction and implementation of digital components that support AI, such as broadband infrastructure development.
All the above would not be possible unless multi-stakeholder cooperation and collaboration are put in place among government, private sector, academia and civil society groups, so as to identify challenges and opportunities from various socioeconomic angles. Cooperation and collaboration should not only take place at national levels but also at regional levels. In this context, regional cooperation platforms could be a particularly important mechanism to address challenges and come up with common solutions and approaches.
Data is now considered the “new oil”,127 which means that it is a valuable resource and commodity that provides strategic insights and new knowledge in a wide socioeconomic context. In addition to broadband connectivity,
127 The Economist, “The world’s most valuable resource is no longer oil, but data”, 6 May 2017. Available from https://www.economist.com/news/leaders/21721656-data-economy-demands-new-approach-antitrust-rules-worlds-most-valuable-resource.
ESCAP member countries should take stock of the data requirements and future-proof broadband networks and ICT initiatives.
Where to start is the next question. As this report highlighted, the target in narrowing the digital divide seems to be moving and the broadband divide now has a new dimension of AI and its digital components. In this new context, the gap between developing and developed countries is much wider than previously thought. Accelerated investment in broadband connectivity and capacity development in digital technology would certainly feature on the to-do list. Capacity development would enable the ESCAP member countries to customize and localize applications, and better understand AI algorithms.
In the process of AI uptake, cybersecurity has emerged as one of the priority areas for government interventions. AI can identify security threats and risks, but introduction of various digital components without security measures will increase vulnerabilities, as illustrated above.
Bridging digital divides and enabling everyone in Asia and the Pacific to take advantage of the opportunities offered by ICT is one of the key pillars of the Asia-Pacific Information Superhighway, an ESCAP member-driven initiative to improve regional broadband connectivity through a dense web of open-access cross-border infrastructure. This study is conducted in support of the Asia-Pacific Information Superhighway initiative. It aims to stimulate discussions among policymakers, private sector, academia and think tanks on how regional broadband connectivity and AI could be shaped to achieve inclusive broadband, develop the digital economy in the region, and achieve the SDGs as outlined in the ambitious 2030 Agenda for Sustainable Development.
Artificial Intelligence and Broadband Divide: State of ICT Connectivity in Asia and the Pacific
66

Annexes
67
Annex 1 | The Evolution of Artificial Intelligence
Artificial Intelligence (AI) is “the mechanical simulation system of collecting knowledge and information and processing intelligence of universe: (collating and interpreting) and disseminating it to the eligible in the form of actionable intelligence.”128 Many tech companies, like Microsoft,129 Google and Baidu have invested in AI laboratories, as they believe AI is essential to social development.
While the term “Artificial Intelligence” was coined in 1955 to describe a new computer science sub-discipline, today it includes a variety of technologies and tools ranging from speech recognition to virtual agents. The increased prominence of AI approaches over the past 25 years has been boosted by the adoption of statistical and probabilistic methods, the availability of large amounts of data, and increased computer processing power. Recent advances in technologies such as deep learning, and the rapid expansion of process automation in various sectors, including manufacturing, transportation and financial services, mean that AI’s impact is growing exponentially.
Recently, AI has gained widespread media attention. For instance, in 2014, as part of the “Todai Robot Project”, researchers were able to create an AI system that answered real questions on university entrance examinations, and found that the system was competent enough to pass the entrance exams of more than half of the private universities in Japan. More recently, in 2016, an AI program that trained itself to play the traditional game of Go beat the 18-time world champion Lee Sedol. Unlike chess, the computer cannot be programmed to simply memorize all possible combinations of board pieces in the game of Go and execute a strategy accordingly, which makes it a textbook example of AI utilization.
While encouraging innovation, decision makers must ensure that policies and processes related to AI address ethical, privacy and security implications. Moreover, it is critical to ensure equitable and universal access to the benefits of AI technologies throughout the Asia-Pacific region. Since AI is expected to touch many aspects of our lives in the upcoming years and decades, policymakers, academia, the private sector and society play a major role in progressing AI towards shaping sustainable and equitable societies, and achieving the goals of the 2030 Agenda for Sustainable Development.
128 Dalvinder Singh Grewal, “A Critical Conceptual Analysis of Definitions of Artificial Intelligence as Applicable to Computer Engineering”, IOSR Journal of Computer Engineering, vol. 16, no. 2 (March-April 2014), pp. 9-13.
129 Microsoft, “Artificial Intelligence”. Available from https://www.microsoft.com/en-us/research/research-area/artificial-intelligence/.
Artificial Intelligence and Broadband Divide: State of ICT Connectivity in Asia and the Pacific
68
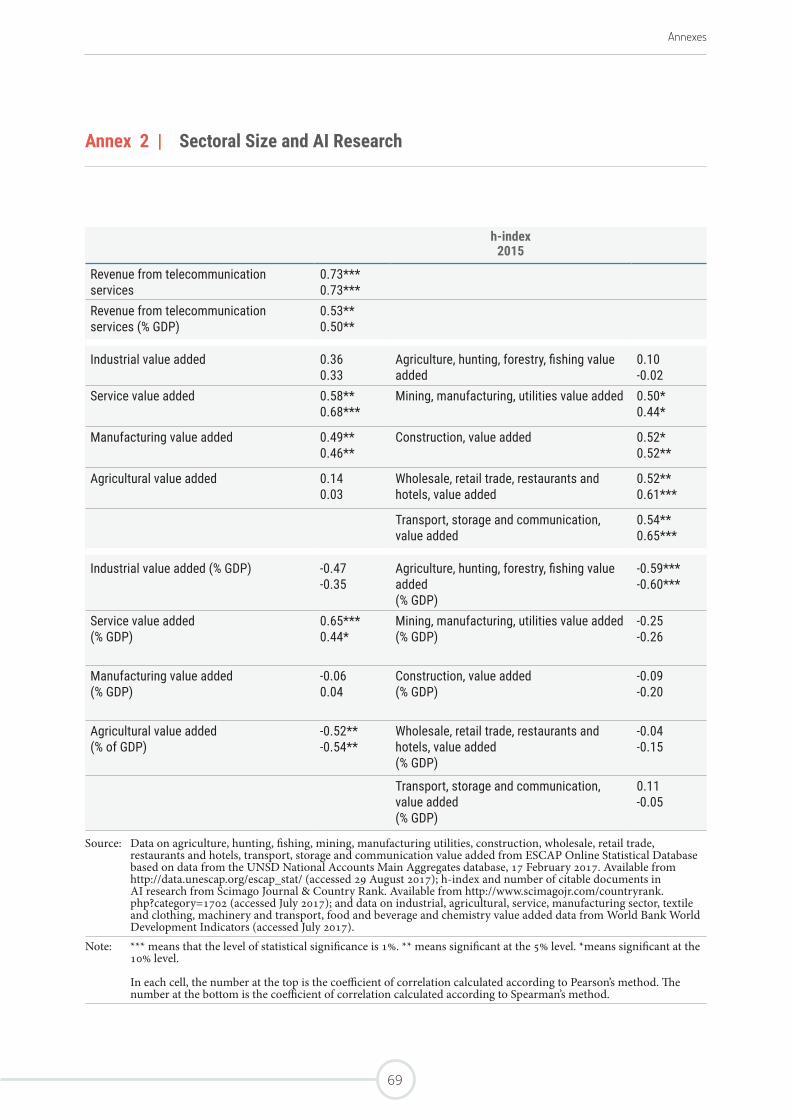
Annexes
Annex 2 | Sectoral Size and AI Research
h-index2015
Revenue from telecommunication services
0.73***0.73***
Revenue from telecommunication services (% GDP)
0.53**0.50**
Industrial value added 0.360.33
Agriculture, hunting, forestry, fishing value added
0.10-0.02
Service value added 0.58**0.68***
Mining, manufacturing, utilities value added 0.50*0.44*
Manufacturing value added 0.49**0.46**
Construction, value added 0.52*0.52**
Agricultural value added 0.140.03
Wholesale, retail trade, restaurants and hotels, value added
0.52**0.61***
Transport, storage and communication, value added
0.54**0.65***
Industrial value added (% GDP) -0.47-0.35
Agriculture, hunting, forestry, fishing value added (% GDP)
-0.59***-0.60***
Service value added (% GDP)
0.65***0.44*
Mining, manufacturing, utilities value added(% GDP)
-0.25-0.26
Manufacturing value added (% GDP)
-0.060.04
Construction, value added (% GDP)
-0.09-0.20
Agricultural value added (% of GDP)
-0.52**-0.54**
Wholesale, retail trade, restaurants and hotels, value added (% GDP)
-0.04-0.15
Transport, storage and communication, value added (% GDP)
0.11-0.05
Source: Data on agriculture, hunting, fishing, mining, manufacturing utilities, construction, wholesale, retail trade, restaurants and hotels, transport, storage and communication value added from ESCAP Online Statistical Database based on data from the UNSD National Accounts Main Aggregates database, 17 February 2017. Available from http://data.unescap.org/escap_stat/ (accessed 29 August 2017); h-index and number of citable documents in AI research from Scimago Journal & Country Rank. Available from http://www.scimagojr.com/countryrank.php?category=1702 (accessed July 2017); and data on industrial, agricultural, service, manufacturing sector, textile and clothing, machinery and transport, food and beverage and chemistry value added data from World Bank World Development Indicators (accessed July 2017).
Note: *** means that the level of statistical significance is 1%. ** means significant at the 5% level. *means significant at the 10% level.
In each cell, the number at the top is the coefficient of correlation calculated according to Pearson’s method. The number at the bottom is the coefficient of correlation calculated according to Spearman’s method.
69
Annex 3 | Artificial Intelligence Research and ICT Adoption, Economic and Technological Indicators
The coefficients in Table 3.1 demonstrate that research in Artificial Intelligence (AI), both in terms of quantity and quality, tends to be highly correlated with economic variables, information and communications technology (ICT) adoption indicators, as well as the level of investment in ICT and technology absorption. Identifying direct causal links from the table is a difficult task and would require extensive econometric analysis. However, it is possible to conclude that countries with high AI research indicators are also the most ready to reap the benefits of AI applications as they tend to be the countries with good connectivity infrastructure.
With the exception of mobile broadband and the h-index, all coefficients of correlation using ICT adoption indicators are significant at the 1 per cent level and have a high magnitude. Countries with a high h-index and a high number of citable documents also tend to be those with a high annual investment in ICT, a high number of patents per million people and a high technology absorption index, as suggested by the coefficients of correlation. In other words, AI research is more likely to translate into direct tangible economic benefits in these countries.
The strong and significant coefficients of correlation between economic variables and AI research indicators show that richer countries and countries characterized by a big market size are more likely to produce extensive and better quality AI research. It also indicates that the gap between richer and less economically-advanced countries is likely to widen in the near future as AI is expected to generate substantial economic returns.
Artificial Intelligence and Broadband Divide: State of ICT Connectivity in Asia and the Pacific
70
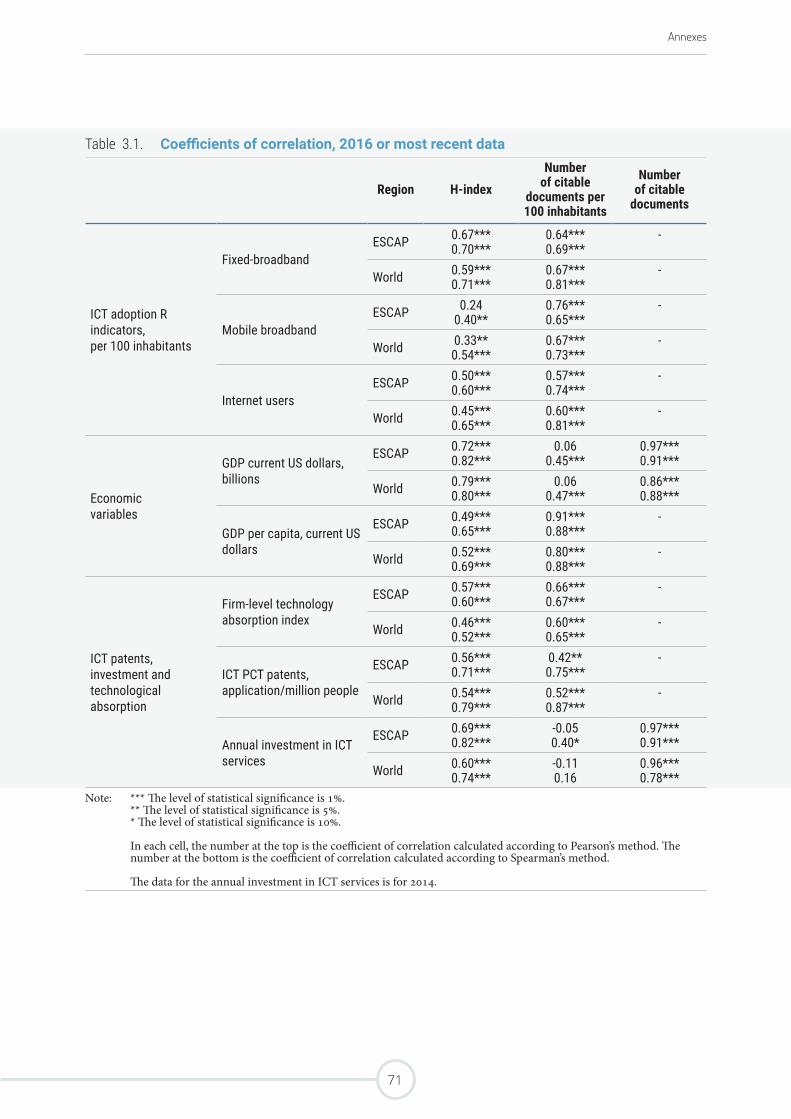
Annexes
Table 3.1. Coefficients of correlation, 2016 or most recent data
Region H-indexNumber
of citable documents per 100 inhabitants
Number of citable
documents
ICT adoption R indicators, per 100 inhabitants
Fixed-broadbandESCAP 0.67***
0.70***0.64***0.69***
-
World 0.59***0.71***
0.67***0.81***
-
Mobile broadbandESCAP 0.24
0.40**0.76***0.65***
-
World 0.33**0.54***
0.67***0.73***
-
Internet usersESCAP 0.50***
0.60***0.57***0.74***
-
World 0.45***0.65***
0.60***0.81***
-
Economic variables
GDP current US dollars, billions
ESCAP 0.72***0.82***
0.060.45***
0.97***0.91***
World 0.79***0.80***
0.060.47***
0.86***0.88***
GDP per capita, current US dollars
ESCAP 0.49***0.65***
0.91***0.88***
-
World 0.52***0.69***
0.80***0.88***
-
ICT patents, investment and technological absorption
Firm-level technology absorption index
ESCAP 0.57***0.60***
0.66***0.67***
-
World 0.46***0.52***
0.60***0.65***
-
ICT PCT patents, application/million people
ESCAP 0.56***0.71***
0.42**0.75***
-
World 0.54***0.79***
0.52***0.87***
-
Annual investment in ICT services
ESCAP 0.69***0.82***
-0.050.40*
0.97***0.91***
World 0.60***0.74***
-0.110.16
0.96***0.78***
Note: *** The level of statistical significance is 1%. ** The level of statistical significance is 5%. * The level of statistical significance is 10%.
In each cell, the number at the top is the coefficient of correlation calculated according to Pearson’s method. The number at the bottom is the coefficient of correlation calculated according to Spearman’s method.
The data for the annual investment in ICT services is for 2014.
71
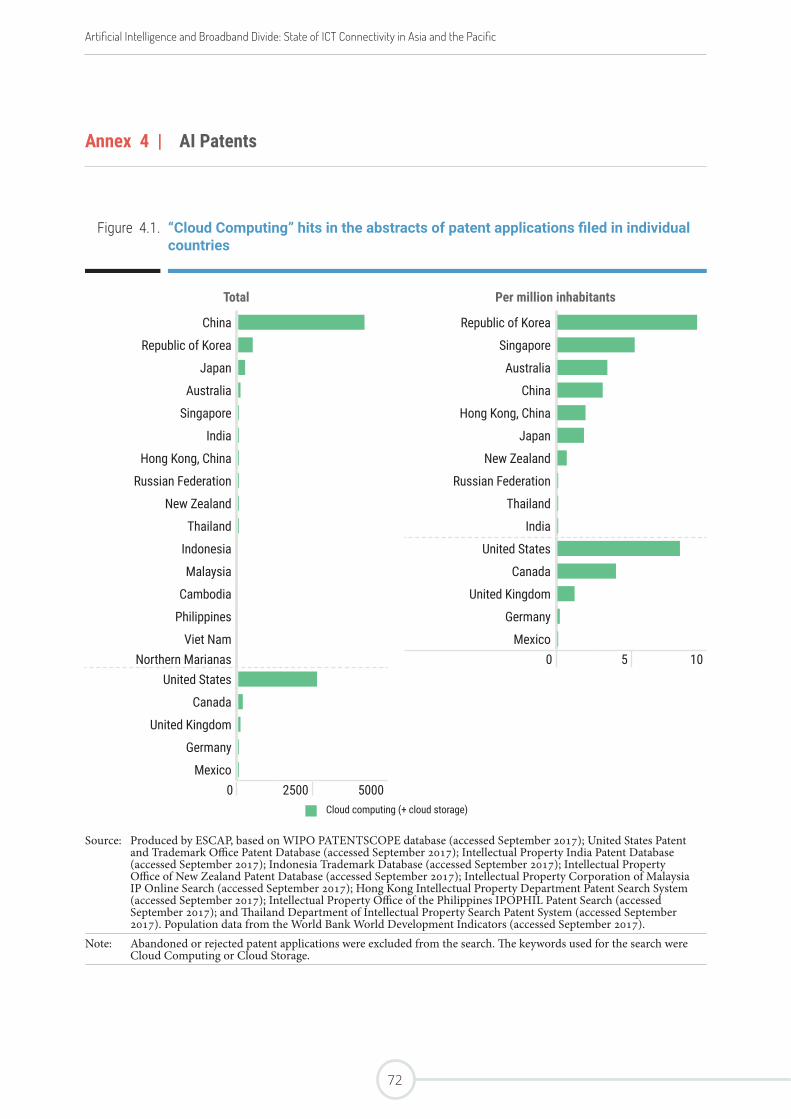
Annex 4 | AI Patents
Figure 4.1. “Cloud Computing” hits in the abstracts of patent applications filed in individual countries
Total Per million inhabitants
China Republic of Korea
Republic of Korea Singapore
Japan Australia
Australia China
Singapore Hong Kong, China
India Japan
Hong Kong, China New Zealand
Russian Federation Russian Federation
New Zealand Thailand
Thailand India
Indonesia United States
Malaysia Canada
Cambodia United Kingdom
Philippines Germany
Viet Nam MexicoNorthern Marianas 0 5 10
United States
Canada
United Kingdom
Germany
Mexico0 2500 5000
Cloud computing (+ cloud storage)
Source: Produced by ESCAP, based on WIPO PATENTSCOPE database (accessed September 2017); United States Patent and Trademark Office Patent Database (accessed September 2017); Intellectual Property India Patent Database (accessed September 2017); Indonesia Trademark Database (accessed September 2017); Intellectual Property Office of New Zealand Patent Database (accessed September 2017); Intellectual Property Corporation of Malaysia IP Online Search (accessed September 2017); Hong Kong Intellectual Property Department Patent Search System (accessed September 2017); Intellectual Property Office of the Philippines IPOPHIL Patent Search (accessed September 2017); and Thailand Department of Intellectual Property Search Patent System (accessed September 2017). Population data from the World Bank World Development Indicators (accessed September 2017).
Note: Abandoned or rejected patent applications were excluded from the search. The keywords used for the search were Cloud Computing or Cloud Storage.
Artificial Intelligence and Broadband Divide: State of ICT Connectivity in Asia and the Pacific
72
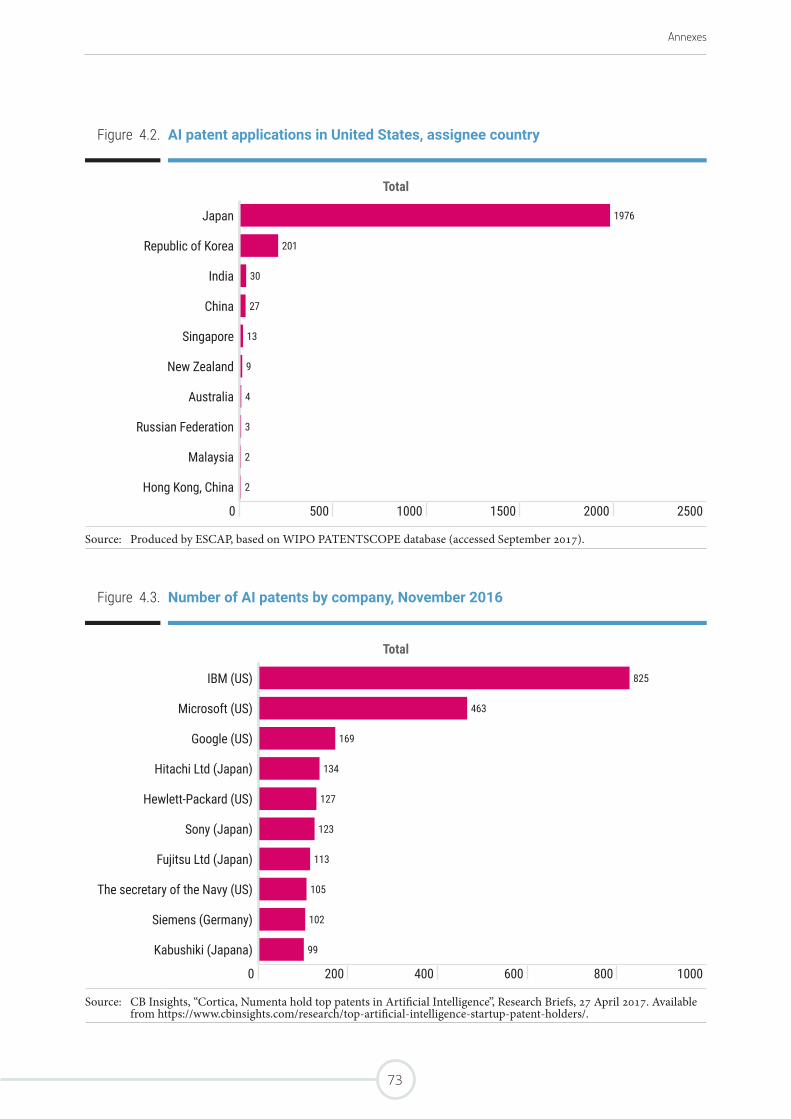
Annexes
Figure 4.2. AI patent applications in United States, assignee country
Total
Japan 1976
Republic of Korea 201
India 30
China 27
Singapore 13
New Zealand 9
Australia 4
Russian Federation 3
Malaysia 2
Hong Kong, China 2
0 500 1000 1500 2000 2500
Source: Produced by ESCAP, based on WIPO PATENTSCOPE database (accessed September 2017).
Figure 4.3. Number of AI patents by company, November 2016
Total
IBM (US) 825
Microsoft (US) 463
Google (US) 169
Hitachi Ltd (Japan) 134
Hewlett-Packard (US) 127
Sony (Japan) 123
Fujitsu Ltd (Japan) 113
The secretary of the Navy (US) 105
Siemens (Germany) 102
Kabushiki (Japana) 99
0 200 400 600 800 1000
Source: CB Insights, “Cortica, Numenta hold top patents in Artificial Intelligence”, Research Briefs, 27 April 2017. Available from https://www.cbinsights.com/research/top-artificial-intelligence-startup-patent-holders/.
73
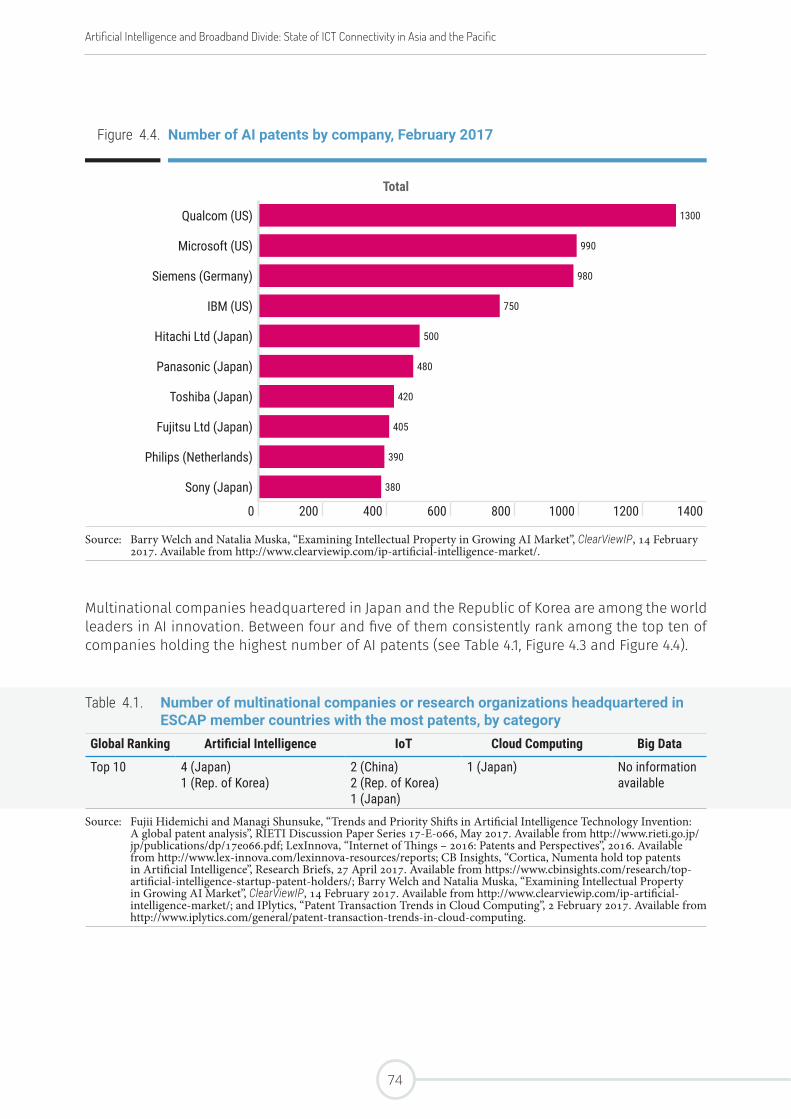
Multinational companies headquartered in Japan and the Republic of Korea are among the world leaders in AI innovation. Between four and five of them consistently rank among the top ten of companies holding the highest number of AI patents (see Table 4.1, Figure 4.3 and Figure 4.4).
Figure 4.4. Number of AI patents by company, February 2017
Total
Qualcom (US) 1300
Microsoft (US) 990
Siemens (Germany) 980
IBM (US) 750
Hitachi Ltd (Japan) 500
Panasonic (Japan) 480
Toshiba (Japan) 420
Fujitsu Ltd (Japan) 405
Philips (Netherlands) 390
Sony (Japan) 380
0 200 400 600 800 1000 1200 1400
Source: Barry Welch and Natalia Muska, “Examining Intellectual Property in Growing AI Market”, ClearViewIP, 14 February 2017. Available from http://www.clearviewip.com/ip-artificial-intelligence-market/.
Table 4.1. Number of multinational companies or research organizations headquartered in ESCAP member countries with the most patents, by category
Global Ranking Artificial Intelligence IoT Cloud Computing Big Data
Top 10 4 (Japan) 1 (Rep. of Korea)
2 (China)2 (Rep. of Korea)1 (Japan)
1 (Japan) No information available
Source: Fujii Hidemichi and Managi Shunsuke, “Trends and Priority Shifts in Artificial Intelligence Technology Invention: A global patent analysis”, RIETI Discussion Paper Series 17-E-066, May 2017. Available from http://www.rieti.go.jp/jp/publications/dp/17e066.pdf; LexInnova, “Internet of Things – 2016: Patents and Perspectives”, 2016. Available from http://www.lex-innova.com/lexinnova-resources/reports; CB Insights, “Cortica, Numenta hold top patents in Artificial Intelligence”, Research Briefs, 27 April 2017. Available from https://www.cbinsights.com/research/top-artificial-intelligence-startup-patent-holders/; Barry Welch and Natalia Muska, “Examining Intellectual Property in Growing AI Market”, ClearViewIP, 14 February 2017. Available from http://www.clearviewip.com/ip-artificial-intelligence-market/; and IPlytics, “Patent Transaction Trends in Cloud Computing”, 2 February 2017. Available from http://www.iplytics.com/general/patent-transaction-trends-in-cloud-computing.
Artificial Intelligence and Broadband Divide: State of ICT Connectivity in Asia and the Pacific
74

Annexes
The research performance of the two countries—Japan and the Republic of Korea—appears to be strong relative to their population size (see right column in Figure 4.1). Moreover, universities located in Hong Kong (China) and Singapore perform well in the world ranking for AI research established by the Times Higher Education as four of them appear in the top ten. In the case of Hong Kong (China), our research also shows that a high proportion of AI-related patents are submitted by universities (see Table 4.2).
It is reasonable to expect the most economically-advanced countries to enter a virtuous cycle as predicted by endogenous growth theories,130 where higher economic development leads to more research and development, which in turn spurs economic development.
This will probably accentuate the development gap between the economically-advanced and relatively poorer countries that are characterized by modest or small market sizes. Without research and development in AI, the latter countries may only be able to extensively use AI-based products/solutions with or without localization when they become more affordable in the later stages of the technology life cycle. The lack of infrastructure would still constitute a barrier that may significantly impede or delay adoption.
130 See for example, Paul M. Romer, “The Origins of Endogenous Growth”, The Journal of Economic Perspectives, vol. 8, no. 1 (Winter 1994), pp. 3-22.
Table 4.2. Leading universities/research institutions in AI research in the Asia-Pacific region, 2017
Institution Country Global Rank Regional Rank Publications Field-weighted Citation Impact
Nanyang Technological University Singapore 3 1 1,197 2.51Institute of Automation, Chinese Academy of Science
China 7 2 588 2.26
Hong Kong Polytechnic University Hong Kong, China
8 3 602 2.20
National University of Singapore Singapore 9 4 807 2.14Chinese University of Hong Kong Hong Kong,
China10 5 530 2.09
Source: Simon Baker, “Which countries and universities are leading on AI research?” Times Higher Education, 22 May 2017. Available from https://www.timeshighereducation.com/data-bites/which-countries-and-universities-are-leading-ai-research.
Table 4.1. Number of multinational companies or research organizations headquartered in ESCAP member countries with the most patents, by category
Global Ranking Artificial Intelligence IoT Cloud Computing Big Data
Top 10 4 (Japan) 1 (Rep. of Korea)
2 (China)2 (Rep. of Korea)1 (Japan)
1 (Japan) No information available
Source: Fujii Hidemichi and Managi Shunsuke, “Trends and Priority Shifts in Artificial Intelligence Technology Invention: A global patent analysis”, RIETI Discussion Paper Series 17-E-066, May 2017. Available from http://www.rieti.go.jp/jp/publications/dp/17e066.pdf; LexInnova, “Internet of Things – 2016: Patents and Perspectives”, 2016. Available from http://www.lex-innova.com/lexinnova-resources/reports; CB Insights, “Cortica, Numenta hold top patents in Artificial Intelligence”, Research Briefs, 27 April 2017. Available from https://www.cbinsights.com/research/top-artificial-intelligence-startup-patent-holders/; Barry Welch and Natalia Muska, “Examining Intellectual Property in Growing AI Market”, ClearViewIP, 14 February 2017. Available from http://www.clearviewip.com/ip-artificial-intelligence-market/; and IPlytics, “Patent Transaction Trends in Cloud Computing”, 2 February 2017. Available from http://www.iplytics.com/general/patent-transaction-trends-in-cloud-computing.
75
Annex 5 | Cloud Computing Challenges
The heightened demand for computing power has raised several issues. The first one being the energy consumption of the data centres.131 Files that are transmitted over the network are a major contributor to energy consumption. Researchers found that the average consumption of a single data centre is equivalent to the energy consumption of 25,000 households.132 The infrastructure has to be managed in a power-efficient way, which constitutes a substantial challenge for sustainable development. Innovative technological systems must therefore be used to ensure environmental sustainability.133
Another major challenge cloud computing faces is ensuring adequate security and privacy,134 particularly of sensitive and personal data that are stored in data centres situated in foreign countries. In some developing countries, corruption, lack of transparency and a weak legal system can amplify security and privacy concerns.
By combining AI and data stored using cloud computing, large companies have the potential to monopolize the market. Over the past years, major platform providers have amassed immense amounts of data from countless users, enabling them to provide quality services at affordable costs. This, in turn, attracts even more users by virtue of the network effect, thus allowing platform providers to achieve economies of scale based on their numbers of users and volumes of data.
131 Ibrahim Alzamil and others, “Energy-aware profiling for cloud computing environments”, Electronic Notes in Theoretical Computer Science, vol. 318 (2015), pp. 91-108.
132 Patricia Arroba and others, “Server power modeling for run-time energy optimization of cloud computing facilities”, Energy Procedia, vol. 62 (2014), pp. 401-410.
133 Konstantinos Domdouzis, “Sustainable cloud computing”, in Green Information Technology: A Sustainable Approach, Mohammad Dastbaz, Colin Pattinson and Babak Akhgar, eds. (Waltham, MA, Morgan Kaufmann, 2015), pp. 95-110.
134 Lifei Wei and others, “Security and privacy for storage and computation in cloud computing”, Information Sciences, vol. 258 (2014), pp. 371-386.
Artificial Intelligence and Broadband Divide: State of ICT Connectivity in Asia and the Pacific
76
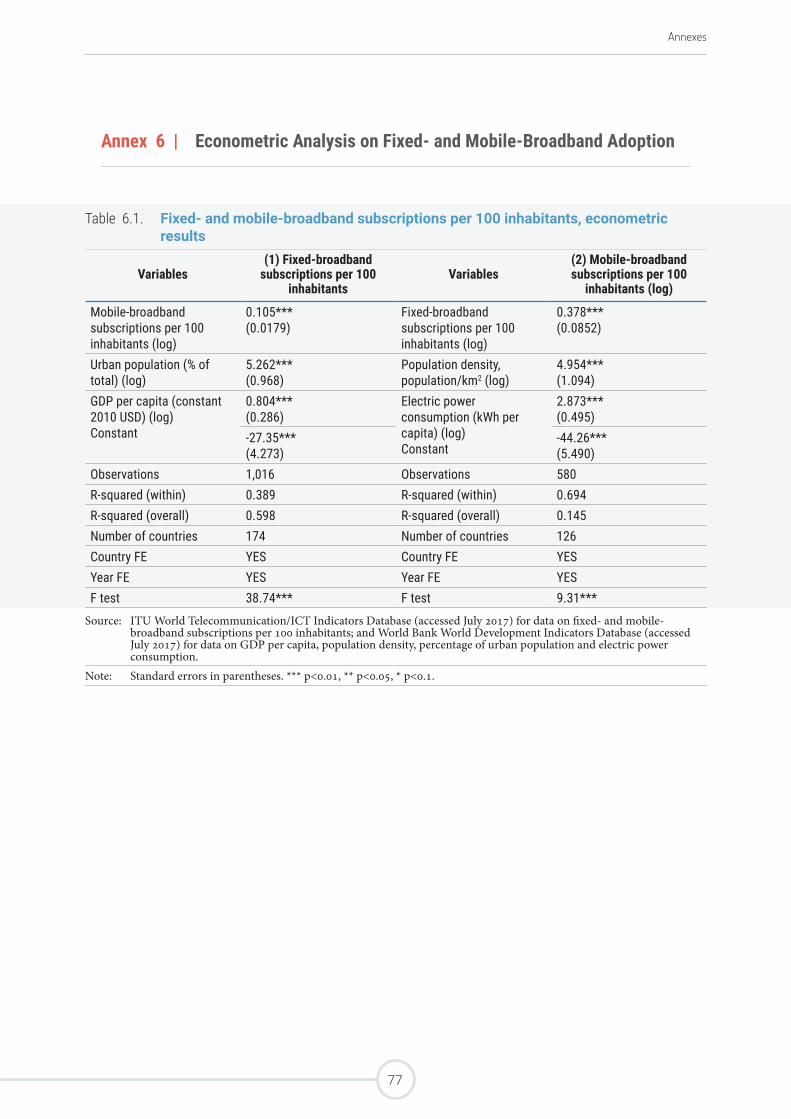
Annexes
Annex 6 | Econometric Analysis on Fixed- and Mobile-Broadband Adoption
Table 6.1. Fixed- and mobile-broadband subscriptions per 100 inhabitants, econometric results
Variables(1) Fixed-broadband
subscriptions per 100 inhabitants
Variables(2) Mobile-broadband subscriptions per 100
inhabitants (log)
Mobile-broadband subscriptions per 100 inhabitants (log)
0.105***(0.0179)
Fixed-broadband subscriptions per 100 inhabitants (log)
0.378***(0.0852)
Urban population (% of total) (log)
5.262***(0.968)
Population density, population/km2 (log)
4.954***(1.094)
GDP per capita (constant 2010 USD) (log)Constant
0.804***(0.286)
Electric power consumption (kWh per capita) (log)Constant
2.873***(0.495)
-27.35***(4.273)
-44.26***(5.490)
Observations 1,016 Observations 580R-squared (within) 0.389 R-squared (within) 0.694R-squared (overall) 0.598 R-squared (overall) 0.145Number of countries 174 Number of countries 126Country FE YES Country FE YESYear FE YES Year FE YESF test 38.74*** F test 9.31***
Source: ITU World Telecommunication/ICT Indicators Database (accessed July 2017) for data on fixed- and mobile-broadband subscriptions per 100 inhabitants; and World Bank World Development Indicators Database (accessed July 2017) for data on GDP per capita, population density, percentage of urban population and electric power consumption.
Note: Standard errors in parentheses. *** p<0.01, ** p<0.05, * p<0.1.
77
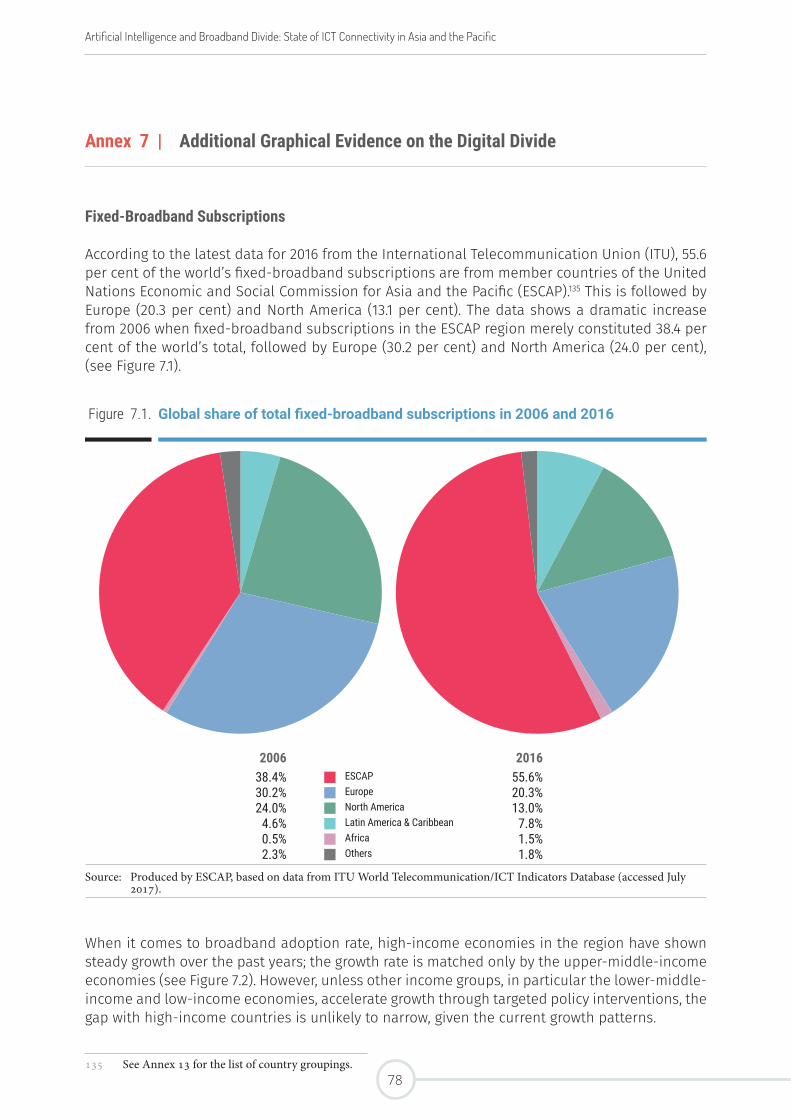
Annex 7 | Additional Graphical Evidence on the Digital Divide
Fixed-Broadband Subscriptions
According to the latest data for 2016 from the International Telecommunication Union (ITU), 55.6 per cent of the world’s fixed-broadband subscriptions are from member countries of the United Nations Economic and Social Commission for Asia and the Pacific (ESCAP).135 This is followed by Europe (20.3 per cent) and North America (13.1 per cent). The data shows a dramatic increase from 2006 when fixed-broadband subscriptions in the ESCAP region merely constituted 38.4 per cent of the world’s total, followed by Europe (30.2 per cent) and North America (24.0 per cent), (see Figure 7.1).
When it comes to broadband adoption rate, high-income economies in the region have shown steady growth over the past years; the growth rate is matched only by the upper-middle-income economies (see Figure 7.2). However, unless other income groups, in particular the lower-middle-income and low-income economies, accelerate growth through targeted policy interventions, the gap with high-income countries is unlikely to narrow, given the current growth patterns.
135 See Annex 13 for the list of country groupings.
Figure 7.1. Global share of total fixed-broadband subscriptions in 2006 and 2016
2006 201638.4% ESCAP 55.6%30.2% Europe 20.3%24.0% North America 13.0%
4.6% Latin America & Caribbean 7.8%0.5% Africa 1.5%2.3% Others 1.8%
Source: Produced by ESCAP, based on data from ITU World Telecommunication/ICT Indicators Database (accessed July 2017).
Artificial Intelligence and Broadband Divide: State of ICT Connectivity in Asia and the Pacific
78
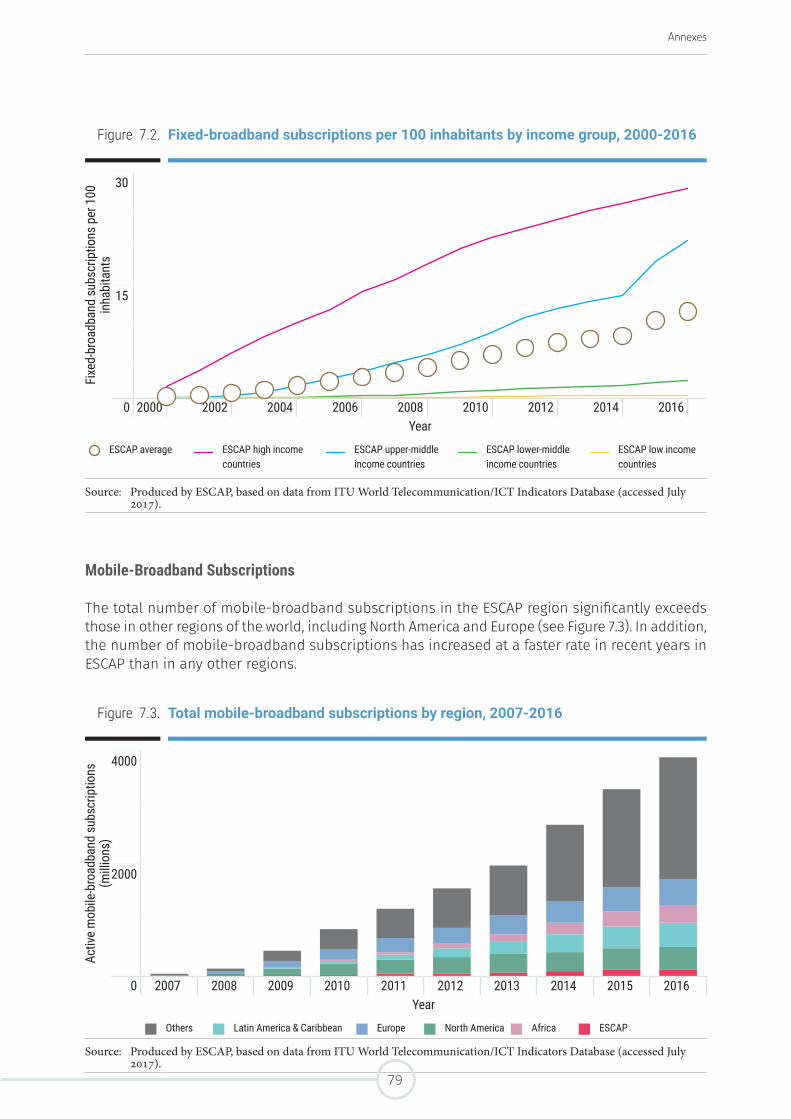
Annexes
Mobile-Broadband Subscriptions
The total number of mobile-broadband subscriptions in the ESCAP region significantly exceeds those in other regions of the world, including North America and Europe (see Figure 7.3). In addition, the number of mobile-broadband subscriptions has increased at a faster rate in recent years in ESCAP than in any other regions.
Figure 7.2. Fixed-broadband subscriptions per 100 inhabitants by income group, 2000-2016
Fixe
d-br
oadb
and
subs
crip
tions
per
100
in
habi
tant
s
30
15
0 2000 2002 2004 2006 2008 2010 2012 2014 2016Year
ESCAP average ESCAP high income countries
ESCAP upper-middle income countries
ESCAP lower-middle income countries
ESCAP low income countries
Source: Produced by ESCAP, based on data from ITU World Telecommunication/ICT Indicators Database (accessed July 2017).
Figure 7.3. Total mobile-broadband subscriptions by region, 2007-2016
Activ
e m
obile
-bro
adba
nd s
ubsc
riptio
ns
(milli
ons)
4000
2000
0 2007 2008 2009 2010 2011 2012 2013 2014 2015 2016Year
Others Latin America & Caribbean Europe North America Africa ESCAP
Source: Produced by ESCAP, based on data from ITU World Telecommunication/ICT Indicators Database (accessed July 2017).
79
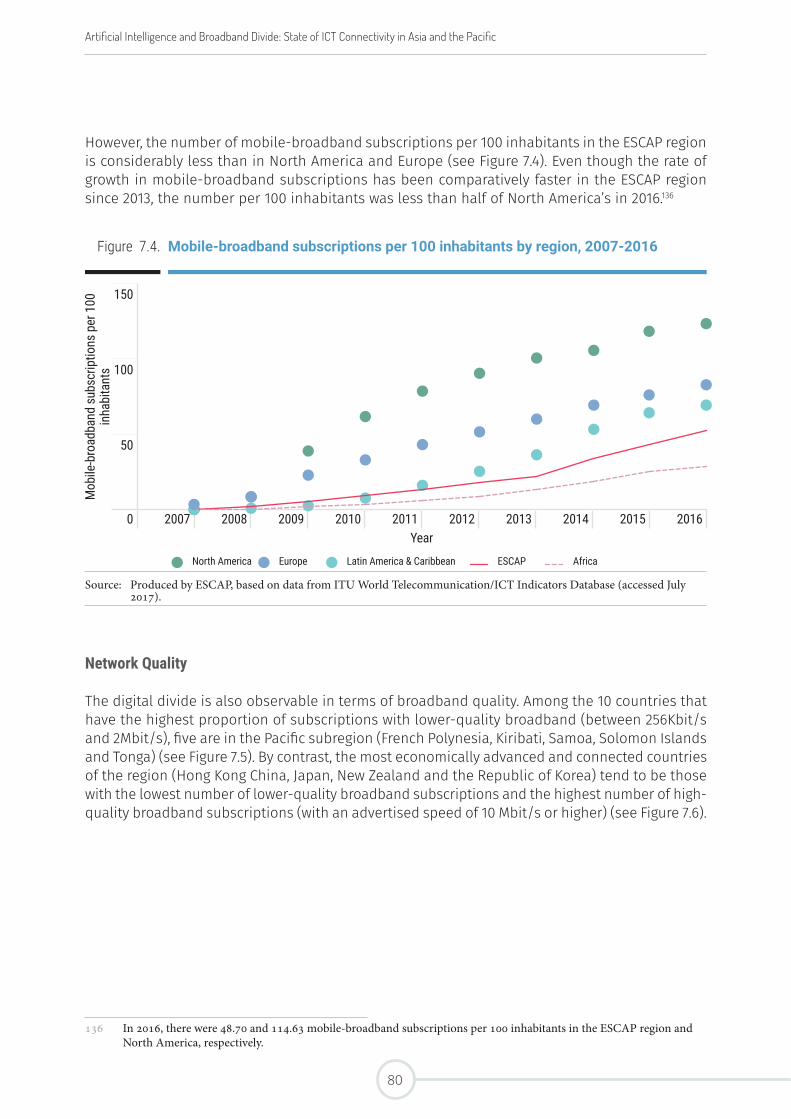
However, the number of mobile-broadband subscriptions per 100 inhabitants in the ESCAP region is considerably less than in North America and Europe (see Figure 7.4). Even though the rate of growth in mobile-broadband subscriptions has been comparatively faster in the ESCAP region since 2013, the number per 100 inhabitants was less than half of North America’s in 2016.136
Network Quality
The digital divide is also observable in terms of broadband quality. Among the 10 countries that have the highest proportion of subscriptions with lower-quality broadband (between 256Kbit/s and 2Mbit/s), five are in the Pacific subregion (French Polynesia, Kiribati, Samoa, Solomon Islands and Tonga) (see Figure 7.5). By contrast, the most economically advanced and connected countries of the region (Hong Kong China, Japan, New Zealand and the Republic of Korea) tend to be those with the lowest number of lower-quality broadband subscriptions and the highest number of high-quality broadband subscriptions (with an advertised speed of 10 Mbit/s or higher) (see Figure 7.6).
136 In 2016, there were 48.70 and 114.63 mobile-broadband subscriptions per 100 inhabitants in the ESCAP region and North America, respectively.
Figure 7.4. Mobile-broadband subscriptions per 100 inhabitants by region, 2007-2016
Mob
ile-b
road
band
sub
scrip
tions
per
100
in
habi
tant
s
150
100
50
0 2007 2008 2009 2010 2011 2012 2013 2014 2015 2016Year
North America Europe Latin America & Caribbean ESCAP Africa
Source: Produced by ESCAP, based on data from ITU World Telecommunication/ICT Indicators Database (accessed July 2017).
Artificial Intelligence and Broadband Divide: State of ICT Connectivity in Asia and the Pacific
80
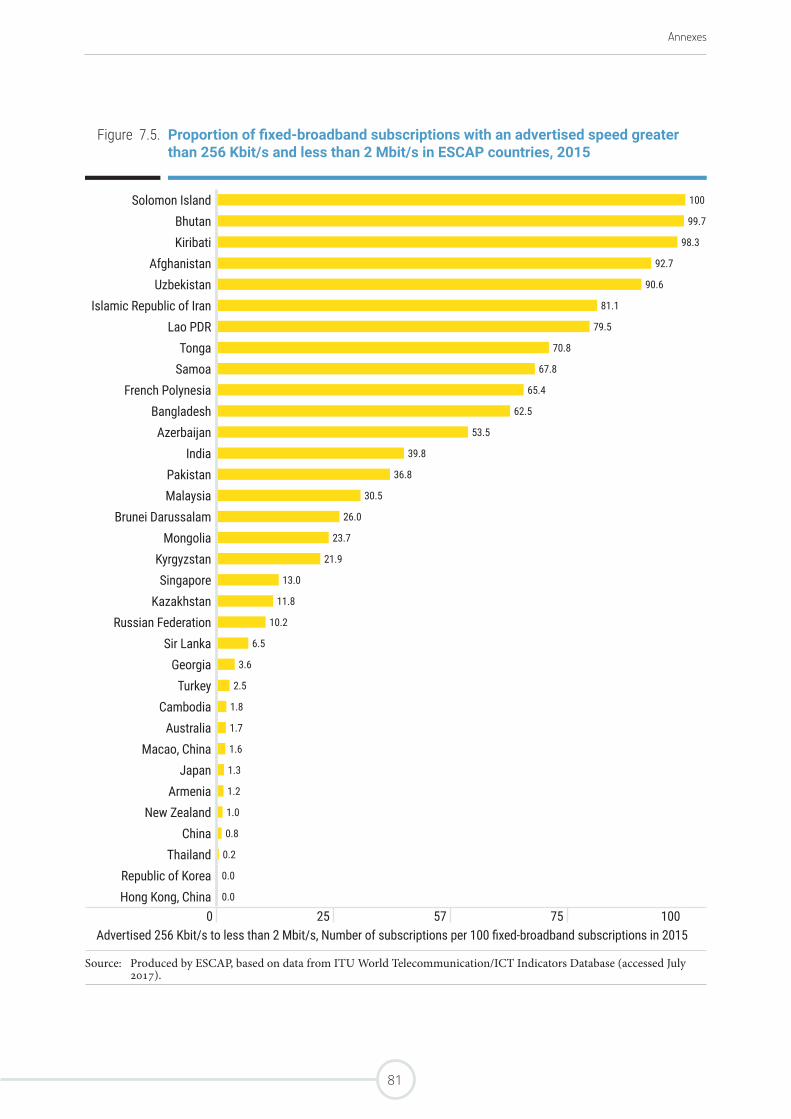
Annexes
Figure 7.5. Proportion of fixed-broadband subscriptions with an advertised speed greater than 256 Kbit/s and less than 2 Mbit/s in ESCAP countries, 2015
Solomon Island 100
Bhutan 99.7
Kiribati 98.3
Afghanistan 92.7
Uzbekistan 90.6
Islamic Republic of Iran 81.1
Lao PDR 79.5
Tonga 70.8
Samoa 67.8
French Polynesia 65.4
Bangladesh 62.5
Azerbaijan 53.5
India 39.8
Pakistan 36.8
Malaysia 30.5
Brunei Darussalam 26.0
Mongolia 23.7
Kyrgyzstan 21.9
Singapore 13.0
Kazakhstan 11.8
Russian Federation 10.2
Sir Lanka 6.5
Georgia 3.6
Turkey 2.5
Cambodia 1.8
Australia 1.7
Macao, China 1.6
Japan 1.3
Armenia 1.2
New Zealand 1.0
China 0.8
Thailand 0.2
Republic of Korea 0.0
Hong Kong, China 0.0
0 25 57 75 100Advertised 256 Kbit/s to less than 2 Mbit/s, Number of subscriptions per 100 fixed-broadband subscriptions in 2015
Source: Produced by ESCAP, based on data from ITU World Telecommunication/ICT Indicators Database (accessed July 2017).
81
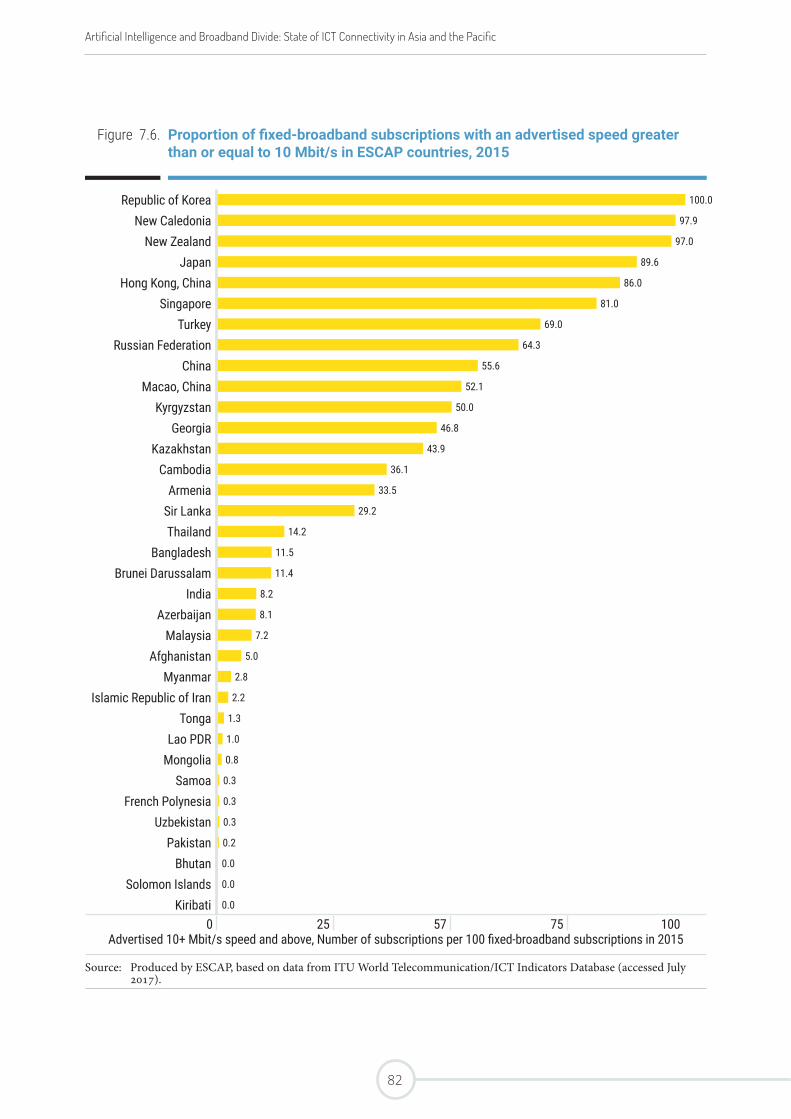
Figure 7.6. Proportion of fixed-broadband subscriptions with an advertised speed greater than or equal to 10 Mbit/s in ESCAP countries, 2015
Republic of Korea 100.0
New Caledonia 97.9
New Zealand 97.0
Japan 89.6
Hong Kong, China 86.0
Singapore 81.0
Turkey 69.0
Russian Federation 64.3
China 55.6
Macao, China 52.1
Kyrgyzstan 50.0
Georgia 46.8
Kazakhstan 43.9
Cambodia 36.1
Armenia 33.5
Sir Lanka 29.2
Thailand 14.2
Bangladesh 11.5
Brunei Darussalam 11.4
India 8.2
Azerbaijan 8.1
Malaysia 7.2
Afghanistan 5.0
Myanmar 2.8
Islamic Republic of Iran 2.2
Tonga 1.3
Lao PDR 1.0
Mongolia 0.8
Samoa 0.3
French Polynesia 0.3
Uzbekistan 0.3
Pakistan 0.2
Bhutan 0.0
Solomon Islands 0.0
Kiribati 0.0
0 25 57 75 100Advertised 10+ Mbit/s speed and above, Number of subscriptions per 100 fixed-broadband subscriptions in 2015
Source: Produced by ESCAP, based on data from ITU World Telecommunication/ICT Indicators Database (accessed July 2017).
Artificial Intelligence and Broadband Divide: State of ICT Connectivity in Asia and the Pacific
82
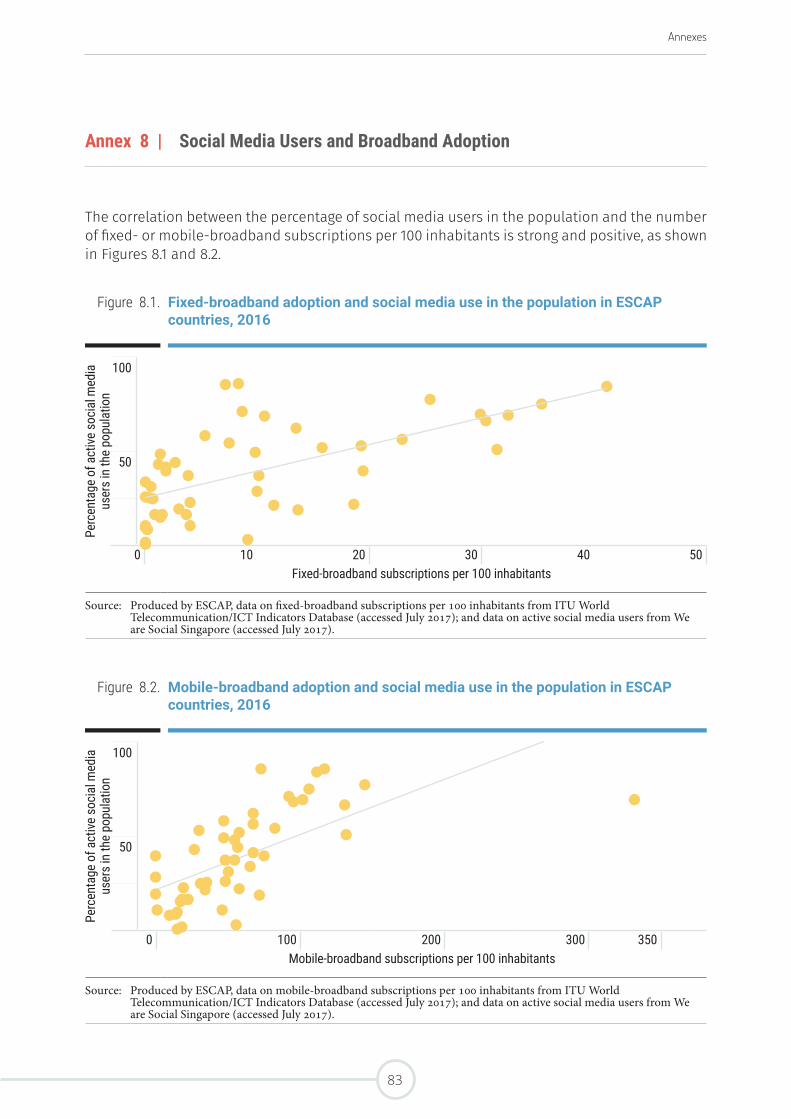
Annexes
Annex 8 | Social Media Users and Broadband Adoption
The correlation between the percentage of social media users in the population and the number of fixed- or mobile-broadband subscriptions per 100 inhabitants is strong and positive, as shown in Figures 8.1 and 8.2.
Figure 8.1. Fixed-broadband adoption and social media use in the population in ESCAP countries, 2016
Perc
enta
ge o
f act
ive s
ocia
l med
ia
user
s in
the
popu
latio
n
100
50
0 10 20 30 40 50Fixed-broadband subscriptions per 100 inhabitants
Source: Produced by ESCAP, data on fixed-broadband subscriptions per 100 inhabitants from ITU World Telecommunication/ICT Indicators Database (accessed July 2017); and data on active social media users from We are Social Singapore (accessed July 2017).
Figure 8.2. Mobile-broadband adoption and social media use in the population in ESCAP countries, 2016
Perc
enta
ge o
f act
ive s
ocia
l med
ia
user
s in
the
popu
latio
n
100
50
0 100 200 300 350Mobile-broadband subscriptions per 100 inhabitants
Source: Produced by ESCAP, data on mobile-broadband subscriptions per 100 inhabitants from ITU World Telecommunication/ICT Indicators Database (accessed July 2017); and data on active social media users from We are Social Singapore (accessed July 2017).
83
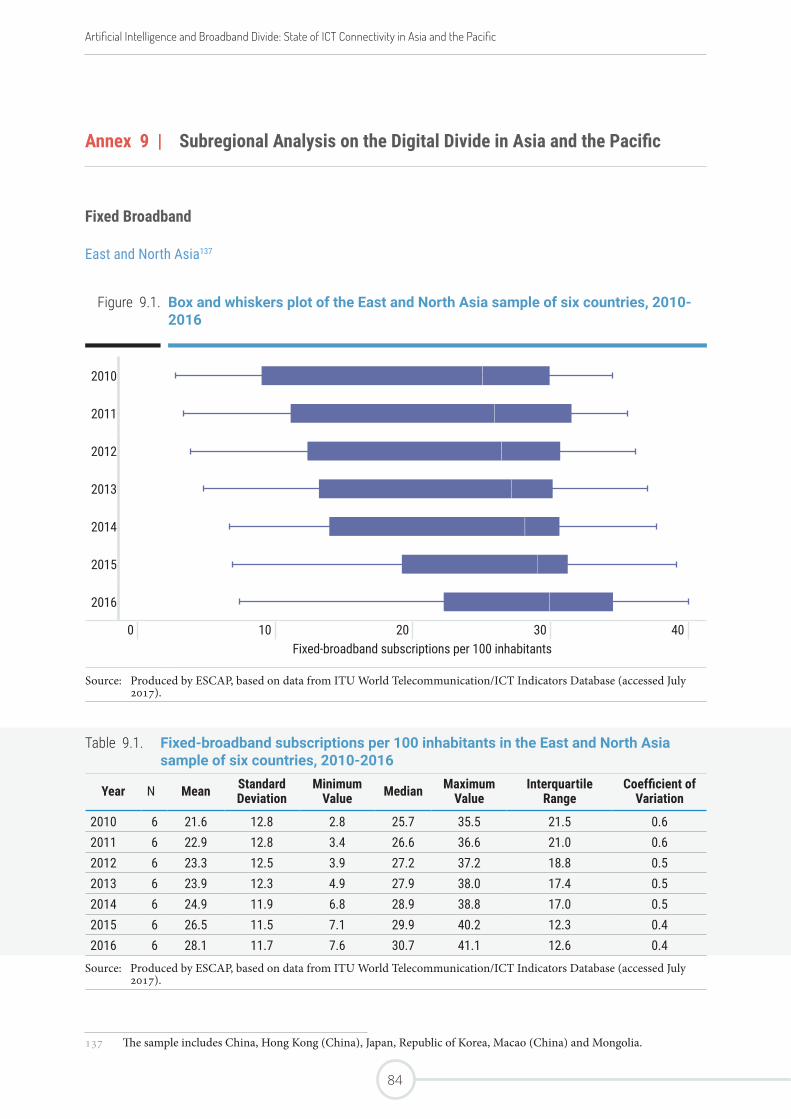
Annex 9 | Subregional Analysis on the Digital Divide in Asia and the Pacific
Fixed Broadband
East and North Asia137
137 The sample includes China, Hong Kong (China), Japan, Republic of Korea, Macao (China) and Mongolia.
Figure 9.1. Box and whiskers plot of the East and North Asia sample of six countries, 2010-2016
2010
2011
2012
2013
2014
2015
2016
0 10 20 30 40Fixed-broadband subscriptions per 100 inhabitants
Source: Produced by ESCAP, based on data from ITU World Telecommunication/ICT Indicators Database (accessed July 2017).
Table 9.1. Fixed-broadband subscriptions per 100 inhabitants in the East and North Asia sample of six countries, 2010-2016
Year N Mean Standard Deviation
MinimumValue Median Maximum
ValueInterquartile
RangeCoefficient of
Variation
2010 6 21.6 12.8 2.8 25.7 35.5 21.5 0.62011 6 22.9 12.8 3.4 26.6 36.6 21.0 0.62012 6 23.3 12.5 3.9 27.2 37.2 18.8 0.52013 6 23.9 12.3 4.9 27.9 38.0 17.4 0.52014 6 24.9 11.9 6.8 28.9 38.8 17.0 0.52015 6 26.5 11.5 7.1 29.9 40.2 12.3 0.42016 6 28.1 11.7 7.6 30.7 41.1 12.6 0.4
Source: Produced by ESCAP, based on data from ITU World Telecommunication/ICT Indicators Database (accessed July 2017).
Artificial Intelligence and Broadband Divide: State of ICT Connectivity in Asia and the Pacific
84
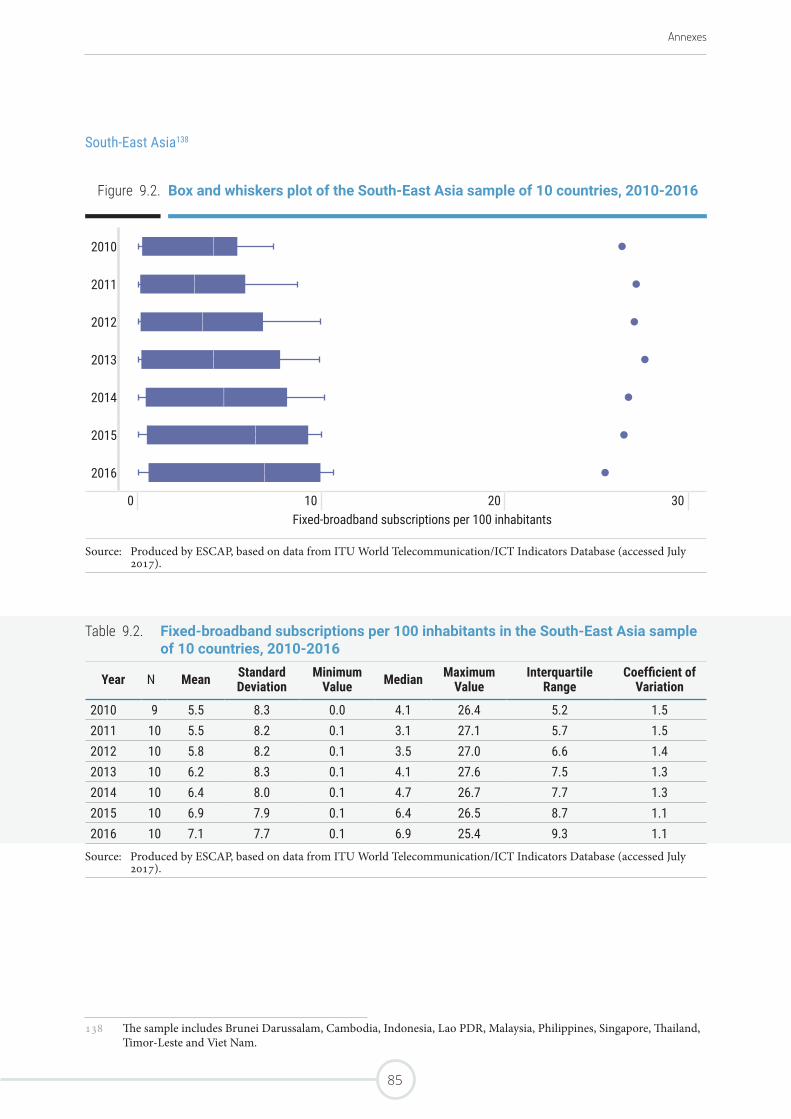
Annexes
South-East Asia138
138 The sample includes Brunei Darussalam, Cambodia, Indonesia, Lao PDR, Malaysia, Philippines, Singapore, Thailand, Timor-Leste and Viet Nam.
Figure 9.2. Box and whiskers plot of the South-East Asia sample of 10 countries, 2010-2016
2010
2011
2012
2013
2014
2015
2016
0 10 20 30Fixed-broadband subscriptions per 100 inhabitants
Source: Produced by ESCAP, based on data from ITU World Telecommunication/ICT Indicators Database (accessed July 2017).
Table 9.2. Fixed-broadband subscriptions per 100 inhabitants in the South-East Asia sample of 10 countries, 2010-2016
Year N Mean Standard Deviation
MinimumValue Median Maximum
ValueInterquartile
RangeCoefficient of
Variation
2010 9 5.5 8.3 0.0 4.1 26.4 5.2 1.52011 10 5.5 8.2 0.1 3.1 27.1 5.7 1.52012 10 5.8 8.2 0.1 3.5 27.0 6.6 1.42013 10 6.2 8.3 0.1 4.1 27.6 7.5 1.32014 10 6.4 8.0 0.1 4.7 26.7 7.7 1.32015 10 6.9 7.9 0.1 6.4 26.5 8.7 1.12016 10 7.1 7.7 0.1 6.9 25.4 9.3 1.1
Source: Produced by ESCAP, based on data from ITU World Telecommunication/ICT Indicators Database (accessed July 2017).
Table 9.1. Fixed-broadband subscriptions per 100 inhabitants in the East and North Asia sample of six countries, 2010-2016
Year N Mean Standard Deviation
MinimumValue Median Maximum
ValueInterquartile
RangeCoefficient of
Variation
2010 6 21.6 12.8 2.8 25.7 35.5 21.5 0.62011 6 22.9 12.8 3.4 26.6 36.6 21.0 0.62012 6 23.3 12.5 3.9 27.2 37.2 18.8 0.52013 6 23.9 12.3 4.9 27.9 38.0 17.4 0.52014 6 24.9 11.9 6.8 28.9 38.8 17.0 0.52015 6 26.5 11.5 7.1 29.9 40.2 12.3 0.42016 6 28.1 11.7 7.6 30.7 41.1 12.6 0.4
Source: Produced by ESCAP, based on data from ITU World Telecommunication/ICT Indicators Database (accessed July 2017).
85
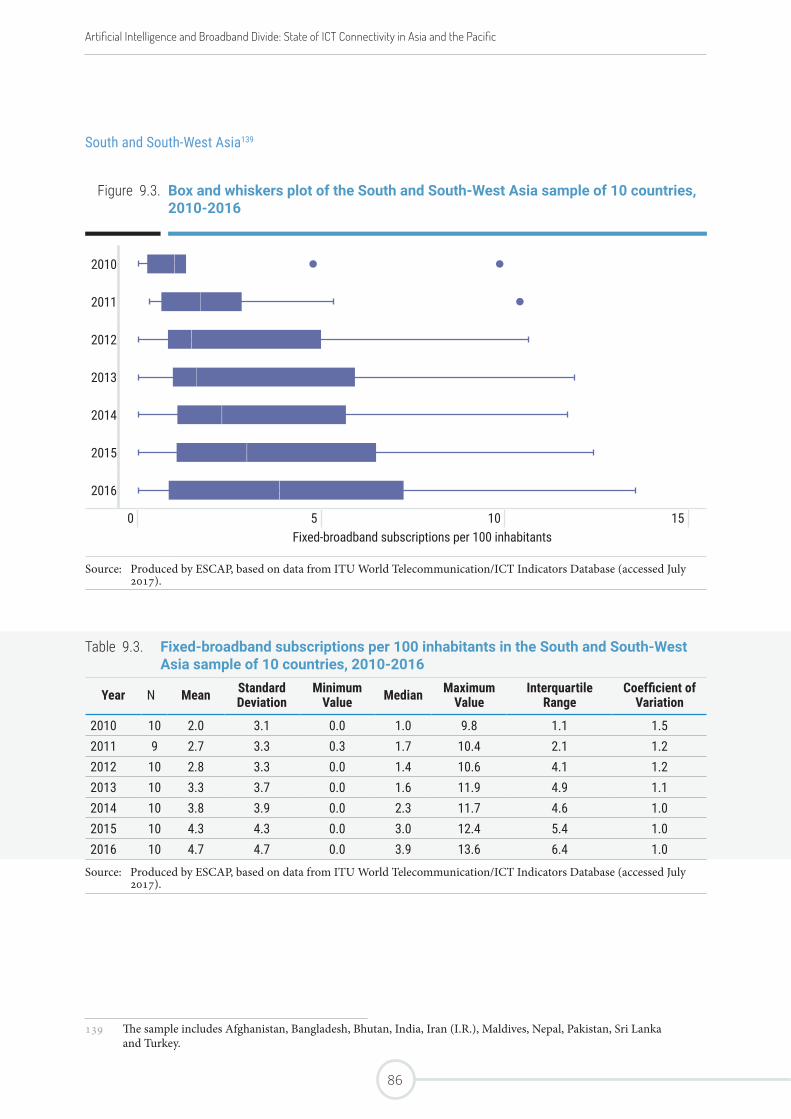
South and South-West Asia139
139 The sample includes Afghanistan, Bangladesh, Bhutan, India, Iran (I.R.), Maldives, Nepal, Pakistan, Sri Lanka and Turkey.
Figure 9.3. Box and whiskers plot of the South and South-West Asia sample of 10 countries, 2010-2016
2010
2011
2012
2013
2014
2015
2016
0 5 10 15Fixed-broadband subscriptions per 100 inhabitants
Source: Produced by ESCAP, based on data from ITU World Telecommunication/ICT Indicators Database (accessed July 2017).
Table 9.3. Fixed-broadband subscriptions per 100 inhabitants in the South and South-West Asia sample of 10 countries, 2010-2016
Year N Mean Standard Deviation
MinimumValue Median Maximum
ValueInterquartile
RangeCoefficient of
Variation
2010 10 2.0 3.1 0.0 1.0 9.8 1.1 1.52011 9 2.7 3.3 0.3 1.7 10.4 2.1 1.22012 10 2.8 3.3 0.0 1.4 10.6 4.1 1.22013 10 3.3 3.7 0.0 1.6 11.9 4.9 1.12014 10 3.8 3.9 0.0 2.3 11.7 4.6 1.02015 10 4.3 4.3 0.0 3.0 12.4 5.4 1.02016 10 4.7 4.7 0.0 3.9 13.6 6.4 1.0
Source: Produced by ESCAP, based on data from ITU World Telecommunication/ICT Indicators Database (accessed July 2017).
Artificial Intelligence and Broadband Divide: State of ICT Connectivity in Asia and the Pacific
86
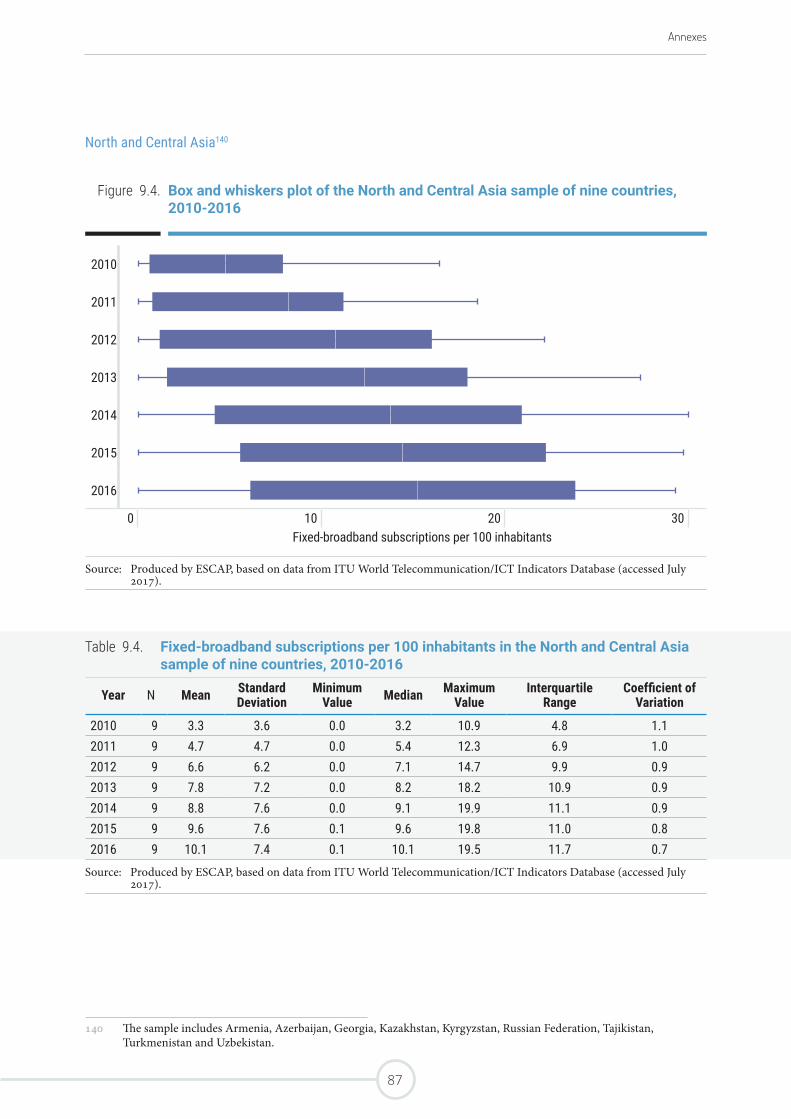
Annexes
North and Central Asia140
140 The sample includes Armenia, Azerbaijan, Georgia, Kazakhstan, Kyrgyzstan, Russian Federation, Tajikistan, Turkmenistan and Uzbekistan.
Figure 9.4. Box and whiskers plot of the North and Central Asia sample of nine countries, 2010-2016
2010
2011
2012
2013
2014
2015
2016
0 10 20 30Fixed-broadband subscriptions per 100 inhabitants
Source: Produced by ESCAP, based on data from ITU World Telecommunication/ICT Indicators Database (accessed July 2017).
Table 9.4. Fixed-broadband subscriptions per 100 inhabitants in the North and Central Asia sample of nine countries, 2010-2016
Year N Mean Standard Deviation
MinimumValue Median Maximum
ValueInterquartile
RangeCoefficient of
Variation
2010 9 3.3 3.6 0.0 3.2 10.9 4.8 1.12011 9 4.7 4.7 0.0 5.4 12.3 6.9 1.02012 9 6.6 6.2 0.0 7.1 14.7 9.9 0.92013 9 7.8 7.2 0.0 8.2 18.2 10.9 0.92014 9 8.8 7.6 0.0 9.1 19.9 11.1 0.92015 9 9.6 7.6 0.1 9.6 19.8 11.0 0.82016 9 10.1 7.4 0.1 10.1 19.5 11.7 0.7
Source: Produced by ESCAP, based on data from ITU World Telecommunication/ICT Indicators Database (accessed July 2017).
Table 9.3. Fixed-broadband subscriptions per 100 inhabitants in the South and South-West Asia sample of 10 countries, 2010-2016
Year N Mean Standard Deviation
MinimumValue Median Maximum
ValueInterquartile
RangeCoefficient of
Variation
2010 10 2.0 3.1 0.0 1.0 9.8 1.1 1.52011 9 2.7 3.3 0.3 1.7 10.4 2.1 1.22012 10 2.8 3.3 0.0 1.4 10.6 4.1 1.22013 10 3.3 3.7 0.0 1.6 11.9 4.9 1.12014 10 3.8 3.9 0.0 2.3 11.7 4.6 1.02015 10 4.3 4.3 0.0 3.0 12.4 5.4 1.02016 10 4.7 4.7 0.0 3.9 13.6 6.4 1.0
Source: Produced by ESCAP, based on data from ITU World Telecommunication/ICT Indicators Database (accessed July 2017).
87
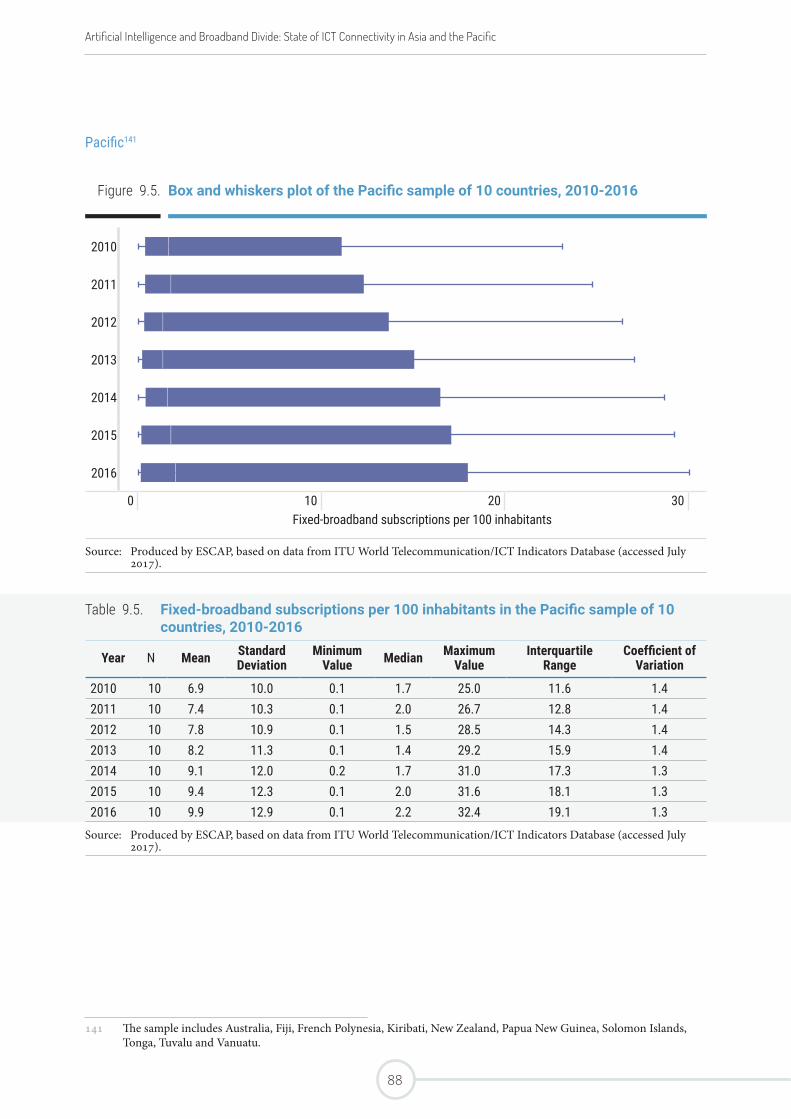
Pacific141
141 The sample includes Australia, Fiji, French Polynesia, Kiribati, New Zealand, Papua New Guinea, Solomon Islands, Tonga, Tuvalu and Vanuatu.
Figure 9.5. Box and whiskers plot of the Pacific sample of 10 countries, 2010-2016
2010
2011
2012
2013
2014
2015
2016
0 10 20 30Fixed-broadband subscriptions per 100 inhabitants
Source: Produced by ESCAP, based on data from ITU World Telecommunication/ICT Indicators Database (accessed July 2017).
Table 9.5. Fixed-broadband subscriptions per 100 inhabitants in the Pacific sample of 10 countries, 2010-2016
Year N Mean Standard Deviation
MinimumValue Median Maximum
ValueInterquartile
RangeCoefficient of
Variation
2010 10 6.9 10.0 0.1 1.7 25.0 11.6 1.42011 10 7.4 10.3 0.1 2.0 26.7 12.8 1.42012 10 7.8 10.9 0.1 1.5 28.5 14.3 1.42013 10 8.2 11.3 0.1 1.4 29.2 15.9 1.42014 10 9.1 12.0 0.2 1.7 31.0 17.3 1.32015 10 9.4 12.3 0.1 2.0 31.6 18.1 1.32016 10 9.9 12.9 0.1 2.2 32.4 19.1 1.3
Source: Produced by ESCAP, based on data from ITU World Telecommunication/ICT Indicators Database (accessed July 2017).
Artificial Intelligence and Broadband Divide: State of ICT Connectivity in Asia and the Pacific
88
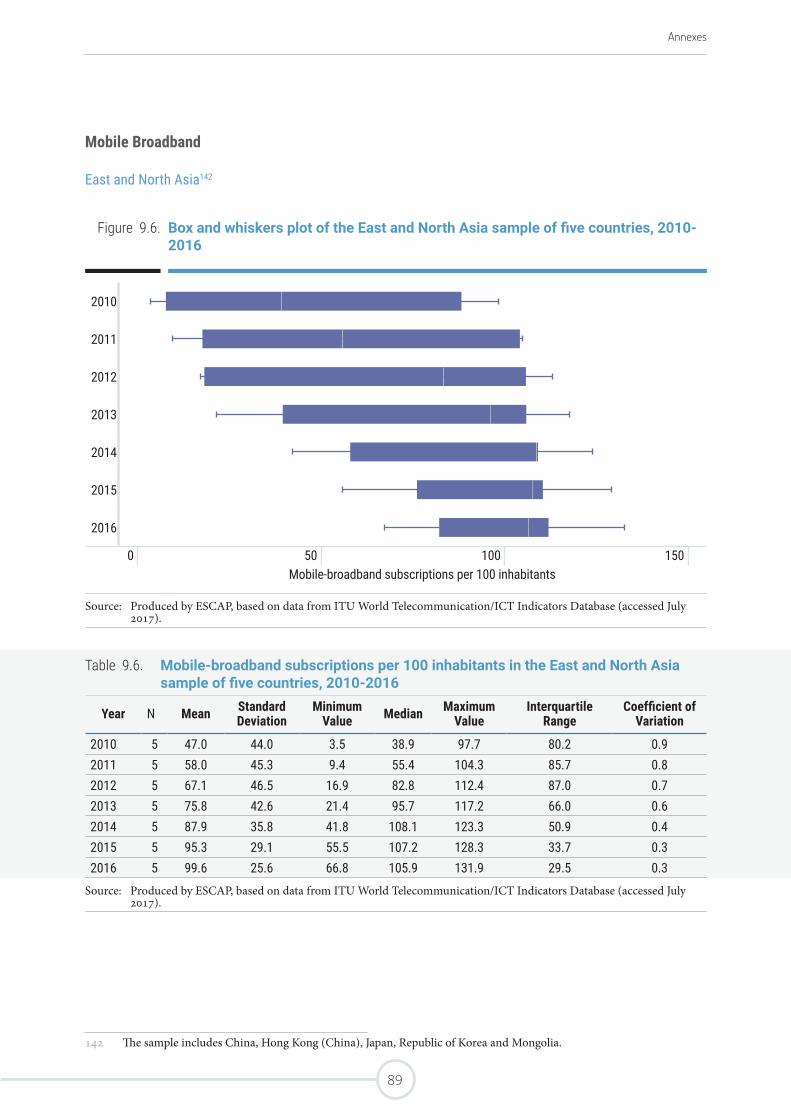
Annexes
Mobile Broadband
East and North Asia142
142 The sample includes China, Hong Kong (China), Japan, Republic of Korea and Mongolia.
Figure 9.6. Box and whiskers plot of the East and North Asia sample of five countries, 2010-2016
2010
2011
2012
2013
2014
2015
2016
0 50 100 150Mobile-broadband subscriptions per 100 inhabitants
Source: Produced by ESCAP, based on data from ITU World Telecommunication/ICT Indicators Database (accessed July 2017).
Table 9.6. Mobile-broadband subscriptions per 100 inhabitants in the East and North Asia sample of five countries, 2010-2016
Year N Mean Standard Deviation
MinimumValue Median Maximum
ValueInterquartile
RangeCoefficient of
Variation
2010 5 47.0 44.0 3.5 38.9 97.7 80.2 0.92011 5 58.0 45.3 9.4 55.4 104.3 85.7 0.82012 5 67.1 46.5 16.9 82.8 112.4 87.0 0.72013 5 75.8 42.6 21.4 95.7 117.2 66.0 0.62014 5 87.9 35.8 41.8 108.1 123.3 50.9 0.42015 5 95.3 29.1 55.5 107.2 128.3 33.7 0.32016 5 99.6 25.6 66.8 105.9 131.9 29.5 0.3
Source: Produced by ESCAP, based on data from ITU World Telecommunication/ICT Indicators Database (accessed July 2017).
Table 9.5. Fixed-broadband subscriptions per 100 inhabitants in the Pacific sample of 10 countries, 2010-2016
Year N Mean Standard Deviation
MinimumValue Median Maximum
ValueInterquartile
RangeCoefficient of
Variation
2010 10 6.9 10.0 0.1 1.7 25.0 11.6 1.42011 10 7.4 10.3 0.1 2.0 26.7 12.8 1.42012 10 7.8 10.9 0.1 1.5 28.5 14.3 1.42013 10 8.2 11.3 0.1 1.4 29.2 15.9 1.42014 10 9.1 12.0 0.2 1.7 31.0 17.3 1.32015 10 9.4 12.3 0.1 2.0 31.6 18.1 1.32016 10 9.9 12.9 0.1 2.2 32.4 19.1 1.3
Source: Produced by ESCAP, based on data from ITU World Telecommunication/ICT Indicators Database (accessed July 2017).
89
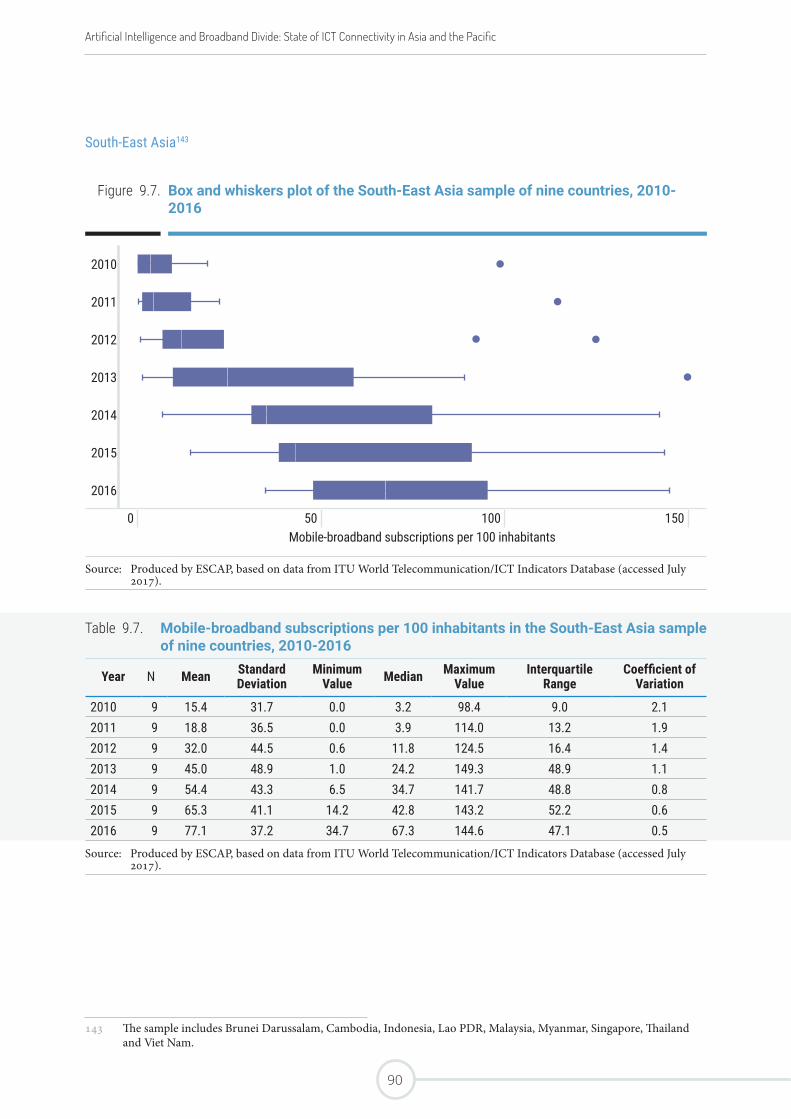
South-East Asia143
143 The sample includes Brunei Darussalam, Cambodia, Indonesia, Lao PDR, Malaysia, Myanmar, Singapore, Thailand and Viet Nam.
Figure 9.7. Box and whiskers plot of the South-East Asia sample of nine countries, 2010-2016
2010
2011
2012
2013
2014
2015
2016
0 50 100 150Mobile-broadband subscriptions per 100 inhabitants
Source: Produced by ESCAP, based on data from ITU World Telecommunication/ICT Indicators Database (accessed July 2017).
Table 9.7. Mobile-broadband subscriptions per 100 inhabitants in the South-East Asia sample of nine countries, 2010-2016
Year N Mean Standard Deviation
MinimumValue Median Maximum
ValueInterquartile
RangeCoefficient of
Variation
2010 9 15.4 31.7 0.0 3.2 98.4 9.0 2.12011 9 18.8 36.5 0.0 3.9 114.0 13.2 1.92012 9 32.0 44.5 0.6 11.8 124.5 16.4 1.42013 9 45.0 48.9 1.0 24.2 149.3 48.9 1.12014 9 54.4 43.3 6.5 34.7 141.7 48.8 0.82015 9 65.3 41.1 14.2 42.8 143.2 52.2 0.62016 9 77.1 37.2 34.7 67.3 144.6 47.1 0.5
Source: Produced by ESCAP, based on data from ITU World Telecommunication/ICT Indicators Database (accessed July 2017).
Artificial Intelligence and Broadband Divide: State of ICT Connectivity in Asia and the Pacific
90
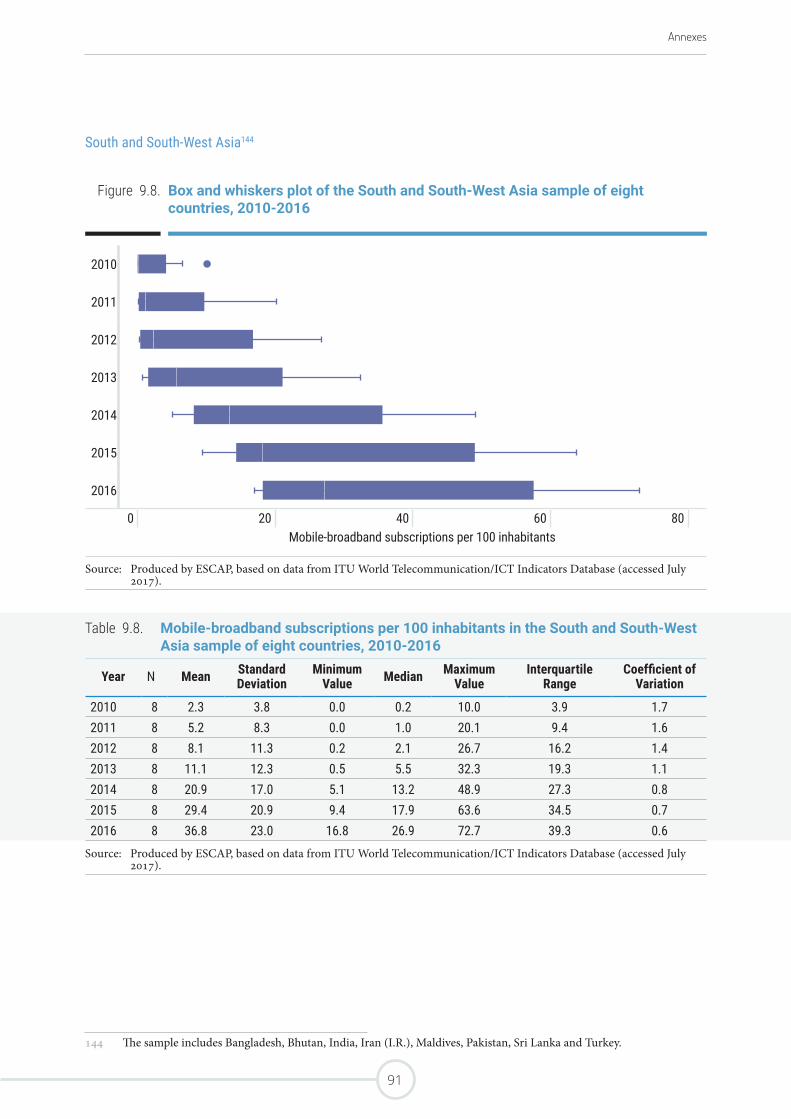
Annexes
South and South-West Asia144
144 The sample includes Bangladesh, Bhutan, India, Iran (I.R.), Maldives, Pakistan, Sri Lanka and Turkey.
Figure 9.8. Box and whiskers plot of the South and South-West Asia sample of eight countries, 2010-2016
2010
2011
2012
2013
2014
2015
2016
0 20 40 60 80Mobile-broadband subscriptions per 100 inhabitants
Source: Produced by ESCAP, based on data from ITU World Telecommunication/ICT Indicators Database (accessed July 2017).
Table 9.8. Mobile-broadband subscriptions per 100 inhabitants in the South and South-West Asia sample of eight countries, 2010-2016
Year N Mean Standard Deviation
MinimumValue Median Maximum
ValueInterquartile
RangeCoefficient of
Variation
2010 8 2.3 3.8 0.0 0.2 10.0 3.9 1.72011 8 5.2 8.3 0.0 1.0 20.1 9.4 1.62012 8 8.1 11.3 0.2 2.1 26.7 16.2 1.42013 8 11.1 12.3 0.5 5.5 32.3 19.3 1.12014 8 20.9 17.0 5.1 13.2 48.9 27.3 0.82015 8 29.4 20.9 9.4 17.9 63.6 34.5 0.72016 8 36.8 23.0 16.8 26.9 72.7 39.3 0.6
Source: Produced by ESCAP, based on data from ITU World Telecommunication/ICT Indicators Database (accessed July 2017).
Table 9.7. Mobile-broadband subscriptions per 100 inhabitants in the South-East Asia sample of nine countries, 2010-2016
Year N Mean Standard Deviation
MinimumValue Median Maximum
ValueInterquartile
RangeCoefficient of
Variation
2010 9 15.4 31.7 0.0 3.2 98.4 9.0 2.12011 9 18.8 36.5 0.0 3.9 114.0 13.2 1.92012 9 32.0 44.5 0.6 11.8 124.5 16.4 1.42013 9 45.0 48.9 1.0 24.2 149.3 48.9 1.12014 9 54.4 43.3 6.5 34.7 141.7 48.8 0.82015 9 65.3 41.1 14.2 42.8 143.2 52.2 0.62016 9 77.1 37.2 34.7 67.3 144.6 47.1 0.5
Source: Produced by ESCAP, based on data from ITU World Telecommunication/ICT Indicators Database (accessed July 2017).
91
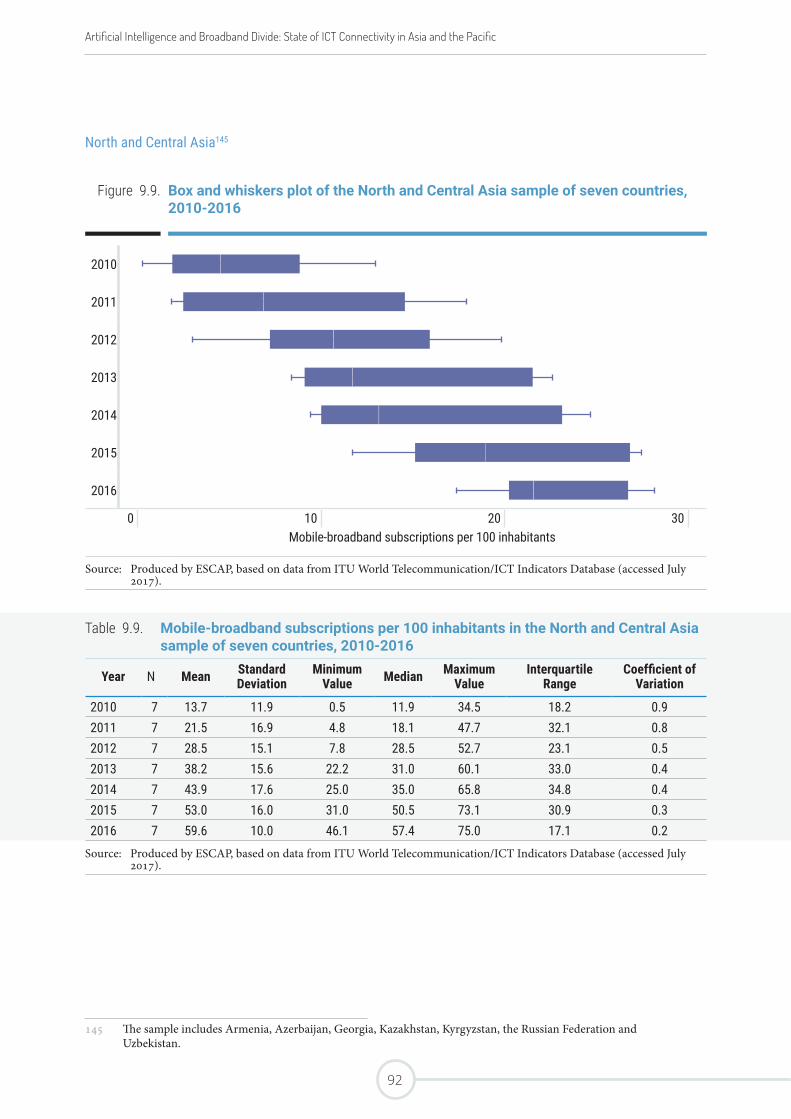
North and Central Asia145
145 The sample includes Armenia, Azerbaijan, Georgia, Kazakhstan, Kyrgyzstan, the Russian Federation and Uzbekistan.
Figure 9.9. Box and whiskers plot of the North and Central Asia sample of seven countries, 2010-2016
2010
2011
2012
2013
2014
2015
2016
0 10 20 30Mobile-broadband subscriptions per 100 inhabitants
Source: Produced by ESCAP, based on data from ITU World Telecommunication/ICT Indicators Database (accessed July 2017).
Table 9.9. Mobile-broadband subscriptions per 100 inhabitants in the North and Central Asia sample of seven countries, 2010-2016
Year N Mean Standard Deviation
MinimumValue Median Maximum
ValueInterquartile
RangeCoefficient of
Variation
2010 7 13.7 11.9 0.5 11.9 34.5 18.2 0.92011 7 21.5 16.9 4.8 18.1 47.7 32.1 0.82012 7 28.5 15.1 7.8 28.5 52.7 23.1 0.52013 7 38.2 15.6 22.2 31.0 60.1 33.0 0.42014 7 43.9 17.6 25.0 35.0 65.8 34.8 0.42015 7 53.0 16.0 31.0 50.5 73.1 30.9 0.32016 7 59.6 10.0 46.1 57.4 75.0 17.1 0.2
Source: Produced by ESCAP, based on data from ITU World Telecommunication/ICT Indicators Database (accessed July 2017).
Artificial Intelligence and Broadband Divide: State of ICT Connectivity in Asia and the Pacific
92
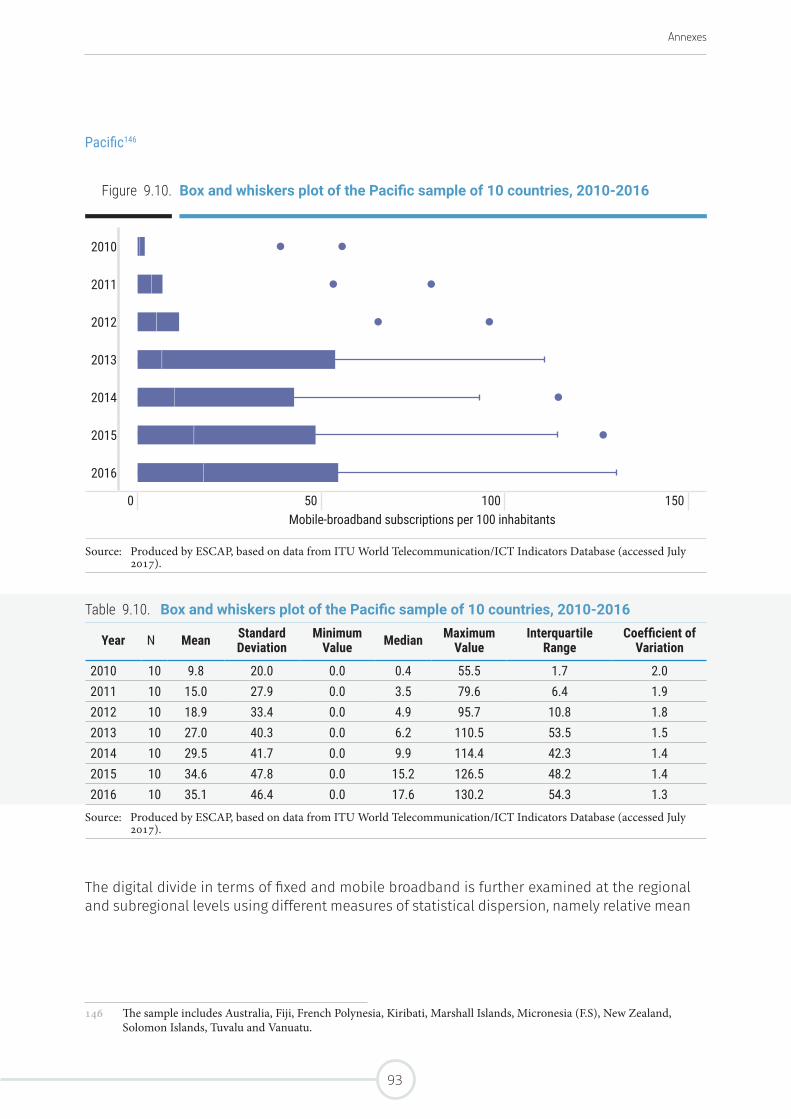
Annexes
Pacific146
The digital divide in terms of fixed and mobile broadband is further examined at the regional and subregional levels using different measures of statistical dispersion, namely relative mean
146 The sample includes Australia, Fiji, French Polynesia, Kiribati, Marshall Islands, Micronesia (F.S), New Zealand, Solomon Islands, Tuvalu and Vanuatu.
Figure 9.10. Box and whiskers plot of the Pacific sample of 10 countries, 2010-2016
2010
2011
2012
2013
2014
2015
2016
0 50 100 150Mobile-broadband subscriptions per 100 inhabitants
Source: Produced by ESCAP, based on data from ITU World Telecommunication/ICT Indicators Database (accessed July 2017).
Table 9.10. Box and whiskers plot of the Pacific sample of 10 countries, 2010-2016
Year N Mean Standard Deviation
MinimumValue Median Maximum
ValueInterquartile
RangeCoefficient of
Variation
2010 10 9.8 20.0 0.0 0.4 55.5 1.7 2.02011 10 15.0 27.9 0.0 3.5 79.6 6.4 1.92012 10 18.9 33.4 0.0 4.9 95.7 10.8 1.82013 10 27.0 40.3 0.0 6.2 110.5 53.5 1.52014 10 29.5 41.7 0.0 9.9 114.4 42.3 1.42015 10 34.6 47.8 0.0 15.2 126.5 48.2 1.42016 10 35.1 46.4 0.0 17.6 130.2 54.3 1.3
Source: Produced by ESCAP, based on data from ITU World Telecommunication/ICT Indicators Database (accessed July 2017).
Table 9.9. Mobile-broadband subscriptions per 100 inhabitants in the North and Central Asia sample of seven countries, 2010-2016
Year N Mean Standard Deviation
MinimumValue Median Maximum
ValueInterquartile
RangeCoefficient of
Variation
2010 7 13.7 11.9 0.5 11.9 34.5 18.2 0.92011 7 21.5 16.9 4.8 18.1 47.7 32.1 0.82012 7 28.5 15.1 7.8 28.5 52.7 23.1 0.52013 7 38.2 15.6 22.2 31.0 60.1 33.0 0.42014 7 43.9 17.6 25.0 35.0 65.8 34.8 0.42015 7 53.0 16.0 31.0 50.5 73.1 30.9 0.32016 7 59.6 10.0 46.1 57.4 75.0 17.1 0.2
Source: Produced by ESCAP, based on data from ITU World Telecommunication/ICT Indicators Database (accessed July 2017).
93
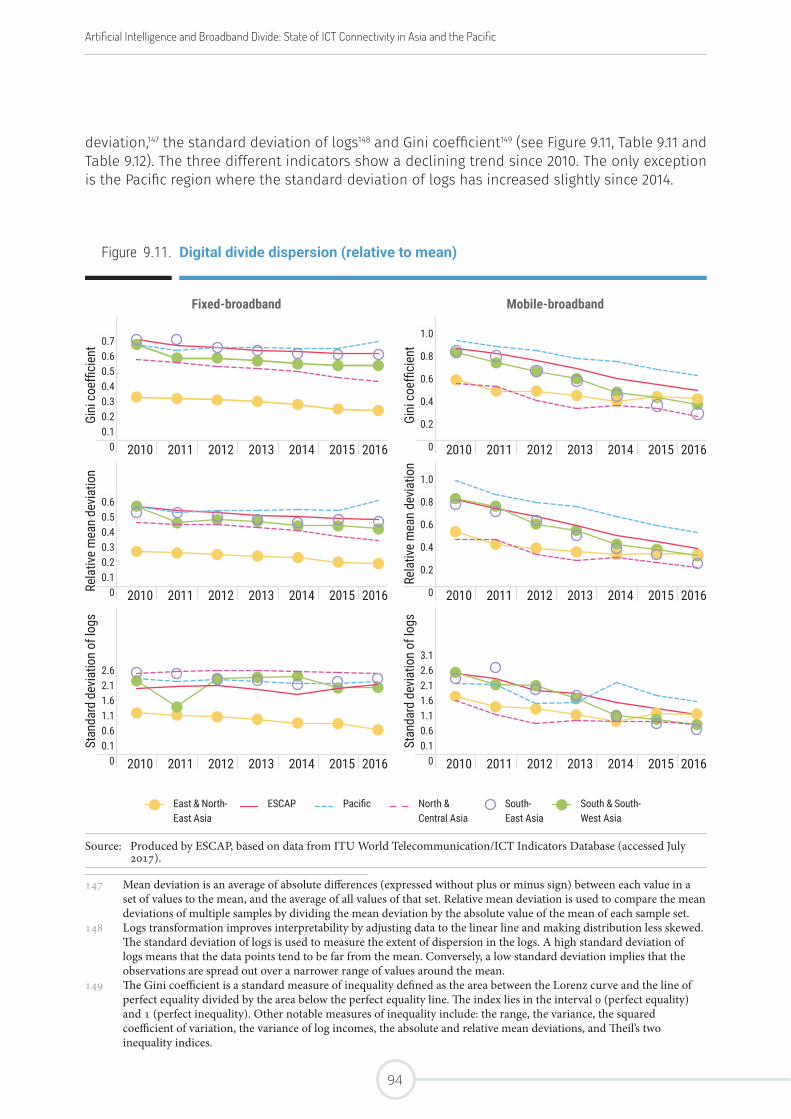
deviation,147 the standard deviation of logs148 and Gini coefficient149 (see Figure 9.11, Table 9.11 and Table 9.12). The three different indicators show a declining trend since 2010. The only exception is the Pacific region where the standard deviation of logs has increased slightly since 2014.
147 Mean deviation is an average of absolute differences (expressed without plus or minus sign) between each value in a set of values to the mean, and the average of all values of that set. Relative mean deviation is used to compare the mean deviations of multiple samples by dividing the mean deviation by the absolute value of the mean of each sample set.
148 Logs transformation improves interpretability by adjusting data to the linear line and making distribution less skewed. The standard deviation of logs is used to measure the extent of dispersion in the logs. A high standard deviation of logs means that the data points tend to be far from the mean. Conversely, a low standard deviation implies that the observations are spread out over a narrower range of values around the mean.
149 The Gini coefficient is a standard measure of inequality defined as the area between the Lorenz curve and the line of perfect equality divided by the area below the perfect equality line. The index lies in the interval 0 (perfect equality) and 1 (perfect inequality). Other notable measures of inequality include: the range, the variance, the squared coefficient of variation, the variance of log incomes, the absolute and relative mean deviations, and Theil’s two inequality indices.
Figure 9.11. Digital divide dispersion (relative to mean)
Fixed-broadband Mobile-broadband
Gini
coe
ffici
ent 0.7
0.60.50.40.30.20.1
0 2010 2011 2012 2013 2014 2015 2016
Gini
coe
ffici
ent
1.0
0.8
0.6
0.4
0.2
0 2010 2011 2012 2013 2014 2015 2016
Rela
tive
mea
n de
viatio
n
0.60.50.40.30.20.1
0 2010 2011 2012 2013 2014 2015 2016
Rela
tive
mea
n de
viatio
n
1.0
0.8
0.6
0.4
0.2
0 2010 2011 2012 2013 2014 2015 2016
Stan
dard
dev
iatio
n of
logs
2.62.11.61.10.60.1
0 2010 2011 2012 2013 2014 2015 2016
Stan
dard
dev
iatio
n of
logs
3.12.62.11.61.10.60.1
0 2010 2011 2012 2013 2014 2015 2016
East & North-East Asia
ESCAP Pacific North & Central Asia
South-East Asia
South & South-West Asia
Source: Produced by ESCAP, based on data from ITU World Telecommunication/ICT Indicators Database (accessed July 2017).
Artificial Intelligence and Broadband Divide: State of ICT Connectivity in Asia and the Pacific
94
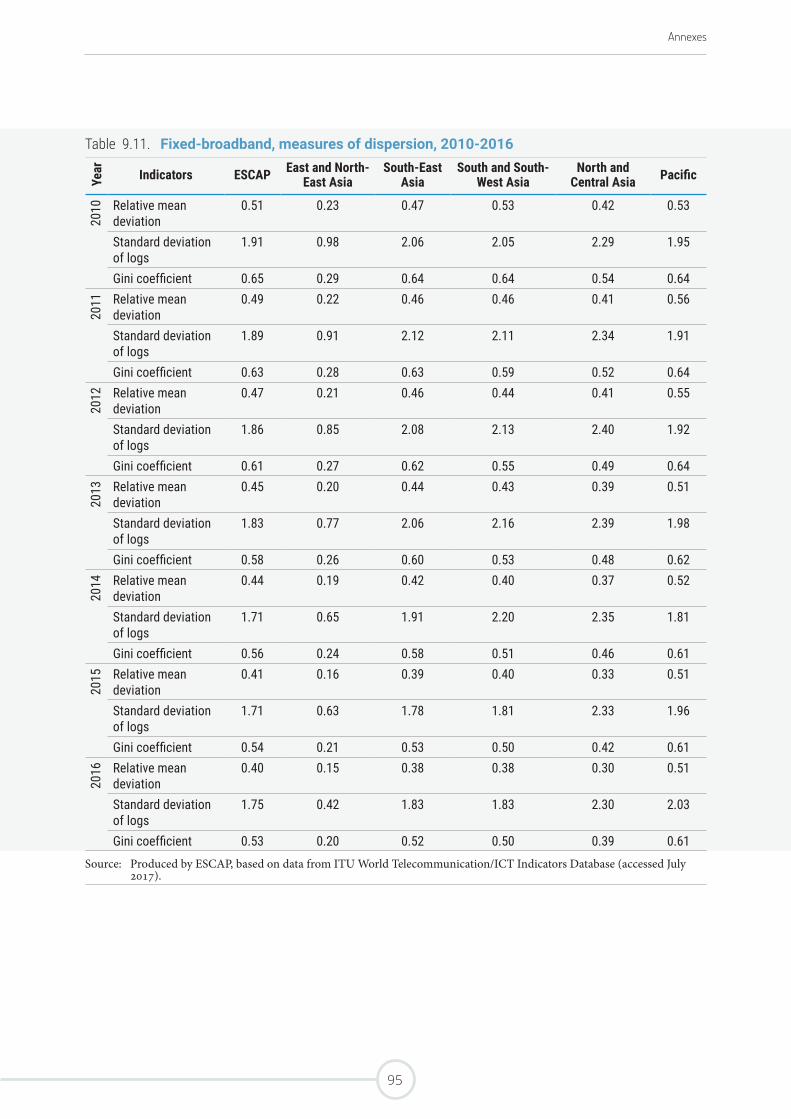
Annexes
Table 9.11. Fixed-broadband, measures of dispersion, 2010-2016
Year Indicators ESCAP East and North-
East AsiaSouth-East
AsiaSouth and South-
West AsiaNorth and
Central Asia Pacific
2010 Relative mean
deviation0.51 0.23 0.47 0.53 0.42 0.53
Standard deviation of logs
1.91 0.98 2.06 2.05 2.29 1.95
Gini coefficient 0.65 0.29 0.64 0.64 0.54 0.64
2011 Relative mean
deviation0.49 0.22 0.46 0.46 0.41 0.56
Standard deviation of logs
1.89 0.91 2.12 2.11 2.34 1.91
Gini coefficient 0.63 0.28 0.63 0.59 0.52 0.64
2012 Relative mean
deviation0.47 0.21 0.46 0.44 0.41 0.55
Standard deviation of logs
1.86 0.85 2.08 2.13 2.40 1.92
Gini coefficient 0.61 0.27 0.62 0.55 0.49 0.64
2013 Relative mean
deviation0.45 0.20 0.44 0.43 0.39 0.51
Standard deviation of logs
1.83 0.77 2.06 2.16 2.39 1.98
Gini coefficient 0.58 0.26 0.60 0.53 0.48 0.62
2014 Relative mean
deviation0.44 0.19 0.42 0.40 0.37 0.52
Standard deviation of logs
1.71 0.65 1.91 2.20 2.35 1.81
Gini coefficient 0.56 0.24 0.58 0.51 0.46 0.61
2015 Relative mean
deviation0.41 0.16 0.39 0.40 0.33 0.51
Standard deviation of logs
1.71 0.63 1.78 1.81 2.33 1.96
Gini coefficient 0.54 0.21 0.53 0.50 0.42 0.61
2016 Relative mean
deviation0.40 0.15 0.38 0.38 0.30 0.51
Standard deviation of logs
1.75 0.42 1.83 1.83 2.30 2.03
Gini coefficient 0.53 0.20 0.52 0.50 0.39 0.61Source: Produced by ESCAP, based on data from ITU World Telecommunication/ICT Indicators Database (accessed July
2017).
95
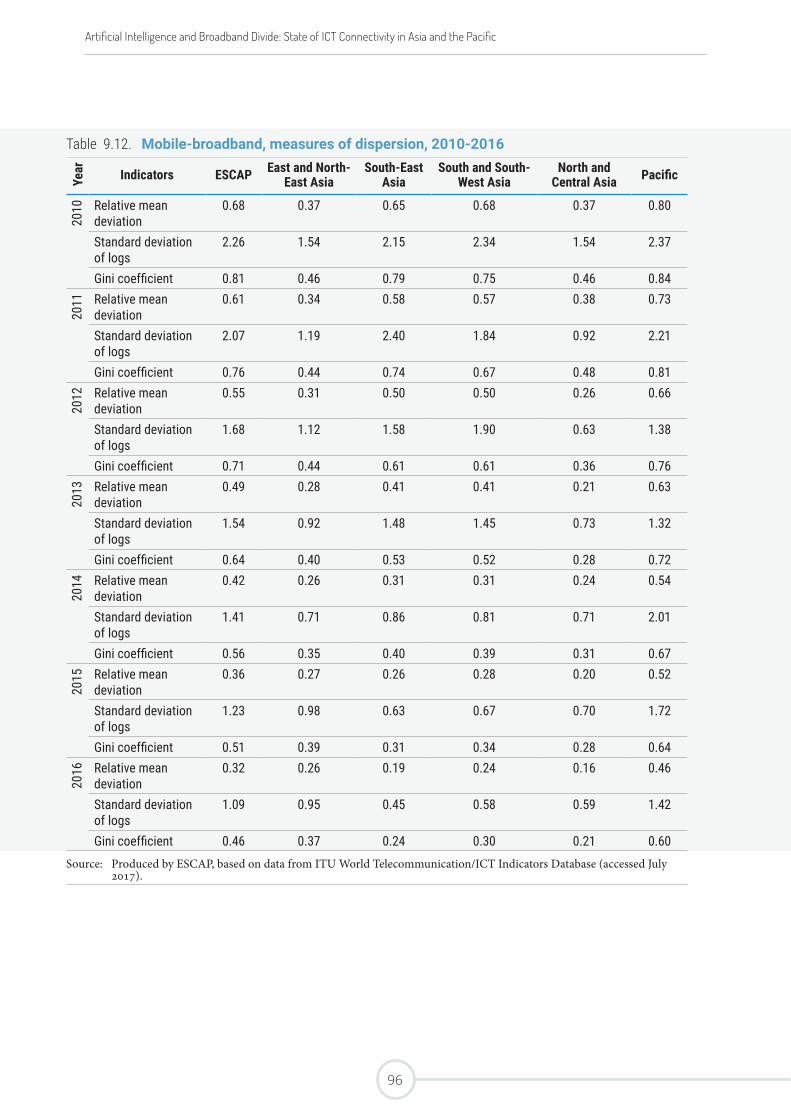
Table 9.12. Mobile-broadband, measures of dispersion, 2010-2016
Year Indicators ESCAP East and North-
East AsiaSouth-East
AsiaSouth and South-
West AsiaNorth and
Central Asia Pacific
2010 Relative mean
deviation0.68 0.37 0.65 0.68 0.37 0.80
Standard deviation of logs
2.26 1.54 2.15 2.34 1.54 2.37
Gini coefficient 0.81 0.46 0.79 0.75 0.46 0.84
2011 Relative mean
deviation0.61 0.34 0.58 0.57 0.38 0.73
Standard deviation of logs
2.07 1.19 2.40 1.84 0.92 2.21
Gini coefficient 0.76 0.44 0.74 0.67 0.48 0.81
2012 Relative mean
deviation0.55 0.31 0.50 0.50 0.26 0.66
Standard deviation of logs
1.68 1.12 1.58 1.90 0.63 1.38
Gini coefficient 0.71 0.44 0.61 0.61 0.36 0.76
2013 Relative mean
deviation0.49 0.28 0.41 0.41 0.21 0.63
Standard deviation of logs
1.54 0.92 1.48 1.45 0.73 1.32
Gini coefficient 0.64 0.40 0.53 0.52 0.28 0.72
2014 Relative mean
deviation0.42 0.26 0.31 0.31 0.24 0.54
Standard deviation of logs
1.41 0.71 0.86 0.81 0.71 2.01
Gini coefficient 0.56 0.35 0.40 0.39 0.31 0.67
2015 Relative mean
deviation0.36 0.27 0.26 0.28 0.20 0.52
Standard deviation of logs
1.23 0.98 0.63 0.67 0.70 1.72
Gini coefficient 0.51 0.39 0.31 0.34 0.28 0.64
2016 Relative mean
deviation0.32 0.26 0.19 0.24 0.16 0.46
Standard deviation of logs
1.09 0.95 0.45 0.58 0.59 1.42
Gini coefficient 0.46 0.37 0.24 0.30 0.21 0.60Source: Produced by ESCAP, based on data from ITU World Telecommunication/ICT Indicators Database (accessed July
2017).
Artificial Intelligence and Broadband Divide: State of ICT Connectivity in Asia and the Pacific
96
Annexes
The declining trend implies that the digital divide has been reduced in the region and all subregions relative to the mean. However, even if these measures indicate that the dispersion of data points tend to narrow around the mean, the fact that the interquartile range has widened clearly shows that some countries are stuck at a low level of adoption, especially as far as fixed broadband is concerned.
The third quartile has increased at a much faster pace than the first quartile since 2010. This suggests that if a significant number of countries characterized by an average or high adoption rate tend to progressively converge, which reduces the variability in the dispersion of data points measured by the indicators, some countries at the bottom become clearly distanced. However, the indicators do not show the trend of the whole sample.
When the standard deviation is taken into account, which show the dispersion of all countries, results show that a majority of the countries (relative to the mean) have improved their broadband connectivity, but not all countries. These few countries therefore tend to widen the dispersion over time.
Table 9.12. Mobile-broadband, measures of dispersion, 2010-2016
Year Indicators ESCAP East and North-
East AsiaSouth-East
AsiaSouth and South-
West AsiaNorth and
Central Asia Pacific
2010 Relative mean
deviation0.68 0.37 0.65 0.68 0.37 0.80
Standard deviation of logs
2.26 1.54 2.15 2.34 1.54 2.37
Gini coefficient 0.81 0.46 0.79 0.75 0.46 0.84
2011 Relative mean
deviation0.61 0.34 0.58 0.57 0.38 0.73
Standard deviation of logs
2.07 1.19 2.40 1.84 0.92 2.21
Gini coefficient 0.76 0.44 0.74 0.67 0.48 0.81
2012 Relative mean
deviation0.55 0.31 0.50 0.50 0.26 0.66
Standard deviation of logs
1.68 1.12 1.58 1.90 0.63 1.38
Gini coefficient 0.71 0.44 0.61 0.61 0.36 0.76
2013 Relative mean
deviation0.49 0.28 0.41 0.41 0.21 0.63
Standard deviation of logs
1.54 0.92 1.48 1.45 0.73 1.32
Gini coefficient 0.64 0.40 0.53 0.52 0.28 0.72
2014 Relative mean
deviation0.42 0.26 0.31 0.31 0.24 0.54
Standard deviation of logs
1.41 0.71 0.86 0.81 0.71 2.01
Gini coefficient 0.56 0.35 0.40 0.39 0.31 0.67
2015 Relative mean
deviation0.36 0.27 0.26 0.28 0.20 0.52
Standard deviation of logs
1.23 0.98 0.63 0.67 0.70 1.72
Gini coefficient 0.51 0.39 0.31 0.34 0.28 0.64
2016 Relative mean
deviation0.32 0.26 0.19 0.24 0.16 0.46
Standard deviation of logs
1.09 0.95 0.45 0.58 0.59 1.42
Gini coefficient 0.46 0.37 0.24 0.30 0.21 0.60Source: Produced by ESCAP, based on data from ITU World Telecommunication/ICT Indicators Database (accessed July
2017).
97
Annex 10 | Artificial Intelligence and Medical Research
The application of Artificial Intelligence (AI) in medical research has enhanced the accuracy and efficiency of diagnosis for diseases like breast cancer and thyroid disorders, and has therefore been contributing to the reduction of women’s health risks. Breast cancer is the second leading cause of cancer death among women,150 and women are particularly vulnerable to thyroid diseases. Thyroid function is closely related to iodine, and South-East Asia is one of the regions most affected by iodine deficiency.151
There are different types of breast cancers, with different aggressiveness and genetic makeup, thus, early detection and prevention significantly increase survival rates.152 Scientists have incorporated a number of statistical and machine-learning techniques into breast cancer prediction models. An example is the model with support vector machines that has performed well in breast cancer prediction.153 In another breast cancer study, algorithm has been employed to detect nuclei because typical cancer nuclei are clustered and have irregular texture and shape properties.154 Advanced breast cancer diagnosis is critical to Asia-Pacific countries. For instance, in Japan, the aging society faces an increased number of female breast cancer incidence,155 and the Republic of Korea experiences one of the world’s fastest increase in breast cancer incidence, with age-standardized rates tripling in the last two decades.156
Related to thyroid diseases, a study in Japan has demonstrated that machine-learning algorithms can be incorporated into thyroid diseases diagnosis.157
AI components, including data mining and decision tree, play critical roles in advanced health systems. Research shows data-mining algorithms employed in pre-diagnosis in health care decision support systems.158 With broad access to patient records and automated system to detect anomalies, health care systems that are equipped with AI substantially raise the accuracy and effectiveness of the diagnosis. A specific example is HELPII released in 2003 that stored about 32,000 emergency cases to support diagnosis.159
150 M. F. Akay, “Support vector machines combined with feature selection for breast cancer diagnosis”, Expert System with Applications, vol. 36 (2009), pp. 3240-3247.
151 World Health Organization, Global Health Risks: Mortality and Burden of Disease Attributable to Selected Major Risks (Geneva, 2009). Available from: http://www.who.int/healthinfo/global_burden_disease/GlobalHealthRisks_report_full.pdf.
152 Min-Wei Huang and others, “SVM and SVM ensembles in breast cancer prediction”, PLoS One, vol. 12, no. 1 (2017).153 Ibid.154 Maqlin Paramanandam and others, “Automated segmentation of nuclei in breast cancer histopathology images”, PLoS
One, vol. 11, no. 9 (2016).155 Kayoko Katayama and Hiroto Narimatsu, “Prediction of female breast cancer incidence among the aging society in
Kanagawa, Japan”, PLoS One, vol. 11, no. 8 (2016).156 The Economist Intelligence Unit, “Breast cancer in Asia: The challenge and response”, 15 March 2016.157 V. Prasad, T. Srinivasa Rao and M. Surendra Prasad Babu, “Thyroid diseases diagnosis via hybrid architecture
composing rough data sets theory and machine learning algorithms”, Soft Computing, vol. 20, no. 3 (March 2016), pp. 1179-1189.
158 M. Furmankiewicz, A. Sołtysik-Piorunkiewicz and P. Ziuziański, “Artificial intelligence system for knowledge management in e-health: The study of intelligent software agents”, Latest Trends on Systems, vol. 2 (2014).
159 Monali Dey and Siddharth Swarup Rautaray, “Study and analysis of data mining algorithms for healthcare decision support system”, International Journal of Computer Science and Information Technologies, vol. 5, no. 1 (2014), pp. 470-477.
Artificial Intelligence and Broadband Divide: State of ICT Connectivity in Asia and the Pacific
98
Annexes
AI helps to make sense of the myriad of connected sensors and devices in the Internet of Things (IoT) to reveal valuable insights. An example of the application of IoT in health care is the monitoring of vaccines’ environment temperatures in real time. Vaccines need to be stored at 2-6 degrees Celsius, and they can be damaged when exposed to temperatures outside of this narrow range. In the context of developing countries, particularly in rural and remote locations, this has been highlighted as a serious problem. Monitoring the “cold chain” has traditionally been a manual and tardy process. Cold chain equipment in low- and middle-income countries has been found to be functioning poorly or non-functional.160 Over-freezing vaccines is also an issue, and a 2013 World Health Organization study in India found that 75 per cent of freeze-sensitive vaccines had been exposed to freezing.161 Currently, IoT temperature sensors are increasingly being used to monitor vaccines’ environment temperatures in real-time, with automatic warnings transmitted via GPRS or SMS when temperatures exceed critical thresholds.162
Another vaccine-related application of IoT in health care in developing countries includes digital necklaces that store the vaccination history of children in rural areas in India.163 The embedded near-field communication chip allows health workers to update patients’ vaccination records on their mobile phone. This data is synchronized with the database on the cloud when the mobile phone is able to connect to the Internet. This initiative shows that IoT can be applied in countries with low Internet connectivity.
In the field of health care, IoTs have also been used to collect patient data remotely through various attachments. Examples of attachments include patches to take patients’ baseline vitals and measure any deviations from the baseline remotely.164 Various attachments to smart phones are used in the medical field, including screening for oral lesions—a precursor of oral cancer, and testing for sexually transmitted diseases—dropping the cost of testing equipment from USD18,000 to USD34. There is also an ultrasound attachment for pregnancy monitoring.165 These attachments are a substitute to more expensive equipment available in developed countries, highlighting the different use and opportunities these technologies have for developing countries.
160 World Health Organization and United Nations Children’s Fund, “Achieving immunization targets with the comprehensive effective vaccine management (EVM) framework”, March 2016. Available from http://www.who.int/immunization/programmes_systems/supply_chain/EVM-JS_final.pdf.
161 Manoj V Murhekar and others, “Frequent exposure to suboptimal temperatures in vaccine cold-chain system in India: Results of temperature monitoring in 10 states”, World Health Organization Bulletin, vol. 91 (2013), pp. 906-913. Available from http://www.who.int/bulletin/volumes/91/12/13-119974.pdf.
162 Nexleaf Analytics, “What is Coldtrace?” Available from http://nexleaf.org/vaccines.163 KhushiBab, “What We Do”. Available from http://www.khushibaby.org.164 Lance Ulanoff, “This smart ‘band-aid’ could help the world beat Ebola”, Mashable, 15 March 2015. Available from
http://mashable.com/2015/03/14/smart-band-aid-ebola/.165 ICT Works, “5 mHealth Innovations Using Mobile Phone Extensions and Wearables”, 31 July 2015. Available from
http://www.ictworks.org/2015/07/31/5-mhealth-innovations-using-mobile-phone-extensions-and-wearables.
99
Annex 11 | Artificial Intelligence for Broadband Innovation
With the assistance of Artificial Intelligence (AI), broadband services, such as wireless sensor networks (WSNs), are able to transmit data and schedule tasks in a more simplified manner, thus significantly improving network performance.166 As technologies become more advanced and innovative, WSNs are expected to process multiple tasks and make decisions simultaneously, such as the selection of long-range or short-range radio for data transmission. The application of Reinforcement Learning (RL), an AI approach, uses algorism that covers most elements affecting network performance. Moreover, RL is designed to learn by itself, hence requires no prior knowledge of the operating environment.
Another research that focuses on WSNs suggests that AI approach has the potential to help WSNs minimize the use of energy, particularly when performance is associated with cooperative diversity.167 Scientists point out that AI technology can be used to exploit cooperative diversity and design the model to lower energy use, and thus its cost.
Moreover, AI can be used to help information and communications technologies achieve efficient resource allocation, particularly in meeting the exploding traffic demand over wireless systems. In the case of cognitive radios (CRs), their decision-making in resource allocation depends on optimization algorithms to process the parameters (time, frequency and space), minimize factors like power consumption, bit error rate and interference, and maximize spectrum efficiency.168 These examples of WSNs and CRs demonstrate how AI approach has advantages in satisfying the increasing demand to handle complex decision-making.
166 Kok-Lim Alvin Yau and others, “Application of reinforcement learning to wireless sensor networks: Models and algorithms”, Computing, vol. 97, no. 11 (2015), pp. 1045-1075.
167 M. Sarper Gokturk and Ozgur Gurbuz, “Cooperation with multiple relays in wireless sensor networks: Optimal cooperator selection and power assignment”, Wireless Networks, vol. 20, no. 2 (February 2014), pp. 209-225.
168 Nadine Abbas, Youssef Nasser and Karim El Ahmad, “Recent advances on artificial intelligence and learning techniques in cognitive radio network”, EURASIP Journal on Wireless Communications and Networking (December 2015), p. 174.
Artificial Intelligence and Broadband Divide: State of ICT Connectivity in Asia and the Pacific
100
Annexes
Annex 12 | Recent Research on the Impact of Innovation on Labour Markets in Developing Countries
The extent of the trade-off between employment growth and innovation-led productivity gains is a critical issue for policymakers. The issue is even more crucial in developing countries where the need to increase higher-productivity jobs is strong. Using a sample of 15,000 companies in developing countries across the world, Cicera and Sabetti169 show that employment increases at a higher rate in middle-income countries than in their higher-income counterparts for each dollar of revenue generated through product innovation. The authors attribute this finding to the fact that efficiency gains are smaller in lower-income countries because innovation is mostly based on small improvements to existing products in these economies. By contrast, innovation is more labour efficient in higher-income countries.
The authors also find that organizational innovation and process innovation have no sizeable impact on employment. No evidence of labour displacement or job losses is found as far as automation is concerned, and changes in the quality of labour are the most likely outcome of automation, according to the authors.
The latter finding is not surprising. Theoretically, developing countries are expected to exhibit a weaker job polarization170 process relative to their developed counterparts according to Maloney and Molina.171 Firstly, some significant barriers to technological absorption exist in developing economies, which will limit the share of middle-skill jobs impacted by automation. For example, developing countries may be characterized by a lack of resources to undertake significant investments, lack of ICT capital and lack of labour skills to ensure maintenance. Secondly, the adoption of automated processes may be hindered by a shortage of skilled people that can provide complementary tasks. Thirdly, developing countries are characterized by a fewer proportion of automatable jobs than developed countries. Fourthly, job creation can be spurred in developing countries through jobs offshored from developed countries, which may increase the demand for middle-skill jobs.
Using labour force data for 21 developing countries across the world, Maloney and Molina argue that even if there is currently no strong evidence of polarization in developing countries due to automation, some signs indicate that this may no longer be the case in the near future. While the majority of countries examined in the study show no decline in middle-skill jobs relative to other categories, there are some notable exceptions such as Brazil, Indonesia and Mexico. In particular, China is characterized by a rapid robotization process and this may be the reason explaining why a large number of recent graduates perceive themselves as being underemployed. The authors argue that the speed at which labour tasks can complement automated processes may be very slow.
169 Xavier Cirera and Leonard Sabetti, “The Effects of Innovation on Employment in Developing Countries: Evidence from Enterprise Surveys”, World Bank Policy Research Working Paper 7775, August 2016.
170 The polarization concept in economics refers to the relative decline in employment in jobs in the middle of the skill distribution relative to low-skilled and high-skilled occupations.
171 William F. Maloney and Carlos Molina, “Are Automation and Trade Polarizing Developing Country Labor Markets, Too?” World Bank Policy Research Working Paper 7922, December 2016. Available from https://openknowledge.worldbank.org/bitstream/handle/10986/25821/WPS7922.pdf.
101
Annex 13 | Country Groupings
Geographical ESCAP Member Countries:172 Afghanistan; American Samoa; Armenia; Australia; Azerbaijan; Bangladesh; Bhutan; Brunei Darussalam; Cambodia; China; Korea (Democratic People’s Republic); Fiji; French Polynesia; Georgia; Guam; Hong Kong (China); India; Indonesia; Iran (Islamic Republic of); Japan; Kazakhstan; Kiribati; Korea (Republic of); Kyrgyzstan; Lao People’s Democratic Republic; Macao (China); Malaysia; Maldives; Marshall Islands; Micronesia (Federated States of); Mongolia; Myanmar; Nauru; Nepal; New Caledonia; New Zealand; Northern Mariana Islands; Pakistan; Palau; Papua New Guinea; Philippines; Russian Federation; Samoa; Singapore; Solomon Islands; Sri Lanka; Tajikistan; Thailand; Timor-Leste; Tonga; Turkey; Turkmenistan; Tuvalu; Uzbekistan; Vanuatu; Viet Nam.
Europe:173 Albania; Andorra; Austria; Belarus; Belgium; Bosnia and Herzegovina; Bulgaria; Croatia; Cyprus; Czech Republic; Denmark; Estonia; Faroe Islands; Finland; France; Germany; Gibraltar; Greece; Guernsey; Hungary; Iceland; Ireland; Italy; Jersey; Latvia; Liechtenstein; Lithuania; Luxembourg; Malta; Moldova; Monaco; Montenegro; Netherlands; Norway; Poland; Portugal; Romania; San Marino; Serbia; Slovak Republic; Slovenia; Spain; Sweden; Switzerland; the former Yugoslav Republic of Macedonia; Ukraine; United Kingdom.
Africa:174 Algeria; Angola; Benin; Botswana; Burkina Faso; Burundi; Cameroon; Cape Verde; Central African Republic; Chad; Comoros; Congo; Congo (Democratic Republic of the); Cote d’Ivoire; Djibouti; Egypt; Equatorial Guinea; Eritrea; Ethiopia; Gabon; Gambia; Ghana; Guinea; Guinea-Bissau; Kenya; Lesotho; Liberia; Libya; Madagascar; Malawi; Mali; Mauritania; Mauritius; Morocco; Mozambique; Namibia; Niger; Nigeria; Rwanda; Sao Tome and Principe; Senegal; Seychelles; Sierra Leone; Somalia; South Africa; South Sudan; Sudan; Swaziland; Tanzania; Togo; Tunisia; Uganda; Zambia; Zimbabwe.
North America:175 Bermuda; Canada; Greenland; United States of America.
Latin America and Caribbean:176 Antigua and Barbuda; Argentina; Aruba; Bahamas; Barbados; Belize; Bolivia; Brazil; Cayman Islands; Chile; Colombia; Costa Rica; Cuba; Dominica; Dominican Republic; Ecuador; El Salvador; Grenada; Guatemala; Guyana; Haiti; Honduras; Jamaica; Mexico; Nicaragua; Panama; Paraguay; Peru; Puerto Rico; Saint Kitts and Nevis; Saint Lucia; St. Vincent and the Grenadines; Suriname; Trinidad and Tobago; Uruguay; Venezuela; Virgin Islands (U.S.).
ESCAP Low-Income Economies:177 Afghanistan; Korea (Democratic People’s Republic); Nepal.
172 ESCAP, “Economic and Social Commission for Asia and the Pacific Member States”. Available from http://www.unescap.org/about/member-states.
173 Ibid.174 Ibid.175 Ibid.176 Ibid.177 ESCAP, Statistical Yearbook for Asia and the Pacific 2016 (Bangkok, 2016). Available from http://www.unescap.org/
sites/default/files/publications/ESCAP_SYB2016_SDG_baseline_report.pdf.
Artificial Intelligence and Broadband Divide: State of ICT Connectivity in Asia and the Pacific
102
Annexes
ESCAP Lower-Middle-Income Economies:178 Armenia; Bangladesh; Bhutan; Cambodia; India; Indonesia; Kiribati; Kyrgyzstan; Lao People’s Democratic Republic; Micronesia (Federated States of); Mongolia; Myanmar; Pakistan; Papua New Guinea; Philippines; Samoa; Solomon Islands; Sri Lanka; Tajikistan; Timor-Leste; Tonga; Uzbekistan; Vanuatu; Viet Nam.
ESCAP Upper-Middle-Income Economies:179 American Samoa; Azerbaijan; China; Fiji; Georgia Iran (Islamic Republic of); Kazakhstan; Malaysia; Maldives; Marshall Islands; Mongolia; Palau; Russian Federation; Thailand; Turkey; Turkmenistan; Tuvalu.
ESCAP High-Income Economies:180 Australia; Brunei Darussalam; French Polynesia; Guam; Hong Kong (China); Japan; Korea (Republic of); Macao (China); New Caledonia; New Zealand; Northern Mariana Islands; Singapore.
ESCAP Members East and North-East Asia: China; D.P.R. Korea; Hong Kong (China); Japan; Korea (Republic of); Macao (China); Mongolia.
ESCAP Members South-East Asia: Brunei Darussalam; Cambodia; Indonesia; Lao People’s Democratic Republic; Malaysia; Myanmar; Philippines; Singapore; Thailand; Timor-Leste; Viet Nam.
ESCAP Members North and Central Asia: Armenia; Azerbaijan; Georgia; Kazakhstan; Kyrgyzstan; Russian Federation; Tajikistan; Turkmenistan; Uzbekistan.
ESCAP Members South and South-West Asia: Afghanistan; Bangladesh; Bhutan; India; Iran (Islamic Republic of); Maldives; Nepal; Pakistan; Sri Lanka; Turkey.
ESCAP Members Pacific: American Samoa; Australia; Fiji; French Polynesia; Guam; Kiribati; Marshall Islands; Micronesia (Federated States of); Nauru; New Caledonia; New Zealand; Niue; Northern Mariana Islands; Palau; Papua New Guinea; Samoa; Solomon Islands; Tonga; Tuvalu; Vanuatu.
Scimago Journal & Country Rank, Countries Included in the Analysis:
Albania; Algeria; Argentina; Armenia; Australia; Austria; Azerbaijan; Bahrain; Bangladesh; Belarus; Belgium; Benin; Bhutan; Bolivia; Bosnia and Herzegovina; Botswana; Brazil; Brunei Darussalam; Bulgaria; Cambodia; Cameroon; Canada; Chile; China; Colombia; Costa Rica; Croatia; Cuba; Cyprus; Czech Republic; Denmark; Dominican Rep.; Ecuador; Egypt; Estonia; Ethiopia; Fiji; Finland; France; Gabon; Georgia; Germany; Ghana; Greece; Guatemala; Hong Kong (China); Hungary; Iceland; India; Indonesia; Iran (Islamic Republic of); Iraq; Ireland; Israel; Italy; Jamaica; Japan; Jordan; Kazakhstan; Kenya; Korea (Republic of); Kuwait; Lao People’s Democratic Republic; Latvia; Lebanon; Libya; Lithuania; Luxembourg; Macao (China); Madagascar; Malaysia; Malta; Mauritius; Mexico; Moldova; Mongolia; Montenegro; Morocco; Myanmar; Namibia; Nepal; Netherlands; New Caledonia; New Zealand; Nicaragua; Niger; Nigeria; Norway; Oman; Pakistan; Palestine; Panama; Paraguay; Peru; Philippines; Poland; Portugal; Puerto Rico; Qatar; Romania; Russian Federation; Rwanda; Reunion; Saudi Arabia;
178 Ibid.179 Ibid.180 Ibid.
103
Senegal; Serbia; Singapore; Slovakia; Slovenia; South Africa; Spain; Sri Lanka; Sudan; Swaziland; Sweden; Switzerland; Syria; the former Yugoslav Republic of Macedonia; Taiwan, Province of China; Thailand; Timor-Leste; Trinidad & Tobago; Tunisia; Turkey; Uganda; Ukraine; United Arab Emirates; United Kingdom; United States; Uruguay; Uzbekistan; Venezuela; Viet Nam; Yemen; Zambia.
World Economic Forum, The Networked Readiness Index Historical Dataset 2012-2016. Country Listing:
Albania; Algeria; Argentina; Armenia; Australia; Austria; Azerbaijan; Bahrain; Bangladesh; Belgium; Benin; Bhutan; Bolivia; Bosnia and Herzegovina; Botswana; Brazil; Bulgaria; Burundi; Cambodia; Cameroon; Canada; Cape Verde; Chad; Chile; China; Colombia; Costa Rica; Croatia; Cyprus; Czech Republic; Côte d’Ivoire; Denmark; Dominican Rep.; Ecuador; Egypt; El Salvador; Estonia; Ethiopia; Finland; France; Gabon; Gambia; Georgia; Germany; Ghana; Greece; Guatemala; Guinea; Guyana; Haiti; Honduras; Hong Kong (China); Hungary; Iceland; India; Indonesia; Iran (Islamic Republic of); Ireland; Israel; Italy; Jamaica; Japan; Jordan; Kazakhstan; Kenya; Korea (Republic of); Kuwait; Kyrgyzstan; Lao People’s Democratic Republic; Latvia; Lebanon; Lesotho; Liberia; Lithuania; Luxembourg; Madagascar; Malawi; Malaysia; Mali; Malta; Mauritania; Mauritius; Mexico; Moldova; Mongolia; Montenegro; Morocco; Mozambique; Myanmar; Namibia; Nepal; Netherlands; New Zealand; Nicaragua; Nigeria; Norway; Oman; Pakistan; Panama; Paraguay; Peru; Philippines; Poland; Portugal; Qatar; Romania; Russian Federation; Rwanda; Saudi Arabia; Senegal; Serbia; Seychelles; Singapore; Slovakia; Slovenia; South Africa; Spain; Sri Lanka; Swaziland; Sweden; Switzerland; the former Yugoslav Republic of Macedonia; Taiwan, Province of China; Tajikistan; Tanzania; Thailand; Trinidad & Tobago; Tunisia; Turkey; Uganda; Ukraine; United Arab Emirates; United Kingdom; United States; Uruguay; Venezuela; Viet Nam; Zambia; Zimbabwe.
Artificial Intelligence and Broadband Divide: State of ICT Connectivity in Asia and the Pacific
104
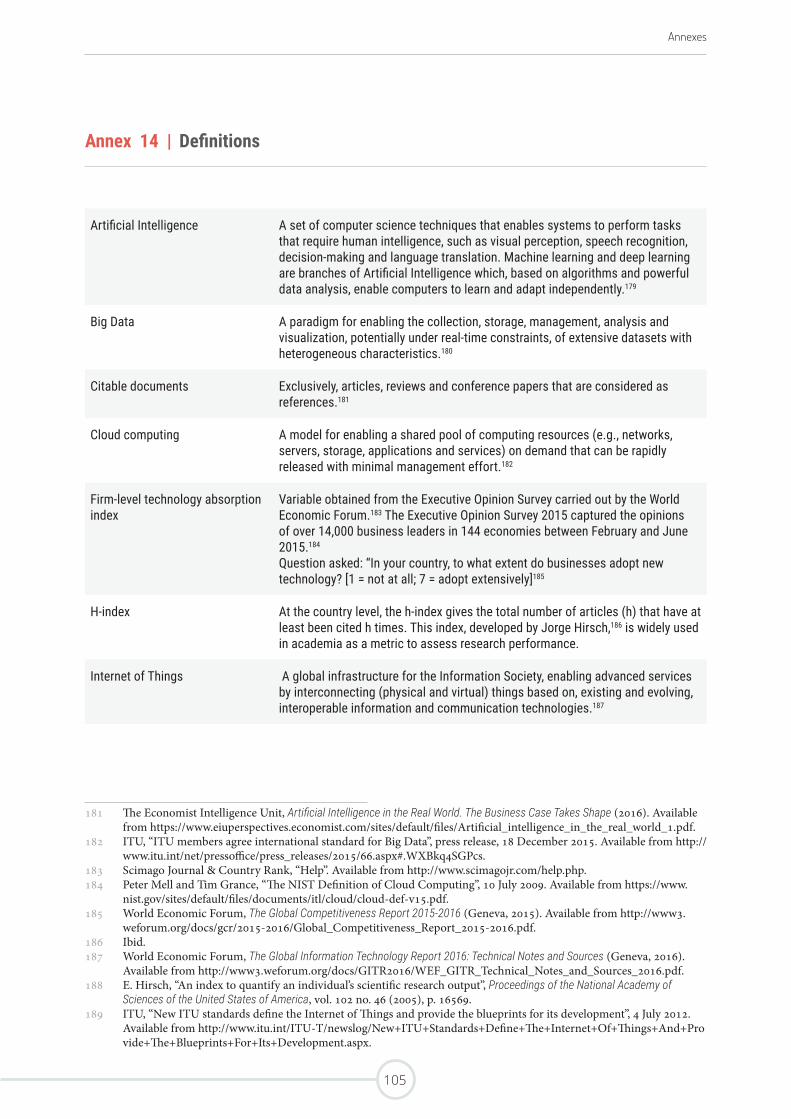
Annexes
Annex 14 | Definitions
Artificial Intelligence A set of computer science techniques that enables systems to perform tasks that require human intelligence, such as visual perception, speech recognition, decision-making and language translation. Machine learning and deep learning are branches of Artificial Intelligence which, based on algorithms and powerful data analysis, enable computers to learn and adapt independently.179
Big Data A paradigm for enabling the collection, storage, management, analysis and visualization, potentially under real-time constraints, of extensive datasets with heterogeneous characteristics.180
Citable documents Exclusively, articles, reviews and conference papers that are considered as references.181
Cloud computing A model for enabling a shared pool of computing resources (e.g., networks, servers, storage, applications and services) on demand that can be rapidly released with minimal management effort.182
Firm-level technology absorption index
Variable obtained from the Executive Opinion Survey carried out by the World Economic Forum.183 The Executive Opinion Survey 2015 captured the opinions of over 14,000 business leaders in 144 economies between February and June 2015.184
Question asked: “In your country, to what extent do businesses adopt new technology? [1 = not at all; 7 = adopt extensively]185
H-index At the country level, the h-index gives the total number of articles (h) that have at least been cited h times. This index, developed by Jorge Hirsch,186 is widely used in academia as a metric to assess research performance.
Internet of Things A global infrastructure for the Information Society, enabling advanced services by interconnecting (physical and virtual) things based on, existing and evolving, interoperable information and communication technologies.187
181 182 183 184 185 186 187 188 189
181 The Economist Intelligence Unit, Artificial Intelligence in the Real World. The Business Case Takes Shape (2016). Available from https://www.eiuperspectives.economist.com/sites/default/files/Artificial_intelligence_in_the_real_world_1.pdf.
182 ITU, “ITU members agree international standard for Big Data”, press release, 18 December 2015. Available from http://www.itu.int/net/pressoffice/press_releases/2015/66.aspx#.WXBkq4SGPcs.
183 Scimago Journal & Country Rank, “Help”. Available from http://www.scimagojr.com/help.php.184 Peter Mell and Tim Grance, “The NIST Definition of Cloud Computing”, 10 July 2009. Available from https://www.
nist.gov/sites/default/files/documents/itl/cloud/cloud-def-v15.pdf.185 World Economic Forum, The Global Competitiveness Report 2015-2016 (Geneva, 2015). Available from http://www3.
weforum.org/docs/gcr/2015-2016/Global_Competitiveness_Report_2015-2016.pdf.186 Ibid.187 World Economic Forum, The Global Information Technology Report 2016: Technical Notes and Sources (Geneva, 2016).
Available from http://www3.weforum.org/docs/GITR2016/WEF_GITR_Technical_Notes_and_Sources_2016.pdf.188 E. Hirsch, “An index to quantify an individual’s scientific research output”, Proceedings of the National Academy of
Sciences of the United States of America, vol. 102 no. 46 (2005), p. 16569.189 ITU, “New ITU standards define the Internet of Things and provide the blueprints for its development”, 4 July 2012.
Available from http://www.itu.int/ITU-T/newslog/New+ITU+Standards+Define+The+Internet+Of+Things+And+Provide+The+Blueprints+For+Its+Development.aspx.
105
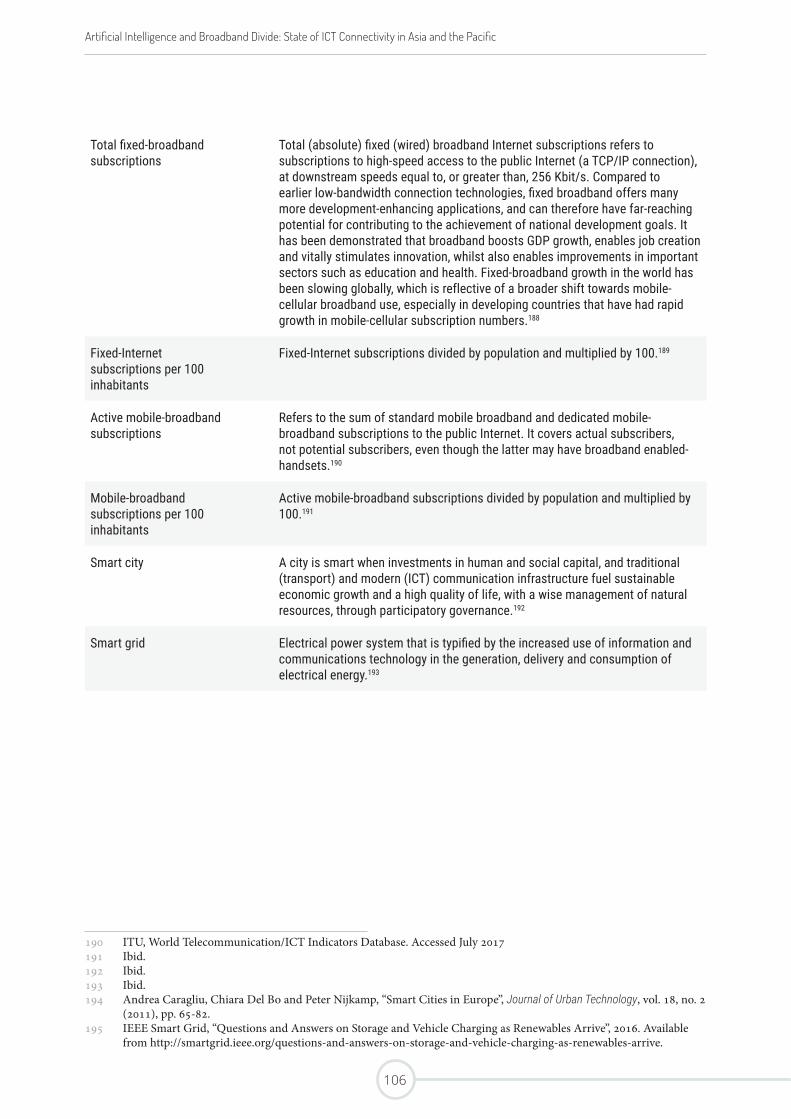
Total fixed-broadband subscriptions
Total (absolute) fixed (wired) broadband Internet subscriptions refers to subscriptions to high-speed access to the public Internet (a TCP/IP connection), at downstream speeds equal to, or greater than, 256 Kbit/s. Compared to earlier low-bandwidth connection technologies, fixed broadband offers many more development-enhancing applications, and can therefore have far-reaching potential for contributing to the achievement of national development goals. It has been demonstrated that broadband boosts GDP growth, enables job creation and vitally stimulates innovation, whilst also enables improvements in important sectors such as education and health. Fixed-broadband growth in the world has been slowing globally, which is reflective of a broader shift towards mobile-cellular broadband use, especially in developing countries that have had rapid growth in mobile-cellular subscription numbers.188
Fixed-Internet subscriptions per 100 inhabitants
Fixed-Internet subscriptions divided by population and multiplied by 100.189
Active mobile-broadband subscriptions
Refers to the sum of standard mobile broadband and dedicated mobile-broadband subscriptions to the public Internet. It covers actual subscribers, not potential subscribers, even though the latter may have broadband enabled-handsets.190
Mobile-broadband subscriptions per 100 inhabitants
Active mobile-broadband subscriptions divided by population and multiplied by 100.191
Smart city A city is smart when investments in human and social capital, and traditional (transport) and modern (ICT) communication infrastructure fuel sustainable economic growth and a high quality of life, with a wise management of natural resources, through participatory governance.192
Smart grid Electrical power system that is typified by the increased use of information and communications technology in the generation, delivery and consumption of electrical energy.193
190 191 192 193 194 195
190 ITU, World Telecommunication/ICT Indicators Database. Accessed July 2017191 Ibid.192 Ibid.193 Ibid.194 Andrea Caragliu, Chiara Del Bo and Peter Nijkamp, “Smart Cities in Europe”, Journal of Urban Technology, vol. 18, no. 2
(2011), pp. 65-82.195 IEEE Smart Grid, “Questions and Answers on Storage and Vehicle Charging as Renewables Arrive”, 2016. Available
from http://smartgrid.ieee.org/questions-and-answers-on-storage-and-vehicle-charging-as-renewables-arrive.
Artificial Intelligence and Broadband Divide: State of ICT Connectivity in Asia and the Pacific
106