southside hampton roads hazard mitigation plan ... · southside hampton roads hazard mitigation...
TRANSCRIPT

SOUTHSIDE HAMPTON ROADS HAZARD MITIGATION PLAN
VULNERABILITY ASSESSMENT
2011 UPDATE
Each of the hazards in this section was reviewed and updated to reflect the revised information obtained for the updated Hazard Identification and Analysis section. Discussion of vulnerability to Mosquito Borne Diseases, Sea Level Rise and Land Subsidence, and the manmade hazards has been appended. The vulnerability discussion for sinkholes and landslides was excerpted, and all hazard names were edited to provide consistency with the Hazard Identification and Analysis. Table 5.2 was updated with available Census 2010 data, Table 5.3 was updated with new HAZUS exposure data, and Table 5.4 was updated with additional explanation included in the descriptive narrative. Table 5.5 was updated with more recent National Flood Insurance Program (NFIP) data, and the Development Trends section was updated using Census 2010 data. The tables at the end of the section regarding Conclusions on Hazard Risk were all updated. In addition, each of the following hazard sections was updated as follows: Floods – Table 5.7 was revised to reflect the Mitigation Planning Committee’s decision to change the probability from “Possible” to “Likely”. The NFIP statistics were updated with new data on policies and repetitive losses. A description of Severe Repetitive Losses is included, and maps of repetitive flood loss areas for each jurisdiction with repetitive losses were appended. Table 5.9 was updated using HAZUS flood analysis rather than GIS analysis, and the annualized flood damages were also updated. Hurricanes and Tropical Storms – Loss estimate tables and corresponding narrative were updated based on a new HAZUS analysis. Severe Thunderstorms and Hail - Loss estimate table and corresponding narrative were updated based on the inclusion of recent events. Lightning – The annualized loss estimate was recalculated based on the inclusion of recent events, but was determined to remain negligible. Tornadoes - Loss estimate table and corresponding narrative were updated based on the inclusion of recent events. Winter Storms and Nor’easters - Loss estimate table and corresponding narrative were updated based on the inclusion of recent events. Shoreline Erosion – Revised text to reflect hazard name change, and added information on the Virginia Institute of Marine Science Comprehensive Coastal Inventory Program. Droughts – Removed the estimate of potential losses because the methodology was unsupported. Updated the data table with most recent agricultural data to provide a time series comparison. Wildfires - Loss estimate table and corresponding narrative were updated based on the inclusion of recent events. Dam Failure – Checked the National Inventory of Dams to ensure no updates were necessary.
INTRODUCTION
The Vulnerability Assessment section builds on the information provided in the Hazard Identification and Analysis by identifying community assets and development trends in the region, then assessing the potential impact and amount of damage (loss of life and/or property) that could be caused by each hazard event addressed in this risk assessment. The primary objective of this level of vulnerability assessment is to prioritize hazards of concern to the region, adding to the foundation for mitigation strategy and policy development. Consistent with the preceding sections, the following hazards are addressed in this assessment:

VULNERABILITY ASSESSMENT
SOUTHSIDE HAMPTON ROADS HAZARD MITIGATION PLAN SEPTEMBER 2011
5:47
TABLE 5.47: COMPARISON OF ANNUALIZED LOSS ESTIMATES AND PRIORITY RISK INDEX VALUES
QUANTITATIVE ASSESSMENT FINDINGS QUALITATIVE ASSESSMENT FINDINGS
HAZARD ANNUALIZED LOSS
ESTIMATES HAZARD PRI VALUE
Sea Level Rise and Land Subsidence
$281,000,000 to $620,000,000 Floods (100-Year) 3.5
Floods (100-year) $2,821,224,000 Sea Level Rise and Land Subsidence
3.2
Floods (Storm Surge) $206,624,689 Hurricanes and Tropical Storms
3.2
Urban Fires $41,149,088 Hazardous Materials Incidents 3.1 Hurricanes and Tropical Storms
$30,443,000 Floods (Storm Surge) 3.0
Winter Storms and Nor’easters $1,183,529 Winter Storms and Nor’easters 3.0 Tornadoes $614,377 Biological Threats 2.9 Severe Thunderstorms and Hail
$264,917 Severe Thunderstorms and Hail
2.8
Earthquakes $93,000 Tornadoes 2.7 Hazardous Materials Incidents $42,229 Lightning 2.7 Wildfires $11,758 Tsunamis 2.6 Shoreline Erosion Undetermined Terrorism 2.6 Lightning Negligible Radiological Threats 2.6 Extreme Heat Negligible Wildfires 2.5 Dam Failures Negligible Urban Fires 2.4 Mosquito Borne Diseases Negligible Droughts 2.2 Terrorism Negligible Dam Failures 2.2 Biological Threats Negligible Shoreline Erosion 2.1 Radiological Threats Negligible Extreme Heat 2.1 Droughts Undetermined Mosquito Borne Diseases 2.1 Tsunamis Undetermined Earthquakes 1.9
The conclusions drawn from the qualitative and quantitative assessments, combined with final determinations from the Mitigation Planning Committee, were inserted into three categories for a final summary of hazard risk for the region based on High, Moderate or Low designations (Table 5.48). It should be noted that although some hazards are classified as posing Low risk, their occurrence of varying or unprecedented magnitudes is still possible and will continue to be reevaluated during future updates of this Plan.

VULNERABILITY ASSESSMENT
SOUTHSIDE HAMPTON ROADS HAZARD MITIGATION PLAN SEPTEMBER 2011
5:46
CONCLUSIONS ON HAZARD RISK
The vulnerability assessment performed for the Southside Hampton Roads region provides significant findings that allow the Mitigation Planning Committee to prioritize hazard risks and proposed hazard mitigation strategies and actions. Prior to assigning conclusive risk levels for each hazard, the Mitigation Planning Committee reviewed the results of quantitative and qualitative assessments shown in the following tables. Table 5.46 summarizes the degree of risk assigned to each category for all identified hazards in the region based on the application of the Priority Risk Index (PRI) tool fully introduced in “Methodologies Used.” Assigned risk levels were based on historical and anecdotal data, as well as input from the Mitigation Planning Committee. The results were then used in calculating PRI values and making conclusions for the qualitative assessment.
TABLE 5.46: SUMMARY OF QUALITATIVE ASSESSMENT
HAZARD
CATEGORY/DEGREE OF RISK
PROBABILITY IMPACT SPATIAL EXTENT
WARNING TIME DURATION
Floods (100-Year) Highly Likely Catastrophic Moderate More than 24 Hours More than 1 Week Floods (Storm Surge) Likely Catastrophic Moderate More than 24 Hours Less than 24 Hours Sea Level Rise and Land Subsidence
Highly Likely Critical Moderate More than 24 Hours More than 1 Week
Hurricanes and Tropical Storms Likely Catastrophic Large More than 24 Hours Less than 24 Hours Severe Thunderstorms and Hail Highly Likely Minor Large Less than 6 Hours Less than 6 Hours Lightning Highly Likely Limited Small Less than 6 Hours Less than 6 hours Tornadoes Likely Critical Small Less than 6 Hours Less than 6 Hours Winter Storms and Nor’easters Likely Critical Large More than 24 Hours Less than 1 Week Shoreline Erosion Likely Minor Small More than 24 Hours More than 1 Week Earthquakes Unlikely Minor Large Less than 6 Hours Less than 6 Hours Droughts Possible Minor Large More than 24 Hours More than 1 Week Wildfires Highly Likely Minor Small Less than 6 Hours Less than 24 Hours Dam Failures Unlikely Critical Small Less than 6 hours Less than 24 Hours Tsunamis Unlikely Catastrophic Moderate Less than 6 Hours Less than 6 Hours Extreme Heat Possible Minor Large More than 24 Hours Less than 1 Week Mosquito Borne Diseases Possible Limited Small More than 24 hours More than 1 week Hazardous Materials Incidents
Highly Likely Critical Small Less than 6 hours Less than 24 hours
Urban Fires Likely Limited Small Less than 6 hours Less than 6 hours Terrorism Possible Critical Moderate Less than 6 hours Less than 6 hours Biological Threats Possible Critical Moderate Less than 6 hours More than 1 Week Radiological Threats Unlikely Critical Moderate Less than 6 hours More than 1 Week
Source: Southside Hampton Roads Mitigation Planning Committee Table 5.47 summarizes the annualized loss estimates that were generated for the applicable hazards based on the quantitative assessment and compares them with the PRI values determined for each hazard based on the qualitative assessment. The results and comparisons of both assessments aided the Mitigation Planning Committee in determining the final conclusions on overall hazard risk for the Southside Hampton Roads region.

VULNERABILITY ASSESSMENT
SOUTHSIDE HAMPTON ROADS HAZARD MITIGATION PLAN SEPTEMBER 2011
5:45
FUTURE VULNERABILITY AND LAND USE Future land use and zoning of structural development as discussed in previous subsections is expected to have less impact on future vulnerability to this hazard than the protection of human life through administration of proper emergency notification and evacuation planning with regard to potential radiological incidents.
TABLE 5.45: POTENTIALLY AT-RISK STRUCTURES FOR RADIOLOGICAL THREATS
JURISDICTION
STRUCTURES WITHIN 10 MILES OF SURRY NUCLEAR
POWER PLANT
STRUCTURES WITHIN 10 MILES OF NORFOLK NAVAL
STATION
STRUCTURES WITHIN 10 MILES OF NORFOLK NAVAL
SHIPYARD, PORTSMOUTH
STRUCTURES WITHIN 10 MILES OF
HUNTINGTON INGALLS
INDUSTRIES, NEWPORT NEWS
Isle of Wight County 1,570 0 0 8,362
Norfolk 0 85,024 90,779 11,284
Portsmouth 0 34,343 49,338 10,154
Suffolk 0 3,911 7,686 10,844
Virginia Beach 0 159 65,362 0
TOTALS 1,570 123,437 213,165 40,644
Source: GIS Analysis

VULNERABILITY ASSESSMENT
SOUTHSIDE HAMPTON ROADS HAZARD MITIGATION PLAN SEPTEMBER 2011
5:44
RADIOLOGICAL THREATS
PRI Value: 2.6 Annualized Loss Estimate: Negligible (Less than $1,000) According to the qualitative assessment performed using the PRI tool, the radiological threat hazard scored a PRI value of 2.6 (from a scale of 0 to 4, with 4 being the highest risk level). Table 5.44 summarizes the risk levels assigned to each PRI category.
TABLE 5.44: QUALITATIVE ASSESSMENT FOR RADIOLOGICAL THREATS
PROBABILITY IMPACT SPATIAL EXTENT WARNING TIME DURATION
Unlikely Critical Moderate Less than 6 hours More than 1 Week
Source: Southside Hampton Roads Mitigation Planning Committee. Please refer to Table 5.1 for an explanation of the terms used.
ESTIMATES OF POTENTIAL LOSSES According to FEMA, approximately three million shipments of radioactive materials are made each year by highway, railroad, aircraft and ship. No deaths or serious injuries have ever been attributed to the radioactive nature of any materials involved in a transportation accident. Given the lack of information on previous occurrences of this hazard, it is not possible to determine an annualized loss estimate.
SOCIAL VULNERABILITY Southside communities have a variable threat risk for the radiological hazard based on proximity to Norfolk Naval Station and Surry Nuclear Power Plant. Parts of northern Isle of Wight County are located inside of the 10-mile radius known as the Emergency Protective Zone (EPZ) for Surry Nuclear Power Plant. However, the entire area within 50 miles of the station, which would include portions of each Southside community, would be assessed in the event of an accident to determine if there had been any impact on the environment or ingestion pathways. At-risk populations were estimated using the proxy of structures located within certain ranges of Surry Nuclear Power Plant, Norfolk Naval Station, Norfolk Naval Shipyard in Portsmouth and Huntington Ingalls Industries in Newport News on the Peninsula. Potentially at-risk structures (populations), as shown in Table 5.45, are presented for each jurisdiction.

VULNERABILITY ASSESSMENT
SOUTHSIDE HAMPTON ROADS HAZARD MITIGATION PLAN SEPTEMBER 2011
5:43
BIOLOGICAL THREATS
PRI Value: 2.9 Annualized Loss Estimate: Negligible (Less than $1,000) According to the qualitative assessment performed using the PRI tool, the biological threat hazard scored a PRI value of 2.9 (from a scale of 0 to 4, with 4 being the highest risk level). Table 5.43 summarizes the risk levels assigned to each PRI category.
TABLE 5.43: QUALITATIVE ASSESSMENT FOR BIOLOGICAL THREATS
PROBABILITY IMPACT SPATIAL EXTENT WARNING TIME DURATION
Possible Critical Moderate Less than 6 hours More than 1 Week
Source: Southside Hampton Roads Mitigation Planning Committee. Please refer to Table 5.1 for an explanation of the terms used.
ESTIMATES OF POTENTIAL LOSSES Annualized losses are estimated to be negligible (less than $1,000) due to the relative infrequency of past historical occurrences and the difficulty in predicting the circumstances and materials involved in future potential biological incidents.
SOCIAL VULNERABILITY At-risk populations would depend on the location and type of biological agent released as well as local meteorological conditions at the time of release and immediately afterwards. Therefore, it is not possible to identify specific at-risk populations beyond those discussed in the Demographics subsection.
FUTURE VULNERABILITY AND LAND USE Future land use and zoning of structural development as discussed in previous subsections is expected to have less impact on future vulnerability to this hazard than the protection of human life through administration of proper emergency notification and evacuation planning with regard to potential biological threats.

VULNERABILITY ASSESSMENT
SOUTHSIDE HAMPTON ROADS HAZARD MITIGATION PLAN SEPTEMBER 2011
5:42
TERRORISM
PRI Value: 2.6 Annualized Loss Estimate: Negligible (Less than $1,000) According to the qualitative assessment performed using the PRI tool, the terrorism hazard scored a PRI value of 2.6 (from a scale of 0 to 4, with 4 being the highest risk level). Table 5.42 summarizes the risk levels assigned to each PRI category.
TABLE 5.42: QUALITATIVE ASSESSMENT FOR TERRORISM
PROBABILITY IMPACT SPATIAL EXTENT WARNING TIME DURATION
Possible Critical Moderate Less than 6 hours Less than 6 hours
Source: Southside Hampton Roads Mitigation Planning Committee. Please refer to Table 5.1 for an explanation of the terms used.
ESTIMATES OF POTENTIAL LOSSES Given the lack of historical occurrences of terrorism in the Southside Communities, it is difficult to predict the circumstances under which the terrorism hazard would occur and what potential losses would be reasonable to assume. While one major event may result in significant losses, annualizing structural losses over a long period of time would most likely yield an annualized loss estimate of less than $1,000. The area is considered a terrorist target, especially due to the port in Portsmouth and the large number of military assets and personnel in the region.
SOCIAL VULNERABILITY At-risk populations would depend on the location and mode of attack as well as other local conditions at the time of occurrence and immediately thereafter. It is not possible to identify specific at-risk populations beyond those discussed in the Demographics subsection.
FUTURE VULNERABILITY AND LAND USE Future land use and zoning of structural development as discussed in previous subsections is expected to have less impact on future vulnerability than the protection of human life through administration of proper emergency notification and evacuation planning with regard to potential terrorist attacks. Any large government or community buildings as well as large infrastructure elements such as dams, nuclear facilities or transportation lifelines constructed in the future may be more at-risk than normal development because these types of facilities present opportunities for greater potential losses in one attack.

VULNERABILITY ASSESSMENT
SOUTHSIDE HAMPTON ROADS HAZARD MITIGATION PLAN SEPTEMBER 2011
5:41
TABLE 5.41: POTENTIALLY AT-RISK POPULATIONS FOR URBAN FIRE
POPULATION GROUP NUMBER
Children (Ages 5 and Under) 60,741
Elderly (Ages 65 and Over) 86,225
Disabled Status 141,089
Source: Census 2000
FUTURE VULNERABILITY AND LAND USE The application of building codes in the design and construction of new buildings and the rehabilitation of existing structures will help control future vulnerability; however, the urban fire hazard is not expected to be completely eliminated by these measures.

VULNERABILITY ASSESSMENT
SOUTHSIDE HAMPTON ROADS HAZARD MITIGATION PLAN SEPTEMBER 2011
5:40
URBAN FIRES
PRI Value: 2.4 Annualized Loss Estimate: $41,149,088 According to the qualitative assessment performed using the PRI tool, the urban fire hazard scored a PRI value of 2.4 (from a scale of 0 to 4, with 4 being the highest risk level). Table 5.39 summarizes the risk levels assigned to each PRI category.
TABLE 5.39: QUALITATIVE ASSESSMENT FOR URBAN FIRES
PROBABILITY IMPACT SPATIAL EXTENT WARNING TIME DURATION
Likely Limited Small Less than 6 hours Less than 6 hours
Source: Southside Hampton Roads Mitigation Planning Committee. Please refer to Table 5.1 for an explanation of the terms used.
ESTIMATES OF POTENTIAL LOSSES Based on the data provided by the Virginia Department of Fire Programs, there were 5,229 building fires and 191 building exposure fires in the five year period from 2006 to 2010. Therefore, there is an annual frequency of 1,046 building fire incidents, and average annual damages of $41,149,088.
TABLE 5.40: ANNUALIZED LOSSES FOR URBAN FIRE
JURISDICTION NUMBER OF
BUILDING FIRES PROPERTY DAMAGE
AVERAGE ANNUAL NUMBER OF EVENTS
ANNUALIZED LOSS
Isle of Wight County 155 $2,797,675 31 $559,535
City of Norfolk 756 $10,894,783 151.2 $2,178,957
City of Portsmouth 1,219 $23,129,852 243.8 $4,625,970
City of Suffolk 889 $17,980,410 177.8 $3,596,082
City of Virginia Beach 2,210 $150,942,721 442 $30,188,544
TOTAL 5,229 $205,745,441 1,045.8 $41,149,088
SOCIAL VULNERABILITY According to the U.S. Fire Administration, a division of FEMA, the most at-risk populations to the urban fire hazard are children, college campus residents, high-rise residents, manufactured home residents, those 65 years of age and older, people with disabilities and rural residents. Table 5.41 shows the total number of residents in Southside Hampton Roads within several of those population groups.

VULNERABILITY ASSESSMENT
SOUTHSIDE HAMPTON ROADS HAZARD MITIGATION PLAN SEPTEMBER 2011
5:39
FUTURE VULNERABILITY AND LAND USE Future land use and zoning of structural development as discussed in previous subsections are expected to have less impact on future vulnerability than the protection of human life through administration of proper emergency notification and evacuation planning with regard to potential hazardous material incidents.
TABLE 5.38: POTENTIALLY AT-RISK STRUCTURES FOR HAZARDOUS MATERIALS INCIDENTS
JURISDICTION STRUCTURES
WITHIN 0.1 MILE OF RAILROAD
STRUCTURES WITHIN 0.25 MILE
OF RAILROAD
STRUCTURES WITHIN 1 MILE OF RAILROAD
Isle of Wight County 917 1,532 2,969
Norfolk 7,421 18,806 55,576
Portsmouth 3,592 10,841 40,017
Suffolk 4,483 10,678 24,155
Virginia Beach 3,356 9,537 44,498
TOTALS 19,769 51,394 167,215
Source: GIS Analysis

VULNERABILITY ASSESSMENT
SOUTHSIDE HAMPTON ROADS HAZARD MITIGATION PLAN SEPTEMBER 2011
5:38
HAZARDOUS MATERIALS INCIDENTS
PRI Value: 3.1 Annualized Loss Estimate: $42,229 According to the qualitative assessment performed using the PRI tool, the hazardous material hazard scored a PRI value of 3.1 (from a scale of 0 to 4, with 4 being the highest risk level). Table 5.36 summarizes the risk levels assigned to each PRI category.
TABLE 5.36: QUALITATIVE ASSESSMENT FOR HAZARDOUS MATERIALS INCIDENTS
PROBABILITY IMPACT SPATIAL EXTENT WARNING TIME DURATION
Highly Likely Critical Small Less than 6 hours Less than 24 hours
Source: Southside Hampton Roads Mitigation Planning Committee. Please refer to Table 5.1 for an explanation of the terms used.
ESTIMATES OF POTENTIAL LOSSES Based on information provided in the Hazard Identification and Analysis section, the Southside Hampton Roads region experiences an average of 20 hazardous materials incidents per year with only minor damages (generally less than $10,000 per year) reported. Table 5.37 shows hazardous materials incidents from 1998 to 2011 in the Southside Hampton Roads region (according to the United States Department of Transportation) that contribute to an annualized loss estimate of $42,229. During the period, no hazardous materials incidents were reported in the towns of Smithfield and Windsor or Isle of Wight County.
Sources: U.S. Department of Transportation; Statistical Risk Assessment Methodology
SOCIAL VULNERABILITY At-risk populations were estimated using the proxy of structures located within certain ranges of high-risk railway corridors. Potentially at-risk structures (populations), as shown in Table 5.38, are presented for each jurisdiction.
TABLE 5.37: ANNUALIZED LOSSES FOR HAZARDOUS MATERIALS INCIDENTS
JURISDICTION NUMBER OF EVENTS PROPERTY DAMAGE AVERAGE ANNUAL
NUMBER OF EVENTS ANNUALIZED LOSS
Norfolk 91 $47,691 7.3 $3,815
Portsmouth 38 $118,693 3.0 $9,495
Suffolk 11 $292,978 0.9 $23,438
Virginia Beach 115 $54,107 9.2 $4,329
TOTAL 255 $527,863 20.4 $42,229

VULNERABILITY ASSESSMENT
SOUTHSIDE HAMPTON ROADS HAZARD MITIGATION PLAN SEPTEMBER 2011
5:37
MOSQUITO BORNE DISEASES
PRI Value: 2.1 Annualized Loss Estimate: Negligible (Less than $1,000) According to the qualitative assessment performed using the PRI tool, the mosquito borne disease hazard scored a PRI value of 2.1 (from a scale of 0 to 4, with 4 being the highest risk level). Table 5.35 summarizes the risk levels assigned to each PRI category.
TABLE 5.35: QUALITATIVE ASSESSMENT FOR MOSQUITO BORNE DISEASES
PROBABILITY IMPACT SPATIAL EXTENT WARNING TIME DURATION
Possible Limited Small More than 24 hours More than 1 week
Source: Southside Hampton Roads Mitigation Planning Committee. Please refer to Table 5.1 for an explanation of the terms used.
ESTIMATES OF POTENTIAL LOSSES An outbreak of a Mosquito Borne Disease may burden local medical facilities in terms of capacity for treatment, and may burden City and County public works agencies with mosquito abatement and control responsibilities, but would not be expected to impact the built environment or community infrastructure in any way.
SOCIAL VULNERABILITY Eastern Equine Encephalitis: Residents of and visitors to areas with an established presence of the virus and people who engage in outdoor work and recreational activities are at increased risk of getting the diseases. Persons over age 50 and younger than age 15 seem to be at greatest risk for developing severe disease after outbreaks begin. (Virginia Department of Health, 2011) West Nile Virus: Anyone can get WNV infection if bitten by an infected mosquito; however, even in areas where transmission of WNV is active, less than 1 percent of mosquitoes are likely to be infected. Additionally, less than 1 percent of people bitten by an infected mosquito will become seriously ill. People who are over age 50 are at greater risk of severe illness. (Virginia Department of Health, 2011)
FUTURE VULNERABILITY AND LAND USE Future land use is expected to have less impact on future vulnerability than the protection of public health through dissemination of proper individual protection measures and emergency notification with regard to mosquito borne disease outbreaks.
VULNERABILITY ASSESSMENT
SOUTHSIDE HAMPTON ROADS HAZARD MITIGATION PLAN SEPTEMBER 2011
5:36
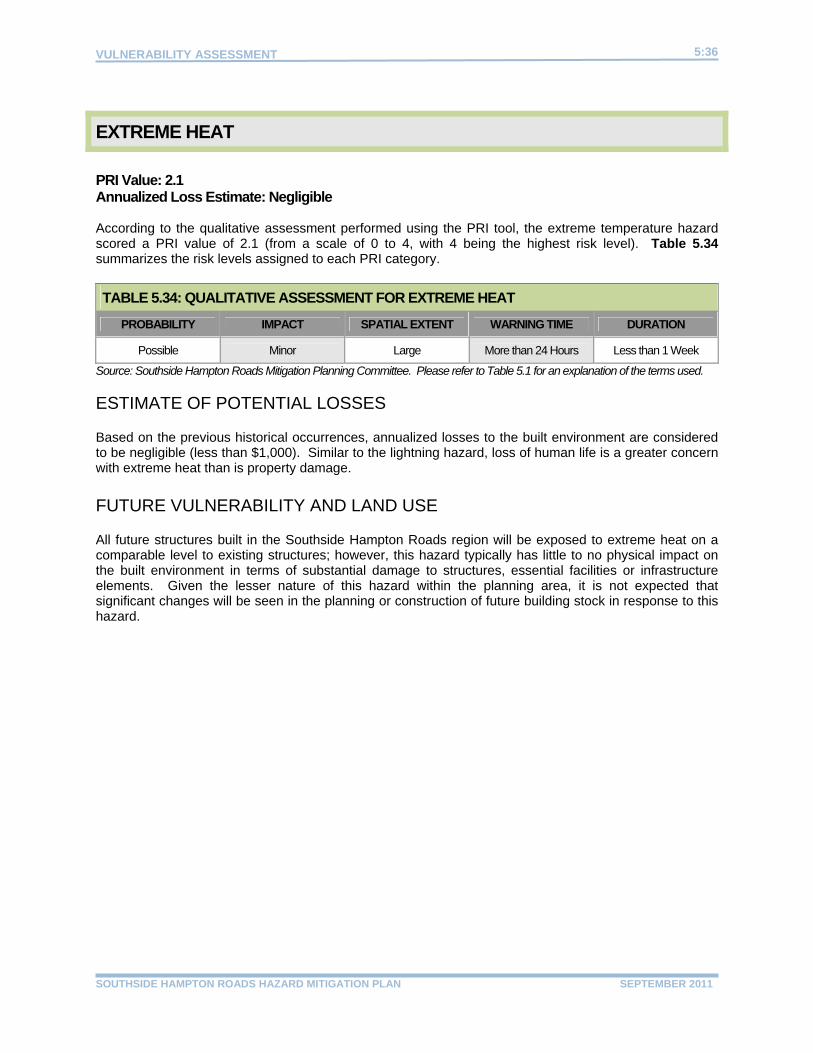
EXTREME HEAT
PRI Value: 2.1 Annualized Loss Estimate: Negligible According to the qualitative assessment performed using the PRI tool, the extreme temperature hazard scored a PRI value of 2.1 (from a scale of 0 to 4, with 4 being the highest risk level). Table 5.34 summarizes the risk levels assigned to each PRI category.
TABLE 5.34: QUALITATIVE ASSESSMENT FOR EXTREME HEAT
PROBABILITY IMPACT SPATIAL EXTENT WARNING TIME DURATION
Possible Minor Large More than 24 Hours Less than 1 Week
Source: Southside Hampton Roads Mitigation Planning Committee. Please refer to Table 5.1 for an explanation of the terms used.
ESTIMATE OF POTENTIAL LOSSES Based on the previous historical occurrences, annualized losses to the built environment are considered to be negligible (less than $1,000). Similar to the lightning hazard, loss of human life is a greater concern with extreme heat than is property damage.
FUTURE VULNERABILITY AND LAND USE All future structures built in the Southside Hampton Roads region will be exposed to extreme heat on a comparable level to existing structures; however, this hazard typically has little to no physical impact on the built environment in terms of substantial damage to structures, essential facilities or infrastructure elements. Given the lesser nature of this hazard within the planning area, it is not expected that significant changes will be seen in the planning or construction of future building stock in response to this hazard.

VULNERABILITY ASSESSMENT
SOUTHSIDE HAMPTON ROADS HAZARD MITIGATION PLAN SEPTEMBER 2011
5:35
TSUNAMIS
PRI Value: 2.6 Annualized Loss Estimate: Undetermined According to the qualitative assessment performed using the PRI tool, the tsunami hazard scored a PRI value of 2.6 (from a scale of 0 to 4, with 4 being the highest risk level). Table 5.33 summarizes the risk levels assigned to each PRI category.
TABLE 5.33: QUALITATIVE ASSESSMENT FOR TSUNAMIS
PROBABILITY IMPACT SPATIAL EXTENT WARNING TIME DURATION
Unlikely Catastrophic Moderate Less than 6 Hours Less than 6 Hours
Source: Southside Hampton Roads Mitigation Planning Committee. Please refer to Table 5.1 for an explanation of the terms used.
ESTIMATE OF POTENTIAL LOSSES Losses that could occur based on a tsunami event would probably be similar to those experienced by coastal flooding or storm surge event as discussed earlier in this section. However, because of the lack of information on previous occurrences, it is not possible to determine an annualized loss estimate. FUTURE VULNERABILITY AND LAND USE All future development in the Southside Hampton Roads region that is located close to the coast or tidal bodies of water could be exposed to the tsunami hazard in the future.

VULNERABILITY ASSESSMENT
SOUTHSIDE HAMPTON ROADS HAZARD MITIGATION PLAN SEPTEMBER 2011
5:34
DAM FAILURES
PRI Value: 2.2 Annualized Loss Estimate: Negligible (less than $5,000) As documented in the Hazard Identification Analysis section, there are 37 major dams in the Southside Hampton Roads region, defined as being 50 feet or more in height, or with a normal storage capacity of 5,000 acre-feet or more, or with a maximum storage capacity of 25,000 acre-feet or more. There is no record of any damages, deaths or injuries associated with dam failure in the region. According to the qualitative assessment performed using the PRI tool, the dam failure hazard scored a PRI value of 2.2 (from a scale of 0 to 4, with 4 being the highest risk level). Table 5.31 summarizes the risk levels assigned to each PRI category.
TABLE 5.31: QUALITATIVE ASSESSMENT FOR DAM FAILURES
PROBABILITY IMPACT SPATIAL EXTENT WARNING TIME DURATION
Unlikely Critical Small Less than 6 Hours Less than 24 Hours
Source: Southside Hampton Roads Mitigation Planning Committee. Please refer to Table 5.1 for an explanation of the terms used. ESTIMATES OF POTENTIAL LOSSES Failure or mis-operation of a dam classified as “high” hazard would result in the probability of at least one death and more than $200,000 in economic damages. As documented in detail in the Hazard Identification and Analysis section, there are three major dams in the Southside Hampton Roads region classified as high hazard. Table 5.32 shows the surface area, primary purpose and owner of the three major high hazard dams in the county. Annualized loss estimates for this hazard are considered to be negligible (less than $5,000). Officials from the City of Suffolk have recognized that development downstream of many of their dams, specifically, Western Branch, Burnt Mills, Lake Prince, Lake Cahoon, Lake Meade, Lake Kilby, Speight’s Run and Camp Pond, has increased in recent years.
TABLE 5.32: INVENTORY AND DETAILS OF MAJOR HIGH HAZARD DAMS IN THE REGION
DAM NAME SURFACE AREA
(ACRES) PRIMARY PURPOSE OWNER
Lake Burnt Mills Dam 596 Water Supply City of Norfolk Western Branch Dam 1,282 Water Supply City of Norfolk Lake Mead Dam 590 Water Supply City of Portsmouth
Source: National Inventory of Dams FUTURE VULNERABILITY AND LAND USE Future updates to this Plan will attempt to address dam failure vulnerability in greater detail, if conditions warrant. An analysis of properties downstream of high hazard dams, in order to better determine the number of people and value of properties in inundation zones, may be possible if dam owners conduct inundation studies in the future. Suffolk officials indicate that several dam owners have conducted inundation studies, including: Norfolk, Portsmouth, Suffolk and International Paper. Lists of properties subject to inundation are a part of the Emergency Action Plans (EAPs) for these jurisdictions.

VULNERABILITY ASSESSMENT
SOUTHSIDE HAMPTON ROADS HAZARD MITIGATION PLAN SEPTEMBER 2011
5:33
ESTIMATES OF POTENTIAL LOSSES As documented in the Hazard Identification and Analysis section, the Southside Hampton Roads region experiences an average of 14 wildfire events per year with only minor property damages (generally less than $15,000 per year) reported. Table 5.30 shows wildfire events from 1995 to 2008 in the Southside Hampton Roads region (according to VDOF) that contribute to an annualized loss estimate of $11,758 for the wildfire hazard. During the period, no wildfire events were reported in the towns of Smithfield and Windsor, or the City of Norfolk.
Sources: Virginia Department of Forestry; Statistical Risk Assessment Methodology FUTURE VULNERABILITY AND LAND USE Future vulnerability is likely to be affected by the degree of development experienced in high wildfire hazard areas.
TABLE 5.30: ESTIMATED ANNUALIZED LOSSES FOR WILDFIRES
JURISDICTION NUMBER OF EVENTS PROPERTY DAMAGEAVERAGE ANNUAL
NUMBER OF EVENTS ANNUALIZED
LOSSES
Isle of Wight County 120 $81,600 9.23 $6,277
Portsmouth 1 $0 0.07 $0
Suffolk 45 $71,260 3.46 $5,482
Virginia Beach 12 $0 0.92 $0
TOTAL 177 $152,860 13.62 $11,758

VULNERABILITY ASSESSMENT
SOUTHSIDE HAMPTON ROADS HAZARD MITIGATION PLAN SEPTEMBER 2011
5:32
WILDFIRES
PRI Value: 2.5 Annualized Loss Estimate: $11,758 According to the qualitative assessment performed using the PRI tool, the wildfire hazard scored a PRI value of 2.5 (from a scale of 0 to 4, with 4 being the highest risk level). Table 5.28 summarizes the risk levels assigned to each PRI category.
TABLE 5.28: QUALITATIVE ASSESSMENT FOR WILDFIRES
PROBABILITY IMPACT SPATIAL EXTENT WARNING TIME DURATION
Highly Likely Minor Small Less than 6 Hours Less than 24 Hours
Source: Southside Hampton Roads Mitigation Planning Committee. Please refer to Table 5.1 for an explanation of the terms used. According to Virginia Department of Forestry (VDOF) statistics, Virginia has more than 4,000 woodland home communities. These areas are defined by VDOF as “clusters of homes located along forested areas at the wildland-urban interface that could possibly be damaged during a nearby wildfire incident.” In the Southside Hampton Roads region, forty six woodland home communities have been identified. Nineteen are located in Isle of Wight County, twenty-six are located in Suffolk and one is located in Virginia Beach. Table 5.29 lists the number of woodland home communities for the Southside Hampton Roads region that are located in areas identified as being either high or moderate risk for wildfires. Figure 4.26 shows the location of these woodland home communities in relation to the identified wildfire hazard areas. More information on these communities is readily available through the VDOF.
TABLE 5.29: AT-RISK WOODLAND COMMUNITIES IN THE SOUTHSIDE HAMPTON ROADS REGION
Jurisdiction High Risk Communities Moderate Risk Communities
Isle of Wight County 6 12 Suffolk 3 17
Virginia Beach 0 1 Total 9 30
Source: VDOF

VULNERABILITY ASSESSMENT
SOUTHSIDE HAMPTON ROADS HAZARD MITIGATION PLAN SEPTEMBER 2011
5:31
TABLE 5.27: AGRICULTURAL DATA RELATED TO DROUGHT VULNERABILITY
JURISDICTION
2002 2007
TOTAL HARVESTED CROPLAND
(acres)
IRRIGATED LAND (acres)
MARKET VALUE OF
CROPS ($1,000)
TOTAL HARVESTED CROPLAND
(acres)
IRRIGATED LAND (acres)
MARKET VALUE OF
CROPS ($1,000)
Isle of Wight County 49,373 790 $13,458 50,641 702 $13,798
Suffolk 53,954 1,167 $35,745 51,203 616 $51,271
Virginia Beach 21,609 432 $7,716 20,258 194 $12,570
TOTAL 124,936 2,389 $56,919 122,102 1,512 $77,639
Source: U.S. Census of Agriculture (2002), and USDA Farm and Ranch Irrigation Survey (2008)
FUTURE VULNERABILITY AND LAND USE According the U.S. Census of Agriculture (2002) and the USDA Farm and Ranch Irrigation Survey (2008), the total harvested croplands in the City of Virginia Beach, Isle of Wight County and City of Suffolk have decreased 38.0, 7.2 and 7.9 percent respectively between 1992 and 2002, and 2.9, 1.8 and 1.0 percent between 2002 and 2007. These rates may be indicative of future changes in land use which may be peripherally related to long-term drought conditions.

VULNERABILITY ASSESSMENT
SOUTHSIDE HAMPTON ROADS HAZARD MITIGATION PLAN SEPTEMBER 2011
5:30
DROUGHTS
PRI Value: 2.2 Annualized Loss Estimate: Undetermined Droughts can impact natural systems and the ability of cities, towns and neighborhoods to function effectively. Specific effects may include a reduction in the production of food grains and other crops, the size and quality of livestock and fish, available forage for livestock and wildlife, and the availability of water supplies needed by communities and industry. As evidenced by previous occurrences, the Southside Hampton Roads region is vulnerable to the drought hazard. According to the qualitative assessment performed using the PRI tool, the drought hazard scored a PRI value of 2.2 (from a scale of 0 to 4, with 4 being the highest risk level). Table 5.26 summarizes the risk levels assigned to each PRI category.
TABLE 5.26: QUALITATIVE ASSESSMENT FOR DROUGHTS
PROBABILITY IMPACT SPATIAL EXTENT WARNING TIME DURATION
Possible Minor Large More than 24 Hours More than 1 Week
Source: Southside Hampton Roads Mitigation Planning Committee. Please refer to Table 5.1 for an explanation of the terms used. ESTIMATES OF POTENTIAL LOSSES While drought impacts agricultural, recreational, and manufacturing industries, estimating losses to the built environment is difficult because drought causes little documented physical damage to the built environment. In 2006, this plan included an annualized drought loss estimate of $2,215,839 for Isle of Wight County, Suffolk and Virginia Beach; however, the methodology regarding how this loss estimate was developed is not clear. Annualized damages appear to have been based on changes in total harvested cropland; however, losses in harvested cropland or the market value of crops cannot be attributed entirely to drought or other weather-related conditions, especially in rural parts of the planning area that are rapidly developing. Data on drought damages from the NCDC are incomplete and, when available, apply to a very large area including jurisdictions outside of the planning region. As a result, the estimation of annualized damages due to drought is discontinued in this update. Table 5.27 provides a time series of data regarding the total harvested cropland, irrigated land, market value of crops, and percent of non-irrigated land in both 2002 and 2007. Due to a lack of agricultural information, data for the towns of Smithfield and Windsor and cities of Norfolk and Portsmouth are not provided.
VULNERABILITY ASSESSMENT
SOUTHSIDE HAMPTON ROADS HAZARD MITIGATION PLAN SEPTEMBER 2011
5:29
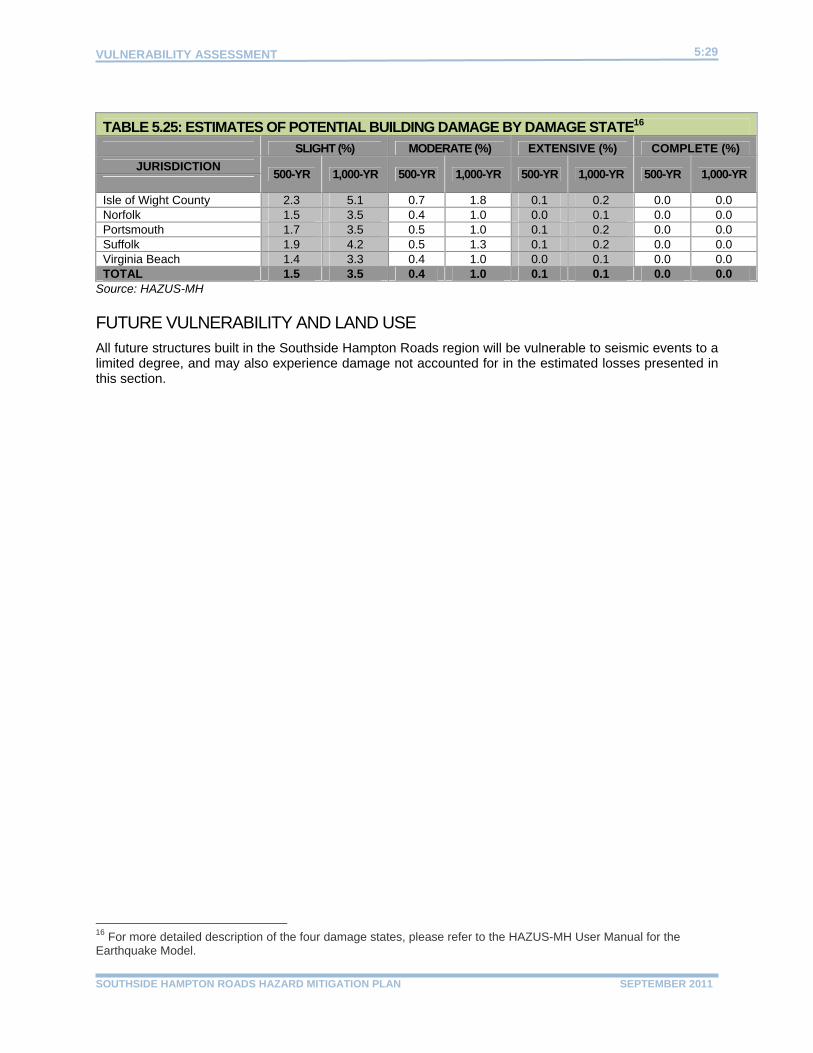
TABLE 5.25: ESTIMATES OF POTENTIAL BUILDING DAMAGE BY DAMAGE STATE16
SLIGHT (%) MODERATE (%) EXTENSIVE (%) COMPLETE (%)
JURISDICTION 500-YR 1,000-YR 500-YR 1,000-YR 500-YR 1,000-YR 500-YR 1,000-YR
Isle of Wight County 2.3 5.1 0.7 1.8 0.1 0.2 0.0 0.0Norfolk 1.5 3.5 0.4 1.0 0.0 0.1 0.0 0.0Portsmouth 1.7 3.5 0.5 1.0 0.1 0.2 0.0 0.0Suffolk 1.9 4.2 0.5 1.3 0.1 0.2 0.0 0.0Virginia Beach 1.4 3.3 0.4 1.0 0.0 0.1 0.0 0.0TOTAL 1.5 3.5 0.4 1.0 0.1 0.1 0.0 0.0
Source: HAZUS-MH FUTURE VULNERABILITY AND LAND USE All future structures built in the Southside Hampton Roads region will be vulnerable to seismic events to a limited degree, and may also experience damage not accounted for in the estimated losses presented in this section.
16 For more detailed description of the four damage states, please refer to the HAZUS-MH User Manual for the Earthquake Model.

VULNERABILITY ASSESSMENT
SOUTHSIDE HAMPTON ROADS HAZARD MITIGATION PLAN SEPTEMBER 2011
5:28
EARTHQUAKES
PRI Value: 1.9 Annualized Loss Estimate: $93,000 The annual probability of an earthquake event impacting the study area is estimated at 5 percent based on historical data. While the probability of an earthquake occurrence is relatively low, moderate losses, should a significant earthquake event occur, are possible. According to the qualitative assessment performed using the PRI tool, the earthquake hazard scored a PRI value of 1.9 (from a scale of 0 to 4, with 4 being the highest risk level). Table 5.23 summarizes the risk levels assigned to each PRI category.
TABLE 5.23: QUALITATIVE ASSESSMENT FOR EARTHQUAKES
PROBABILITY IMPACT SPATIAL EXTENT WARNING TIME DURATION
Unlikely Minor Large Less than 6 Hours Less than 6 Hours
Source: Southside Hampton Roads Mitigation Planning Committee. Please refer to Table 5.1 for an explanation of the terms used.
ESTIMATES OF POTENTIAL LOSSES Table 5.24 provides generalized building damage estimates by jurisdiction for the 100-, 500- and 1,000-year return periods as well as annualized losses based on probabilistic scenarios using HAZUS-MH. The annualized building damage estimate for the earthquake hazard is $93,000, and in that estimate residential properties suffer more than 98 percent of the total damage.
TABLE 5.24: ESTIMATES OF POTENTIAL BUILDING DAMAGE
BUILDING OCCUPANCY TYPE
100-YEAR EVENT 500-YEAR EVENT 1,000-YEAR EVENT ANNUALIZED
Isle of Wight County Negligible15 $408,000 $1,092,000 $5,000Norfolk Negligible $2,785,000 $7,422,000 $28,000Portsmouth Negligible $1,358,000 $2,851,000 $11,000Suffolk Negligible $833,000 $2,104,000 $8,000Virginia Beach Negligible $4,468,000 $11,911,000 $41,000TOTAL Negligible $9,852,000 $25,380,000 $93,000
Source: HAZUS-MH HAZUS-MH was also used to produce building damage estimates based on percentage of damage (by damage state) for the 500-, and 1,000-year return periods (Table 5.25). According to the HAZUS-MH model assumptions, there should be no building damage from 100-year earthquake event.
15 Damage less than $1,000

VULNERABILITY ASSESSMENT
SOUTHSIDE HAMPTON ROADS HAZARD MITIGATION PLAN SEPTEMBER 2011
5:27
Although the maps alone do not indicate potential loss from erosion, they provide areas for future study and indicate where shoreline structure protection is currently in place to protect against coastal erosion.
FUTURE VULNERABILITY AND LAND USE It is difficult to assess future vulnerability and land use in regard to this hazard. Generally speaking, future vulnerability is going to depend greatly on appropriate local site planning and permitting, as well as each community’s approach to sea level rise and associated flooding problems.

VULNERABILITY ASSESSMENT
SOUTHSIDE HAMPTON ROADS HAZARD MITIGATION PLAN SEPTEMBER 2011
5:26
SHORELINE EROSION
PRI Value: 2.1 Annualized Loss Estimate: Undetermined As documented in the Hazard Identification and Analysis section, the Southside Hampton Roads region is vulnerable to the long term effects of shoreline erosion. Coastal erosion remains a significant hazard of concern that must continue to be addressed through sustained shoreline management practices. To date, existing strategies for shoreline hardening and the implementation of numerous renourishment projects have been successful in minimizing major coastal erosion losses within parts of the planning region14. According to the qualitative assessment performed using the PRI tool, the erosion hazard scored a PRI value of 2.1 (from a scale of 0 to 4, with 4 being the highest risk level). Table 5.22 summarizes the risk levels assigned to each PRI category.
TABLE 5.22: QUALITATIVE ASSESSMENT FOR SHORELINE EROSION
PROBABILITY IMPACT SPATIAL EXTENT WARNING TIME DURATION
Likely Minor Small More than 24 Hours More than 1 Week
Source: Southside Hampton Roads Mitigation Planning Committee. Please refer to Table 5.1 for an explanation of the terms used.
ESTIMATES OF POTENTIAL LOSS It is difficult to determine the amount of property or the number of structures that are vulnerable to the erosion hazard. The jurisdictions in the region have demonstrated, through past projects such as the Virginia Beach Erosion Control and Hurricane Protection Project that they are willing to take on projects to protect coastal residences and commercial buildings in the hazard zone. The Comprehensive Coastal Inventory Program (CCI) at the Virginia Institute of Marine Science (VIMS) is creating a new GIS shoreline database to develop revised Shoreline Situation Reports (SSR) for cities and counties in the region. SSRs were developed by VIMS in the 1970s, and are available online at: http://ccrm.vims.edu/gis_data_maps/data/index.html for Isle of Wight County, Virginia Beach and Suffolk. These reports have been the foundation for shoreline management planning in the region for more than 30 years. CCI has developed new protocols for collecting, disseminating, and reporting data relevant to shoreline management issues today. New SSRs are being generated on a county by county basis and are currently available online at: http://ccrm.vims.edu/gis_data_maps/data/index.html for Norfolk and Portsmouth. The data inventory developed for the new SSRs is based on a three-tiered shoreline assessment approach. In most cases this assessment characterizes conditions that can be observed from high resolution imagery. A small boat navigating along the shoreline was used to verify the remotely sensed data and collect features that could not be ascertained from the imagery. The three tiered shoreline assessment approach divides the shore zone into three regions: 1) the immediate riparian zone, evaluated for land use; 2) the bank, evaluated for height, stability, cover and natural protection; and 3) the shoreline, describing the presence of shoreline structures for shore protection and recreational purposes. Final prepared maps are available at the site for Norfolk (45 total plates) and Portsmouth (40 total plates).
14 The Norfolk District of the Army Corps of Engineers estimates that $82 million in damages were prevented during Hurricane Isabel in 2003 through the Virginia Beach Erosion Control and Hurricane Protection Project. This includes $52 million in damages to residential property, $15 million to commercial interests and $15 million to infrastructure.
VULNERABILITY ASSESSMENT
SOUTHSIDE HAMPTON ROADS HAZARD MITIGATION PLAN SEPTEMBER 2011
5:25
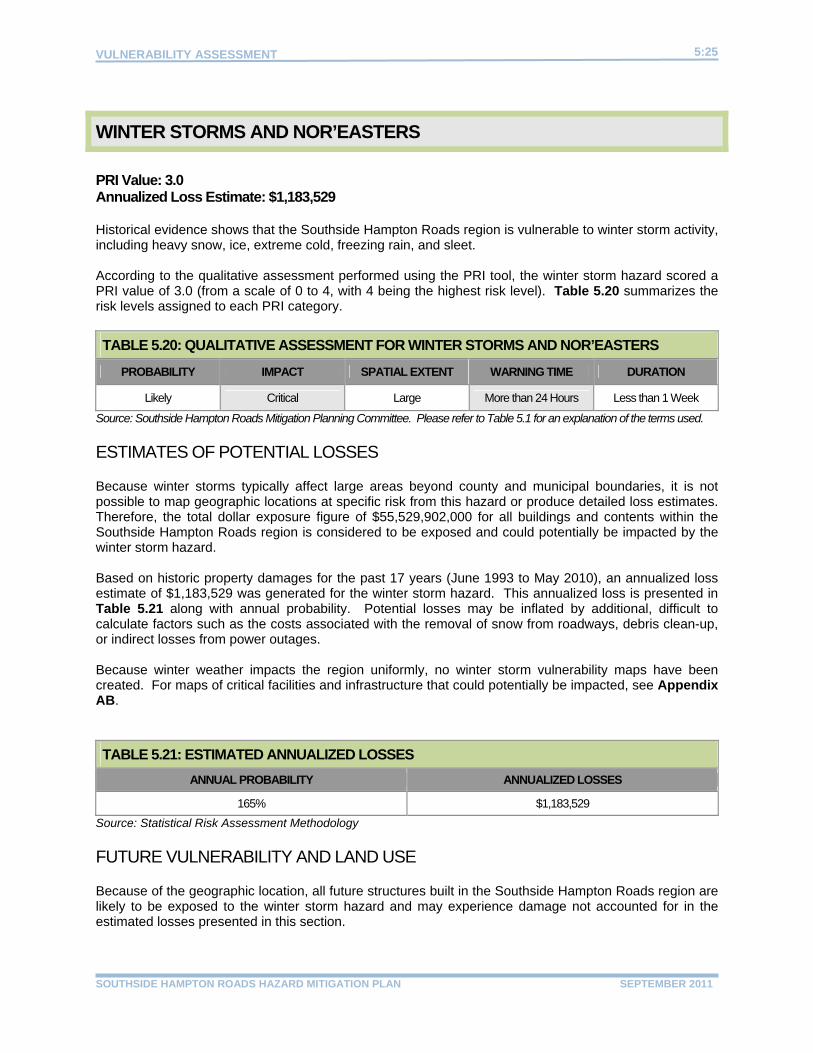
WINTER STORMS AND NOR’EASTERS
PRI Value: 3.0 Annualized Loss Estimate: $1,183,529 Historical evidence shows that the Southside Hampton Roads region is vulnerable to winter storm activity, including heavy snow, ice, extreme cold, freezing rain, and sleet. According to the qualitative assessment performed using the PRI tool, the winter storm hazard scored a PRI value of 3.0 (from a scale of 0 to 4, with 4 being the highest risk level). Table 5.20 summarizes the risk levels assigned to each PRI category.
TABLE 5.20: QUALITATIVE ASSESSMENT FOR WINTER STORMS AND NOR’EASTERS
PROBABILITY IMPACT SPATIAL EXTENT WARNING TIME DURATION
Likely Critical Large More than 24 Hours Less than 1 Week
Source: Southside Hampton Roads Mitigation Planning Committee. Please refer to Table 5.1 for an explanation of the terms used. ESTIMATES OF POTENTIAL LOSSES Because winter storms typically affect large areas beyond county and municipal boundaries, it is not possible to map geographic locations at specific risk from this hazard or produce detailed loss estimates. Therefore, the total dollar exposure figure of $55,529,902,000 for all buildings and contents within the Southside Hampton Roads region is considered to be exposed and could potentially be impacted by the winter storm hazard. Based on historic property damages for the past 17 years (June 1993 to May 2010), an annualized loss estimate of $1,183,529 was generated for the winter storm hazard. This annualized loss is presented in Table 5.21 along with annual probability. Potential losses may be inflated by additional, difficult to calculate factors such as the costs associated with the removal of snow from roadways, debris clean-up, or indirect losses from power outages. Because winter weather impacts the region uniformly, no winter storm vulnerability maps have been created. For maps of critical facilities and infrastructure that could potentially be impacted, see Appendix AB.
TABLE 5.21: ESTIMATED ANNUALIZED LOSSES
ANNUAL PROBABILITY ANNUALIZED LOSSES
165% $1,183,529
Source: Statistical Risk Assessment Methodology FUTURE VULNERABILITY AND LAND USE Because of the geographic location, all future structures built in the Southside Hampton Roads region are likely to be exposed to the winter storm hazard and may experience damage not accounted for in the estimated losses presented in this section.
VULNERABILITY ASSESSMENT
SOUTHSIDE HAMPTON ROADS HAZARD MITIGATION PLAN SEPTEMBER 2011
5:24
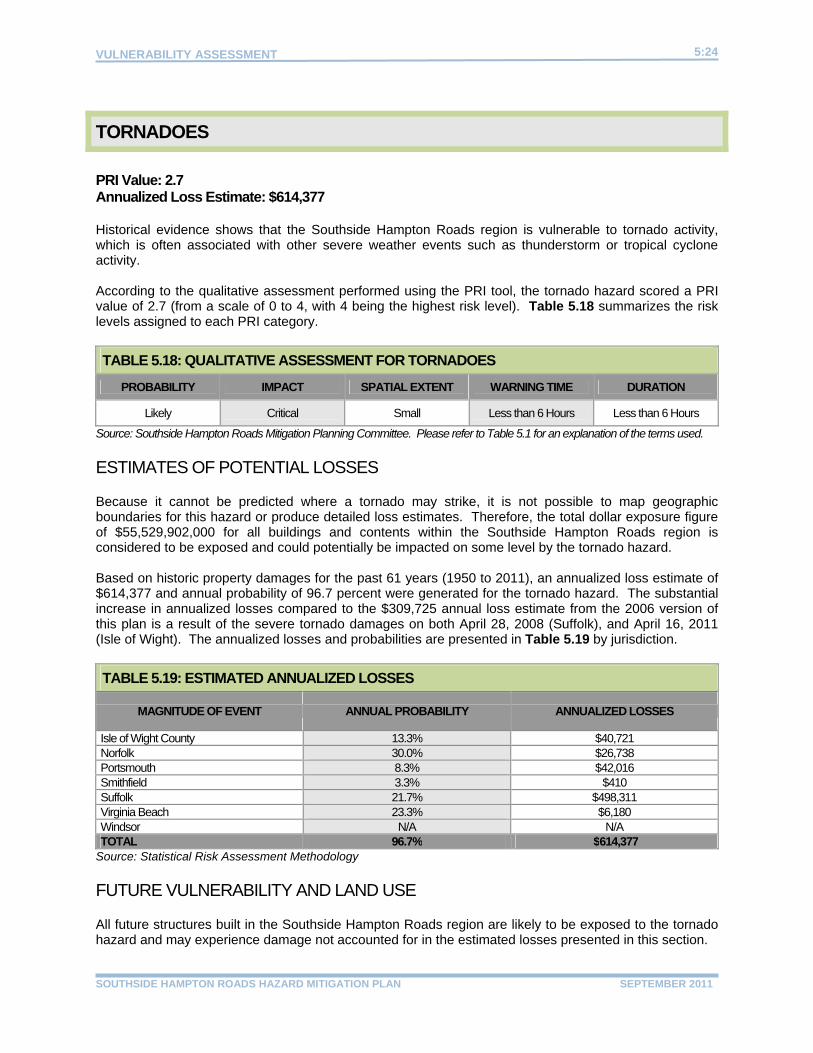
TORNADOES
PRI Value: 2.7 Annualized Loss Estimate: $614,377 Historical evidence shows that the Southside Hampton Roads region is vulnerable to tornado activity, which is often associated with other severe weather events such as thunderstorm or tropical cyclone activity. According to the qualitative assessment performed using the PRI tool, the tornado hazard scored a PRI value of 2.7 (from a scale of 0 to 4, with 4 being the highest risk level). Table 5.18 summarizes the risk levels assigned to each PRI category.
TABLE 5.18: QUALITATIVE ASSESSMENT FOR TORNADOES
PROBABILITY IMPACT SPATIAL EXTENT WARNING TIME DURATION
Likely Critical Small Less than 6 Hours Less than 6 Hours
Source: Southside Hampton Roads Mitigation Planning Committee. Please refer to Table 5.1 for an explanation of the terms used. ESTIMATES OF POTENTIAL LOSSES Because it cannot be predicted where a tornado may strike, it is not possible to map geographic boundaries for this hazard or produce detailed loss estimates. Therefore, the total dollar exposure figure of $55,529,902,000 for all buildings and contents within the Southside Hampton Roads region is considered to be exposed and could potentially be impacted on some level by the tornado hazard. Based on historic property damages for the past 61 years (1950 to 2011), an annualized loss estimate of $614,377 and annual probability of 96.7 percent were generated for the tornado hazard. The substantial increase in annualized losses compared to the $309,725 annual loss estimate from the 2006 version of this plan is a result of the severe tornado damages on both April 28, 2008 (Suffolk), and April 16, 2011 (Isle of Wight). The annualized losses and probabilities are presented in Table 5.19 by jurisdiction.
TABLE 5.19: ESTIMATED ANNUALIZED LOSSES
MAGNITUDE OF EVENT ANNUAL PROBABILITY ANNUALIZED LOSSES
Isle of Wight County 13.3% $40,721 Norfolk 30.0% $26,738 Portsmouth 8.3% $42,016 Smithfield 3.3% $410 Suffolk 21.7% $498,311 Virginia Beach 23.3% $6,180 Windsor N/A N/A TOTAL 96.7% $614,377
Source: Statistical Risk Assessment Methodology FUTURE VULNERABILITY AND LAND USE All future structures built in the Southside Hampton Roads region are likely to be exposed to the tornado hazard and may experience damage not accounted for in the estimated losses presented in this section.
VULNERABILITY ASSESSMENT
SOUTHSIDE HAMPTON ROADS HAZARD MITIGATION PLAN SEPTEMBER 2011
5:23
LIGHTNING
PRI Value: 2.7 Annualized Loss Estimate: Negligible Historical evidence shows that the Southside Hampton Roads region is vulnerable to lightning activity, which is often associated with severe thunderstorms that impact the region. According to the qualitative assessment performed using the PRI tool, the lightning hazard scored a PRI value of 2.7 (from a scale of 0 to 4, with 4 being the highest risk level). Table 5.17 summarizes the risk levels assigned to each PRI category.
TABLE 5.17: QUALITATIVE ASSESSMENT FOR LIGHTNING
PROBABILITY IMPACT SPATIAL EXTENT WARNING TIME DURATION
Highly Likely Limited Small Less than 6 Hours Less than 6 Hours
Source: Southside Hampton Roads Mitigation Planning Committee. Please refer to Table 5.1 for an explanation of the terms used.
ESTIMATES OF POTENTIAL LOSSES Because it cannot be predicted where lightning will strike, it is not possible to map geographic boundaries for this hazard or produce detailed loss estimates. Therefore, the total dollar exposure figure of $55,529,902,000 for all buildings and contents within the Southside Hampton Roads region is considered to be exposed and could potentially be impacted on some level by the lightning hazard.
FUTURE VULNERABILITY AND LAND USE Because of the random nature of occurrence of the lightning hazard, it is difficult to assess future vulnerability and land use with regard to this particular hazard. In general, all buildings built in the future in this region and all future populations will be exposed and therefore at risk to the lightning hazard.

VULNERABILITY ASSESSMENT
SOUTHSIDE HAMPTON ROADS HAZARD MITIGATION PLAN SEPTEMBER 2011
5:22
SEVERE THUNDERSTORMS AND HAIL
PRI Value: 2.8 Annualized Loss Estimate: $264,917 Historical evidence shows that the Southside Hampton Roads region is vulnerable to severe thunderstorm activity, including related hail that often accompanies these severe weather events. According to the qualitative assessment performed using the PRI tool, the severe thunderstorm hazard scored a PRI value of 2.8 (from a scale of 0 to 4, with 4 being the highest risk level). Table 5.15 summarizes the risk levels assigned to each PRI category.
TABLE 5.15: QUALITATIVE ASSESSMENT FOR SEVERE THUNDERSTORMS AND HAIL
PROBABILITY IMPACT SPATIAL EXTENT WARNING TIME DURATION
Highly Likely Minor Large Less than 6 Hours Less than 6 Hours
Source: Southside Hampton Roads Mitigation Planning Committee. Please refer to Table 5.1 for an explanation of the terms used. ESTIMATES OF POTENTIAL LOSSES Because it cannot be predicted where severe thunderstorms and hail may occur, it is not possible to map geographic boundaries for this hazard or produce detailed loss estimates. Therefore, the total dollar exposure figure of $55,529,902,000 for all buildings and contents within the planning area is considered to be exposed and could potentially be impacted on some level by this hazard. Based on historic property damages for the past 60 years (1950 to 2010), an annualized loss estimate of $264,917 was generated for severe thunderstorm and hail damages combined with an annual probability of 785 percent in the planning area. These annualized loss and probability estimates are presented in Table 5.16 by jurisdiction.
TABLE 5.16: ESTIMATED ANNUALIZED LOSSES
JURISDICTION ANNUAL PROBABILITY ANNUALIZED LOSSES
Isle of Wight County 101.7% $3,100 Norfolk 125.0% $169,817 Portsmouth 86.7% $1,233 Smithfield 25.0% $900 Suffolk 186.7% $4,600 Virginia Beach 248.3% $85,083 Windsor 11.7% $183 TOTAL 785.0% $264,917
Source: Statistical Risk Assessment Methodology FUTURE VULNERABILITY AND LAND USE All future structures built in the Southside Hampton Roads region will likely be exposed to severe thunderstorms and may experience damage not accounted for in the estimated losses presented in this section.

VULNERABILITY ASSESSMENT
SOUTHSIDE HAMPTON ROADS HAZARD MITIGATION PLAN SEPTEMBER 2011
5:21
TABLE 5.14: ESTIMATES OF POTENTIAL BUILDING DAMAGE BY DAMAGE STATE13
BUILDING OCCUPANCY TYPE
MINOR (%) MODERATE (%) SEVERE (%) DESTRUCTION (%)
100-YR 500-YR 100-YR 500-YR 100-YR 500-YR 100-YR 500-YRIsle of Wight County 425 1,852 25 326 1 24 0 20 Norfolk 7,016 22,171 1,056 7,981 37 998 19 627 Portsmouth 2,984 10,549 328 2,953 9 316 6 223 Suffolk 1,425 3,226 117 864 4 154 2 125 Virginia Beach 17,197 46,820 2,414 16,952 82 2,572 53 1,735 TOTAL 29,047 84,618 3,940 29,076 133 4,064 80 2730 Source: HAZUS-MH
FUTURE VULNERABILITY AND LAND USE All future structures built in the Southside Hampton Roads region will likely be exposed to hurricane and tropical storm-force winds and may also experience damage not accounted for in the loss estimates presented in this section.
13 For detailed definitions of the four damage states, please refer to the HAZUS-MH User Manual for the Hurricane Model.
VULNERABILITY ASSESSMENT
SOUTHSIDE HAMPTON ROADS HAZARD MITIGATION PLAN SEPTEMBER 2011
5:20
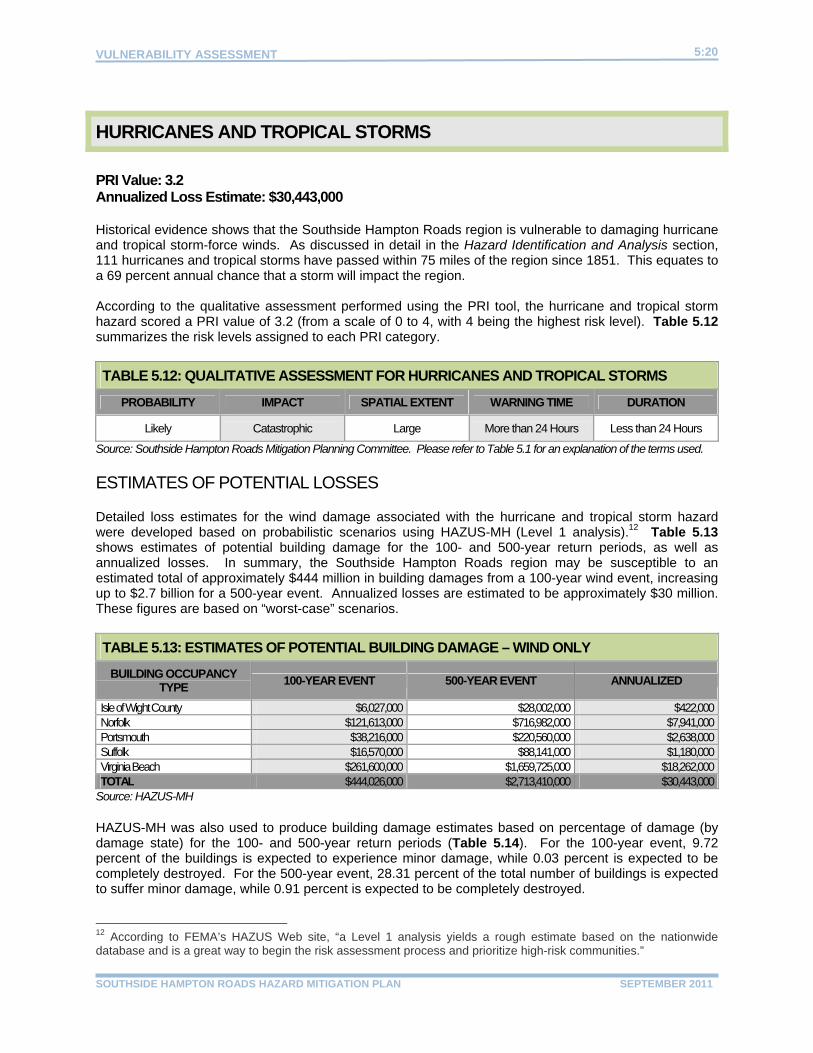
HURRICANES AND TROPICAL STORMS
PRI Value: 3.2 Annualized Loss Estimate: $30,443,000 Historical evidence shows that the Southside Hampton Roads region is vulnerable to damaging hurricane and tropical storm-force winds. As discussed in detail in the Hazard Identification and Analysis section, 111 hurricanes and tropical storms have passed within 75 miles of the region since 1851. This equates to a 69 percent annual chance that a storm will impact the region. According to the qualitative assessment performed using the PRI tool, the hurricane and tropical storm hazard scored a PRI value of 3.2 (from a scale of 0 to 4, with 4 being the highest risk level). Table 5.12 summarizes the risk levels assigned to each PRI category.
TABLE 5.12: QUALITATIVE ASSESSMENT FOR HURRICANES AND TROPICAL STORMS
PROBABILITY IMPACT SPATIAL EXTENT WARNING TIME DURATION
Likely Catastrophic Large More than 24 Hours Less than 24 Hours
Source: Southside Hampton Roads Mitigation Planning Committee. Please refer to Table 5.1 for an explanation of the terms used. ESTIMATES OF POTENTIAL LOSSES Detailed loss estimates for the wind damage associated with the hurricane and tropical storm hazard were developed based on probabilistic scenarios using HAZUS-MH (Level 1 analysis).12 Table 5.13 shows estimates of potential building damage for the 100- and 500-year return periods, as well as annualized losses. In summary, the Southside Hampton Roads region may be susceptible to an estimated total of approximately $444 million in building damages from a 100-year wind event, increasing up to $2.7 billion for a 500-year event. Annualized losses are estimated to be approximately $30 million. These figures are based on “worst-case” scenarios.
TABLE 5.13: ESTIMATES OF POTENTIAL BUILDING DAMAGE – WIND ONLY
BUILDING OCCUPANCY TYPE
100-YEAR EVENT 500-YEAR EVENT ANNUALIZED
Isle of Wight County $6,027,000 $28,002,000 $422,000Norfolk $121,613,000 $716,982,000 $7,941,000Portsmouth $38,216,000 $220,560,000 $2,638,000Suffolk $16,570,000 $88,141,000 $1,180,000Virginia Beach $261,600,000 $1,659,725,000 $18,262,000TOTAL $444,026,000 $2,713,410,000 $30,443,000
Source: HAZUS-MH HAZUS-MH was also used to produce building damage estimates based on percentage of damage (by damage state) for the 100- and 500-year return periods (Table 5.14). For the 100-year event, 9.72 percent of the buildings is expected to experience minor damage, while 0.03 percent is expected to be completely destroyed. For the 500-year event, 28.31 percent of the total number of buildings is expected to suffer minor damage, while 0.91 percent is expected to be completely destroyed. 12 According to FEMA’s HAZUS Web site, “a Level 1 analysis yields a rough estimate based on the nationwide database and is a great way to begin the risk assessment process and prioritize high-risk communities.”
VULNERABILITY ASSESSMENT
SOUTHSIDE HAMPTON ROADS HAZARD MITIGATION PLAN SEPTEMBER 2011
5:19
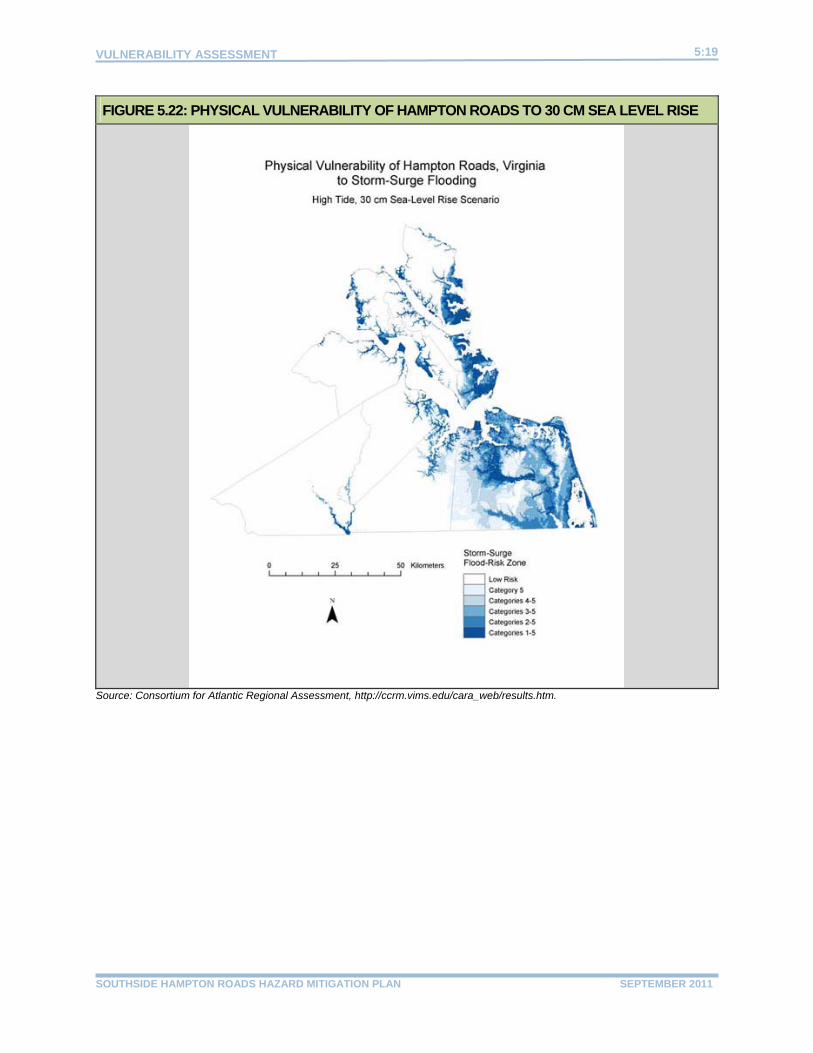
FIGURE 5.22: PHYSICAL VULNERABILITY OF HAMPTON ROADS TO 30 CM SEA LEVEL RISE
Source: Consortium for Atlantic Regional Assessment, http://ccrm.vims.edu/cara_web/results.htm.
VULNERABILITY ASSESSMENT
SOUTHSIDE HAMPTON ROADS HAZARD MITIGATION PLAN SEPTEMBER 2011
5:18
million at present to between $281 million and $326 million under a 1-foot rise scenario, and to between $417 million to $620 million under the 3-foot rise scenario. However, the FEMA study assumes that the current elevation distribution of post-FIRM construction relative to the 100-year flood elevation holds steady for future construction, when in fact many communities in the region are implementing freeboard requirements, such as the 1.5 feet of freeboard now required in Portsmouth. An impending coastal flood study by FEMA over the next decade in the Chesapeake Bay region may result in changes to the 100-year flood elevations which set the standard for new construction. Also, the obsolescence of buildings is not accounted for in the FEMA predictions; realistically, the number of pre-FIRM and post-FIRM buildings built to outmoded floodplain management standards should decline with time. Replacement structures must be in compliance with NFIP regulations in effect at the time of their construction. Thus, loss expectations based on the FEMA formula are likely overestimated, but provide a basis for decision making in this planning environment.
FUTURE VULNERABILITY AND LAND USE In Vulnerability of Hampton Roads, Virginia to Storm-Surge Flooding and Sea-Level Rise, Kleinosky, Yarnal and Fisher (Natural Hazards, 2006) compare data on the location of socially and economically vulnerable populations with storm surge flood risk exposure in order to map areas with the highest social vulnerability to storm surge in the future. The study premise is that sea level rise will cause an increase in the land area susceptible to storm surge flooding. Results indicate highest social vulnerability in much of Norfolk (including downtown), downtown Portsmouth, and several small pockets in central Virginia Beach. The article and maps are copyright-protected and cannot be provided herein, but are available online at: http://www.cara.psu.edu/about/publications/2006-Kleinosky%20et%20al.pdf. Figure 5.22 contains the results of the same case study regarding physical vulnerability of the Hampton Roads region to sea level rise. The map used SLOSH output data and a digital elevation model to create a visual representation of vulnerability as it changes over the region. All infrastructure and structures built in the current 100-year and 500-year floodplains of the Southside Hampton Roads region will likely be exposed to increased flooding damage resulting from hurricanes, tropical storms, and nor’easters as sea level rises in the future.

VULNERABILITY ASSESSMENT
SOUTHSIDE HAMPTON ROADS HAZARD MITIGATION PLAN SEPTEMBER 2011
5:17
SEA LEVEL RISE AND LAND SUBSIDENCE
PRI Value: 3.2 Annualized Loss Estimate: $281 million to $326 million (1 foot rise by 2100) $417 million to $620 million (3 foot rise by 2100) Historical evidence shows that the Southside Hampton Roads region is already experiencing some degree of sea level rise. As discussed in detail in the Hazard Identification and Analysis section, data from Sewells Point at the Norfolk Naval Base indicate that sea level in the past 70 years has risen at a rate of approximately 4.44 millimeters per year. Although there is no guarantee that this rate will remain constant in the future, the rate of land subsidence is expected to remain somewhat steady, and that rate is a major component of the relative sea level rise experienced in Hampton Roads. According to the qualitative assessment performed using the PRI tool, the sea level rise and land subsidence hazard scored a PRI value of 3.2 (from a scale of 0 to 4, with 4 being the highest risk level). Table 5.11 summarizes the risk levels assigned to each PRI category.
TABLE 5.11: QUALITATIVE ASSESSMENT FOR SEA LEVEL RISE AND LAND SUBSIDENCE
PROBABILITY IMPACT SPATIAL EXTENT WARNING TIME DURATION
Highly Likely Critical Moderate More than 24 Hours More than 1 Week
Source: Southside Hampton Roads Mitigation Planning Committee. Please refer to Table 5.1 for an explanation of the terms used. ESTIMATES OF POTENTIAL LOSSES Detailed economic loss estimates for sea level rise and land subsidence are extremely difficult to develop because the response of individual property owners to sea level rise is inherently unpredictable and variable over both time and space. The lack of detailed elevation information for the existing pre-FIRM and post-FIRM building inventory in Hampton Roads hinders any effort to calculate detailed future average annual flood damages using increasing 100-year flood elevations. For example, calculations of sea level rise losses may be supported by the argument that areas below a certain elevation will be permanently inundated and evacuated; however, regional experience over the past 50 years alone indicates that shoreline protection measures will be reinforced to protect threatened structures, hindering the ability of wetlands and shorelines to adjust naturally as the water level rises. So models based on permanent inundation dramatically overstate losses. A recent project conducted by the Virginia Institute of Marine Science (VIMS) created maps depicting the likelihood of shore protection along the Virginia coast as part of a nationwide study reporting on the development of coastal land most vulnerable to rising sea level (Environmental Research Letters, 2009). The purpose of the project was to motivate dialogues about the appropriate measures to rising sea level by creating maps that depict the likely response given current practices and policies. The maps divide coastal low lands in Southside Hampton Roads into four categories: developed (shore protection almost certain), intermediate (shore protection likely), undeveloped (shore protection unlikely), and conservation (no shore protection) (Figures 5.16 thru 5.21). One methodology for estimating average annual losses expected from sea level rise is supported by FEMA. In 1991, FEMA issued a report to Congress documenting the estimated impact of relative sea level rise on the Flood Insurance Rate Maps. The agency estimates that existing development in the coastal zone would experience a 36 to 58 percent increase in annual damages for a 1-foot rise in sea level by 2100, and a 102 to 200 percent increase resulting from a 3-foot rise by 2100. Based on this estimate, average annual flood damages from storm surge could be expected to increase from $207

VULNERABILITY ASSESSMENT
SOUTHSIDE HAMPTON ROADS HAZARD MITIGATION PLAN SEPTEMBER 2011
5:16
FUTURE VULNERABILITY AND LAND USE For both the coastal flood and storm surge flooding hazards, future vulnerability will be determined, in part, by local officials. Flood hazard and SLOSH maps have been developed to indicate what areas of the jurisdictions are most vulnerable to these hazards. All of the SLOSH maps for Southside communities and flood hazard maps for Portsmouth, Norfolk, and Virginia Beach have been updated since the initial plan was developed and can be used to help guide development away from hazardous areas. Local officials are responsible for enforcing local floodplain management regulations, flood damage prevention ordinances and other forms of development policies that restrict new development in flood hazard areas.
VULNERABILITY ASSESSMENT
SOUTHSIDE HAMPTON ROADS HAZARD MITIGATION PLAN SEPTEMBER 2011
5:15
ESTIMATES OF POTENTIAL LOSSES HAZUS-MH was used to model the damage expected in association with the 100-year coastal flood in the region, assuming a stillwater elevation of 10 feet mean sea level with no wave setup. These parameters were set to take advantage of available data, and may not exactly duplicate the parameters used to model the 100-year flood shown on the Flood Insurance Rate Maps. Table 5.9 provides a detailed listing of the number of structures expected to be damaged, and the dollar losses expected. An annualized loss estimate of $2,821,224,000 was determined based on this loss estimate for the 100-year flood. This annualized estimate likely overstates the annual losses, and the calculation could be made more precise through the inclusion of community damage assessment data and flood height data from smaller floods as part of future updates to this plan. The estimated number of pre-FIRM structures (constructed prior to a community joining the NFIP) was tallied, based on provided tax assessor data for communities. There are an estimated 11,207 pre-FIRM structures in Norfolk, 595 in Suffolk, and 4,182 in Virginia Beach.
TABLE 5.9: HAZUS-MH LOSS ESTIMATES FOR 100-YEAR FLOOD EVENT
JURISDICTION
NUMBER OF BUILDINGS
MODERATELY DAMAGED
NUMBER OF BUILDINGS
DESTROYED BUILDING LOSSES
BUSINESS INTERRUPTION
LOSSES
TOTAL LOSSES
Isle of Wight County 897 77 $187,590,000 $780,000 $188,370,000
Norfolk 27,734 312 $4,616,920,000 $70,080,000 $4,687,000,000
Portsmouth 4,937 76 $719,600,000 $16,440,000 $736,040,000
Suffolk 1,346 49 $216,080,000 $1,680,000 $217,760,000
Virginia Beach 48,147 865 $5,637,400,000 $48,630,000 $5,686,030,000
TOTAL 83,061 1,379 $11,377,590,000 $137,610,000 $11,515,200,000
Sources: HAZUS-MH, local GIS data Following a detailed analysis of the study area using best available GIS data including SLOSH model data, 156,042 properties were determined to be at risk to storm surge from a Category 3 hurricane, amounting to a total net present worth of approximately $25,828,086,183 in exposure. Table 5.10 provides a detailed listing of the estimated number of parcels, number of developed parcels, number of structures and assessed values of structures at risk to surge from a Category 3 event. An annualized loss estimate of $206,624,689 was determined using best available local property tax data, and assuming that the worst case scenario storm surge event for a Category 3 hurricane has a recurrence interval of 150 years.
TABLE 5.10: OVERVIEW OF POTENTIALLY AT-RISK PROPERTIES FLOODS (STORM SURGE)
JURISDICTION CATEGORY 3 STORM SURGE INUNDATION ZONE
NUMBER OF PARCELS
DEVELOPED PARCELS
NUMBER OF STRUCTURES
VALUE OF STRUCTURES
Isle of Wight County 2,437 591 653 $54,221,100
Norfolk 115,535 91,358 85,754 $16,293,288,040
Portsmouth 35,343 22,733 49,102 $1,240,970,150
Smithfield 793 91 94 $21,886,200
Suffolk 3,723 1,481 2,069 $313,003,000
Virginia Beach 42,941 39,788 74,373 $7,904,717,693
Windsor 0 0 0 $0
TOTAL 200,772 156,042 212,045 $25,828,086,183Sources: Southside Hampton Roads Planning District Commission (SLOSH data); Local GIS data

VULNERABILITY ASSESSMENT
SOUTHSIDE HAMPTON ROADS HAZARD MITIGATION PLAN SEPTEMBER 2011
5:14
defined by the NFIP have been identified within the Southside Hampton Roads region. These 1,393 properties have experienced a total of 3,632 individual insured losses. Table 5.8 provides details for each jurisdiction with regard to the community’s number of NFIP policies, total coverage, number of repetitive loss properties, total number of losses, total dollar amount of repetitive losses and average payment per repetitive loss claim.
TABLE 5.8: NFIP STATISTICS AND REPETITIVE LOSS PROPERTIES
REPETITIVE FLOOD LOSSES
JURISDICTION NUMBER OF NFIP
POLICIES
TOTAL COVERAGE
NUMBER OF PROPERTIES (residential /
non-residential)
VALUE OF LOSSES
NUMBER OF
LOSSES
AVERAGE PAYMENT PER CLAIM
Isle of Wight County 396 $115,417,000 16 / 2 $1,055,852 41 $25,752 Norfolk 12,021 $2,906,787,000 705 / 27 $31,136,110 1,840 $16,922 Portsmouth 3,944 $886,654,000 180 / 6 $7,318,176 461 $15,875 Smithfield 119 $35,402,000 3/0 $71,415 7 $10,202Suffolk 1,055 $306,327,000 10/3 $1,450,883 36 $40,302 Virginia Beach 25,268 $6,323,000,000 433 / 8 $21,812,396 1,247 $16,864 Windsor 7 $1,379,000 N/A N/A N/A N/ATOTAL 42,810 $10,574,966,000 1,347 / 46 $62,844,832 3,632 $125,917
Sources: NFIP (as of 1/29/2011) A severe repetitive loss (SRL) property is defined as a residential property that is covered under an NFIP flood insurance policy and: (a) has at least four NFIP claim payments (including building and contents) over $5,000 each, and the cumulative amount of such claims payments exceeds $20,000; or (b) has at least two separate claims payments (building payments only) made, with the cumulative amount of the building portion of such claims exceeding the market value of the building. For both (a) and (b), at least two of the referenced claims must have occurred within any ten-year period, and must be greater than 10 days apart. The City of Norfolk has 32 SRL properties with a total of 164 claims. Total claims for these 32 properties are over $3.4 million. Portsmouth has 5 SRL properties with a total of 33 claims totaling $722,315. Virginia Beach has 24 SRL properties with a total of 149 claims totaling over $3.6 million. Figure 5.6 through Figure 5.15 contain maps of the region’s repetitive loss areas, including the properties on the repetitive loss list and all adjacent properties with the same or similar flooding conditions. Additional detail on the geographic boundaries of repetitive loss areas in each community, as well as the number of structures included in those areas, is available by contacting the Planning Department in each community. In each of the repetitive loss areas in Norfolk and Virginia Beach, the primary cause of flooding is coastal storm surge and nor’easters. The secondary source is sea level rise and land subsidence. In Isle of Wight, repetitive loss areas 1 thru 6 are flooded due to riverine flooding, while areas 7 thru 12 are flooded due to storm surge and nor’easters. In Suffolk, repetitive loss areas 1 thru 3 are flooded due to storm surge and nor’easters, and areas 4 thru 10 are flooded due to riverine flooding and inadequate storm drainage. Portsmouth has completed repetitive flood loss area mapping separately from this plan and the maps can be found in the 2010 Portsmouth Floodplain Management Plan available online at: http://www.portsmouthva.gov/planning/images/2010-Flood-Plan-Directions-Final-Draft.pdf.

VULNERABILITY ASSESSMENT
SOUTHSIDE HAMPTON ROADS HAZARD MITIGATION PLAN SEPTEMBER 2011
5:13
FLOODS
FLOODS (100-YEAR) PRI Value: 3.5 Annualized Loss Estimate: $2,821,224,000 FLOODS (STORM SURGE) PRI Value: 3.0 Annualized Loss Estimate: $206,624,689 The vulnerability assessment for the flood hazard includes the findings of the qualitative assessment conducted, an overview of NFIP statistics, repetitive loss properties (as defined and identified by the NFIP), estimates of potential losses, and future vulnerability and land use. As described in detail in the Hazard Identification and Analysis section, the NCDC has records for 41 significant flood events in the past 16 years for the Southside Hampton Roads region, amounting to approximately $7,750,000 in reported property damage. Also discussed in the Hazard Identification and Analysis are historic storms such as Hurricanes Isabel, Floyd and the 1933 hurricane that each caused flooding in the region. Historically, the region is vulnerable to the flood hazard and flood events occur on a frequent basis. According to the qualitative assessment performed using the PRI tool, the flood hazard scored a PRI value of 3.5 (from a scale of 0 to 4, with 4 being the highest risk level). Table 5.6 summarizes the risk levels assigned to each PRI category.
TABLE 5.6: QUALITATIVE ASSESSMENT FOR FLOODS (100-YEAR)
PROBABILITY IMPACT SPATIAL EXTENT WARNING TIME DURATION
Highly Likely Catastrophic Moderate More Than 24 Hours More Than 1 Week
Source: Southside Hampton Roads Mitigation Planning Committee. Please refer to Table 5.1 for an explanation of the terms used. The storm surge hazard was analyzed separately from the 100-year coastal flood hazard, and scored a PRI value of 3.0 (from a scale of 0 to 4, with 4 being the highest risk level). Table 5.7 summarizes the risk levels assigned to each PRI category.
TABLE 5.7: QUALITATIVE ASSESSMENT FOR FLOODS (STORM SURGE)
PROBABILITY IMPACT SPATIAL EXTENT WARNING TIME DURATION
Likely Catastrophic Moderate More than 24 Hours Less than 24 Hours
Source: Southside Hampton Roads Mitigation Planning Committee. Please refer to Table 5.1 for an explanation of the terms used. NFIP STATISTICS AND REPETITIVE LOSS PROPERTIES Throughout the planning jurisdictions, there are 42,810 flood insurance policies in place, providing a total of $10,574,966,000 in coverage, almost doubling from $5,793,863,900 in 2003. Currently, there are over 132,000 repetitive loss (RL) properties nationwide. Reducing the number of RL properties insured by the NFIP is a nationwide emphasis of FEMA. An RL property is any insurable building for which two or more claims of more than $1,000 were paid by the NFIP within any rolling ten-year period, since 1978. An RL property may or may not be currently insured by the NFIP. A total of 1,393 repetitive loss properties as

VULNERABILITY ASSESSMENT
SOUTHSIDE HAMPTON ROADS HAZARD MITIGATION PLAN SEPTEMBER 2011
5:12
33 percent increase and the Town of Smithfield with a 28 percent increase. Portsmouth experienced a loss in population with a -5 percent growth rate from 2000 to 2010. In the areas of population increase, new housing construction tends to create jobs and stimulate the local economy. Local employment and retail sales for these communities continue to look positive for the immediate future. However, in the areas of population decline, unemployment and loss of businesses could continue to negatively impact the area in terms of economic growth.
AGRICULTURAL VULNERABILITY While most of the Southside Hampton Roads region is urbanized or developed, much of Isle of Wight County, Suffolk and portions of Virginia Beach remain undeveloped and used for agricultural purposes. Row crops constitute 13.7 percent of the total land use in the Southside Hampton Roads region (Isle of Wight County 25.3 percent, Suffolk, 22.9 percent and Virginia Beach 17.1 percent). The following crops are grown in Isle of Wight County, Suffolk and Virginia Beach: Corn Cotton Peanuts Soybeans Tall Fescue Wheat
Areas where agriculture is the primary land use are typically more vulnerable to the drought hazard because of the dependency of agriculture on water. These areas can also experience losses that are difficult to capture for other hazards such as flooding and hurricanes.
VULNERABILITY ASSESSMENT
SOUTHSIDE HAMPTON ROADS HAZARD MITIGATION PLAN SEPTEMBER 2011
5:11
ZONING AND LAND USE In order to regulate current and future land use and guide overall development patterns, all of the jurisdictions in the Southside Hampton Roads region have adopted a zoning ordinance that enforces standards for designated zoning districts. Zoning maps are useful planning tools, demonstrating the type and location of projected community development. Because of the number of jurisdictions participating in this Plan, and the many differences in zoning designations across the region, it is not feasible to show a regional map of the various zoning districts across the region. MANUFACTURED HOUSING AND THE AGE OF BUILDINGS The vulnerability of manufactured homes versus those built on-site can vary due to several factors. These include the age of construction, the materials and construction techniques used, the adherence to past and current building codes, and the method of installation. In the case of manufactured housing, proper installation can significantly affect vulnerability. For instance, with regard to wind-related hazards such as tropical cyclones, severe thunderstorms and tornadoes, estimates based on regional trends show that 50 percent of manufactured homes built prior to 1976 are not secured with tie downs. Of the manufactured homes built between 1976 and 1993, 25 percent have no tie downs. Of those built from 1994 to 2004, 1 percent has no tie downs. These statistics demonstrate that older manufactured homes, specifically those with no tie downs, are at greater risk from high wind hazards (Blue Sky Foundation of North Carolina). A similar logic applies to the age of buildings and flood hazard vulnerability. As shown in Table 5.5, the communities in the Southside Hampton Roads region joined the National Flood Insurance Program (NFIP) either in the early 1970’s or early 1990’s. In order to join the NFIP, each participating jurisdiction is required to adopt and enforce its own floodplain management ordinance. As a result, structures built after joining the NFIP are assumed to be less vulnerable to flood hazards than those built prior to joining, assuming other environmental conditions remain constant.
TABLE 5.5: NFIP ENTRY DATE AND CURRENT EFFECTIVE FLOOD INSURANCE RATE MAP (FIRM)
JURISDICTION NFIP ENTRY DATE CURRENT EFFECTIVE FIRM
Isle of Wight County 8/19/1991 9/4/2002 Norfolk 8/1/1979 9/2/2009 Portsmouth 7/2/1971 9/25/2009 Smithfield 12/5/1990 9/4/2002 Suffolk 11/16/1990 9/4/2002 Virginia Beach 4/23/1971 5/4/2009 Windsor 8/1/1990 9/4/2002
Source: FEMA DEVELOPMENT TRENDS Two factors that contribute to an overall understanding of development trends are population change and economic growth. According to the U.S. Census Bureau, the average rate of population growth in the Southside Hampton Roads region between 1990 and 2000 was 7.1 percent, and between 2000 and 2010, the rate was 5.3 percent. This rate is slower than the state average of 14.4 percent for the period 1990 to 2000, and 13.0 percent from 2000 to 2010. Between 2000 and 2010, the Town of Windsor experienced the greatest population growth rate with a 187 percent increase, followed by Suffolk with a

VULNERABILITY ASSESSMENT
SOUTHSIDE HAMPTON ROADS HAZARD MITIGATION PLAN SEPTEMBER 2011
5:10
Schools (particularly those designated as shelters)
Hazardous materials facilities
Water (and wastewater) facilities
Energy facilities (electric, oil and natural gas)
Communication facilities
Critical facility data were acquired from the HAZUS-MH database of critical facilities for each jurisdiction. Figures AB1 through AB-5 (located in Appendix B) show the general location of critical facilities in each jurisdiction. Table 5.4 shows the results of a general analysis of the critical facilities that are located in the high wildfire risk area, 100-year floodplain, Coastal High Hazard Area (V Zone) and the Storm Surge Zone for a Category 3 hurricane. The critical facility data points from the HAZUS-MH software were used for this analysis. This analysis was updated in 2011 for the communities with newly designated 100-year floodplains and V Zones (Norfolk, Portsmouth, and Virginia Beach), and for the new SLOSH storm surge maps. Suffolk officials verified that there are no critical facilities in the 100-year floodplain, so the single school previously listed was deleted from the list.
TABLE 5.4: CRITICAL FACILITIES LOCATED IN HAZARD AREAS
Jurisdiction Facility Type High Wildfire
Risk 100-year
Floodplain
Coastal High Hazard Area
(V Zone)
Storm Surge Category 3
Isle of Wight County Fire/Rescue Station 1 1 0 0
Police Facility 0 0 0 0
Water Facilities 0 2 0 2
Norfolk Fire/Rescue Station 0 1 0 0
Schools 0 8 0 43
Water Facilities 0 2 0 3
Police Facilities 0 4 0 2
Medical Facilities 0 1 0 1
Portsmouth Water Facilities 0 1 1 0
Schools 0 4 0 16
Police Facilities 0 2 0 1
Medical Facilities undetermined 0 0 1
Fire/Rescue Station 0 1 0 0
Suffolk Water Facilities 0 0 0 1
Schools 0 0 0 1 (elevated above
BFE)
Smithfield None 0 0 0 0
Windsor None 0 0 0 0
Virginia Beach Fire/Rescue Station 0 1 0 0
Police Facilities 0 0 0 2
Water Facilities 0 0 0 1
Schools 0 6 0 24
Medical Facilities 0 0 0 0
VULNERABILITY ASSESSMENT
SOUTHSIDE HAMPTON ROADS HAZARD MITIGATION PLAN SEPTEMBER 2011
5:9
GENERAL ASSET INVENTORY The total dollar exposure of buildings within the Southside Hampton Roads region is estimated to be $55,529,902,000. This figure is based on an estimated 298,941 residential, commercial, and other buildings located throughout the region, derived from HAZUS-MH data4 (Table 5.3). The data provide an estimate of the aggregated replacement value for the region’s assets. Figures 5.3 through 5.5 illustrate geographically the concentration of commercial and residential dollar exposure in the Southside Hampton Roads region based on HAZUS-MH data.
TABLE 5.3: BUILDING INVENTORY IN SOUTHSIDE HAMPTON ROADS
JURISDICTION NUMBER OF BUILDINGS
RESIDENTIAL COMMERCIAL OTHER TOTAL
Isle of Wight County 12,340 577 450 13,367
Norfolk 68,652 4,261 2,112 75,025
Portsmouth 36,197 1,751 804 38,752
Suffolk 24,737 1,264 731 26,732
Virginia Beach 135,297 6,619 3,149 145,065
TOTAL 277,223 14,472 7,246 298,941
JURISDICTION BUILDING AND CONTENTS VALUES (2006 dollars)
RESIDENTIAL COMMERCIAL OTHER TOTAL
Isle of Wight County $1,434,666,000 $230,137,000 $306,972,000 $1,971,775,000
Norfolk $11,412,898,000 $3,047,094,000 $1,534,019,000 $15,994,011,000
Portsmouth $4,615,686,000 $844,288,000 $468,004,000 $5,927,978,000
Suffolk $2,818,959,000 $645,703,000 $340,904,000 $3,805,566,000
Virginia Beach $22,326,642,000 $3,961,084,000 $1,542,846,000 $27,830,572,000
TOTAL $42,608,851,000 $8,728,306,000 $4,192,745,000 $55,529,902,000
Source: HAZUS-MH CRITICAL FACILITIES There is no comprehensive database of critical facilities and infrastructure for the Southside Hampton Roads region. Moreover, there is no universally accepted definition of what constitutes critical facilities and infrastructure, nor is one associated with FEMA and DMA 2000 planning requirements. However, for purposes of this Plan, critical facilities and infrastructure are identified as “those facilities or systems whose incapacity or destruction would present an immediate threat to life, public health, and safety or have a debilitating effect on the economic security of the region.” This includes the following facilities and systems based on their high relative importance for the delivery of vital services, the protection of special populations, and other important functions in the Southside Hampton Roads region: Emergency Operations Centers (EOCs)
Hospitals and medical care facilities
Police stations
Fire stations
4 HAZUS uses Census 2000 and Dunn and Bradstreet (2002) data for its default inventories.
VULNERABILITY ASSESSMENT
SOUTHSIDE HAMPTON ROADS HAZARD MITIGATION PLAN SEPTEMBER 2011
5:8
OVERVIEW OF SOUTHSIDE HAMPTON ROADS VULNERABILITY
DEMOGRAPHICS According to the U.S. Census Bureau, the total population of Southside Hampton Roads region in 2000 was 860,870; in 2010 the total population was 906,902, an increase of 5.3 percent. The average number of persons per square mile was 811 and the average housing units per square mile was 318. These numbers are significantly higher than the state average. The City of Virginia Beach contains the greatest population and housing units among cities and towns in the planning area. Table 5.2 provides a summary of population and demographic characteristics for the region from the 2000 Census and the limited 2010 Census data available at the time of this update.
TABLE 5.2: POPULATION AND DEMOGRAPHIC CHARACTERISTICS
JURISDICTION TOTAL
POPULATION 2000
TOTAL POPULATION
2010 (% change)
UNDER 18 YEARS OLD
(2000)
65 YEARS AND OVER
(2000)
DISABILITY STATUS (2000)
Isle of Wight County 29,728 35,270 (19%)
23% 12% 20%
Norfolk 234,403 242,803
(4%) 21% 11% 24%
Portsmouth 100,565 95,535 (-5%)
24% 14% 25%
Smithfield 6,324 8,089 (28%)
24% 14% 22%
Suffolk 63,677 84,585 (33%)
26% 11% 24%
Virginia Beach 425,257 437,994
(3%) 24% 8% 15%
Windsor 916 2,626
(187%) 22% 12% 20%
Source: U.S. Census Bureau (2000, 2010) Figure 5.2 shows the distribution of this population across the planning area based on the number of persons per census block, based on Census 2000 data.3
3 Graduated coloring used to show persons living in each census block can be visually misleading. Highly populated areas may appear scarcely populated because population is divided into many small census blocks. Likewise, large census blocks may show large population but cover more land area.

VULNERABILITY ASSESSMENT
SOUTHSIDE HAMPTON ROADS HAZARD MITIGATION PLAN SEPTEMBER 2011
5:7
TABLE 5.1: SUMMARY OF PRIORITY RISK INDEX (PRI)
PRI CATEGORY
DEGREE OF RISK ASSIGNED WEIGHTING
FACTOR LEVEL CRITERIA INDEX VALUE
Probability
Unlikely Less than 1% annual probability 1
30% Possible Between 1 and 10% annual probability 2
Likely Between 10 and 100% annual probability 3
Highly Likely 100% annual probability 4
Impact
Minor Very few injuries, if any. Only minor property damage and minimal disruption on quality of life. Temporary shutdown of critical facilities.
1
30%
Limited Minor injuries only. More than 10% of property in affected area damaged or destroyed. Complete shutdown of critical facilities for more than one day.
2
Critical
Multiple deaths/injuries possible. More than 25% of property in affected area damaged or destroyed. Complete shutdown of critical facilities for more than one week.
3
Catastrophic
High number of deaths/injuries possible. More than 50% of property in affected area damaged or destroyed. Complete shutdown of critical facilities for 30 days or more.
4
Spatial Extent
Negligible Less than 1% of area affected 1
20% Small Between 1 and 10% of area affected 2
Moderate Between 10 and 50% of area affected 3
Large Between 50 and 100% of area affected 4
Warning Time
More than 24 hours Self explanatory 1
10% 12 to 24 hours Self explanatory 2
6 to 12 hours Self explanatory 3
Less than 6 hours Self explanatory 4
Duration
Less than 6 hours Self explanatory 1
10% Less than 24 hours Self explanatory 2
Less than one week Self explanatory 3
More than one week Self explanatory 4
Source: Southside Hampton Roads Mitigation Planning Committee

VULNERABILITY ASSESSMENT
SOUTHSIDE HAMPTON ROADS HAZARD MITIGATION PLAN SEPTEMBER 2011
5:6
QUALITATIVE METHODOLOGY The qualitative assessment relies less on technology and more on historical and anecdotal data, community input and professional judgment regarding expected hazard impacts. The qualitative assessment completed for the Southside Hampton Roads region is based on the Priority Risk Index (PRI), a tool used to measure the degree of risk for identified hazards in a particular planning area. The PRI is also used to assist community officials in ranking and prioritizing those hazards that pose the most significant threat to their area based on a variety of factors deemed important by the Mitigation Planning Committee and other stakeholders in the hazard mitigation planning process. While the quantitative assessment focuses on using best available data, computer models and GIS technology, the PRI system relies more on historical data, local knowledge and the general consensus of the Mitigation Planning Committee. The PRI is used for hazards with no available GIS data or relevant information to perform quantitative analyses, and also provides an important opportunity to compare the results with hazards that do have historical data. The PRI results allow identified hazards to be ranked against one another (the higher the PRI value, the greater the hazard risk). PRI values are obtained by assigning varying degrees of risk to five categories for each hazard (probability, impact, spatial extent, warning time and duration). Each degree of risk has been assigned a value (1 to 4) and an agreed upon weighting factor2, as summarized in Table 5.1. To calculate the PRI value for a given hazard, the assigned risk value for each category is multiplied by the weighting factor. The sum of all five categories equals the final PRI value, as demonstrated in the example equation below:
PRI VALUE = [(PROBABILITY x .30) + (IMPACT x .30) + (SPATIAL EXTENT x .20) + (WARNING TIME x .10) + (DURATION x .10)]
According to the weighting scheme applied for the Southside Hampton Roads region, the highest possible PRI value is 4.0. Prior to being finalized, PRI values for each hazard were reviewed and accepted by the Mitigation Planning Committee. The Committee analyzed and approved the PRI for each hazard as part of the 2011 update.
SUMMARY Using both the qualitative and quantitative analyses to evaluate the hazards that impact the region provides members of the Mitigation Planning Committee with a dual-faceted review of the hazards. This allows officials to recognize those hazards that may potentially be costly, but also to plan and prepare for hazards that may not cause much monetary damage, but could put a strain on the local resources needed to recover. All conclusions of the vulnerability assessment completed for the region and participating jurisdictions are presented in “Conclusions on Hazard Risk” at the end of this section. Findings for each hazard are detailed in the hazard-by-hazard vulnerability assessment that follows, beginning with an overview of general asset inventory and exposure data for the Southside Hampton Roads region.
2 The Mitigation Planning Committee based upon any unique concerns for the planning area may also adjust the PRI weighting scheme.
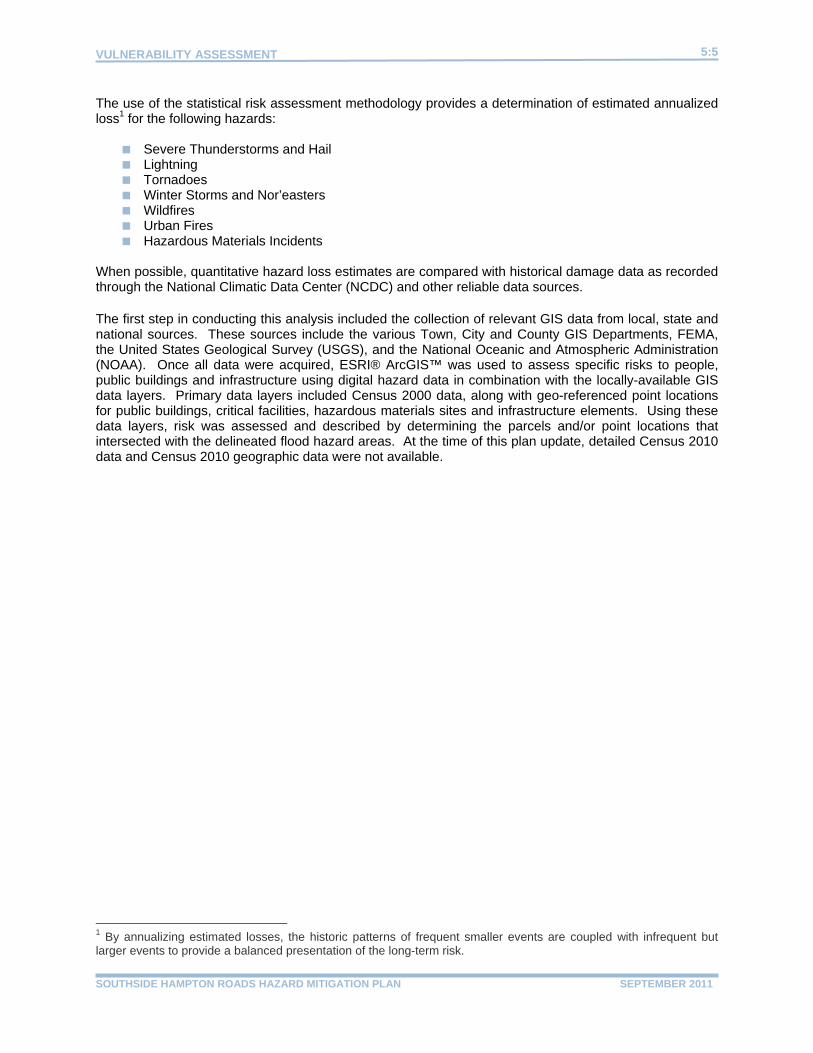
VULNERABILITY ASSESSMENT
SOUTHSIDE HAMPTON ROADS HAZARD MITIGATION PLAN SEPTEMBER 2011
5:5
The use of the statistical risk assessment methodology provides a determination of estimated annualized loss1 for the following hazards:
Severe Thunderstorms and Hail Lightning Tornadoes Winter Storms and Nor’easters Wildfires Urban Fires Hazardous Materials Incidents
When possible, quantitative hazard loss estimates are compared with historical damage data as recorded through the National Climatic Data Center (NCDC) and other reliable data sources. The first step in conducting this analysis included the collection of relevant GIS data from local, state and national sources. These sources include the various Town, City and County GIS Departments, FEMA, the United States Geological Survey (USGS), and the National Oceanic and Atmospheric Administration (NOAA). Once all data were acquired, ESRI® ArcGIS™ was used to assess specific risks to people, public buildings and infrastructure using digital hazard data in combination with the locally-available GIS data layers. Primary data layers included Census 2000 data, along with geo-referenced point locations for public buildings, critical facilities, hazardous materials sites and infrastructure elements. Using these data layers, risk was assessed and described by determining the parcels and/or point locations that intersected with the delineated flood hazard areas. At the time of this plan update, detailed Census 2010 data and Census 2010 geographic data were not available.
1 By annualizing estimated losses, the historic patterns of frequent smaller events are coupled with infrequent but larger events to provide a balanced presentation of the long-term risk.

VULNERABILITY ASSESSMENT
SOUTHSIDE HAMPTON ROADS HAZARD MITIGATION PLAN SEPTEMBER 2011
5:4
FIGURE 5.1: CONCEPTUAL MODEL OF HAZUSMH METHODOLOGY
Sources: FEMA This risk assessment used HAZUS-MH to produce regional profiles and estimated losses for three of the hazards addressed in this section: 100-year coastal flood, hurricane winds and earthquakes. For each of these hazards, HAZUS-MH was used to generate probabilistic “worst case scenario” events to show the extent of potential damages. Explanation of GIS-based (Non-HAZUSMH) Risk Assessment Methodology For hazards outside the scope of HAZUS-MH, a statistical risk assessment methodology was designed and applied to generate potential loss estimates. The approach is based on the same principals as HAZUS-MH, but does not rely on readily available automated software. First, historical data are compiled for each hazard to relate occurrence patterns with existing hazard models. Statistical evaluations are then applied in combination with engineering modeling to develop damage functions that generate annualized losses.

VULNERABILITY ASSESSMENT
SOUTHSIDE HAMPTON ROADS HAZARD MITIGATION PLAN SEPTEMBER 2011
5:3
METHODOLOGIES USED
Two distinct risk assessment methodologies were used in the formation of this vulnerability assessment. The first consists of a quantitative analysis that relies upon best available data and technology, while the second approach consists of a qualitative analysis that relies on local knowledge and rational decision making. Upon completion, the methods are combined to create a “hybrid” approach for assessing hazard vulnerability for the region that allows for some degree of quality control and assurance. The methodologies are briefly described and introduced here and are further illustrated throughout this section. For each hazard addressed in this section, vulnerability is summarized in part by an annualized loss estimate specific to that hazard, along with a “PRI” value (described in detail below). QUANTITATIVE METHODOLOGY The quantitative assessment involved the use of Hazards U.S. Multi-Hazard (HAZUS-MH) software, a geographic information system (GIS)-based loss estimation tool available from the Federal Emergency Management Agency (FEMA), along with a statistical risk assessment methodology for hazards outside the scope of HAZUS-MH. For the flood hazard, the quantitative assessment incorporates a detailed GIS-based approach using best available local data from the jurisdictions in the region. When combined, the results of these vulnerability studies are used to form an assessment of potential hazard losses (in dollars) along with the identification of specific community assets that are deemed at-risk. Explanation of HAZUS-MH and Statistical Risk Assessment Methodology HAZUS-MH is FEMA’s standardized loss estimation software package, built on an integrated GIS platform using a national inventory of baseline geographic data (including information on the region’s general building stock and dollar exposure). Originally designed for the analysis of earthquake risks, FEMA expanded the program in 2003 to allow for the analysis of multiple hazards: namely the flood and wind (hurricane wind) hazards. By providing estimates on potential losses, HAZUS-MH facilitates quantitative comparisons between hazards and assists in the prioritization of hazard mitigation activities. HAZUS-MH uses a statistical approach and mathematical modeling of risk to predict a hazard’s frequency of occurrence and estimated impacts based on recorded or historic damage information. The HAZUS-MH risk assessment methodology is parametric, in that distinct hazard and inventory parameters—such as wind speed and building type—were modeled using the HAZUS-MH software to determine the impact on the built environment. Figure 5.1 shows a conceptual model of HAZUS-MH methodology. More information on HAZUS-MH loss estimation methodology is available through FEMA at www.fema.gov/hazus.
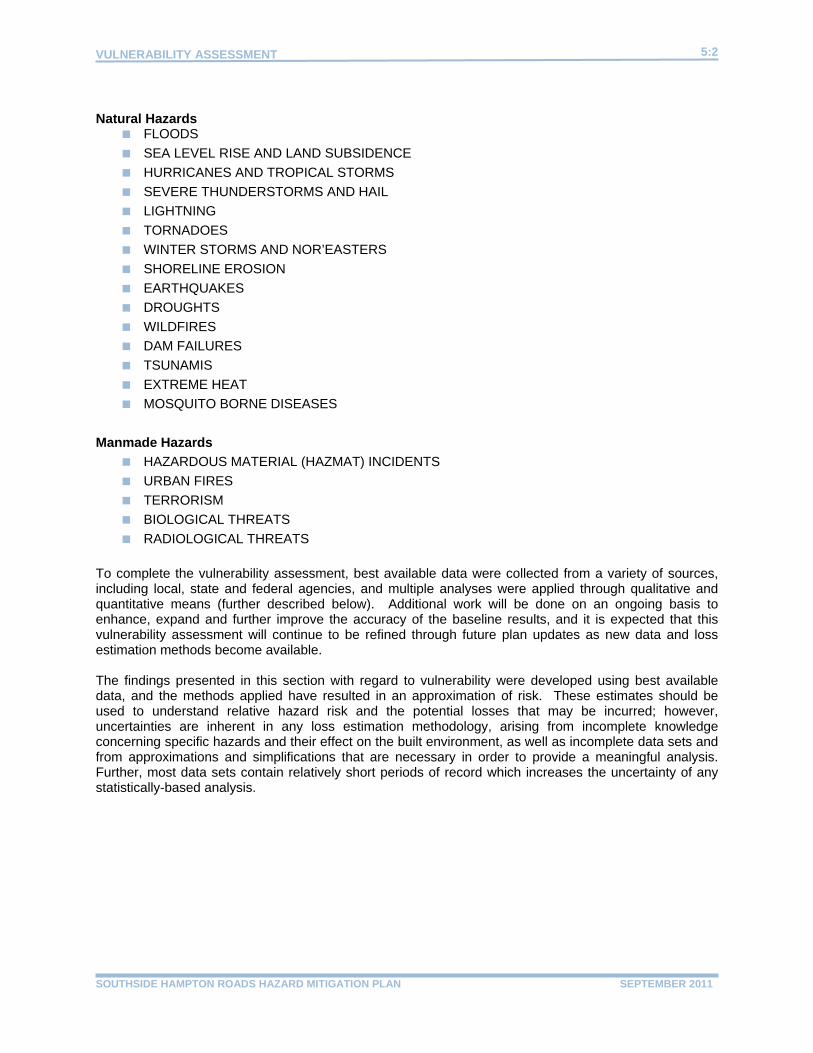
VULNERABILITY ASSESSMENT
SOUTHSIDE HAMPTON ROADS HAZARD MITIGATION PLAN SEPTEMBER 2011
5:2
Natural Hazards FLOODS
SEA LEVEL RISE AND LAND SUBSIDENCE
HURRICANES AND TROPICAL STORMS
SEVERE THUNDERSTORMS AND HAIL
LIGHTNING
TORNADOES
WINTER STORMS AND NOR’EASTERS
SHORELINE EROSION
EARTHQUAKES
DROUGHTS
WILDFIRES
DAM FAILURES
TSUNAMIS
EXTREME HEAT
MOSQUITO BORNE DISEASES
Manmade Hazards
HAZARDOUS MATERIAL (HAZMAT) INCIDENTS
URBAN FIRES
TERRORISM
BIOLOGICAL THREATS
RADIOLOGICAL THREATS
To complete the vulnerability assessment, best available data were collected from a variety of sources, including local, state and federal agencies, and multiple analyses were applied through qualitative and quantitative means (further described below). Additional work will be done on an ongoing basis to enhance, expand and further improve the accuracy of the baseline results, and it is expected that this vulnerability assessment will continue to be refined through future plan updates as new data and loss estimation methods become available. The findings presented in this section with regard to vulnerability were developed using best available data, and the methods applied have resulted in an approximation of risk. These estimates should be used to understand relative hazard risk and the potential losses that may be incurred; however, uncertainties are inherent in any loss estimation methodology, arising from incomplete knowledge concerning specific hazards and their effect on the built environment, as well as incomplete data sets and from approximations and simplifications that are necessary in order to provide a meaningful analysis. Further, most data sets contain relatively short periods of record which increases the uncertainty of any statistically-based analysis.

VULNERABILITY ASSESSMENT
SOUTHSIDE HAMPTON ROADS HAZARD MITIGATION PLAN SEPTEMBER 2011
5:48
TABLE 5.48: CONCLUSIONS ON HAZARD RISK FOR THE SOUTHSIDE HAMPTON ROADS REGION
CRITICAL HAZARD - HIGH RISK
Sea Level Rise and Land Subsidence
Floods (100-Year) Hurricanes and Tropical Storms Winter Storms and Nor’easters
CRITICAL HAZARD - MODERATE RISK
Hazardous Materials Incidents
Tornadoes Severe Thunderstorms and Hail
Lightning Floods (Storm Surge)
Tsunamis
NONCRITICAL HAZARD - LOW RISK
Urban Fires
Wildfires Droughts
Dam Failures Shoreline Erosion
Earthquakes Extreme Heat
Mosquito Borne Diseases Terrorism
Biological Threats Radiological Threats
Source: Southside Hampton Roads Mitigation Planning Committee