south african journal of geomatics, vol. 4, no. 3, august … · south african journal of...
TRANSCRIPT

South African Journal of Geomatics, Vol. 4, No. 3, August 2015
198
A participatory web map service: the case of Theewaterskloof Dam
Kevin Musungu1, Dorette Jacobs2 1Civil Engineering and Surveying, Cape Peninsula University of Technology, Cape Town, South Africa,
[email protected] 2Directorate: Spatial and Land Information Management. Department of Water and Sanitation,
Pretoria, South Africa
DOI: http://dx.doi.org/10.4314/sajg.v4i3.2
Abstract
In recent years there have been huge advancements in GIS as a technology and as a science. Previously, GIS was critiqued as a segregating science used exclusively by geospatial experts. In recent years however, various studies have investigated the potential for communities without geospatial training to contribute towards, or benefit from, the use of GIS. Indeed, innovations such as open source and internet based packages like Google Earth and Open Street Map as well as mobile navigation devices have already popularised the importance of geospatial data. This study sought to investigate one way of providing up-to-date maps to fishermen and tourists using dams in South Africa. The paper reports on a pilot case study in the use of web based GIS service for mapping on the Theewaterskloof dam in South Africa. It presents a case study methodology for the development and testing of a web GIS that can be optimised for smartphones and tablets so that communities can access updated information while using the dam, which is rated as dangerous, for fishing or other recreational activity.
1. Introduction
In South Africa, the Department of Water Affairs (DWA) is the custodian for water-related data on state-owned dams. Unfortunately, the efficient dissemination of the data is hampered by the absence of a single point of access where this data can be retrieved instantaneously by various stakeholders. Further, in order for one to have access to specific datasets or information (hard copy or digital), various individuals in the organisation have to be contacted. This is because the information is fragmented and exists in silos throughout the organisation. Though paper maps are readily available at departmental front desks, it is difficult to visualize and symbolize various themes or aspects simultaneously on a single map. Thus, sometimes more than one paper copy is required making it difficult to handle when the clients intend to use the maps for fieldwork. Additionally, paper maps are static and can only be updated periodically.
One potential solution to these problems is the use of an interactive web based map information service that could be developed to facilitate instantaneous access of various stakeholders’ to relevant data. This study sought to develop a methodology for the development of such a web based service that could facilitate access to both spatial and non-spatial data using the Theewaterskloof dam area as a case study site. The Theewaterskloof dam was chosen by the DWA as the pilot study site. The amount of data available and the precarious nature of the dam structure were two main factors in choosing this dam as the pilot study..
2. Study Site
The Theewaterskloof dam is located near Villiersdorp in the Western Cape Province of South Africa (Figure 1). It has a capacity of 480 million m³ and a surface area of 48 km², which makes it the seventh largest dam in South Africa. The dam structure consists of rocky drop offs, grass, reeds at the water’s edge, many submerged trees, old underwater buildings and roads and a bridge. The structure, the dam size, protected areas, privately owned properties around the dam and limited access roads made access to the water difficult. It especially had an impact on anglers not familiar with the area around the dam and the delineated dam zones set out by DWA for water activities such as fishing, skiing, sailing and protected areas. As earlier stated, these dangers were a reason this area was chosen as a pilot study.

South African Journal of Geomatics, Vol. 4, No. 3, August 2015
199
Figure 1. Theewaterskloof Dam (Source: Google Maps, 2015)
A number of key stakeholders that could benefit from the interactive web based map information service were identified. These included;
The property owners living around the dam, especially those with commercial rights where fishermen could get access to the water through their property;
The general public or community that used the facilities on and around the water (e.g. fishermen, boat clubs);
The Inland Maritime Safety Program (IMSP) contributors who aim to promote recreational water safety;
The Department of Environmental Affairs (DEA) responsible for the environmentally protected areas and monitoring of the growth of invasive plant species;
Nature Conservation who are also responsible for the protected areas at the dam;
Department of Water Affairs (DWA) who are responsible for aspects such as dam zoning, implementation of new Buoyage systems, preparation of specifications on state owned dams to demarcate recreational water activities as well as state owned property management
The use of web map services for the collection and distribution of spatial information straddles several research themes including web cartography, neo cartography, crowd sourcing, participatory sensing and participatory GIS. The following section will highlight the theoretical foundation and case studies for dissemination of spatial and aspatial data using an interactive web based map information service.
3. Geographical Information Systems and the Web
3.1 The evolution of Geographical Information Systems
Geographic Information Systems (GIS) are now commonly used to collect spatial data as well as to disseminate spatial information. GIS is essentially a computerised system that allows a user to map, model, query, and analyse spatial data (Quan et al 2001). A GIS essentially consists of several components that incorporate geographical data into a database that can subsequently be subjected to spatial analytical algorithms. However, the potential of GIS to facilitate dialogue between stakeholders at various scales has often been unrealised, mainly because GIS development has traditionally been executed by professionals without input from local stakeholder communities located in the actual geographical space of interest (Edney, 1991; Pickles, 1995; Carver, 2001; Quan et al., 2001).
South African Journal of Geomatics, Vol. 4, No. 3, August 2015
200
This is partly because of the diversity of spatial data as well as the analytical components of GIS. The data was often expensive to source, software was expensive to purchase, significant expertise was required for data manipulation and processing, and perpetual commitment of resources was required to maintain the developed GIS (Elwood 2008; Abbott et al 1998).
Additionally, scholars noted concerns with uneven access to spatial information. Laituri (2003) stated that access to GIS technology and data is dependent on, among other things, the relationship between the stakeholders (context); the technological infrastructure, policy and funding available (connectivity); the basic, computer and spatial literacy of the participants (capabilities); the availability and types of data, such as public data or sensitive data from government entities (content). Hence, the use of GIS required a certain level of expertise, and communities could not gain access to the data in the GIS (Edney, 1991; Pickles, 1995; Carver, 2001; Quan et al., 2001). Consequently, traditional development of GIS has often frustrated participation rather than encouraging it.
These deficiencies in traditional GIS precipitated what became known as Participatory GIS (PGIS) and Public Participation GIS (PPGIS). The acronyms PGIS for ‘Participatory GIS’ and GISP for ‘GIS with Participation’ have been used interchangeably by scholars on the subject. Quan et al (2001: 2) describe PGIS as ‘the integration of local knowledge as well as stakeholders’ perspectives in a GIS’. Laituri (2003: 25) describes PGIS as ‘a confluence of social activity such as grassroots organizations and government decision making with technology in specific places or grounded geographies’. Tulloch (2003) states that based on various case studies on the subject PGIS could be described as ‘a study of the uses and applications of GIS technology used by members of the public both as individuals and grass-root groups for the participation in public processes from data collection to decision-making’. These definitions broadly describe the main aspects of PGIS i.e. linkages between primary stakeholders (e.g. end-beneficiary communities) and secondary stakeholders (such as government) as well as processes involving GIS (Elwood 2008). Similarly, Weiner and Harris (2003) fashioned the term Community-Integrated GIS (CiGIS) describing a GIS that facilitates participation of people and communities that would otherwise be peripheral in the decision making process. Participatory GIS can therefore be split into two broad themes, addressing the two deficiencies highlighted in the preceding discussion. Some scholars address the issues involved in enabling access of the various stakeholders to pertinent spatial information in the GIS (Carver, 2001; Laituri, 2003; McCall, 2003), whilst others advocate the inclusion of information from various stakeholders including communities in a GIS (Abbott et al., 1998; Abbot, 2000; Karanja, 2010). Incidentally, this study will focus on the former. The paradigm shift from GIS to PGIS has transformed GIS technology into a means of communication between previously disconnected groups (Elwood 2008; Weiner and Harris 2003).
Critics of PGIS suggest that like most community participation projects the effectiveness of PGIS is frustrated by the persistent problems such as time, funding, expertise, continuity and the cultural dynamics of dealing with multiple stakeholders (Weiner and Harris 2003; Sawicki and Peterman 2002). It also stands to reason that since the form of PGIS will vary from community to community (Elwood 2008; Rambaldi et al 2006) it could take on a variety of forms and methods. A number of methodologies have been employed in integrating community information and GIS such as videos, questionnaires, transect walks, sketch mapping and scale mapping (Barry & Rüther, 2005; Tripathi & Bhattarya, 2004). Notably, although many studies have focused on promoting community participation in the development of GIS (Patel and Baptist, 2012; Baptist and Bolnick, 2012; Musungu et al., 2012; Armaş & Avram, 2009; Raaijmakers et al., 2008; Bouchard et al., 2007; Abbot, 2000; Abbot et al., 1998) there has been far less research on innovative ways of data dissemination. In addition, another major critique is the lack of continuity in these studies. Many of them are prompted by project needs and are discontinued once the projects are implemented for a variety of reasons (Weiner & Harris, 2003). Consequently, there is a need to identify more sustainable methods of soliciting and disseminating spatial information to stakeholder communities.
With regard to access to data, the internet has become popular as a means of access to spatial data and information in recent years. Carver (2001) reported on a case study in Leeds, England, where spatial datasets were uploaded onto the internet and communities were able to access the data and voice their opinions online on various issues affecting their lives. Online interaction between stakeholders has also been referred to as e-participation (ibid). Currently, various websites also actively promote the agenda of PGIS and PPGIS research. These include www.ppgis.net, Open Street Map (OSM), MapQuest, Google Map Maker, CrowdMap and OpenLayers. The maps on these sites are often created using data from GPS devices, aerial photography, paper based questionnaires or any other free sources and can be downloaded in full for free under the open license (figure 1 is one such example). The maps can be edited or updated by individuals with user accounts. Moreover, maps can also be displayed on mobile phones and GPS devices. Therefore these websites encourage the collaborative development, growth and distribution of geospatial data to a large extent. An African example of a PGIS project involving community-powered web mapping and information dissemination is the Kibera project in Kenya (Figure 2). Kibera is an informal settlement in Nairobi, the Kenyan capital city. The local residents are trained to create community maps using the tools and techniques of OpenStreetMap. The community maps are used for development and relief efforts by the Kenyan government (Craner, 2012).

South African Journal of Geomatics, Vol. 4, No. 3, August 2015
201
Figure 2. Map of Kibera slum, Nairobi, Kenya (Source: Mapkibera.org, 2012)
In South Africa, although researchers have recognised the potential of web platforms (Breetzke, 2006; Budhathoki & Nedovic-Budic 2008) and Community Based Organisations (CBOs) have actively engaged in community related GIS research, little has been in done in the utilisation of online platforms. Chirowodza et al (2009) used PGIS as a tool in order to understand and inform community-based HIV intervention studies in four case study areas located in Zimbabwe, Tanzania and South Africa. Participatory research methods were used in conjunction with GIS in the formative phase of a multisite community-based social mobilization trial. Maman et al. (2009) conducted a similar HIV-focused study in Tanzania, Zimbabwe, Thailand and South Africa. Panek and van Heerden (2013) used PGIS to identify sites for water provision in rural Koffiekraal in South Africa and aimed to map households located more than 200 m from cart water. Musungu et al (2012a) reports on a risk analysis case study conducted in two informal settlements in Cape Town. The study identified and mapped existing hazards (flooding and fire) as well as community based adaptations in conjunction with local community members. Similar studies on flood vulnerability were conducted by Nethengwe (2007) at Dzingahe and Maliboni villages in Limpopo and Tyler (2011) in Masiphumulele informal settlement in Cape Town. Weiner & Harris (2003) examined the use of PGIS in the context of land reform. Musungu et al (2012b) report on collaboration with a local Non-Governmental Organisation (NGO) in Cape Town for re-blocking of an informal settlement.
Most of the papers highlighted in the preceding section, describe local examples of PGIS whose long-term sustainability could have benefited from the use of web-based platforms. Reason being, most of them were static studies i.e. the information presented is only reflective of the local situation at that particular period of time when the study was taken. However, the creation of maps on the web requires the consideration of a number of cartographic issues. The next section will highlight some of these issues.
3.2 Web Cartography
There are a number of mapping constraints that need consideration when developing web map application. These include the map purpose, the geographic reality to be represented, the audience for which the application is intended, the conditions where it will be used, the scale-ranges of display and the technical limitations to produce and serve the map (Muehrcke & Muehrcke, 1992). Other constraints include (Hajji, 2011):
a) Data storage (optimal storage supports easy map display and queries)
b) Styling and display (creating maps on the fly with own symbols, style and scale)
c) Data queries (in order to generate dynamic maps immediately the interface must have correct tools for querying data and building maps)
d) Performance (fast access to generate maps may require caching of maps)
e) Security (intrusion of database and confidential zoom levels)
f) Web services (assessment of standards and formats) and lastly

South African Journal of Geomatics, Vol. 4, No. 3, August 2015
202
g) Mobile maps (resolution and performance requirements of mobile applications)
Some recommendations from scholars such as Kraak and Brown (2001) include the use of;
a) Small file sizes (speeds up downloading but can lead to smaller maps with simpler designs)
b) Scaling and zooming options (will lessen the problem of small map formats)
c) Visual hierarchy (emphasize the important elements and organize the content logically i.e. shape and colour attracts the eye first, and then information is picked out)
d) Visual variables (more web orientated and include transparency and shadow)
e) Web map objects (use interactive gadgets like pull-down menus, mouse-over events and hotspots)
f) Map symbols (use simple self-explanatory symbols to speed up uploading time and shorten map reading time)
g) Legends (use pop-up legends and interactive control legends to explain symbols)
h) Text (font replacement, the flow of the text, letter spacing and leading can influence readability and legibility)
i) Final web map testing (test on minimum user configurations and improve with regular feedback)
Based on the feedback in previous studies, web GIS provides a platform for users to leverage the mapping and analytical capacity of GIS (Boulos 2005; Choi et al., 2005; Kamatak et al., 2007; Kiehle et al. 2007; Rada et al., 2013) as well as the dissemination capacity of the web (Meyer et al., 2007; Liu et al., 2008; Han et al., 2012; Kulawiak et al., 2010). It is important though, to ensure that the stakeholders in the area of interest are all given a chance for involvement in the development and choice of data to be captured as much as possible (Cartwright, 2012). Also, steps have to be taken to ensure that the web GIS is accessible to the stakeholders on a number of devices. The following section describes the methodology used in this study.
3.3 Levels of Participation
Studies centred on crowdsourcing and citizen science identify various levels of community participation. Haklay (2013) describes the following four levels of participation in Citizen Science:
a) Crowdsourcing – Participation is limited to provision of resources and information. In participatory sensing, participants are encouraged to use to record information for a centralized database. The advantage of this approach, from a quality perspective, is that, as long as the characteristics of the instrumentation are known (such as the accuracy of a GPS receiver some assumptions about the quality of the information can be developed. Moreover, the number of sensors report similar information provide a yardstick for the validity of the data collected.
b) Distributed intelligence –The participants are asked to take some basic training, and then collect data or carry out a simple interpretation activity. The key aim is to include the cognitive ability of the participants.
c) Participatory science – here there is a level of participation in which the problem is defined by the participants and, in consultation with scientists and experts, a data collection method is devised. The participants engage in data collection, but require the assistance of the experts in for the analysis and interpretation of results.
d) Extreme citizen science – here the participants can decide on their level of engagement and can be potentially involved in various stages such as analysis and publication or utilisation of results. This type of participation also opens the possibility of citizen science without professional scientists, in which the whole process is managed and carried out by the participants themselves in order to achieve a specific goal.

South African Journal of Geomatics, Vol. 4, No. 3, August 2015
203
Figure 3. Levels of Citizen Science (Haklay 2013)
It is important to rate PGIS studies in this context in order to gauge the levels of actual participation in PGIS. Figure 3 shows a summary of the various levels.
4. Methodology
The web map was created with base and operational data sourced from various stakeholders as well as the public. Also, links to documentation and other web sites of interest to the identified stakeholders have been incorporated to make this a comprehensive web information service accessible from the user’s preferred device. Additional data and any other indigenous knowledge that is not currently captured can be contributed by the public or communities around the dam site. This data could include statistics of incidents that happened on or around the dams in the past. Examples of such data or information include boating accidents, old submerged structures, fallen trees or other dangerous obstacles that are not visible when the dam water levels are high. Table 1 shows information about the base data used in the web GIS.
Table 1. Data layers used to form base layers for the web service
Alias name (As used in web map)
Description Name and format Custodian and date Projection and datum
1 : 50 000 Image service
Seamless national data set created from separate images covering SA. (Images)
1 : 50 000 (Image)
National Geospatial Information (NGI) – Each image date varies (Image service created by DWA – 2011)
Ortho-rectified; Geographic – WGS84
SPOT 2011 10 m deg, Image service
Seamless national data set created from separate ortho-rectified images degraded 10m resolution for distribution purposes via web (Images).
SPOT5 2011 (Image)
South African National Space Agency (SANSA) 2011 (Image service created by DWA – 2012)
Ortho-rectified; UTM 35
Multibeam images
Data set showing the profile of the dam basin as captured by a Multibeam sonar system device. (Images)
twk-east-area1.tif to twk-east-area4.tif and twk-west-area1.tif to twk-west-area5.tif
DWA (Contracted to Underwater Surveys) 2008
Not ortho-rectified
Nature reserves
Nature Reserve Boundary coverage of South Africa. Restriction - DWA use only. (Polygon)
consgeo.shp (shapefile)
Department of Environmental Affairs (DEA) – (Published 1995, last updated 1995)
Geographic – Clarke1866
Towns Major towns of SA (Polygon)
Towns.shp (shapefile)
NGI
Geographic – Cape1880
Communities Communities of SA Commatr.shp NGI Geographic –
South African Journal of Geomatics, Vol. 4, No. 3, August 2015
204
(Polygon) (shapefile) Cape1880
World heritage sites
Heritage sites. Restriction – State not to be sold) (Polygon)
Heritage_geo.shp (shapefile)
DEA (Source date: 1998, last updated: 1998)
Geographic – Clarke1866)
Quaternary catchments
Quaternary catchment boundaries for SA. Restriction – State not to be sold) (Polygon)
drgnquat.shp (shapefile)
DWA (Source date - 1995; Updated – 2000)
Geographic – Clarke1880
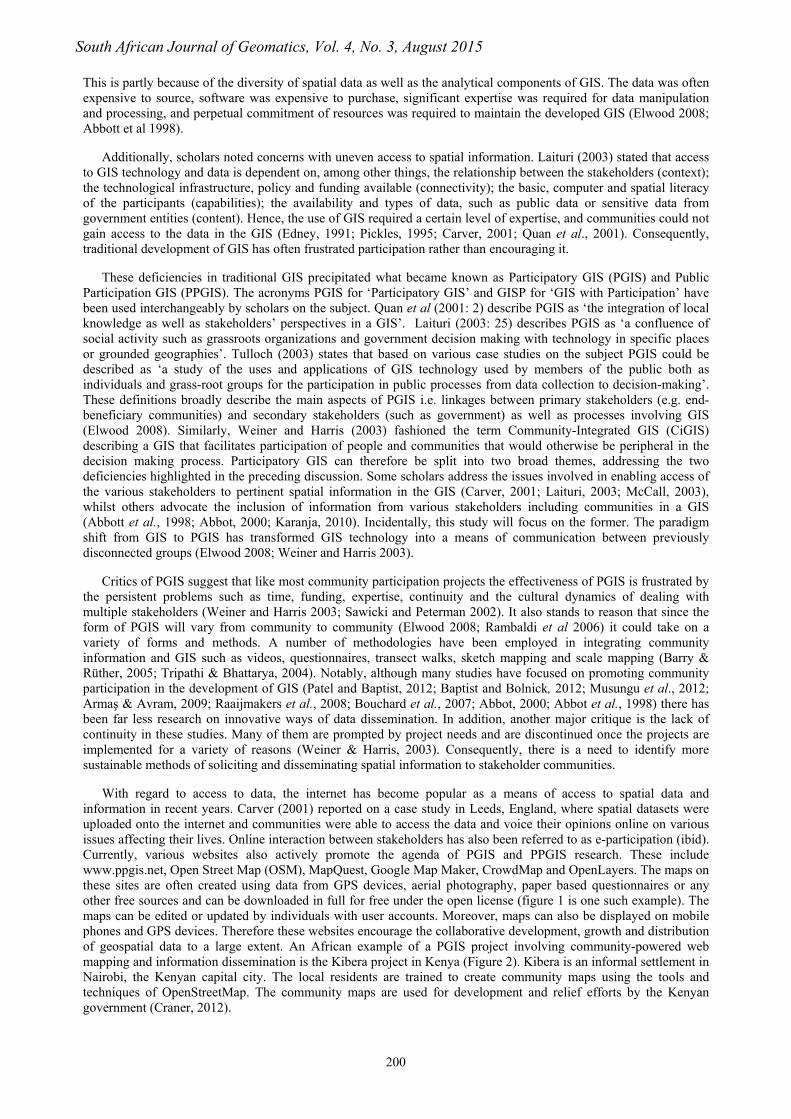
Table 2 shows the operational data captured in the Web GIS layers. The data was either created for this web service by using ArcGIS software or captured at the dam site using GPS and an echo sounder. The creation of symbol styles and compilation of layer files were undertaken with the aim of optimizing download time when viewing the web map. This was done according to DWA standards (for the base data) as well as the Aids to Navigation (AtoN) principles adopted by the South African Navy for inland water bodies (for the buoy data). A detailed description of the AtoN manual can be requested from South African Maritime Safety Authority (SAMSA). A copy of AtoN manual is also available at http://www.hydro.navy.mi.th/download/Navguide_2010.pdf. Additionally, documents were compiled to provide the user with supplementary information on the dam and associated aspects, as well as links to other websites relating to the dam or data in DWA and other entities.
The web map service was tested for accessibility, upload time, interactivity and visualization on different digital devices to optimise the value of such an application to the user. The service was tested using laptops and smart phones. This web service was served on the DWA server and also overlaid on external web services such as ArcGIS Online and Google Earth as they already contained base maps.
Table 2. Datasets used in the operational layers of the web service
Alias name (As used in web map)
Description Name and format Custodian and date
Projection and datum
Buoys
Buoy positions as captured @ dam with a GPS and echo sounder and symbolized according to AtoN principles. (SA Navy – J. Collocot & DWA – D. Piekaar) (Point)
Buoy_update2.shp (shapefile)
DWA 2012
Transverse Mercator Lo 19° - Hartebeeshoek
Buoy direction
Buoy direction positions according to AtoN principles for port hand and star board hand positions on dam for all boats and yachts. (Point)
Buoy_direction.shp (shapefile)
DWA 2012
Transverse Mercator Lo 19° - Hartebeeshoek
UPN zones Zones as proposed by owner of UPN system for emergency incident reporting. (Polygon)
UPN_zones.shp (shapefile)
DWA 2012
Transverse Mercator Lo 19° - Hartebeeshoek
Dam zones Zones to designate recreational water activities on dam. (Point)
Dam zones.shp DWA 2012
Transverse Mercator Lo 19° - Hartebeeshoek
Points of interest
Position of points of interest on and around dam which includes photos. (Point)
Photo_docs.shp (shapefile)
DWA (Sourced: 2011; updated: 2012)
Transverse Mercator Lo 19° - Hartebeeshoek
During the pilot phase, two questionnaires were compiled in order to get feedback from users that were testing the web service functionality. The questions focussed on the devices used and their means of accessing the internet (e.g. Local Area Network and 3G), upload times and which web service platform was preferred. The questionnaire also queried the ease-of-use, interactive ability, and other data that users would like to have access as well as suggestions for the future development of such web services. The first questionnaire was sent out to 36 people to get feedback on their experiences in using the map service. The people that took part in the questionnaire were GIS staff in different
South African Journal of Geomatics, Vol. 4, No. 3, August 2015
205
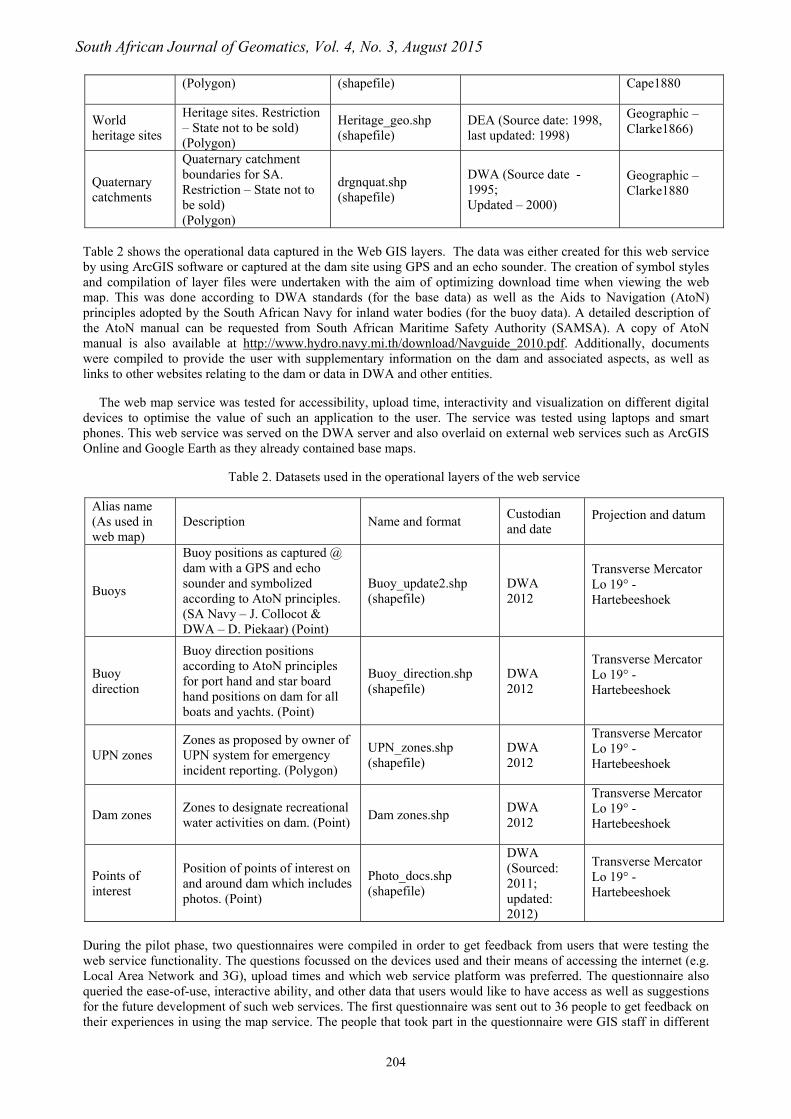
departments at DWA (consisting of a GIS Professional, GISc technicians), part of the general public and professionals from other Departments and local businesses. One of the authors also visited the dam site and tested the accessibility to the website, ArcGis Online and Google Earth. Feedback was captured in the form of a spreadsheet that users returned via email. Subsequently, based on the users’ comments, changes and improvements were made to the web service and a second questionnaire was then sent to 67 people, including the initial respondents, to get feedback on the new web GIS. In total, 103 responses were targeted and 23 were actually received i.e. 22% of the potential sample of 103. The results from this feedback will be discussed in the next section in more detail. The flowchart below provides a summary of the methodology.
Figure 4. Workflow in the development of the Web GIS service
5. Results
5.1 The interactive web map via DWA servers
When a user accesses the web map via the web link the web page opens and displays the map. Figure 5 shows a screenshot of the user interface.
Figure 5. Map Operational Layers and Base layers used on the web map
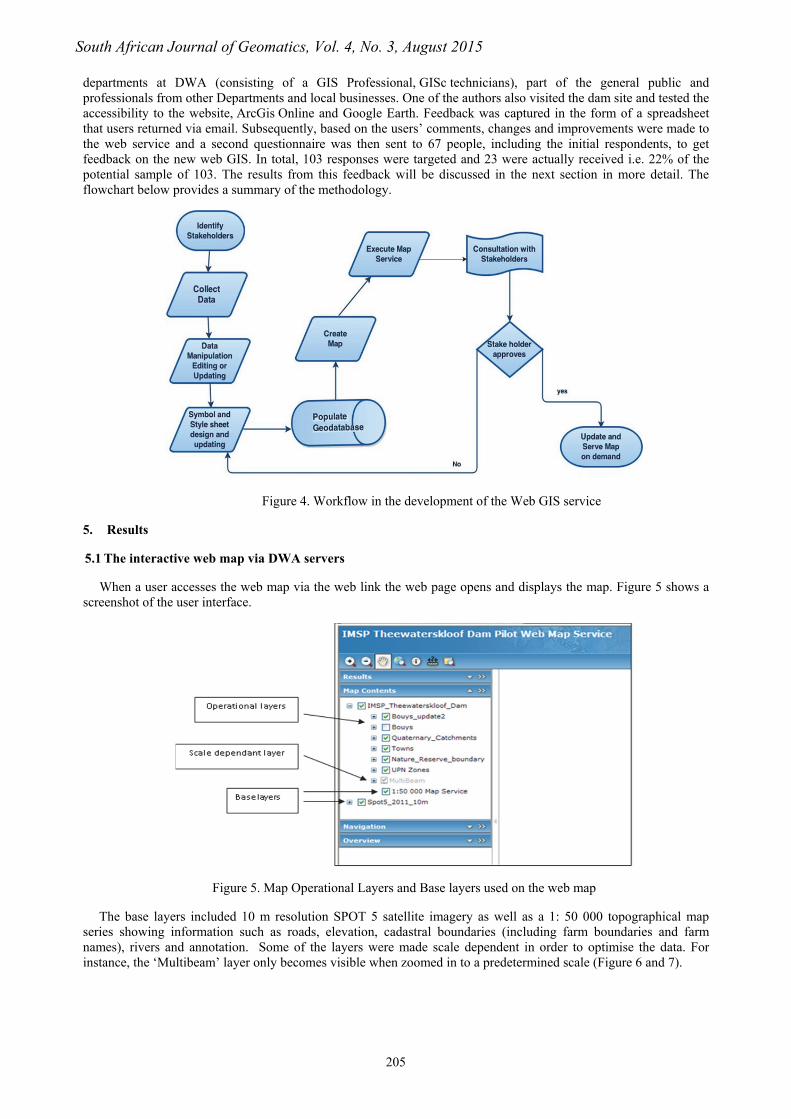
The base layers included 10 m resolution SPOT 5 satellite imagery as well as a 1: 50 000 topographical map series showing information such as roads, elevation, cadastral boundaries (including farm boundaries and farm names), rivers and annotation. Some of the layers were made scale dependent in order to optimise the data. For instance, the ‘Multibeam’ layer only becomes visible when zoomed in to a predetermined scale (Figure 6 and 7).
South African Journal of Geomatics, Vol. 4, No. 3, August 2015
206
Figure 6. Multibeam layer displayed at large scale
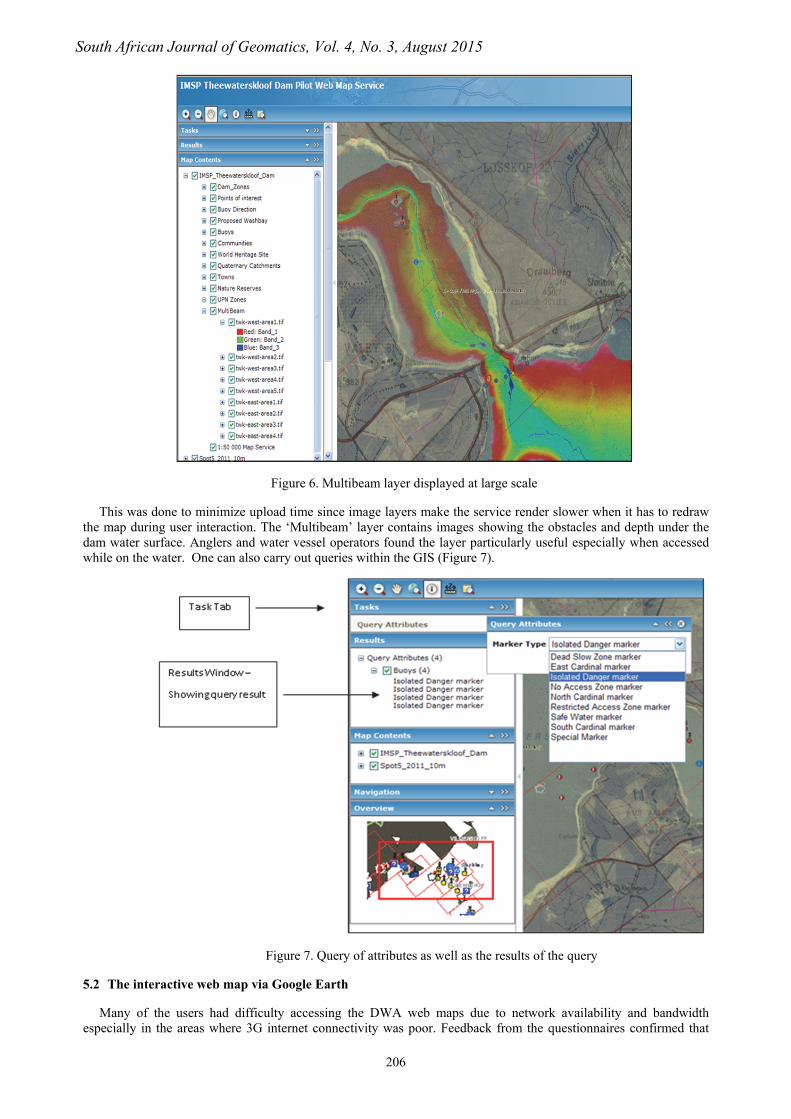
This was done to minimize upload time since image layers make the service render slower when it has to redraw the map during user interaction. The ‘Multibeam’ layer contains images showing the obstacles and depth under the dam water surface. Anglers and water vessel operators found the layer particularly useful especially when accessed while on the water. One can also carry out queries within the GIS (Figure 7).
Figure 7. Query of attributes as well as the results of the query
5.2 The interactive web map via Google Earth
Many of the users had difficulty accessing the DWA web maps due to network availability and bandwidth especially in the areas where 3G internet connectivity was poor. Feedback from the questionnaires confirmed that

South African Journal of Geomatics, Vol. 4, No. 3, August 2015
207
devices using EDGE and GPRS could access the GIS service but it was slower. In such cases it was found that smart phone apps (which can be downloaded from a cell phone application store via the internet) worked significantly faster. Notably, the cell phone signal at the dam site was tested at various places on the dam, when the buoy capturing took place, during the site visit in May 2012 and found to be sufficient (an average of three phone signal bars).
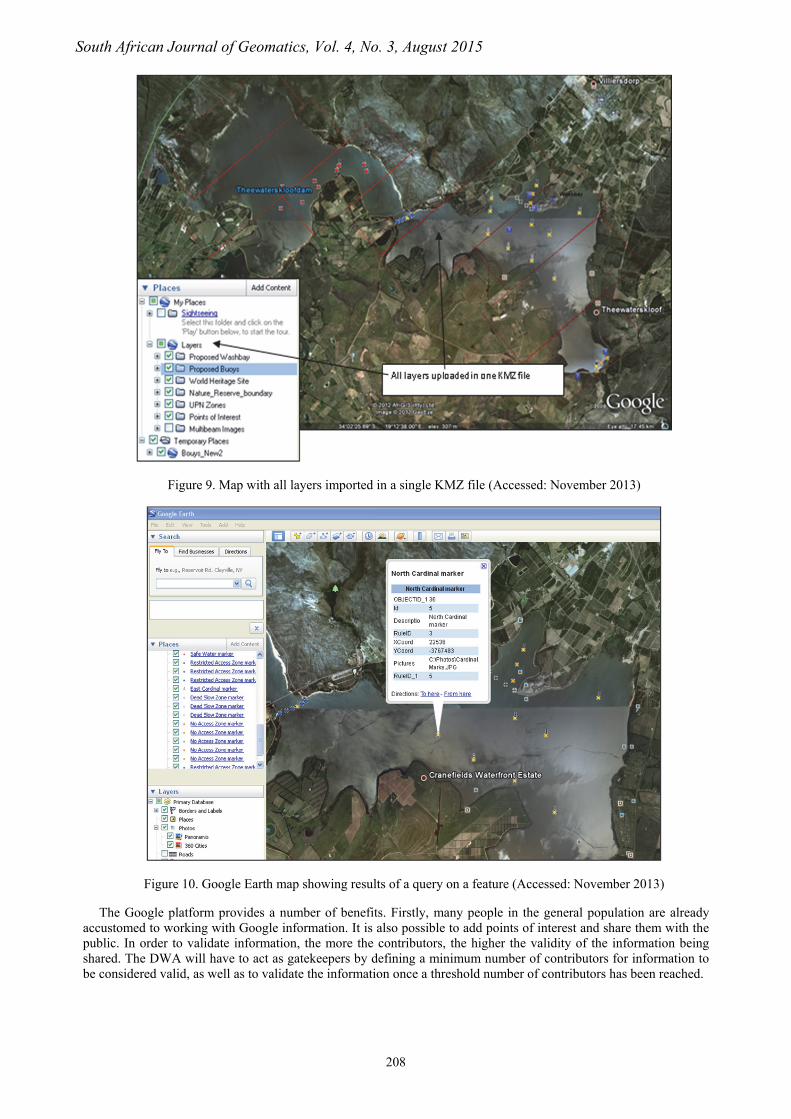
Considering the difficulty in accessing the DWA maps, the alternative use of the Google Earth web service was also tested. The same map created with ArcGIS 10 for the DWA web service in MXD file extension format, was exported to a KMZ file format and a separate KMZ file was created for the buoy data layer. The MXD format is a GIS project (map) file format used by ESRI mapping software that includes the map description, layout and embedded objects saved in the map. KMZ files are zipped KML (Keyhole Markup Language) files which is the file format Google Earth uses. These two KMZ files were then sent to users. The users of this service tested it on tablets and smart phones. Figure 8 shows the KMZ file with just the buoy layer uploaded to Google Earth. Whereas two KMZ files were created in this case, it is also possible to export all the layers used in your MXD at once (Figure 9).
Figure 8. Map with Buoy data layer uploaded in KMZ format (Accessed: November 2013)
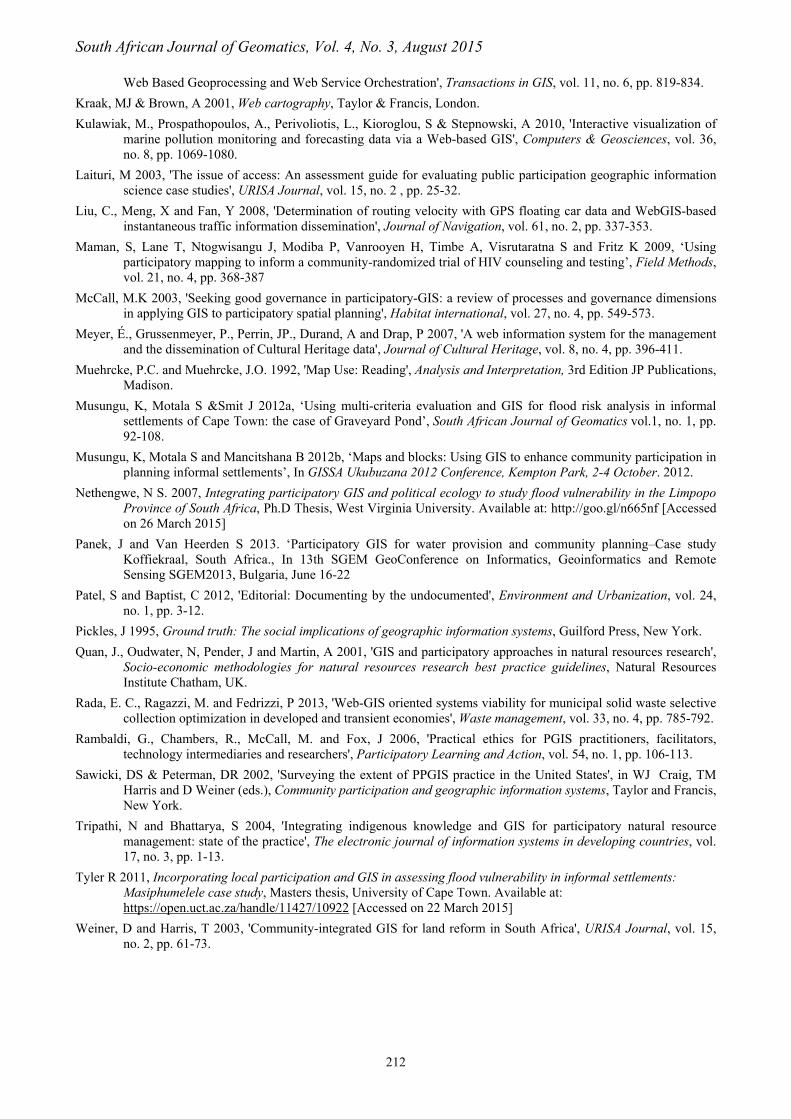
Attribute data about features can be displayed in a pop up window once the feature is selected (Figure 10). Further, any new data added to this map by the user is copied to the DWA. It may then be imported as a vector file (e.g. shape file format) into the existing DWA dataset and the DWA map service is updated in this manner.
South African Journal of Geomatics, Vol. 4, No. 3, August 2015
208
Figure 9. Map with all layers imported in a single KMZ file (Accessed: November 2013)
Figure 10. Google Earth map showing results of a query on a feature (Accessed: November 2013)
The Google platform provides a number of benefits. Firstly, many people in the general population are already accustomed to working with Google information. It is also possible to add points of interest and share them with the public. In order to validate information, the more the contributors, the higher the validity of the information being shared. The DWA will have to act as gatekeepers by defining a minimum number of contributors for information to be considered valid, as well as to validate the information once a threshold number of contributors has been reached.

South African Journal of Geomatics, Vol. 4, No. 3, August 2015
209
5.3 The interactive web map via ArcGIS Online
Lastly, the maps were also tested on the ArcGIS online application. Though ArcGIS Online is proprietary, it also offered the opportunity to see how the map performed on a platform designed for smartphones and tablets. The result is shown in Figure 11. In future, the use of open source software and phone applications should be investigated to alleviate bottleneck caused when new versions of proprietary software are released.
Figure 11. Map showing buoys and safety information (Accessed: November 2013)
5.4 Questionnaires and Evaluation
The feedback and questionnaire evaluations were important in getting the views of the stakeholders. It was important to understand the performance of the map service across several platforms including desktops, smartphones and tablets. Twenty three responses were received altogether from the questionnaires. These were the respondents from the various iterations when testing the software. From the feedback and questionnaire evaluations it was deduced that:
a) Most users will use the DWA web service from the office (LAN connection) and mostly using a laptop or PC (Figure 12). Thus, the symbols and annotation must be scaled to be clearly visible on a Laptop and PC screen.
b) The upload time was sufficient indicating that the map rendering adequate and the existing data layers did not have to be edited or reduced.
c) Google maps was most popular but considering that the information document was not readily available as is the case of the DWA web service a user would only have the data and no other supplementary information.
d ) The development of the web service was participatory as it was compiled and refined based on feedback and input from users at different GIS skill levels – from a GIS professional to the general public. Moreover, once the final web service is uploaded onto the official DWA website (www.dwa.gov.za) all users and stakeholders of the service will be able to access and contribute data and/or information to the web service via the DWA website.

South African Journal of Geomatics, Vol. 4, No. 3, August 2015
210
Figure 12. Cumulative number of devices used by stakeholders to test the map service
6. Discussion and Conclusion
One of the key requirements of the stakeholders around Theewaterskloof dam was to have access to relevant data and information from a centralized database. Previously, the public and even some other entities could not easily access this water related information from the Department of Water Affairs. Reason being, data was captured and stored in different directorates and sections with various contact persons. Hence there was a need to move from having information in silos to storing all pertinent data in a singular geodatabase. The data was easier to manage that way and to share the relevant data with other stakeholders and interested parties was effortless as everything was together. The resulting web GIS service served the purpose of disseminating this data from a singular database. Moreover, since the data was available online on various servers and accessible on various devices, the various stakeholders around Theewaterskloof dam could collect information from, and contribute data to the datasets in the web GIS at their convenience. Notably, in supporting both download an upload of local data, the web GIS service satisfied both key requirements of PGIS.
On the other hand, the DWA also benefited from this study. Reason being, the web platform provides an opportunity to crowdsource information from users of the dam. Further, it facilitates the DWA with a platform from which the organisation can broadcast warnings in real time. This is of great importance considering that Theewaterskloof dam is ranked highly as a dangerous dam. The dangers stem from mainly drowned trees but also rocky drop offs, grass, reeds, old roads, bridges and even drowned buildings. The locational details of such a broadcast could be facilitated by providing a Google format file such as KML or KMZ that users could access. In any situation where the community is encouraged to contribute data, security of information is always a concern. Hence although the public is allowed to submit data onto the Google Earth platform, it has to be verified before it is added to the Web service served on the DWA servers. This endures that the data on the service is accurate whilst allowing the public to continuously update the map.
In relation to the study by Haklay (2013) summarised in Figure 3, this study was at levels 1 and 2. It is envisaged that contributions will be captured by users and that they will be able to interpret the information being broadcast. Considering also, that the idea of a shared platform was recognised by the stakeholders and that the web based platforms was created in response to these discussion, there is a component of level 3. This serves as a pilot study especially considering that consultations between government and the public on the capture and distribution of data are uncommon. Though there are loopholes, as will be shown in the next paragraph, it still serves as a starting point for future improvements.
This project was able to achieve its objectives and presented a methodology that could be implemented at other dams under the management of the Department of Water Affairs. Nonetheless, there were areas of the research that could be improved. For instance;
a) Innovative ways of getting more feedback from the local community and other stakeholders need to be investigated. The response to the online questionnaires though statistically acceptable, was not ideal given that a total of 23 responses were received from a total of 103 possible responses. Perhaps the use of printed questionnaires, interviews and local meetings could yield more responses. Incidentally, this is a problem well described in literature on participatory GIS studies.
2
18
3
0 5 10 15 20
SmartPhone
Laptop
Desktop
Number of Users
Dev
ices

South African Journal of Geomatics, Vol. 4, No. 3, August 2015
211
b) This study relied heavily on proprietary software. If the methodology is to be affordably replicated in other case studies, then the use of open source software must be investigated. By and large, open source software has improved in functionality and it is therefore plausible that it can be used to fulfil this purpose. Perhaps future studies could test the viability of platforms such as open street map.
c) Better stakeholder involvement. This study started with discussions with stakeholders who identified the need for such a service. The fact that the DWA was responsive is complementary. However, better buy-in from stakeholders could have been achieved. From the outset, a plan for correspondence and an actual commitment to providing feedback on the part of stakeholders should have been pursued. Consequently, the interest in improving the service was insufficient to gather significant feedback. On the other hand, perhaps the use of web platforms represents a paradigm shift for the traditional users of the Theewaterskloof dam. In which case, the alternate use of mobile applications, which have been popularised in recent years should be investigated. It is imperative that higher levels of participation are envisaged.
Nonetheless, this study contributes to the body of participatory GIS by leveraging the web as a platform for geospatial data dissemination to various devices in local communities.
7. References
Abbot, J., Chambers, R., Dunn, C., Harris, T., de Merode , E., Porter, G., Townsend, J. & Weiner, D 1998, 'Participatory GIS: opportunity or oxymoron', PLA notes, vol. 33, pp. 27-33.
Abbott, J 2000, 'An Integrated spatial information framework for informal settlement upgrading', International Archives of Photogrammetry and Remote Sensing, 33(B2; PART 2), pp. 7-16.
Armaş, I and Avram, E 2009, 'Perception of flood risk in Danube Delta, Romania', Natural Hazards, vol. 50, no. 2, pp. 269-287.
Baptist, C and Bolnick, J 2012, 'Participatory enumerations, in situ upgrading and mega events: the 2009 survey in Joe Slovo, Cape Town', Environment and Urbanization, vol. 24, no.1, pp. 59-66.
Barry, M and Rüther, H 2005, 'Data collection techniques for informal settlement upgrades in Cape Town, South Africa', URISA Journal, vol. 17, no.1, pp. 43-52.
Boulos, MN 2005, 'Web GIS in practice III: creating a simple interactive map of England's strategic Health Authorities using Google Maps API, Google Earth KML, and MSN Virtual Earth Map Control', International Journal of Health Geographics, vol. 4, no. 1, 22.
Breetzke, GD 2006, ‘Geographical information systems (GIS) and policing in South Africa: a review’, Policing: An International Journal of Police Strategies & Management, vol. 29, no.4, pp. 723-740.
Budhathoki NR & Nedovic-Budic Z 2008, ‘Reconceptualizing the role of the user of spatial data infrastructure’, GeoJournal, vol.72, no. 3-4, pp. 149-160.
Cartwright, W 2012, 'Neocartography: Opportunities, issues and prospects', South African Journal of Geomatics, vol. 1, no. 1, pp. 14-31.
Carver, S 2001, 'Participation and Geographical Information: a position paper', in ESF-NSF Workshop, Spoleto, Italy, Citeseer,
Chirowodza, A, van Rooyen H, Joseph P, Sikotoyi S, Richter L, and Coates T 2009, ‘Using participatory methods and geographic information systems (GIS) to prepare for an HIV community‐based trial in Vulindlela, South Africa (Project Accept–HPTN 043)’, Journal of community psychology, vol. 37, no. 1, pp.41-57.
Choi, J., Engel, B. and Farnsworth, R 2005, 'Web-based GIS and spatial decision support system for watershed management', Journal of Hydroinformatics, vol. 7, pp. 165-174.
Edney, M 1991, 'Strategies for maintaining the democratic nature of geographic information systems', in Papers and proceedings of the Applied Geography Conferences, vol. 14, pp. 100-108.
Elwood, S 2008, 'Volunteered geographic information: future research directions motivated by critical, participatory, and feminist GIS', GeoJournal, vol. 72, no. (3-4), pp. 173-183.
Haklay, M 2013, 'Citizen Science and volunteered geographic information: Overview and typology of participation' In Crowdsourcing geographic knowledge in D Sui, S Elwood and M Goodchild (eds.) Springer, Netherlands.
Han, W., Yang, Z., Di, L. and Mueller, R 2012, 'CropScape: A Web service based application for exploring and disseminating US conterminous geospatial cropland data products for decision support', Computers and Electronics in Agriculture, vol. 84, pp. 111-123.
Karanja, I 2010, 'An enumeration and mapping of informal settlements in Kisumu, Kenya, implemented by their inhabitants', Environment and Urbanization, vol. 22, no. 1, pp. 217-239.
Kiehle, C., Greve, K & Heier, C 2007, 'Requirements for Next Generation Spatial Data Infrastructures‐Standardized
South African Journal of Geomatics, Vol. 4, No. 3, August 2015
212
Web Based Geoprocessing and Web Service Orchestration', Transactions in GIS, vol. 11, no. 6, pp. 819-834.
Kraak, MJ & Brown, A 2001, Web cartography, Taylor & Francis, London.
Kulawiak, M., Prospathopoulos, A., Perivoliotis, L., Kioroglou, S & Stepnowski, A 2010, 'Interactive visualization of marine pollution monitoring and forecasting data via a Web-based GIS', Computers & Geosciences, vol. 36, no. 8, pp. 1069-1080.
Laituri, M 2003, 'The issue of access: An assessment guide for evaluating public participation geographic information science case studies', URISA Journal, vol. 15, no. 2 , pp. 25-32.
Liu, C., Meng, X and Fan, Y 2008, 'Determination of routing velocity with GPS floating car data and WebGIS-based instantaneous traffic information dissemination', Journal of Navigation, vol. 61, no. 2, pp. 337-353.
Maman, S, Lane T, Ntogwisangu J, Modiba P, Vanrooyen H, Timbe A, Visrutaratna S and Fritz K 2009, ‘Using participatory mapping to inform a community-randomized trial of HIV counseling and testing’, Field Methods, vol. 21, no. 4, pp. 368-387
McCall, M.K 2003, 'Seeking good governance in participatory-GIS: a review of processes and governance dimensions in applying GIS to participatory spatial planning', Habitat international, vol. 27, no. 4, pp. 549-573.
Meyer, É., Grussenmeyer, P., Perrin, JP., Durand, A and Drap, P 2007, 'A web information system for the management and the dissemination of Cultural Heritage data', Journal of Cultural Heritage, vol. 8, no. 4, pp. 396-411.
Muehrcke, P.C. and Muehrcke, J.O. 1992, 'Map Use: Reading', Analysis and Interpretation, 3rd Edition JP Publications, Madison.
Musungu, K, Motala S &Smit J 2012a, ‘Using multi-criteria evaluation and GIS for flood risk analysis in informal settlements of Cape Town: the case of Graveyard Pond’, South African Journal of Geomatics vol.1, no. 1, pp. 92-108.
Musungu, K, Motala S and Mancitshana B 2012b, ‘Maps and blocks: Using GIS to enhance community participation in planning informal settlements’, In GISSA Ukubuzana 2012 Conference, Kempton Park, 2-4 October. 2012.
Nethengwe, N S. 2007, Integrating participatory GIS and political ecology to study flood vulnerability in the Limpopo Province of South Africa, Ph.D Thesis, West Virginia University. Available at: http://goo.gl/n665nf [Accessed on 26 March 2015]
Panek, J and Van Heerden S 2013. ‘Participatory GIS for water provision and community planning–Case study Koffiekraal, South Africa., In 13th SGEM GeoConference on Informatics, Geoinformatics and Remote Sensing SGEM2013, Bulgaria, June 16-22
Patel, S and Baptist, C 2012, 'Editorial: Documenting by the undocumented', Environment and Urbanization, vol. 24, no. 1, pp. 3-12.
Pickles, J 1995, Ground truth: The social implications of geographic information systems, Guilford Press, New York.
Quan, J., Oudwater, N, Pender, J and Martin, A 2001, 'GIS and participatory approaches in natural resources research', Socio-economic methodologies for natural resources research best practice guidelines, Natural Resources Institute Chatham, UK.
Rada, E. C., Ragazzi, M. and Fedrizzi, P 2013, 'Web-GIS oriented systems viability for municipal solid waste selective collection optimization in developed and transient economies', Waste management, vol. 33, no. 4, pp. 785-792.
Rambaldi, G., Chambers, R., McCall, M. and Fox, J 2006, 'Practical ethics for PGIS practitioners, facilitators, technology intermediaries and researchers', Participatory Learning and Action, vol. 54, no. 1, pp. 106-113.
Sawicki, DS & Peterman, DR 2002, 'Surveying the extent of PPGIS practice in the United States', in WJ Craig, TM Harris and D Weiner (eds.), Community participation and geographic information systems, Taylor and Francis, New York.
Tripathi, N and Bhattarya, S 2004, 'Integrating indigenous knowledge and GIS for participatory natural resource management: state of the practice', The electronic journal of information systems in developing countries, vol. 17, no. 3, pp. 1-13.
Tyler R 2011, Incorporating local participation and GIS in assessing flood vulnerability in informal settlements: Masiphumelele case study, Masters thesis, University of Cape Town. Available at: https://open.uct.ac.za/handle/11427/10922 [Accessed on 22 March 2015]
Weiner, D and Harris, T 2003, 'Community-integrated GIS for land reform in South Africa', URISA Journal, vol. 15, no. 2, pp. 61-73.