solid-liquid equilibrium of paracetamol in water-ethanol
TRANSCRIPT
Journal of Molecular Liquids 323 (2021) 114617
Contents lists available at ScienceDirect
Journal of Molecular Liquids
j ourna l homepage: www.e lsev ie r .com/ locate /mol l iq
Solid-liquid equilibrium of paracetamol in water-ethanol andwater-propylene glycol mixtures
Gabriel Pereira Assis a, Rafael Henrique Lazzari Garcia b, Silas Derenzo c, André Bernardo a,⁎a Programa de Pós-Graduação em Engenharia Química, UFSCar, São Carlos, Brazilb IPEN, Centro de Combustíveis Nucleares, São Paulo, Brazilc IPT, São Paulo, Brazil
⁎ Corresponding author.E-mail address: [email protected] (A. Bernardo).
https://doi.org/10.1016/j.molliq.2020.1146170167-7322/© 2020 Elsevier B.V. All rights reserved.
a b s t r a c t
a r t i c l e i n f oArticle history:Received 9 August 2020Received in revised form 13 October 2020Accepted 17 October 2020Available online 27 October 2020
Keywords:ParacetamolSolubilityEthanolPropylene glycolX-rays diffraction
Solubility is one of most important property to produce active pharmaceutical ingredients (APIs), beyond ofbeing related to its bioavailability. In this context, itwas determined paracetamol solid-liquid equilibrium in tem-peratures from 20 to 50 °C for two solvent systems: water - ethanol and water - propylene glycol (PG), by refrac-tometry method. The experimental results were compared with five thermodynamic models (Apelblat, Wilson,UNIQUAC, NRTL and λh) and data from the literature, showing good correlations for Apelblat and the best pre-dictive fit for the NRTL model in both solvent mixtures. Maximum solubility values were observed in a 75% eth-anol composition, this result being unusual and not the same with PG. the results of this work were comparedwith the literature and some references point to similar behavior. Optical microscopy and X-ray diffraction mea-surements of the solids in equilibrium with the liquid indicate that maximum solubility is not associated with achange in the crystalline structure of the solid
© 2020 Elsevier B.V. All rights reserved.
1. Introduction
Solubility is probably the most important property that must beknown for the production and purification of active pharmaceutical in-gredients (APIs) by crystallization, which is crucial for the pharmaceuti-cal industry both in the separation of intermediate products such as inthe final stage of their production [1,2].
The most APIs have size from 10 to 100 Da with high structural di-versity, having ionizable and hydrophobic parts. Thus, their interactionwith each other, solvents or antisolvents, and cossolutes and impuritiesin the solution are very diverse. Furthermore, their solid phases, includ-ing polymorphs (the same chemical species with more than one possi-ble crystalline type) and several solvates (formation of crystals with thepresence of solvents physically similar) formed by such molecules arestill very poorly understood [3–5].
Study of polymorphs by the solubility technique consists in deter-mining the solubility in the pre-formulation, obtaining the solubilitycurve as a function of temperature, and transition evaluation of thephases mediated by solvents [6], becoming experimental challengesfor low solubilities which are limited, mainly due to the difficulty ofreaching the thermodynamic balance between the solid and liquidphases, among other factors [4].
For the study of possible polymorphs formed in the solid portion,may be used the techniques of differential scanning calorimetry (DSC),thermogravimetry, X-ray powder diffraction (XRD), Raman and NMRspectroscopy [6].
The paracetamol or acetaminophen (CAS 103–90-2), with amolecu-lar mass of 151.16 g/mol, is one of the API's most widely used in theworld and can be associated with other's substances. It is a derivativeof p-aminophenol used as analgesic and antipyretic [7,8]. Some refer-ences show a maximum solubility value of paracetamol in ternary mix-tures of ethanol-water [9–12], while the same does not occur withwater-propylene glycol (PG)mixture [12,13]. However, reported valuesshow significant differences, on top of an unusual behavior for thewater-ethanol system, with a maximum solubility value close to 80%(m/m) of ethanol. Articles written by Jouyban et al. (2006) and Romeroet al. (1996) indicate a possible change of the crystalline form at thisconcentration, but do not report a deep investigation of solid phase.
Haisa et al. [14] report success on obtaining paracetamol orthorhom-bic form (II) by evaporating the ethanol solution, and in 1976, a mono-clinic form (I) obtained from the aqueous solutions [15]. Nichols andFrampton [16] observed that, depending on used solution and temper-ature conditions, form II can converge to form I of paracetamol whileEspeau et al. [17] report that form I can converge into form II whenunder pressure.
According to Hojjati and Rohani [18], it is preferable to use thermo-dynamic models to predict pharmaceuticals solubility due to the largeamount of solute and time required to obtain experimental solubility.
G.P. Assis, R.H.L. Garcia, S. Derenzo et al. Journal of Molecular Liquids 323 (2021) 114617
Many thermodynamic models were tested to predict the solubility ofParacetamol in different solvents and solvent mixtures. Among them,there are the Apelblat, λh, Wilson, UNIQUAC and NRTL models.
Apelblat andλhmodels are simple and adjust solubility in relation totemperature [19]. Hojjati and Rohani applied the Apelblat model in awater-paracetamol system, which showed a good correlation for thedata in reported article [18]. Both models were also applied by BalujaandTalaviya for di-hydropyridine,with adequate convergence to the re-ported data [20].
Wilson, NRTL and UNIQUAC models are non-correlative models ofactivity coefficient, for non-ideal binary mixtures, it may be preferableto use robustmodels such asNRTL, or UNIQUAC [21]. For binary and ter-nary systems, and systems with high structural complexity moleculesshown good relation for UNIQUAC model [18,22–24].
Thus, the determination of experimental solubility data for the para-cetamol in water-ethanol andwater-PG systems to evaluate the fit withfive thermodynamic models (Apelblat, Wilson, UNIQUAC, NRTL, λh)and the effect of the solvent mixture in behavior and crystal structureof the solid in equilibrium with the solution by optical microscopy andXRD techniques.
2. Experimental section
2.1. Chemicals
For the experiments were used demineralized water, 99,81% masspurity ethanol (NEON, Brazil) and 99,5% mass purity propylene-glycol(LABSYNTH, Brazil). 99,3% mass purity paracetamol was commerciallyobtained (Anqiu Lu'an Pharma, China).
2.2. Solubility measurements
Solubility was measured experimentally by isothermal method [4].Solvent-system concentration conditions were evaluated using anaqueousmixture with 0%, 25%, 50%, 75% and 100% ethanol or propyleneglycol, at temperatures of 20, 25, 30, 35, 40, 45 and 50 °C. All proposedconditions were evaluated in triplicate.
Desired quantities of each solvent were measured in analytical bal-ance fromQUIMISwith an accuracy of 0,1 mg andmixture for the prep-aration of the solvent system. Into the solution were added exceedingquantities of Paracetamol, in a such way that solid presence remainsin suspension in the system. The suspensions were kept in Erlenmeyerwith constant temperature under agitation in a SOLAB thermostaticshaker for at least 48 h. Required stirring time to reach the balancewas experimentally determined by dissolution specific test. Then, thesuspensionswere kept at rest at that constant temperature for 4 h to de-cant the solid. Samples of the supernatant liquid were collected in trip-licate to measure the concentration, and samples of the solid werecollected by filtration for characterization (optical microscopy and X-ray diffraction) [25].
Concentration analyzes of solutions were made by refractometrymethod, used by Crestani et al. [26]. Previously, a correlation was ob-tained between the refractive index (RI) and the solution compositionof each solute in the different used solvents at a fixed temperature of55 °C. All liquid samples were withdrawn using a preheated syringe,to avoid solid formation in the syringe during sampling. Samples wereadded to Eppendorfs vials heated up to 55 °C. The RI was thenmeasuredby the ABBE refractometer type from Analytikjena and the concentra-tion determined from the obtained correlations from the samerefractometer.
2.3. Solid characterization
To characterize the crystalline phases, present in the material,X-ray powder diffraction analyzes were performed on the BrukerD8 equipment, equipped with a scintillation detector and graphite
2
monochromator. The analyzes were performed with 0,025° path, 10 sper step, with 1080 W of Cu-Kα. Divergence slits and spreading of2,0 mm (approximately 1°), reception slit of 0,4 mm, and the goniome-ter radius of 250 mm, with variation of 2Theta from 8° to 60°. To carryout the analysis, the samples were previously ground in a mortar andagate mill.
3. Thermodynamic models
3.1. Modified Apelblat model
The Apelblatmodel uses 3 empirical constants obtained from exper-imental data, expressed by Eq. 1 [27,28].
ln x1 ¼ Aþ BTþ C lnT Eq 1
Where A and B are constants that represent the variation of the ac-tivity coefficient in solution and C represents the effect of temperatureover fusion enthalpy.
3.2. λh model
The λh equation, or Buchowski model, uses two parameters ob-tained from the experimental data, adjusted for multicomponent mix-tures by a mixing rule [29,30]. The λh equation is expressed by Eq. 2.
ln 1þ λ 1−xAð ÞxA
� �sat
¼ λh1T−
1Tm
� �Eq 2
Where, for multicomponent mixtures, the values of λ and h are:
h ¼ h1 x01� �2 þ 2 1−k12ð Þ x01
� �x02� � ffiffiffiffiffiffiffiffiffiffi
h1h2p
þ h2 x02� �2
Eq 3
λ ¼ λ1 x01� �2 þ 2 1−k12ð Þ x01
� �x02� � ffiffiffiffiffiffiffiffiffiffiffi
λ1λ2
pþ λ2 x02
� �2Eq 4
3.3. Modified Van't Hoff equation
To minimize the activity coefficients of the Wilson, UNIQUAC andNRTL, was used the modified Van't Hoff equation [18], by ΔCp ≅ ΔS,Eq. 5.
lnγ2x2 ¼ −ΔHfusm
RTmln Trð Þ Eq 5
3.4. Wilson model
Wilsonmodel uses two interaction parameters and formulticompo-nent systems it is expressed in Eq. 6 [31,32].
lnγk ¼ − ln ∑N
j¼1xjΛkj
!þ 1−∑
N
i¼1
xiΛ ik
∑N
j¼1xjΛ ij
0BBB@
1CCCA Eq 6
Where, Λ ij ¼ νj
viexp − λij−λii
RT
� �; Λ ji ¼ νi
vjexp − λji−λjj
RT
� �.
3.5. UNIQUAC model
For the UNIQUAC model, the activity coefficient equation for multi-component systems is expressed as a combination of the combinatorialpart and the residual part, expressed by eqs. 7 and 8 [33].
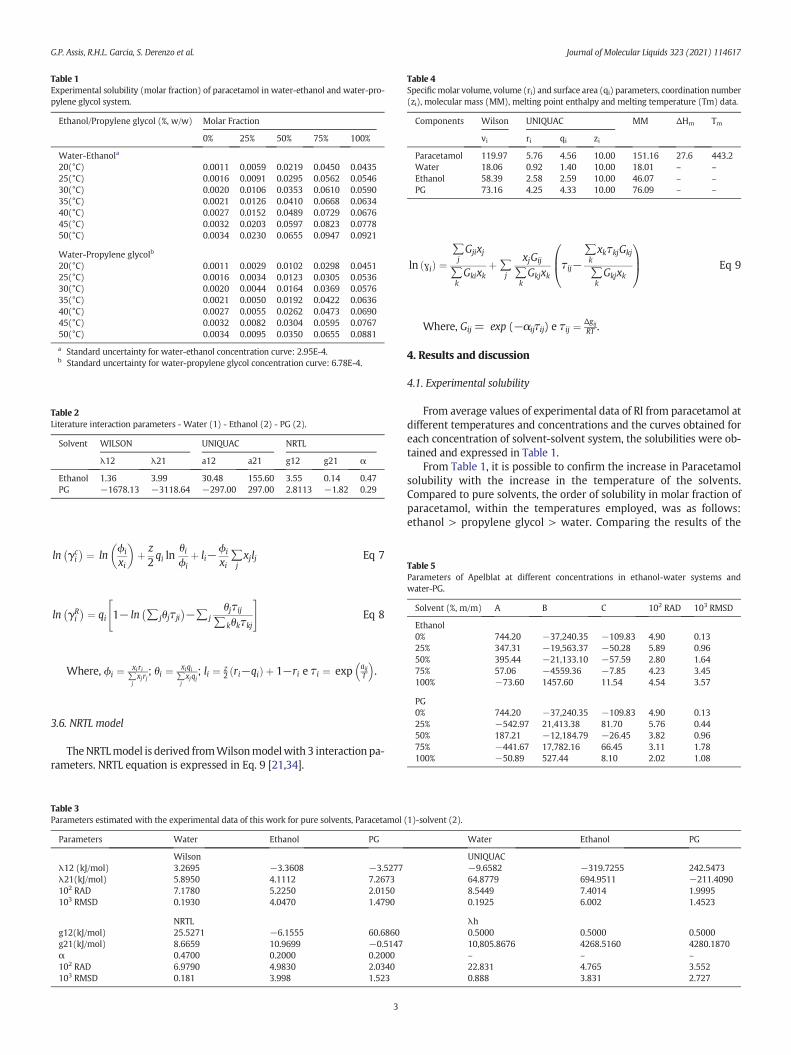
Table 1Experimental solubility (molar fraction) of paracetamol in water-ethanol and water-pro-pylene glycol system.
Ethanol/Propylene glycol (%, w/w) Molar Fraction
0% 25% 50% 75% 100%
Water-Ethanola
20(°C) 0.0011 0.0059 0.0219 0.0450 0.043525(°C) 0.0016 0.0091 0.0295 0.0562 0.054630(°C) 0.0020 0.0106 0.0353 0.0610 0.059035(°C) 0.0021 0.0126 0.0410 0.0668 0.063440(°C) 0.0027 0.0152 0.0489 0.0729 0.067645(°C) 0.0032 0.0203 0.0597 0.0823 0.077850(°C) 0.0034 0.0230 0.0655 0.0947 0.0921
Water-Propylene glycolb
20(°C) 0.0011 0.0029 0.0102 0.0298 0.045125(°C) 0.0016 0.0034 0.0123 0.0305 0.053630(°C) 0.0020 0.0044 0.0164 0.0369 0.057635(°C) 0.0021 0.0050 0.0192 0.0422 0.063640(°C) 0.0027 0.0055 0.0262 0.0473 0.069045(°C) 0.0032 0.0082 0.0304 0.0595 0.076750(°C) 0.0034 0.0095 0.0350 0.0655 0.0881
a Standard uncertainty for water-ethanol concentration curve: 2.95E-4.b Standard uncertainty for water-propylene glycol concentration curve: 6.78E-4.
Table 2Literature interaction parameters - Water (1) - Ethanol (2) - PG (2).
Solvent WILSON UNIQUAC NRTL
λ12 λ21 a12 a21 g12 g21 α
Ethanol 1.36 3.99 30.48 155.60 3.55 0.14 0.47PG −1678.13 −3118.64 −297.00 297.00 2.8113 −1.82 0.29
Table 4Specificmolar volume, volume (ri) and surface area (qi) parameters, coordination number(zi), molecular mass (MM), melting point enthalpy and melting temperature (Tm) data.
Components Wilson UNIQUAC MM ΔHm Tm
vi ri qi zi
Paracetamol 119.97 5.76 4.56 10.00 151.16 27.6 443.2Water 18.06 0.92 1.40 10.00 18.01 – –Ethanol 58.39 2.58 2.59 10.00 46.07 – –PG 73.16 4.25 4.33 10.00 76.09 – –
Table 5Parameters of Apelblat at different concentrations in ethanol-water systems andwater-PG.
Solvent (%, m/m) A B C 102 RAD 103 RMSD
Ethanol0% 744.20 −37,240.35 −109.83 4.90 0.1325% 347.31 −19,563.37 −50.28 5.89 0.9650% 395.44 −21,133.10 −57.59 2.80 1.6475% 57.06 −4559.36 −7.85 4.23 3.45100% −73.60 1457.60 11.54 4.54 3.57
G.P. Assis, R.H.L. Garcia, S. Derenzo et al. Journal of Molecular Liquids 323 (2021) 114617
ln γci
� � ¼ lnϕi
xi
� �þ z2qi ln
θiϕi
þ li−ϕi
xi∑jxjlj Eq 7
ln γRi
� � ¼ qi 1− ln ∑jθjτji� �
−∑jθjτij
∑kθkτkj
" #Eq 8
Where, ϕi ¼ xiri∑jxjrj
; θi ¼ xiqi∑jxjqj
; li ¼ z2 ri−qið Þ þ 1−ri e τi ¼ exp aij
T
� �.
PG0% 744.20 −37,240.35 −109.83 4.90 0.1325% −542.97 21,413.38 81.70 5.76 0.4450% 187.21 −12,184.79 −26.45 3.82 0.9675% −441.67 17,782.16 66.45 3.11 1.78100% −50.89 527.44 8.10 2.02 1.08
3.6. NRTL model
TheNRTLmodel is derived fromWilsonmodelwith 3 interaction pa-rameters. NRTL equation is expressed in Eq. 9 [21,34].
Table 3Parameters estimated with the experimental data of this work for pure solvents, Paracetamol
Parameters Water Ethanol PG
Wilsonλ12 (kJ/mol) 3.2695 −3.3608 −3.5277λ21(kJ/mol) 5.8950 4.1112 7.2673102 RAD 7.1780 5.2250 2.0150103 RMSD 0.1930 4.0470 1.4790
NRTLg12(kJ/mol) 25.5271 −6.1555 60.6860g21(kJ/mol) 8.6659 10.9699 −0.5147α 0.4700 0.2000 0.2000102 RAD 6.9790 4.9830 2.0340103 RMSD 0.181 3.998 1.523
3
ln ɣið Þ ¼∑jGjixj
∑kGkixk
þ∑j
xjGij
∑kGkjxk
τij−∑kxkτkjGkj
∑kGkjxk
0B@
1CA Eq 9
Where, Gij = exp (−αijτij) e τij ¼ ΔgijRT .
4. Results and discussion
4.1. Experimental solubility
From average values of experimental data of RI from paracetamol atdifferent temperatures and concentrations and the curves obtained foreach concentration of solvent-solvent system, the solubilities were ob-tained and expressed in Table 1.
From Table 1, it is possible to confirm the increase in Paracetamolsolubility with the increase in the temperature of the solvents.Compared to pure solvents, the order of solubility in molar fraction ofparacetamol, within the temperatures employed, was as follows:ethanol > propylene glycol > water. Comparing the results of the
(1)-solvent (2).
Water Ethanol PG
UNIQUAC−9.6582 −319.7255 242.547364.8779 694.9511 −211.40908.5449 7.4014 1.99950.1925 6.002 1.4523
λh0.5000 0.5000 0.500010,805.8676 4268.5160 4280.1870– – –22.831 4.765 3.5520.888 3.831 2.727
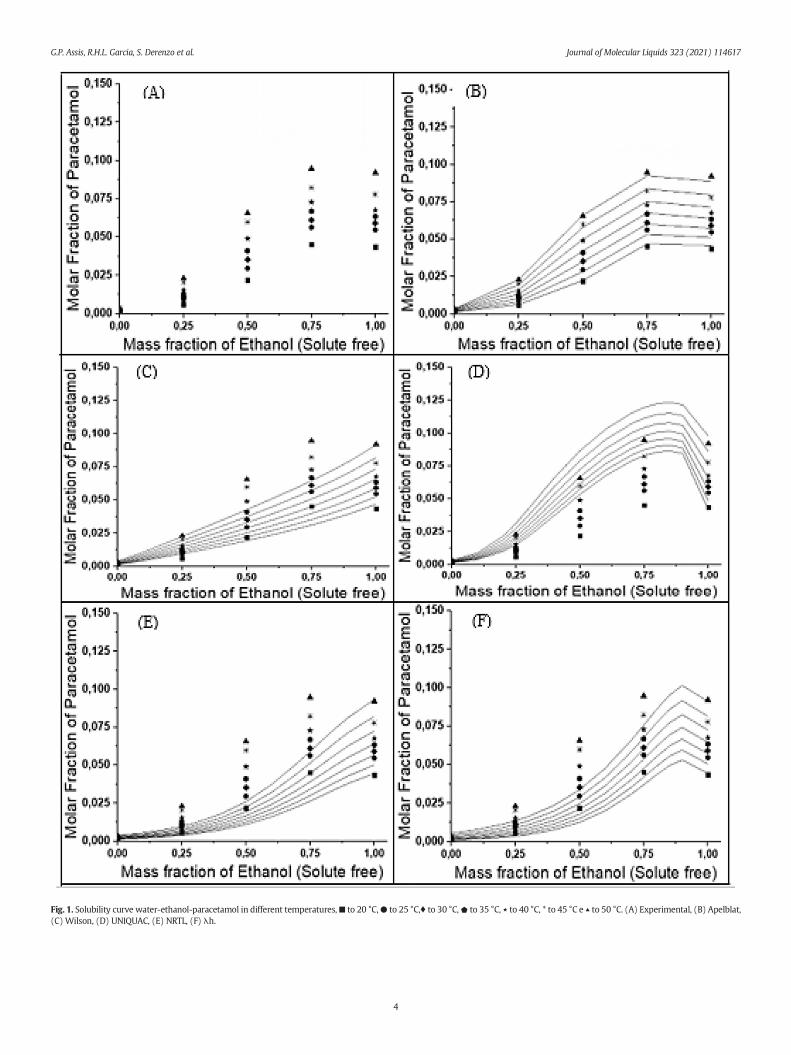
Fig. 1. Solubility curve water-ethanol-paracetamol in different temperatures,■ to 20 °C,● to 25 °C,♦ to 30 °C,⬟ to 35 °C, ⋆ to 40 °C, * to 45 °C e ▴ to 50 °C. (A) Experimental, (B) Apelblat,(C) Wilson, (D) UNIQUAC, (E) NRTL, (F) λh.
G.P. Assis, R.H.L. Garcia, S. Derenzo et al. Journal of Molecular Liquids 323 (2021) 114617
4
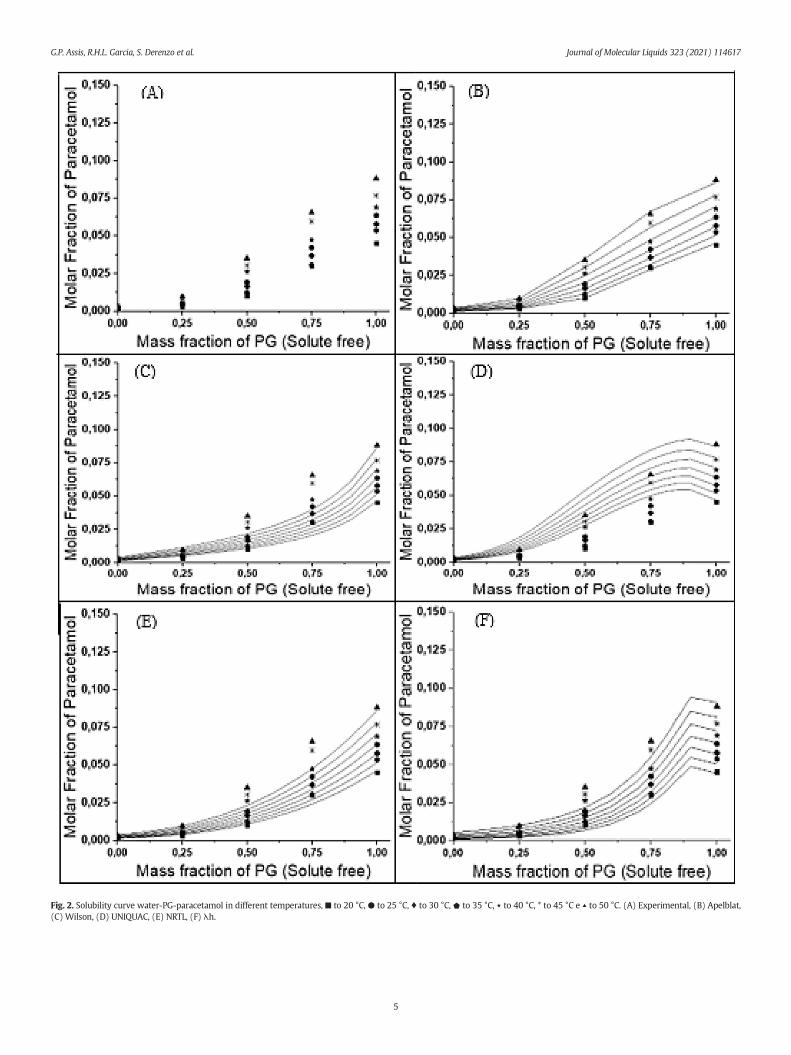
Fig. 2. Solubility curve water-PG-paracetamol in different temperatures, ■ to 20 °C, ● to 25 °C, ♦ to 30 °C, ⬟ to 35 °C, ⋆ to 40 °C, * to 45 °C e ▴ to 50 °C. (A) Experimental, (B) Apelblat,(C) Wilson, (D) UNIQUAC, (E) NRTL, (F) λh.
G.P. Assis, R.H.L. Garcia, S. Derenzo et al. Journal of Molecular Liquids 323 (2021) 114617
5
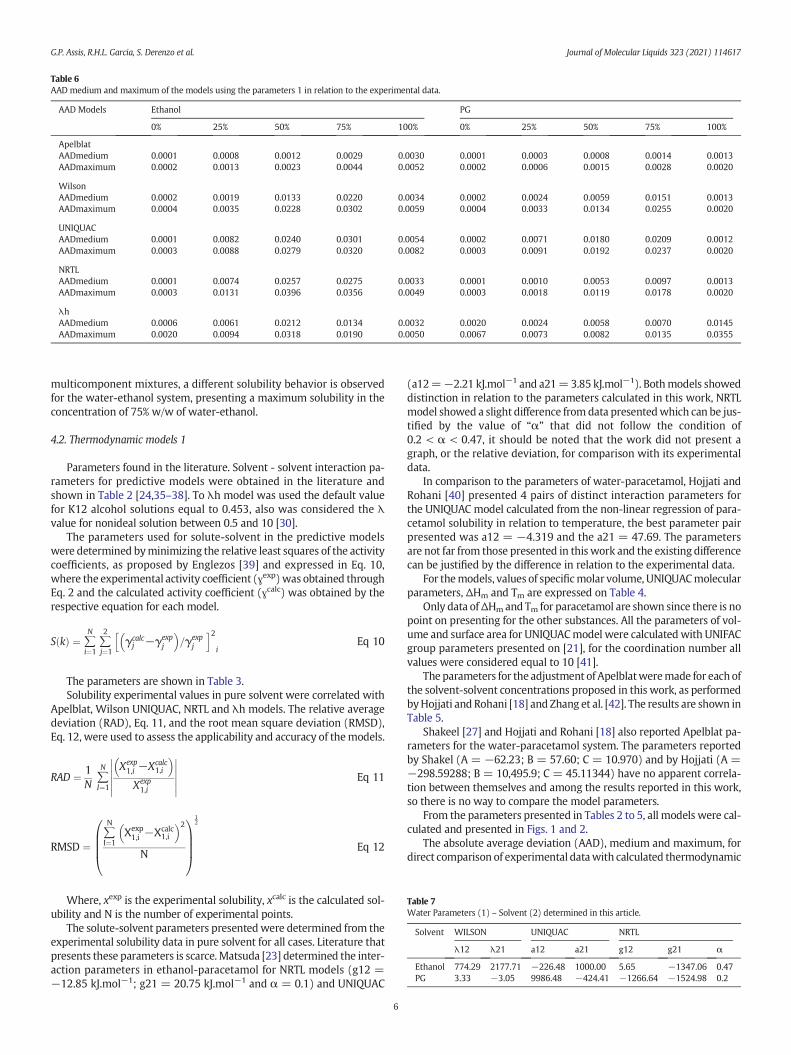
Table 6AAD medium and maximum of the models using the parameters 1 in relation to the experimental data.
AAD Models Ethanol PG
0% 25% 50% 75% 100% 0% 25% 50% 75% 100%
ApelblatAADmedium 0.0001 0.0008 0.0012 0.0029 0.0030 0.0001 0.0003 0.0008 0.0014 0.0013AADmaximum 0.0002 0.0013 0.0023 0.0044 0.0052 0.0002 0.0006 0.0015 0.0028 0.0020
WilsonAADmedium 0.0002 0.0019 0.0133 0.0220 0.0034 0.0002 0.0024 0.0059 0.0151 0.0013AADmaximum 0.0004 0.0035 0.0228 0.0302 0.0059 0.0004 0.0033 0.0134 0.0255 0.0020
UNIQUACAADmedium 0.0001 0.0082 0.0240 0.0301 0.0054 0.0002 0.0071 0.0180 0.0209 0.0012AADmaximum 0.0003 0.0088 0.0279 0.0320 0.0082 0.0003 0.0091 0.0192 0.0237 0.0020
NRTLAADmedium 0.0001 0.0074 0.0257 0.0275 0.0033 0.0001 0.0010 0.0053 0.0097 0.0013AADmaximum 0.0003 0.0131 0.0396 0.0356 0.0049 0.0003 0.0018 0.0119 0.0178 0.0020
λhAADmedium 0.0006 0.0061 0.0212 0.0134 0.0032 0.0020 0.0024 0.0058 0.0070 0.0145AADmaximum 0.0020 0.0094 0.0318 0.0190 0.0050 0.0067 0.0073 0.0082 0.0135 0.0355
Table 7Water Parameters (1) – Solvent (2) determined in this article.
Solvent WILSON UNIQUAC NRTL
λ12 λ21 a12 a21 g12 g21 α
Ethanol 774.29 2177.71 −226.48 1000.00 5.65 −1347.06 0.47PG 3.33 −3.05 9986.48 −424.41 −1266.64 −1524.98 0.2
G.P. Assis, R.H.L. Garcia, S. Derenzo et al. Journal of Molecular Liquids 323 (2021) 114617
multicomponent mixtures, a different solubility behavior is observedfor the water-ethanol system, presenting a maximum solubility in theconcentration of 75% w/w of water-ethanol.
4.2. Thermodynamic models 1
Parameters found in the literature. Solvent - solvent interaction pa-rameters for predictive models were obtained in the literature andshown in Table 2 [24,35–38]. To λh model was used the default valuefor K12 alcohol solutions equal to 0.453, also was considered the λvalue for nonideal solution between 0.5 and 10 [30].
The parameters used for solute-solvent in the predictive modelswere determined byminimizing the relative least squares of the activitycoefficients, as proposed by Englezos [39] and expressed in Eq. 10,where the experimental activity coefficient (ɣexp)was obtained throughEq. 2 and the calculated activity coefficient (ɣcalc) was obtained by therespective equation for each model.
S kð Þ ¼ ∑N
i¼1∑2
j¼1γcalcj −γexp
j
� �=γexp
j
h i2i
Eq 10
The parameters are shown in Table 3.Solubility experimental values in pure solvent were correlated with
Apelblat, Wilson UNIQUAC, NRTL and λh models. The relative averagedeviation (RAD), Eq. 11, and the root mean square deviation (RMSD),Eq. 12, were used to assess the applicability and accuracy of themodels.
RAD ¼ 1N
∑N
I¼1
Xexp1,i −Xcalc
1,i
� �Xexp1,i
Eq 11
RMSD ¼∑N
I¼1Xexp1,i −Xcalc
1,i
� �2N
0BBB@
1CCCA
12
Eq 12
Where, xexp is the experimental solubility, xcalc is the calculated sol-ubility and N is the number of experimental points.
The solute-solvent parameters presentedwere determined from theexperimental solubility data in pure solvent for all cases. Literature thatpresents these parameters is scarce.Matsuda [23] determined the inter-action parameters in ethanol-paracetamol for NRTL models (g12 =−12.85 kJ.mol−1; g21 = 20.75 kJ.mol−1 and α = 0.1) and UNIQUAC
6
(a12=−2.21 kJ.mol−1 and a21=3.85 kJ.mol−1). Bothmodels showeddistinction in relation to the parameters calculated in this work, NRTLmodel showed a slight difference fromdata presentedwhich can be jus-tified by the value of “α” that did not follow the condition of0.2 < α < 0.47, it should be noted that the work did not present agraph, or the relative deviation, for comparison with its experimentaldata.
In comparison to the parameters of water-paracetamol, Hojjati andRohani [40] presented 4 pairs of distinct interaction parameters forthe UNIQUAC model calculated from the non-linear regression of para-cetamol solubility in relation to temperature, the best parameter pairpresented was a12 = −4.319 and the a21 = 47.69. The parametersare not far from those presented in this work and the existing differencecan be justified by the difference in relation to the experimental data.
For themodels, values of specificmolar volume, UNIQUACmolecularparameters, ΔHm and Tm are expressed on Table 4.
Only data ofΔHmand Tm for paracetamol are shown since there is nopoint on presenting for the other substances. All the parameters of vol-ume and surface area for UNIQUACmodel were calculated with UNIFACgroup parameters presented on [21], for the coordination number allvalues were considered equal to 10 [41].
The parameters for the adjustment of Apelblatweremade for eachofthe solvent-solvent concentrations proposed in this work, as performedbyHojjati and Rohani [18] and Zhang et al. [42]. The results are shown inTable 5.
Shakeel [27] and Hojjati and Rohani [18] also reported Apelblat pa-rameters for the water-paracetamol system. The parameters reportedby Shakel (A = −62.23; B = 57.60; C = 10.970) and by Hojjati (A =−298.59288; B = 10,495.9; C = 45.11344) have no apparent correla-tion between themselves and among the results reported in this work,so there is no way to compare the model parameters.
From the parameters presented in Tables 2 to 5, all models were cal-culated and presented in Figs. 1 and 2.
The absolute average deviation (AAD), medium and maximum, fordirect comparison of experimental datawith calculated thermodynamic
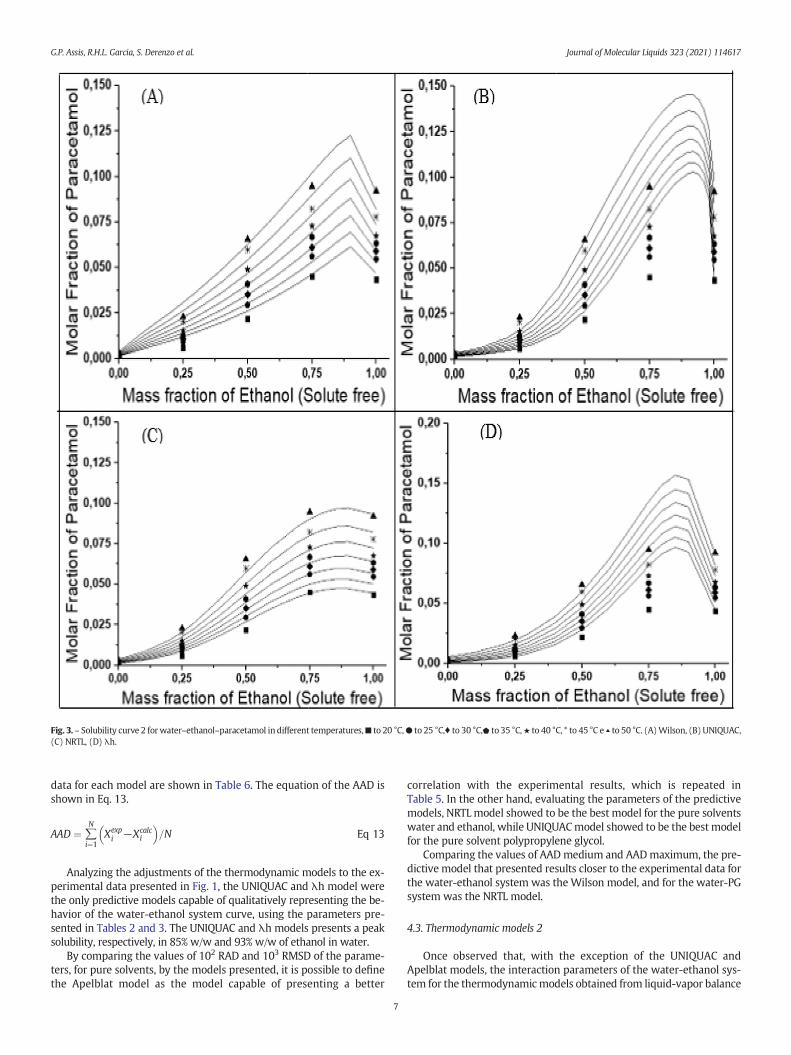
Fig. 3. – Solubility curve 2 for water–ethanol–paracetamol in different temperatures,■ to 20 °C,● to 25 °C,♦ to 30 °C,⬟ to 35 °C,★ to 40 °C, * to 45 °C e ▴ to 50 °C. (A)Wilson, (B) UNIQUAC,(C) NRTL, (D) λh.
G.P. Assis, R.H.L. Garcia, S. Derenzo et al. Journal of Molecular Liquids 323 (2021) 114617
data for each model are shown in Table 6. The equation of the AAD isshown in Eq. 13.
AAD ¼ ∑N
i¼1Xexpi −Xcalc
i
� �=N Eq 13
Analyzing the adjustments of the thermodynamic models to the ex-perimental data presented in Fig. 1, the UNIQUAC and λh model werethe only predictive models capable of qualitatively representing the be-havior of the water-ethanol system curve, using the parameters pre-sented in Tables 2 and 3. The UNIQUAC and λh models presents a peaksolubility, respectively, in 85% w/w and 93% w/w of ethanol in water.
By comparing the values of 102 RAD and 103 RMSD of the parame-ters, for pure solvents, by the models presented, it is possible to definethe Apelblat model as the model capable of presenting a better
7
correlation with the experimental results, which is repeated inTable 5. In the other hand, evaluating the parameters of the predictivemodels, NRTL model showed to be the best model for the pure solventswater and ethanol, while UNIQUACmodel showed to be the best modelfor the pure solvent polypropylene glycol.
Comparing the values of AAD medium and AADmaximum, the pre-dictive model that presented results closer to the experimental data forthe water-ethanol system was theWilson model, and for the water-PGsystem was the NRTL model.
4.3. Thermodynamic models 2
Once observed that, with the exception of the UNIQUAC andApelblat models, the interaction parameters of the water-ethanol sys-tem for the thermodynamicmodels obtained from liquid-vapor balance
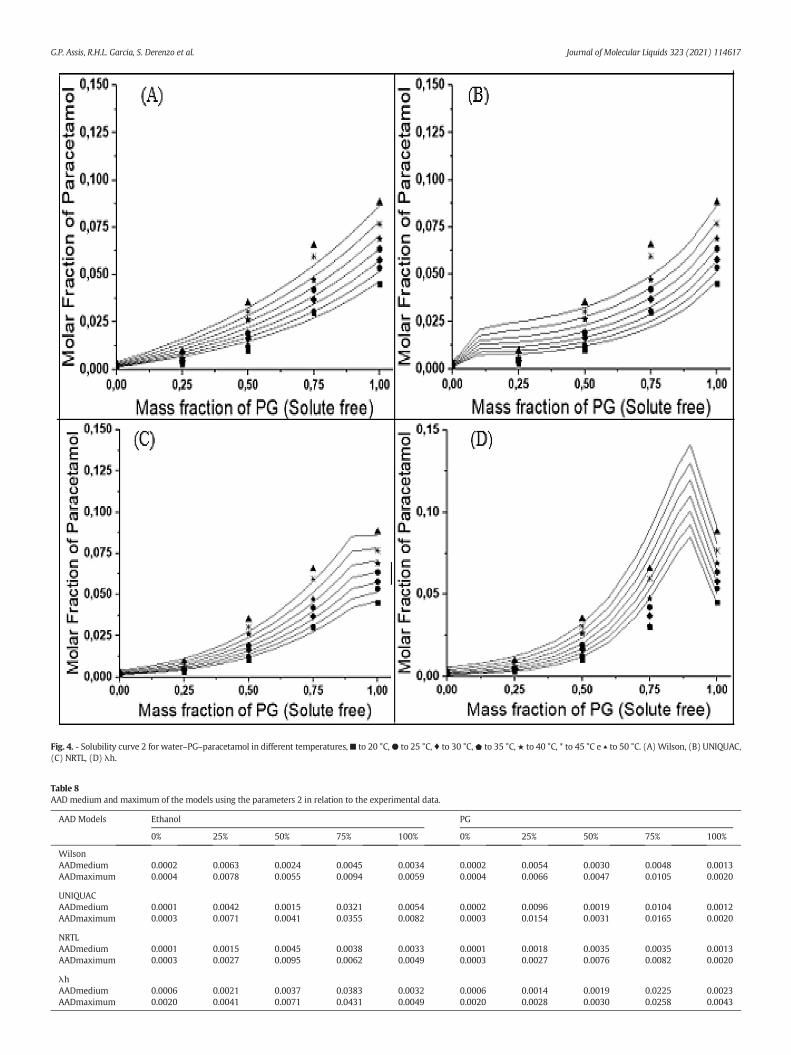
Fig. 4. - Solubility curve 2 for water–PG–paracetamol in different temperatures, ■ to 20 °C,● to 25 °C, ♦ to 30 °C,⬟ to 35 °C, ★ to 40 °C, * to 45 °C e ▴ to 50 °C. (A) Wilson, (B) UNIQUAC,(C) NRTL, (D) λh.
Table 8AAD medium and maximum of the models using the parameters 2 in relation to the experimental data.
AAD Models Ethanol PG
0% 25% 50% 75% 100% 0% 25% 50% 75% 100%
WilsonAADmedium 0.0002 0.0063 0.0024 0.0045 0.0034 0.0002 0.0054 0.0030 0.0048 0.0013AADmaximum 0.0004 0.0078 0.0055 0.0094 0.0059 0.0004 0.0066 0.0047 0.0105 0.0020
UNIQUACAADmedium 0.0001 0.0042 0.0015 0.0321 0.0054 0.0002 0.0096 0.0019 0.0104 0.0012AADmaximum 0.0003 0.0071 0.0041 0.0355 0.0082 0.0003 0.0154 0.0031 0.0165 0.0020
NRTLAADmedium 0.0001 0.0015 0.0045 0.0038 0.0033 0.0001 0.0018 0.0035 0.0035 0.0013AADmaximum 0.0003 0.0027 0.0095 0.0062 0.0049 0.0003 0.0027 0.0076 0.0082 0.0020
λhAADmedium 0.0006 0.0021 0.0037 0.0383 0.0032 0.0006 0.0014 0.0019 0.0225 0.0023AADmaximum 0.0020 0.0041 0.0071 0.0431 0.0049 0.0020 0.0028 0.0030 0.0258 0.0043
G.P. Assis, R.H.L. Garcia, S. Derenzo et al. Journal of Molecular Liquids 323 (2021) 114617
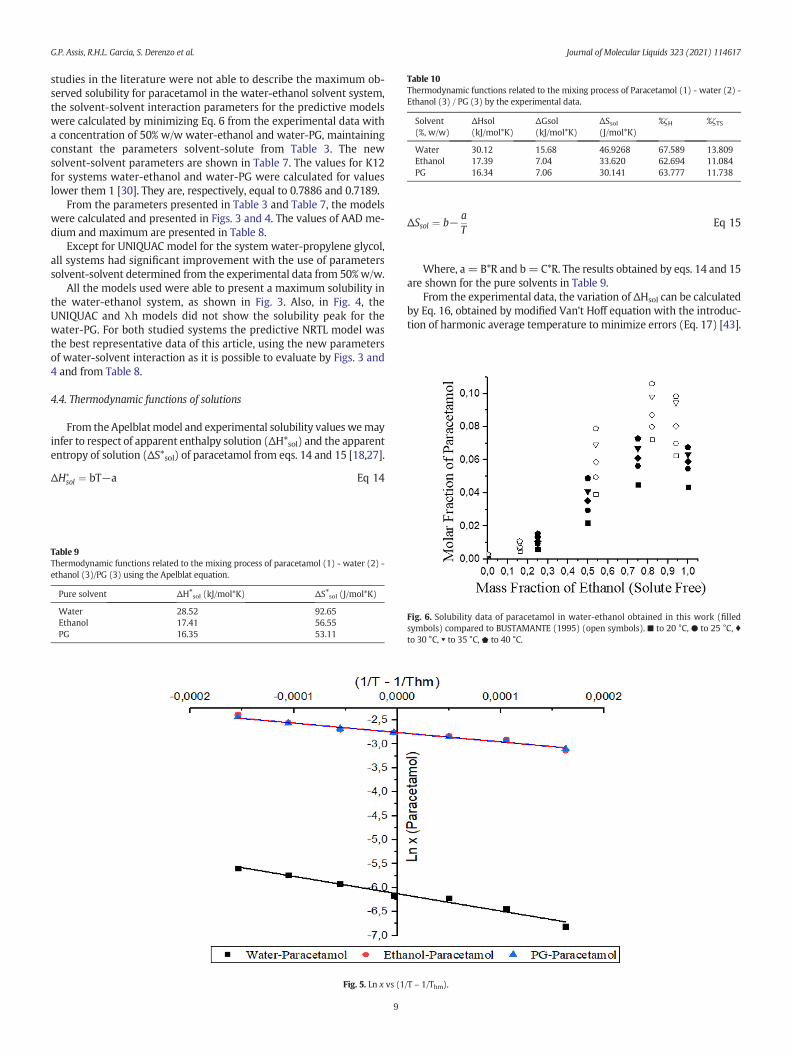
Table 10Thermodynamic functions related to the mixing process of Paracetamol (1) - water (2) -Ethanol (3) / PG (3) by the experimental data.
Solvent(%, w/w)
ΔHsol(kJ/mol*K)
ΔGsol(kJ/mol*K)
ΔSsol(J/mol*K)
%ζH %ζTS
Water 30.12 15.68 46.9268 67.589 13.809Ethanol 17.39 7.04 33.620 62.694 11.084PG 16.34 7.06 30.141 63.777 11.738
G.P. Assis, R.H.L. Garcia, S. Derenzo et al. Journal of Molecular Liquids 323 (2021) 114617
studies in the literature were not able to describe the maximum ob-served solubility for paracetamol in the water-ethanol solvent system,the solvent-solvent interaction parameters for the predictive modelswere calculated by minimizing Eq. 6 from the experimental data witha concentration of 50% w/w water-ethanol and water-PG, maintainingconstant the parameters solvent-solute from Table 3. The newsolvent-solvent parameters are shown in Table 7. The values for K12for systems water-ethanol and water-PG were calculated for valueslower them 1 [30]. They are, respectively, equal to 0.7886 and 0.7189.
From the parameters presented in Table 3 and Table 7, the modelswere calculated and presented in Figs. 3 and 4. The values of AAD me-dium and maximum are presented in Table 8.
Except for UNIQUAC model for the system water-propylene glycol,all systems had significant improvement with the use of parameterssolvent-solvent determined from the experimental data from 50%w/w.
All the models used were able to present a maximum solubility inthe water-ethanol system, as shown in Fig. 3. Also, in Fig. 4, theUNIQUAC and λh models did not show the solubility peak for thewater-PG. For both studied systems the predictive NRTL model wasthe best representative data of this article, using the new parametersof water-solvent interaction as it is possible to evaluate by Figs. 3 and4 and from Table 8.
4.4. Thermodynamic functions of solutions
From the Apelblatmodel and experimental solubility values wemayinfer to respect of apparent enthalpy solution (ΔH*sol) and the apparententropy of solution (ΔS*sol) of paracetamol from eqs. 14 and 15 [18,27].
ΔH∗sol ¼ bT−a Eq 14
Table 9Thermodynamic functions related to the mixing process of paracetamol (1) - water (2) -ethanol (3)/PG (3) using the Apelblat equation.
Pure solvent ΔH⁎sol (kJ/mol*K) ΔS⁎sol (J/mol*K)
Water 28.52 92.65Ethanol 17.41 56.55PG 16.35 53.11
Fig. 5. Ln x vs (1
9
ΔSsol ¼ b−aT
Eq 15
Where, a= B*R and b= C*R. The results obtained by eqs. 14 and 15are shown for the pure solvents in Table 9.
From the experimental data, the variation of ΔHsol can be calculatedby Eq. 16, obtained by modified Van't Hoff equation with the introduc-tion of harmonic average temperature to minimize errors (Eq. 17) [43].
/T – 1/Thm).
Fig. 6. Solubility data of paracetamol in water-ethanol obtained in this work (filledsymbols) compared to BUSTAMANTE (1995) (open symbols). ■ to 20 °C, ● to 25 °C, ♦to 30 °C, ▾ to 35 °C, ⬟ to 40 °C.
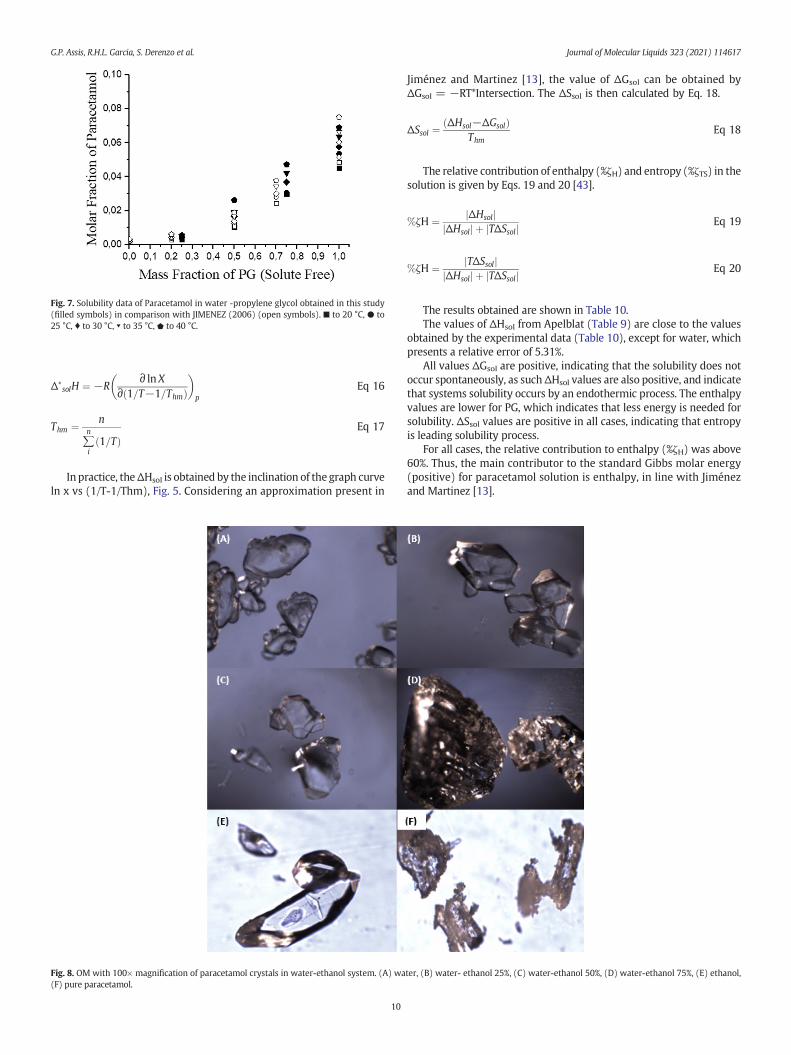
Fig. 7. Solubility data of Paracetamol in water -propylene glycol obtained in this study(filled symbols) in comparison with JIMENEZ (2006) (open symbols). ■ to 20 °C, ● to25 °C, ♦ to 30 °C, ▾ to 35 °C,⬟ to 40 °C.
G.P. Assis, R.H.L. Garcia, S. Derenzo et al. Journal of Molecular Liquids 323 (2021) 114617
Δ∗solH ¼ −R
∂ lnX∂ 1=T−1=Thmð Þ� �
pEq 16
Thm ¼ n
∑n
i1=Tð Þ
Eq 17
In practice, theΔHsol is obtained by the inclination of the graph curveln x vs (1/T-1/Thm), Fig. 5. Considering an approximation present in
Fig. 8. OM with 100× magnification of paracetamol crystals in water-ethanol system. (A) wa(F) pure paracetamol.
10
Jiménez and Martinez [13], the value of ΔGsol can be obtained byΔGsol = −RT*Intersection. The ΔSsol is then calculated by Eq. 18.
ΔSsol ¼ΔHsol−ΔGsolð Þ
ThmEq 18
The relative contribution of enthalpy (%ζH) and entropy (%ζTS) in thesolution is given by Eqs. 19 and 20 [43].
%ζH ¼ ΔHsolj jΔHsolj j þ TΔSsolj j Eq 19
%ζH ¼ TΔSsolj jΔHsolj j þ TΔSsolj j Eq 20
The results obtained are shown in Table 10.The values of ΔHsol from Apelblat (Table 9) are close to the values
obtained by the experimental data (Table 10), except for water, whichpresents a relative error of 5.31%.
All values ΔGsol are positive, indicating that the solubility does notoccur spontaneously, as suchΔHsol values are also positive, and indicatethat systems solubility occurs by an endothermic process. The enthalpyvalues are lower for PG, which indicates that less energy is needed forsolubility. ΔSsol values are positive in all cases, indicating that entropyis leading solubility process.
For all cases, the relative contribution to enthalpy (%ζH) was above60%. Thus, the main contributor to the standard Gibbs molar energy(positive) for paracetamol solution is enthalpy, in line with Jiménezand Martinez [13].
ter, (B) water- ethanol 25%, (C) water-ethanol 50%, (D) water-ethanol 75%, (E) ethanol,
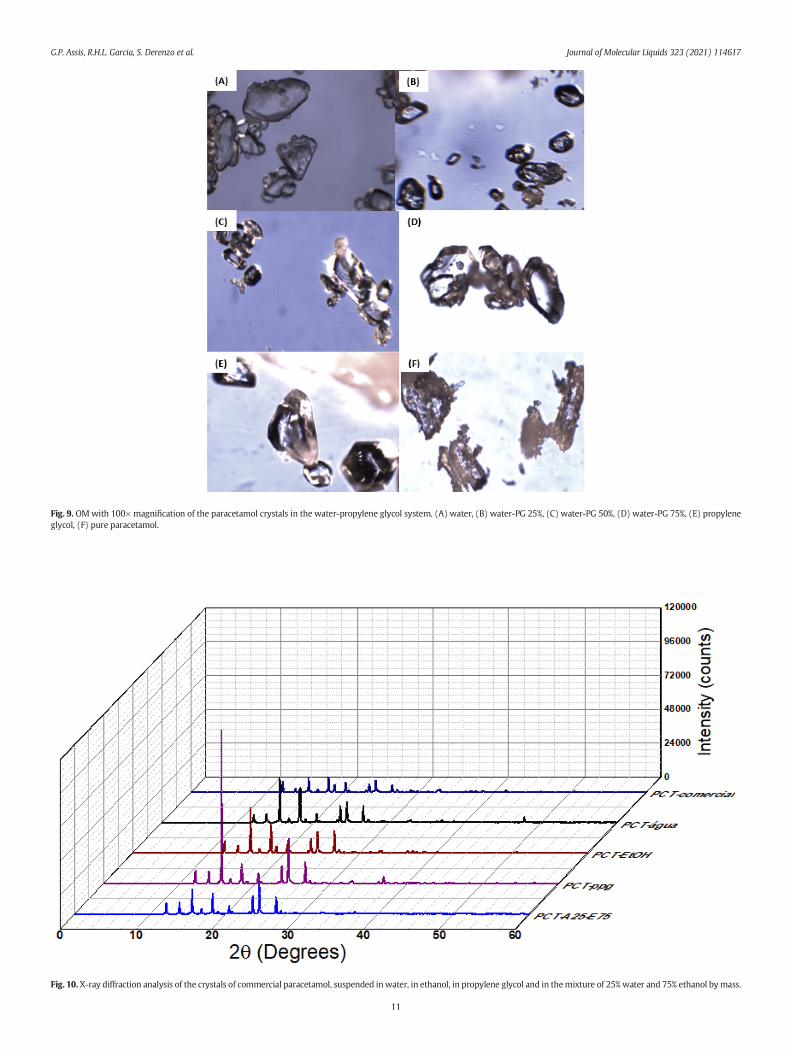
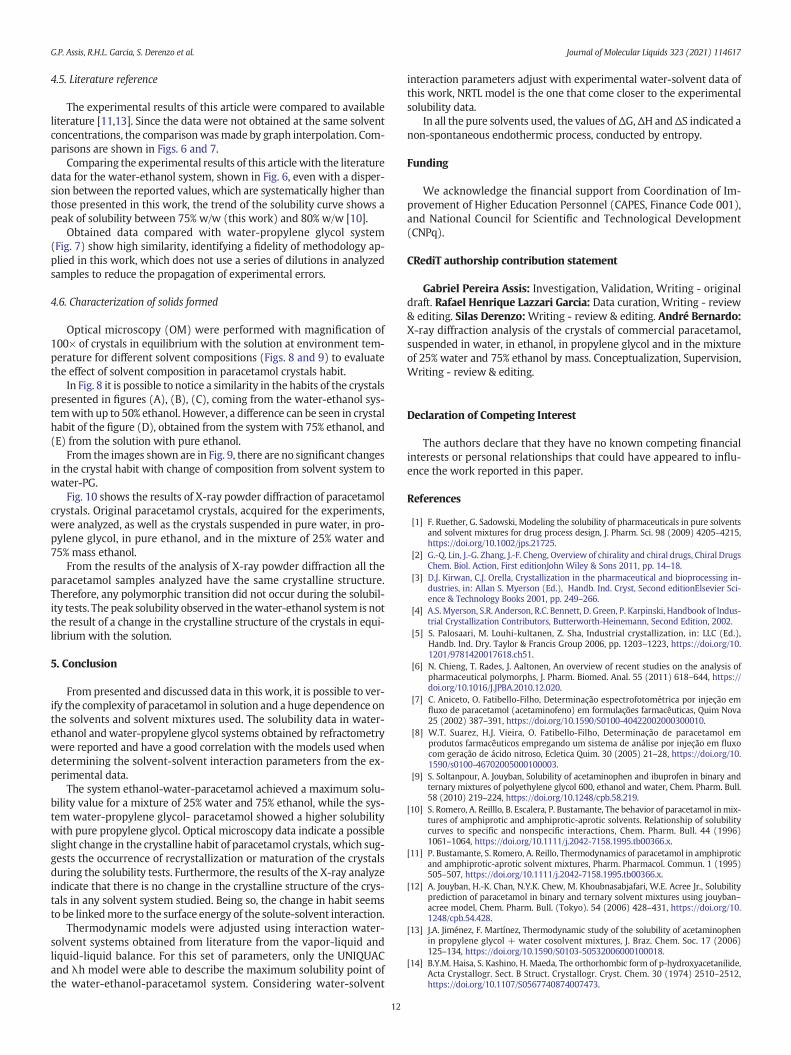
Fig. 9. OMwith 100× magnification of the paracetamol crystals in the water-propylene glycol system. (A) water, (B) water-PG 25%, (C) water-PG 50%, (D) water-PG 75%, (E) propyleneglycol, (F) pure paracetamol.
Fig. 10. X-ray diffraction analysis of the crystals of commercial paracetamol, suspended inwater, in ethanol, in propylene glycol and in themixture of 25%water and 75% ethanol bymass.
G.P. Assis, R.H.L. Garcia, S. Derenzo et al. Journal of Molecular Liquids 323 (2021) 114617
11
G.P. Assis, R.H.L. Garcia, S. Derenzo et al. Journal of Molecular Liquids 323 (2021) 114617
4.5. Literature reference
The experimental results of this article were compared to availableliterature [11,13]. Since the data were not obtained at the same solventconcentrations, the comparisonwasmade by graph interpolation. Com-parisons are shown in Figs. 6 and 7.
Comparing the experimental results of this article with the literaturedata for the water-ethanol system, shown in Fig. 6, even with a disper-sion between the reported values, which are systematically higher thanthose presented in this work, the trend of the solubility curve shows apeak of solubility between 75% w/w (this work) and 80% w/w [10].
Obtained data compared with water-propylene glycol system(Fig. 7) show high similarity, identifying a fidelity of methodology ap-plied in this work, which does not use a series of dilutions in analyzedsamples to reduce the propagation of experimental errors.
4.6. Characterization of solids formed
Optical microscopy (OM) were performed with magnification of100× of crystals in equilibrium with the solution at environment tem-perature for different solvent compositions (Figs. 8 and 9) to evaluatethe effect of solvent composition in paracetamol crystals habit.
In Fig. 8 it is possible to notice a similarity in the habits of the crystalspresented in figures (A), (B), (C), coming from the water-ethanol sys-temwith up to 50% ethanol. However, a difference can be seen in crystalhabit of the figure (D), obtained from the systemwith 75% ethanol, and(E) from the solution with pure ethanol.
From the images shown are in Fig. 9, there are no significant changesin the crystal habit with change of composition from solvent system towater-PG.
Fig. 10 shows the results of X-ray powder diffraction of paracetamolcrystals. Original paracetamol crystals, acquired for the experiments,were analyzed, as well as the crystals suspended in pure water, in pro-pylene glycol, in pure ethanol, and in the mixture of 25% water and75% mass ethanol.
From the results of the analysis of X-ray powder diffraction all theparacetamol samples analyzed have the same crystalline structure.Therefore, any polymorphic transition did not occur during the solubil-ity tests. The peak solubility observed in thewater-ethanol system is notthe result of a change in the crystalline structure of the crystals in equi-librium with the solution.
5. Conclusion
From presented and discussed data in this work, it is possible to ver-ify the complexity of paracetamol in solution and a huge dependence onthe solvents and solvent mixtures used. The solubility data in water-ethanol andwater-propylene glycol systems obtained by refractometrywere reported and have a good correlation with the models used whendetermining the solvent-solvent interaction parameters from the ex-perimental data.
The system ethanol-water-paracetamol achieved a maximum solu-bility value for a mixture of 25% water and 75% ethanol, while the sys-tem water-propylene glycol- paracetamol showed a higher solubilitywith pure propylene glycol. Optical microscopy data indicate a possibleslight change in the crystalline habit of paracetamol crystals, which sug-gests the occurrence of recrystallization or maturation of the crystalsduring the solubility tests. Furthermore, the results of the X-ray analyzeindicate that there is no change in the crystalline structure of the crys-tals in any solvent system studied. Being so, the change in habit seemsto be linkedmore to the surface energy of the solute-solvent interaction.
Thermodynamic models were adjusted using interaction water-solvent systems obtained from literature from the vapor-liquid andliquid-liquid balance. For this set of parameters, only the UNIQUACand λh model were able to describe the maximum solubility point ofthe water-ethanol-paracetamol system. Considering water-solvent
12
interaction parameters adjust with experimental water-solvent data ofthis work, NRTL model is the one that come closer to the experimentalsolubility data.
In all the pure solvents used, the values ofΔG,ΔH andΔS indicated anon-spontaneous endothermic process, conducted by entropy.
Funding
We acknowledge the financial support from Coordination of Im-provement of Higher Education Personnel (CAPES, Finance Code 001),and National Council for Scientific and Technological Development(CNPq).
CRediT authorship contribution statement
Gabriel Pereira Assis: Investigation, Validation, Writing - originaldraft. Rafael Henrique Lazzari Garcia: Data curation, Writing - review& editing. Silas Derenzo: Writing - review & editing. André Bernardo:X-ray diffraction analysis of the crystals of commercial paracetamol,suspended in water, in ethanol, in propylene glycol and in the mixtureof 25% water and 75% ethanol by mass. Conceptualization, Supervision,Writing - review & editing.
Declaration of Competing Interest
The authors declare that they have no known competing financialinterests or personal relationships that could have appeared to influ-ence the work reported in this paper.
References
[1] F. Ruether, G. Sadowski, Modeling the solubility of pharmaceuticals in pure solventsand solvent mixtures for drug process design, J. Pharm. Sci. 98 (2009) 4205–4215,https://doi.org/10.1002/jps.21725.
[2] G.-Q. Lin, J.-G. Zhang, J.-F. Cheng, Overview of chirality and chiral drugs, Chiral DrugsChem. Biol. Action, First editionJohn Wiley & Sons 2011, pp. 14–18.
[3] D.J. Kirwan, C.J. Orella, Crystallization in the pharmaceutical and bioprocessing in-dustries, in: Allan S. Myerson (Ed.), Handb. Ind. Cryst, Second editionElsevier Sci-ence & Technology Books 2001, pp. 249–266.
[4] A.S. Myerson, S.R. Anderson, R.C. Bennett, D. Green, P. Karpinski, Handbook of Indus-trial Crystallization Contributors, Butterworth-Heinemann, Second Edition, 2002.
[5] S. Palosaari, M. Louhi-kultanen, Z. Sha, Industrial crystallization, in: LLC (Ed.),Handb. Ind. Dry. Taylor & Francis Group 2006, pp. 1203–1223, https://doi.org/10.1201/9781420017618.ch51.
[6] N. Chieng, T. Rades, J. Aaltonen, An overview of recent studies on the analysis ofpharmaceutical polymorphs, J. Pharm. Biomed. Anal. 55 (2011) 618–644, https://doi.org/10.1016/J.JPBA.2010.12.020.
[7] C. Aniceto, O. Fatibello-Filho, Determinação espectrofotométrica por injeção emfluxo de paracetamol (acetaminofeno) em formulações farmacêuticas, Quim Nova25 (2002) 387–391, https://doi.org/10.1590/S0100-40422002000300010.
[8] W.T. Suarez, H.J. Vieira, O. Fatibello-Filho, Determinação de paracetamol emprodutos farmacêuticos empregando um sistema de análise por injeção em fluxocom geração de ácido nitroso, Ecletica Quim. 30 (2005) 21–28, https://doi.org/10.1590/s0100-46702005000100003.
[9] S. Soltanpour, A. Jouyban, Solubility of acetaminophen and ibuprofen in binary andternary mixtures of polyethylene glycol 600, ethanol and water, Chem. Pharm. Bull.58 (2010) 219–224, https://doi.org/10.1248/cpb.58.219.
[10] S. Romero, A. Reilllo, B. Escalera, P. Bustamante, The behavior of paracetamol inmix-tures of amphiprotic and amphiprotic-aprotic solvents. Relationship of solubilitycurves to specific and nonspecific interactions, Chem. Pharm. Bull. 44 (1996)1061–1064, https://doi.org/10.1111/j.2042-7158.1995.tb00366.x.
[11] P. Bustamante, S. Romero, A. Reillo, Thermodynamics of paracetamol in amphiproticand amphiprotic-aprotic solvent mixtures, Pharm. Pharmacol. Commun. 1 (1995)505–507, https://doi.org/10.1111/j.2042-7158.1995.tb00366.x.
[12] A. Jouyban, H.-K. Chan, N.Y.K. Chew, M. Khoubnasabjafari, W.E. Acree Jr., Solubilityprediction of paracetamol in binary and ternary solvent mixtures using jouyban–acree model, Chem. Pharm. Bull. (Tokyo). 54 (2006) 428–431, https://doi.org/10.1248/cpb.54.428.
[13] J.A. Jiménez, F. Martínez, Thermodynamic study of the solubility of acetaminophenin propylene glycol + water cosolvent mixtures, J. Braz. Chem. Soc. 17 (2006)125–134, https://doi.org/10.1590/S0103-50532006000100018.
[14] B.Y.M. Haisa, S. Kashino, H. Maeda, The orthorhombic form of p-hydroxyacetanilide,Acta Crystallogr. Sect. B Struct. Crystallogr. Cryst. Chem. 30 (1974) 2510–2512,https://doi.org/10.1107/S0567740874007473.
G.P. Assis, R.H.L. Garcia, S. Derenzo et al. Journal of Molecular Liquids 323 (2021) 114617
[15] M. HAISA, S. KASHINO, R. KAWAI, H. MAEDA, The monoclinic form of p-hydroxyacetanilide, Acta Crystallogr. Sect. B Struct. Crystallogr. Cryst. Chem. 32(1976) 1283–1285, https://doi.org/10.1107/S0567740876012223.
[16] G. Nichols, C.S. Frampton, Physicochemical characterization of the orthorhombicpolymorph of paracetamol crystallized from solution, J. Pharm. Sci. 87 (1998)684–693, https://doi.org/10.1021/js970483d.
[17] P. Espeau, R. Céolin, J.L. Tamarit, M.A. Perrin, J.P. Gauchi, F. Leveiller, Polymorphismof paracetamol: relative stabilities of the monoclinic and orthorhombic phases in-ferred from topological pressure-temperature and temperature-volume phase dia-grams, J. Pharm. Sci. 94 (2005) 524–539, https://doi.org/10.1002/jps.20261.
[18] H. Hojjati, S. Rohani, Measurement and prediction of solubility of paracetamol inwater - isopropanol solution. Part 1 . Measurement and data analysis, Org. Process.Res. Dev. 10 (2006) 1101–1109, https://doi.org/10.1021/op060073o.
[19] J. Ouyang, Y. Zhang, B. Na, Z. Liu, L. Zhou, H. Hao, Solubility determination of nicotin-amide and its application for the cocrystallization with benzoic acid, J. Chem. Eng.Data 63 (2018) 4157–4165, https://doi.org/10.1021/acs.jced.8b00560.
[20] S. BALUJA, R. TALAVIYA, Experimental determination of solubility of derivatives inorganic solvents at different temperatures: interactions and thermodynamic param-eters relating to the solvation process, J. Mol. Liq. 223 (2016) 436–447, https://doi.org/10.1016/j.molliq.2016.08.074.
[21] B.E. Poling, M. Prausnitz, J.P. O’CONNEL, The Properties of Gases and Liquids, Fifthedition McGraw-Hill, 2000.
[22] A. Lancia, D. Musmarra, F. Pepe, Vapor-liquid equilibria for mixtures of ethylene gly-col, propylene glycol, and water between 98 and 122°C, J. Chem. Eng. Japan 29(1996) 449–455, https://doi.org/10.1252/jcej.29.449.
[23] H. Matsuda, K. Mori, M. Tomioka, N. Kariyasu, T. Fukami, K. Kurihara, K. Tochigi, K.Tomono, Determination and prediction of solubilities of active pharmaceutical in-gredients in selected organic solvents, Fluid Phase Equilib. 406 (2015) 116–123,https://doi.org/10.1016/j.fluid.2015.07.032.
[24] S. Jónsdóttir, K. Rasmussen, A. Fredenslund, UNIQUAC parameters determined bymolecular mechanics, Fluid Phase Equilib. 100 (1994) 121–138, https://doi.org/10.1016/0378-3812(94)80005-7.
[25] M. Herrmann, U. Förter-Barth, P.B. Kempa, H. Kröber, Particle characterization by X-ray powder diffraction, Chem. Eng. Technol. 32 (2009) 1067–1072, https://doi.org/10.1002/ceat.200900069.
[26] C.E. Crestani, A. Bernardo, C.B.B. Costa, M. Giulietti, Fructose solubility inmixed (eth-anol+water) solvent: experimental data and comparison among different thermo-dynamic models, J. Chem. Eng. Data 58 (2013) 3039–3045, https://doi.org/10.1021/je400471m.
[27] F. Shakeel, F.K. Alanazi, I.A. Alsarra, N. Haq, Solubilization behavior of paracetamol intranscutol− water mixtures at (298. 15 to 333. 15)K, J. Chem. Eng. Data 58 (2013)3551–3556, https://doi.org/10.1021/je4008525.
[28] A. APELBLAT, E. MANZUROLA, Solubilities of o -acetylsalicylic , aspartate in waterfrom T = (278 to 348) K, J. Chem. Thermodyn. 31 (1999) 85–91.
13
[29] H. Buchowski, A. Ksiazczak, S. Pietrzyk, Solvent activity along a saturation line andsolubility of hydrogen-bonding solids, J. Phys. Chem. 84 (1980) 975–979, https://doi.org/10.1021/j100446a008.
[30] J.Q. Zhu, Y.S. Yu, C.H. He, Calculation of solid’s solubilities inmixed liquid solvents bythe λh equation using mixing rules, Fluid Phase Equilib. 155 (1999) 85–94, https://doi.org/10.1016/S0378-3812(98)00445-2.
[31] H. Wu, L. Dang, H. Wei, Solid−liquid phase equilibrium of nicotinamide in differentpure solvents : measurements and thermodynamic modeling, Ind. Eng. Chem. Res.53 (2014) 1707–1711, https://doi.org/10.1021/ie403628d.
[32] R.V. Orye, J.M. Prausnitz, Multicomponent equilibria: with theWilson equation, Ind.Eng. Chem. 57 (1965) 18–26, https://doi.org/10.1021/ie50665a005.
[33] A.M. Peres, Thermodynamic properties of sugars in aqueous solutions: correlationand prediction using a modified UNIQUAC model, Fluid Phase Equilib. 123 (1996)71–95, https://doi.org/10.1016/S0378-3812(96)90013-8.
[34] J.M. Prausnitz, R.N. Lichtenthaler, E.G. Azevedo, Molecular Thermodynamics ofFluid-Phase Equilibria, Third edition Pearson Education, 1998 https://doi.org/10.1016/0378-3812(87)80022-5.
[35] J. Gmehling, U. Onken, Vapor-Liguid Equilibrium Data Collection, Chemistry Data Se-ries, Second, DECHEMA, 1991.
[36] M.H. Wang, A.N. Soriano, A.R. Caparanga, M.H. Li, Binarymutual diffusion coefficientof aqueous solutions of propylene glycol and dipropylene glycol, J. Taiwan Inst.Chem. Eng. 41 (2010) 279–285, https://doi.org/10.1016/j.jtice.2009.09.001.
[37] S.Ó. Jónsdóttir, R.A. Klein, UNIQUAC interaction parameters for molecules with -OHgroups on adjacent carbon atoms in aqueous solution determined bymolecular me-chanics - glycols, glycerol and glucose, Fluid Phase Equilib. 132 (1997) 117–137,https://doi.org/10.1016/s0378-3812(97)00017-4.
[38] I. Nagata, Modification of the extended UNIQUAC model for ternary and quaternaryliquid- liquid equilibrium calculations, Fluid Phase Equilib. 51 (1989) 53–70, https://doi.org/10.1016/0378-3812(89)80354-1.
[39] P. Englezos, N. Kalogerakis, Applied Parameter Estimation for Chemical Engi-neers, MARCEL DEKKER, INC., New York, 2001 https://doi.org/10.1017/CBO9781107415324.004.
[40] H. Hojjati, S. Rohani, Measurement and prediction of solubility of paracetamol inwater-isopropanol solution. Part 2. Prediction, Org. Process. Res. Dev. 10 (2006)2–10, https://doi.org/10.1021/op060074g.
[41] D.S. ABRAMS, J.M. PRAUSNITZ, Statistical thermodynamics of liquidmixtures: a newexpression for the excess Gibbs energy of partly or completely miscible systems,AICHE J. 21 (1975) 116–128, https://doi.org/10.1002/aic.690210115.
[42] J. Zhang, Y. Wang, G. Wang, H. Hao, H. Wang, Q. Luan, C. Jiang, Determination andcorrelation of solubility of spironolactone form II in pure solvents and binary solventmixtures, J. Chem. Thermodyn. 79 (2014) 61–68, https://doi.org/10.1016/j.jct.2014.07.011.
[43] A.R. Holguín, D.R. Delgado, F. Martínez, Y. Marcus, Solution thermodynamics andpreferential solvation of meloxicam in propylene glycol +water mixtures, J. Solut.Chem. 40 (2011) 1987–1999, https://doi.org/10.1007/s10953-011-9769-0.