social impact monitoring and vulnerability …
TRANSCRIPT
SOCIAL IMPACT MONITORING AND VULNERABILITY ASSESSMENT (SIMVA) 2018 Report on 2018 Baseline Survey of the Lower Mekong Mainstream and Floodplain Areas
MRC Technical Paper
The MRC is funded by contributions from its Member Countries and Development Partners, including Australia, the European Union, Finland, Flanders/Belgium, France, Germany, Japan, Luxembourg, the Netherlands, New Zealand, Sweden, Switzerland, the United States of America and the World Bank.
SOCIAL IMPACT MONITORING AND VULNERABILITY ASSESSMENT (SIMVA) 2018
Report on 2018 baseline survey of the Lower Mekong mainstream and floodplain areas
October 2021
Copyright © Mekong River Commission, 2021 First published (2010)
Some rights reserved.
This work is a product of the Mekong River Commission (MRC) Secretariat. While all efforts have been made to present accurate information, the MRC does not guarantee the accuracy of the data included in this work. The boundaries, colours, denomination and other information shown on any map in this work do not imply any judgement on the part of the MRC concerning the legal status of any territory or the endorsement or acceptance of such boundaries.
Nothing herein shall constitute or be considered to be a limitation upon or waiver of the privileges and immunities of the MRC, all of which are specifically reserved.
This publication may be reproduced, in whole or in part and in any form, for educational or non-profit purposes without special permission from the copyright holder provided that the MRC is acknowledged as the source and that notification is sent to the MRC. The MRC Secretariat would appreciate receiving a copy of any publication that uses this publication as a source. This publication cannot be used for sale or for any other commercial purpose whatsoever without permission in writing from the MRC Secretariat.
Title: Social impact monitoring and vulnerability assessment 2018: Report on 2018 baseline survey of the Lower Mekong mainstream and floodplain areas
ISSN: 2789-245X (online); 2789-2441 (print) DOI: 10.52107/mrc.qx5ynt
Keywords: social impact/vulnerability/SIMVA/Lower Mekong/gender
For bibliographic purposes, this volume may be cited as: Mekong River Commission. (2021). Social impact monitoring and vulnerability assessment 2018: Report on 2018 baseline survey of the Lower Mekong mainstream and floodplain areas. Vientiane: MRC Secretariat. https://doi.org/10.52107/mrc.qx5ynt
Information on MRC publications and digital products can be found at https://www.mrcmekong.org/publications/
Graphic designer: Anouvong Manivong
All queries on rights and licenses should be addressed to: Mekong River Commission Documentation and Learning Centre 184 Fa Ngoum Road, Unit 18, Ban Sithane Neua, Sikhottabong District, Vientiane 01000, Lao PDR Telephone: +856-21 263 263 | E-mail: [email protected] | www.mrcmekong.org
Citation
Mekong River Commission. (2021). Social impact monitoring and vulnerability assessment 2018: Report on 2018 baseline survey of the Lower Mekong mainstream and floodplain areas. Vientiane: MRC Secretariat. https://doi.org/10.52107/mrc.qx5ynt
Authors
Project Management Team
Mr Bountieng Sanaxonh, Director of Planning DivisionDr Thim Ly, Chief River Basin Planner
Technical experts
MRC Secretariat’s technical expert
Ms Nguyen Thi Ngoc Minh, Socio-Economic Specialist, Planning Division
Regional expert
Dr Truong Thi Thu Trang, Director, Centre for Agricultural Policy, Institute of Policy and Strategy for Rural and Development, Viet Nam Ministry of Agriculture and Rural Development
Contributing national experts
Cambodia
Mr They Kheam, National Statistics Office, Ministry of Planning and Investment
Lao PDR
Dr Bounlert Vanhnalat, Senior Lecturer, National University of Laos
Thailand
Dr Sirisuda Jumnongsong, Kasetsart University, Bangkok
Viet Nam
Dr Pham Trong Thinh, Institute of Forest Inventory and Planning, Ministry of Agriculture and Rural Development
CONTENTS
EXECUTIVE SUMMARY I
INTRODUCTION 11.1 Background 1.2 Relevance and benefits to MRC, LMB countries and local communities1.3 Research questions1.4 Answers to the research questions1.5 Structure of the Report
METHODS AND SURVEY PROCESS 72.1 Study area2.1 Study framework2.3 Application of methodology 2.4 List of indicators
THE VILLAGE PROFILE 203.1 Village characteristics3.2 Main livelihood activities in the sample villages3.3 Labour mobility in the area3.4 Source of water and facilities 3.5 Water-related infrastructure 3.6 Riverbanks, island gardens and fields3.7 Losses and damages by flooding, drought, and saline intrusion3.8 The adaptation of villages to climate change
THE HH SURVEY 344.1 Demographic and education characteristics of HHs 4.2 HH livelihood activities4.3 HH income and assets4.5 HH vulnerability 4.6 Agriculture, fisheries, and OAAs/Ps collection4.7 Climate change-related social vulnerability 4.8 Early warning and disaster preparedness4.9 Gender issues
QUALITATIVE SURVEY RESULTS 605.1 Name, location and characteristics of the villages in the study5.2 Main events that occurred in the last five years5.3 Main occupations and the trends in the villages5.4 Trends in community well-being
CONCLUSIONS AND RECOMMENDATIONS 706.1 Conclusions 6.2 Recommendations
GLOSSARY AND DEFINITIONS 73
REFERENCES 76
FIGURES
Figure 1. Classification of social-ecological systems of the Mekong Basin ...................................8
Figure 2. Socio-ecological zones, sub-zones and sample villages and communes for SIMVA 2018 ..................................................................................................................11
Figure 3. SIMVA 2018 modules ...................................................................................................12
Figure 4. Topography of the sample villages ...............................................................................20
Figure 5. Location mostly travel to work .....................................................................................22
Figure 6. Length of time people typically migrate to fish ...........................................................23
Figure 7. Length of time that people typically migrate for aquaculture ....................................23
Figure 8. Drinking water supply used by HHs (%) .......................................................................24
Figure 9. The condition of village public and private services ....................................................25
Figure 10. HHs in the village with riverbanks, island gardens and fields (%) ................................26
Figure 11. Ownership of the riverbanks, island gardens and fields (%) ........................................27
Figure 12. Experience of losses and damages from flooding, by village, in the last three years ..27
Figure 13. Experience of losses and damages from flooding by village in the last 12 months .....28
Figure 14. Causes of most serious flooding in the last 12 months (%) .........................................29
Figure 15. Main causes of flooding in the last 12 months (%) ......................................................29
Figure 16. Trend in impacts of flooding ........................................................................................30
Figure 17. Experience of losses and damages from drought by village in the last 3 years ...........31
Figure 18. Experience of drought in the last 12 months (%) .........................................................31
Figure 19. Causes of drought (%) ..................................................................................................31
Figure 20. Trends in the impacts of drought .................................................................................32
Figure 21. Adaptation activities carried out (%) ...........................................................................33
Figure 22. Adaptation activities by structural or non-structural measures (%) ............................33
Figure 23. Dependency ratio in 2011, 2014 and 2018, by country (%) .........................................35
Figure 24. Education levels of head of HH (%) ..............................................................................35
Figure 25. Marital status of head of HH (%) ..................................................................................36
Figure 26. Comparison of the most and second most important livelihood activities in the past 12 months, 2014 and 2018 .......................................................................36
Figure 27. Percentage of HHs whose most important livelihood is fishing, 2011, 2014 and 2018 .............................................................................................................37
Figure 28. Percentage of HHs whose second most important livelihood is fishing ......................37
Figure 29. Percentage of HHs that fish, 2011, 2014 and 2018 ......................................................38
Figure 30. Percentage of HHs collecting OAAs, 2011, 2014 and 2018 ..........................................38
Figure 31. HH income during the last month by source (US$/HH) ...............................................40
Figure 32. HH income during the last year by source (US$/HH) ...................................................40
Figure 33. Income per capita from fish sales (last month), 2011 and 2018 (% of HHs) ................41
Figure 34. Percentage of HHs with income from OAAs.................................................................41
Figure 35. Sources of drinking water ............................................................................................43
Figure 36. Sources of drinking water, 2011 and 2018 ...................................................................43
Figure 37. Percentage of HHs that depend on water drawn from the Mekong for irrigation, 2011, 2014 and 2018 ...................................................................................44
Figure 38. Source of loan (% of HHs) ............................................................................................46
Figure 39. Percentage of HHs with riverbank cultivation, 2011, 2014 and 2018 ..........................47
Figure 40. Fishing habitat by month in Cambodia ........................................................................48
Figure 41. Fishing habitat in Lao PDR, by month .........................................................................48
Figure 42. Fishing habitat in Thailand by month ...........................................................................49
Figure 43. Fishing habitat by month in Viet Nam .........................................................................49
Figure 44. Percentage of HHs that sold, bought and consumed fish and frequency ....................50
Figure 45. Sources of fish for consumption ..................................................................................50
Figure 46. The average amount of fish per person that HHs ate during the latest meal that includes fish .................................................................................................50
Figure 47. Collecting AAO/Ps in Cambodia (% of HHs) .................................................................51
Figure 48. Collecting AAO/Ps in Lao PDR (% of HHs).....................................................................51
Figure 49. Collecting AAO/Ps in Thailand (% of HHs) ....................................................................52
Figure 50. Collecting AAO/Ps in Viet Nam (% of HHs) ...................................................................52
Figure 51. Selling (A) and buying (B) OAAs/Ps (%) ........................................................................53
Figure 52. Sources of OAAs/Ps ......................................................................................................53
Figure 53. Percentage of HHs with non-aquatic sources of income .............................................54
Figure 54. Coping strategies to flooding (%) .................................................................................55
Figure 55. Strategies to cope with drought (% of HHs) .................................................................57
Figure 56. Flood warning information sources and their reliability ..............................................58
Figure 57. Gender-related features of HHs ...................................................................................59
Figure 58. Trends in fisheries in Lao PDR, 2013–2018 ..................................................................65
Figure 59. Trends in navigation in Lao PDR, 2013–2018 ...............................................................65
Figure 60. Trends in irrigation in Lao PDR, 2013–2018 .................................................................65
Figure 61. Trends in sedimentation in Lao PDR, 2013–2018 .........................................................66
Figure 62. Trends in fisheries in Thailand, 2014– 2018 .................................................................66
Figure 63. Trends in irrigation in Thailand, 2014–2018 .................................................................66
Figure 64. Trends in navigation in Thailand, 2014– 2018 ..............................................................67
Figure 65. Score of well-being in the five villages in Cambodia, 2013–2018 ................................68
Figure 66. The well-being score of five villages in Thailand, 2014–2018 ......................................69
Figure 67. The well-being score in the five qualitative sample villages in Viet Nam, 2013–2018 .69
TABLES
Table 1. IBFM and SIMVA zones ..................................................................................................9
Table 2. Number of HHs and villages in different SIMVA surveys ..............................................13
Table 3. Preliminary list of indicators ........................................................................................15
Table 4. Link between SIMVA 2018 Indicators with the Social Dimension in the MRC Indicator Framework, August 2018 Version .......................................................18
Table 5. The link between SIMVA Indicators and the SDGs .......................................................19
Table 6. Area and population characteristics ............................................................................21
Table 7. Main livelihood activities in the sample villages (%) ....................................................21
Table 8. Availability of water in the wet season (%) ..................................................................24
Table 9. Availability of water in the dry season (%) ...................................................................25
Table 10. Water-related physical infrastructure (% of villages) ...................................................26
Table 11. Area damaged by flooding, by number of villages and duration, in the last 12 months .............................................................................................................28
Table 12. HHs that experienced losses (L) and damages (D) in the region (no. of villages reported) .........................................................................................................30
Table 13. Demographic characteristics of HHs, by country .........................................................34
Table 14. Engagement of HH member in water-related livelihood activities in the last 12 months in 2018 (%) ..........................................................................................38
Table 15. Occupation or livelihood changes in the last five years (% of HH) ...............................39
Table 16. Income changes compared to five years ago (% of HHs) .............................................41
Table 17. Types of HH assets ......................................................................................................42
Table 18. HH characteristics during the last 12 months (%) ........................................................44
Table 19. Agricultural activities of sample HHs in the last 12 months (%) ..................................46
Table 20. Table 20. Losses and damages from flooding ..............................................................54
Table 21. Losses and damages from drought ..............................................................................56
Table 22. Impacts of saline intrusion ...........................................................................................57
Table 23. Measures to prevent impacts from floods and drought (%) ........................................58
Table 24. Female indicators (%) ...................................................................................................59
Table 25. Names, location, topography, and characteristics of sample villages ..........................60
Table 26. Main occupations in Cambodian sample villages ........................................................64
Table 27. Main occupations in the sample qualitative villages ...................................................67
Table 28. Well-being score of five villages in Lao PDR, 2013–2018 .............................................68
i
EXECUTIVE SUMMARY
Background The Social Impact Monitoring and Vulnerability Assessment (SIMVA) 2018 survey was undertaken by the Mekong River Commission (MRC) Secretariat with field surveys implemented by Member Countries. The SIMVA 2018 followed the methodology of the SIMVA 2011 baseline survey and the SIMVA 2014 survey on shocks and trends. The SIMVA 2018 survey primarily builds on these two previous exercises and aims to set a technical framework for decentralized SIMVA field data collection, with the expectation that responsibility will rest fully with Member Countries by 2033.
The objectives of SIMVA 2018 are:
• Provide regular information on the status and trends of the social conditions of the people in the corridor along the Mekong mainstream and around flooded areas, linked to changes in the Basin’s aquatic ecosystems.
• Provide data and information on social vulnerability (particularly food and livelihood vulnerability) linked to changes in water resources (e.g. agriculture, aquaculture, fish, other aquatic animals and plants), and people’s resilience in coping with those changes.
• Establish social impact indicators that reflect current socio-economic conditions and the extent of people’s dependence on water resources.
• Provide data for the MRC 2021–2030 cycle of the basin development planning and monitoring processes.
Executive summaryii
Approach and methodology SIMVA 2018 was conducted in a corridor along the Mekong mainstream and around flooded areas in similar periods in the four Member Countries (November 2018 – February 2019 in Cambodia; February 2019 in Lao PDR; and November – December 2018 in Thailand and Viet Nam). Mixed methods were designed, comprising of a quantitative survey at both the household (HH) and village levels, and a qualitative community study. The quantitative surveys were carried out in 200 sample villages with key informants and HH surveys covering up to 2,800 HHs. Surveys on the villages and HHs are all based on questionnaires, including basic socio-economic variables, livelihoods, vulnerabilities, and resilience. The qualitative study on resilience, vulnerabilities, and social impacts was carried out in five villages near MRC monitoring locations through focus group discussions and in-depth interview.
The SIMVA 2018 survey was conducted in the same study sites and used the same methods as in the SIMVA 2014 survey. The villages and HHs in the 2014 survey were prioritized for the 2018 survey. This helps ensure a panel (set of data) to allow trends to be observed over time, which is a key strength of this SIMVA survey. However, the sample size has decreased as the number of villages per country has been decreased from 88 to 50 due to budget constraints, and the number of HHs selected in each village were slightly decreased from 16 to 14. In addition, some indicators and corresponding questions have been adjusted in the 2018 survey, compared to the 2014 one. In addition to having similar information to the 2014 survey, the 2018 survey includes questions to gather information on HH demographics and gender-specific issues.
This report also used the results of the 2011 and 2014 surveys in order to evaluate indicative trends and changes in the 2011–2018 period.
Main findingsStatus and trends of the social conditions of the people in the corridor, linked to changes in the Basin’s aquatic ecosystems, in the sample areas
• The share of HHs reporting fishing as the most important livelihood increased in Cambodia and Viet Nam from 2011 to 2018, but decreased in Thailand. The option of fishing as the second most important livelihood activity fluctuated in the region with an increasing tend from 2011 to 2014, but a decreasing trend from 2014 to 2018.
• The percentage of HHs with members who fished in the last 12 months decreased from 2011 to 2018. According to the 2018 survey, around 38% of HHs were engaged in fishing in the last 12 months from 45% in 2011, of which 30% of HHs were in Cambodia, 31% in Lao PDR and Thailand, and only 9% in Viet Nam.
• Similarly, the percentage of HHs with members who collected other aquatic animals (OAAs) in the last 12 months decreased in the survey period. The figure for Viet Nam was still lowest of the three other countries. Also, most of HHs never sold other aquatic animals and plants (OAAs/Ps) (48%); only 2% of HHs sold OAAs/Ps more than three times a week; and 1% of HHs sold OAAs/Ps 2–3 times a week. Hence, selling OAAs/Ps was not the main income in the survey areas.
• Regarding the income trend compared to five years ago, 35% of the surveyed HHs said that their income was lower; 32% that it was the same; just 26% that their income increased slightly; and 6% of HHs that their income increased significantly. About 22% of HHs indicated that the income changes related to changes in water resource.
• A small portion of HHs (only 5.4%) shifted their livelihoods because of declined productivity in the natural resources such as fish or OAAs/Ps. These figures show that changes in occupation or livelihood activities were still limited in the last five years. Shifting to farming was dominated by Cambodia and Thailand; shifting to livestock was common in Lao PDR.
iii
• The qualitative survey, albeit more subjective since it is based on focus group discussions (FGDs), revealed several changes in human well-being, occupations, and important events that occurred in the sample villages in the last five years such as flooding and weather-related events such as drought and water shortages, impacting on local livelihood in the sample sites. In addition, agricultural events, including the reduction of fisheries, plant and livestock diseases and events caused by external factors such as low prices for agricultural products detrimentally affected the income of HHs in sample villages, thus impacting the well-being of the communities. People living along the Mekong corridor still depend on agriculture and fisheries activities, hence their well-being is vulnerable to the changes in natural resources and climate.
Vulnerability, particularly food and livelihood vulnerability, linked to changes in water resources
• Riverbanks, island gardens and fields are considered an important agricultural area and they are very vulnerable to flooding and soil erosion. The survey found that 68% of villages had HHs who had riverbanks, island gardens and fields; the highest percentage was in Cambodia, at 94% and Viet Nam, at 78%.
• In the last three years, about 62% of sample villages experienced losses and damages from flooding. Thailand had the highest portion (80%) while Viet Nam had the lowest (42%). Twenty-five per cent of villages observed that the impacts of flooding became much worse, and 25% of villages reported these impacts were worse in the last 12 months than in previous years.
• The main consequences of serious flooding in the last 12 months were overflowing rivers (56% of villages reported) and rainwater that could not drain away (55% of villages reported).
• In the last 12 months, normal rain/monsoon was considered the main source of flooding in the region (34% of villages reported).
• About 61% of villages experienced losses and damages from drought in the last three years.
• Saline intrusion has impacted Vietnamese HH only. The duration of the most severe salinity had been from one to three months. Compared to earlier years, 10% of respondents indicated that the impacts of the most severe salinity intrusion in the last 12 months were worse.
• The availability of drinking water supply is a vulnerability indicator in SIMVA 2018 and is a measure of HH’s access to safe drinking water. Drinking water mostly came from bottled water (50%), followed by piped water, at 33% of HHs using this source. The main water source was bottled water (79%) in Thailand and piped water in Viet Nam (67%).
• Regarding services provided to villages, in general, some fundamental services were common in the region, including the electric grid, telephone and Internet connection, healthcare, and feeder roads, while a number of other facilities were still limited, especially agriculture-related services such as markets for selling local fish, aquaculture products and vegetables, ice factory, fish processing facilities, landing place for boats. More than 50% of villages reported that these services were not available.
• Percentage of HHs considered officially as poor by the government was 25.6%. Most of HHs indicated that they had enough food during the last 12 months (94%) and had over two meals per day (85%).
• Eighteen percent of HHs received the support for the poor and 14% received disaster support; Thai households received the largest support, at 88% for support for the poor, and 69% for disaster support. In contrast, Vietnamese households received less support, at less than 3%.
• Around 43% of HHs experienced flooding in the last three years. In the last 12 months, 29% experienced flooding, most of whom were Vietnamese. The percentage of HHs damaged by flooding in the last three years and 12 months were 26% and 20%, respectively. The percentages of cultivated land area and riverbanks, island gardens and fields damaged by flood were 62% and 63%, respectively.
Executive summaryiv
• 39% of HHs experienced drought in the last three years, and 25% of HHs had assets damaged and other losses by drought.
• At the regional level, 66% of villages took actions to cope with climate extreme events. Viet Nam had the highest rate at 88% and Cambodia, the lowest, at 42%.
• In the 2018 survey results indicate that the main strategy to cope with flooding was receiving assistance from the government (6.5%), of whom Thai HHs were the most reliant on government support (19%). Casual work and working outside the home village were the second and the third most common coping measures, at around 4%.
• The 2018 survey’s results indicate that the main strategy to cope with drought, was receiving assistance from the government (5.2% of HHs), followed by working outside the village (4%) and shifting from farming to other activities (3%).
• There were very limited coping strategies to deal with negative events occurring in the last five years. It emerged from the FGDs that HHs mostly depended on government and agency support to overcome their difficulties, particularly in Lao PDR. Long-term measures were observed in Thailand and Viet Nam, where people started to change their farming practices and applied climate-resilient and disease-tolerant varieties in farming to mitigate the impacts of climate change and agricultural shocks.
• The dependency ratio of the region in 2018 was 30%; the ratio was highest in Lao PDR 53.8%, followed by Cambodia with 35%, and Thailand with 36%. This correlates to the high fertility rates and relatively large HHs, indicating more traditional extended family structures. HHs in Viet Nam had the lowest dependency ratio (27%), reflecting a more advanced stage in the demographic transition towards modernization. The data from the Mekong Delta could be interpreted as showing a stage in the transition from traditional, extended families to modern nuclear families. In the 2011–2018 period, there was an increasing trend in dependency ratios in all countries except Cambodia; Lao PDR had the highest increase, of nearly 20%.
• There were four large ethnic groups – Khmer in Cambodia (88%), Kinh in Viet Nam (91%), Lao Isan in Thailand (71%) and Lao in Lao PDR (72%). In addition, there were other smaller ethnic groups including Khmou, Tai Lue, Suay, Cham, Chinese, Hmong, Lu Mien, Kaloeng, Lahu, Lamet, Nyo, Phou Thay, Phuan, Ta-oy, Tai, etc.
• In all four countries, the most common marital status of heads of HHs was married, at over 77% whereas separation was the least common, at under 1%.
• The general education level is an indicator for resilience and ability to adapt to changing circumstances. Primary school completion was the highest level among 39% of heads of HHs; 33% of heads of HHs completed lower secondary school. These figures suggest a relatively high level of vulnerability in corridor communities.
• Gender is an important aspect of vulnerability. Traditional gender roles are in force in many areas of the LMB corridor, and women and men do not have the same opportunities for employment and pay. A female-headed HH was vulnerable in a number of ways – legally, socially, and economically, since it is typically also a single- parent HH. The survey found that 19% of the HHs were headed by females and 81% by males. Lao PDR and Viet Nam had the lowest rate of female-headed HH, at 13%, while Thailand had the highest rate, at 27%.
• Local people were aware of the cause of climate extreme events. At the village level, the most serious flooding was caused by the overflooding of rivers, and the main sources of flooding were from normal rain/monsoon and extended monsoons. The major causes of drought were extreme weather/climate change.
• Local knowledge on weather-related events was considered the most reliable source of knowledge for 52% of HHs, followed by radio in the village. TV was the most reliable information sources indicated by Thailand, at 73% of HHs and Lao PDR with 49%.
v
Conclusion The SIMVA 2018 survey provided information on the status and trends on the social-economic conditions of the people in the Mekong River corridor and the trend in people’s dependence on water resources. The survey also provides data and information on social vulnerability (particularly food and livelihood vulnerability) linked to changes in water resources (agriculture, aquaculture, fish, and OAAs/Ps), and people’s resilience in coping with these changes. The results of the 2018 survey with 2,800 HHs in 200 villages indicated that communities in the Mekong mainstream corridor were still largely dependent on the river water-related resources for their livelihoods, income, and well-being. As such, they are still vulnerable to changes in the Mekong water resources. However, the overall dependency has decreased with other, non-water resources-related livelihood activities, such as wage employment or business/trading, which play increasingly important roles in their overall livelihood strategy. The survey results also showed that while government support could be critical in helping HHs cope with vulnerabilities, and indeed basic services such as primary infrastructure (roads, schools, commune health clinics, simple water and sanitation), there is still significant room for improvements in the production-related support services. This is an important policy implication for the government if communities are to be protected from water- and climate- related vulnerability.
Main recommendations for SIMVAIt is recommended that the SIMVA survey continue, given its uniqueness in providing primary data on communities’ direct dependency on water-related resources. The next SIMVA surveys on social vulnerability (particularly food and livelihood vulnerability) linked to changes in water resources (agriculture, aquaculture, fish, OAAs/Ps) will remain unchanged to allow for a comparison of past events and predictions of future trends. Surveys should be carried out every four years to track changes over time.
The data collection approach is important to ensure accurate data for a temporal overview of the situation on the Mekong mainstream. It is vital to train staff collecting data to ensure understanding of the required data and consistency.
Arranging and conducting interviews with HHs can be time-consuming. In some cases, the HHs did not agree to complete the survey. The number of replacement HHs should be increased, and when an original HH was not available, an alternative was selected to reduce the time burden for data collection.
Regarding the reliability of data, some questions were understood differently in different countries; as a result, some collected data were inconsistent. Thus, it was necessary to ensure that the questionnaires were clear and easy to understand.
When entering data, all the countries should develop codebooks and have the same coding in order to ensure that the aggregate data for the entire region are calculated and analysed accurately.
Regarding data analysis, some answers were categorized as “Other” but were not specified. Therefore, further analysis of the data may clarify what the ‘Other’ category covers.
Executive summaryvi
1
INTRODUCTION
1.1 Background
SIMVA activities begun in 2004, and before this survey, four phases of study had been completed. Phase 1, 2004–2006, was an extensive literature review. Phase 2, 2008–2009, was a pilot survey to determine the validity of indicators and research tools. Phase 3, 2011–2012, was a baseline survey in the LMB corridor, which applied the methodology developed in Phase 2. Phase 4 focused on climate-related shocks and trends, and resilience and coping strategies. The SIMVA 2018 is Phase 5 of the process.
SIMVA 2018 aimed to create a panel dataset with SIMVA 2014 that allows to analyse changes in the major indicators between 2014 and 2018. In addition, panel data also have certain advantages: they allow a researcher to analyse several important economic questions that cannot be addressed using cross-sectional or time-series datasets. More importantly, the advantage of panel data derives from their theoretical ability to isolate the effects of specific actions, treatments, or more general policies.
As a general framework for the core SIMVA survey going forward, SIMVA 2018, omitted the special module on shocks and trends, which were the focus of SIMVA 2014. Instead, the 2018 survey included further questions on resilience and vulnerabilities, which are the central elements of SIMVA. SIMVA 2018 also created a framework for social vulnerability and resilience indicators in this pilot decentralized survey, which will be applied in future, more decentralized, SIMVA surveys.
SIMVA 2018 is designed as a regional study of rural villages and households (HHs) located within a 15-km buffer zone on each side of the Mekong mainstream and around major floodplains in Cambodia and in the Mekong Delta. The survey focuses on the resilience and vulnerabilities of villages and HHs in the LMB Corridor. Livelihood vulnerability is the balance between the sensitivity and resilience of livelihood systems. Highly vulnerable systems are characterized by low resilience and high sensitivity, while less vulnerable systems have low sensitivity with high resilience. Livelihood resilience allows a system to absorb and utilize (or even benefit from) change. In the context of climate change, vulnerability has been defined as “the degree to which a system is susceptible to, and unable to cope with, the adverse effects of climate change, including climate variability and extremes. Vulnerability is a function of the character, magnitude, and rate of climate change and variation to which a system is exposed, its sensitivity, and its adaptive capacity” (IPCC, WG2, 2007, p. 6).
The objectives of SIMVA 2018 are as follows, as noted in the SIMVA 2018 Guidelines:
• Provide regular information on the status and trends of the social conditions of the people in the corridor, linked to changes in the Basin’s aquatic ecosystems.
• Provide data and information on social vulnerability (particularly food and livelihood vulnerability) linked to changes in water resources (agriculture, aquaculture, fish, OAAs/Ps) and people’s resilience in coping with these changes.
• Establish social impact indicators that reflect current socio-economic conditions and the extent of people’s dependence on water resources.
• Provide data for the MRC 2021–2030 cycle of basin development planning and monitoring processes.
The relationship between socio-economic conditions and people’s dependency on water resources determines their vulnerability to changes in the water resources. The long-term monitoring of
Introduction2
SIMVA has the following objectives:
• Identify any significant changes in people’s access to water resources.
• Identify any significant changes in HH welfare and livelihoods.
• Link these changes to their levels of vulnerability, including livelihood vulnerability.
• Help measure potential social impacts of economic activities and possible projects in the Lower Basin region.
1.2 Relevance and benefits to MRC, LMB countries and local communities
SIMVA will allow for a comparison of conditions in different socio-ecological zones, and will thereby give Member Countries a unique opportunity to obtain an overview of the situation along the whole of Mekong mainstream, across national boundaries. These data are not yet covered in the national monitoring systems. As such, SIMVA data fill a critical gap and can be used for assessing transboundary trends, issues and development opportunities. Local communities will benefit from the knowledge generated by SIMVA, through its application in water resources development initiatives such as flood protection, irrigation, and fisheries regulations.
1.3 Research questions
• What types of positive or negative changes related to the Mekong River system and water resources, and impacts from these changes have villages and HHs experienced, over the past 12 months (quantitative survey), and the past five years (qualitative study)?
• Have these changes and impacts been different in the different socio-ecological zones?
• What has been the strength or severity of these positive or negative impacts from changes?
• What are the vulnerabilities of the HHs living in the corridor with regard to the Mekong River system and water resources (water quality, water level, flow, flooding, fish and OAAs/Ps, irrigated agriculture, riverbank gardens, drinking water supply, navigation and other livelihoods)?
• How resilient are HHs in coping with the changes related to the Mekong River system and water resources?
• What measures have HHs and village communities taken to cope with the negative impacts?
• What types of impacts have occurred abruptly, without warning, at a scale so they can be considered shocks?
• What are the socio-economic conditions that determine more resilience to shocks?
• What are the livelihoods of the HHs living in the corridor for the Mekong River system and water resources (water quality, water level, flow, flooding, fish and OAAs/Ps, irrigated agriculture, riverbank gardens, drinking water supply, navigation, and other livelihoods)?
• What long-term trends over the last five years can be identified in the use and condition of river water resources, fisheries, irrigation, navigation, timber floating, tourism, and livelihoods at the community level?
1.4 Answers to the research questions
The following indicators were identified as relevant for answering the research questions. The relationship between the indicators and the research questions, and where they are presented in the report is as follows:
3
Research questions and the main related findings Results presented in
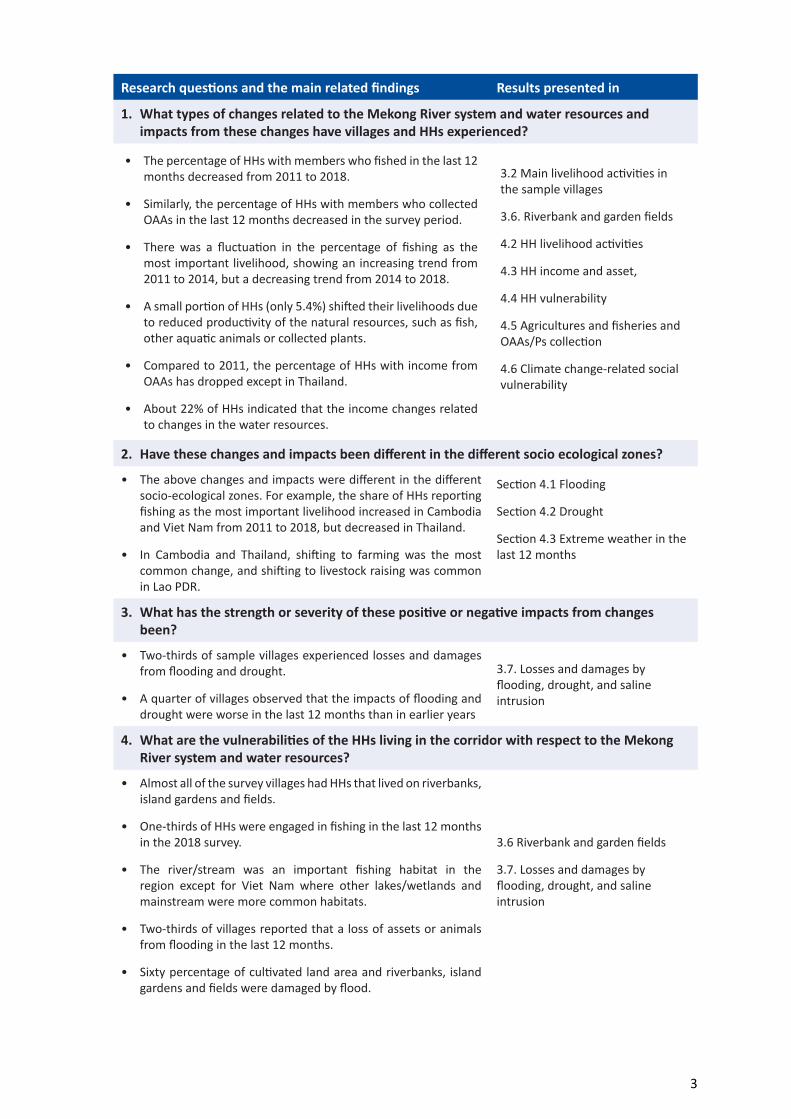
1. What types of changes related to the Mekong River system and water resources and impacts from these changes have villages and HHs experienced?
• The percentage of HHs with members who fished in the last 12 months decreased from 2011 to 2018.
• Similarly, the percentage of HHs with members who collected OAAs in the last 12 months decreased in the survey period.
• There was a fluctuation in the percentage of fishing as the most important livelihood, showing an increasing trend from 2011 to 2014, but a decreasing trend from 2014 to 2018.
• A small portion of HHs (only 5.4%) shifted their livelihoods due to reduced productivity of the natural resources, such as fish, other aquatic animals or collected plants.
• Compared to 2011, the percentage of HHs with income from OAAs has dropped except in Thailand.
• About 22% of HHs indicated that the income changes related to changes in the water resources.
3.2 Main livelihood activities in the sample villages
3.6. Riverbank and garden fields
4.2 HH livelihood activities
4.3 HH income and asset,
4.4 HH vulnerability
4.5 Agricultures and fisheries and OAAs/Ps collection
4.6 Climate change-related social vulnerability
2. Have these changes and impacts been different in the different socio ecological zones?
• The above changes and impacts were different in the different socio-ecological zones. For example, the share of HHs reporting fishing as the most important livelihood increased in Cambodia and Viet Nam from 2011 to 2018, but decreased in Thailand.
• In Cambodia and Thailand, shifting to farming was the most common change, and shifting to livestock raising was common in Lao PDR.
Section 4.1 Flooding
Section 4.2 Drought
Section 4.3 Extreme weather in the last 12 months
3. What has the strength or severity of these positive or negative impacts from changes been?
• Two-thirds of sample villages experienced losses and damages from flooding and drought.
• A quarter of villages observed that the impacts of flooding and drought were worse in the last 12 months than in earlier years
3.7. Losses and damages by flooding, drought, and saline intrusion
4. What are the vulnerabilities of the HHs living in the corridor with respect to the Mekong River system and water resources?
• Almost all of the survey villages had HHs that lived on riverbanks, island gardens and fields.
• One-thirds of HHs were engaged in fishing in the last 12 months in the 2018 survey.
• The river/stream was an important fishing habitat in the region except for Viet Nam where other lakes/wetlands and mainstream were more common habitats.
• Two-thirds of villages reported that a loss of assets or animals from flooding in the last 12 months.
• Sixty percentage of cultivated land area and riverbanks, island gardens and fields were damaged by flood.
3.6 Riverbank and garden fields
3.7. Losses and damages by flooding, drought, and saline intrusion
Introduction4
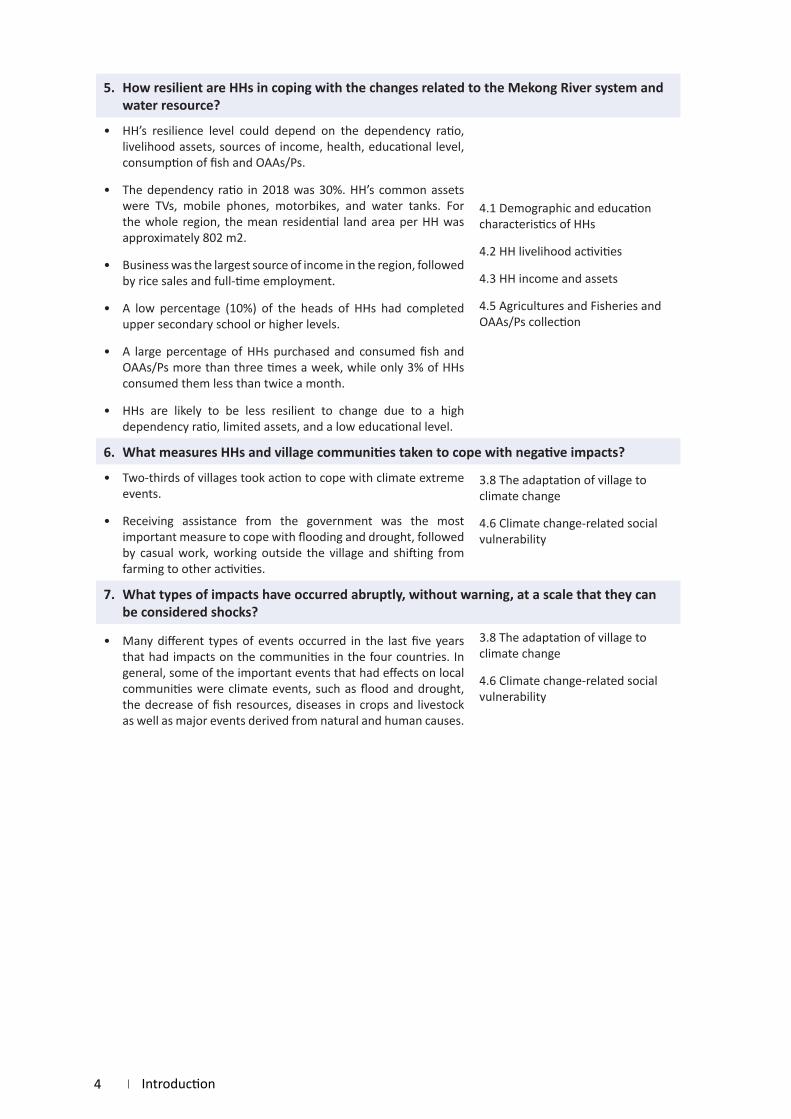
5. How resilient are HHs in coping with the changes related to the Mekong River system and water resource?
• HH’s resilience level could depend on the dependency ratio, livelihood assets, sources of income, health, educational level, consumption of fish and OAAs/Ps.
• The dependency ratio in 2018 was 30%. HH’s common assets were TVs, mobile phones, motorbikes, and water tanks. For the whole region, the mean residential land area per HH was approximately 802 m2.
• Business was the largest source of income in the region, followed by rice sales and full-time employment.
• A low percentage (10%) of the heads of HHs had completed upper secondary school or higher levels.
• A large percentage of HHs purchased and consumed fish and OAAs/Ps more than three times a week, while only 3% of HHs consumed them less than twice a month.
• HHs are likely to be less resilient to change due to a high dependency ratio, limited assets, and a low educational level.
4.1 Demographic and education characteristics of HHs
4.2 HH livelihood activities
4.3 HH income and assets
4.5 Agricultures and Fisheries and OAAs/Ps collection
6. What measures HHs and village communities taken to cope with negative impacts?
• Two-thirds of villages took action to cope with climate extreme events.
• Receiving assistance from the government was the most important measure to cope with flooding and drought, followed by casual work, working outside the village and shifting from farming to other activities.
3.8 The adaptation of village to climate change
4.6 Climate change-related social vulnerability
7. What types of impacts have occurred abruptly, without warning, at a scale that they can be considered shocks?
• Many different types of events occurred in the last five years that had impacts on the communities in the four countries. In general, some of the important events that had effects on local communities were climate events, such as flood and drought, the decrease of fish resources, diseases in crops and livestock as well as major events derived from natural and human causes.
3.8 The adaptation of village to climate change
4.6 Climate change-related social vulnerability
5
8. What are the socio-economic conditions that determine more resilience to shocks?
• The conditions include demographic and education characteristics of HHs (dependency ratio, education level), livelihood, income, vulnerability, early warning and disaster preparedness. Village public services such as water supply and facilities, and water-related infrastructure also have impacts on resilience.
3.4 Water resources and facilities
3. 5 Water-related infrastructure
4.1 Demographic and education characteristics 4.2 HH livelihood activities
4.3 HH income and assets
4.4 HH vulnerability
4.5 Agriculture and fisheries and OAAs/Ps collection
4.6 Climate change-related social vulnerability
4.7 Early warning and disaster preparedness
9. What are the livelihoods of the HHs living in the corridor that depend on the Mekong River system and water resources?
• Crop farming was the most important occupation in the study area (46%). Water resource-related livelihoods accounted for a small portion. Fishing was the most important livelihood for only 3% of the HHs and the second important activity for only 4% of HHs.
• Each of the other water resource-dependent occupations, such as the collection of OAAs/Ps, fish processing, aquaculture, navigation, and sand mining from the river, were the most or second most important activities for less than 1% of the HHs.
3.2 Main livelihood activities in the sample villages
4.2 HH livelihood activities
4.5 Agricultures and Fisheries and OAAs/Ps collection
10. What long-term trends over the last five years can be identified at the community level?
• Compared to the 2014 survey, crop farming is still the major livelihood in all study sites, reflecting that local livelihoods are vulnerable to changes in water resources and climate change impacts. Trading (included services) has become the second most important occupation. Working outside in other districts or provinces was a very common livelihood activity for almost all of the sample villages.
• In the four countries, the populations mostly travelled to other fishing areas in order to fish.
• There were some improvements in local infrastructure such as the construction of new roads and bridges in Viet Nam.
• Compared to the 2014 survey, losses and damages from main climate shocks, especially flooding, increased significantly in all areas.
5.2 Main events that occurred in the last five years
5.3 Main occupations and the trends in the villages
1.5 Structure of the Report
This regional report presents the main findings from the analysis of data collected for both the quantitative survey and the qualitative study of the SIMVA 2018 survey on livelihoods, vulnerability and resilience, and case studies in the Lower Mekong Basin Corridor in Cambodia, Lao PDR, Thailand, and Viet Nam. This report comprises six main parts:
Introduction6
Part 1. The introduction provides an overview of the SIMVA survey, objectives, and rationale as well as the 2018 survey research questions.
Part 2. Methods and the survey process describe the study area, methods, sampling procedure, and the changes that have been made to SIMVA 2014 compared to SIMVA 2018.
Part 3. The village profile presents the results of the village survey in terms of village characteristics, population, livelihoods activities, labour mobility and how they are distributed in the different socio-ecological zones. The village profile data are obtained from information at the village level. This section also presents findings on riverbank cultivation, the use of water resources, and source of drinking waters. In addition, it provides data on the occurrence of extreme weather events such as flooding, drought and saline intrusion, their impacts on villages, and coping strategies at the village level. Data were included on the occurrence of these disasters in the last 12 months and in the last three years, as well as the main causes of them. The categories of the impacts ranged from much less to much worse.
Part 4. The HH survey presents the results of the HH survey, regarding information on the status and trends of the social conditions of people in the corridor in the sample areas, linked to changes in the Basin’s aquatic ecosystems, as well as information on social vulnerability (particularly food and livelihood vulnerability) linked to changes in water resources (agriculture, aquaculture, fish, OAAs/Ps), and people’s resilience in coping with these changes and establish social impact indicators that reflect current socio-economic conditions and the extent of people’s dependence on water resources.
Part 5. Qualitative study results present the findings from the qualitative survey based on FGDs in the sample villages. This section shows the essential information on the main trends in positive and negative events and factors over the last five years, which influences the socio-economic situation and community well-being of villages in the Mekong River corridor, with a focus on water-related factors.
Part 6. Conclusions and Recommendations highlight the main observations in the 2018 survey. Recommendations for future SIMVA surveys and recommendations for continued and enhanced, relevant activity areas for the MRC are discussed.
Four National Reports complement this Regional Report. The National Reports provide more detail on the findings from each of the Member Countries. The National Reports include discussions on national perspectives on SIMVA, both in terms of the study findings, and in terms of its sustainability as a process of integrative data collection and analysis.
7
METHODS AND SURVEY PROCESS
2.1 Study area
SIMVA 2018, like SIMVA 2011 and 2014, is conducted in a corridor along the Mekong mainstream and around major flooded areas around Tonle Sap in Cambodia, Songkhram in Thailand, and in the Mekong Delta. This section represents the rationale for this spatial focus of the survey, which has been mentioned in previous SIMVA reports for the benefit of readers.
SIMVA is concerned primarily with people’s dependence on water resources and their vulnerability to changes in the availability of these resources. For this reason, the geographical areas used to analyse this relationship must make both ecological and social sense.
The clearest link between natural resources and users is within ‘social-ecological’ systems where people have adapted to their environment over hundreds of years. Within these areas, the interdependence between people and the ecosystems they inhabit has evolved to create generally resilient environments where both man and nature can sustain certain levels of change.
A social-ecological system (SES) is defined as “an integrated system of ecosystems and human society with reciprocal feedback and interdependence”. The concept emphasizes the ‘humans-in-nature’ perspective (Resilience Alliance, 2007).
Thus, SIMVA focuses on the SESs (also known as habitats) identified through earlier work carried out by the Integrated Basin Flow Management (IBFM) for the corridor, and by WWF (with MRC support) in 2006 for the whole basin. They use a classification framework for sub-basins and streams that focuses on ecological functionality, which is based on hydro-geomorphic characteristics. The categories considered were:
• Water flow system type (e.g. headwater vs. pass-through watershed, small vs. large streams, floodplain type)
• Elevation (and derivatives, e.g. slope)
• Geology
• Vegetation
• Hydrology (e.g. surface runoff, river discharge)
• Stream network characteristics (e.g. river density, sinuosity).
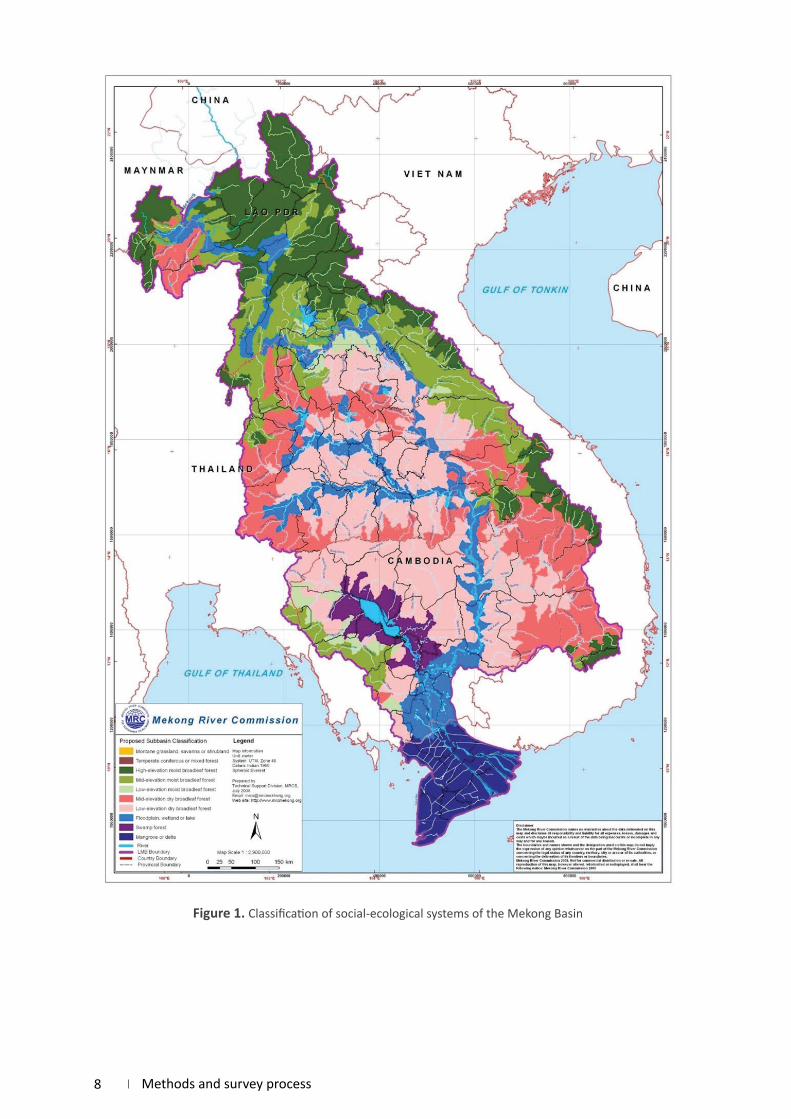
Based on these categories, stakeholders developed an initial hierarchical classification scheme: each category was subdivided into different elevation zones, and each of these unique combinations was then further subdivided according to geology and vegetation, etc. This was then developed further to define 10 sub-basin classifications for the region, 8 of which apply to the LMB. The classifications are named after the natural ecosystems, although it is recognized that they have been largely transformed by agriculture and forestry. Studies show that the residents of these areas have adapted their livelihoods to the ecosystems, effectively becoming an integral part of the environment they manage and transform. The classification of SESs of the Mekong Basin is shown in Figure 1.
Methods and survey process8
Figure 1. Classification of social-ecological systems of the Mekong Basin
9
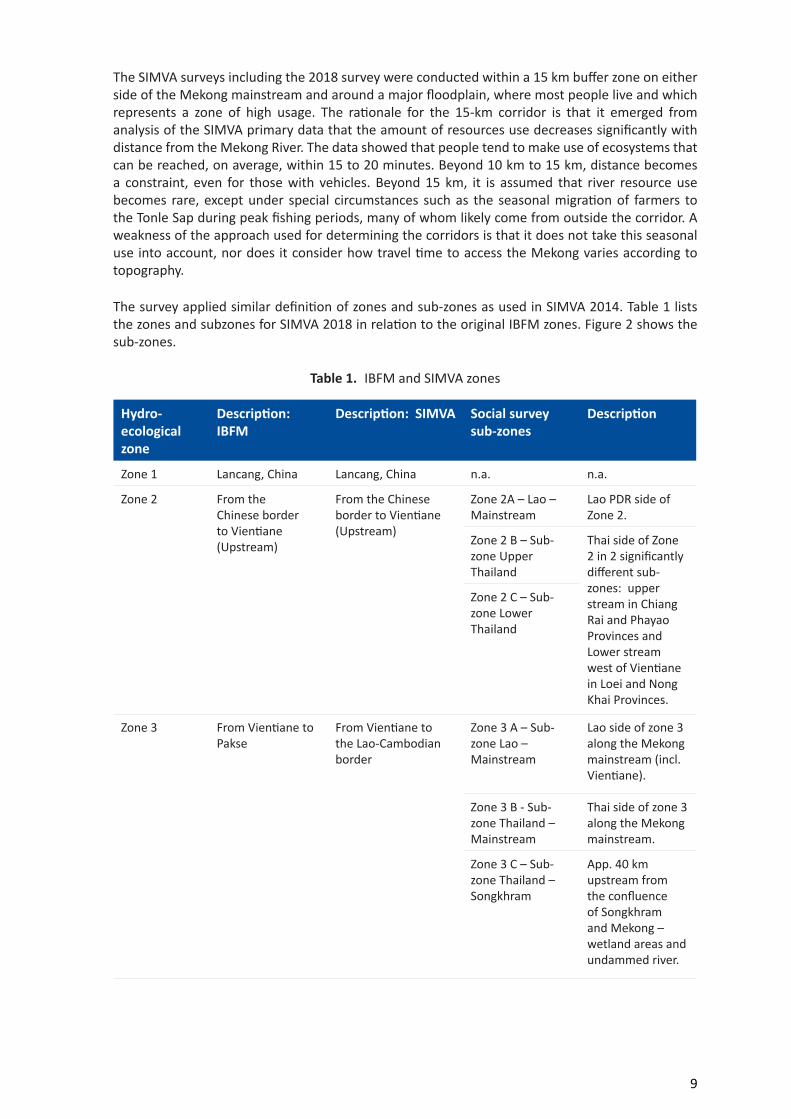
The SIMVA surveys including the 2018 survey were conducted within a 15 km buffer zone on either side of the Mekong mainstream and around a major floodplain, where most people live and which represents a zone of high usage. The rationale for the 15-km corridor is that it emerged from analysis of the SIMVA primary data that the amount of resources use decreases significantly with distance from the Mekong River. The data showed that people tend to make use of ecosystems that can be reached, on average, within 15 to 20 minutes. Beyond 10 km to 15 km, distance becomes a constraint, even for those with vehicles. Beyond 15 km, it is assumed that river resource use becomes rare, except under special circumstances such as the seasonal migration of farmers to the Tonle Sap during peak fishing periods, many of whom likely come from outside the corridor. A weakness of the approach used for determining the corridors is that it does not take this seasonal use into account, nor does it consider how travel time to access the Mekong varies according to topography.
The survey applied similar definition of zones and sub-zones as used in SIMVA 2014. Table 1 lists the zones and subzones for SIMVA 2018 in relation to the original IBFM zones. Figure 2 shows the sub-zones.
Table 1. IBFM and SIMVA zones
Hydro-ecological zone
Description: IBFM
Description: SIMVA Social survey sub-zones
Description
Zone 1 Lancang, China Lancang, China n.a. n.a.
Zone 2 From the Chinese border to Vientiane (Upstream)
From the Chinese border to Vientiane (Upstream)
Zone 2A – Lao – Mainstream
Lao PDR side of Zone 2.
Zone 2 B – Sub-zone Upper Thailand
Thai side of Zone 2 in 2 significantly different sub-zones: upper stream in Chiang Rai and Phayao Provinces and Lower stream west of Vientiane in Loei and Nong Khai Provinces.
Zone 2 C – Sub-zone Lower Thailand
Zone 3 From Vientiane to Pakse
From Vientiane to the Lao-Cambodian border
Zone 3 A – Sub-zone Lao – Mainstream
Lao side of zone 3 along the Mekong mainstream (incl. Vientiane).
Zone 3 B - Sub-zone Thailand – Mainstream
Thai side of zone 3 along the Mekong mainstream.
Zone 3 C – Sub-zone Thailand – Songkhram
App. 40 km upstream from the confluence of Songkhram and Mekong – wetland areas and undammed river.
Methods and survey process10
Zone 4 From Pakse to Kratie
From the Lao-Cambodian border to Cambodian-Vietnamese border
Zone 4 B – Sub-zone Cambodia – 3S
App. 40 km from confluence of 3S and Mekong – undammed river, special eco-system.
Zone 4 A - Sub-zone Cambodia – Khone Falls to Kratie
Along Mekong mainstream down to the start of the floodplain
Zone 4 C – Sub-zone Cambodia – Kratie to Viet Nam border
A 15-km zone around the maximum flooded area on the floodplain along the Mekong mainstream and Bassac east and south of Phnom Penh.
Zone 5 From Kratie to Phnom Penh (upstream), incl. Tonle Sap
From Phnom Penh up to and including Tonle Sap Lake
Zone 5 A – Sub-zone Cambodia – Tonle Sap River
Since the socio-ecological system of Tonle Sap River is considered different from the Lake, a special sub-zone was drawn.
Zone 5 B – Sub-zone Cambodia – Tonle Sap Lake
The area is defined as 15 km around the maximum flooded area (in 2000).
Zone 6 From Phnom Penh to the South China Sea (the Delta)
From the Cambodian-Vietnamese border to the sea (the Delta)
Zone 6 A - Sub-zone Viet Nam – Mekong Delta – freshwater
The sub-zone covers the area of the Mekong Delta, which has freshwater.
Zone 6 B – Sub-zone Viet Nam – Mekong Delta – saline
The saline sub-zone has special characteristics such as problems with saline intrusion.
11
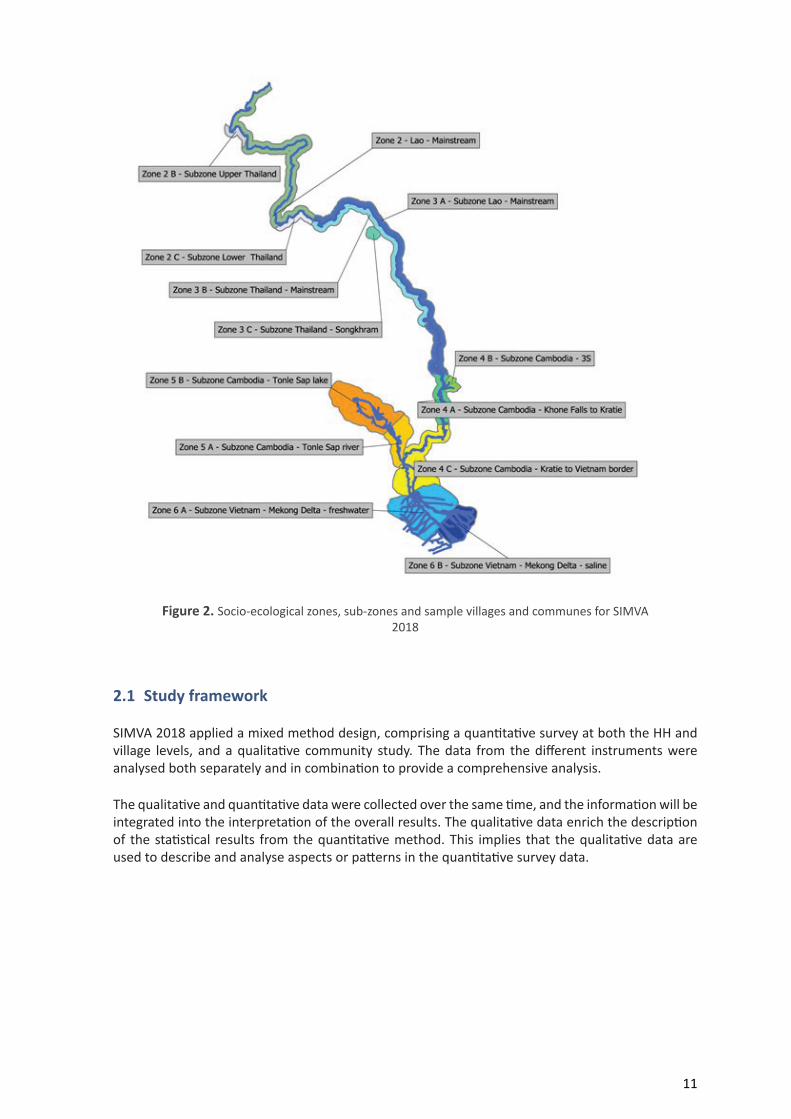
Figure 2. Socio-ecological zones, sub-zones and sample villages and communes for SIMVA 2018
2.1 Study framework
SIMVA 2018 applied a mixed method design, comprising a quantitative survey at both the HH and village levels, and a qualitative community study. The data from the different instruments were analysed both separately and in combination to provide a comprehensive analysis.
The qualitative and quantitative data were collected over the same time, and the information will be integrated into the interpretation of the overall results. The qualitative data enrich the description of the statistical results from the quantitative method. This implies that the qualitative data are used to describe and analyse aspects or patterns in the quantitative survey data.
Methods and survey process12
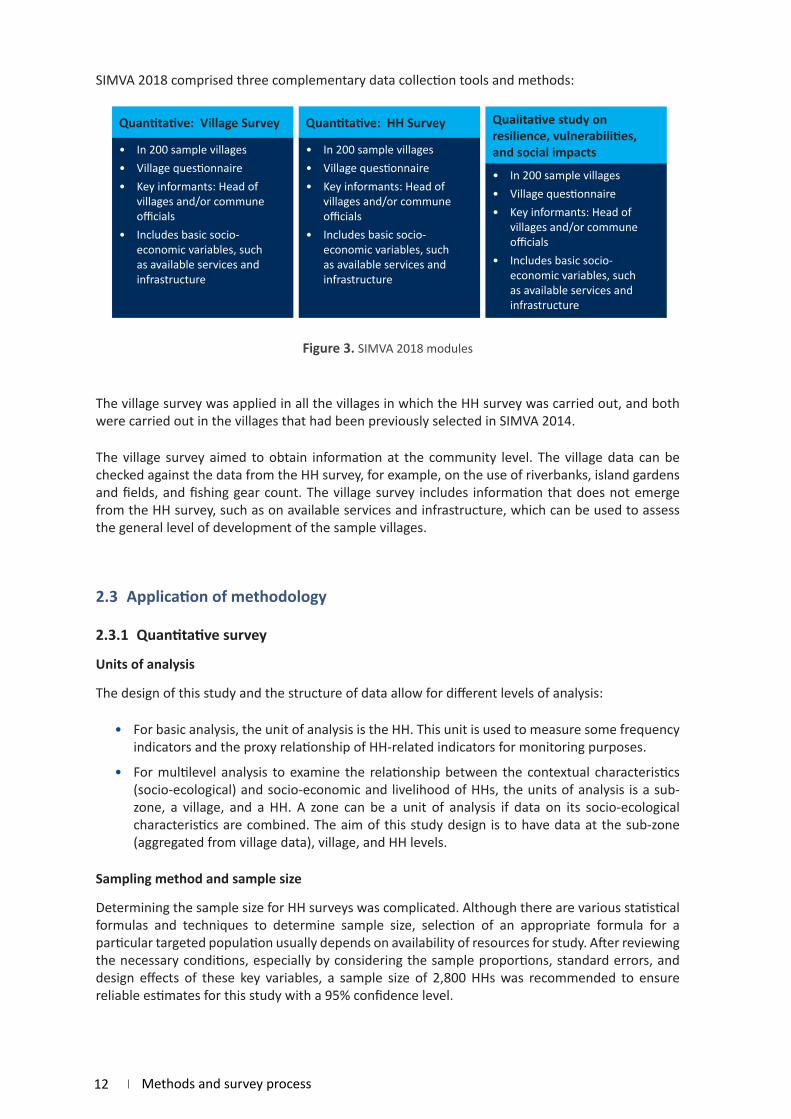
SIMVA 2018 comprised three complementary data collection tools and methods:
• In 200 sample villages• Village questionnaire• Key informants: Head of
villages and/or commune officials
• Includes basic socio-economic variables, such as available services and infrastructure
Quantitative: Village Survey
• In 200 sample villages• Village questionnaire• Key informants: Head of
villages and/or commune officials
• Includes basic socio-economic variables, such as available services and infrastructure
Quantitative: HH Survey
• In 200 sample villages• Village questionnaire• Key informants: Head of
villages and/or commune officials
• Includes basic socio-economic variables, such as available services and infrastructure
Qualitative study on resilience, vulnerabilities, and social impacts
Figure 3. SIMVA 2018 modules
The village survey was applied in all the villages in which the HH survey was carried out, and both were carried out in the villages that had been previously selected in SIMVA 2014.
The village survey aimed to obtain information at the community level. The village data can be checked against the data from the HH survey, for example, on the use of riverbanks, island gardens and fields, and fishing gear count. The village survey includes information that does not emerge from the HH survey, such as on available services and infrastructure, which can be used to assess the general level of development of the sample villages.
2.3 Application of methodology
2.3.1 Quantitative survey
Units of analysis
The design of this study and the structure of data allow for different levels of analysis:
• For basic analysis, the unit of analysis is the HH. This unit is used to measure some frequency indicators and the proxy relationship of HH-related indicators for monitoring purposes.
• For multilevel analysis to examine the relationship between the contextual characteristics (socio-ecological) and socio-economic and livelihood of HHs, the units of analysis is a sub-zone, a village, and a HH. A zone can be a unit of analysis if data on its socio-ecological characteristics are combined. The aim of this study design is to have data at the sub-zone (aggregated from village data), village, and HH levels.
Sampling method and sample size
Determining the sample size for HH surveys was complicated. Although there are various statistical formulas and techniques to determine sample size, selection of an appropriate formula for a particular targeted population usually depends on availability of resources for study. After reviewing the necessary conditions, especially by considering the sample proportions, standard errors, and design effects of these key variables, a sample size of 2,800 HHs was recommended to ensure reliable estimates for this study with a 95% confidence level.
13
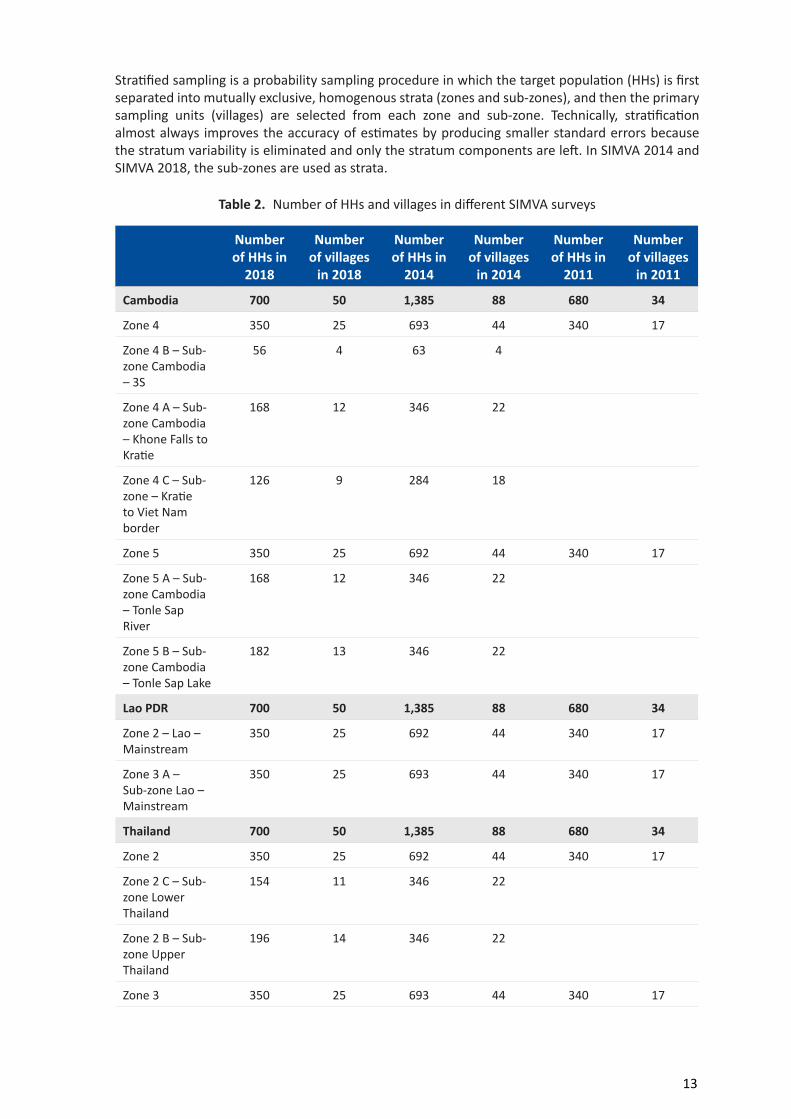
Stratified sampling is a probability sampling procedure in which the target population (HHs) is first separated into mutually exclusive, homogenous strata (zones and sub-zones), and then the primary sampling units (villages) are selected from each zone and sub-zone. Technically, stratification almost always improves the accuracy of estimates by producing smaller standard errors because the stratum variability is eliminated and only the stratum components are left. In SIMVA 2014 and SIMVA 2018, the sub-zones are used as strata.
Table 2. Number of HHs and villages in different SIMVA surveys
Number of HHs in
2018
Number of villages
in 2018
Number of HHs in
2014
Number of villages
in 2014
Number of HHs in
2011
Number of villages
in 2011
Cambodia 700 50 1,385 88 680 34
Zone 4 350 25 693 44 340 17
Zone 4 B – Sub-zone Cambodia – 3S
56 4 63 4
Zone 4 A – Sub-zone Cambodia – Khone Falls to Kratie
168 12 346 22
Zone 4 C – Sub-zone – Kratie to Viet Nam border
126 9 284 18
Zone 5 350 25 692 44 340 17
Zone 5 A – Sub-zone Cambodia – Tonle Sap River
168 12 346 22
Zone 5 B – Sub-zone Cambodia – Tonle Sap Lake
182 13 346 22
Lao PDR 700 50 1,385 88 680 34
Zone 2 – Lao – Mainstream
350 25 692 44 340 17
Zone 3 A – Sub-zone Lao – Mainstream
350 25 693 44 340 17
Thailand 700 50 1,385 88 680 34
Zone 2 350 25 692 44 340 17
Zone 2 C – Sub-zone Lower Thailand
154 11 346 22
Zone 2 B – Sub-zone Upper Thailand
196 14 346 22
Zone 3 350 25 693 44 340 17
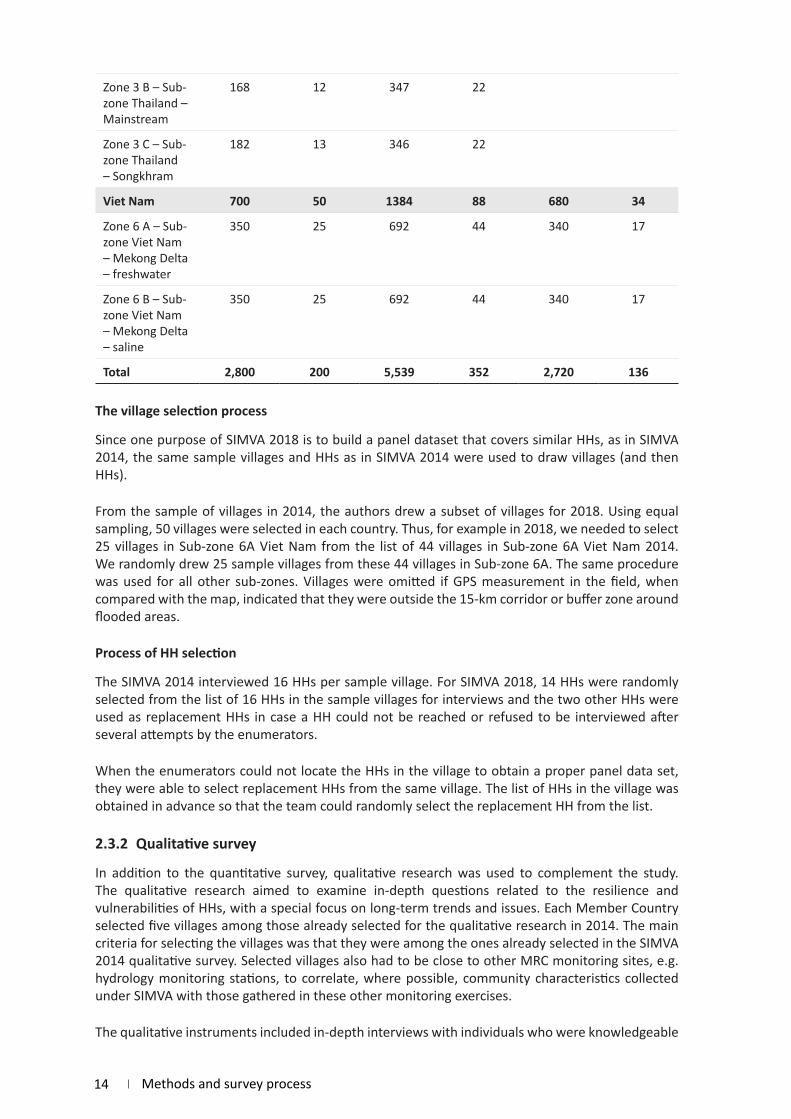
Methods and survey process14
Zone 3 B – Sub-zone Thailand – Mainstream
168 12 347 22
Zone 3 C – Sub-zone Thailand – Songkhram
182 13 346 22
Viet Nam 700 50 1384 88 680 34
Zone 6 A – Sub-zone Viet Nam – Mekong Delta – freshwater
350 25 692 44 340 17
Zone 6 B – Sub-zone Viet Nam – Mekong Delta – saline
350 25 692 44 340 17
Total 2,800 200 5,539 352 2,720 136
The village selection process
Since one purpose of SIMVA 2018 is to build a panel dataset that covers similar HHs, as in SIMVA 2014, the same sample villages and HHs as in SIMVA 2014 were used to draw villages (and then HHs).
From the sample of villages in 2014, the authors drew a subset of villages for 2018. Using equal sampling, 50 villages were selected in each country. Thus, for example in 2018, we needed to select 25 villages in Sub-zone 6A Viet Nam from the list of 44 villages in Sub-zone 6A Viet Nam 2014. We randomly drew 25 sample villages from these 44 villages in Sub-zone 6A. The same procedure was used for all other sub-zones. Villages were omitted if GPS measurement in the field, when compared with the map, indicated that they were outside the 15-km corridor or buffer zone around flooded areas.
Process of HH selection
The SIMVA 2014 interviewed 16 HHs per sample village. For SIMVA 2018, 14 HHs were randomly selected from the list of 16 HHs in the sample villages for interviews and the two other HHs were used as replacement HHs in case a HH could not be reached or refused to be interviewed after several attempts by the enumerators.
When the enumerators could not locate the HHs in the village to obtain a proper panel data set, they were able to select replacement HHs from the same village. The list of HHs in the village was obtained in advance so that the team could randomly select the replacement HH from the list.
2.3.2 Qualitative survey
In addition to the quantitative survey, qualitative research was used to complement the study. The qualitative research aimed to examine in-depth questions related to the resilience and vulnerabilities of HHs, with a special focus on long-term trends and issues. Each Member Country selected five villages among those already selected for the qualitative research in 2014. The main criteria for selecting the villages was that they were among the ones already selected in the SIMVA 2014 qualitative survey. Selected villages also had to be close to other MRC monitoring sites, e.g. hydrology monitoring stations, to correlate, where possible, community characteristics collected under SIMVA with those gathered in these other monitoring exercises.
The qualitative instruments included in-depth interviews with individuals who were knowledgeable
15
about the issues; (2) FGDs with a group of HHs.
2.4 List of indicators
The goal of the SIMVA study is to analyse the relationship between socio-economic conditions and people’s dependency on water resources to determine their vulnerability to changes in the water resources along the LMB corridor and major wetlands (Songkhram and Tonle Sap).
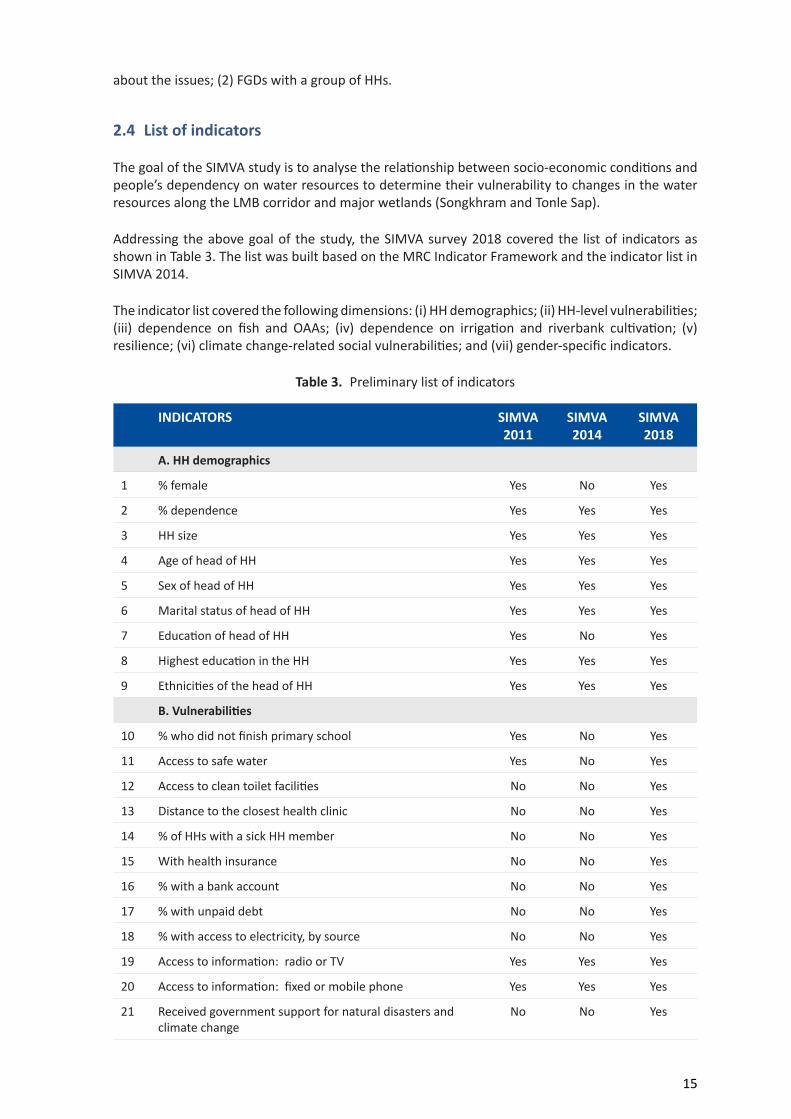
Addressing the above goal of the study, the SIMVA survey 2018 covered the list of indicators as shown in Table 3. The list was built based on the MRC Indicator Framework and the indicator list in SIMVA 2014.
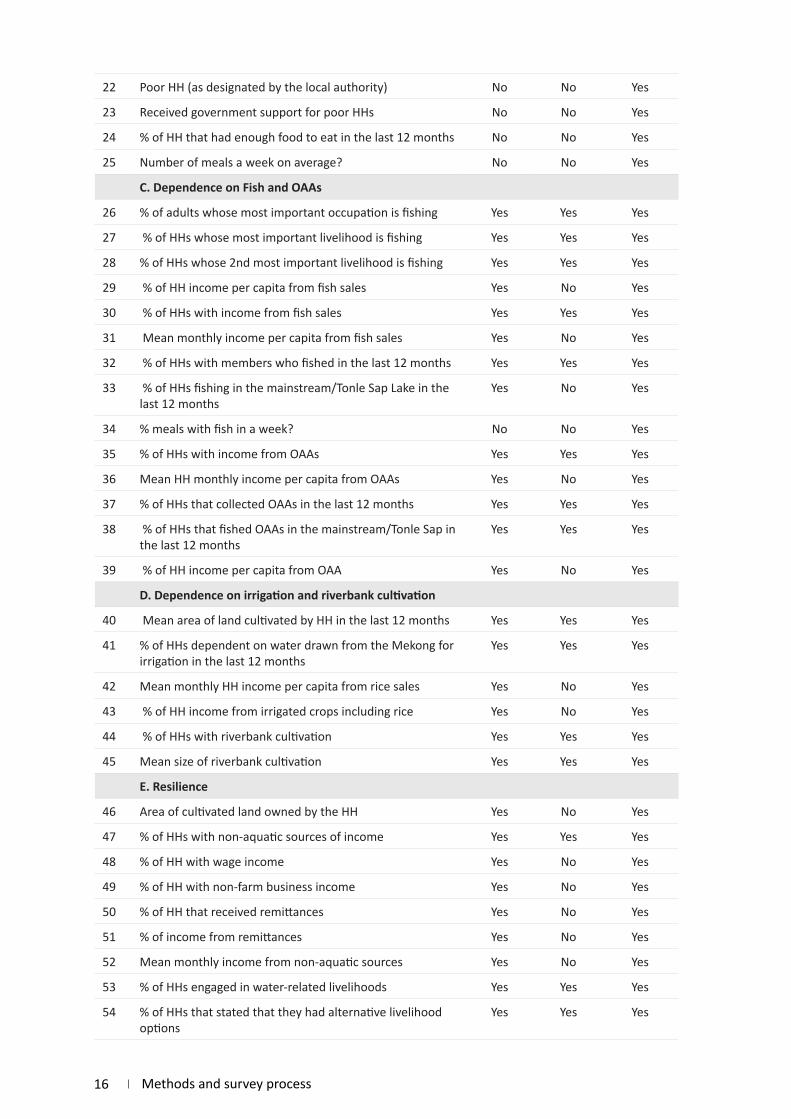
The indicator list covered the following dimensions: (i) HH demographics; (ii) HH-level vulnerabilities; (iii) dependence on fish and OAAs; (iv) dependence on irrigation and riverbank cultivation; (v) resilience; (vi) climate change-related social vulnerabilities; and (vii) gender-specific indicators.
Table 3. Preliminary list of indicators
INDICATORS SIMVA 2011
SIMVA 2014
SIMVA 2018
A. HH demographics
1 % female Yes No Yes
2 % dependence Yes Yes Yes
3 HH size Yes Yes Yes
4 Age of head of HH Yes Yes Yes
5 Sex of head of HH Yes Yes Yes
6 Marital status of head of HH Yes Yes Yes
7 Education of head of HH Yes No Yes
8 Highest education in the HH Yes Yes Yes
9 Ethnicities of the head of HH Yes Yes Yes
B. Vulnerabilities
10 % who did not finish primary school Yes No Yes
11 Access to safe water Yes No Yes
12 Access to clean toilet facilities No No Yes
13 Distance to the closest health clinic No No Yes
14 % of HHs with a sick HH member No No Yes
15 With health insurance No No Yes
16 % with a bank account No No Yes
17 % with unpaid debt No No Yes
18 % with access to electricity, by source No No Yes
19 Access to information: radio or TV Yes Yes Yes
20 Access to information: fixed or mobile phone Yes Yes Yes
21 Received government support for natural disasters and climate change
No No Yes
Methods and survey process16
22 Poor HH (as designated by the local authority) No No Yes
23 Received government support for poor HHs No No Yes
24 % of HH that had enough food to eat in the last 12 months No No Yes
25 Number of meals a week on average? No No Yes
C. Dependence on Fish and OAAs
26 % of adults whose most important occupation is fishing Yes Yes Yes
27 % of HHs whose most important livelihood is fishing Yes Yes Yes
28 % of HHs whose 2nd most important livelihood is fishing Yes Yes Yes
29 % of HH income per capita from fish sales Yes No Yes
30 % of HHs with income from fish sales Yes Yes Yes
31 Mean monthly income per capita from fish sales Yes No Yes
32 % of HHs with members who fished in the last 12 months Yes Yes Yes
33 % of HHs fishing in the mainstream/Tonle Sap Lake in the last 12 months
Yes No Yes
34 % meals with fish in a week? No No Yes
35 % of HHs with income from OAAs Yes Yes Yes
36 Mean HH monthly income per capita from OAAs Yes No Yes
37 % of HHs that collected OAAs in the last 12 months Yes Yes Yes
38 % of HHs that fished OAAs in the mainstream/Tonle Sap in the last 12 months
Yes Yes Yes
39 % of HH income per capita from OAA Yes No Yes
D. Dependence on irrigation and riverbank cultivation
40 Mean area of land cultivated by HH in the last 12 months Yes Yes Yes
41 % of HHs dependent on water drawn from the Mekong for irrigation in the last 12 months
Yes Yes Yes
42 Mean monthly HH income per capita from rice sales Yes No Yes
43 % of HH income from irrigated crops including rice Yes No Yes
44 % of HHs with riverbank cultivation Yes Yes Yes
45 Mean size of riverbank cultivation Yes Yes Yes
E. Resilience
46 Area of cultivated land owned by the HH Yes No Yes
47 % of HHs with non-aquatic sources of income Yes Yes Yes
48 % of HH with wage income Yes No Yes
49 % of HH with non-farm business income Yes No Yes
50 % of HH that received remittances Yes No Yes
51 % of income from remittances Yes No Yes
52 Mean monthly income from non-aquatic sources Yes No Yes
53 % of HHs engaged in water-related livelihoods Yes Yes Yes
54 % of HHs that stated that they had alternative livelihood options
Yes Yes Yes
17
55 Number of livestock units per capita Yes No Yes
F. Climate change-related social vulnerabilities
56 Percentage of loss of cultivation due to floods, droughts, and salinity intrusion
Yes Yes Yes
57 Value of cultivation lost due to floods, droughts and salinity intrusion
Yes Yes Yes
58 Proportion of loss of livestock due to floods and droughts Yes Yes Yes
59 Value of livestock loss due to floods and droughts Yes Yes Yes
60 Average values of property losses due to floods, droughts, and/or other forms of climate variability
Yes Yes Yes
61 Most frequently used coping strategies for floods, droughts, and other forms of climate variability
Yes Yes Yes
G. Gender-specific indicators
62 Labour force participation rates for 15+, by sex No No Yes
63 % of female heads of HHs No No Yes
64 Gap in HH income between female- and male-headed HHs No No Yes
65 Primary completion rate, by sex No No Yes
66 Graduation at upper secondary, by sex No No Yes
67 Education attainment of population aged 25 and over, by sex
No No Yes
68 % of adults who earned wages from the most important and second most important occupation, by sex
No No Yes
69 % of adults whose main occupation is water-related (fishing, collecting OAAs, aquaculture, fish processing, navigation, sand mining), by sex
No No Yes
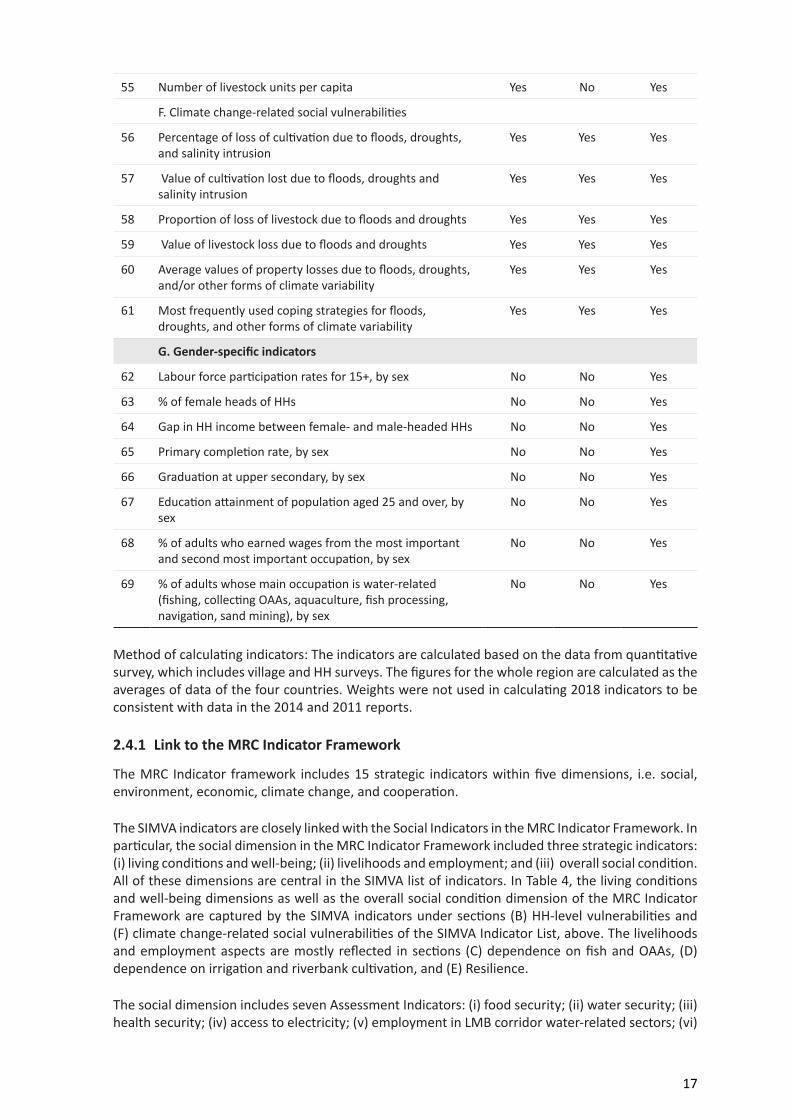
Method of calculating indicators: The indicators are calculated based on the data from quantitative survey, which includes village and HH surveys. The figures for the whole region are calculated as the averages of data of the four countries. Weights were not used in calculating 2018 indicators to be consistent with data in the 2014 and 2011 reports.
2.4.1 Link to the MRC Indicator Framework
The MRC Indicator framework includes 15 strategic indicators within five dimensions, i.e. social, environment, economic, climate change, and cooperation.
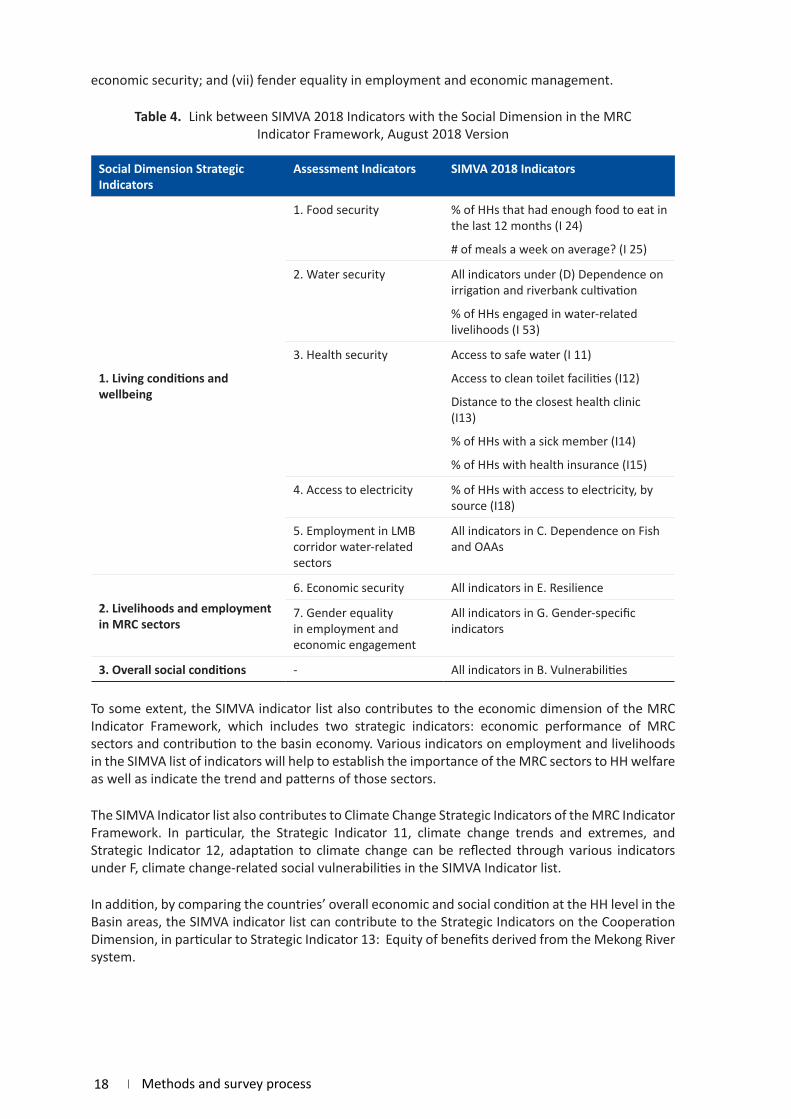
The SIMVA indicators are closely linked with the Social Indicators in the MRC Indicator Framework. In particular, the social dimension in the MRC Indicator Framework included three strategic indicators: (i) living conditions and well-being; (ii) livelihoods and employment; and (iii) overall social condition. All of these dimensions are central in the SIMVA list of indicators. In Table 4, the living conditions and well-being dimensions as well as the overall social condition dimension of the MRC Indicator Framework are captured by the SIMVA indicators under sections (B) HH-level vulnerabilities and (F) climate change-related social vulnerabilities of the SIMVA Indicator List, above. The livelihoods and employment aspects are mostly reflected in sections (C) dependence on fish and OAAs, (D) dependence on irrigation and riverbank cultivation, and (E) Resilience.
The social dimension includes seven Assessment Indicators: (i) food security; (ii) water security; (iii) health security; (iv) access to electricity; (v) employment in LMB corridor water-related sectors; (vi)
Methods and survey process18
economic security; and (vii) fender equality in employment and economic management.
Table 4. Link between SIMVA 2018 Indicators with the Social Dimension in the MRC Indicator Framework, August 2018 Version
Social Dimension Strategic Indicators
Assessment Indicators SIMVA 2018 Indicators
1. Living conditions and wellbeing
1. Food security % of HHs that had enough food to eat in the last 12 months (I 24)
# of meals a week on average? (I 25)
2. Water security All indicators under (D) Dependence on irrigation and riverbank cultivation
% of HHs engaged in water-related livelihoods (I 53)
3. Health security Access to safe water (I 11)
Access to clean toilet facilities (I12)
Distance to the closest health clinic (I13)
% of HHs with a sick member (I14)
% of HHs with health insurance (I15)
4. Access to electricity % of HHs with access to electricity, by source (I18)
5. Employment in LMB corridor water-related sectors
All indicators in C. Dependence on Fish and OAAs
2. Livelihoods and employment in MRC sectors
6. Economic security All indicators in E. Resilience
7. Gender equality in employment and economic engagement
All indicators in G. Gender-specific indicators
3. Overall social conditions - All indicators in B. Vulnerabilities
To some extent, the SIMVA indicator list also contributes to the economic dimension of the MRC Indicator Framework, which includes two strategic indicators: economic performance of MRC sectors and contribution to the basin economy. Various indicators on employment and livelihoods in the SIMVA list of indicators will help to establish the importance of the MRC sectors to HH welfare as well as indicate the trend and patterns of those sectors.
The SIMVA Indicator list also contributes to Climate Change Strategic Indicators of the MRC Indicator Framework. In particular, the Strategic Indicator 11, climate change trends and extremes, and Strategic Indicator 12, adaptation to climate change can be reflected through various indicators under F, climate change-related social vulnerabilities in the SIMVA Indicator list.
In addition, by comparing the countries’ overall economic and social condition at the HH level in the Basin areas, the SIMVA indicator list can contribute to the Strategic Indicators on the Cooperation Dimension, in particular to Strategic Indicator 13: Equity of benefits derived from the Mekong River system.
19
2.4.2 Link with the Sustainable Development Goal indicators.
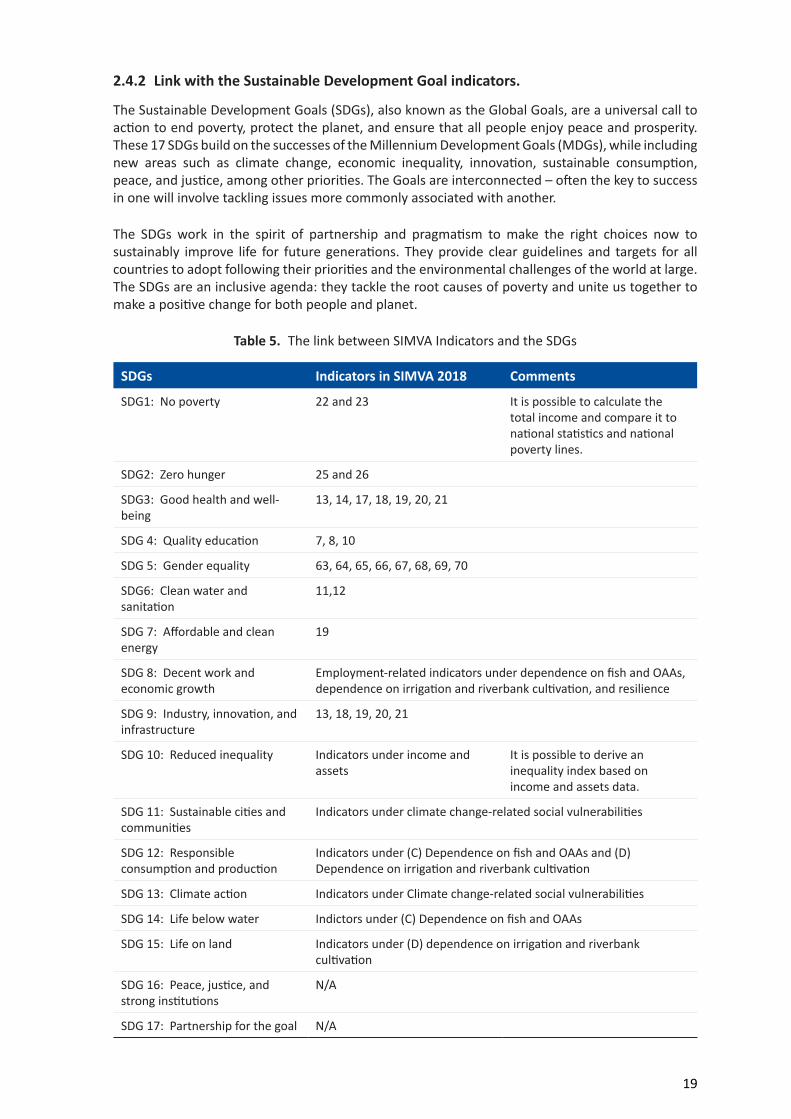
The Sustainable Development Goals (SDGs), also known as the Global Goals, are a universal call to action to end poverty, protect the planet, and ensure that all people enjoy peace and prosperity. These 17 SDGs build on the successes of the Millennium Development Goals (MDGs), while including new areas such as climate change, economic inequality, innovation, sustainable consumption, peace, and justice, among other priorities. The Goals are interconnected – often the key to success in one will involve tackling issues more commonly associated with another.
The SDGs work in the spirit of partnership and pragmatism to make the right choices now to sustainably improve life for future generations. They provide clear guidelines and targets for all countries to adopt following their priorities and the environmental challenges of the world at large. The SDGs are an inclusive agenda: they tackle the root causes of poverty and unite us together to make a positive change for both people and planet.
Table 5. The link between SIMVA Indicators and the SDGs
SDGs Indicators in SIMVA 2018 Comments
SDG1: No poverty 22 and 23 It is possible to calculate the total income and compare it to national statistics and national poverty lines.
SDG2: Zero hunger 25 and 26
SDG3: Good health and well-being
13, 14, 17, 18, 19, 20, 21
SDG 4: Quality education 7, 8, 10
SDG 5: Gender equality 63, 64, 65, 66, 67, 68, 69, 70
SDG6: Clean water and sanitation
11,12
SDG 7: Affordable and clean energy
19
SDG 8: Decent work and economic growth
Employment-related indicators under dependence on fish and OAAs, dependence on irrigation and riverbank cultivation, and resilience
SDG 9: Industry, innovation, and infrastructure
13, 18, 19, 20, 21
SDG 10: Reduced inequality Indicators under income and assets
It is possible to derive an inequality index based on income and assets data.
SDG 11: Sustainable cities and communities
Indicators under climate change-related social vulnerabilities
SDG 12: Responsible consumption and production
Indicators under (C) Dependence on fish and OAAs and (D) Dependence on irrigation and riverbank cultivation
SDG 13: Climate action Indicators under Climate change-related social vulnerabilities
SDG 14: Life below water Indictors under (C) Dependence on fish and OAAs
SDG 15: Life on land Indicators under (D) dependence on irrigation and riverbank cultivation
SDG 16: Peace, justice, and strong institutions
N/A
SDG 17: Partnership for the goal N/A
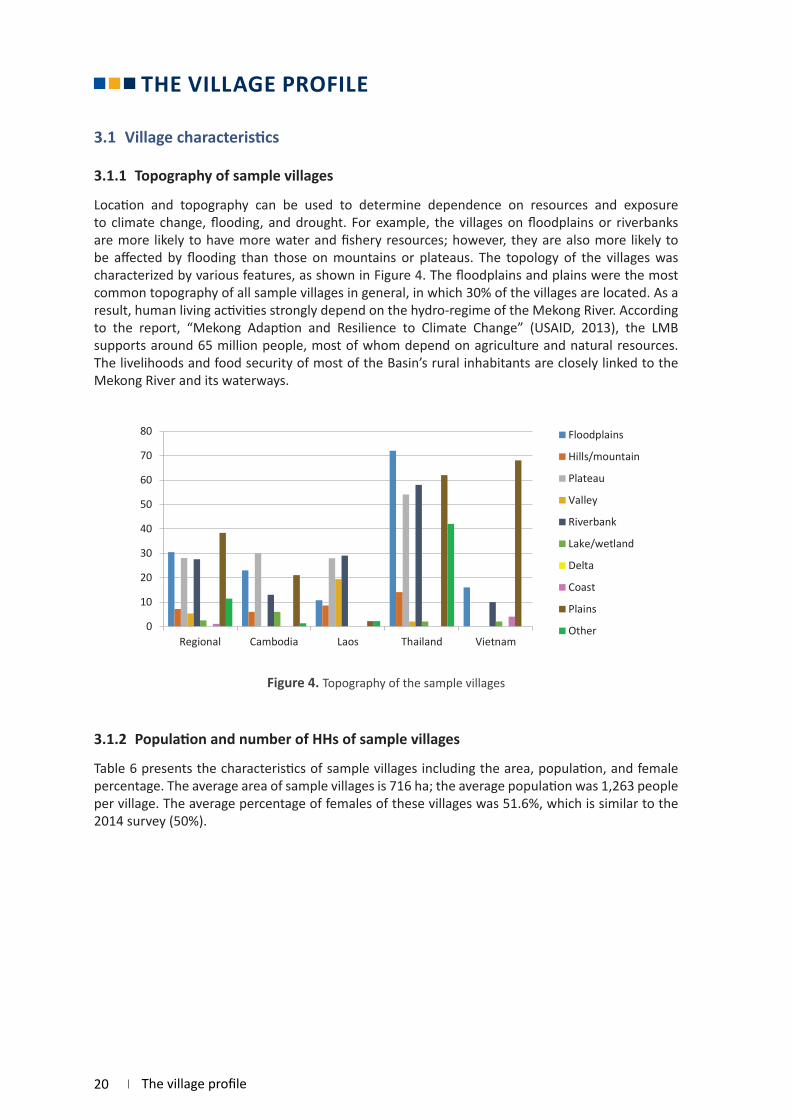
The village profile20
THE VILLAGE PROFILE
3.1 Village characteristics
3.1.1 Topography of sample villages
Location and topography can be used to determine dependence on resources and exposure to climate change, flooding, and drought. For example, the villages on floodplains or riverbanks are more likely to have more water and fishery resources; however, they are also more likely to be affected by flooding than those on mountains or plateaus. The topology of the villages was characterized by various features, as shown in Figure 4. The floodplains and plains were the most common topography of all sample villages in general, in which 30% of the villages are located. As a result, human living activities strongly depend on the hydro-regime of the Mekong River. According to the report, “Mekong Adaption and Resilience to Climate Change” (USAID, 2013), the LMB supports around 65 million people, most of whom depend on agriculture and natural resources. The livelihoods and food security of most of the Basin’s rural inhabitants are closely linked to the Mekong River and its waterways.
0
10
20
30
40
50
60
70
80
Regional Cambodia Laos Thailand Vietnam
Floodplains
Hills/mountain
Plateau
Valley
Riverbank
Lake/wetland
Delta
Coast
Plains
Other
Figure 4. Topography of the sample villages
3.1.2 Population and number of HHs of sample villages
Table 6 presents the characteristics of sample villages including the area, population, and female percentage. The average area of sample villages is 716 ha; the average population was 1,263 people per village. The average percentage of females of these villages was 51.6%, which is similar to the 2014 survey (50%).
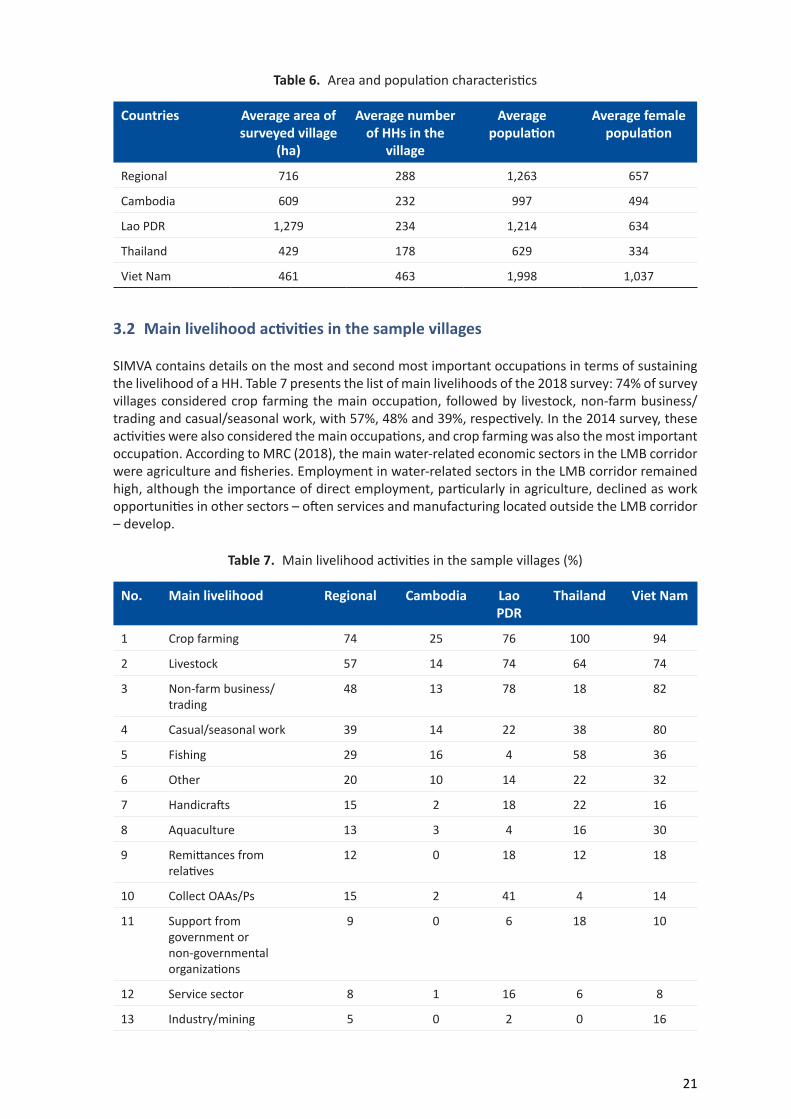
21
Table 6. Area and population characteristics
Countries Average area of surveyed village
(ha)
Average number of HHs in the
village
Average population
Average female population
Regional 716 288 1,263 657
Cambodia 609 232 997 494
Lao PDR 1,279 234 1,214 634
Thailand 429 178 629 334
Viet Nam 461 463 1,998 1,037
3.2 Main livelihood activities in the sample villages
SIMVA contains details on the most and second most important occupations in terms of sustaining the livelihood of a HH. Table 7 presents the list of main livelihoods of the 2018 survey: 74% of survey villages considered crop farming the main occupation, followed by livestock, non-farm business/trading and casual/seasonal work, with 57%, 48% and 39%, respectively. In the 2014 survey, these activities were also considered the main occupations, and crop farming was also the most important occupation. According to MRC (2018), the main water-related economic sectors in the LMB corridor were agriculture and fisheries. Employment in water-related sectors in the LMB corridor remained high, although the importance of direct employment, particularly in agriculture, declined as work opportunities in other sectors – often services and manufacturing located outside the LMB corridor – develop.
Table 7. Main livelihood activities in the sample villages (%)
No. Main livelihood Regional Cambodia Lao PDR
Thailand Viet Nam
1 Crop farming 74 25 76 100 94
2 Livestock 57 14 74 64 74
3 Non-farm business/trading
48 13 78 18 82
4 Casual/seasonal work 39 14 22 38 80
5 Fishing 29 16 4 58 36
6 Other 20 10 14 22 32
7 Handicrafts 15 2 18 22 16
8 Aquaculture 13 3 4 16 30
9 Remittances from relatives
12 0 18 12 18
10 Collect OAAs/Ps 15 2 41 4 14
11 Support from government or non-governmental organizations
9 0 6 18 10
12 Service sector 8 1 16 6 8
13 Industry/mining 5 0 2 0 16
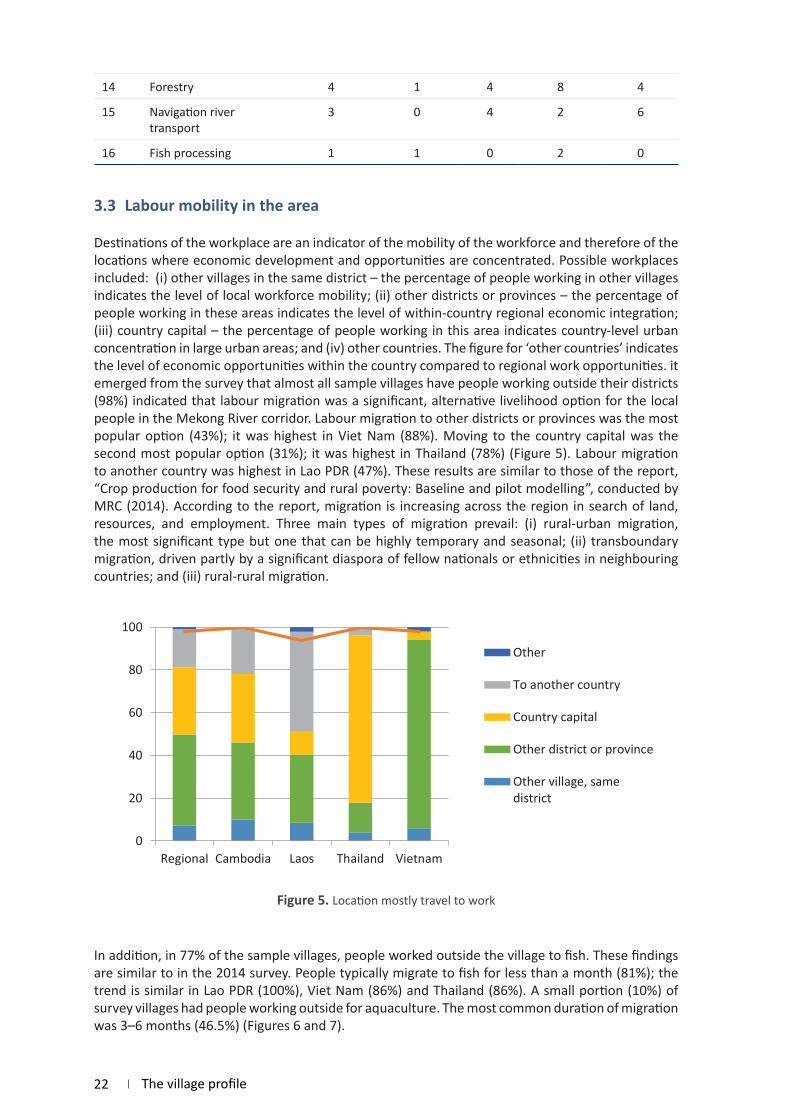
The village profile22
14 Forestry 4 1 4 8 4
15 Navigation river transport
3 0 4 2 6
16 Fish processing 1 1 0 2 0
3.3 Labour mobility in the area
Destinations of the workplace are an indicator of the mobility of the workforce and therefore of the locations where economic development and opportunities are concentrated. Possible workplaces included: (i) other villages in the same district – the percentage of people working in other villages indicates the level of local workforce mobility; (ii) other districts or provinces – the percentage of people working in these areas indicates the level of within-country regional economic integration; (iii) country capital – the percentage of people working in this area indicates country-level urban concentration in large urban areas; and (iv) other countries. The figure for ‘other countries’ indicates the level of economic opportunities within the country compared to regional work opportunities. it emerged from the survey that almost all sample villages have people working outside their districts (98%) indicated that labour migration was a significant, alternative livelihood option for the local people in the Mekong River corridor. Labour migration to other districts or provinces was the most popular option (43%); it was highest in Viet Nam (88%). Moving to the country capital was the second most popular option (31%); it was highest in Thailand (78%) (Figure 5). Labour migration to another country was highest in Lao PDR (47%). These results are similar to those of the report, “Crop production for food security and rural poverty: Baseline and pilot modelling”, conducted by MRC (2014). According to the report, migration is increasing across the region in search of land, resources, and employment. Three main types of migration prevail: (i) rural-urban migration, the most significant type but one that can be highly temporary and seasonal; (ii) transboundary migration, driven partly by a significant diaspora of fellow nationals or ethnicities in neighbouring countries; and (iii) rural-rural migration.
0
20
40
60
80
100
Regional Cambodia Laos Thailand Vietnam
Other
To another country
Country capital
Other district or province
Other village, samedistrict
Figure 5. Location mostly travel to work
In addition, in 77% of the sample villages, people worked outside the village to fish. These findings are similar to in the 2014 survey. People typically migrate to fish for less than a month (81%); the trend is similar in Lao PDR (100%), Viet Nam (86%) and Thailand (86%). A small portion (10%) of survey villages had people working outside for aquaculture. The most common duration of migration was 3–6 months (46.5%) (Figures 6 and 7).
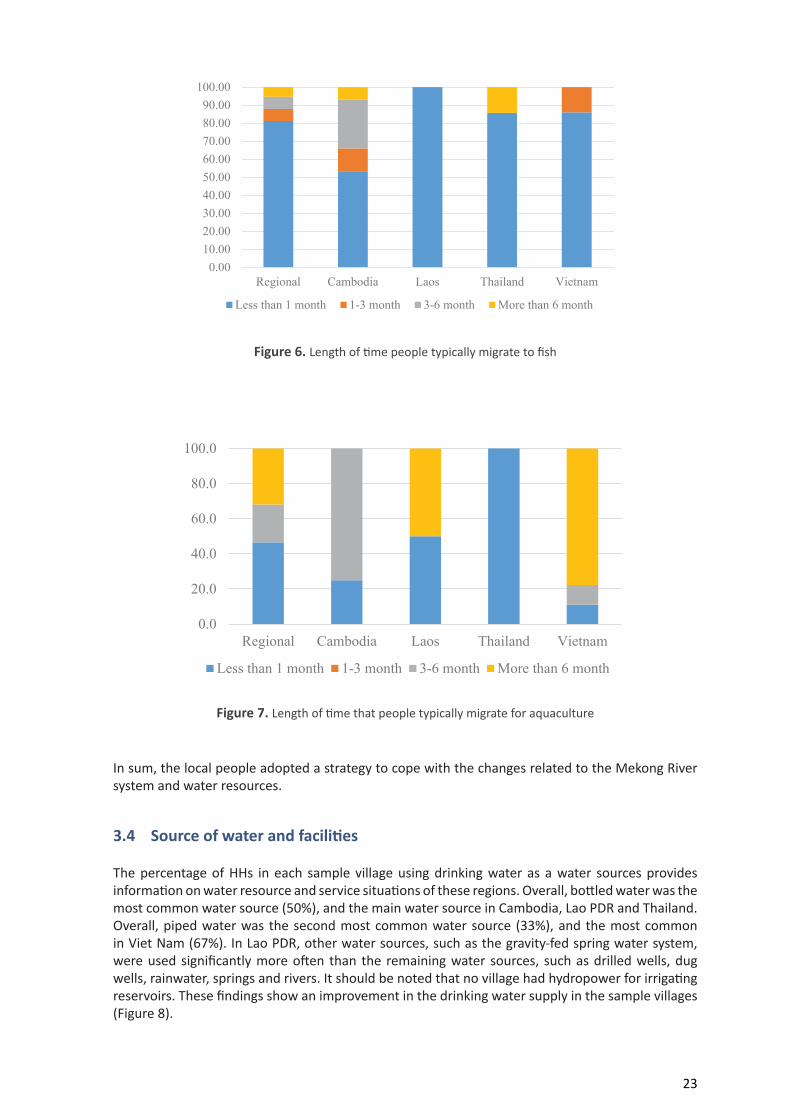
23
0.0010.0020.0030.0040.0050.0060.0070.0080.0090.00
100.00
Regional Cambodia Laos Thailand Vietnam
Less than 1 month 1-3 month 3-6 month More than 6 month
Figure 6. Length of time people typically migrate to fish
0.0
20.0
40.0
60.0
80.0
100.0
Regional Cambodia Laos Thailand Vietnam
Less than 1 month 1-3 month 3-6 month More than 6 month
Figure 7. Length of time that people typically migrate for aquaculture
In sum, the local people adopted a strategy to cope with the changes related to the Mekong River system and water resources.
3.4 Source of water and facilities
The percentage of HHs in each sample village using drinking water as a water sources provides information on water resource and service situations of these regions. Overall, bottled water was the most common water source (50%), and the main water source in Cambodia, Lao PDR and Thailand. Overall, piped water was the second most common water source (33%), and the most common in Viet Nam (67%). In Lao PDR, other water sources, such as the gravity-fed spring water system, were used significantly more often than the remaining water sources, such as drilled wells, dug wells, rainwater, springs and rivers. It should be noted that no village had hydropower for irrigating reservoirs. These findings show an improvement in the drinking water supply in the sample villages (Figure 8).
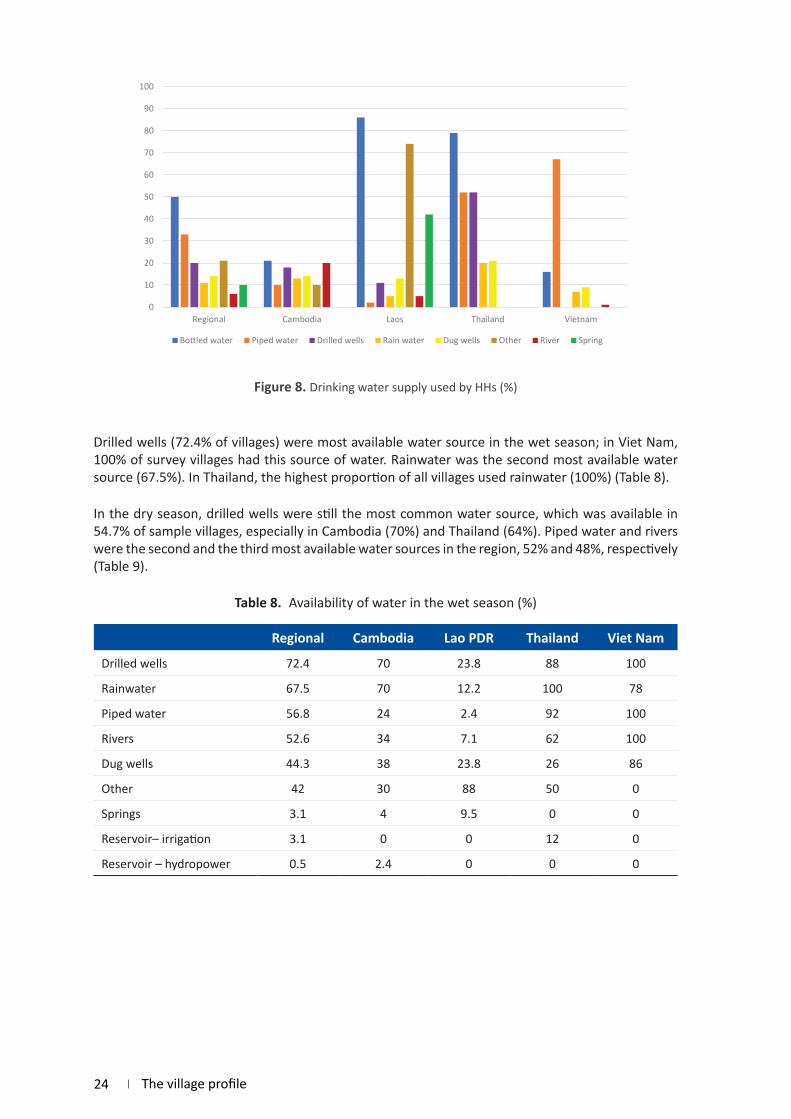
The village profile24
0
10
20
30
40
50
60
70
80
90
100
Regional Cambodia Laos Thailand Vietnam
Bo�led water Piped water Drilled wells Rain water Dug wells Other River Spring
Figure 8. Drinking water supply used by HHs (%)
Drilled wells (72.4% of villages) were most available water source in the wet season; in Viet Nam, 100% of survey villages had this source of water. Rainwater was the second most available water source (67.5%). In Thailand, the highest proportion of all villages used rainwater (100%) (Table 8).
In the dry season, drilled wells were still the most common water source, which was available in 54.7% of sample villages, especially in Cambodia (70%) and Thailand (64%). Piped water and rivers were the second and the third most available water sources in the region, 52% and 48%, respectively (Table 9).
Table 8. Availability of water in the wet season (%)
Regional Cambodia Lao PDR Thailand Viet Nam
Drilled wells 72.4 70 23.8 88 100
Rainwater 67.5 70 12.2 100 78
Piped water 56.8 24 2.4 92 100
Rivers 52.6 34 7.1 62 100
Dug wells 44.3 38 23.8 26 86
Other 42 30 88 50 0
Springs 3.1 4 9.5 0 0
Reservoir– irrigation 3.1 0 0 12 0
Reservoir – hydropower 0.5 2.4 0 0 0
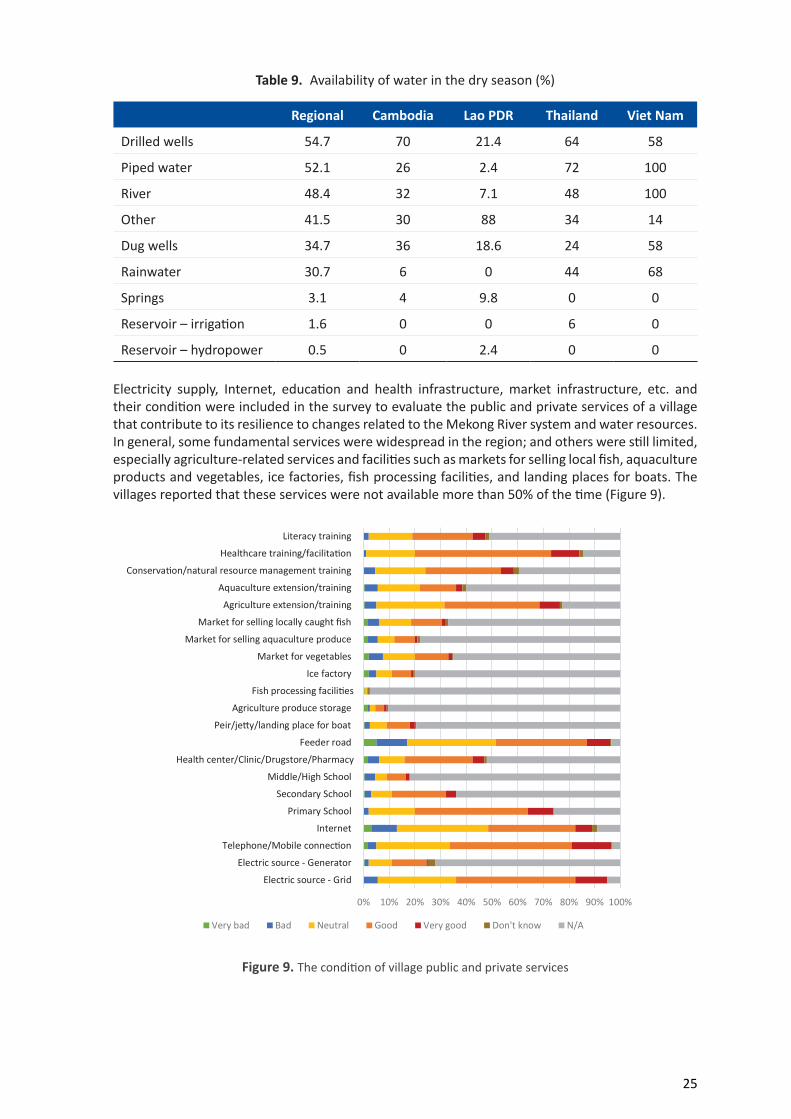
25
Table 9. Availability of water in the dry season (%)
Regional Cambodia Lao PDR Thailand Viet Nam
Drilled wells 54.7 70 21.4 64 58
Piped water 52.1 26 2.4 72 100
River 48.4 32 7.1 48 100
Other 41.5 30 88 34 14
Dug wells 34.7 36 18.6 24 58
Rainwater 30.7 6 0 44 68
Springs 3.1 4 9.8 0 0
Reservoir – irrigation 1.6 0 0 6 0
Reservoir – hydropower 0.5 0 2.4 0 0
Electricity supply, Internet, education and health infrastructure, market infrastructure, etc. and their condition were included in the survey to evaluate the public and private services of a village that contribute to its resilience to changes related to the Mekong River system and water resources. In general, some fundamental services were widespread in the region; and others were still limited, especially agriculture-related services and facilities such as markets for selling local fish, aquaculture products and vegetables, ice factories, fish processing facilities, and landing places for boats. The villages reported that these services were not available more than 50% of the time (Figure 9).
0% 10% 20% 30% 40% 50% 60% 70% 80% 90% 100%
Electric source - Grid
Electric source - Generator
Telephone/Mobile connec�on
Internet
Primary School
Secondary School
Middle/High School
Health center/Clinic/Drugstore/Pharmacy
Feeder road
Peir/je�y/landing place for boat
Agriculture produce storage
Fish processing facili�es
Ice factory
Market for vegetables
Market for selling aquaculture produce
Market for selling locally caught fish
Agriculture extension/training
Aquaculture extension/training
Conserva�on/natural resource management training
Healthcare training/facilita�on
Literacy training
Very bad Bad Neutral Good Very good Don't know N/A
Figure 9. The condition of village public and private services
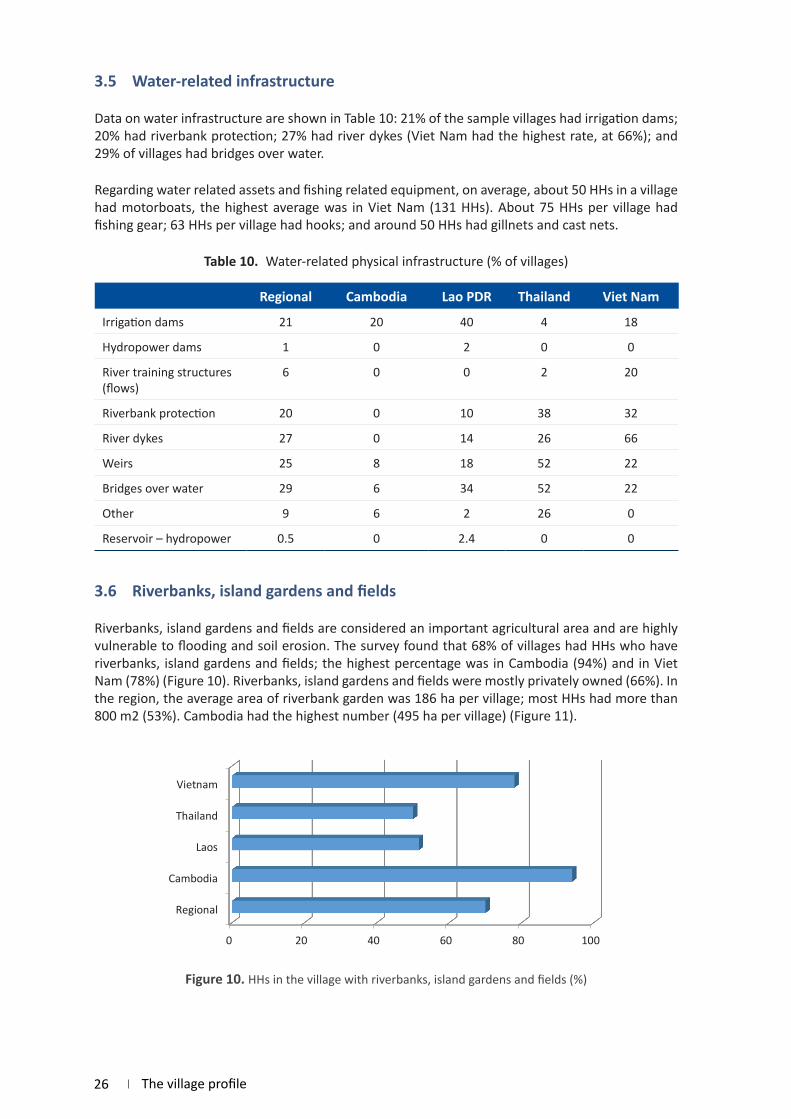
The village profile26
3.5 Water-related infrastructure
Data on water infrastructure are shown in Table 10: 21% of the sample villages had irrigation dams; 20% had riverbank protection; 27% had river dykes (Viet Nam had the highest rate, at 66%); and 29% of villages had bridges over water.
Regarding water related assets and fishing related equipment, on average, about 50 HHs in a village had motorboats, the highest average was in Viet Nam (131 HHs). About 75 HHs per village had fishing gear; 63 HHs per village had hooks; and around 50 HHs had gillnets and cast nets.
Table 10. Water-related physical infrastructure (% of villages)
Regional Cambodia Lao PDR Thailand Viet Nam
Irrigation dams 21 20 40 4 18
Hydropower dams 1 0 2 0 0
River training structures (flows)
6 0 0 2 20
Riverbank protection 20 0 10 38 32
River dykes 27 0 14 26 66
Weirs 25 8 18 52 22
Bridges over water 29 6 34 52 22
Other 9 6 2 26 0
Reservoir – hydropower 0.5 0 2.4 0 0
3.6 Riverbanks, island gardens and fields
Riverbanks, island gardens and fields are considered an important agricultural area and are highly vulnerable to flooding and soil erosion. The survey found that 68% of villages had HHs who have riverbanks, island gardens and fields; the highest percentage was in Cambodia (94%) and in Viet Nam (78%) (Figure 10). Riverbanks, island gardens and fields were mostly privately owned (66%). In the region, the average area of riverbank garden was 186 ha per village; most HHs had more than 800 m2 (53%). Cambodia had the highest number (495 ha per village) (Figure 11).
0 20 40 60 80 100
Regional
Cambodia
Laos
Thailand
Vietnam
Figure 10. HHs in the village with riverbanks, island gardens and fields (%)
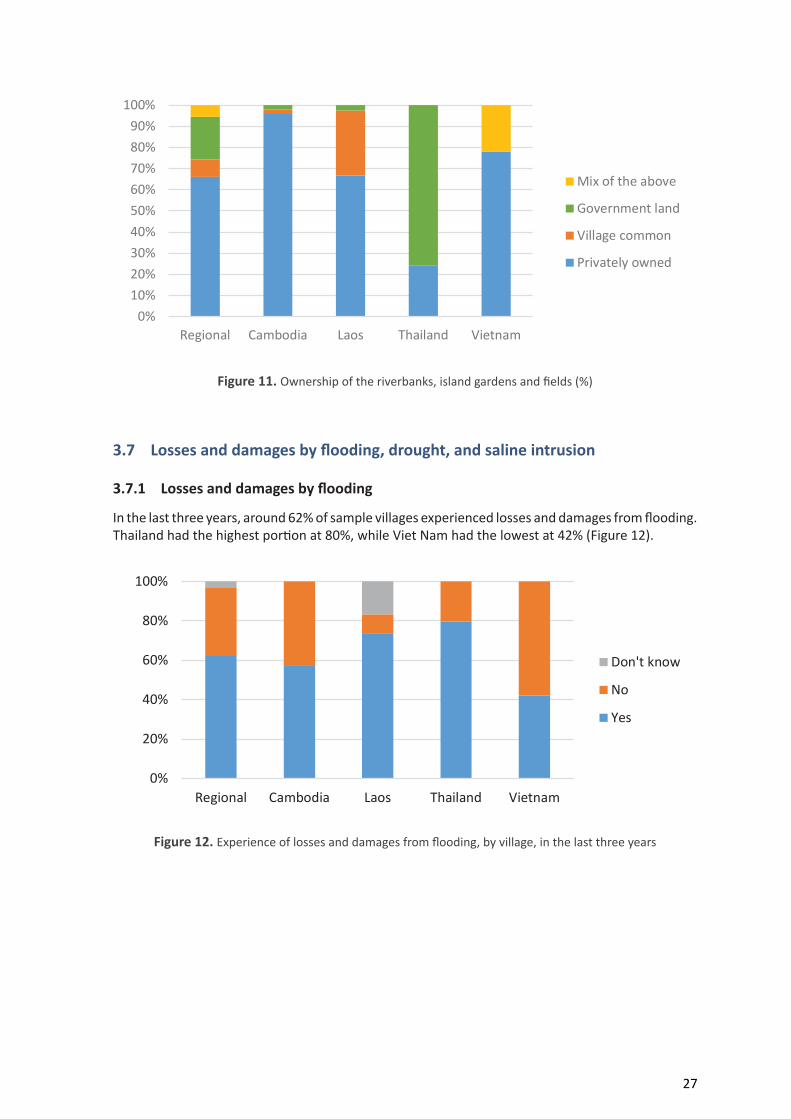
27
0%10%20%30%40%50%60%70%80%90%
100%
Regional Cambodia Laos Thailand Vietnam
Mix of the above
Government land
Village common
Privately owned
Figure 11. Ownership of the riverbanks, island gardens and fields (%)
3.7 Losses and damages by flooding, drought, and saline intrusion
3.7.1 Losses and damages by flooding
In the last three years, around 62% of sample villages experienced losses and damages from flooding. Thailand had the highest portion at 80%, while Viet Nam had the lowest at 42% (Figure 12).
0%
20%
40%
60%
80%
100%
Regional Cambodia Laos Thailand Vietnam
Don't know
No
Yes
Figure 12. Experience of losses and damages from flooding, by village, in the last three years
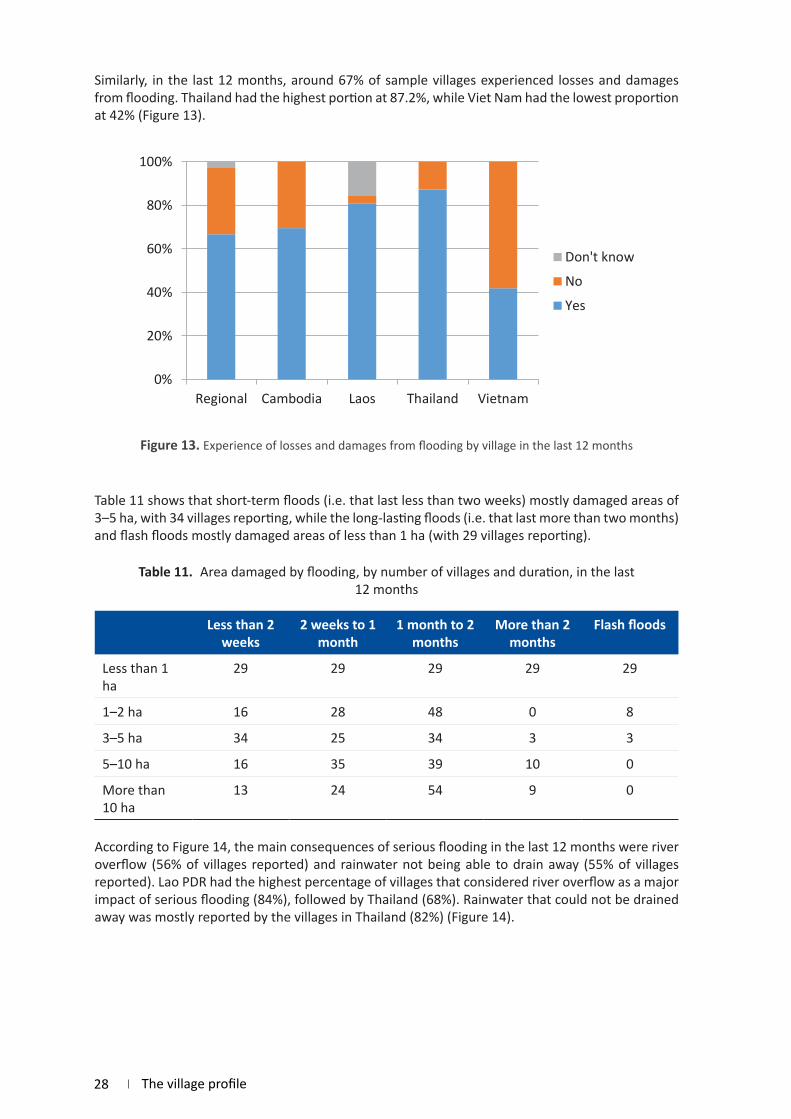
The village profile28
Similarly, in the last 12 months, around 67% of sample villages experienced losses and damages from flooding. Thailand had the highest portion at 87.2%, while Viet Nam had the lowest proportion at 42% (Figure 13).
0%
20%
40%
60%
80%
100%
Regional Cambodia Laos Thailand Vietnam
Don't know
No
Yes
Figure 13. Experience of losses and damages from flooding by village in the last 12 months
Table 11 shows that short-term floods (i.e. that last less than two weeks) mostly damaged areas of 3–5 ha, with 34 villages reporting, while the long-lasting floods (i.e. that last more than two months) and flash floods mostly damaged areas of less than 1 ha (with 29 villages reporting).
Table 11. Area damaged by flooding, by number of villages and duration, in the last 12 months
Less than 2 weeks
2 weeks to 1 month
1 month to 2 months
More than 2 months
Flash floods
Less than 1 ha
29 29 29 29 29
1–2 ha 16 28 48 0 8
3–5 ha 34 25 34 3 3
5–10 ha 16 35 39 10 0
More than 10 ha
13 24 54 9 0
According to Figure 14, the main consequences of serious flooding in the last 12 months were river overflow (56% of villages reported) and rainwater not being able to drain away (55% of villages reported). Lao PDR had the highest percentage of villages that considered river overflow as a major impact of serious flooding (84%), followed by Thailand (68%). Rainwater that could not be drained away was mostly reported by the villages in Thailand (82%) (Figure 14).
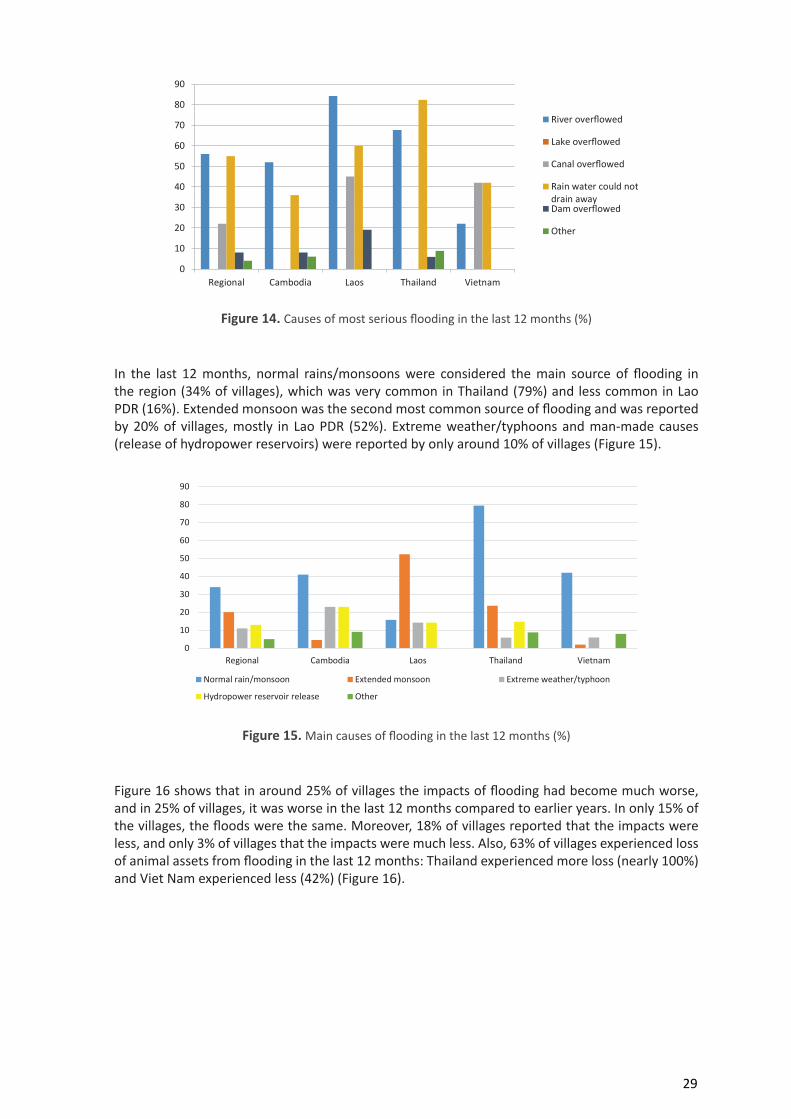
29
0
10
20
30
40
50
60
70
80
90
Regional Cambodia Laos Thailand Vietnam
River overflowed
Lake overflowed
Canal overflowed
Rain water could notdrain awayDam overflowed
Other
Figure 14. Causes of most serious flooding in the last 12 months (%)
In the last 12 months, normal rains/monsoons were considered the main source of flooding in the region (34% of villages), which was very common in Thailand (79%) and less common in Lao PDR (16%). Extended monsoon was the second most common source of flooding and was reported by 20% of villages, mostly in Lao PDR (52%). Extreme weather/typhoons and man-made causes (release of hydropower reservoirs) were reported by only around 10% of villages (Figure 15).
0
10
20
30
40
50
60
70
80
90
Regional Cambodia Laos Thailand Vietnam
Normal rain/monsoon Extended monsoon Extreme weather/typhoon
Hydropower reservoir release Other
Figure 15. Main causes of flooding in the last 12 months (%)
Figure 16 shows that in around 25% of villages the impacts of flooding had become much worse, and in 25% of villages, it was worse in the last 12 months compared to earlier years. In only 15% of the villages, the floods were the same. Moreover, 18% of villages reported that the impacts were less, and only 3% of villages that the impacts were much less. Also, 63% of villages experienced loss of animal assets from flooding in the last 12 months: Thailand experienced more loss (nearly 100%) and Viet Nam experienced less (42%) (Figure 16).
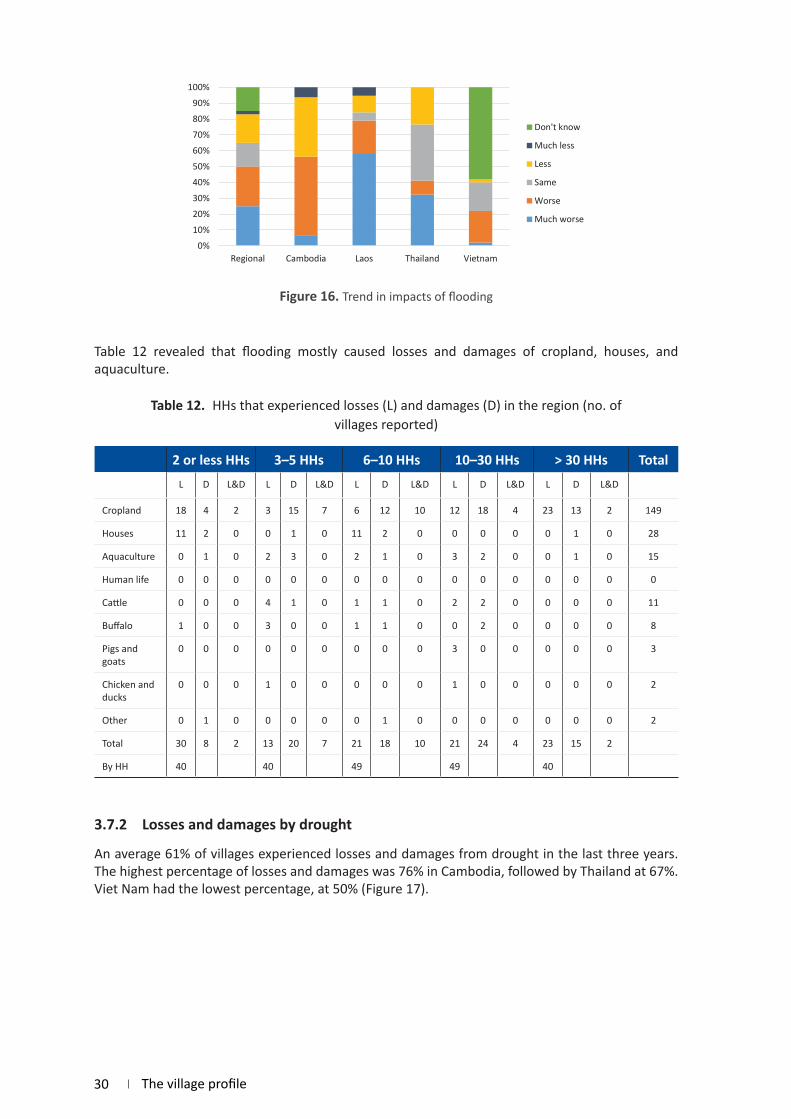
The village profile30
0%
10%
20%
30%
40%
50%
60%
70%
80%
90%
100%
Regional Cambodia Laos Thailand Vietnam
Don't know
Much less
Less
Same
Worse
Much worse
Figure 16. Trend in impacts of flooding
Table 12 revealed that flooding mostly caused losses and damages of cropland, houses, and aquaculture.
Table 12. HHs that experienced losses (L) and damages (D) in the region (no. of villages reported)
2 or less HHs 3–5 HHs 6–10 HHs 10–30 HHs > 30 HHs TotalL D L&D L D L&D L D L&D L D L&D L D L&D
Cropland 18 4 2 3 15 7 6 12 10 12 18 4 23 13 2 149
Houses 11 2 0 0 1 0 11 2 0 0 0 0 0 1 0 28
Aquaculture 0 1 0 2 3 0 2 1 0 3 2 0 0 1 0 15
Human life 0 0 0 0 0 0 0 0 0 0 0 0 0 0 0 0
Cattle 0 0 0 4 1 0 1 1 0 2 2 0 0 0 0 11
Buffalo 1 0 0 3 0 0 1 1 0 0 2 0 0 0 0 8
Pigs and goats
0 0 0 0 0 0 0 0 0 3 0 0 0 0 0 3
Chicken and ducks
0 0 0 1 0 0 0 0 0 1 0 0 0 0 0 2
Other 0 1 0 0 0 0 0 1 0 0 0 0 0 0 0 2
Total 30 8 2 13 20 7 21 18 10 21 24 4 23 15 2
By HH 40 40 49 49 40
3.7.2 Losses and damages by drought
An average 61% of villages experienced losses and damages from drought in the last three years. The highest percentage of losses and damages was 76% in Cambodia, followed by Thailand at 67%. Viet Nam had the lowest percentage, at 50% (Figure 17).
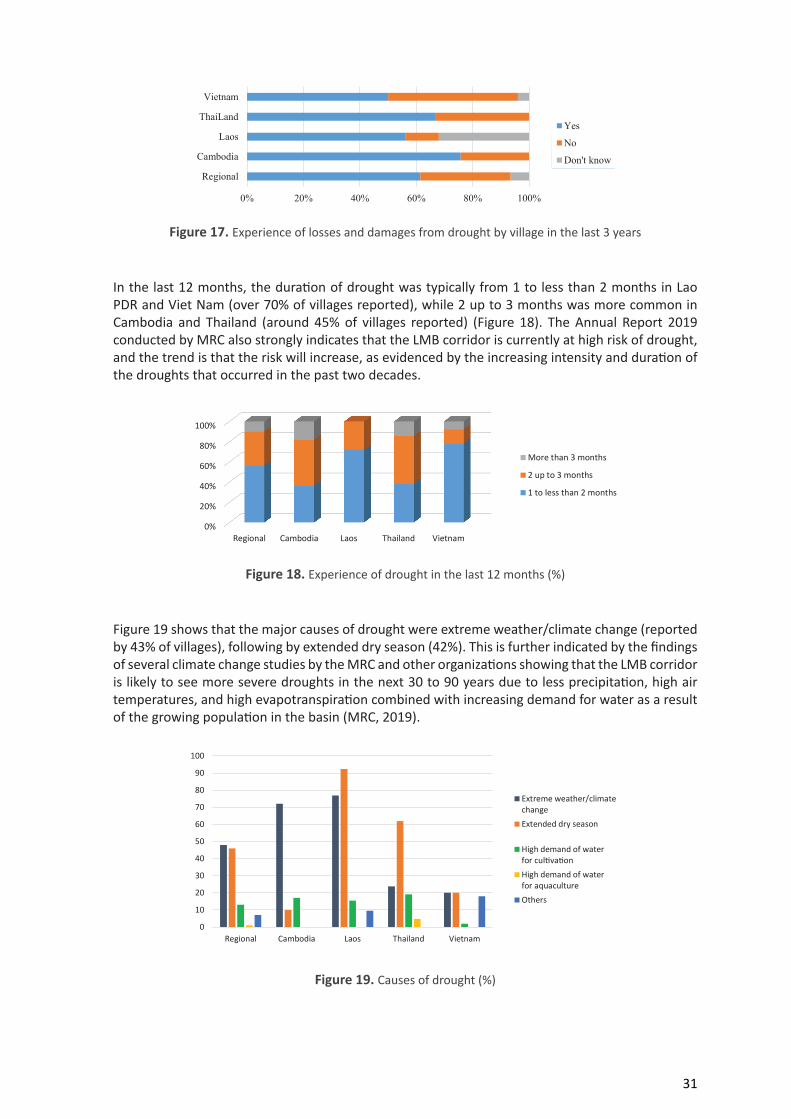
31
0% 20% 40% 60% 80% 100%
Regional
Cambodia
Laos
ThaiLand
Vietnam
Yes
No
Don't know
Figure 17. Experience of losses and damages from drought by village in the last 3 years
In the last 12 months, the duration of drought was typically from 1 to less than 2 months in Lao PDR and Viet Nam (over 70% of villages reported), while 2 up to 3 months was more common in Cambodia and Thailand (around 45% of villages reported) (Figure 18). The Annual Report 2019 conducted by MRC also strongly indicates that the LMB corridor is currently at high risk of drought, and the trend is that the risk will increase, as evidenced by the increasing intensity and duration of the droughts that occurred in the past two decades.
0%
20%
40%
60%
80%
100%
Regional Cambodia Laos Thailand Vietnam
More than 3 months
2 up to 3 months
1 to less than 2 months
Figure 18. Experience of drought in the last 12 months (%)
Figure 19 shows that the major causes of drought were extreme weather/climate change (reported by 43% of villages), following by extended dry season (42%). This is further indicated by the findings of several climate change studies by the MRC and other organizations showing that the LMB corridor is likely to see more severe droughts in the next 30 to 90 years due to less precipitation, high air temperatures, and high evapotranspiration combined with increasing demand for water as a result of the growing population in the basin (MRC, 2019).
0
10
20
30
40
50
60
70
80
90
100
Regional Cambodia Laos Thailand Vietnam
Extreme weather/climatechangeExtended dry season
High demand of waterfor cul�va�onHigh demand of waterfor aquacultureOthers
Figure 19. Causes of drought (%)
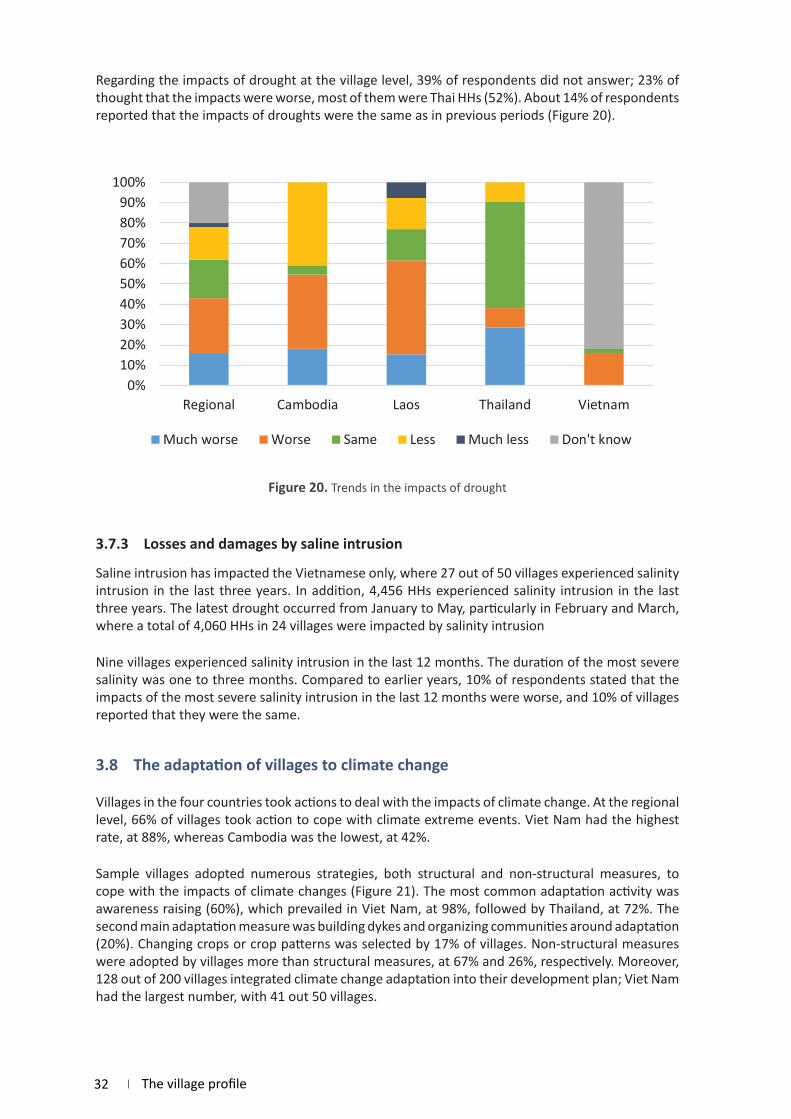
The village profile32
Regarding the impacts of drought at the village level, 39% of respondents did not answer; 23% of thought that the impacts were worse, most of them were Thai HHs (52%). About 14% of respondents reported that the impacts of droughts were the same as in previous periods (Figure 20).
0%10%20%30%40%50%60%70%80%90%
100%
Regional Cambodia Laos Thailand Vietnam
Much worse Worse Same Less Much less Don't know
Figure 20. Trends in the impacts of drought
3.7.3 Losses and damages by saline intrusion
Saline intrusion has impacted the Vietnamese only, where 27 out of 50 villages experienced salinity intrusion in the last three years. In addition, 4,456 HHs experienced salinity intrusion in the last three years. The latest drought occurred from January to May, particularly in February and March, where a total of 4,060 HHs in 24 villages were impacted by salinity intrusion
Nine villages experienced salinity intrusion in the last 12 months. The duration of the most severe salinity was one to three months. Compared to earlier years, 10% of respondents stated that the impacts of the most severe salinity intrusion in the last 12 months were worse, and 10% of villages reported that they were the same.
3.8 The adaptation of villages to climate change
Villages in the four countries took actions to deal with the impacts of climate change. At the regional level, 66% of villages took action to cope with climate extreme events. Viet Nam had the highest rate, at 88%, whereas Cambodia was the lowest, at 42%.
Sample villages adopted numerous strategies, both structural and non-structural measures, to cope with the impacts of climate changes (Figure 21). The most common adaptation activity was awareness raising (60%), which prevailed in Viet Nam, at 98%, followed by Thailand, at 72%. The second main adaptation measure was building dykes and organizing communities around adaptation (20%). Changing crops or crop patterns was selected by 17% of villages. Non-structural measures were adopted by villages more than structural measures, at 67% and 26%, respectively. Moreover, 128 out of 200 villages integrated climate change adaptation into their development plan; Viet Nam had the largest number, with 41 out 50 villages.
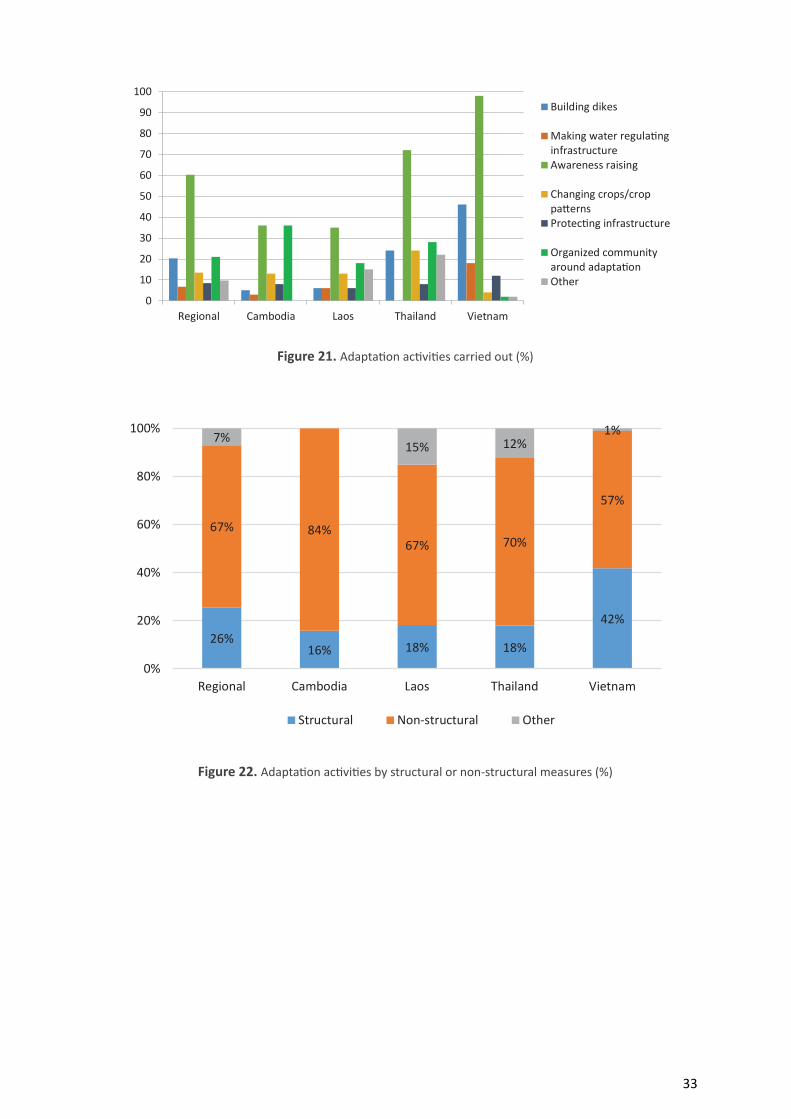
33
0
10
20
30
40
50
60
70
80
90
100
Regional Cambodia Laos Thailand Vietnam
Building dikes
Making water regula�nginfrastructureAwareness raising
Changing crops/croppa�ernsProtec�ng infrastructure
Organized communityaround adapta�onOther
Figure 21. Adaptation activities carried out (%)
26%16% 18% 18%
42%
67% 84%67% 70%
57%
7%15% 12%
1%
0%
20%
40%
60%
80%
100%
Regional Cambodia Laos Thailand Vietnam
Structural Non-structural Other
Figure 22. Adaptation activities by structural or non-structural measures (%)
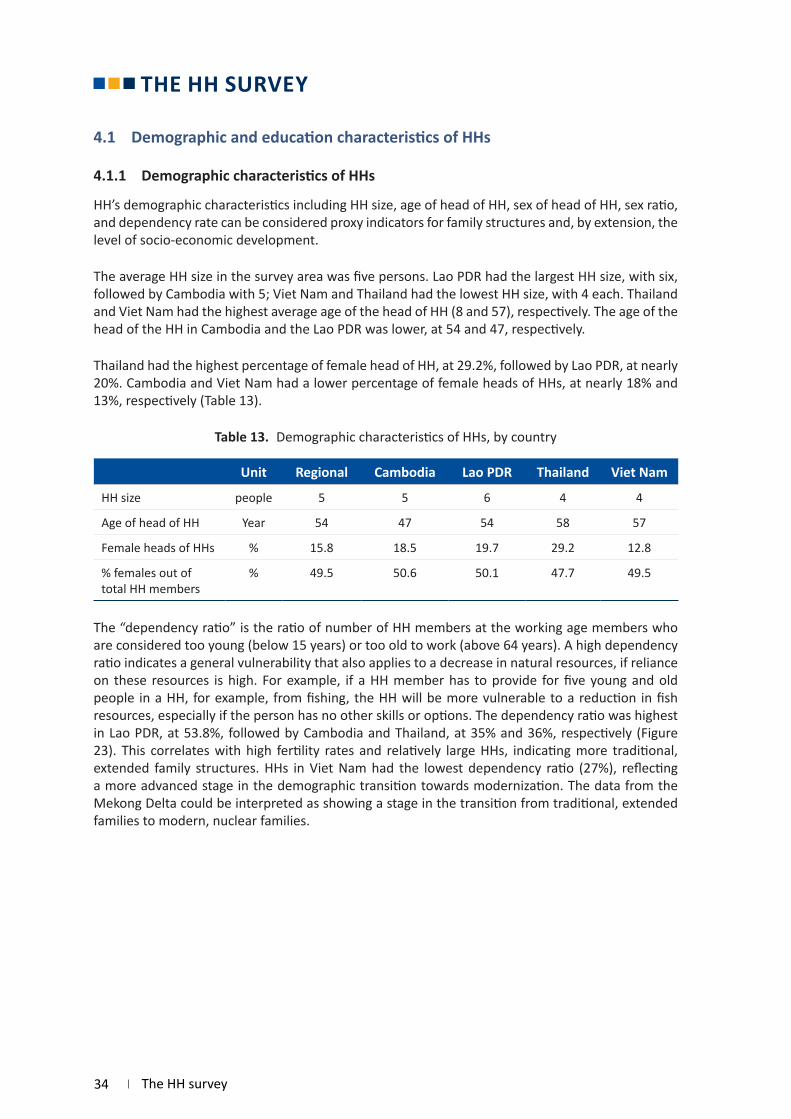
The HH survey34
THE HH SURVEY
4.1 Demographic and education characteristics of HHs
4.1.1 Demographic characteristics of HHs
HH’s demographic characteristics including HH size, age of head of HH, sex of head of HH, sex ratio, and dependency rate can be considered proxy indicators for family structures and, by extension, the level of socio-economic development.
The average HH size in the survey area was five persons. Lao PDR had the largest HH size, with six, followed by Cambodia with 5; Viet Nam and Thailand had the lowest HH size, with 4 each. Thailand and Viet Nam had the highest average age of the head of HH (8 and 57), respectively. The age of the head of the HH in Cambodia and the Lao PDR was lower, at 54 and 47, respectively.
Thailand had the highest percentage of female head of HH, at 29.2%, followed by Lao PDR, at nearly 20%. Cambodia and Viet Nam had a lower percentage of female heads of HHs, at nearly 18% and 13%, respectively (Table 13).
Table 13. Demographic characteristics of HHs, by country
Unit Regional Cambodia Lao PDR Thailand Viet Nam
HH size people 5 5 6 4 4
Age of head of HH Year 54 47 54 58 57
Female heads of HHs % 15.8 18.5 19.7 29.2 12.8
% females out of total HH members
% 49.5 50.6 50.1 47.7 49.5
The “dependency ratio” is the ratio of number of HH members at the working age members who are considered too young (below 15 years) or too old to work (above 64 years). A high dependency ratio indicates a general vulnerability that also applies to a decrease in natural resources, if reliance on these resources is high. For example, if a HH member has to provide for five young and old people in a HH, for example, from fishing, the HH will be more vulnerable to a reduction in fish resources, especially if the person has no other skills or options. The dependency ratio was highest in Lao PDR, at 53.8%, followed by Cambodia and Thailand, at 35% and 36%, respectively (Figure 23). This correlates with high fertility rates and relatively large HHs, indicating more traditional, extended family structures. HHs in Viet Nam had the lowest dependency ratio (27%), reflecting a more advanced stage in the demographic transition towards modernization. The data from the Mekong Delta could be interpreted as showing a stage in the transition from traditional, extended families to modern, nuclear families.
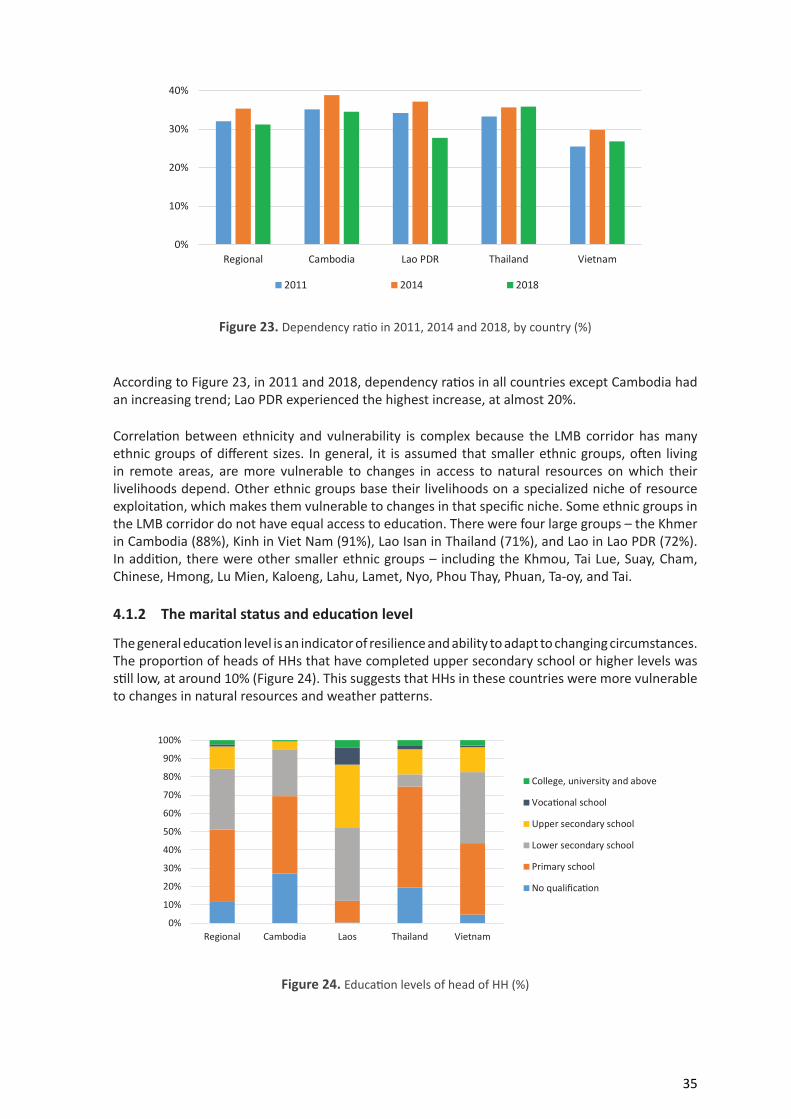
35
0%
10%
20%
30%
40%
Regional Cambodia Lao PDR Thailand Vietnam
2011 2014 2018
Figure 23. Dependency ratio in 2011, 2014 and 2018, by country (%)
According to Figure 23, in 2011 and 2018, dependency ratios in all countries except Cambodia had an increasing trend; Lao PDR experienced the highest increase, at almost 20%.
Correlation between ethnicity and vulnerability is complex because the LMB corridor has many ethnic groups of different sizes. In general, it is assumed that smaller ethnic groups, often living in remote areas, are more vulnerable to changes in access to natural resources on which their livelihoods depend. Other ethnic groups base their livelihoods on a specialized niche of resource exploitation, which makes them vulnerable to changes in that specific niche. Some ethnic groups in the LMB corridor do not have equal access to education. There were four large groups – the Khmer in Cambodia (88%), Kinh in Viet Nam (91%), Lao Isan in Thailand (71%), and Lao in Lao PDR (72%). In addition, there were other smaller ethnic groups – including the Khmou, Tai Lue, Suay, Cham, Chinese, Hmong, Lu Mien, Kaloeng, Lahu, Lamet, Nyo, Phou Thay, Phuan, Ta-oy, and Tai.
4.1.2 The marital status and education level
The general education level is an indicator of resilience and ability to adapt to changing circumstances. The proportion of heads of HHs that have completed upper secondary school or higher levels was still low, at around 10% (Figure 24). This suggests that HHs in these countries were more vulnerable to changes in natural resources and weather patterns.
0%
10%
20%
30%
40%
50%
60%
70%
80%
90%
100%
Regional Cambodia Laos Thailand Vietnam
College, university and above
Voca�onal school
Upper secondary school
Lower secondary school
Primary school
No qualifica�on
Figure 24. Education levels of head of HH (%)
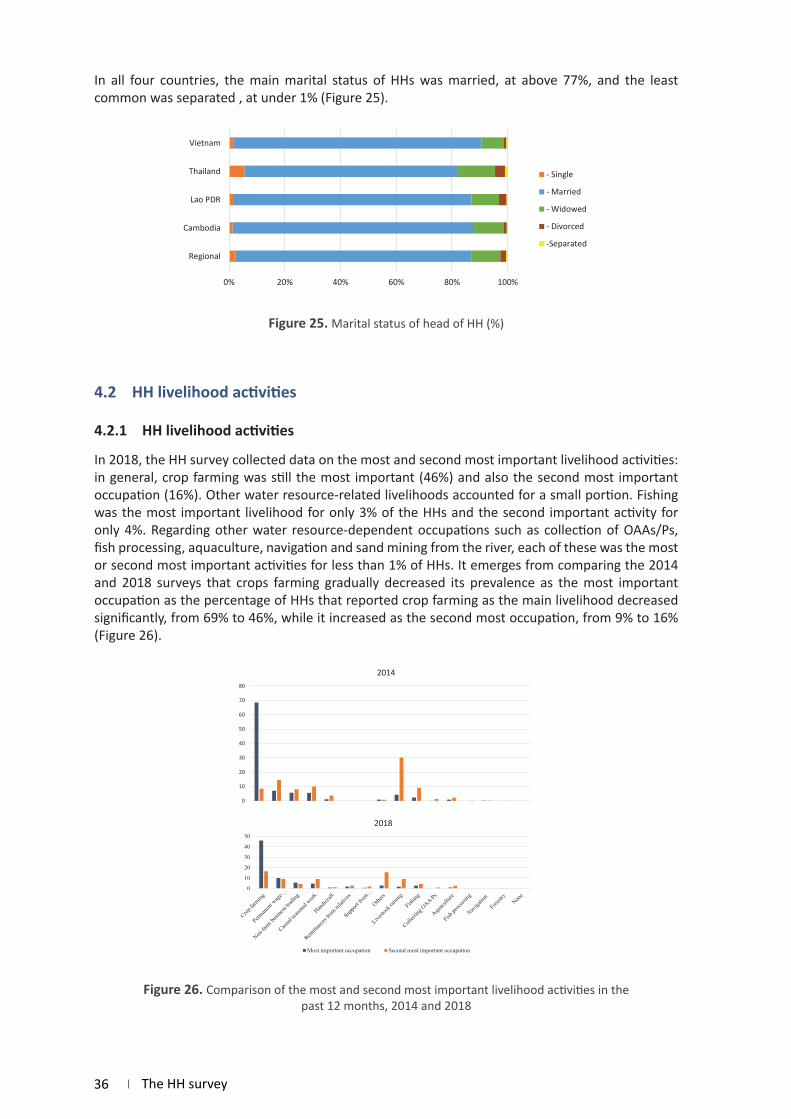
The HH survey36
In all four countries, the main marital status of HHs was married, at above 77%, and the least common was separated , at under 1% (Figure 25).
0% 20% 40% 60% 80% 100%
Regional
Cambodia
Lao PDR
Thailand
Vietnam
- Single
- Married
- Widowed
- Divorced
-Separated
Figure 25. Marital status of head of HH (%)
4.2 HH livelihood activities
4.2.1 HH livelihood activities
In 2018, the HH survey collected data on the most and second most important livelihood activities: in general, crop farming was still the most important (46%) and also the second most important occupation (16%). Other water resource-related livelihoods accounted for a small portion. Fishing was the most important livelihood for only 3% of the HHs and the second important activity for only 4%. Regarding other water resource-dependent occupations such as collection of OAAs/Ps, fish processing, aquaculture, navigation and sand mining from the river, each of these was the most or second most important activities for less than 1% of HHs. It emerges from comparing the 2014 and 2018 surveys that crops farming gradually decreased its prevalence as the most important occupation as the percentage of HHs that reported crop farming as the main livelihood decreased significantly, from 69% to 46%, while it increased as the second most occupation, from 9% to 16% (Figure 26).
0
10
20
30
40
50
60
70
80
2014
0
10
20
30
40
50
2018
Most important occupation Second most important occupation
Figure 26. Comparison of the most and second most important livelihood activities in the past 12 months, 2014 and 2018
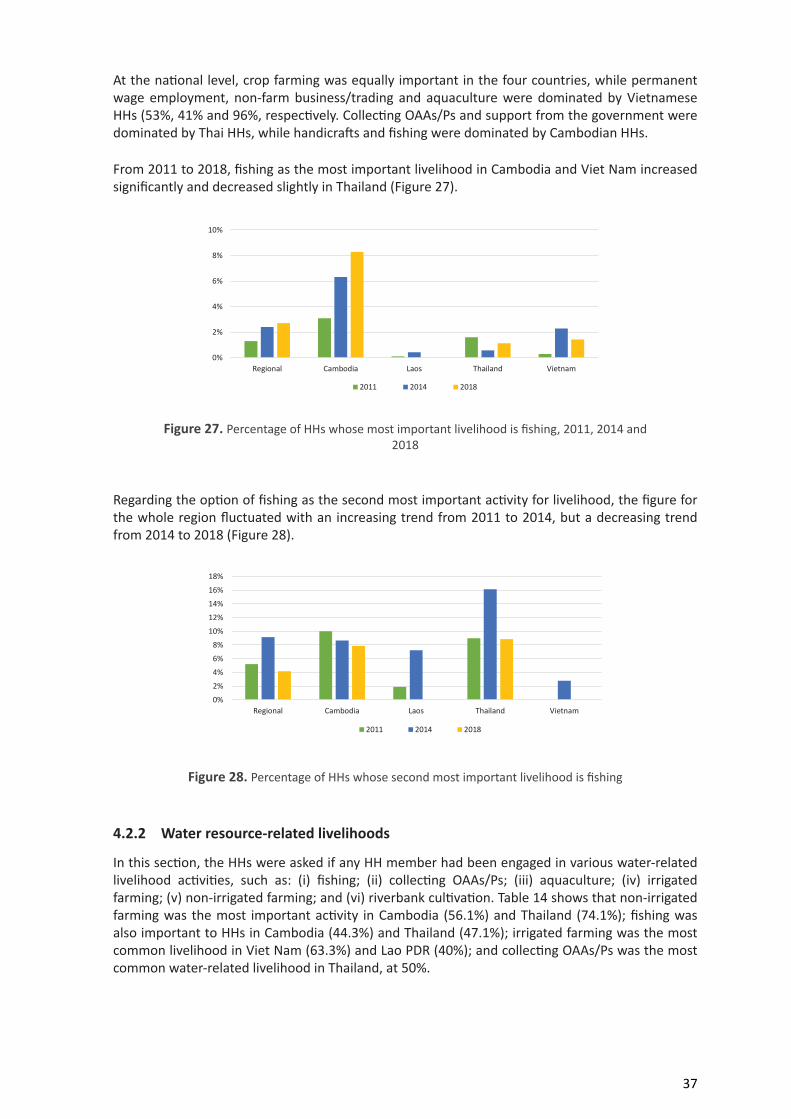
37
At the national level, crop farming was equally important in the four countries, while permanent wage employment, non-farm business/trading and aquaculture were dominated by Vietnamese HHs (53%, 41% and 96%, respectively. Collecting OAAs/Ps and support from the government were dominated by Thai HHs, while handicrafts and fishing were dominated by Cambodian HHs.
From 2011 to 2018, fishing as the most important livelihood in Cambodia and Viet Nam increased significantly and decreased slightly in Thailand (Figure 27).
0%
2%
4%
6%
8%
10%
Regional Cambodia Laos Thailand Vietnam
2011 2014 2018
Figure 27. Percentage of HHs whose most important livelihood is fishing, 2011, 2014 and 2018
Regarding the option of fishing as the second most important activity for livelihood, the figure for the whole region fluctuated with an increasing trend from 2011 to 2014, but a decreasing trend from 2014 to 2018 (Figure 28).
0%
2%
4%
6%
8%
10%
12%
14%
16%
18%
Regional Cambodia Laos Thailand Vietnam
2011 2014 2018
Figure 28. Percentage of HHs whose second most important livelihood is fishing
4.2.2 Water resource-related livelihoods
In this section, the HHs were asked if any HH member had been engaged in various water-related livelihood activities, such as: (i) fishing; (ii) collecting OAAs/Ps; (iii) aquaculture; (iv) irrigated farming; (v) non-irrigated farming; and (vi) riverbank cultivation. Table 14 shows that non-irrigated farming was the most important activity in Cambodia (56.1%) and Thailand (74.1%); fishing was also important to HHs in Cambodia (44.3%) and Thailand (47.1%); irrigated farming was the most common livelihood in Viet Nam (63.3%) and Lao PDR (40%); and collecting OAAs/Ps was the most common water-related livelihood in Thailand, at 50%.
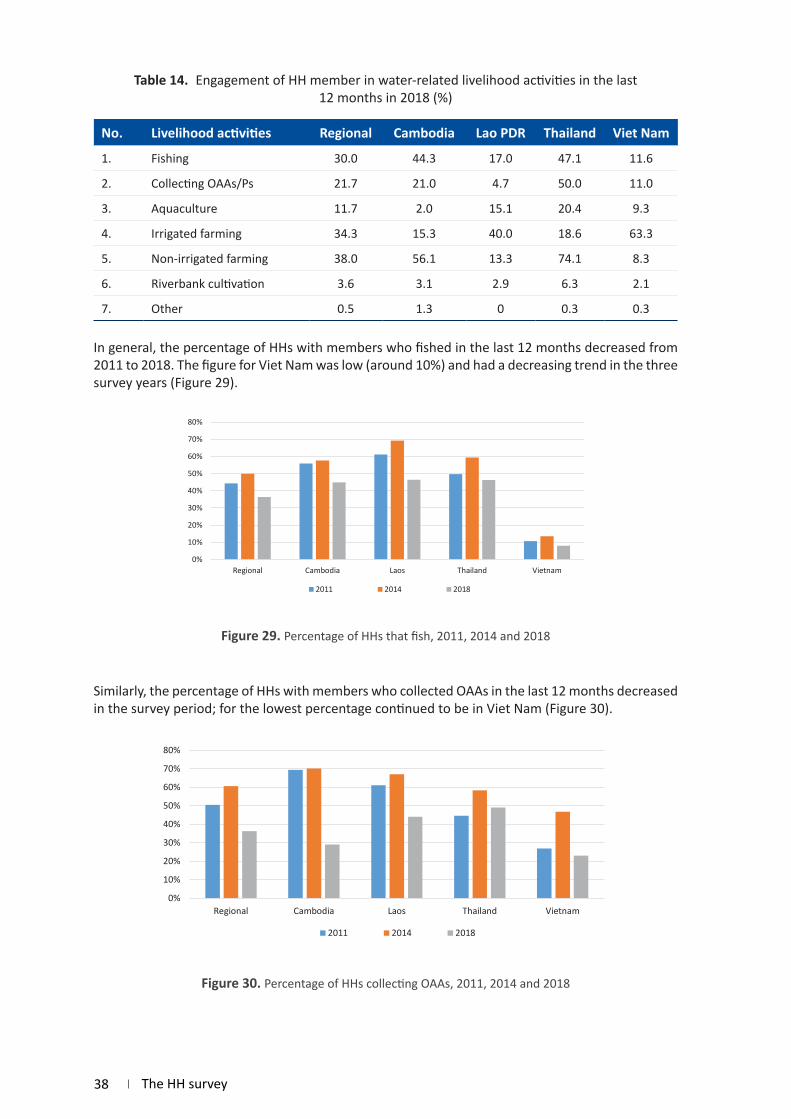
The HH survey38
Table 14. Engagement of HH member in water-related livelihood activities in the last 12 months in 2018 (%)
No. Livelihood activities Regional Cambodia Lao PDR Thailand Viet Nam
1. Fishing 30.0 44.3 17.0 47.1 11.6
2. Collecting OAAs/Ps 21.7 21.0 4.7 50.0 11.0
3. Aquaculture 11.7 2.0 15.1 20.4 9.3
4. Irrigated farming 34.3 15.3 40.0 18.6 63.3
5. Non-irrigated farming 38.0 56.1 13.3 74.1 8.3
6. Riverbank cultivation 3.6 3.1 2.9 6.3 2.1
7. Other 0.5 1.3 0 0.3 0.3
In general, the percentage of HHs with members who fished in the last 12 months decreased from 2011 to 2018. The figure for Viet Nam was low (around 10%) and had a decreasing trend in the three survey years (Figure 29).
0%
10%
20%
30%
40%
50%
60%
70%
80%
Regional Cambodia Laos Thailand Vietnam
2011 2014 2018
Figure 29. Percentage of HHs that fish, 2011, 2014 and 2018
Similarly, the percentage of HHs with members who collected OAAs in the last 12 months decreased in the survey period; for the lowest percentage continued to be in Viet Nam (Figure 30).
0%
10%
20%
30%
40%
50%
60%
70%
80%
Regional Cambodia Laos Thailand Vietnam
2011 2014 2018
Figure 30. Percentage of HHs collecting OAAs, 2011, 2014 and 2018
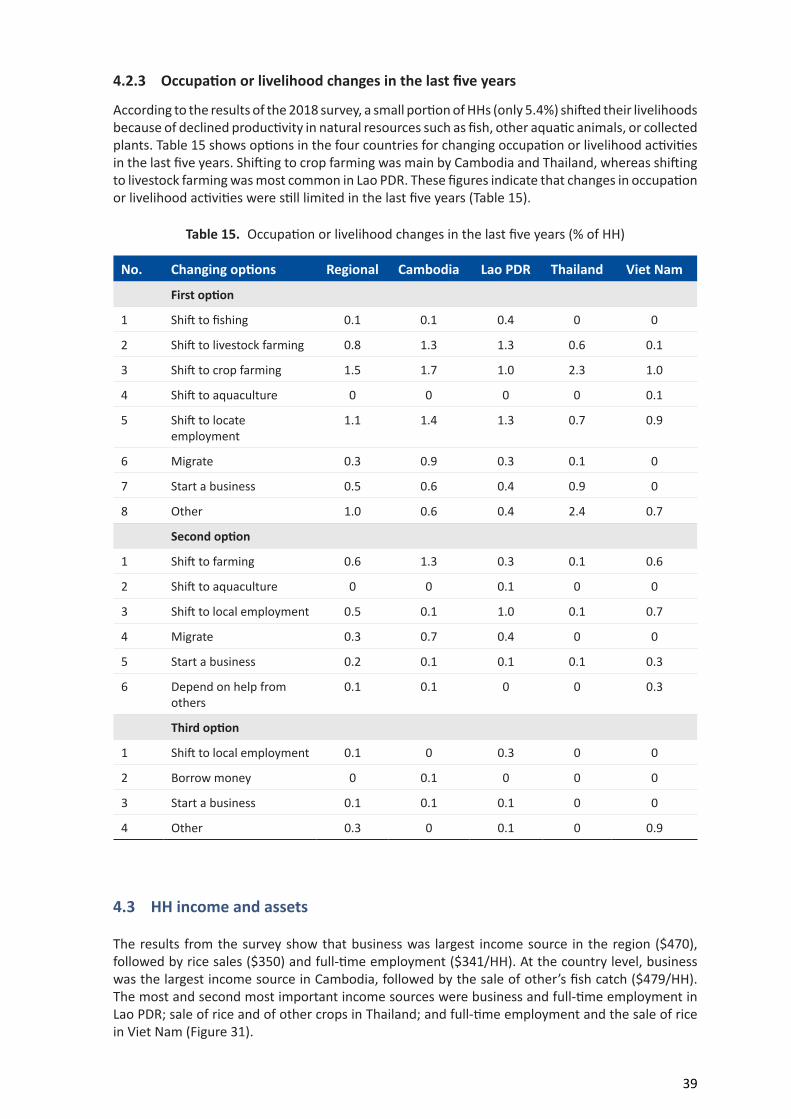
39
4.2.3 Occupation or livelihood changes in the last five years
According to the results of the 2018 survey, a small portion of HHs (only 5.4%) shifted their livelihoods because of declined productivity in natural resources such as fish, other aquatic animals, or collected plants. Table 15 shows options in the four countries for changing occupation or livelihood activities in the last five years. Shifting to crop farming was main by Cambodia and Thailand, whereas shifting to livestock farming was most common in Lao PDR. These figures indicate that changes in occupation or livelihood activities were still limited in the last five years (Table 15).
Table 15. Occupation or livelihood changes in the last five years (% of HH)
No. Changing options Regional Cambodia Lao PDR Thailand Viet Nam
First option
1 Shift to fishing 0.1 0.1 0.4 0 0
2 Shift to livestock farming 0.8 1.3 1.3 0.6 0.1
3 Shift to crop farming 1.5 1.7 1.0 2.3 1.0
4 Shift to aquaculture 0 0 0 0 0.1
5 Shift to locate employment
1.1 1.4 1.3 0.7 0.9
6 Migrate 0.3 0.9 0.3 0.1 0
7 Start a business 0.5 0.6 0.4 0.9 0
8 Other 1.0 0.6 0.4 2.4 0.7
Second option
1 Shift to farming 0.6 1.3 0.3 0.1 0.6
2 Shift to aquaculture 0 0 0.1 0 0
3 Shift to local employment 0.5 0.1 1.0 0.1 0.7
4 Migrate 0.3 0.7 0.4 0 0
5 Start a business 0.2 0.1 0.1 0.1 0.3
6 Depend on help from others
0.1 0.1 0 0 0.3
Third option
1 Shift to local employment 0.1 0 0.3 0 0
2 Borrow money 0 0.1 0 0 0
3 Start a business 0.1 0.1 0.1 0 0
4 Other 0.3 0 0.1 0 0.9
4.3 HH income and assets
The results from the survey show that business was largest income source in the region ($470), followed by rice sales ($350) and full-time employment ($341/HH). At the country level, business was the largest income source in Cambodia, followed by the sale of other’s fish catch ($479/HH). The most and second most important income sources were business and full-time employment in Lao PDR; sale of rice and of other crops in Thailand; and full-time employment and the sale of rice in Viet Nam (Figure 31).
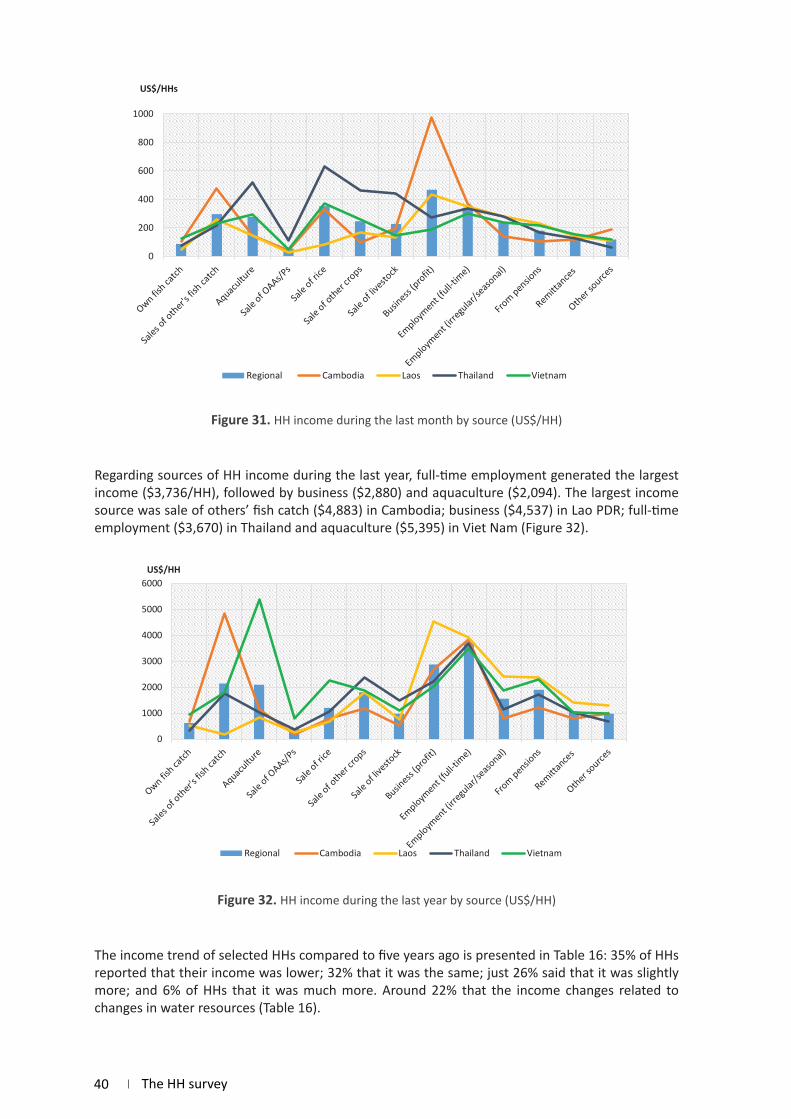
The HH survey40
0
200
400
600
800
1000
US$/HHs
Regional Cambodia Laos Thailand Vietnam
Figure 31. HH income during the last month by source (US$/HH)
Regarding sources of HH income during the last year, full-time employment generated the largest income ($3,736/HH), followed by business ($2,880) and aquaculture ($2,094). The largest income source was sale of others’ fish catch ($4,883) in Cambodia; business ($4,537) in Lao PDR; full-time employment ($3,670) in Thailand and aquaculture ($5,395) in Viet Nam (Figure 32).
0
1000
2000
3000
4000
5000
6000US$/HH
Regional Cambodia Laos Thailand Vietnam
Figure 32. HH income during the last year by source (US$/HH)
The income trend of selected HHs compared to five years ago is presented in Table 16: 35% of HHs reported that their income was lower; 32% that it was the same; just 26% said that it was slightly more; and 6% of HHs that it was much more. Around 22% that the income changes related to changes in water resources (Table 16).
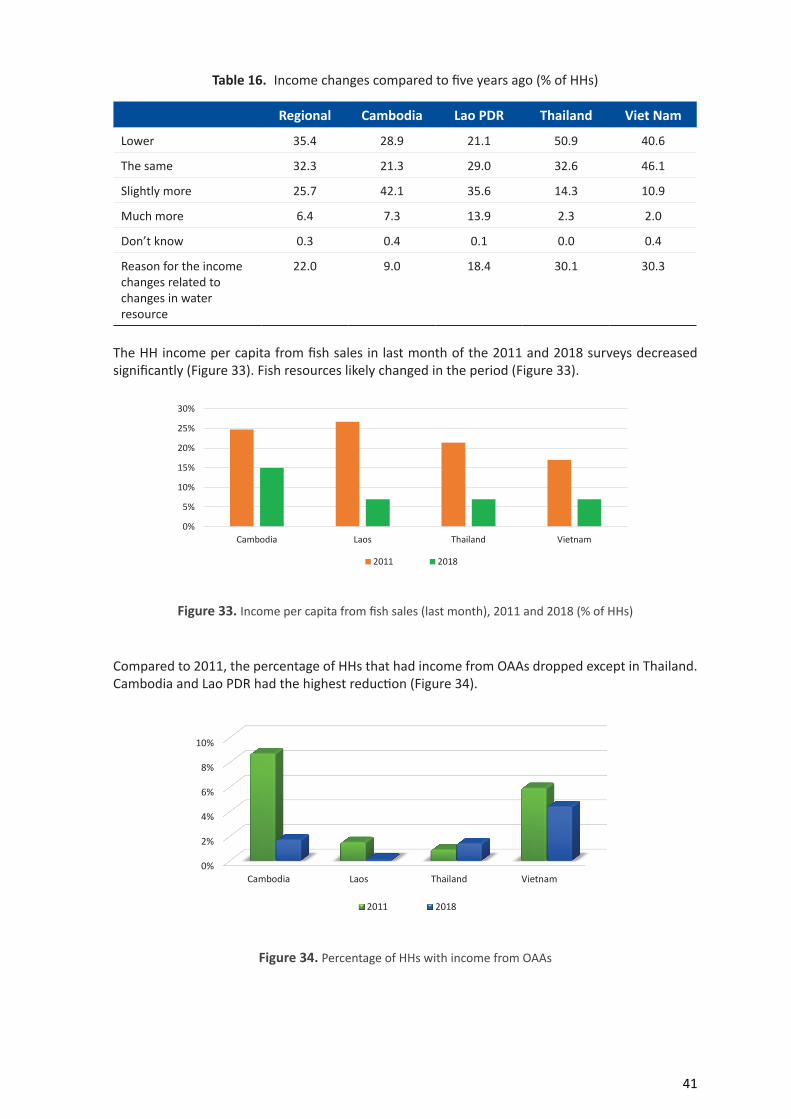
41
Table 16. Income changes compared to five years ago (% of HHs)
Regional Cambodia Lao PDR Thailand Viet Nam
Lower 35.4 28.9 21.1 50.9 40.6
The same 32.3 21.3 29.0 32.6 46.1
Slightly more 25.7 42.1 35.6 14.3 10.9
Much more 6.4 7.3 13.9 2.3 2.0
Don’t know 0.3 0.4 0.1 0.0 0.4
Reason for the income changes related to changes in water resource
22.0 9.0 18.4 30.1 30.3
The HH income per capita from fish sales in last month of the 2011 and 2018 surveys decreased significantly (Figure 33). Fish resources likely changed in the period (Figure 33).
0%
5%
10%
15%
20%
25%
30%
Cambodia Laos Thailand Vietnam
2011 2018
Figure 33. Income per capita from fish sales (last month), 2011 and 2018 (% of HHs)
Compared to 2011, the percentage of HHs that had income from OAAs dropped except in Thailand. Cambodia and Lao PDR had the highest reduction (Figure 34).
0%
2%
4%
6%
8%
10%
Cambodia Laos Thailand Vietnam
2011 2018
Figure 34. Percentage of HHs with income from OAAs
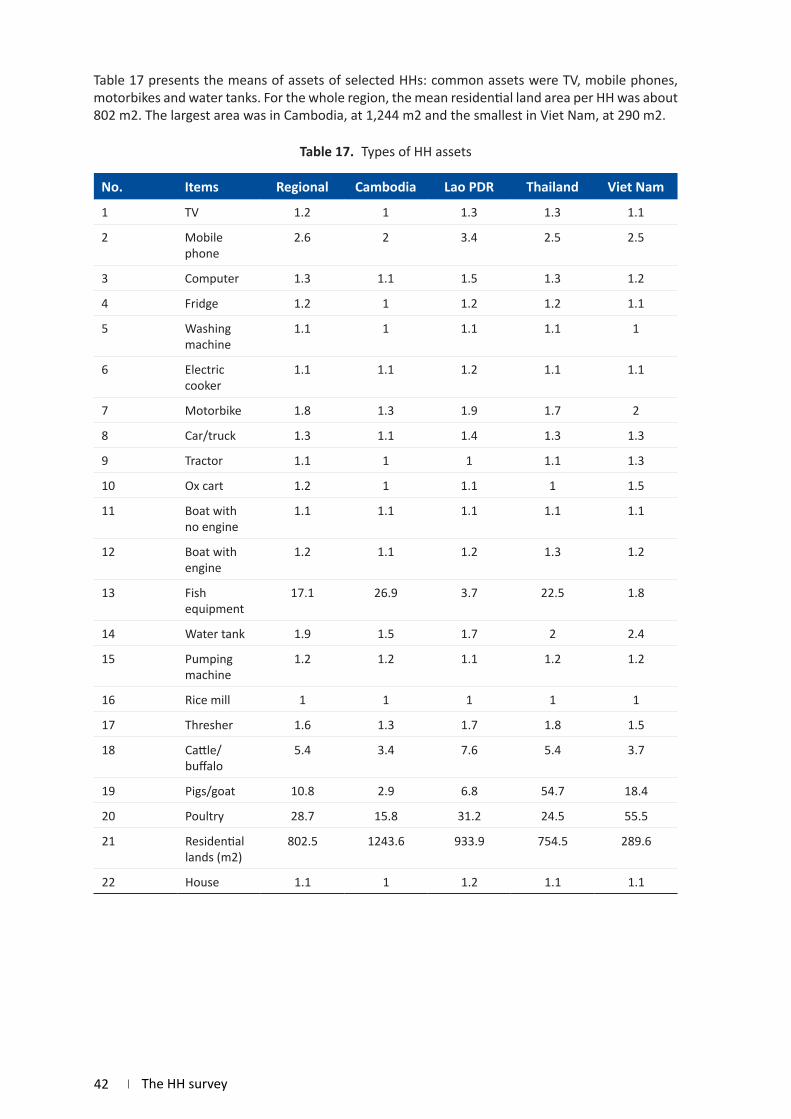
The HH survey42
Table 17 presents the means of assets of selected HHs: common assets were TV, mobile phones, motorbikes and water tanks. For the whole region, the mean residential land area per HH was about 802 m2. The largest area was in Cambodia, at 1,244 m2 and the smallest in Viet Nam, at 290 m2.
Table 17. Types of HH assets
No. Items Regional Cambodia Lao PDR Thailand Viet Nam
1 TV 1.2 1 1.3 1.3 1.1
2 Mobile phone
2.6 2 3.4 2.5 2.5
3 Computer 1.3 1.1 1.5 1.3 1.2
4 Fridge 1.2 1 1.2 1.2 1.1
5 Washing machine
1.1 1 1.1 1.1 1
6 Electric cooker
1.1 1.1 1.2 1.1 1.1
7 Motorbike 1.8 1.3 1.9 1.7 2
8 Car/truck 1.3 1.1 1.4 1.3 1.3
9 Tractor 1.1 1 1 1.1 1.3
10 Ox cart 1.2 1 1.1 1 1.5
11 Boat with no engine
1.1 1.1 1.1 1.1 1.1
12 Boat with engine
1.2 1.1 1.2 1.3 1.2
13 Fish equipment
17.1 26.9 3.7 22.5 1.8
14 Water tank 1.9 1.5 1.7 2 2.4
15 Pumping machine
1.2 1.2 1.1 1.2 1.2
16 Rice mill 1 1 1 1 1
17 Thresher 1.6 1.3 1.7 1.8 1.5
18 Cattle/buffalo
5.4 3.4 7.6 5.4 3.7
19 Pigs/goat 10.8 2.9 6.8 54.7 18.4
20 Poultry 28.7 15.8 31.2 24.5 55.5
21 Residential lands (m2)
802.5 1243.6 933.9 754.5 289.6
22 House 1.1 1 1.2 1.1 1.1
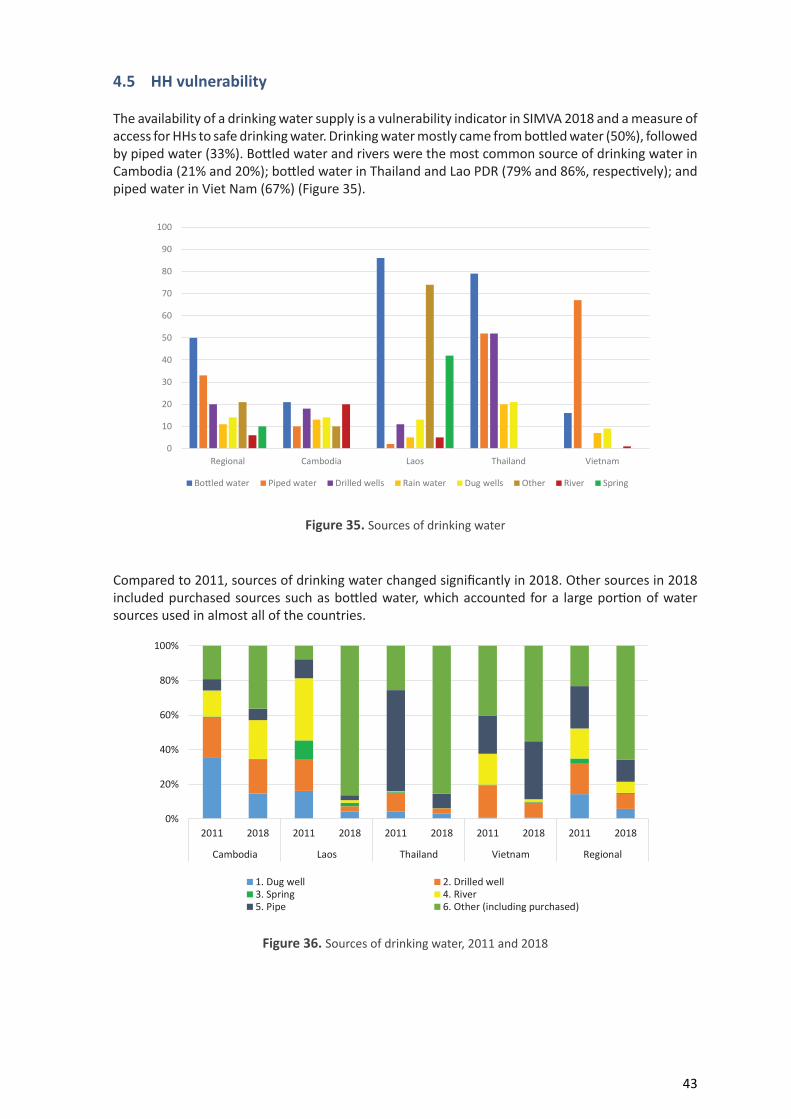
43
4.5 HH vulnerability
The availability of a drinking water supply is a vulnerability indicator in SIMVA 2018 and a measure of access for HHs to safe drinking water. Drinking water mostly came from bottled water (50%), followed by piped water (33%). Bottled water and rivers were the most common source of drinking water in Cambodia (21% and 20%); bottled water in Thailand and Lao PDR (79% and 86%, respectively); and piped water in Viet Nam (67%) (Figure 35).
0
10
20
30
40
50
60
70
80
90
100
Regional Cambodia Laos Thailand Vietnam
Bo�led water Piped water Drilled wells Rain water Dug wells Other River Spring
Figure 35. Sources of drinking water
Compared to 2011, sources of drinking water changed significantly in 2018. Other sources in 2018 included purchased sources such as bottled water, which accounted for a large portion of water sources used in almost all of the countries.
0%
20%
40%
60%
80%
100%
2011 2018 2011 2018 2011 2018 2011 2018 2011 2018
Cambodia Laos Thailand Vietnam Regional
1. Dug well 2. Drilled well3. Spring 4. River5. Pipe 6. Other (including purchased)
Figure 36. Sources of drinking water, 2011 and 2018
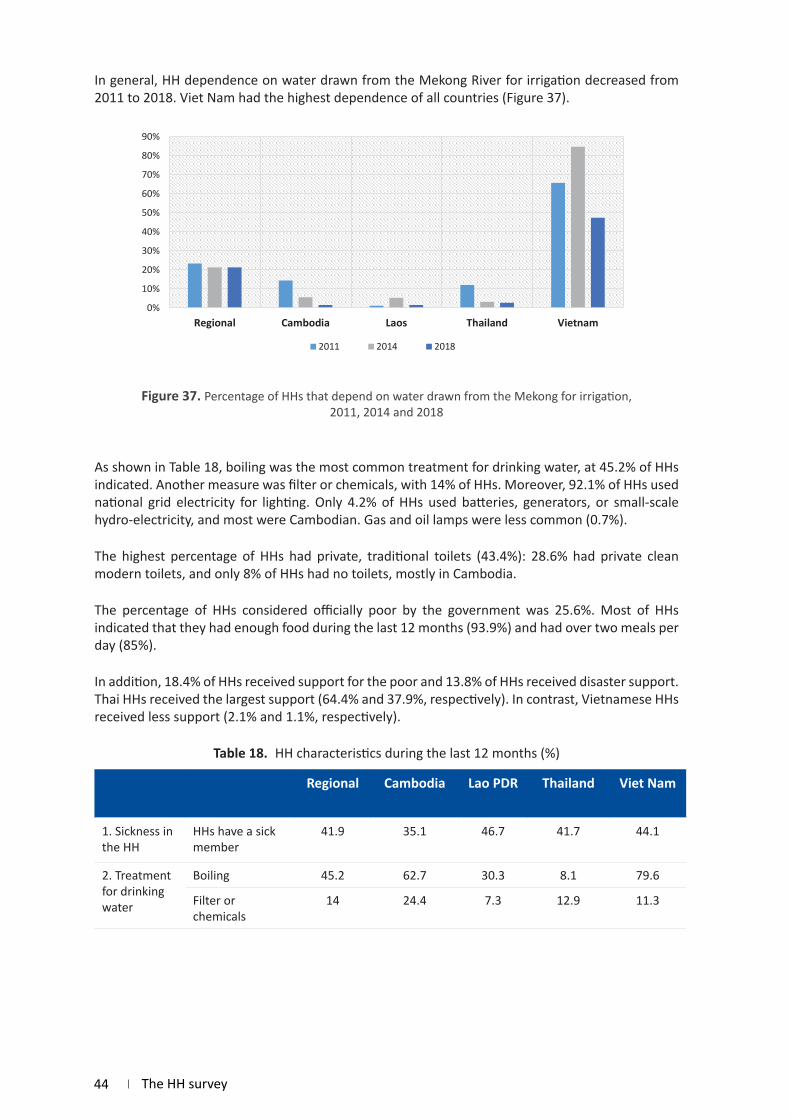
The HH survey44
In general, HH dependence on water drawn from the Mekong River for irrigation decreased from 2011 to 2018. Viet Nam had the highest dependence of all countries (Figure 37).
0%
10%
20%
30%
40%
50%
60%
70%
80%
90%
Regional Cambodia Laos Thailand Vietnam
2011 2014 2018
Figure 37. Percentage of HHs that depend on water drawn from the Mekong for irrigation, 2011, 2014 and 2018
As shown in Table 18, boiling was the most common treatment for drinking water, at 45.2% of HHs indicated. Another measure was filter or chemicals, with 14% of HHs. Moreover, 92.1% of HHs used national grid electricity for lighting. Only 4.2% of HHs used batteries, generators, or small-scale hydro-electricity, and most were Cambodian. Gas and oil lamps were less common (0.7%).
The highest percentage of HHs had private, traditional toilets (43.4%): 28.6% had private clean modern toilets, and only 8% of HHs had no toilets, mostly in Cambodia.
The percentage of HHs considered officially poor by the government was 25.6%. Most of HHs indicated that they had enough food during the last 12 months (93.9%) and had over two meals per day (85%).
In addition, 18.4% of HHs received support for the poor and 13.8% of HHs received disaster support. Thai HHs received the largest support (64.4% and 37.9%, respectively). In contrast, Vietnamese HHs received less support (2.1% and 1.1%, respectively).
Table 18. HH characteristics during the last 12 months (%)
Regional Cambodia Lao PDR Thailand Viet Nam
1. Sickness in the HH
HHs have a sick member
41.9 35.1 46.7 41.7 44.1
2. Treatment for drinking water
Boiling 45.2 62.7 30.3 8.1 79.6
Filter or chemicals
14 24.4 7.3 12.9 11.3
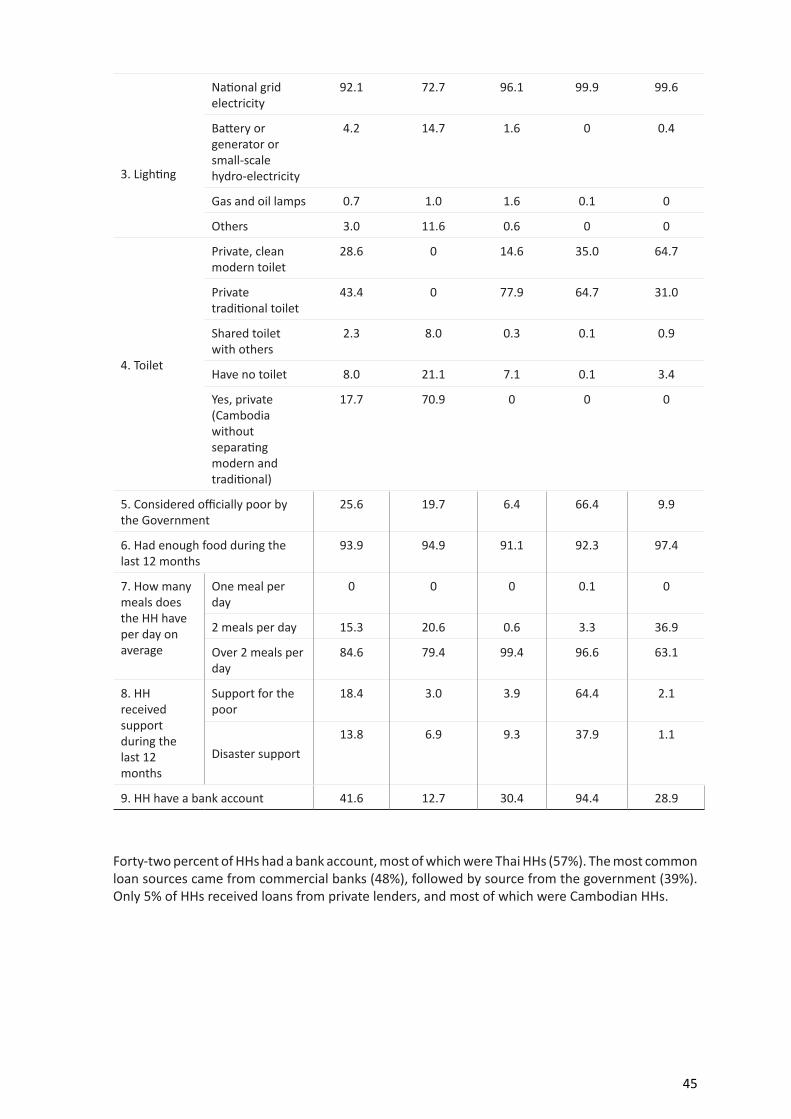
45
3. Lighting
National grid electricity
92.1 72.7 96.1 99.9 99.6
Battery or generator or small-scale hydro-electricity
4.2 14.7 1.6 0 0.4
Gas and oil lamps 0.7 1.0 1.6 0.1 0
Others 3.0 11.6 0.6 0 0
4. Toilet
Private, clean modern toilet
28.6 0 14.6 35.0 64.7
Private traditional toilet
43.4 0 77.9 64.7 31.0
Shared toilet with others
2.3 8.0 0.3 0.1 0.9
Have no toilet 8.0 21.1 7.1 0.1 3.4
Yes, private (Cambodia without separating modern and traditional)
17.7 70.9 0 0 0
5. Considered officially poor by the Government
25.6 19.7 6.4 66.4 9.9
6. Had enough food during the last 12 months
93.9 94.9 91.1 92.3 97.4
7. How many meals does the HH have per day on average
One meal per day
0 0 0 0.1 0
2 meals per day 15.3 20.6 0.6 3.3 36.9
Over 2 meals per day
84.6 79.4 99.4 96.6 63.1
8. HH received support during the last 12 months
Support for the poor
18.4 3.0 3.9 64.4 2.1
Disaster support13.8 6.9 9.3 37.9 1.1
9. HH have a bank account 41.6 12.7 30.4 94.4 28.9
Forty-two percent of HHs had a bank account, most of which were Thai HHs (57%). The most common loan sources came from commercial banks (48%), followed by source from the government (39%). Only 5% of HHs received loans from private lenders, and most of which were Cambodian HHs.
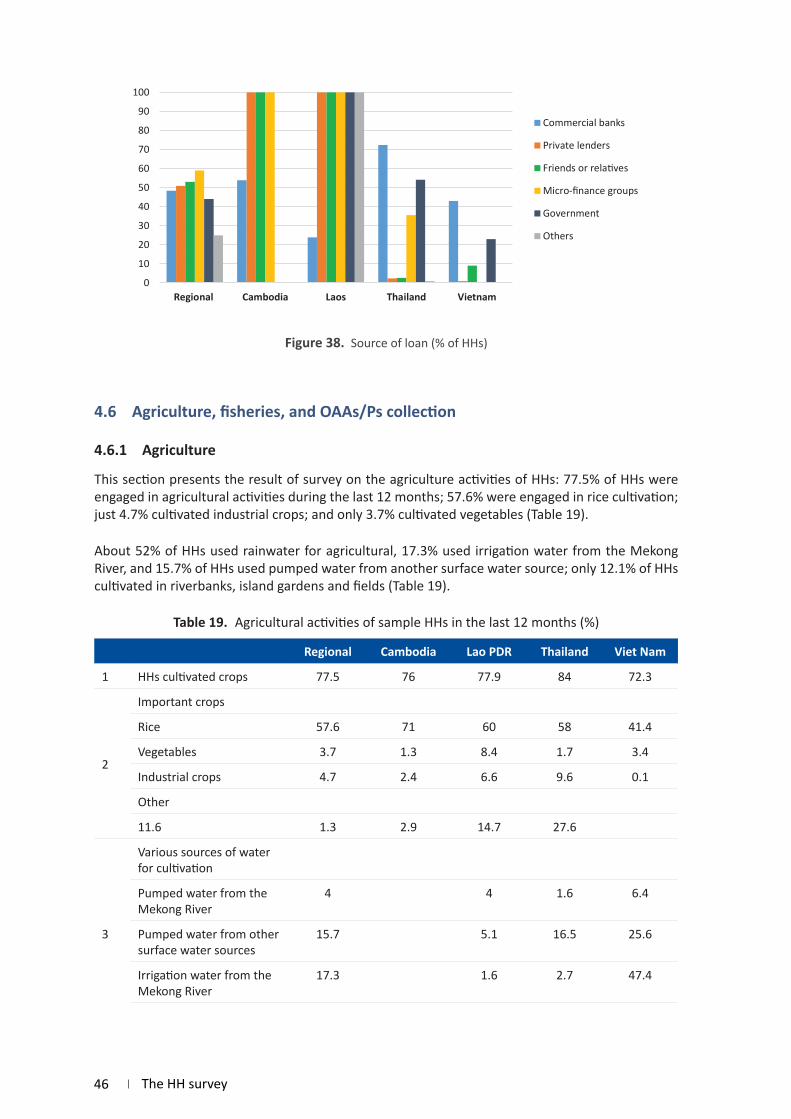
The HH survey46
0
10
20
30
40
50
60
70
80
90
100
Regional Cambodia Laos Thailand Vietnam
Commercial banks
Private lenders
Friends or rela�ves
Micro-finance groups
Government
Others
Figure 38. Source of loan (% of HHs)
4.6 Agriculture, fisheries, and OAAs/Ps collection
4.6.1 Agriculture
This section presents the result of survey on the agriculture activities of HHs: 77.5% of HHs were engaged in agricultural activities during the last 12 months; 57.6% were engaged in rice cultivation; just 4.7% cultivated industrial crops; and only 3.7% cultivated vegetables (Table 19).
About 52% of HHs used rainwater for agricultural, 17.3% used irrigation water from the Mekong River, and 15.7% of HHs used pumped water from another surface water source; only 12.1% of HHs cultivated in riverbanks, island gardens and fields (Table 19).
Table 19. Agricultural activities of sample HHs in the last 12 months (%)
Regional Cambodia Lao PDR Thailand Viet Nam
1 HHs cultivated crops 77.5 76 77.9 84 72.3
2
Important crops
Rice 57.6 71 60 58 41.4
Vegetables 3.7 1.3 8.4 1.7 3.4
Industrial crops 4.7 2.4 6.6 9.6 0.1
Other
11.6 1.3 2.9 14.7 27.6
Various sources of water for cultivation
Pumped water from the Mekong River
4 4 1.6 6.4
3 Pumped water from other surface water sources
15.7 5.1 16.5 25.6
Irrigation water from the Mekong River
17.3 1.6 2.7 47.4
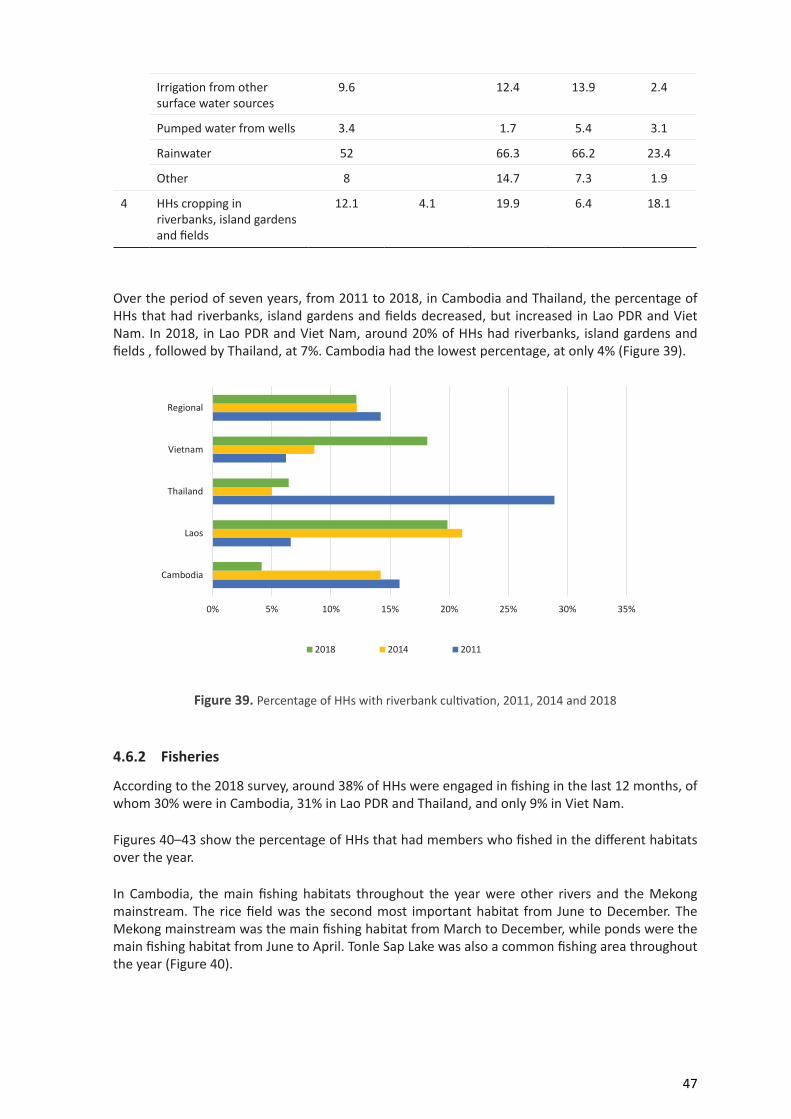
47
Irrigation from other surface water sources
9.6 12.4 13.9 2.4
Pumped water from wells 3.4 1.7 5.4 3.1
Rainwater 52 66.3 66.2 23.4
Other 8 14.7 7.3 1.9
4 HHs cropping in riverbanks, island gardens and fields
12.1 4.1 19.9 6.4 18.1
Over the period of seven years, from 2011 to 2018, in Cambodia and Thailand, the percentage of HHs that had riverbanks, island gardens and fields decreased, but increased in Lao PDR and Viet Nam. In 2018, in Lao PDR and Viet Nam, around 20% of HHs had riverbanks, island gardens and fields , followed by Thailand, at 7%. Cambodia had the lowest percentage, at only 4% (Figure 39).
0% 5% 10% 15% 20% 25% 30% 35%
Cambodia
Laos
Thailand
Vietnam
Regional
2018 2014 2011
Figure 39. Percentage of HHs with riverbank cultivation, 2011, 2014 and 2018
4.6.2 Fisheries
According to the 2018 survey, around 38% of HHs were engaged in fishing in the last 12 months, of whom 30% were in Cambodia, 31% in Lao PDR and Thailand, and only 9% in Viet Nam.
Figures 40–43 show the percentage of HHs that had members who fished in the different habitats over the year.
In Cambodia, the main fishing habitats throughout the year were other rivers and the Mekong mainstream. The rice field was the second most important habitat from June to December. The Mekong mainstream was the main fishing habitat from March to December, while ponds were the main fishing habitat from June to April. Tonle Sap Lake was also a common fishing area throughout the year (Figure 40).
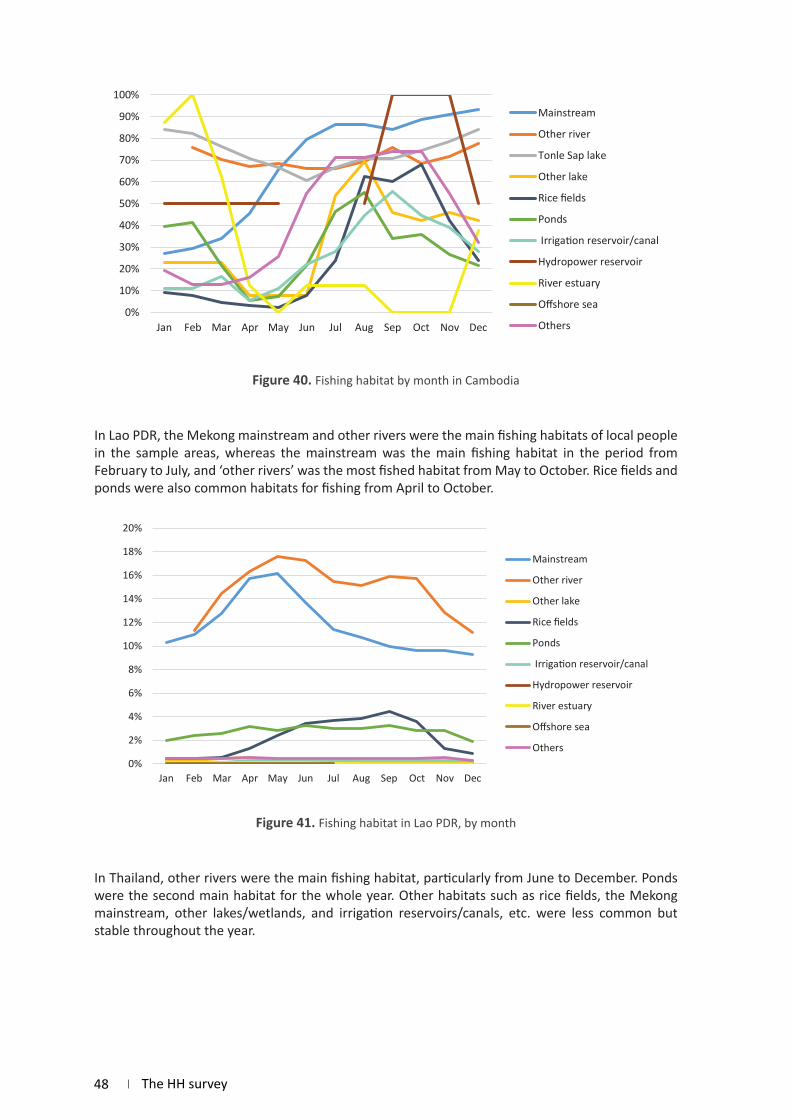
The HH survey48
throughout the year (Figure 40).
0%
10%
20%
30%
40%
50%
60%
70%
80%
90%
100%
Jan Feb Mar Apr May Jun Jul Aug Sep Oct Nov Dec
Mainstream
Other river
Tonle Sap lake
Other lake
Rice fields
Ponds
Irriga�on reservoir/canal
Hydropower reservoir
River estuary
Offshore sea
Others
Figure 40. Fishing habitat by month in Cambodia
In Lao PDR, the Mekong mainstream and other rivers were the main fishing habitats of local people in the sample areas, whereas the mainstream was the main fishing habitat in the period from February to July, and ‘other rivers’ was the most fished habitat from May to October. Rice fields and ponds were also common habitats for fishing from April to October.
0%
2%
4%
6%
8%
10%
12%
14%
16%
18%
20%
Jan Feb Mar Apr May Jun Jul Aug Sep Oct Nov Dec
Mainstream
Other river
Other lake
Rice fields
Ponds
Irriga�on reservoir/canal
Hydropower reservoir
River estuary
Offshore sea
Others
Figure 41. Fishing habitat in Lao PDR, by month
In Thailand, other rivers were the main fishing habitat, particularly from June to December. Ponds were the second main habitat for the whole year. Other habitats such as rice fields, the Mekong mainstream, other lakes/wetlands, and irrigation reservoirs/canals, etc. were less common but stable throughout the year.
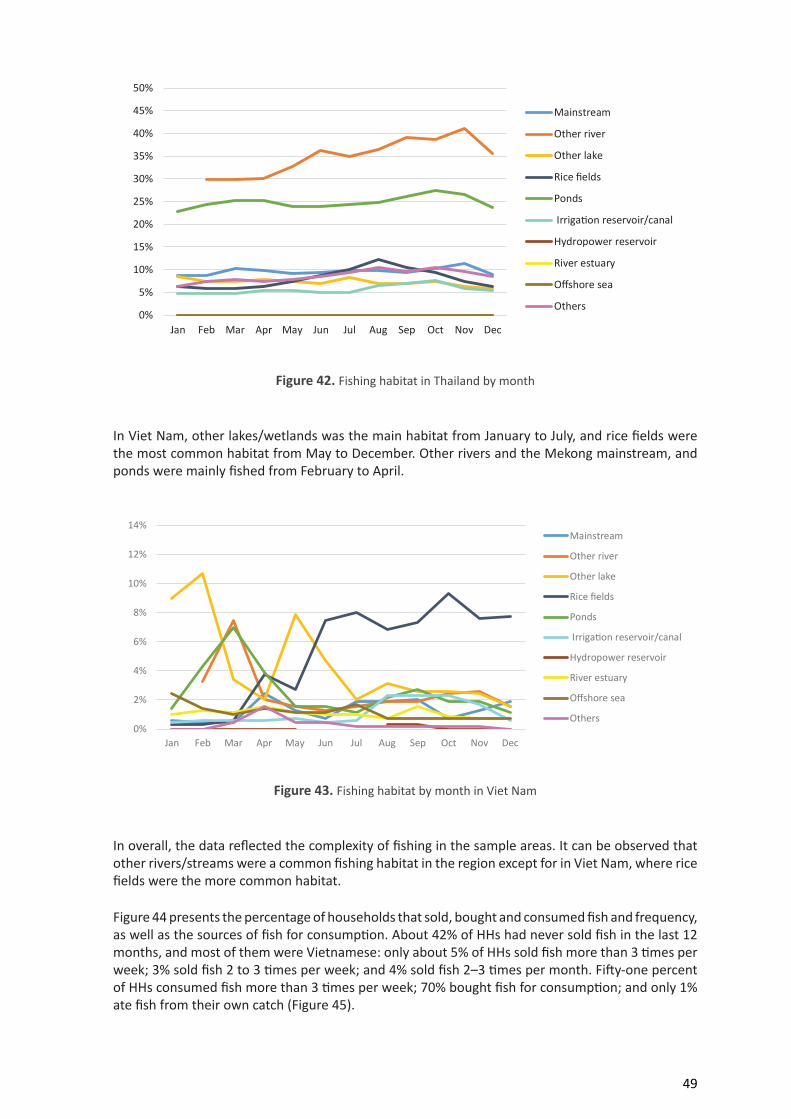
49
0%
5%
10%
15%
20%
25%
30%
35%
40%
45%
50%
Jan Feb Mar Apr May Jun Jul Aug Sep Oct Nov Dec
Mainstream
Other river
Other lake
Rice fields
Ponds
Irriga�on reservoir/canal
Hydropower reservoir
River estuary
Offshore sea
Others
Figure 42. Fishing habitat in Thailand by month
In Viet Nam, other lakes/wetlands was the main habitat from January to July, and rice fields were the most common habitat from May to December. Other rivers and the Mekong mainstream, and ponds were mainly fished from February to April.
0%
2%
4%
6%
8%
10%
12%
14%
Jan Feb Mar Apr May Jun Jul Aug Sep Oct Nov Dec
Mainstream
Other river
Other lake
Rice fields
Ponds
Irriga�on reservoir/canal
Hydropower reservoir
River estuary
Offshore sea
Others
Figure 43. Fishing habitat by month in Viet Nam
In overall, the data reflected the complexity of fishing in the sample areas. It can be observed that other rivers/streams were a common fishing habitat in the region except for in Viet Nam, where rice fields were the more common habitat.
Figure 44 presents the percentage of households that sold, bought and consumed fish and frequency, as well as the sources of fish for consumption. About 42% of HHs had never sold fish in the last 12 months, and most of them were Vietnamese: only about 5% of HHs sold fish more than 3 times per week; 3% sold fish 2 to 3 times per week; and 4% sold fish 2–3 times per month. Fifty-one percent of HHs consumed fish more than 3 times per week; 70% bought fish for consumption; and only 1% ate fish from their own catch (Figure 45).
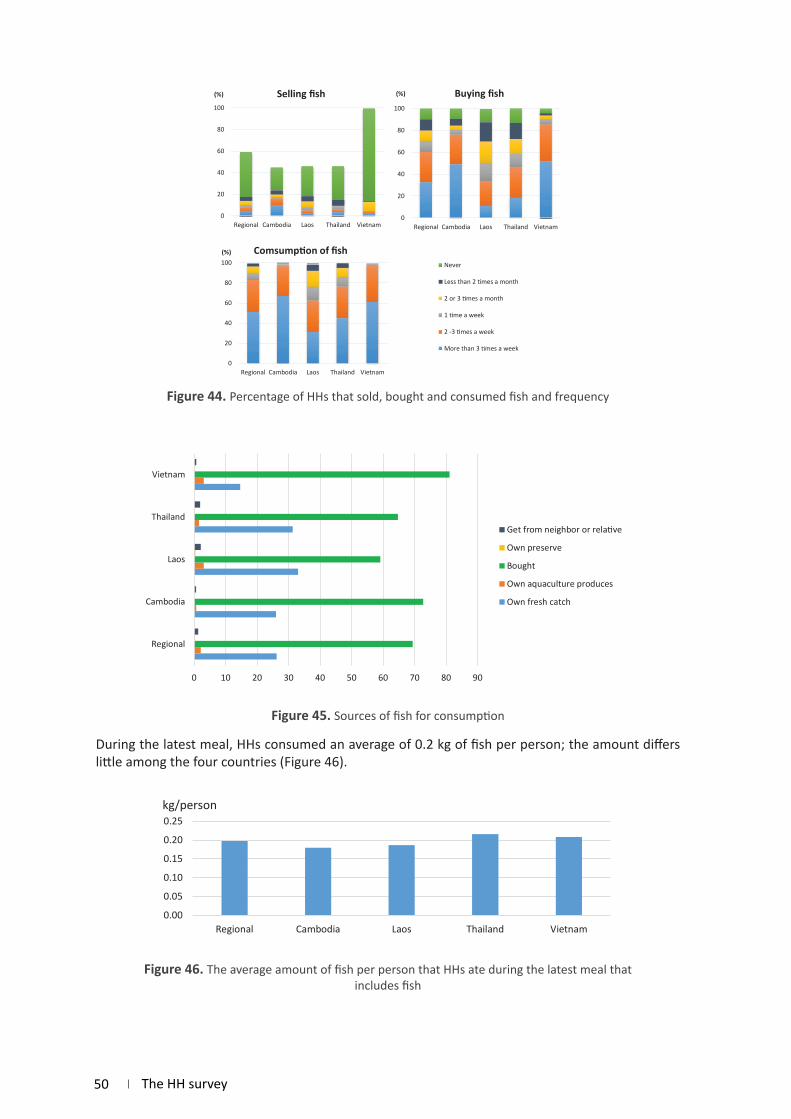
The HH survey50
0
20
40
60
80
100
Regional Cambodia Laos Thailand Vietnam
(%) Selling fish
0
20
40
60
80
100
Regional Cambodia Laos Thailand Vietnam
(%) Buying fish
0
20
40
60
80
100
Regional Cambodia Laos Thailand Vietnam
(%) Comsump�on of fishNever
Less than 2 �mes a month
2 or 3 �mes a month
1 �me a week
2 -3 �mes a week
More than 3 �mes a week
Figure 44. Percentage of HHs that sold, bought and consumed fish and frequency
0 10 20 30 40 50 60 70 80 90
Regional
Cambodia
Laos
Thailand
Vietnam
Get from neighbor or rela�ve
Own preserve
Bought
Own aquaculture produces
Own fresh catch
Figure 45. Sources of fish for consumption
During the latest meal, HHs consumed an average of 0.2 kg of fish per person; the amount differs little among the four countries (Figure 46).
0.00
0.05
0.10
0.15
0.20
0.25
Regional Cambodia Laos Thailand Vietnam
kg/person
Figure 46. The average amount of fish per person that HHs ate during the latest meal that includes fish
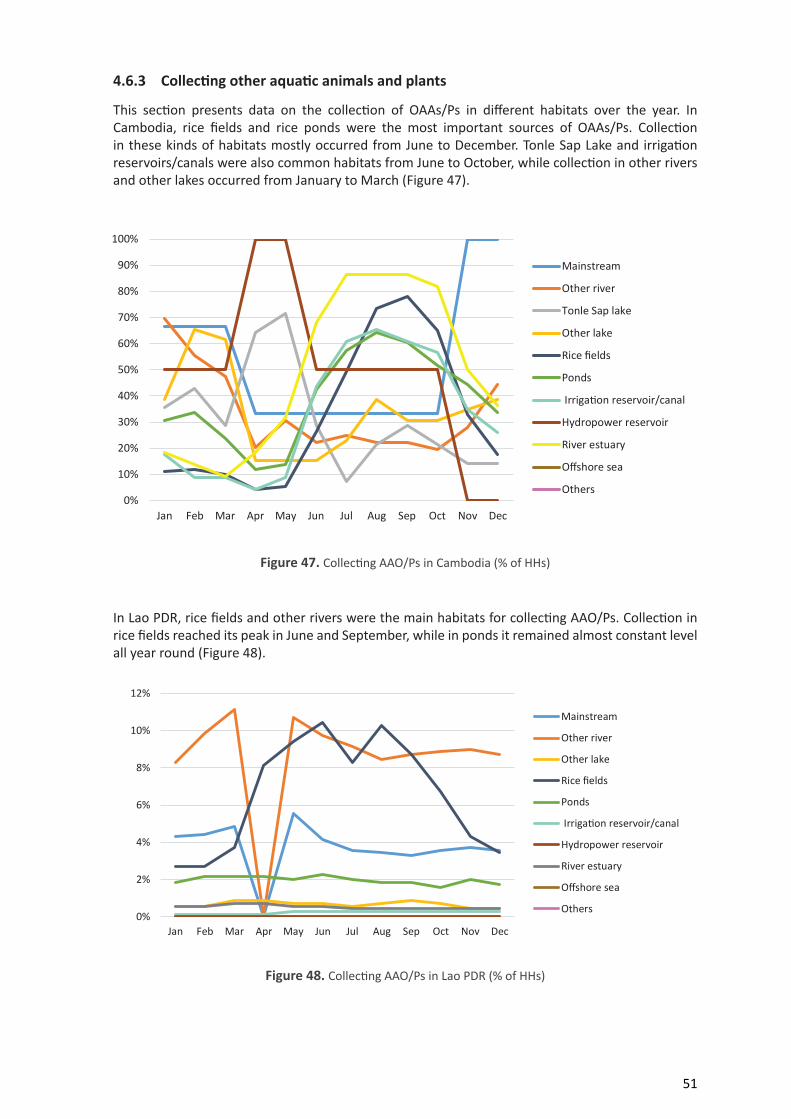
51
4.6.3 Collecting other aquatic animals and plants
This section presents data on the collection of OAAs/Ps in different habitats over the year. In Cambodia, rice fields and rice ponds were the most important sources of OAAs/Ps. Collection in these kinds of habitats mostly occurred from June to December. Tonle Sap Lake and irrigation reservoirs/canals were also common habitats from June to October, while collection in other rivers and other lakes occurred from January to March (Figure 47).
0%
10%
20%
30%
40%
50%
60%
70%
80%
90%
100%
Jan Feb Mar Apr May Jun Jul Aug Sep Oct Nov Dec
Mainstream
Other river
Tonle Sap lake
Other lake
Rice fields
Ponds
Irriga�on reservoir/canal
Hydropower reservoir
River estuary
Offshore sea
Others
Figure 47. Collecting AAO/Ps in Cambodia (% of HHs)
In Lao PDR, rice fields and other rivers were the main habitats for collecting AAO/Ps. Collection in rice fields reached its peak in June and September, while in ponds it remained almost constant level all year round (Figure 48).
0%
2%
4%
6%
8%
10%
12%
Jan Feb Mar Apr May Jun Jul Aug Sep Oct Nov Dec
Mainstream
Other river
Other lake
Rice fields
Ponds
Irriga�on reservoir/canal
Hydropower reservoir
River estuary
Offshore sea
Others
Figure 48. Collecting AAO/Ps in Lao PDR (% of HHs)
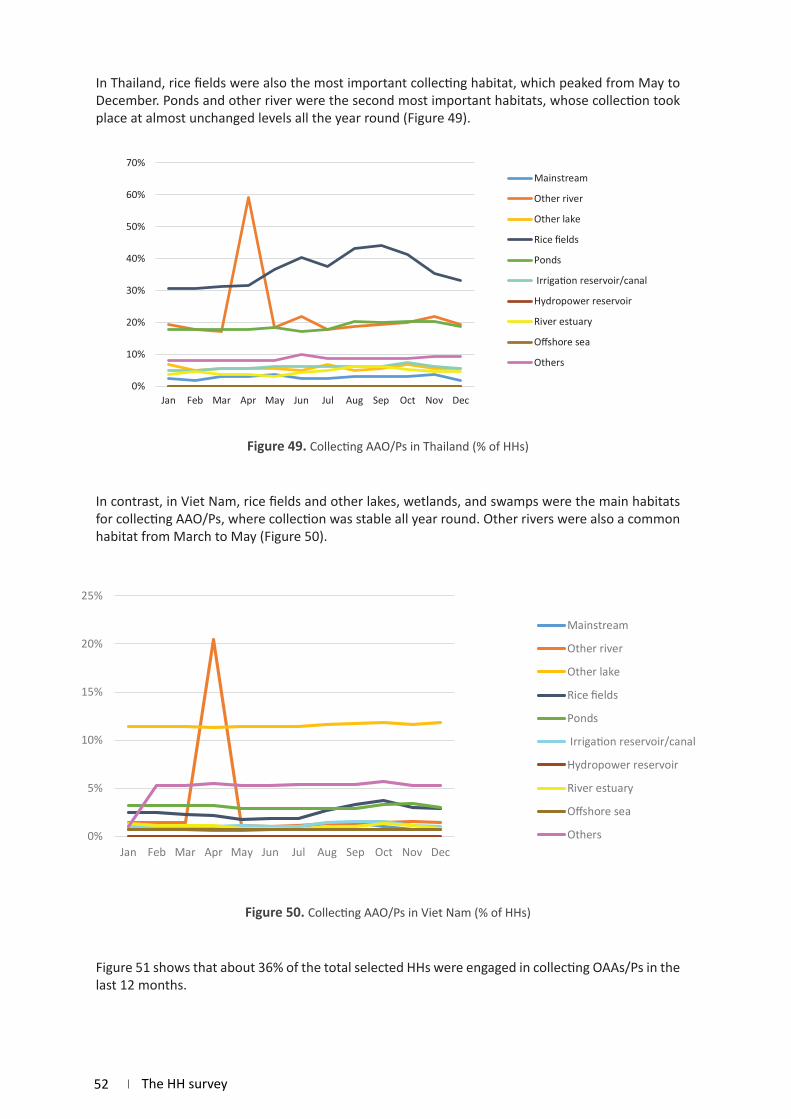
The HH survey52
In Thailand, rice fields were also the most important collecting habitat, which peaked from May to December. Ponds and other river were the second most important habitats, whose collection took place at almost unchanged levels all the year round (Figure 49).
Figure 49. Collec�ng AAO/Ps in Thailand (% of HHs)
0%
10%
20%
30%
40%
50%
60%
70%
Jan Feb Mar Apr May Jun Jul Aug Sep Oct Nov Dec
Mainstream
Other river
Other lake
Rice fields
Ponds
Irriga�on reservoir/canal
Hydropower reservoir
River estuary
Offshore sea
Others
Figure 49. Collecting AAO/Ps in Thailand (% of HHs)
In contrast, in Viet Nam, rice fields and other lakes, wetlands, and swamps were the main habitats for collecting AAO/Ps, where collection was stable all year round. Other rivers were also a common habitat from March to May (Figure 50).
0%
5%
10%
15%
20%
25%
Jan Feb Mar Apr May Jun Jul Aug Sep Oct Nov Dec
Mainstream
Other river
Other lake
Rice fields
Ponds
Irriga�on reservoir/canal
Hydropower reservoir
River estuary
Offshore sea
Others
Figure 50. Collecting AAO/Ps in Viet Nam (% of HHs)
Figure 51 shows that about 36% of the total selected HHs were engaged in collecting OAAs/Ps in the last 12 months.
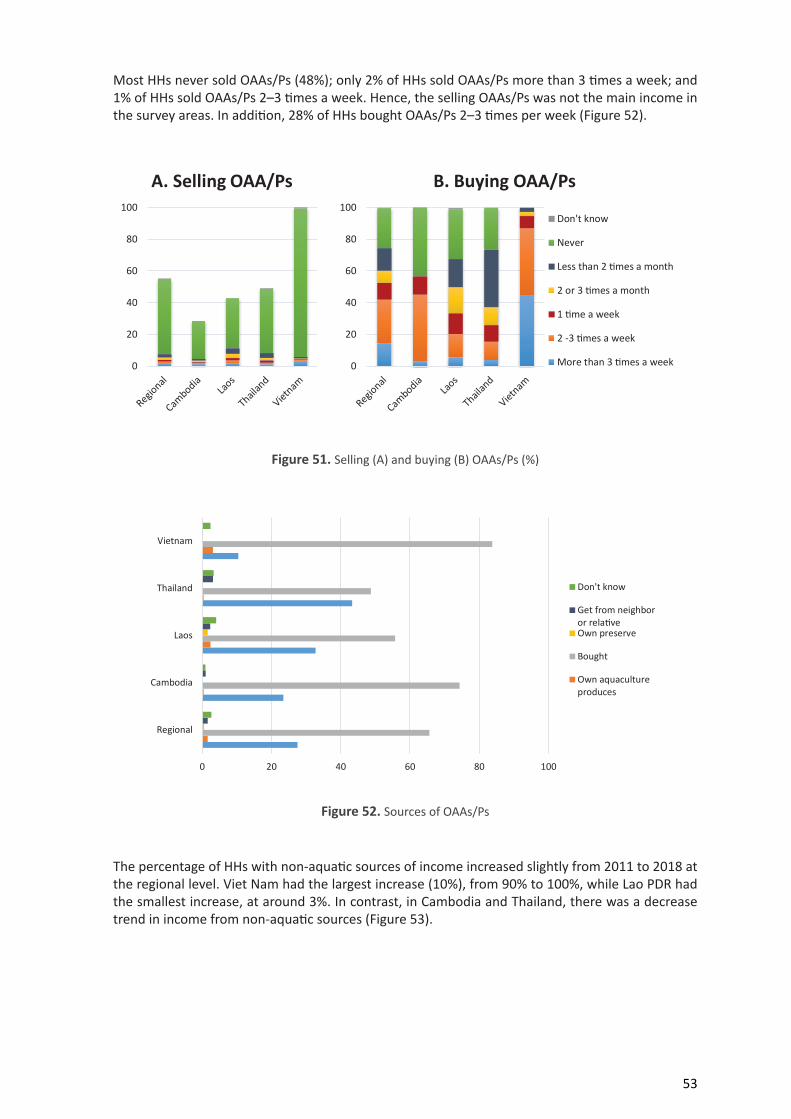
53
Most HHs never sold OAAs/Ps (48%); only 2% of HHs sold OAAs/Ps more than 3 times a week; and 1% of HHs sold OAAs/Ps 2–3 times a week. Hence, the selling OAAs/Ps was not the main income in the survey areas. In addition, 28% of HHs bought OAAs/Ps 2–3 times per week (Figure 52).
0
20
40
60
80
100
A. Selling OAA/Ps
0
20
40
60
80
100
B. Buying OAA/Ps
Don't know
Never
Less than 2 �mes a month
2 or 3 �mes a month
1 �me a week
2 -3 �mes a week
More than 3 �mes a week
Figure 51. Selling (A) and buying (B) OAAs/Ps (%)
0 20 40 60 80 100
Regional
Cambodia
Laos
Thailand
Vietnam
Don't know
Get from neighboror rela�veOwn preserve
Bought
Own aquacultureproduces
Figure 52. Sources of OAAs/Ps
The percentage of HHs with non-aquatic sources of income increased slightly from 2011 to 2018 at the regional level. Viet Nam had the largest increase (10%), from 90% to 100%, while Lao PDR had the smallest increase, at around 3%. In contrast, in Cambodia and Thailand, there was a decrease trend in income from non-aquatic sources (Figure 53).
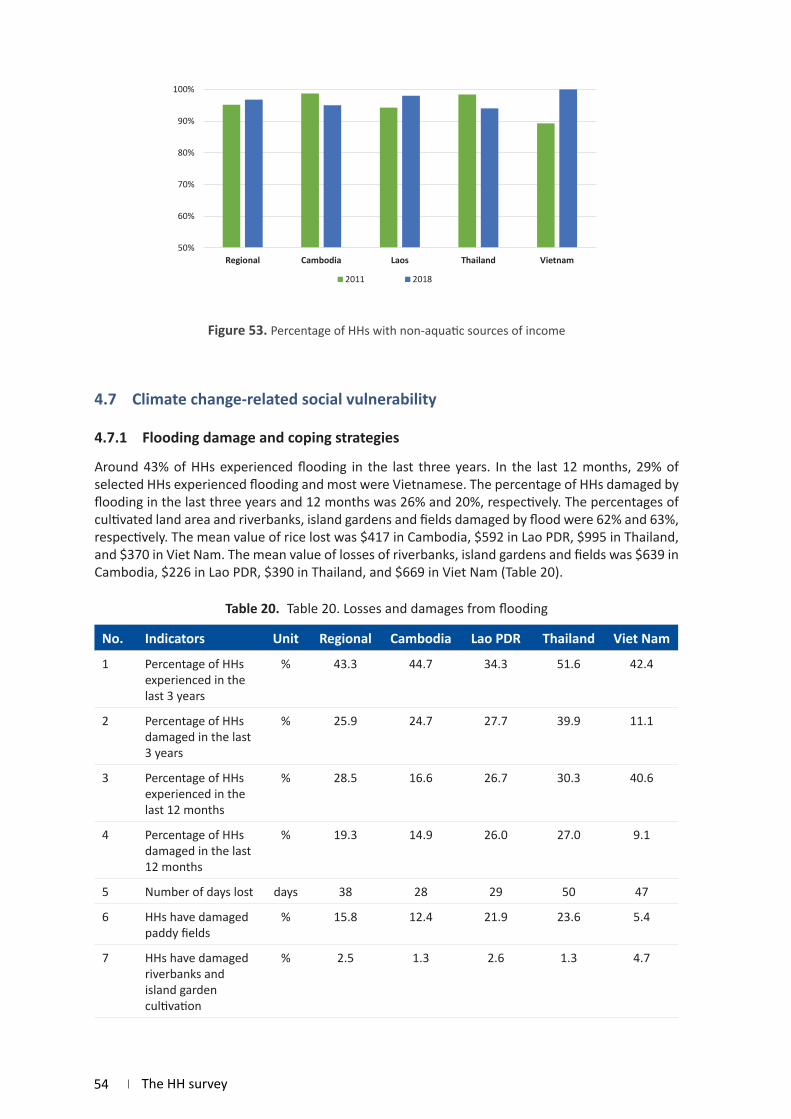
The HH survey54
50%
60%
70%
80%
90%
100%
Regional Cambodia Laos Thailand Vietnam
2011 2018
Figure 53. Percentage of HHs with non-aquatic sources of income
4.7 Climate change-related social vulnerability
4.7.1 Flooding damage and coping strategies
Around 43% of HHs experienced flooding in the last three years. In the last 12 months, 29% of selected HHs experienced flooding and most were Vietnamese. The percentage of HHs damaged by flooding in the last three years and 12 months was 26% and 20%, respectively. The percentages of cultivated land area and riverbanks, island gardens and fields damaged by flood were 62% and 63%, respectively. The mean value of rice lost was $417 in Cambodia, $592 in Lao PDR, $995 in Thailand, and $370 in Viet Nam. The mean value of losses of riverbanks, island gardens and fields was $639 in Cambodia, $226 in Lao PDR, $390 in Thailand, and $669 in Viet Nam (Table 20).
Table 20. Table 20. Losses and damages from flooding
No. Indicators Unit Regional Cambodia Lao PDR Thailand Viet Nam
1 Percentage of HHs experienced in the last 3 years
% 43.3 44.7 34.3 51.6 42.4
2 Percentage of HHs damaged in the last 3 years
% 25.9 24.7 27.7 39.9 11.1
3 Percentage of HHs experienced in the last 12 months
% 28.5 16.6 26.7 30.3 40.6
4 Percentage of HHs damaged in the last 12 months
% 19.3 14.9 26.0 27.0 9.1
5 Number of days lost days 38 28 29 50 47
6 HHs have damaged paddy fields
% 15.8 12.4 21.9 23.6 5.4
7 HHs have damaged riverbanks and island garden cultivation
% 2.5 1.3 2.6 1.3 4.7
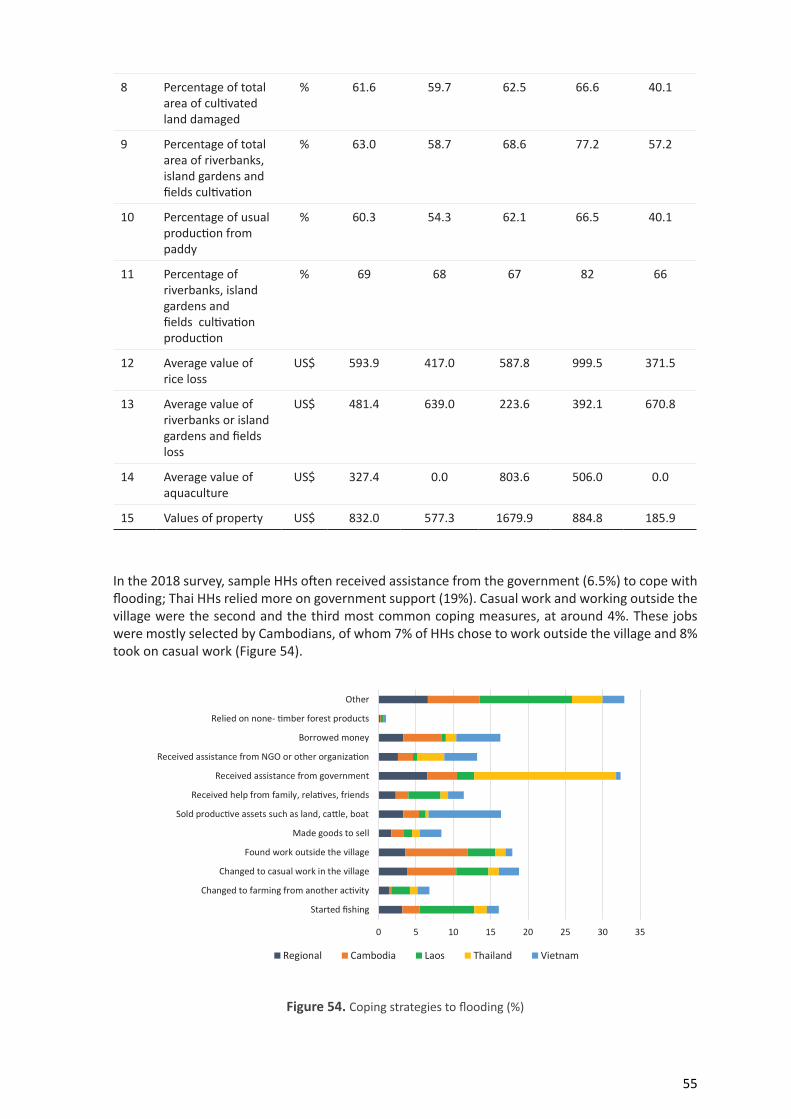
55
8 Percentage of total area of cultivated land damaged
% 61.6 59.7 62.5 66.6 40.1
9 Percentage of total area of riverbanks, island gardens and fields cultivation
% 63.0 58.7 68.6 77.2 57.2
10 Percentage of usual production from paddy
% 60.3 54.3 62.1 66.5 40.1
11 Percentage of riverbanks, island gardens and fields cultivation production
% 69 68 67 82 66
12 Average value of rice loss
US$ 593.9 417.0 587.8 999.5 371.5
13 Average value of riverbanks or island gardens and fields loss
US$ 481.4 639.0 223.6 392.1 670.8
14 Average value of aquaculture
US$ 327.4 0.0 803.6 506.0 0.0
15 Values of property US$ 832.0 577.3 1679.9 884.8 185.9
In the 2018 survey, sample HHs often received assistance from the government (6.5%) to cope with flooding; Thai HHs relied more on government support (19%). Casual work and working outside the village were the second and the third most common coping measures, at around 4%. These jobs were mostly selected by Cambodians, of whom 7% of HHs chose to work outside the village and 8% took on casual work (Figure 54).
0 5 10 15 20 25 30 35
Started fishing
Changed to farming from another ac�vity
Changed to casual work in the village
Found work outside the village
Made goods to sell
Sold produc�ve assets such as land, ca�le, boat
Received help from family, rela�ves, friends
Received assistance from government
Received assistance from NGO or other organiza�on
Borrowed money
Relied on none- �mber forest products
Other
Regional Cambodia Laos Thailand Vietnam
Figure 54. Coping strategies to flooding (%)
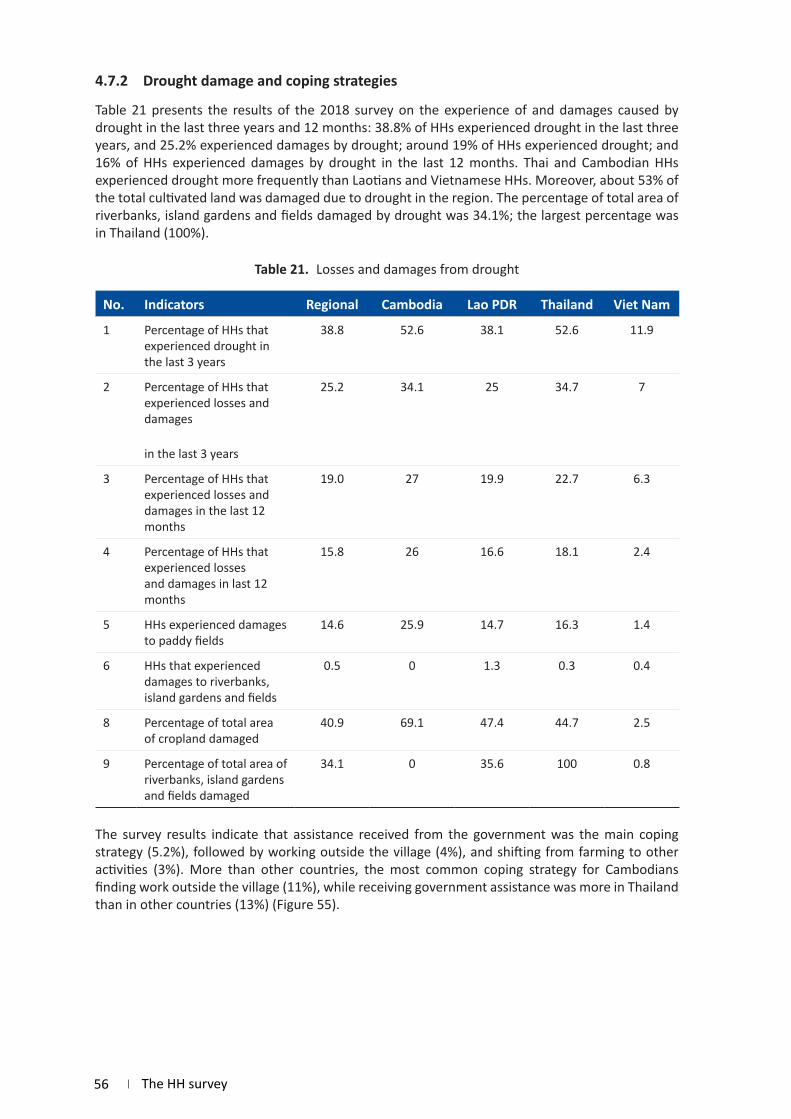
The HH survey56
4.7.2 Drought damage and coping strategies
Table 21 presents the results of the 2018 survey on the experience of and damages caused by drought in the last three years and 12 months: 38.8% of HHs experienced drought in the last three years, and 25.2% experienced damages by drought; around 19% of HHs experienced drought; and 16% of HHs experienced damages by drought in the last 12 months. Thai and Cambodian HHs experienced drought more frequently than Laotians and Vietnamese HHs. Moreover, about 53% of the total cultivated land was damaged due to drought in the region. The percentage of total area of riverbanks, island gardens and fields damaged by drought was 34.1%; the largest percentage was in Thailand (100%).
Table 21. Losses and damages from drought
No. Indicators Regional Cambodia Lao PDR Thailand Viet Nam
1 Percentage of HHs that experienced drought in the last 3 years
38.8 52.6 38.1 52.6 11.9
2 Percentage of HHs that experienced losses and damages
in the last 3 years
25.2 34.1 25 34.7 7
3 Percentage of HHs that experienced losses and damages in the last 12 months
19.0 27 19.9 22.7 6.3
4 Percentage of HHs that experienced losses and damages in last 12 months
15.8 26 16.6 18.1 2.4
5 HHs experienced damages to paddy fields
14.6 25.9 14.7 16.3 1.4
6 HHs that experienced damages to riverbanks, island gardens and fields
0.5 0 1.3 0.3 0.4
8 Percentage of total area of cropland damaged
40.9 69.1 47.4 44.7 2.5
9 Percentage of total area of riverbanks, island gardens and fields damaged
34.1 0 35.6 100 0.8
The survey results indicate that assistance received from the government was the main coping strategy (5.2%), followed by working outside the village (4%), and shifting from farming to other activities (3%). More than other countries, the most common coping strategy for Cambodians finding work outside the village (11%), while receiving government assistance was more in Thailand than in other countries (13%) (Figure 55).
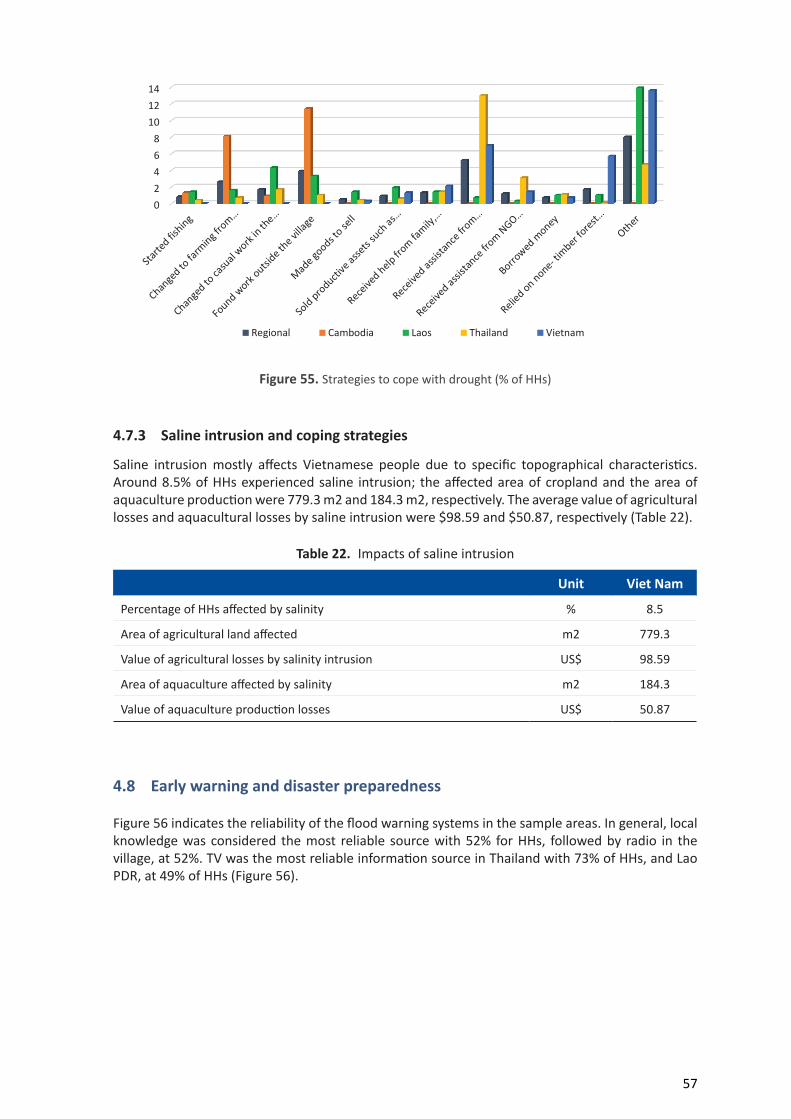
57
02468
101214
Regional Cambodia Laos Thailand Vietnam
Figure 55. Strategies to cope with drought (% of HHs)
4.7.3 Saline intrusion and coping strategies
Saline intrusion mostly affects Vietnamese people due to specific topographical characteristics. Around 8.5% of HHs experienced saline intrusion; the affected area of cropland and the area of aquaculture production were 779.3 m2 and 184.3 m2, respectively. The average value of agricultural losses and aquacultural losses by saline intrusion were $98.59 and $50.87, respectively (Table 22).
Table 22. Impacts of saline intrusion
Unit Viet Nam
Percentage of HHs affected by salinity % 8.5
Area of agricultural land affected m2 779.3
Value of agricultural losses by salinity intrusion US$ 98.59
Area of aquaculture affected by salinity m2 184.3
Value of aquaculture production losses US$ 50.87
4.8 Early warning and disaster preparedness
Figure 56 indicates the reliability of the flood warning systems in the sample areas. In general, local knowledge was considered the most reliable source with 52% for HHs, followed by radio in the village, at 52%. TV was the most reliable information source in Thailand with 73% of HHs, and Lao PDR, at 49% of HHs (Figure 56).
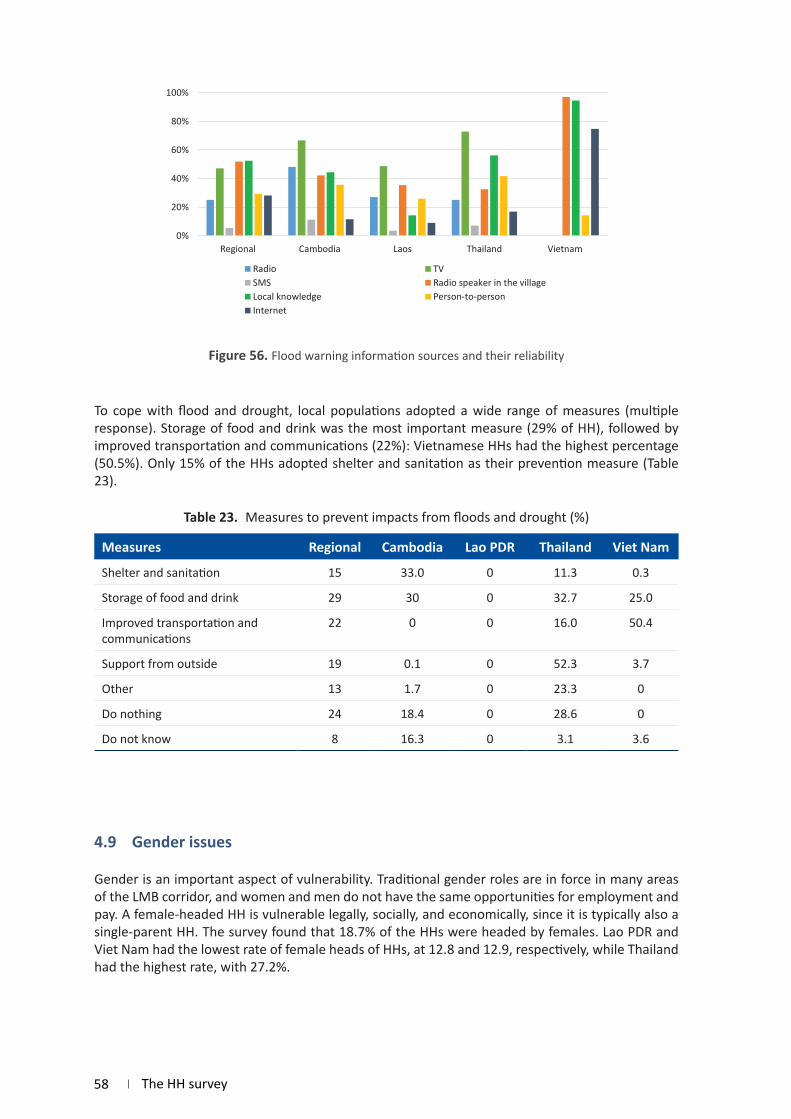
The HH survey58
Lao PDR, at 49% of HHs (Figure 56).
0%
20%
40%
60%
80%
100%
Regional Cambodia Laos Thailand Vietnam
Radio TVSMS Radio speaker in the villageLocal knowledge Person-to-personInternet
Figure 56. Flood warning information sources and their reliability
To cope with flood and drought, local populations adopted a wide range of measures (multiple response). Storage of food and drink was the most important measure (29% of HH), followed by improved transportation and communications (22%): Vietnamese HHs had the highest percentage (50.5%). Only 15% of the HHs adopted shelter and sanitation as their prevention measure (Table 23).
Table 23. Measures to prevent impacts from floods and drought (%)
Measures Regional Cambodia Lao PDR Thailand Viet Nam
Shelter and sanitation 15 33.0 0 11.3 0.3
Storage of food and drink 29 30 0 32.7 25.0
Improved transportation and communications
22 0 0 16.0 50.4
Support from outside 19 0.1 0 52.3 3.7
Other 13 1.7 0 23.3 0
Do nothing 24 18.4 0 28.6 0
Do not know 8 16.3 0 3.1 3.6
4.9 Gender issues
Gender is an important aspect of vulnerability. Traditional gender roles are in force in many areas of the LMB corridor, and women and men do not have the same opportunities for employment and pay. A female-headed HH is vulnerable legally, socially, and economically, since it is typically also a single-parent HH. The survey found that 18.7% of the HHs were headed by females. Lao PDR and Viet Nam had the lowest rate of female heads of HHs, at 12.8 and 12.9, respectively, while Thailand had the highest rate, with 27.2%.
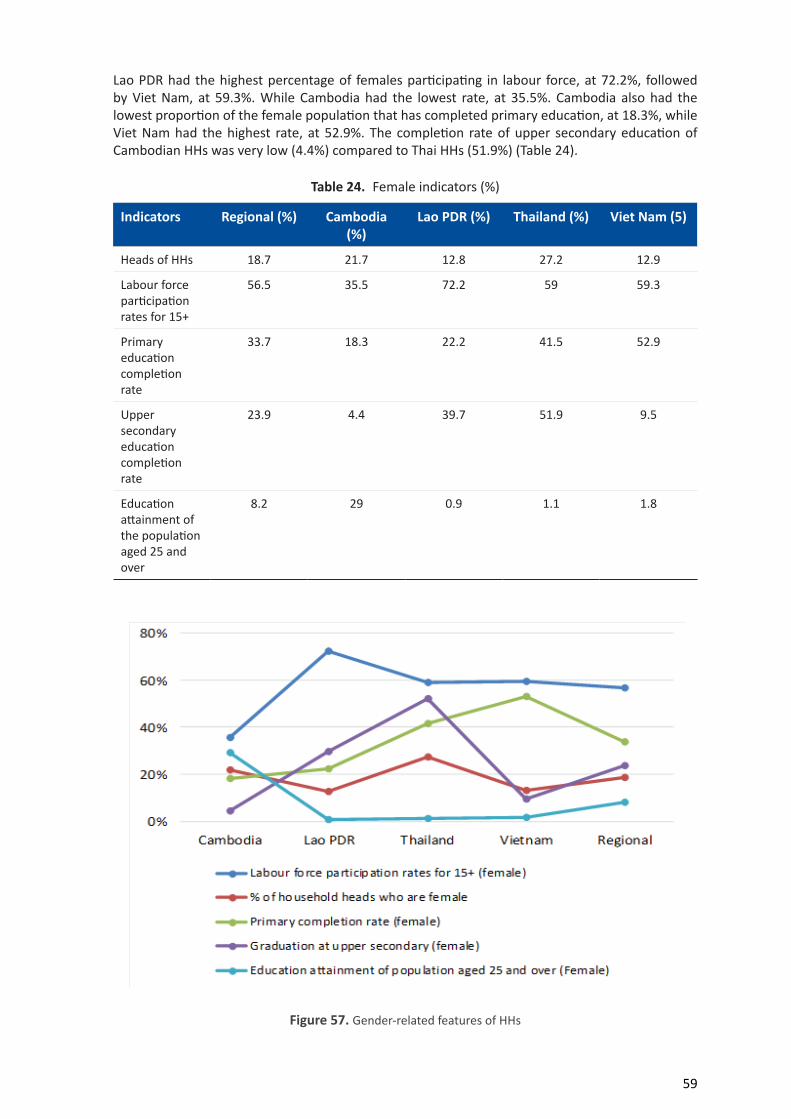
59
Lao PDR had the highest percentage of females participating in labour force, at 72.2%, followed by Viet Nam, at 59.3%. While Cambodia had the lowest rate, at 35.5%. Cambodia also had the lowest proportion of the female population that has completed primary education, at 18.3%, while Viet Nam had the highest rate, at 52.9%. The completion rate of upper secondary education of Cambodian HHs was very low (4.4%) compared to Thai HHs (51.9%) (Table 24).
Table 24. Female indicators (%)
Indicators Regional (%) Cambodia (%)
Lao PDR (%) Thailand (%) Viet Nam (5)
Heads of HHs 18.7 21.7 12.8 27.2 12.9
Labour force participation rates for 15+
56.5 35.5 72.2 59 59.3
Primary education completion rate
33.7 18.3 22.2 41.5 52.9
Upper secondary education completion rate
23.9 4.4 39.7 51.9 9.5
Education attainment of the population aged 25 and over
8.2 29 0.9 1.1 1.8
Figure 57. Gender-related features of HHs
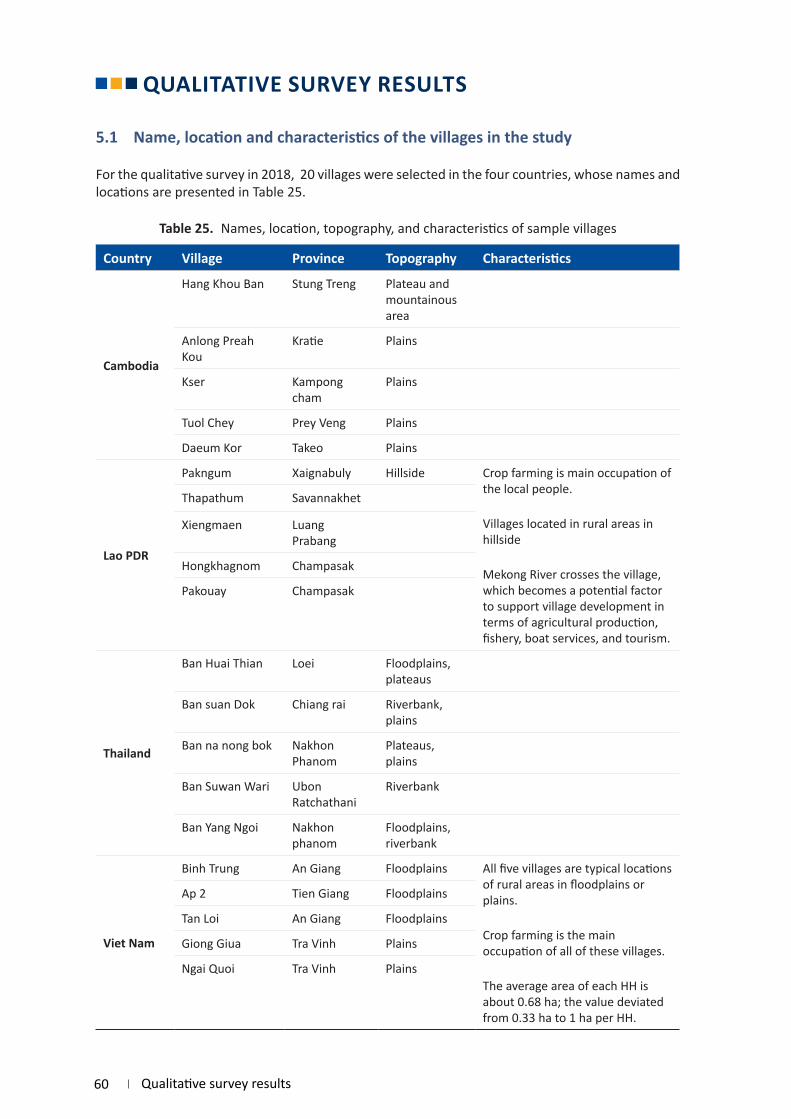
Qualitative survey results60
QUALITATIVE SURVEY RESULTS
5.1 Name, location and characteristics of the villages in the study
For the qualitative survey in 2018, 20 villages were selected in the four countries, whose names and locations are presented in Table 25.
Table 25. Names, location, topography, and characteristics of sample villages
Country Village Province Topography Characteristics
Cambodia
Hang Khou Ban Stung Treng Plateau and mountainous area
Anlong Preah Kou
Kratie Plains
Kser Kampong cham
Plains
Tuol Chey Prey Veng Plains
Daeum Kor Takeo Plains
Lao PDR
Pakngum Xaignabuly Hillside Crop farming is main occupation of the local people.
Villages located in rural areas in hillside
Mekong River crosses the village, which becomes a potential factor to support village development in terms of agricultural production, fishery, boat services, and tourism.
Thapathum Savannakhet
Xiengmaen Luang Prabang
Hongkhagnom Champasak
Pakouay Champasak
Thailand
Ban Huai Thian Loei Floodplains, plateaus
Ban suan Dok Chiang rai Riverbank, plains
Ban na nong bok Nakhon Phanom
Plateaus, plains
Ban Suwan Wari Ubon Ratchathani
Riverbank
Ban Yang Ngoi Nakhon phanom
Floodplains, riverbank
Viet Nam
Binh Trung An Giang Floodplains All five villages are typical locations of rural areas in floodplains or plains.
Crop farming is the main occupation of all of these villages.
The average area of each HH is about 0.68 ha; the value deviated from 0.33 ha to 1 ha per HH.
Ap 2 Tien Giang Floodplains
Tan Loi An Giang Floodplains
Giong Giua Tra Vinh Plains
Ngai Quoi Tra Vinh Plains
61
5.2 Main events that occurred in the last five years
Based on the qualitative study, many different types of events occurred in the last five years that had impacts on local communities in the four countries. In general, some of the important events were climate events such as flood and drought, the decrease of fish resources, crop and livestock diseases, and major events derived from natural and human causes, which all had both positive and negative effects on HH livelihoods. The coping strategies were short-term and mostly dependent on government support.
Cambodia
Electricity use: Before 2014, the village does not have electricity for consumption. The life condition of the village’s population is under normal well-being scale because electricity is important for their life. From 2014 until present the village has electricity for usage, so the population feel happy due to having sufficient electricity for consumption. Electricity also helps improve villagers’ livelihood. From 2015, the price of electricity has been high and electricity has been cut many times a day, which has made the villagers unhappy. If the price of electricity were lower and the power of electricity supply had been stable enough, village livelihood could have better improved. These changes are due to the fact that electricity is very important, for example, for consumption, for lighting homes. Currently, in the survey areas in Cambodia, there is almost a 100% coverage of home lighting. However, until only a few years ago, most Cambodians living in rural areas lacked access to electricity. The villagers were not satisfied with this situation, so they requested the commune authority to connect electricity for the villages, who reported to Electricite du Cambodge, who then connected the village to the electricity grid.
Toilet construction (support by the Provincial Rural Development authority): Before 2013, there was not much improvement in the number of toilets, which negatively affected the environment and sanitation; the well-being of population was below average but in 2014 some villagers constructed the toilet by themselves, so the sanitation has improved resulting in better feeling of the population. In February 2015, the Provincial Rural Development (PRD) authority began to support toilet construction for villages. First, PRD provided toilets to the poor HH and subsidized some labour in construction. This development made the villagers happier as result of the improved environment, better sanitation, and improved health of villagers. From 2016 to 2018, the Provincial Rural Development continued their support. Although the support did not reach all HHs, more toilets were available in this village resulting in the highest level of happiness and well-being in this village. Changes related to this issue is that hydropower dam releasing water has affected to the villager assets. Toilets have been destroyed by water released from hydropower dams.
Road Construction: In April 2013 and March 2014, two different events occurred related to road construction. The livelihood of the village’s population improved due to better road conditions and less expenditures on transportation. Communities have a good road to travel, more middlemen came to buy agriculture products, so road construction is considered very important to their livelihoods. From 2015 to 2017, the road was partially broken, so the villagers find it difficult to travel and it created obstacles in getting agriculture products to transport to markets. Middlemen did not come to buy agricultural products due to the bad roads. Villagers became relatively hopeless because of this problem. At the end of 2018, the road was reconstructed and some roads in the villages are paved with concrete, the villagers in turn feel happy and their well-being improved. The villagers requested the authorities to construct a new road because the old one was destroyed by flood, and during the construction, travel was difficult.
Class room construction: From 2013 to 2015, in the village, there was one primary school with the old building that the student can study in but it was not comfortable. The students felt unsafe and worried every day due to the decay building. Their parents had concerns about children safety because the school was getting too old. In 2016, the Korean NGO DAI LAA supported a new school building for the primary school. Students are no longer worried about the school collapsing, which
Qualitative survey results62
was considered a motivating factor for students to work harder.
Coping strategies by the community – requesting for government support: The villagers had meetings and made a decision to request to the authority and EDC for electricity connection, then the authority forwarded this request to the government. The government responded and provided electricity connection. Government also supported road reconstruction and villagers contributed labour. Moreover, during flooding, the community had support from NGOs and other organizations to regain what was lost due to flooding. Community had the new school building under support from Korean fund (Dai Laor Organization).
Lao PDR
Within the last five years, the sample villages faced with different events that impacted on people’s lives and livelihoods, for example:
In Pakngum village there was a decrease in the price of agricultural products. This is considered a man-made event. This impact was a strong negative event leading to loss of income for many HHs and the decrease of plantation areas. To cope with this event, local people decided to switch to grow more rice and change to livestock farming. The village also face with decreasing number of fish due to the use of electric device for catching fish. This event causes the reduction of fish abundance and loss of income for many HHs, thus reduce food security. Solution for this problem is prohibiting any electric devices for catching fish.
In Xiengmaen village, the Mekong Rriverbank collapsed due to human activities. The abnormal level of the Mekong River, an increase in navigation, and sand and gravel mining were considered the main causes of this event. The event had a negative impact, leading to the reduction of production areas and HH income. A coping strategy was proposed to the local government. The decrease in fish resources was also a problem for the people of Xiengmaen Village.
In Thapathum village there was a major flood caused by an increase in heavy rain. The event lead to increase fish source while causing crop and rice loss, income reduction and impact on transportation. The coping strategy for this event was short term with local Government and agencies providing support by offering land tax exemption or donating some food and drink to local people.
In Hongkhagnom village, local people faced with malaria disease outbreak due to increased monsoon rainfall. This made a strong negative impact on the village which impacted human health, thus deceased income of many HHs.
In Pakouay, there was a drought due to extreme hot weather that had a strong negative impact leading to crop and livestock deaths and disease outbreaks in livestock. The coping strategies were short term by local government support and changing to other jobs. More details on main events, impacts, causes and coping strategies can be found in Annexe 1.1
Thailand
There were 98 events in total: 67 events (68.4%) that had strong impacts on the well-being of villagers in five villages in Thailand; and 31 events (31.6%) that had weak impacts. Agricultural events were discussed more than other events, and 87.5 of these events had a strong impact on well-being. Other important events that had a strong impact on the well-being included those directly connected to the Mekong River or other water resources (76.5%), public and private forms of support (81.8%), and weather-related events (63.6%).
63
Below are examples from each village that discusses in more detail which highlights the different events experience by the villages.
In Ban suan dok, there was an agricultural event caused by the economic situation in Thailand (defined as a man-made cause). This led to an increase in the price of agricultural products. This impact was a strong positive event leading to an increase in income for many HHs. This event did not require any coping strategies.
In Huai thian, there was also an agricultural event with a strong impact. Plant disease, which was caused by human activity, had a negative impact leading to a reduction in HH income. Because of this event the coping strategy selected was an agricultural change to planting a more disease tolerant rice variety. This is viewed as a long-term strategy to deal with the negative impact.
In Yang ngoi, there was flooding connected to the Mekong River caused by monsoon rainfall (defined as natural causes). It had a strong impact on the village which led to a reduction in income for many of the HHs. The coping strategy for this event was short term with local Government and agencies providing support.
In Ban na nong bok, the Government provide support to the village which led to an improvement in access to services for the HHs. This was a strong positive man-made impact on the village.
In Suwan wari, there was a monsoon storm that had a strong negative impact leading to a riverbank collapse. This naturally caused event led to a reduction in natural resources which had a negative impact on the HHs in the village. Details on main events, impacts, causes, and coping strategies can be found in Annexe 1.2.
Viet Nam
The construction of infrastructure (schools, clinic station, roads, bridges, etc.) in the five villages through government support in order to improve rural development has been an important event. The event had a positive effect on the local community by improving access to services. Other positive events include the increase in new jobs and job training, a good rice harvest, improved health care, and low prices of agriculture products, etc. The root causes of these changes were increased investment by farmers in their own resources, and greater application of scientific and new techniques and strong government support.
The sample villages also faced negative events; riverbank collapse was one of the most severe. The causes of this event are strong flows in wet season, lack of embankment, upstream development, and sand mining. Riverbank collapse leads to the reduction of aquatic resources, a decrease in HH income and a loss of assets. Adaptation strategies for this event includes obtaining support for basin cooperation and external support fund for riverbank prevention.
Low prices of agricultural products were due to lack of market knowledge and product chains in all sample villages. The event causes a reduction in HHs income and livelihood security. Common solutions for this event are raising awareness, obtaining state support for farmers to find markets, strengthening the links between farmers and enterprises, improving cultivation techniques and quality of products, and receiving training/education from outside the village.
Drought and water shortages due to climate change and the unstable discharge of the Mekong River have detrimentally impacted on HHs in Ngai Quoi and Binh Trung villages. These negative events impacted on agricultural production, reducing the income of many HHs. The coping strategies adopted by local communities were changing agricultural practices and water sluice construction. Details on the main events, impacts, causes, and coping strategies are provided in Annexe 1.3
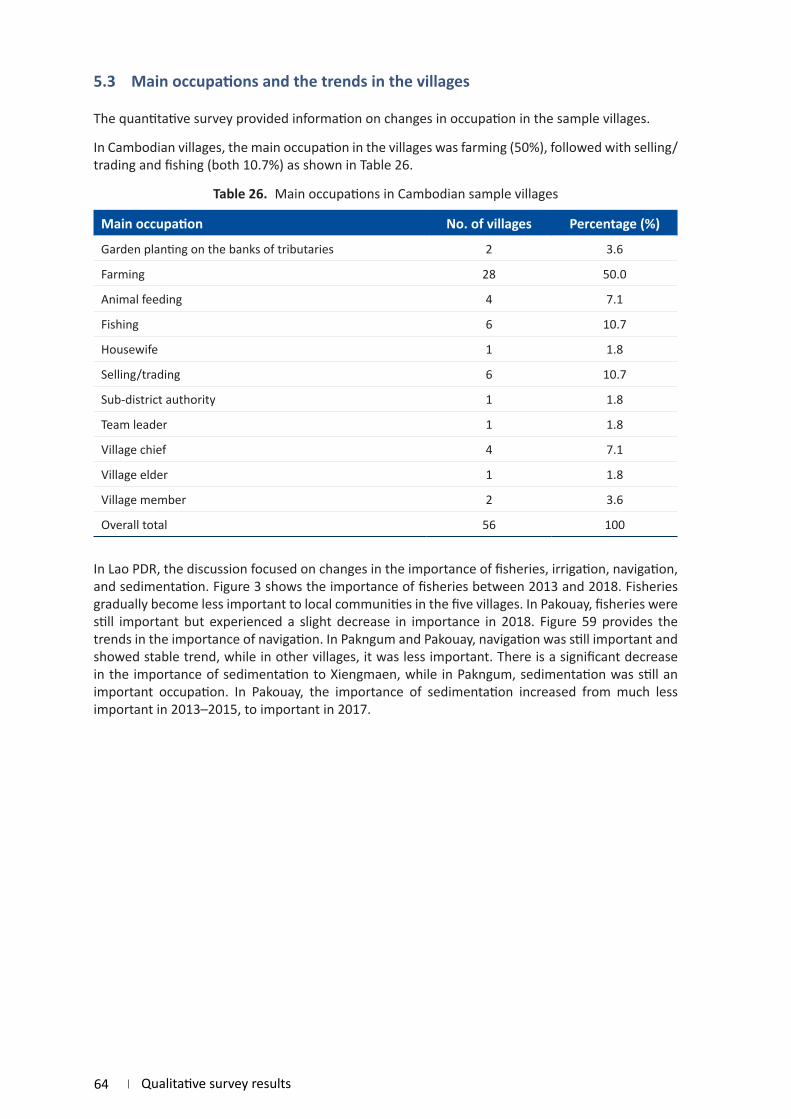
Qualitative survey results64
5.3 Main occupations and the trends in the villages
The quantitative survey provided information on changes in occupation in the sample villages.
In Cambodian villages, the main occupation in the villages was farming (50%), followed with selling/trading and fishing (both 10.7%) as shown in Table 26.
Table 26. Main occupations in Cambodian sample villages
Main occupation No. of villages Percentage (%)
Garden planting on the banks of tributaries 2 3.6
Farming 28 50.0
Animal feeding 4 7.1
Fishing 6 10.7
Housewife 1 1.8
Selling/trading 6 10.7
Sub-district authority 1 1.8
Team leader 1 1.8
Village chief 4 7.1
Village elder 1 1.8
Village member 2 3.6
Overall total 56 100
In Lao PDR, the discussion focused on changes in the importance of fisheries, irrigation, navigation, and sedimentation. Figure 3 shows the importance of fisheries between 2013 and 2018. Fisheries gradually become less important to local communities in the five villages. In Pakouay, fisheries were still important but experienced a slight decrease in importance in 2018. Figure 59 provides the trends in the importance of navigation. In Pakngum and Pakouay, navigation was still important and showed stable trend, while in other villages, it was less important. There is a significant decrease in the importance of sedimentation to Xiengmaen, while in Pakngum, sedimentation was still an important occupation. In Pakouay, the importance of sedimentation increased from much less important in 2013–2015, to important in 2017.
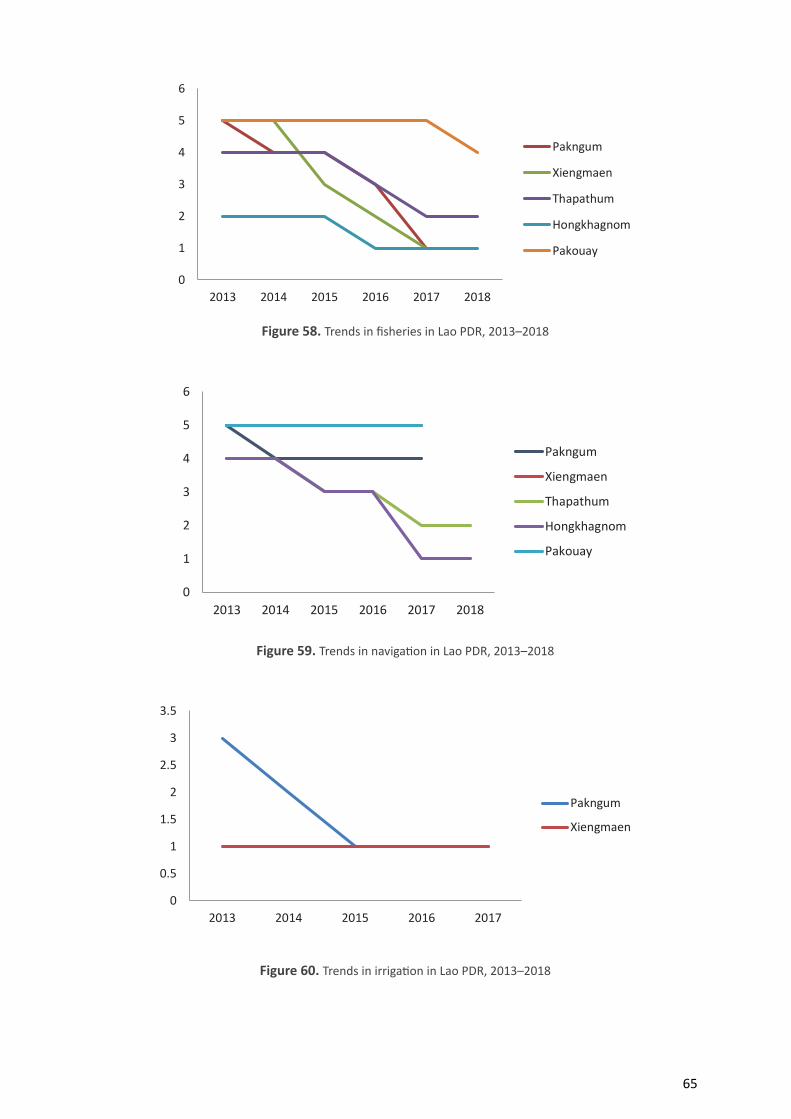
65
0
1
2
3
4
5
6
2013 2014 2015 2016 2017 2018
Pakngum
Xiengmaen
Thapathum
Hongkhagnom
Pakouay
Figure 58. Trends in fisheries in Lao PDR, 2013–2018
0
1
2
3
4
5
6
2013 2014 2015 2016 2017 2018
Pakngum
Xiengmaen
Thapathum
Hongkhagnom
Pakouay
Figure 59. Trends in navigation in Lao PDR, 2013–2018
0
0.5
1
1.5
2
2.5
3
3.5
2013 2014 2015 2016 2017
Pakngum
Xiengmaen
Figure 60. Trends in irrigation in Lao PDR, 2013–2018
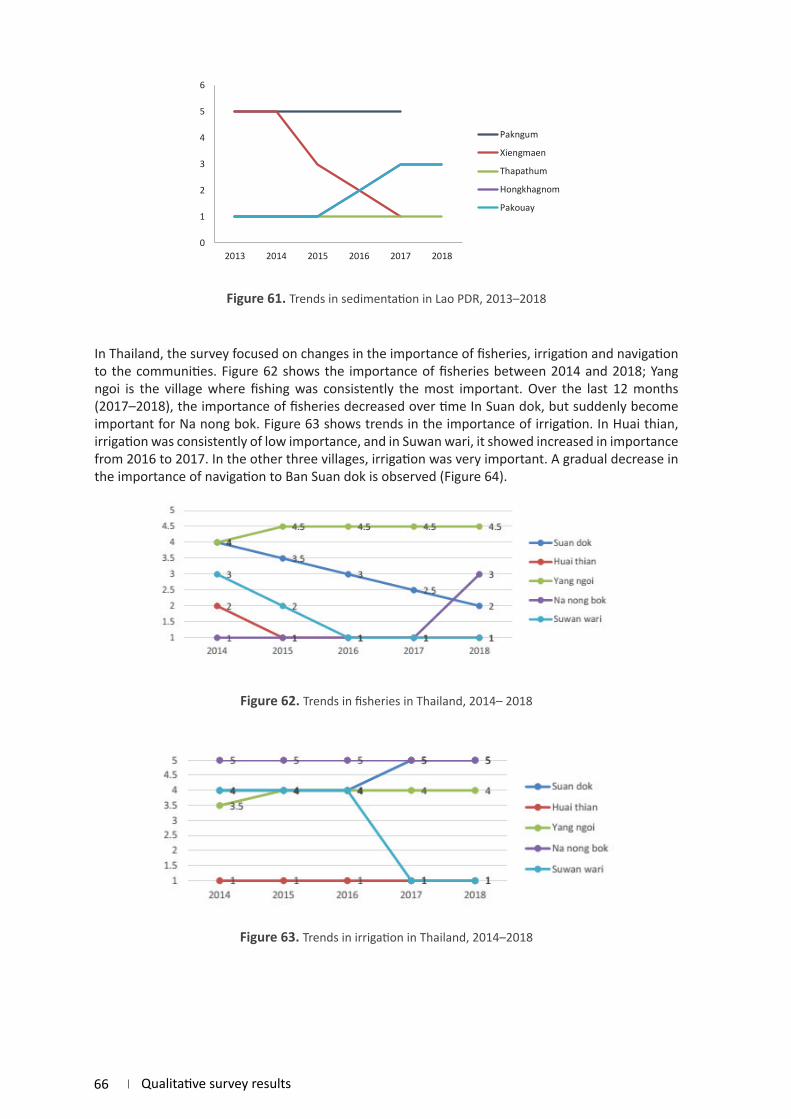
Qualitative survey results66
0
1
2
3
4
5
6
2013 2014 2015 2016 2017 2018
Pakngum
Xiengmaen
Thapathum
Hongkhagnom
Pakouay
Figure 61. Trends in sedimentation in Lao PDR, 2013–2018
In Thailand, the survey focused on changes in the importance of fisheries, irrigation and navigation to the communities. Figure 62 shows the importance of fisheries between 2014 and 2018; Yang ngoi is the village where fishing was consistently the most important. Over the last 12 months (2017–2018), the importance of fisheries decreased over time In Suan dok, but suddenly become important for Na nong bok. Figure 63 shows trends in the importance of irrigation. In Huai thian, irrigation was consistently of low importance, and in Suwan wari, it showed increased in importance from 2016 to 2017. In the other three villages, irrigation was very important. A gradual decrease in the importance of navigation to Ban Suan dok is observed (Figure 64).
Figure 62. Trends in fisheries in Thailand, 2014– 2018
Figure 63. Trends in irrigation in Thailand, 2014–2018
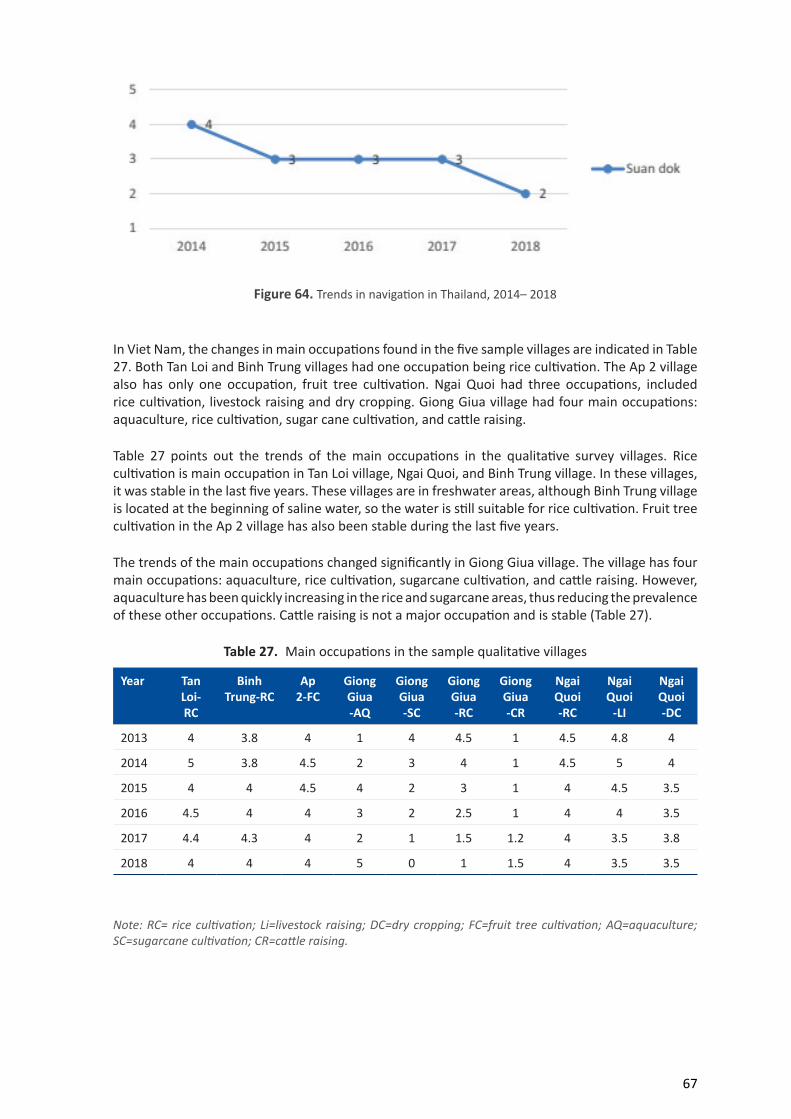
67
Figure 64. Trends in navigation in Thailand, 2014– 2018
In Viet Nam, the changes in main occupations found in the five sample villages are indicated in Table 27. Both Tan Loi and Binh Trung villages had one occupation being rice cultivation. The Ap 2 village also has only one occupation, fruit tree cultivation. Ngai Quoi had three occupations, included rice cultivation, livestock raising and dry cropping. Giong Giua village had four main occupations: aquaculture, rice cultivation, sugar cane cultivation, and cattle raising.
Table 27 points out the trends of the main occupations in the qualitative survey villages. Rice cultivation is main occupation in Tan Loi village, Ngai Quoi, and Binh Trung village. In these villages, it was stable in the last five years. These villages are in freshwater areas, although Binh Trung village is located at the beginning of saline water, so the water is still suitable for rice cultivation. Fruit tree cultivation in the Ap 2 village has also been stable during the last five years.
The trends of the main occupations changed significantly in Giong Giua village. The village has four main occupations: aquaculture, rice cultivation, sugarcane cultivation, and cattle raising. However, aquaculture has been quickly increasing in the rice and sugarcane areas, thus reducing the prevalence of these other occupations. Cattle raising is not a major occupation and is stable (Table 27).
Table 27. Main occupations in the sample qualitative villages
Year Tan Loi- RC
Binh Trung-RC
Ap 2-FC
Giong Giua -AQ
Giong Giua -SC
Giong Giua -RC
Giong Giua -CR
Ngai Quoi -RC
Ngai Quoi
-LI
Ngai Quoi -DC
2013 4 3.8 4 1 4 4.5 1 4.5 4.8 4
2014 5 3.8 4.5 2 3 4 1 4.5 5 4
2015 4 4 4.5 4 2 3 1 4 4.5 3.5
2016 4.5 4 4 3 2 2.5 1 4 4 3.5
2017 4.4 4.3 4 2 1 1.5 1.2 4 3.5 3.8
2018 4 4 4 5 0 1 1.5 4 3.5 3.5
Note: RC= rice cultivation; Li=livestock raising; DC=dry cropping; FC=fruit tree cultivation; AQ=aquaculture; SC=sugarcane cultivation; CR=cattle raising.
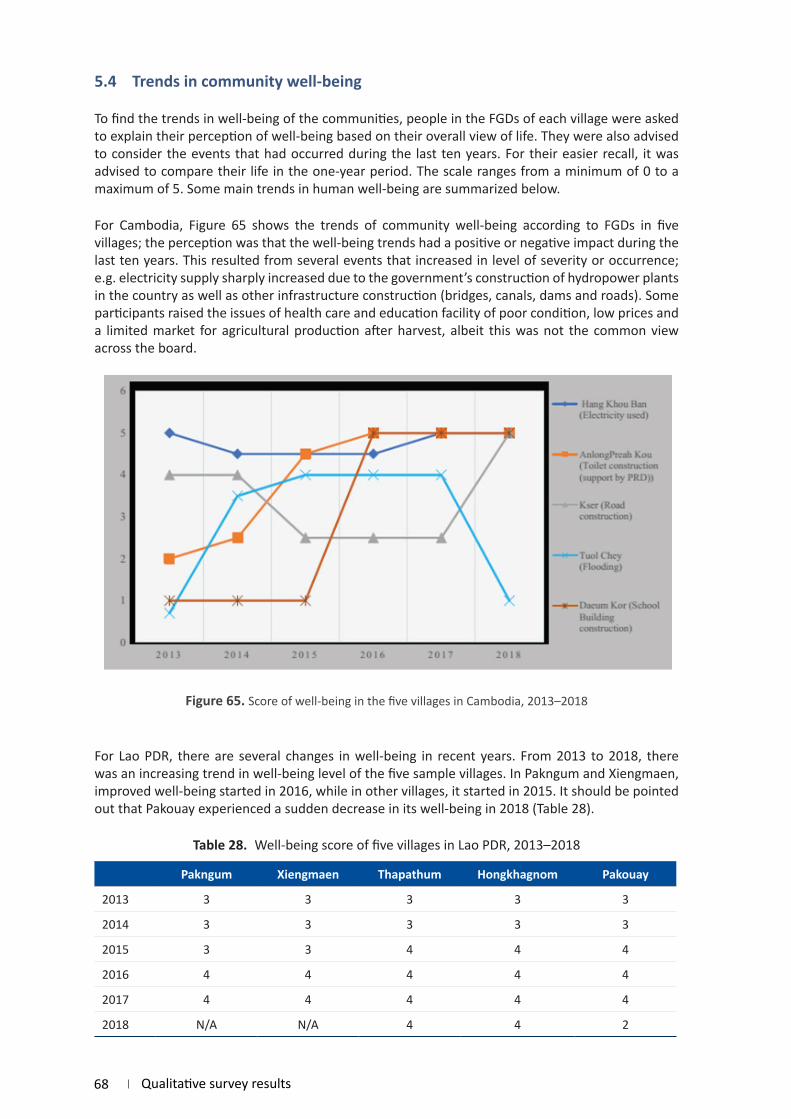
Qualitative survey results68
5.4 Trends in community well-being
To find the trends in well-being of the communities, people in the FGDs of each village were asked to explain their perception of well-being based on their overall view of life. They were also advised to consider the events that had occurred during the last ten years. For their easier recall, it was advised to compare their life in the one-year period. The scale ranges from a minimum of 0 to a maximum of 5. Some main trends in human well-being are summarized below.
For Cambodia, Figure 65 shows the trends of community well-being according to FGDs in five villages; the perception was that the well-being trends had a positive or negative impact during the last ten years. This resulted from several events that increased in level of severity or occurrence; e.g. electricity supply sharply increased due to the government’s construction of hydropower plants in the country as well as other infrastructure construction (bridges, canals, dams and roads). Some participants raised the issues of health care and education facility of poor condition, low prices and a limited market for agricultural production after harvest, albeit this was not the common view across the board.
Figure 65. Score of well-being in the five villages in Cambodia, 2013–2018
For Lao PDR, there are several changes in well-being in recent years. From 2013 to 2018, there was an increasing trend in well-being level of the five sample villages. In Pakngum and Xiengmaen, improved well-being started in 2016, while in other villages, it started in 2015. It should be pointed out that Pakouay experienced a sudden decrease in its well-being in 2018 (Table 28).
Table 28. Well-being score of five villages in Lao PDR, 2013–2018
Pakngum Xiengmaen Thapathum Hongkhagnom Pakouay
2013 3 3 3 3 3
2014 3 3 3 3 3
2015 3 3 4 4 4
2016 4 4 4 4 4
2017 4 4 4 4 4
2018 N/A N/A 4 4 2
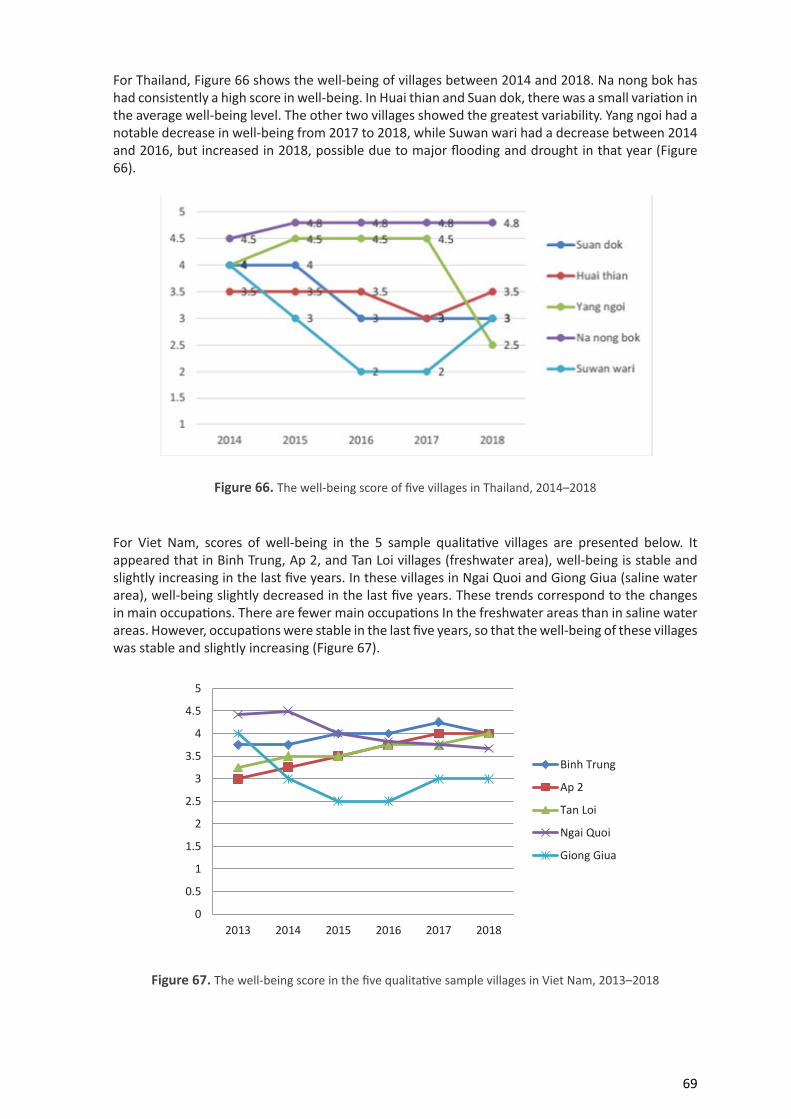
69
For Thailand, Figure 66 shows the well-being of villages between 2014 and 2018. Na nong bok has had consistently a high score in well-being. In Huai thian and Suan dok, there was a small variation in the average well-being level. The other two villages showed the greatest variability. Yang ngoi had a notable decrease in well-being from 2017 to 2018, while Suwan wari had a decrease between 2014 and 2016, but increased in 2018, possible due to major flooding and drought in that year (Figure 66).
Figure 66. The well-being score of five villages in Thailand, 2014–2018
For Viet Nam, scores of well-being in the 5 sample qualitative villages are presented below. It appeared that in Binh Trung, Ap 2, and Tan Loi villages (freshwater area), well-being is stable and slightly increasing in the last five years. In these villages in Ngai Quoi and Giong Giua (saline water area), well-being slightly decreased in the last five years. These trends correspond to the changes in main occupations. There are fewer main occupations In the freshwater areas than in saline water areas. However, occupations were stable in the last five years, so that the well-being of these villages was stable and slightly increasing (Figure 67).
0
0.5
1
1.5
2
2.5
3
3.5
4
4.5
5
2013 2014 2015 2016 2017 2018
Binh Trung
Ap 2
Tan Loi
Ngai Quoi
Giong Giua
Figure 67. The well-being score in the five qualitative sample villages in Viet Nam, 2013–2018

Conclusion and recommendations70
CONCLUSIONS AND RECOMMENDATIONS
6.1 Conclusions
The SIMVA 2018 survey has provided information on the status and trends of the social-economic conditions of the people in the Mekong River corridor and the trend in people dependence on water resources. This survey also provides data and information on social vulnerability (particularly food and livelihood vulnerability) linked to changes in water resources (agriculture, aquaculture, fish, OAAs/Ps), and HHs’ resilience in coping with these changes. The relationship between socio-economic conditions and people’s dependency on water resources determines their vulnerability to changes in the water resources. The survey as such provides information that can potentially be used for socio-economic impact assessments or monitoring for the MRC 2021–2025 cycle and longer-term basin development planning and monitoring. The long-term monitoring of SIMVA aims to: identify any significant changes in HHs’ access to water resources; identify any significant changes in HH welfare and livelihoods;lLink these changes to their levels of vulnerabilities, in particular, livelihood vulnerability; and help identify measures to deal with potential social impacts of economic activities and projects in region.
The quantitative survey at the village and HH levels provided demographic information, vulnerability indicators, information about dependence on local resources, resilience indicators, climate change social indicators, and gender-specific indicators. Some main observations from the quantitative survey are as follows:
• Compared to the 2014 survey, crop farming is still the major livelihood in all study sites, reflecting that local livelihoods are vulnerable to changes in water resource and climate change impacts. However, trading (included services) has become the second most important. Migrating to work in other districts or provinces is very common for almost all sample villages.
• With regard to labour mobility, in the four countries people mostly travel to other fishing areas to fish.
• with regard to water supply resources, piped water and bottled water were the main water sources in the corridor, especially in Viet Nam and Thailand.
• Among the main climate shocks related to Mekong River system, flooding was the largest and the most impactful event in the Mekong corridor. Compared to the 2014 survey, losses and damages from main climate shocks, especially flooding has increased significantly in all areas.
• The consequences of climate extreme events varied among surveyed zones. While flooding impacted all countries, only Viet Nam suffered from saline intrusion.
• The most serious flooding was river overflow, and the main causes of flooding were from normal rains/monsoons and extended monsoons.
• The main causes of drought were extreme weather/climate change and an extended dry season.
• In term of adaptation, more than 80% of villages in Thailand and Viet Nam made efforts to prevent climate change, although in Lao PDR and Cambodia, this figure is less than half. There have been numerous measures to adapt to climate change, principally raising awareness (primarily in Viet Nam and Thailand), i.e. non-structural, but in some cases, there have been changes to crop patterns (in Lao PDR and Thailand) or building dykes (primarily in Cambodia), i.e. structural.
• The people living along Mekong River corridor are vulnerable to changes in water resources and climate events since their livelihoods in farming and fisheries strongly depend on water resources and weather conditions, and they have limited measures to cope with the impacts of these changes.
71
The analysis of qualitative survey revealed key changes in occupation and the well-being of local communities
• There were some improvements in local infrastructure, such as the construction of new road and bridges in Viet Nam.
• The main events causing negative impacts were riverbank collapse; low prices of agriculture products; disease outbreak; a decrease in fish resources; and climate events such as flooding, droughts, and water shortages (mostly in Viet Nam).
• Among the main climate shocks related to the Mekong River system, flooding was the largest and the most impactful event in the Mekong corridor. Compared to the 2014 survey, losses and damages from main climate shocks, especially flooding, increased significantly in all areas.
6.2 Recommendations
It is recommended that, the SIMVA survey continues to capture primary data of community dependency on the Mekong River water resources. Surveys should take place every four years to capture possible trends of vulnerability in the corridor. The main components of future SIMVA surveys, on social vulnerability (particularly food and livelihood vulnerability) linked to changes in water resources (agriculture, aquaculture, fish, OAAs/Ps) remain unchanged in order to allow for a comparison of further trends.
The data collection approach is important to ensure accurate data for a temporal overview of the situation on the Mekong mainstream. It is vital to train staff collecting data to ensure understanding of the required data and consistency.
Arranging and conducting interviews with HHs can be time-consuming. In some cases, the HHs did not agree to complete the survey. The number of replacement HHs should be increased, and when an original HH was not available, an alternative was selected to reduce the time burden for data collection.
Regarding the reliability of data, some questions were understood differently in different countries; as a result, some collected data were inconsistent. Thus, it was necessary to ensure that the questionnaires were clear and easy to understand.
When entering data, all the countries should develop codebooks and have the same coding in order to ensure that the aggregate data for the entire region is calculated and analysed accurately.
Regarding to data analysis, some answers were categorized as “Other” but were not specified. Therefore, further analysis of the data may elicit clarification on what the ‘Other’ category covers.
The coping strategies for negative events are limited, therefore, governments should take a more active role and develop more pro-active actions to deal with negative events. Some proposed strategies to mitigate the negative impacts are as follows:
• Implement Reducing Emissions from Deforestation and Forest Degradation (REDD+) and reduce the exploitation of natural resources, particularly in order to save forest and perennial plants to reduce emissions of carbon dioxide gas, which can reduce the impacts of climate changes.
• Develop incentives to reduce the unstable use of the natural resources, particularly in order to prevent overexploitation of river sand, and aquatic fauna and flora with electric shock.
Conclusion and recommendations72
• Change agricultural practices by changing varieties and crop calendar of agriculture production.
• Mobilize support for Basin cooperation, setting up an external support fund for riverbank preservation.
• Provide training/education to villages and promote alternative livelihood activities.
• Seek new markets, improve cultivation techniques, and improve the quality of products.
• Strengthen advocacy and mobilization control measures for cultivation technology to cope with climate change.
• Improve awareness of the people/state support available to farmers.
• Strengthen the links between farmers and enterprises, and markets.
• Strengthen the legal implementation of environmental protection, encourage people to use water in a more efficient manner, restrict drug use in plant protection, and support the use of biological medicinal products.
Additional issues to be explored for future surveys are as follows:
• Expand study areas and redistribute sampling sizes among the zones to better reflect the population sizes.
• Rename the zones to include country names for easy reference.
• Review the indicators to make them more suitable to emerging issues such as the use of Mekong water, migration, livelihood options, and health outcomes.
• Disseminate SIMVA data and make use of it for Prior Consultation processes, including for monitoring and socio-economic modelling.
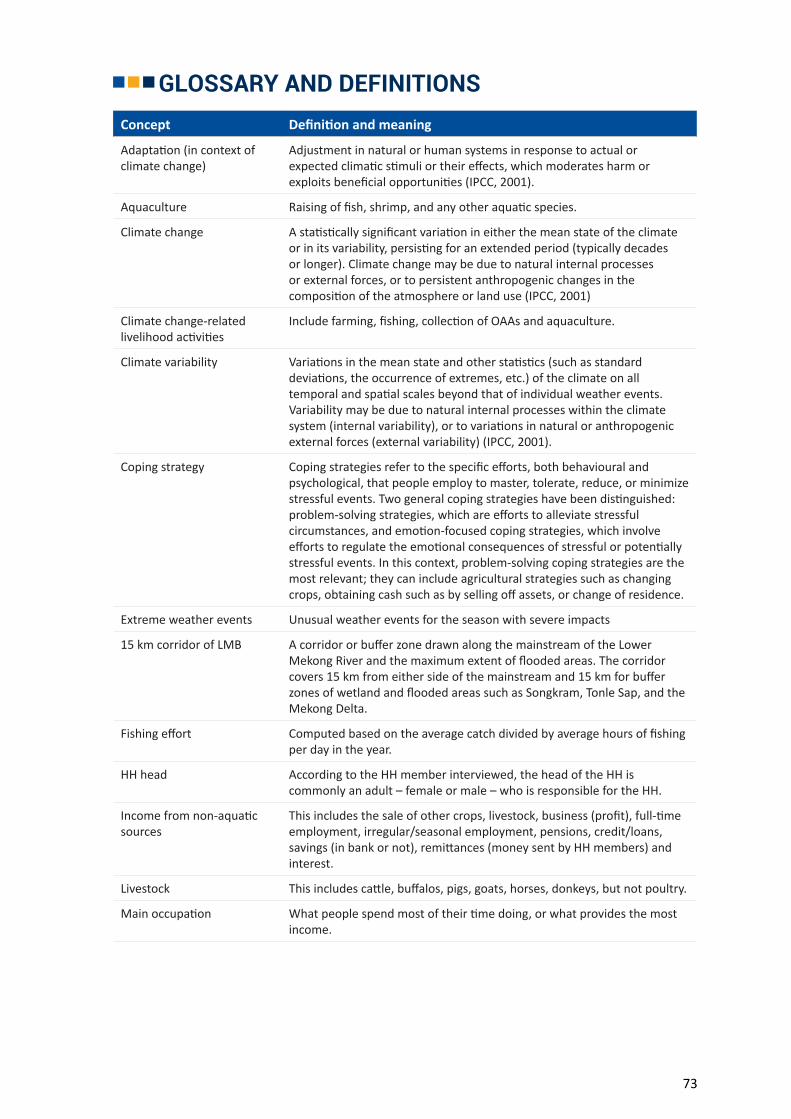
73
GLOSSARY AND DEFINITIONSConcept Definition and meaning
Adaptation (in context of climate change)
Adjustment in natural or human systems in response to actual or expected climatic stimuli or their effects, which moderates harm or exploits beneficial opportunities (IPCC, 2001).
Aquaculture Raising of fish, shrimp, and any other aquatic species.
Climate change A statistically significant variation in either the mean state of the climate or in its variability, persisting for an extended period (typically decades or longer). Climate change may be due to natural internal processes or external forces, or to persistent anthropogenic changes in the composition of the atmosphere or land use (IPCC, 2001)
Climate change-related livelihood activities
Include farming, fishing, collection of OAAs and aquaculture.
Climate variability Variations in the mean state and other statistics (such as standard deviations, the occurrence of extremes, etc.) of the climate on all temporal and spatial scales beyond that of individual weather events. Variability may be due to natural internal processes within the climate system (internal variability), or to variations in natural or anthropogenic external forces (external variability) (IPCC, 2001).
Coping strategy Coping strategies refer to the specific efforts, both behavioural and psychological, that people employ to master, tolerate, reduce, or minimize stressful events. Two general coping strategies have been distinguished: problem-solving strategies, which are efforts to alleviate stressful circumstances, and emotion-focused coping strategies, which involve efforts to regulate the emotional consequences of stressful or potentially stressful events. In this context, problem-solving coping strategies are the most relevant; they can include agricultural strategies such as changing crops, obtaining cash such as by selling off assets, or change of residence.
Extreme weather events Unusual weather events for the season with severe impacts
15 km corridor of LMB A corridor or buffer zone drawn along the mainstream of the Lower Mekong River and the maximum extent of flooded areas. The corridor covers 15 km from either side of the mainstream and 15 km for buffer zones of wetland and flooded areas such as Songkram, Tonle Sap, and the Mekong Delta.
Fishing effort Computed based on the average catch divided by average hours of fishing per day in the year.
HH head According to the HH member interviewed, the head of the HH is commonly an adult – female or male – who is responsible for the HH.
Income from non-aquatic sources
This includes the sale of other crops, livestock, business (profit), full-time employment, irregular/seasonal employment, pensions, credit/loans, savings (in bank or not), remittances (money sent by HH members) and interest.
Livestock This includes cattle, buffalos, pigs, goats, horses, donkeys, but not poultry.
Main occupation What people spend most of their time doing, or what provides the most income.
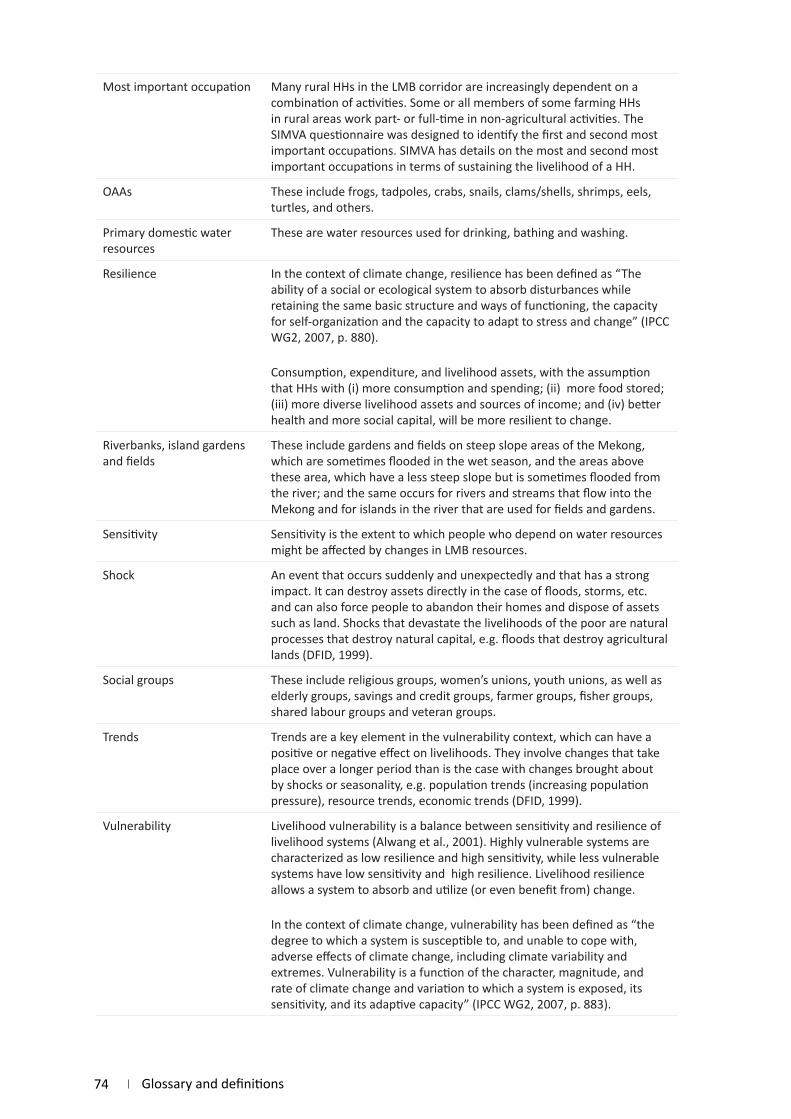
Glossary and definitions74
Most important occupation Many rural HHs in the LMB corridor are increasingly dependent on a combination of activities. Some or all members of some farming HHs in rural areas work part- or full-time in non-agricultural activities. The SIMVA questionnaire was designed to identify the first and second most important occupations. SIMVA has details on the most and second most important occupations in terms of sustaining the livelihood of a HH.
OAAs These include frogs, tadpoles, crabs, snails, clams/shells, shrimps, eels, turtles, and others.
Primary domestic water resources
These are water resources used for drinking, bathing and washing.
Resilience In the context of climate change, resilience has been defined as “The ability of a social or ecological system to absorb disturbances while retaining the same basic structure and ways of functioning, the capacity for self-organization and the capacity to adapt to stress and change” (IPCC WG2, 2007, p. 880).
Consumption, expenditure, and livelihood assets, with the assumption that HHs with (i) more consumption and spending; (ii) more food stored; (iii) more diverse livelihood assets and sources of income; and (iv) better health and more social capital, will be more resilient to change.
Riverbanks, island gardens and fields
These include gardens and fields on steep slope areas of the Mekong, which are sometimes flooded in the wet season, and the areas above these area, which have a less steep slope but is sometimes flooded from the river; and the same occurs for rivers and streams that flow into the Mekong and for islands in the river that are used for fields and gardens.
Sensitivity Sensitivity is the extent to which people who depend on water resources might be affected by changes in LMB resources.
Shock An event that occurs suddenly and unexpectedly and that has a strong impact. It can destroy assets directly in the case of floods, storms, etc. and can also force people to abandon their homes and dispose of assets such as land. Shocks that devastate the livelihoods of the poor are natural processes that destroy natural capital, e.g. floods that destroy agricultural lands (DFID, 1999).
Social groups These include religious groups, women’s unions, youth unions, as well as elderly groups, savings and credit groups, farmer groups, fisher groups, shared labour groups and veteran groups.
Trends Trends are a key element in the vulnerability context, which can have a positive or negative effect on livelihoods. They involve changes that take place over a longer period than is the case with changes brought about by shocks or seasonality, e.g. population trends (increasing population pressure), resource trends, economic trends (DFID, 1999).
Vulnerability Livelihood vulnerability is a balance between sensitivity and resilience of livelihood systems (Alwang et al., 2001). Highly vulnerable systems are characterized as low resilience and high sensitivity, while less vulnerable systems have low sensitivity and high resilience. Livelihood resilience allows a system to absorb and utilize (or even benefit from) change.
In the context of climate change, vulnerability has been defined as “the degree to which a system is susceptible to, and unable to cope with, adverse effects of climate change, including climate variability and extremes. Vulnerability is a function of the character, magnitude, and rate of climate change and variation to which a system is exposed, its sensitivity, and its adaptive capacity” (IPCC WG2, 2007, p. 883).
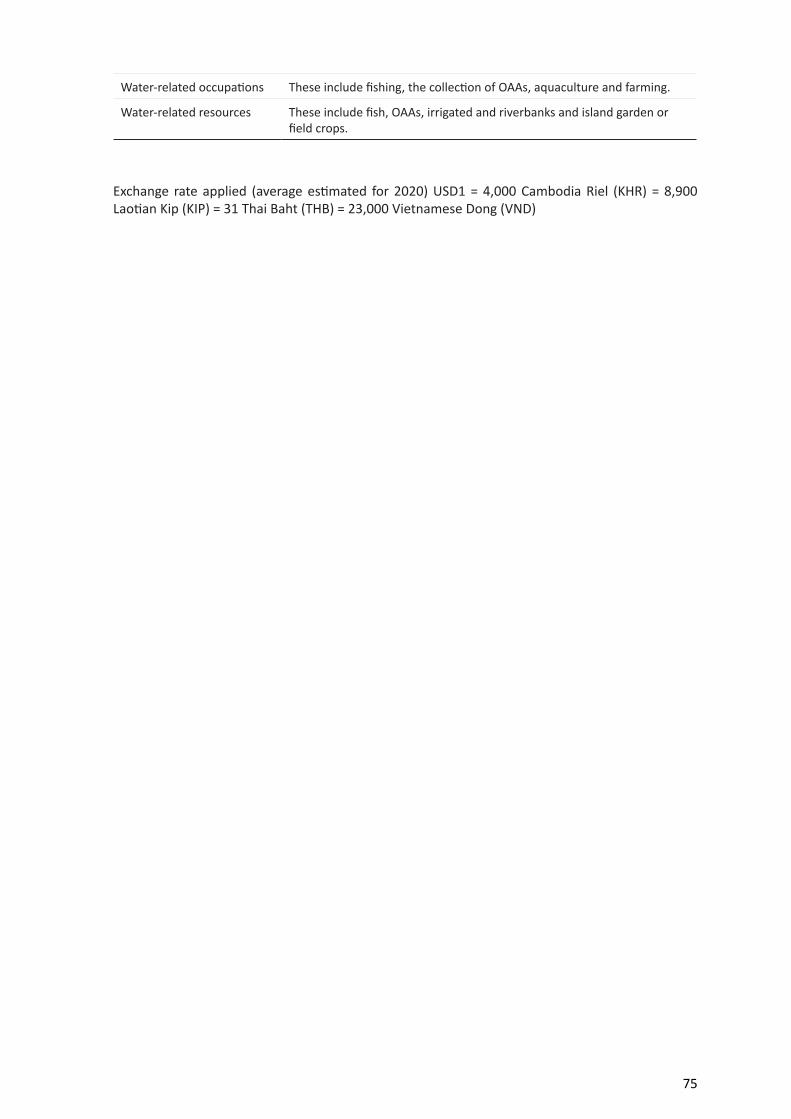
75
Water-related occupations These include fishing, the collection of OAAs, aquaculture and farming.
Water-related resources These include fish, OAAs, irrigated and riverbanks and island garden or field crops.
Exchange rate applied (average estimated for 2020) USD1 = 4,000 Cambodia Riel (KHR) = 8,900 Laotian Kip (KIP) = 31 Thai Baht (THB) = 23,000 Vietnamese Dong (VND)
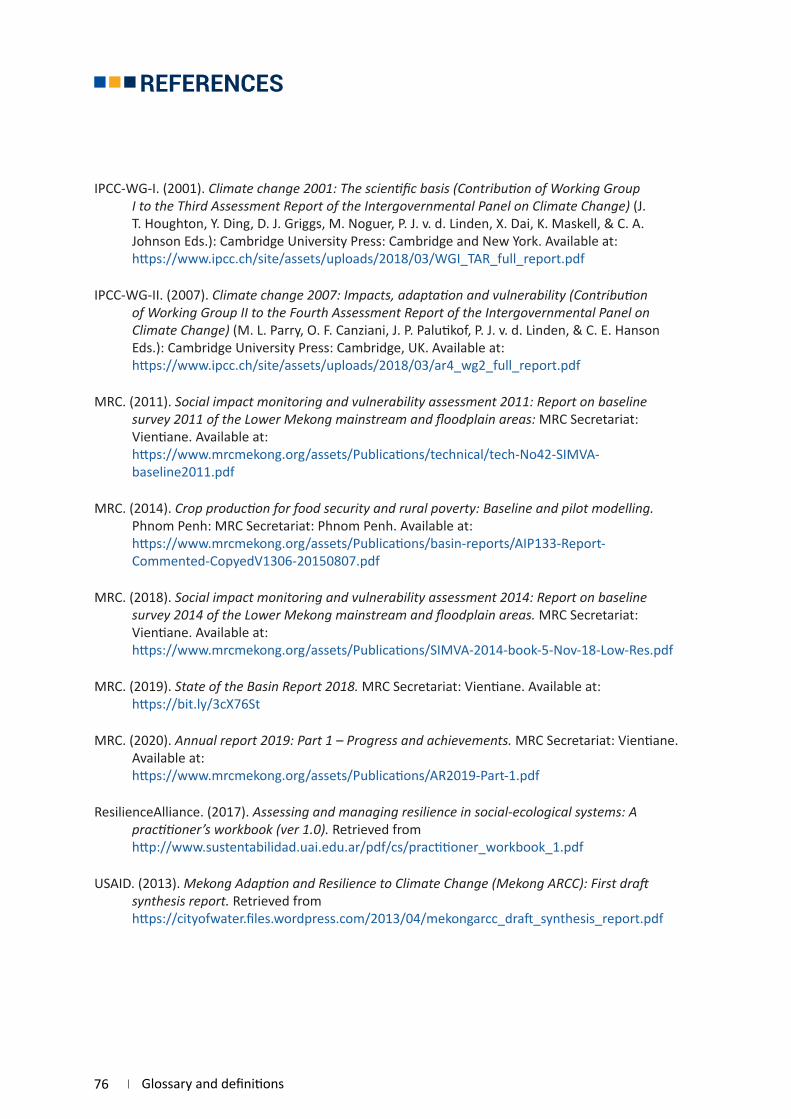
Glossary and definitions76
REFERENCES
IPCC-WG-I. (2001). Climate change 2001: The scientific basis (Contribution of Working Group I to the Third Assessment Report of the Intergovernmental Panel on Climate Change) (J. T. Houghton, Y. Ding, D. J. Griggs, M. Noguer, P. J. v. d. Linden, X. Dai, K. Maskell, & C. A. Johnson Eds.): Cambridge University Press: Cambridge and New York. Available at: https://www.ipcc.ch/site/assets/uploads/2018/03/WGI_TAR_full_report.pdf
IPCC-WG-II. (2007). Climate change 2007: Impacts, adaptation and vulnerability (Contribution of Working Group II to the Fourth Assessment Report of the Intergovernmental Panel on Climate Change) (M. L. Parry, O. F. Canziani, J. P. Palutikof, P. J. v. d. Linden, & C. E. Hanson Eds.): Cambridge University Press: Cambridge, UK. Available at: https://www.ipcc.ch/site/assets/uploads/2018/03/ar4_wg2_full_report.pdf
MRC. (2011). Social impact monitoring and vulnerability assessment 2011: Report on baseline survey 2011 of the Lower Mekong mainstream and floodplain areas: MRC Secretariat: Vientiane. Available at: https://www.mrcmekong.org/assets/Publications/technical/tech-No42-SIMVA-baseline2011.pdf
MRC. (2014). Crop production for food security and rural poverty: Baseline and pilot modelling. Phnom Penh: MRC Secretariat: Phnom Penh. Available at: https://www.mrcmekong.org/assets/Publications/basin-reports/AIP133-Report-Commented-CopyedV1306-20150807.pdf
MRC. (2018). Social impact monitoring and vulnerability assessment 2014: Report on baseline survey 2014 of the Lower Mekong mainstream and floodplain areas. MRC Secretariat: Vientiane. Available at: https://www.mrcmekong.org/assets/Publications/SIMVA-2014-book-5-Nov-18-Low-Res.pdf
MRC. (2019). State of the Basin Report 2018. MRC Secretariat: Vientiane. Available at: https://bit.ly/3cX76St
MRC. (2020). Annual report 2019: Part 1 – Progress and achievements. MRC Secretariat: Vientiane. Available at: https://www.mrcmekong.org/assets/Publications/AR2019-Part-1.pdf
ResilienceAlliance. (2017). Assessing and managing resilience in social-ecological systems: A practitioner’s workbook (ver 1.0). Retrieved from http://www.sustentabilidad.uai.edu.ar/pdf/cs/practitioner_workbook_1.pdf
USAID. (2013). Mekong Adaption and Resilience to Climate Change (Mekong ARCC): First draft synthesis report. Retrieved from https://cityofwater.files.wordpress.com/2013/04/mekongarcc_draft_synthesis_report.pdf
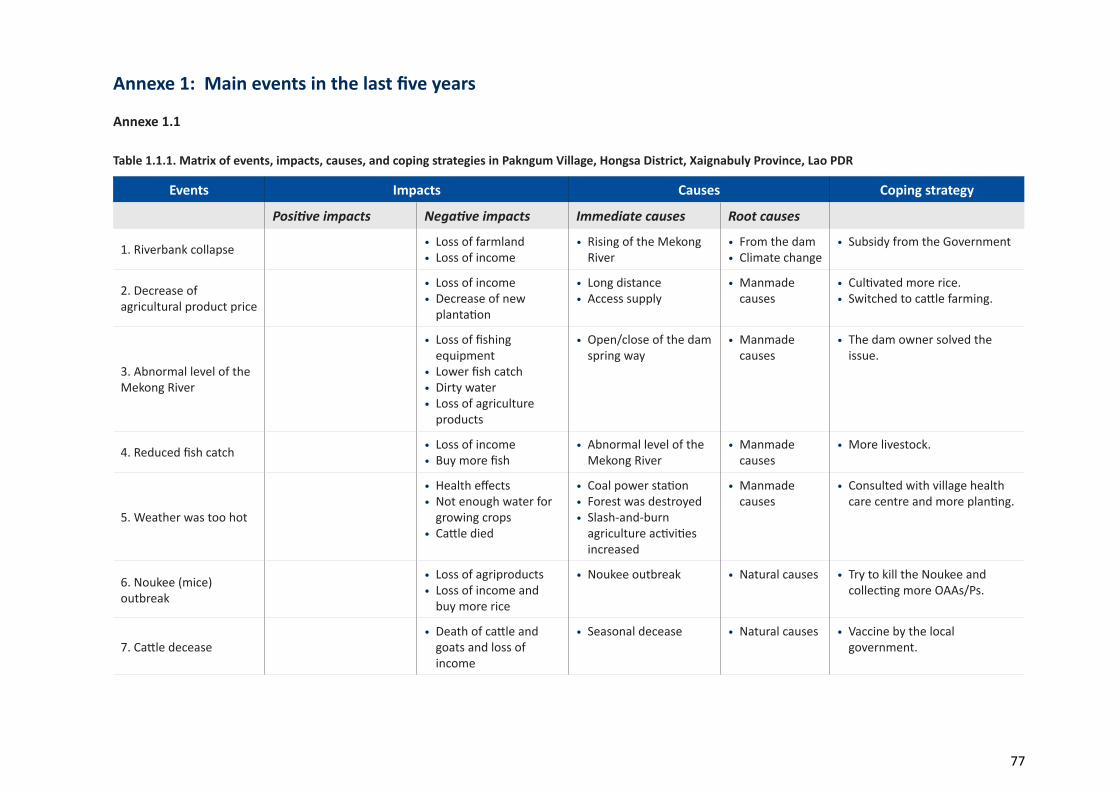
77
Annexe 1: Main events in the last five years
Annexe 1.1
Table 1.1.1. Matrix of events, impacts, causes, and coping strategies in Pakngum Village, Hongsa District, Xaignabuly Province, Lao PDR
Events Impacts Causes Coping strategy
Positive impacts Negative impacts Immediate causes Root causes
1. Riverbank collapse • Loss of farmland• Loss of income
• Rising of the Mekong River
• From the dam• Climate change
• Subsidy from the Government
2. Decrease of agricultural product price
• Loss of income• Decrease of new
plantation
• Long distance• Access supply
• Manmade causes
• Cultivated more rice.• Switched to cattle farming.
3. Abnormal level of the Mekong River
• Loss of fishing equipment
• Lower fish catch • Dirty water• Loss of agriculture
products
• Open/close of the dam spring way
• Manmade causes
• The dam owner solved the issue.
4. Reduced fish catch • Loss of income • Buy more fish
• Abnormal level of the Mekong River
• Manmade causes
• More livestock.
5. Weather was too hot
• Health effects• Not enough water for
growing crops• Cattle died
• Coal power station• Forest was destroyed• Slash-and-burn
agriculture activities increased
• Manmade causes
• Consulted with village health care centre and more planting.
6. Noukee (mice) outbreak
• Loss of agriproducts • Loss of income and
buy more rice
• Noukee outbreak • Natural causes • Try to kill the Noukee and collecting more OAAs/Ps.
7. Cattle decease• Death of cattle and
goats and loss of income
• Seasonal decease • Natural causes • Vaccine by the local government.
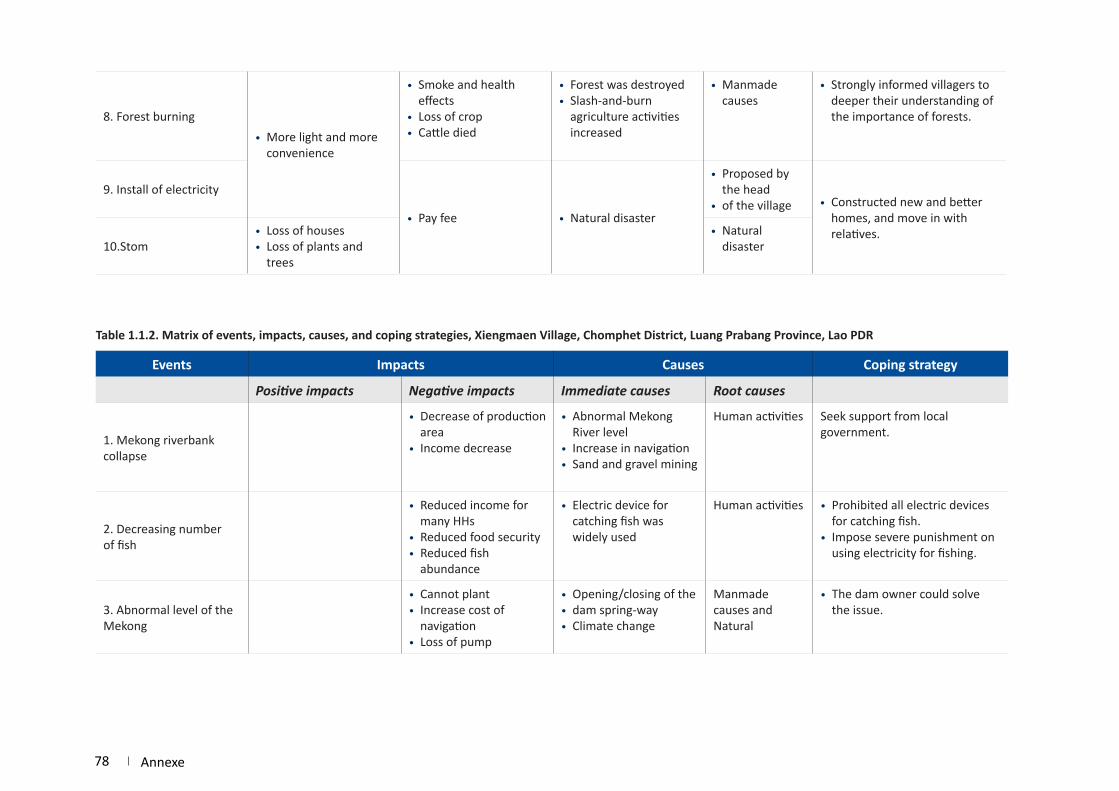
78 Annexe
8. Forest burning• More light and more
convenience
• Smoke and health effects
• Loss of crop• Cattle died
• Forest was destroyed• Slash-and-burn
agriculture activities increased
• Manmade causes
• Strongly informed villagers to deeper their understanding of the importance of forests.
9. Install of electricity
• Pay fee • Natural disaster
• Proposed by the head
• of the village • Constructed new and better homes, and move in with relatives.
10.Stom• Loss of houses • Loss of plants and
trees
• Natural disaster
Table 1.1.2. Matrix of events, impacts, causes, and coping strategies, Xiengmaen Village, Chomphet District, Luang Prabang Province, Lao PDR
Events Impacts Causes Coping strategy
Positive impacts Negative impacts Immediate causes Root causes
1. Mekong riverbank collapse
• Decrease of production area
• Income decrease
• Abnormal Mekong River level
• Increase in navigation• Sand and gravel mining
Human activities Seek support from local government.
2. Decreasing number of fish
• Reduced income for many HHs
• Reduced food security• Reduced fish
abundance
• Electric device for catching fish was widely used
Human activities • Prohibited all electric devices for catching fish.
• Impose severe punishment on using electricity for fishing.
3. Abnormal level of the Mekong
• Cannot plant• Increase cost of
navigation• Loss of pump
• Opening/closing of the • dam spring-way • Climate change
Manmade causes and Natural
• The dam owner could solve the issue.
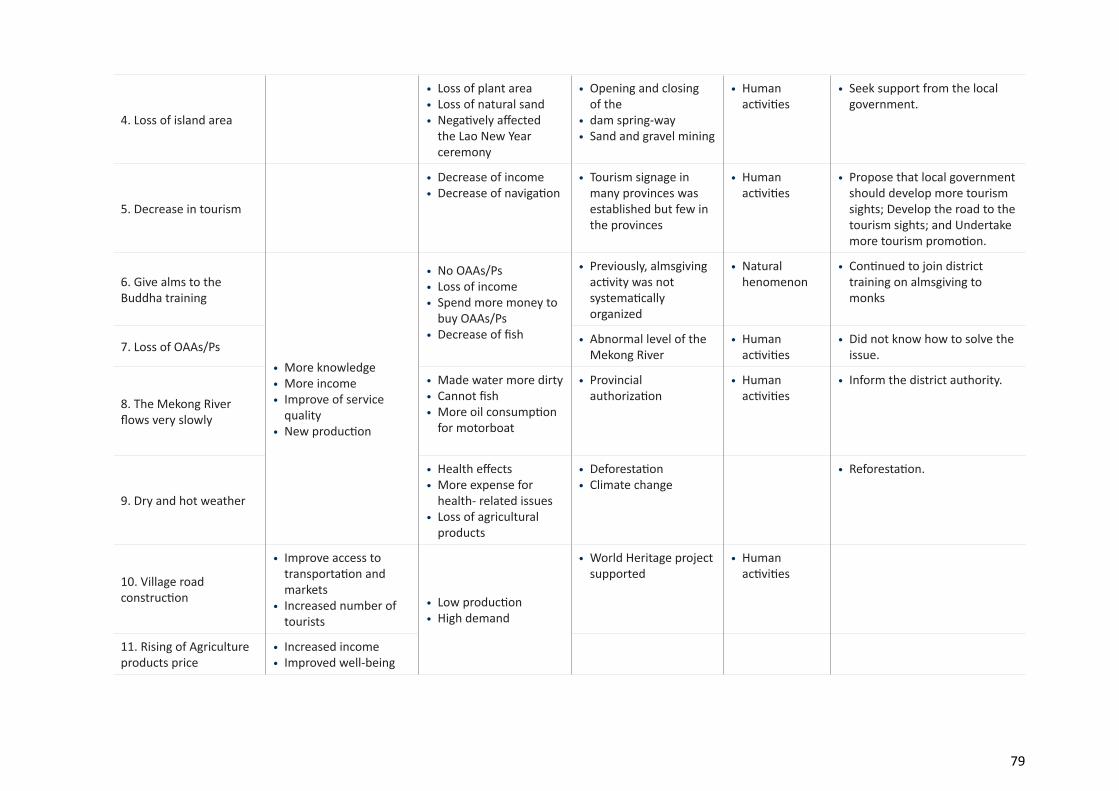
79
4. Loss of island area
• Loss of plant area• Loss of natural sand• Negatively affected
the Lao New Year ceremony
• Opening and closing of the
• dam spring-way • Sand and gravel mining
• Human activities
• Seek support from the local government.
5. Decrease in tourism
• Decrease of income • Decrease of navigation
• Tourism signage in many provinces was established but few in the provinces
• Human activities
• Propose that local government should develop more tourism sights; Develop the road to the tourism sights; and Undertake more tourism promotion.
6. Give alms to the Buddha training
• More knowledge • More income• Improve of service
quality• New production
• No OAAs/Ps• Loss of income• Spend more money to
buy OAAs/Ps• Decrease of fish
• Previously, almsgiving activity was not systematically organized
• Natural henomenon
• Continued to join district training on almsgiving to monks
7. Loss of OAAs/Ps • Abnormal level of the Mekong River
• Human activities
• Did not know how to solve the issue.
8. The Mekong River flows very slowly
• Made water more dirty • Cannot fish• More oil consumption
for motorboat
• Provincial authorization
• Human activities
• Inform the district authority.
9. Dry and hot weather
• Health effects • More expense for
health- related issues • Loss of agricultural
products
• Deforestation • Climate change
• Reforestation.
10. Village road construction
• Improve access to transportation and markets
• Increased number of tourists
• Low production • High demand
• World Heritage project supported
• Human activities
11. Rising of Agriculture products price
• Increased income • Improved well-being
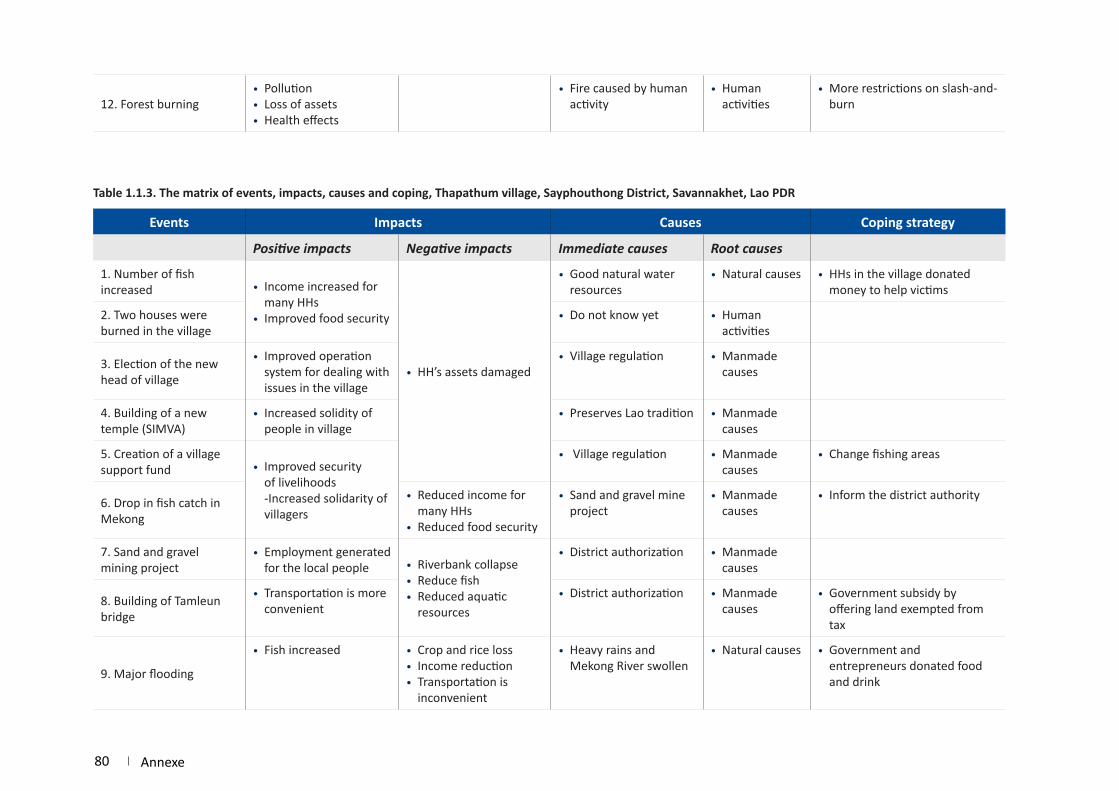
80 Annexe
12. Forest burning• Pollution • Loss of assets • Health effects
• Fire caused by human activity
• Human activities
• More restrictions on slash-and-burn
Table 1.1.3. The matrix of events, impacts, causes and coping, Thapathum village, Sayphouthong District, Savannakhet, Lao PDR
Events Impacts Causes Coping strategy
Positive impacts Negative impacts Immediate causes Root causes
1. Number of fish increased • Income increased for
many HHs• Improved food security
• HH’s assets damaged
• Good natural water resources
• Natural causes • HHs in the village donated money to help victims
2. Two houses were burned in the village
• Do not know yet • Human activities
3. Election of the new head of village
• Improved operation system for dealing with issues in the village
• Village regulation • Manmade causes
4. Building of a new temple (SIMVA)
• Increased solidity of people in village
• Preserves Lao tradition • Manmade causes
5. Creation of a village support fund • Improved security
of livelihoods -Increased solidarity of villagers
• Village regulation • Manmade causes
• Change fishing areas
6. Drop in fish catch in Mekong
• Reduced income for many HHs
• Reduced food security
• Sand and gravel mine project
• Manmade causes
• Inform the district authority
7. Sand and gravel mining project
• Employment generated for the local people • Riverbank collapse
• Reduce fish• Reduced aquatic
resources
• District authorization • Manmade causes
8. Building of Tamleun bridge
• Transportation is more convenient
• District authorization • Manmade causes
• Government subsidy by offering land exempted from tax
9. Major flooding
• Fish increased • Crop and rice loss • Income reduction • Transportation is
inconvenient
• Heavy rains and Mekong River swollen
• Natural causes • Government and entrepreneurs donated food and drink
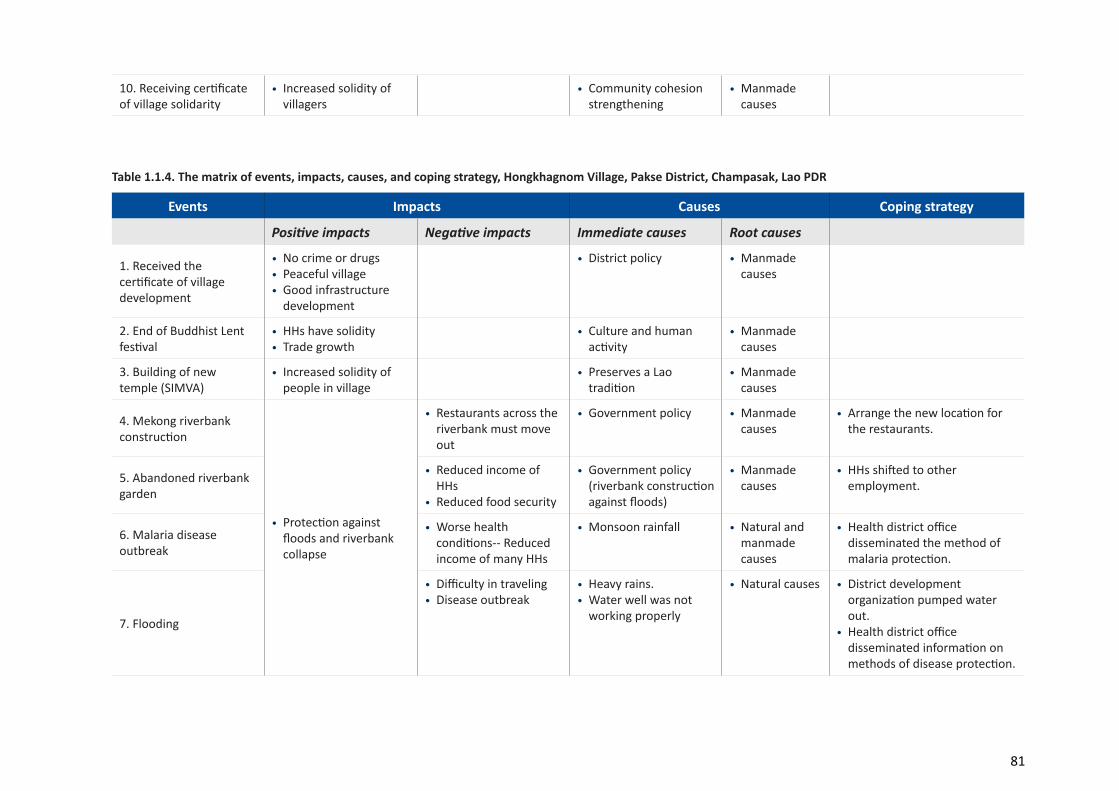
81
10. Receiving certificate of village solidarity
• Increased solidity of villagers
• Community cohesion strengthening
• Manmade causes
Table 1.1.4. The matrix of events, impacts, causes, and coping strategy, Hongkhagnom Village, Pakse District, Champasak, Lao PDR
Events Impacts Causes Coping strategy
Positive impacts Negative impacts Immediate causes Root causes
1. Received the certificate of village development
• No crime or drugs• Peaceful village• Good infrastructure
development
• District policy • Manmade causes
2. End of Buddhist Lent festival
• HHs have solidity• Trade growth
• Culture and human activity
• Manmade causes
3. Building of new temple (SIMVA)
• Increased solidity of people in village
• Preserves a Lao tradition
• Manmade causes
4. Mekong riverbank construction
• Protection against floods and riverbank collapse
• Restaurants across the riverbank must move out
• Government policy • Manmade causes
• Arrange the new location for the restaurants.
5. Abandoned riverbank garden
• Reduced income of HHs
• Reduced food security
• Government policy (riverbank construction against floods)
• Manmade causes
• HHs shifted to other employment.
6. Malaria disease outbreak
• Worse health conditions-- Reduced income of many HHs
• Monsoon rainfall • Natural and manmade causes
• Health district office disseminated the method of malaria protection.
7. Flooding
• Difficulty in traveling• Disease outbreak
• Heavy rains.• Water well was not
working properly
• Natural causes • District development organization pumped water out.
• Health district office disseminated information on methods of disease protection.
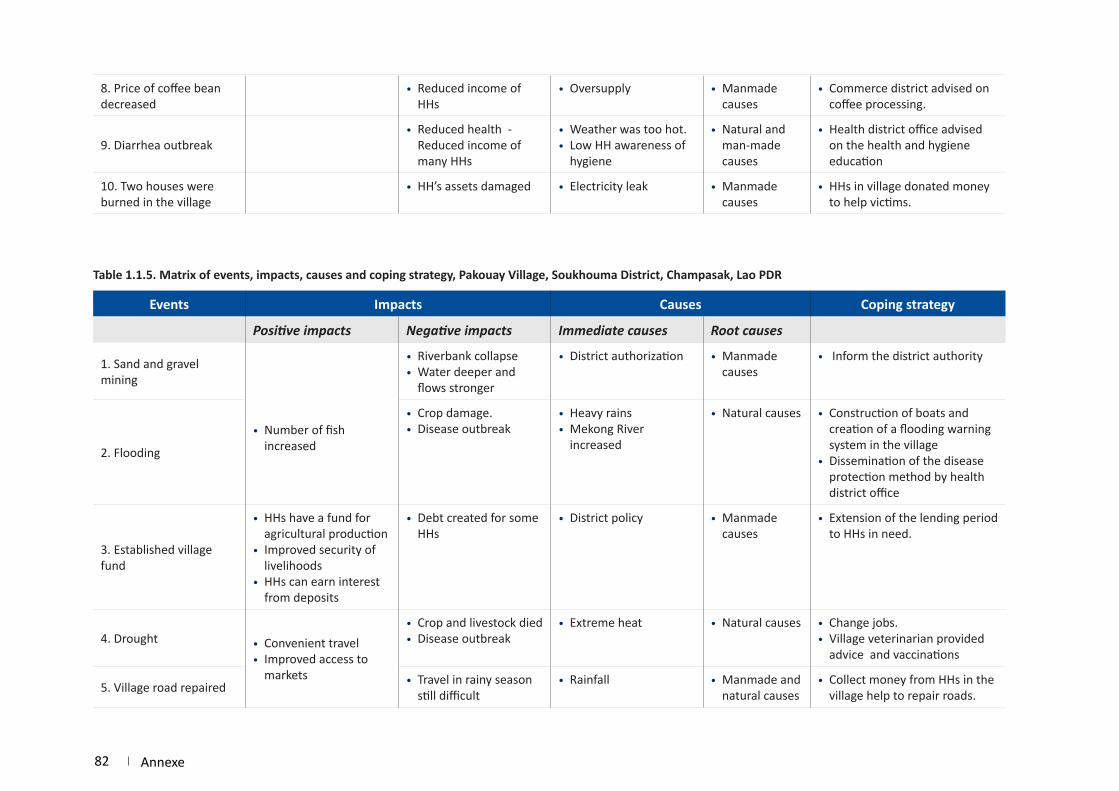
82 Annexe
8. Price of coffee bean decreased
• Reduced income of HHs
• Oversupply • Manmade causes
• Commerce district advised on coffee processing.
9. Diarrhea outbreak• Reduced health -
Reduced income of many HHs
• Weather was too hot.• Low HH awareness of
hygiene
• Natural and man-made causes
• Health district office advised on the health and hygiene education
10. Two houses were burned in the village
• HH’s assets damaged • Electricity leak • Manmade causes
• HHs in village donated money to help victims.
Table 1.1.5. Matrix of events, impacts, causes and coping strategy, Pakouay Village, Soukhouma District, Champasak, Lao PDR
Events Impacts Causes Coping strategy
Positive impacts Negative impacts Immediate causes Root causes
1. Sand and gravel mining
• Number of fish increased
• Riverbank collapse• Water deeper and
flows stronger
• District authorization • Manmade causes
• Inform the district authority
2. Flooding
• Crop damage. • Disease outbreak
• Heavy rains• Mekong River
increased
• Natural causes • Construction of boats and creation of a flooding warning system in the village
• Dissemination of the disease protection method by health district office
3. Established village fund
• HHs have a fund for agricultural production
• Improved security of livelihoods
• HHs can earn interest from deposits
• Debt created for some HHs
• District policy • Manmade causes
• Extension of the lending period to HHs in need.
4. Drought • Convenient travel• Improved access to
markets
• Crop and livestock died • Disease outbreak
• Extreme heat • Natural causes • Change jobs. • Village veterinarian provided
advice and vaccinations
5. Village road repaired • Travel in rainy season still difficult
• Rainfall • Manmade and natural causes
• Collect money from HHs in the village help to repair roads.
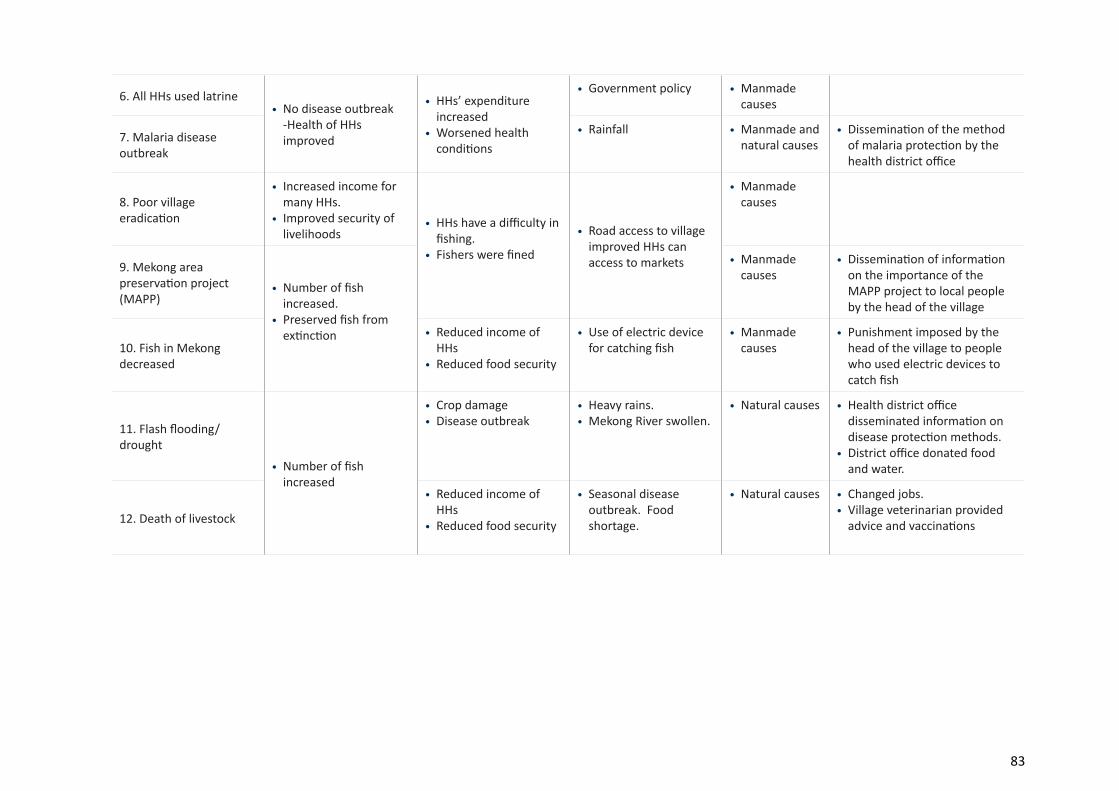
83
6. All HHs used latrine• No disease outbreak
-Health of HHs improved
• HHs’ expenditure increased
• Worsened health conditions
• Government policy • Manmade causes
7. Malaria disease outbreak
• Rainfall • Manmade and natural causes
• Dissemination of the method of malaria protection by the health district office
8. Poor village eradication
• Increased income for many HHs.
• Improved security of livelihoods
• HHs have a difficulty in fishing.
• Fishers were fined
• Road access to village improved HHs can access to markets
• Manmade causes
9. Mekong area preservation project (MAPP)
• Number of fish increased.
• Preserved fish from extinction
• Manmade causes
• Dissemination of information on the importance of the MAPP project to local people by the head of the village
10. Fish in Mekong decreased
• Reduced income of HHs
• Reduced food security
• Use of electric device for catching fish
• Manmade causes
• Punishment imposed by the head of the village to people who used electric devices to catch fish
11. Flash flooding/drought
• Number of fish increased
• Crop damage• Disease outbreak
• Heavy rains.• Mekong River swollen.
• Natural causes • Health district office disseminated information on disease protection methods.
• District office donated food and water.
12. Death of livestock
• Reduced income of HHs
• Reduced food security
• Seasonal disease outbreak. Food shortage.
• Natural causes • Changed jobs. • Village veterinarian provided
advice and vaccinations
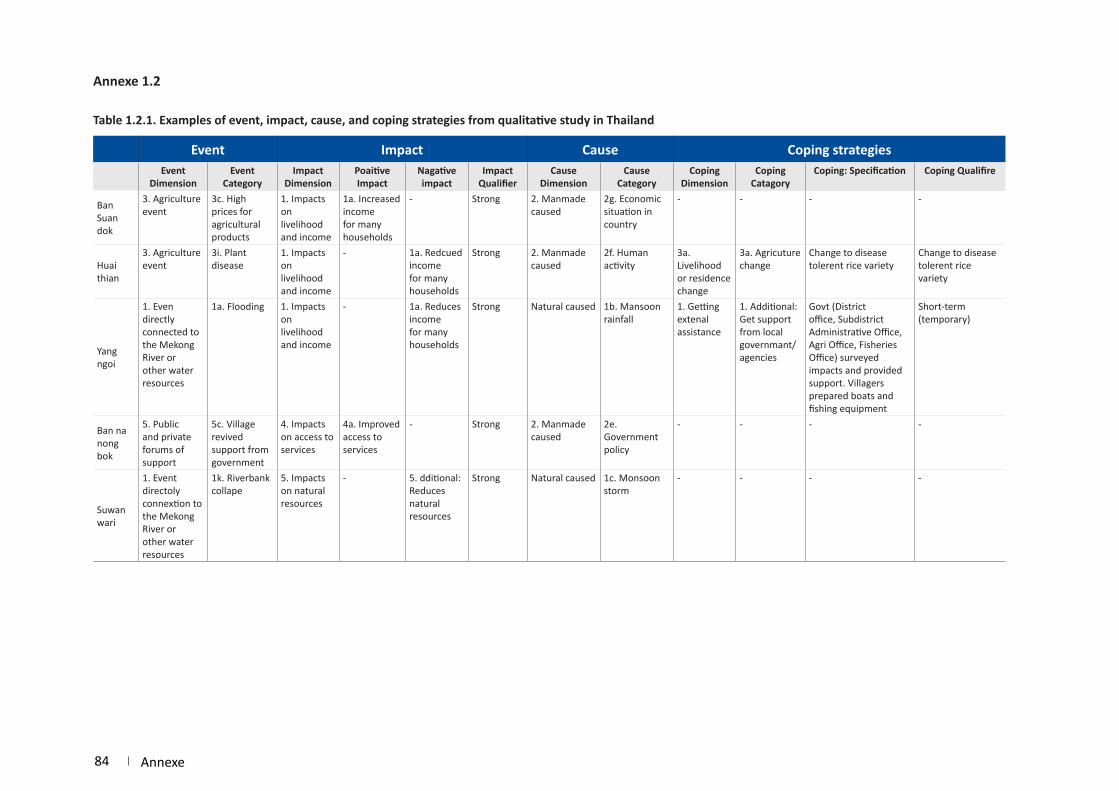
84 Annexe
Annexe 1.2
Table 1.2.1. Examples of event, impact, cause, and coping strategies from qualitative study in Thailand
Event Impact Cause Coping strategiesEvent
DimensionEvent
CategoryImpact
DimensionPoaitive Impact
Nagative impact
Impact Qualifier
Cause Dimension
Cause Category
Coping Dimension
Coping Catagory
Coping: Specification Coping Qualifire
Ban Suan dok
3. Agriculture event
3c. High prices for agricultural products
1. Impacts on livelihood and income
1a. Increased income for many households
- Strong 2. Manmade caused
2g. Economic situation in country
- - - -
Huai thian
3. Agriculture event
3i. Plant disease
1. Impacts on livelihood and income
- 1a. Redcued income for many households
Strong 2. Manmade caused
2f. Human activity
3a. Livelihood or residence change
3a. Agricuture change
Change to disease tolerent rice variety
Change to disease tolerent rice variety
Yang ngoi
1. Even directly connected to the Mekong River or other water resources
1a. Flooding 1. Impacts on livelihood and income
- 1a. Reduces income for many households
Strong Natural caused 1b. Mansoon rainfall
1. Getting extenal assistance
1. Additional: Get support from local governmant/agencies
Govt (District office, Subdistrict Administrative Office, Agri Office, Fisheries Office) surveyed impacts and provided support. Villagers prepared boats and fishing equipment
Short-term (temporary)
Ban na nong bok
5. Public and private forums of support
5c. Village revived support from government
4. Impacts on access to services
4a. Improved access to services
- Strong 2. Manmade caused
2e. Government policy
- - - -
Suwan wari
1. Event directoly connextion to the Mekong River or other water resources
1k. Riverbank collape
5. Impacts on natural resources
- 5. dditional: Reduces natural resources
Strong Natural caused 1c. Monsoon storm
- - - -
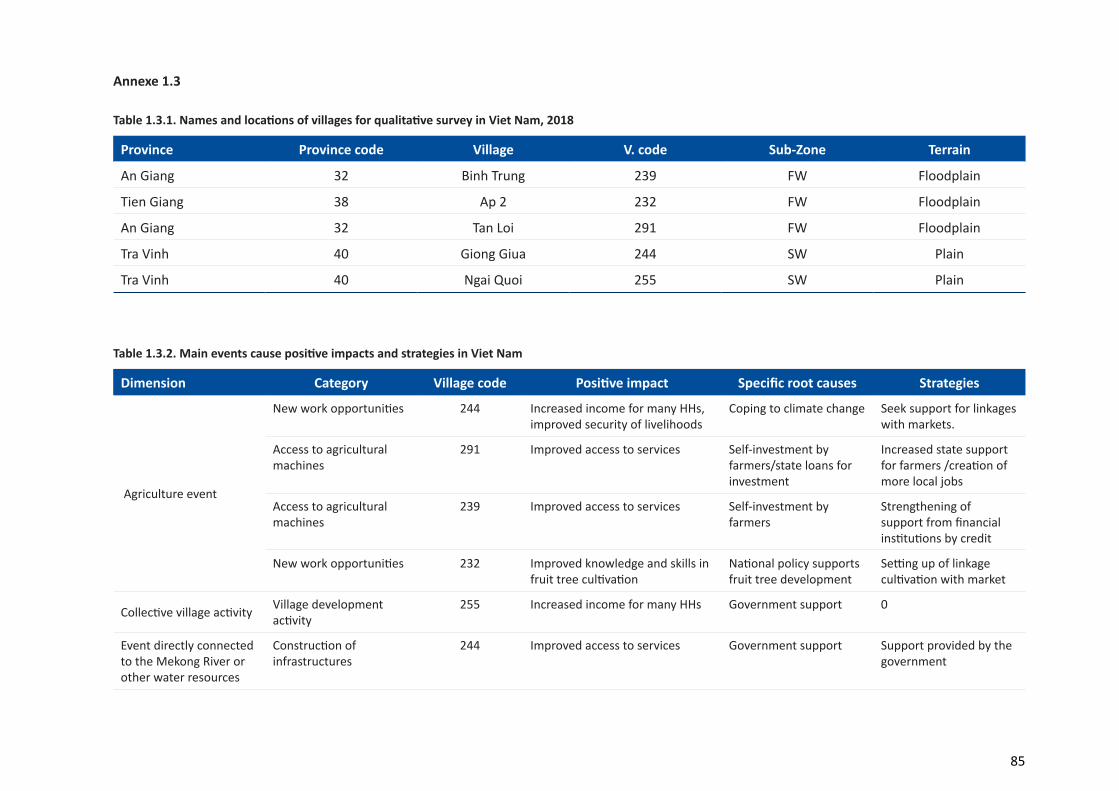
85
Annexe 1.3
Table 1.3.1. Names and locations of villages for qualitative survey in Viet Nam, 2018
Province Province code Village V. code Sub-Zone Terrain
An Giang 32 Binh Trung 239 FW Floodplain
Tien Giang 38 Ap 2 232 FW Floodplain
An Giang 32 Tan Loi 291 FW Floodplain
Tra Vinh 40 Giong Giua 244 SW Plain
Tra Vinh 40 Ngai Quoi 255 SW Plain
Table 1.3.2. Main events cause positive impacts and strategies in Viet Nam
Dimension Category Village code Positive impact Specific root causes Strategies
Agriculture event
New work opportunities 244 Increased income for many HHs, improved security of livelihoods
Coping to climate change Seek support for linkages with markets.
Access to agricultural machines
291 Improved access to services Self-investment by farmers/state loans for investment
Increased state support for farmers /creation of more local jobs
Access to agricultural machines
239 Improved access to services Self-investment by farmers
Strengthening of support from financial institutions by credit
New work opportunities 232 Improved knowledge and skills in fruit tree cultivation
National policy supports fruit tree development
Setting up of linkage cultivation with market
Collective village activity Village development activity
255 Increased income for many HHs Government support 0
Event directly connected to the Mekong River or other water resources
Construction of infrastructures
244 Improved access to services Government support Support provided by the government
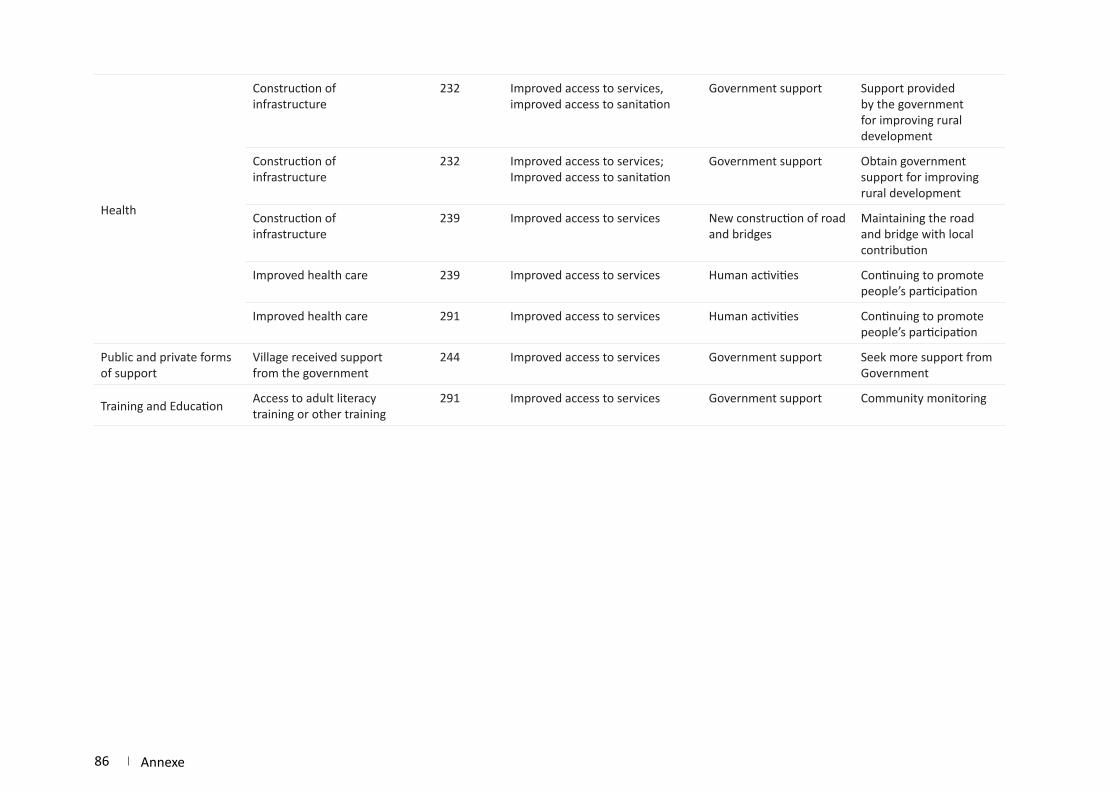
86 Annexe
Health
Construction of infrastructure
232 Improved access to services, improved access to sanitation
Government support Support provided by the government for improving rural development
Construction of infrastructure
232 Improved access to services; Improved access to sanitation
Government support Obtain government support for improving rural development
Construction of infrastructure
239 Improved access to services New construction of road and bridges
Maintaining the road and bridge with local contribution
Improved health care 239 Improved access to services Human activities Continuing to promote people’s participation
Improved health care 291 Improved access to services Human activities Continuing to promote people’s participation
Public and private forms of support
Village received support from the government
244 Improved access to services Government support Seek more support from Government
Training and Education Access to adult literacy training or other training
291 Improved access to services Government support Community monitoring
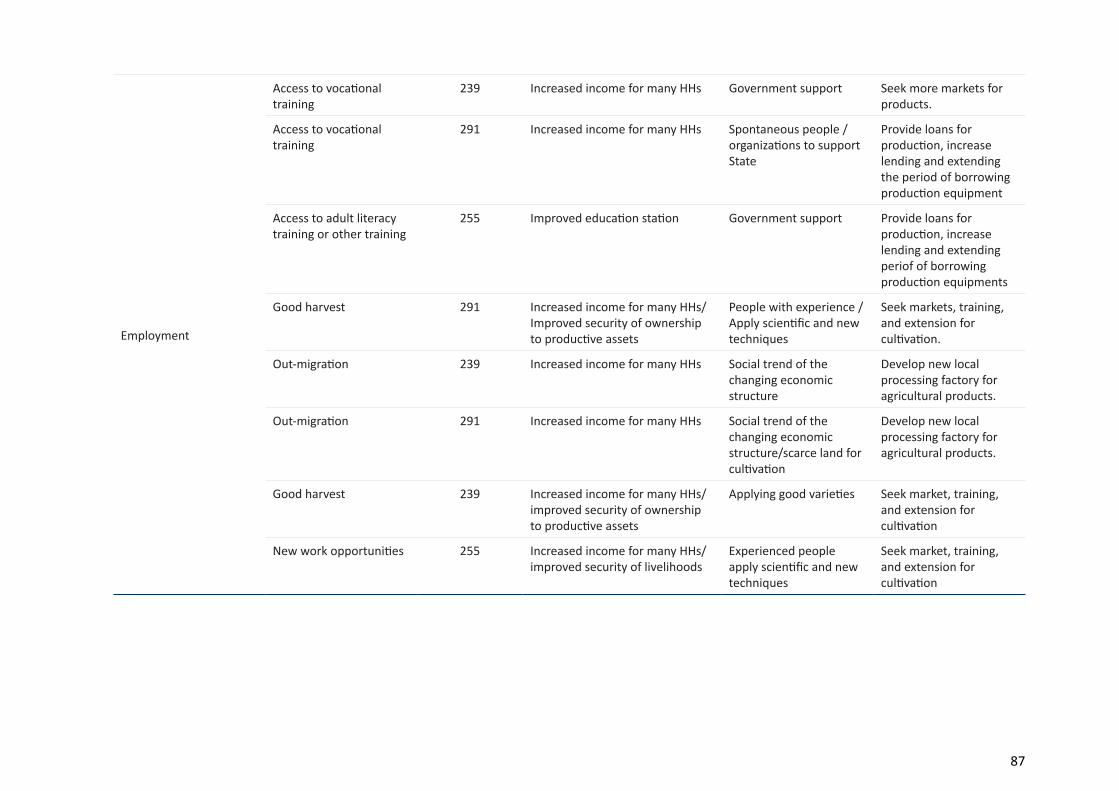
87
Employment
Access to vocational training
239 Increased income for many HHs Government support Seek more markets for products.
Access to vocational training
291 Increased income for many HHs Spontaneous people /organizations to support State
Provide loans for production, increase lending and extending the period of borrowing production equipment
Access to adult literacy training or other training
255 Improved education station Government support Provide loans for production, increase lending and extending periof of borrowing production equipments
Good harvest 291 Increased income for many HHs/Improved security of ownership to productive assets
People with experience /Apply scientific and new techniques
Seek markets, training, and extension for cultivation.
Out-migration 239 Increased income for many HHs Social trend of the changing economic structure
Develop new local processing factory for agricultural products.
Out-migration 291 Increased income for many HHs Social trend of the changing economic structure/scarce land for cultivation
Develop new local processing factory for agricultural products.
Good harvest 239 Increased income for many HHs/improved security of ownership to productive assets
Applying good varieties Seek market, training, and extension for cultivation
New work opportunities 255 Increased income for many HHs/improved security of livelihoods
Experienced people apply scientific and new techniques
Seek market, training, and extension for cultivation
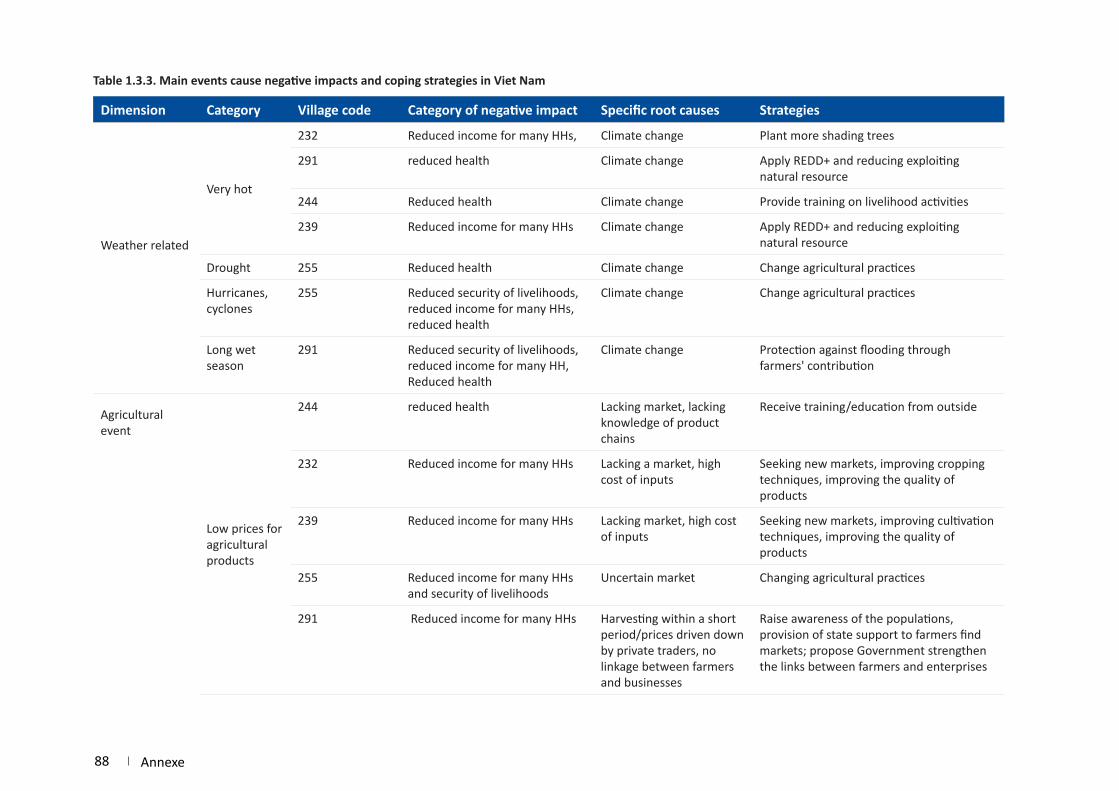
88 Annexe
Table 1.3.3. Main events cause negative impacts and coping strategies in Viet Nam
Dimension Category Village code Category of negative impact Specific root causes Strategies
Weather related
Very hot
232 Reduced income for many HHs, Climate change Plant more shading trees
291 reduced health Climate change Apply REDD+ and reducing exploiting natural resource
244 Reduced health Climate change Provide training on livelihood activities
239 Reduced income for many HHs Climate change Apply REDD+ and reducing exploiting natural resource
Drought 255 Reduced health Climate change Change agricultural practices
Hurricanes, cyclones
255 Reduced security of livelihoods, reduced income for many HHs, reduced health
Climate change Change agricultural practices
Long wet season
291 Reduced security of livelihoods, reduced income for many HH, Reduced health
Climate change Protection against flooding through farmers' contribution
Agricultural event
Low prices for agricultural products
244 reduced health Lacking market, lacking knowledge of product chains
Receive training/education from outside
232 Reduced income for many HHs Lacking a market, high cost of inputs
Seeking new markets, improving cropping techniques, improving the quality of products
239 Reduced income for many HHs Lacking market, high cost of inputs
Seeking new markets, improving cultivation techniques, improving the quality of products
255 Reduced income for many HHs and security of livelihoods
Uncertain market Changing agricultural practices
291 Reduced income for many HHs Harvesting within a short period/prices driven down by private traders, no linkage between farmers and businesses
Raise awareness of the populations, provision of state support to farmers find markets; propose Government strengthen the links between farmers and enterprises
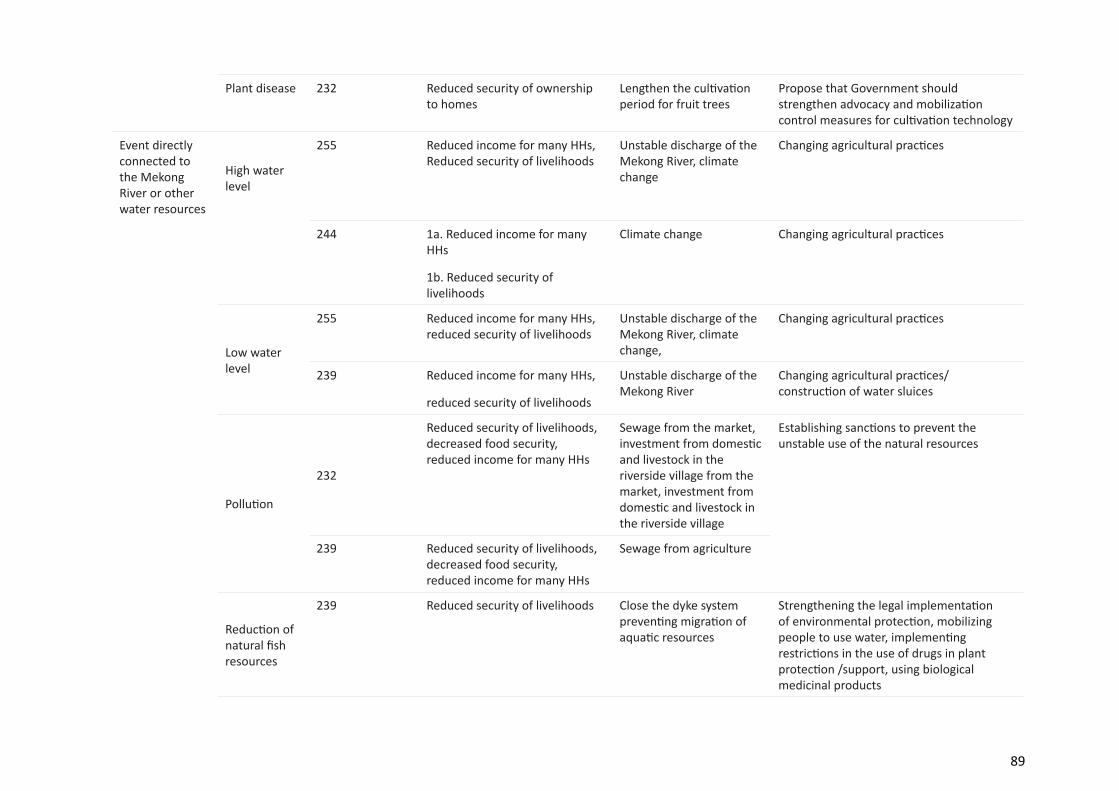
89
Plant disease 232 Reduced security of ownership to homes
Lengthen the cultivation period for fruit trees
Propose that Government should strengthen advocacy and mobilization control measures for cultivation technology
Event directly connected to the Mekong River or other water resources
High water level
255 Reduced income for many HHs, Reduced security of livelihoods
Unstable discharge of the Mekong River, climate change
Changing agricultural practices
244 1a. Reduced income for many HHs
1b. Reduced security of livelihoods
Climate change Changing agricultural practices
Low water level
255 Reduced income for many HHs, reduced security of livelihoods
Unstable discharge of the Mekong River, climate change,
Changing agricultural practices
239 Reduced income for many HHs,
reduced security of livelihoods
Unstable discharge of the Mekong River
Changing agricultural practices/ construction of water sluices
Pollution
232
Reduced security of livelihoods, decreased food security, reduced income for many HHs
Sewage from the market, investment from domestic and livestock in the riverside village from the market, investment from domestic and livestock in the riverside village
Establishing sanctions to prevent the unstable use of the natural resources
239 Reduced security of livelihoods, decreased food security, reduced income for many HHs
Sewage from agriculture
Reduction of natural fish resources
239 Reduced security of livelihoods Close the dyke system preventing migration of aquatic resources
Strengthening the legal implementation of environmental protection, mobilizing people to use water, implementing restrictions in the use of drugs in plant protection /support, using biological medicinal products
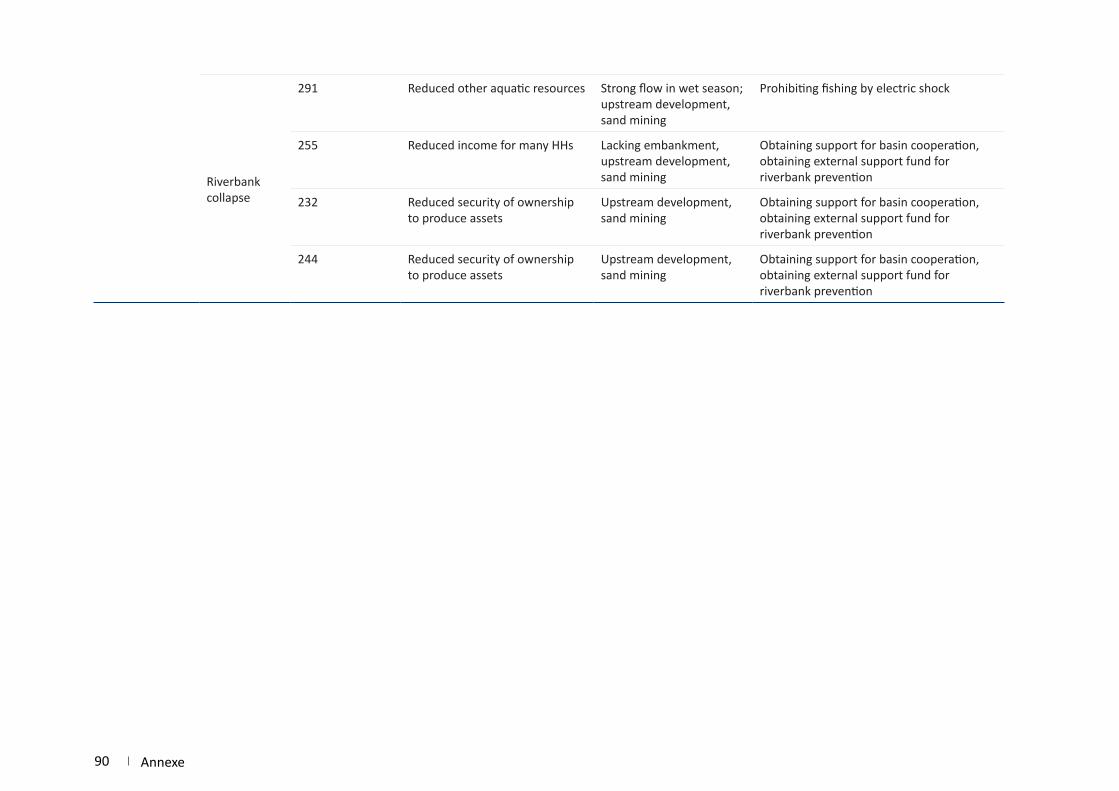
90 Annexe
Riverbank collapse
291 Reduced other aquatic resources Strong flow in wet season; upstream development, sand mining
Prohibiting fishing by electric shock
255 Reduced income for many HHs Lacking embankment, upstream development, sand mining
Obtaining support for basin cooperation, obtaining external support fund for riverbank prevention
232 Reduced security of ownership to produce assets
Upstream development, sand mining
Obtaining support for basin cooperation, obtaining external support fund for riverbank prevention
244 Reduced security of ownership to produce assets
Upstream development, sand mining
Obtaining support for basin cooperation, obtaining external support fund for riverbank prevention
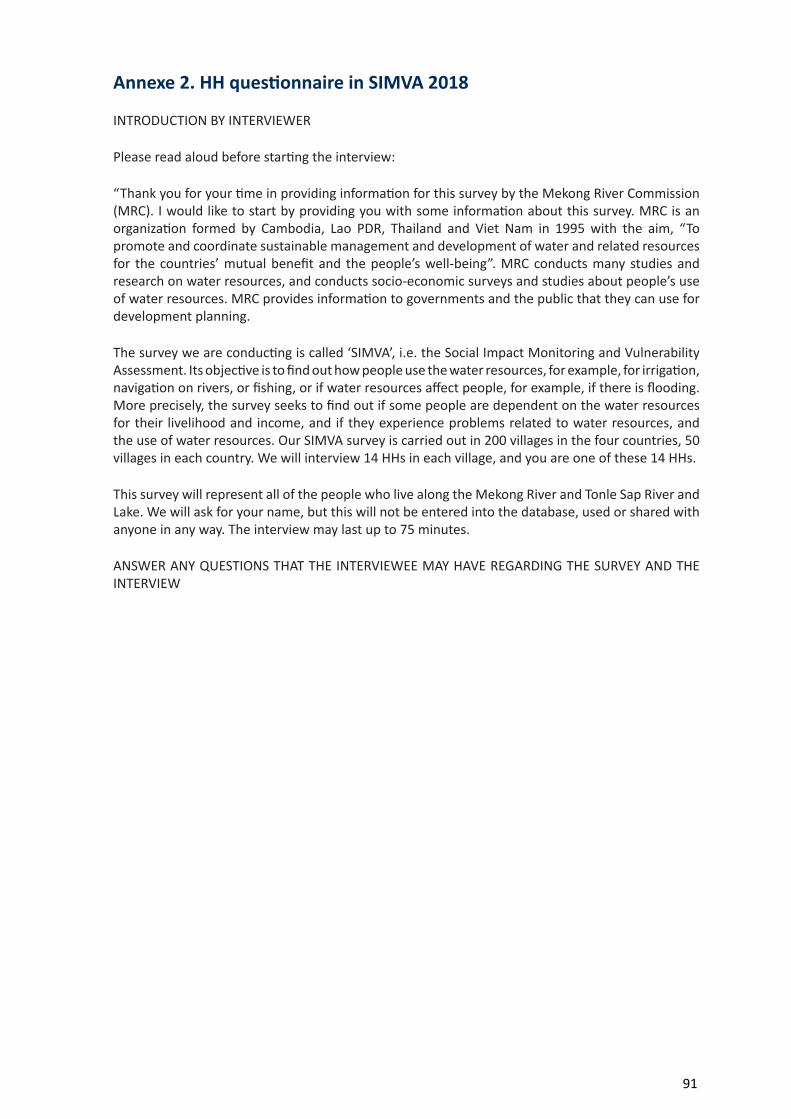
91
Annexe 2. HH questionnaire in SIMVA 2018
INTRODUCTION BY INTERVIEWER
Please read aloud before starting the interview:
“Thank you for your time in providing information for this survey by the Mekong River Commission (MRC). I would like to start by providing you with some information about this survey. MRC is an organization formed by Cambodia, Lao PDR, Thailand and Viet Nam in 1995 with the aim, “To promote and coordinate sustainable management and development of water and related resources for the countries’ mutual benefit and the people’s well-being”. MRC conducts many studies and research on water resources, and conducts socio-economic surveys and studies about people’s use of water resources. MRC provides information to governments and the public that they can use for development planning.
The survey we are conducting is called ‘SIMVA’, i.e. the Social Impact Monitoring and Vulnerability Assessment. Its objective is to find out how people use the water resources, for example, for irrigation, navigation on rivers, or fishing, or if water resources affect people, for example, if there is flooding. More precisely, the survey seeks to find out if some people are dependent on the water resources for their livelihood and income, and if they experience problems related to water resources, and the use of water resources. Our SIMVA survey is carried out in 200 villages in the four countries, 50 villages in each country. We will interview 14 HHs in each village, and you are one of these 14 HHs.
This survey will represent all of the people who live along the Mekong River and Tonle Sap River and Lake. We will ask for your name, but this will not be entered into the database, used or shared with anyone in any way. The interview may last up to 75 minutes.
ANSWER ANY QUESTIONS THAT THE INTERVIEWEE MAY HAVE REGARDING THE SURVEY AND THE INTERVIEW
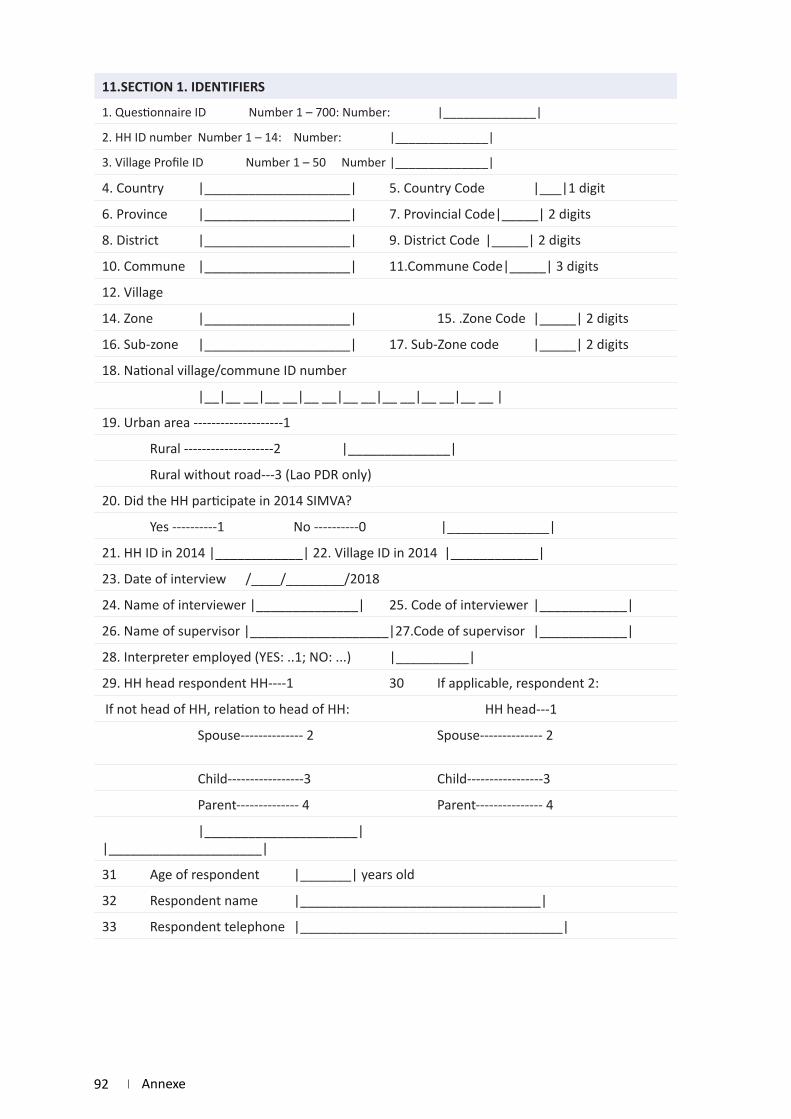
Annexe92
11. SECTION 1. IDENTIFIERS
1. Questionnaire ID Number 1 – 700: Number: |______________|
2. HH ID number Number 1 – 14: Number: |______________|
3. Village Profile ID Number 1 – 50 Number |______________|
4. Country |____________________| 5. Country Code |___|1 digit
6. Province |____________________| 7. Provincial Code|_____| 2 digits
8. District |____________________| 9. District Code |_____| 2 digits
10. Commune |____________________| 11.Commune Code|_____| 3 digits
12. Village
14. Zone |____________________| 15. .Zone Code |_____| 2 digits
16. Sub-zone |____________________| 17. Sub-Zone code |_____| 2 digits
18. National village/commune ID number
|__|__ __|__ __|__ __|__ __|__ __|__ __|__ __ |
19. Urban area --------------------1
Rural --------------------2 |______________|
Rural without road---3 (Lao PDR only)
20. Did the HH participate in 2014 SIMVA?
Yes ----------1 No ----------0 |______________|
21. HH ID in 2014 |____________| 22. Village ID in 2014 |____________|
23. Date of interview /____/________/2018
24. Name of interviewer |______________| 25. Code of interviewer |____________|
26. Name of supervisor |___________________|27.Code of supervisor |____________|
28. Interpreter employed (YES: ..1; NO: ...) |__________|
29. HH head respondent HH----1 30 If applicable, respondent 2:
If not head of HH, relation to head of HH: HH head---1
Spouse-------------- 2 Spouse-------------- 2
Child-----------------3 Child-----------------3
Parent-------------- 4 Parent--------------- 4
|_____________________| |_____________________|
31 Age of respondent |_______| years old
32 Respondent name |_________________________________|
33 Respondent telephone |____________________________________|
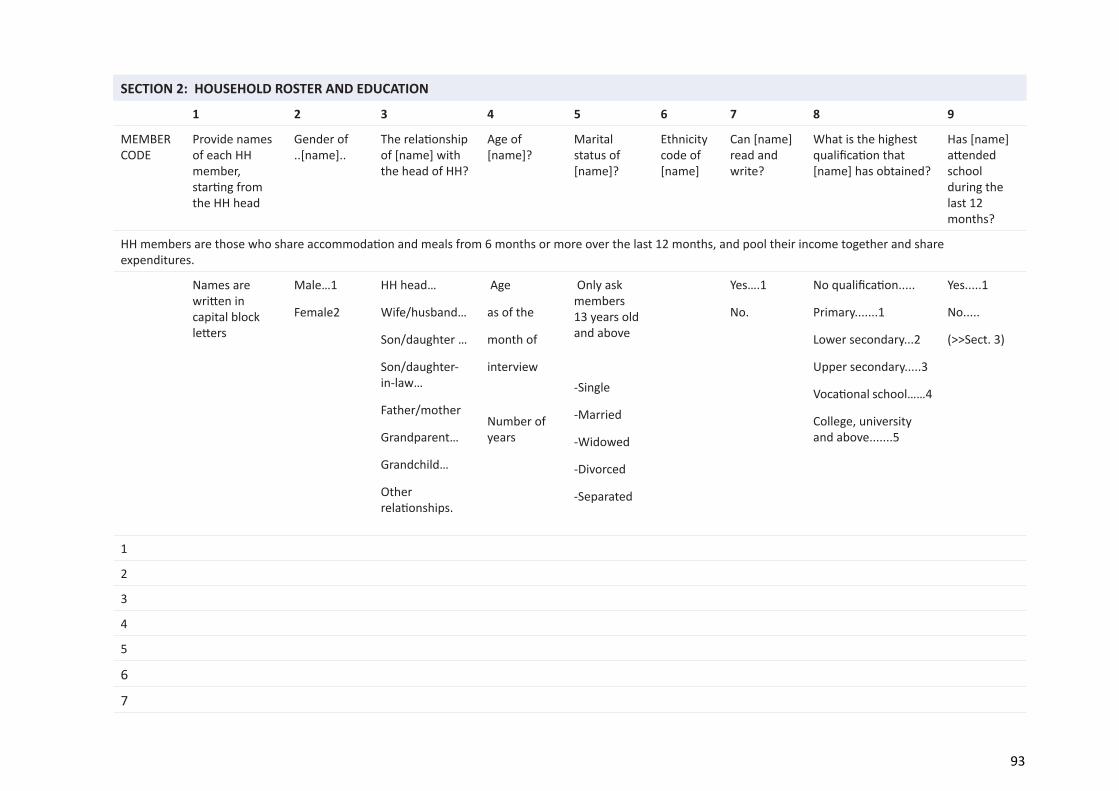
93
SECTION 2: HOUSEHOLD ROSTER AND EDUCATION
1 2 3 4 5 6 7 8 9
MEMBER CODE
Provide names of each HH member, starting from the HH head
Gender of ..[name]..
The relationship of [name] with the head of HH?
Age of [name]?
Marital status of [name]?
Ethnicity code of [name]
Can [name] read and write?
What is the highest qualification that [name] has obtained?
Has [name] attended school during the last 12 months?
HH members are those who share accommodation and meals from 6 months or more over the last 12 months, and pool their income together and share expenditures.
Names are written in capital block letters
Male…1
Female2
HH head…
Wife/husband…
Son/daughter …
Son/daughter-in-law…
Father/mother
Grandparent…
Grandchild…
Other relationships.
Age
as of the
month of
interview
Number of years
Only ask members 13 years old and above
-Single
-Married
-Widowed
-Divorced
-Separated
Yes….1
No.
No qualification.....
Primary.......1
Lower secondary...2
Upper secondary.....3
Vocational school……4
College, university and above.......5
Yes.....1
No.....
(>>Sect. 3)
1
2
3
4
5
6
7
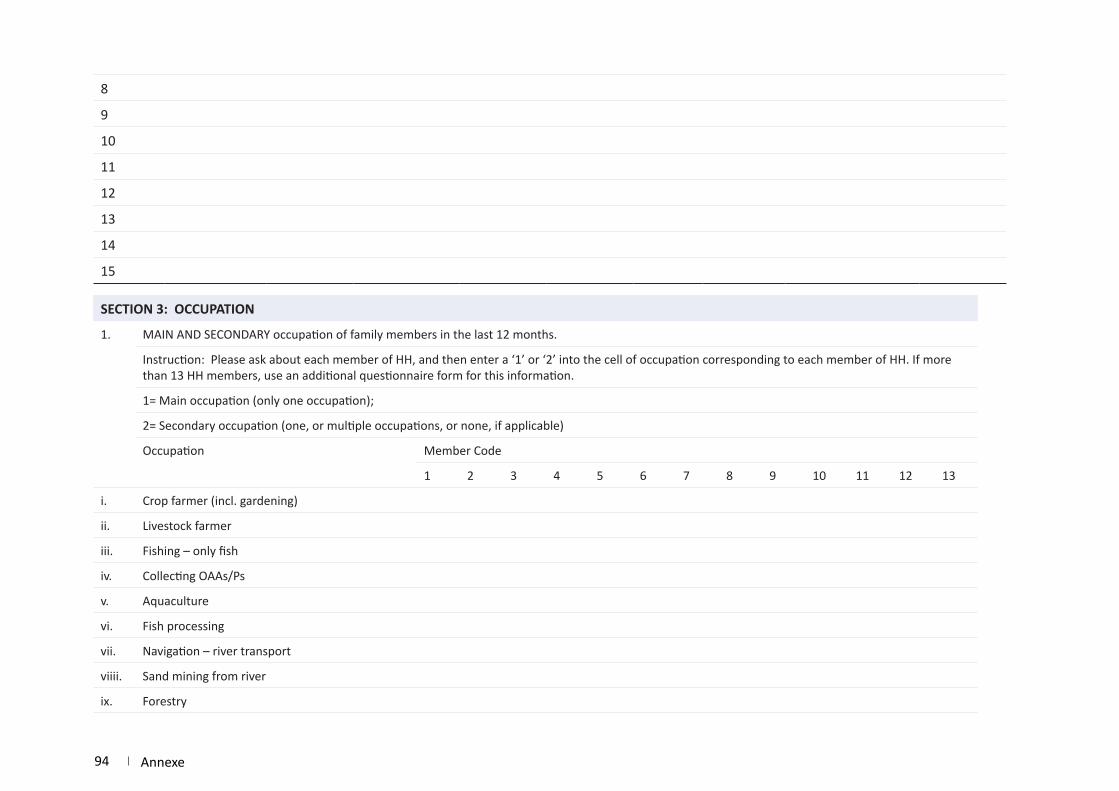
94 Annexe
8
9
10
11
12
13
14
15
SECTION 3: OCCUPATION
1.
MAIN AND SECONDARY occupation of family members in the last 12 months.
Instruction: Please ask about each member of HH, and then enter a ‘1’ or ‘2’ into the cell of occupation corresponding to each member of HH. If more than 13 HH members, use an additional questionnaire form for this information.
1= Main occupation (only one occupation);
2= Secondary occupation (one, or multiple occupations, or none, if applicable)
Occupation Member Code
1 2 3 4 5 6 7 8 9 10 11 12 13
i. Crop farmer (incl. gardening)
ii. Livestock farmer
iii. Fishing – only fish
iv. Collecting OAAs/Ps
v. Aquaculture
vi. Fish processing
vii. Navigation – river transport
viiii. Sand mining from river
ix. Forestry
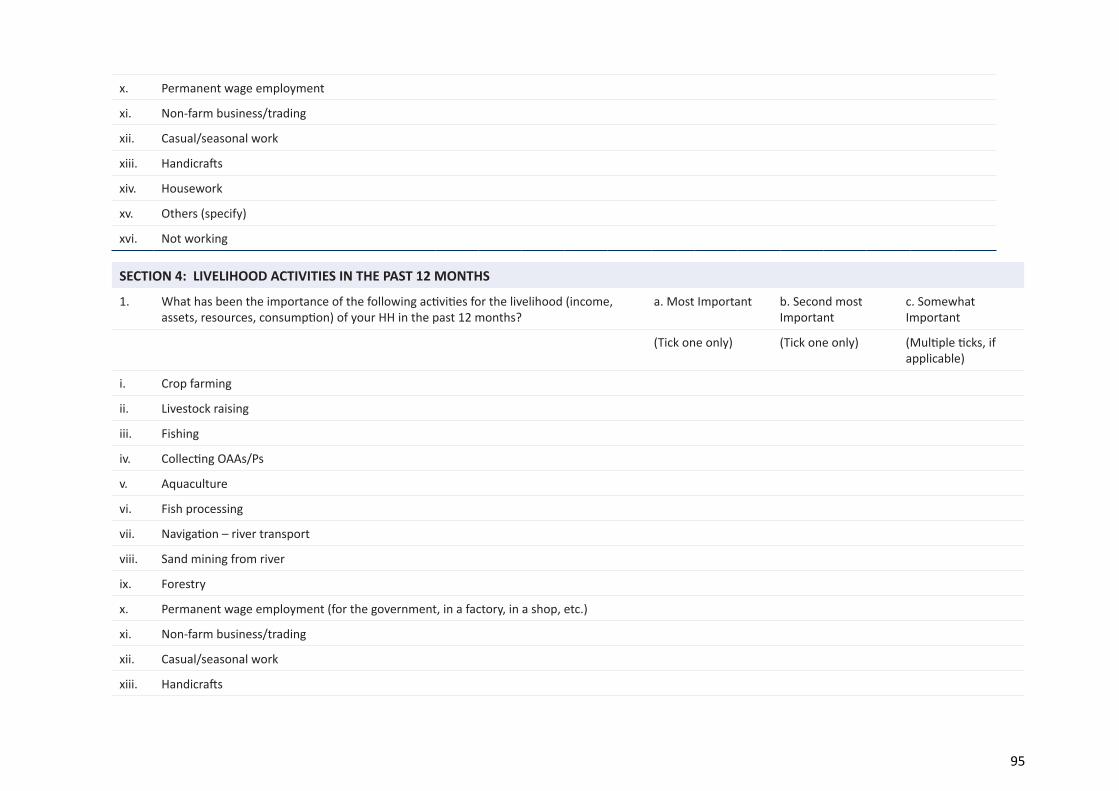
95
x. Permanent wage employment
xi. Non-farm business/trading
xii. Casual/seasonal work
xiii. Handicrafts
xiv. Housework
xv. Others (specify)
xvi. Not working
SECTION 4: LIVELIHOOD ACTIVITIES IN THE PAST 12 MONTHS
1. What has been the importance of the following activities for the livelihood (income, assets, resources, consumption) of your HH in the past 12 months?
a. Most Important b. Second most Important
c. Somewhat Important
(Tick one only) (Tick one only) (Multiple ticks, if applicable)
i. Crop farming
ii. Livestock raising
iii. Fishing
iv. Collecting OAAs/Ps
v. Aquaculture
vi. Fish processing
vii. Navigation – river transport
viii. Sand mining from river
ix. Forestry
x. Permanent wage employment (for the government, in a factory, in a shop, etc.)
xi. Non-farm business/trading
xii. Casual/seasonal work
xiii. Handicrafts
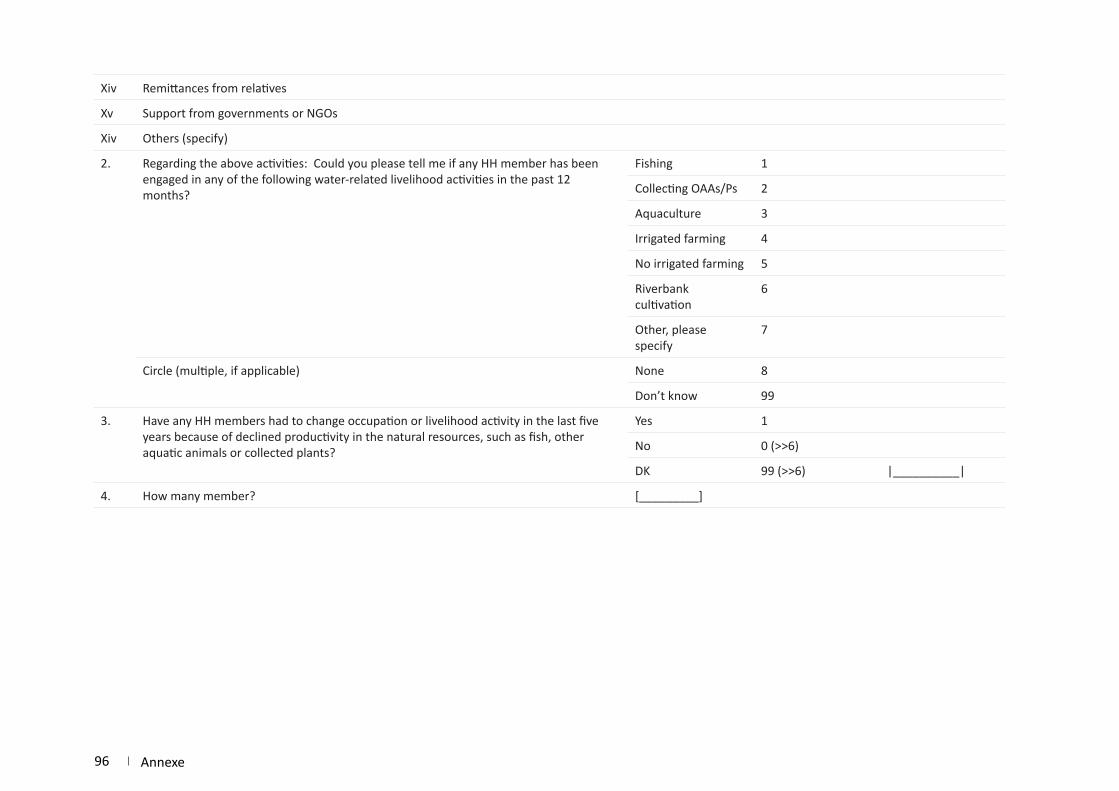
96 Annexe
Xiv Remittances from relatives
Xv Support from governments or NGOs
Xiv Others (specify)
2. Regarding the above activities: Could you please tell me if any HH member has been engaged in any of the following water-related livelihood activities in the past 12 months?
Fishing 1
Collecting OAAs/Ps 2
Aquaculture 3
Irrigated farming 4
No irrigated farming 5
Riverbank cultivation
6
Other, please specify
7
Circle (multiple, if applicable) None 8
Don’t know 99
3. Have any HH members had to change occupation or livelihood activity in the last five years because of declined productivity in the natural resources, such as fish, other aquatic animals or collected plants?
Yes 1
No 0 (>>6)
DK 99 (>>6) |__________|
4. How many member? [_________]
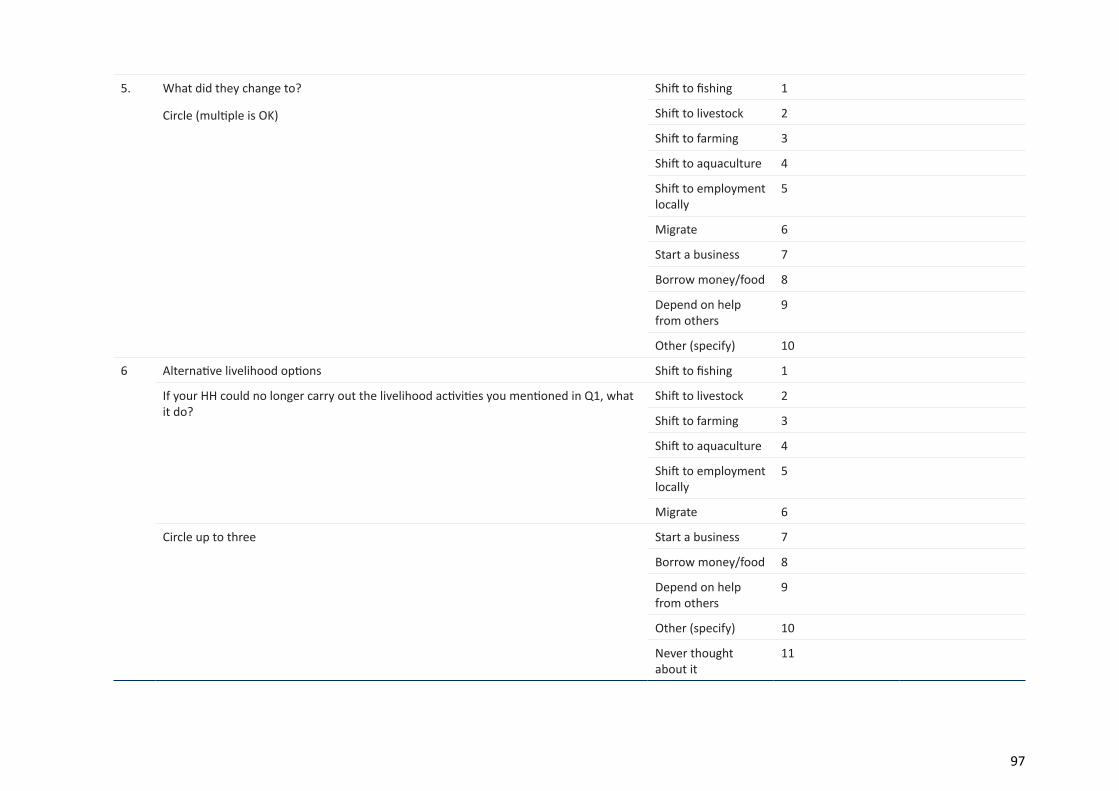
97
5. What did they change to?
Circle (multiple is OK)
Shift to fishing 1
Shift to livestock 2
Shift to farming 3
Shift to aquaculture 4
Shift to employment locally
5
Migrate 6
Start a business 7
Borrow money/food 8
Depend on help from others
9
Other (specify) 10
6 Alternative livelihood options Shift to fishing 1
If your HH could no longer carry out the livelihood activities you mentioned in Q1, what it do?
Shift to livestock 2
Shift to farming 3
Shift to aquaculture 4
Shift to employment locally
5
Migrate 6
Circle up to three
Start a business 7
Borrow money/food 8
Depend on help from others
9
Other (specify) 10
Never thought about it
11
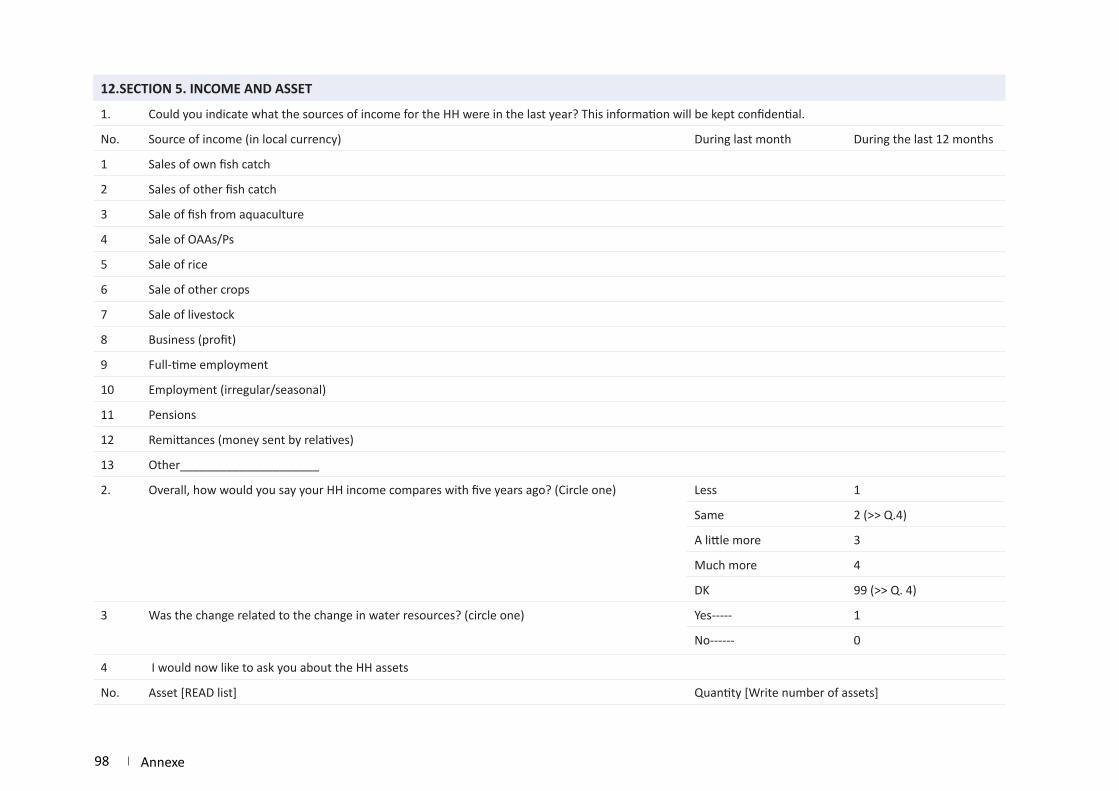
98 Annexe
12. SECTION 5. INCOME AND ASSET
1. Could you indicate what the sources of income for the HH were in the last year? This information will be kept confidential.
No. Source of income (in local currency) During last month During the last 12 months
1 Sales of own fish catch
2 Sales of other fish catch
3 Sale of fish from aquaculture
4 Sale of OAAs/Ps
5 Sale of rice
6 Sale of other crops
7 Sale of livestock
8 Business (profit)
9 Full-time employment
10 Employment (irregular/seasonal)
11 Pensions
12 Remittances (money sent by relatives)
13 Other_____________________
2. Overall, how would you say your HH income compares with five years ago? (Circle one) Less 1
Same 2 (>> Q.4)
A little more 3
Much more 4
DK 99 (>> Q. 4)
3
Was the change related to the change in water resources? (circle one) Yes----- 1
No------ 0
4 I would now like to ask you about the HH assets
No. Asset [READ list] Quantity [Write number of assets]
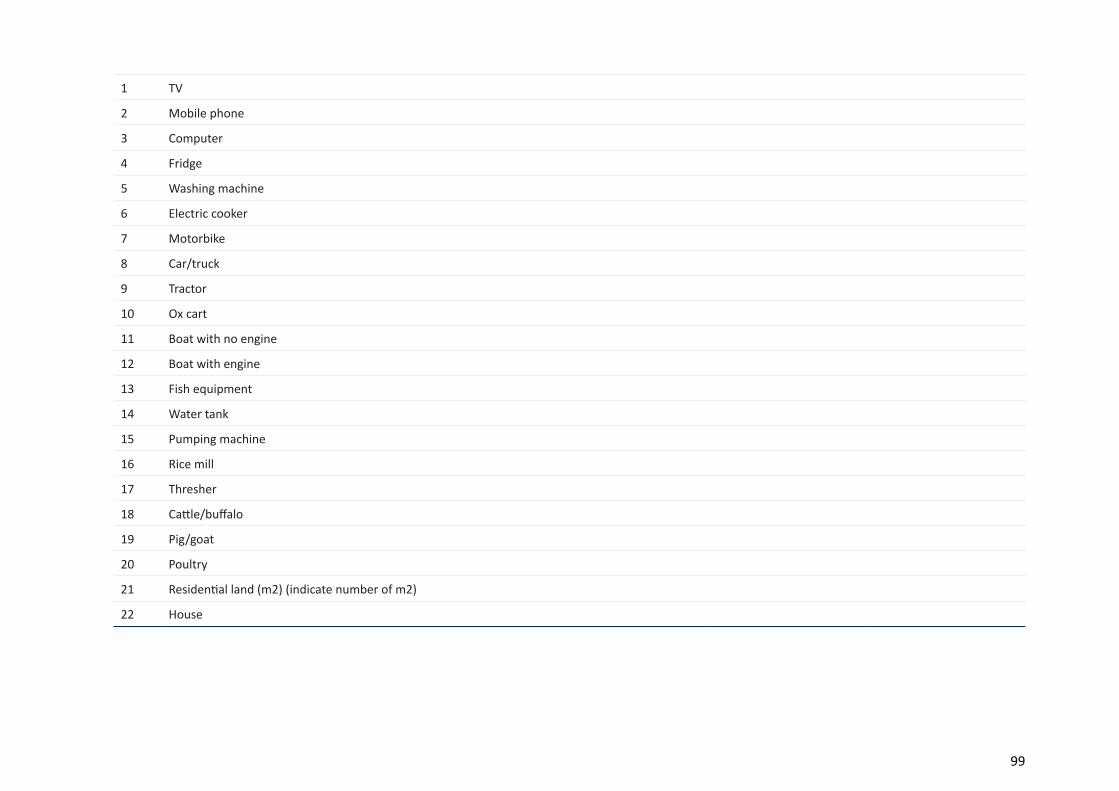
99
1 TV
2 Mobile phone
3 Computer
4 Fridge
5 Washing machine
6 Electric cooker
7 Motorbike
8 Car/truck
9 Tractor
10 Ox cart
11 Boat with no engine
12 Boat with engine
13 Fish equipment
14 Water tank
15 Pumping machine
16 Rice mill
17 Thresher
18 Cattle/buffalo
19 Pig/goat
20 Poultry
21 Residential land (m2) (indicate number of m2)
22 House
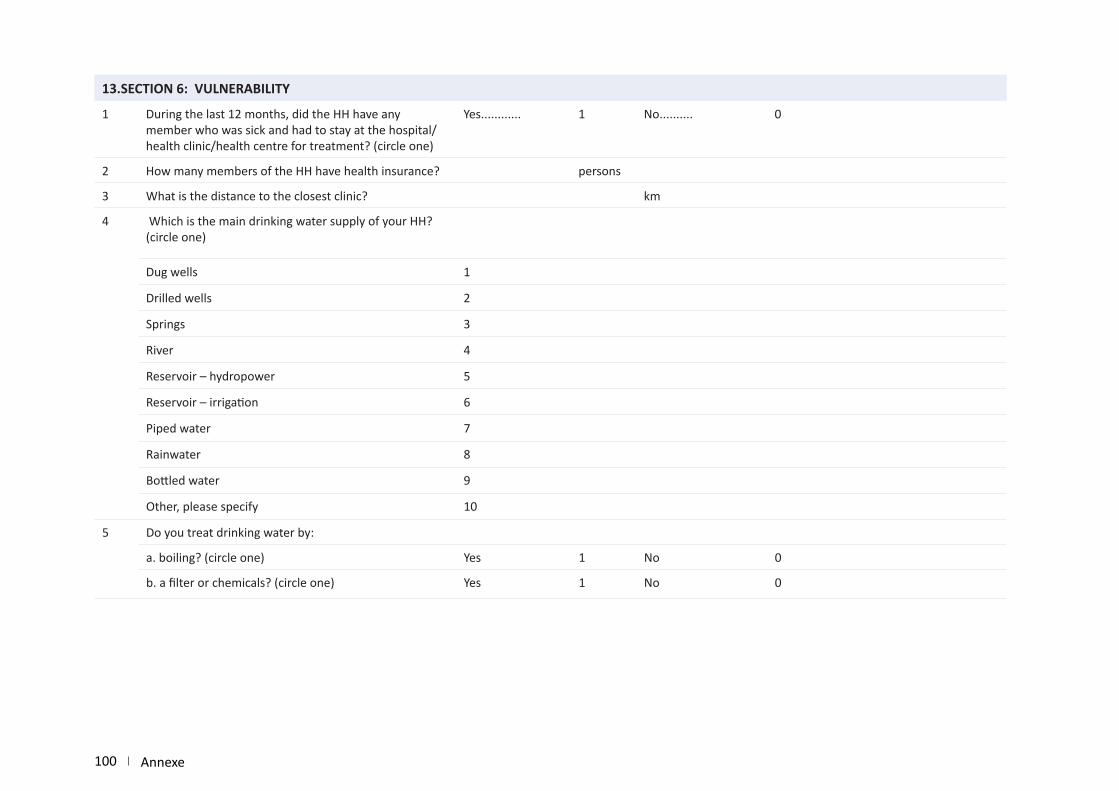
100 Annexe
13. SECTION 6: VULNERABILITY
1 During the last 12 months, did the HH have any member who was sick and had to stay at the hospital/health clinic/health centre for treatment? (circle one)
Yes............ 1 No.......... 0
2 How many members of the HH have health insurance? persons
3 What is the distance to the closest clinic? km
4 Which is the main drinking water supply of your HH? (circle one)
Dug wells 1
Drilled wells 2
Springs 3
River 4
Reservoir – hydropower 5
Reservoir – irrigation 6
Piped water 7
Rainwater 8
Bottled water 9
Other, please specify 10
5
Do you treat drinking water by:
a. boiling? (circle one) Yes 1 No 0
b. a filter or chemicals? (circle one) Yes 1 No 0
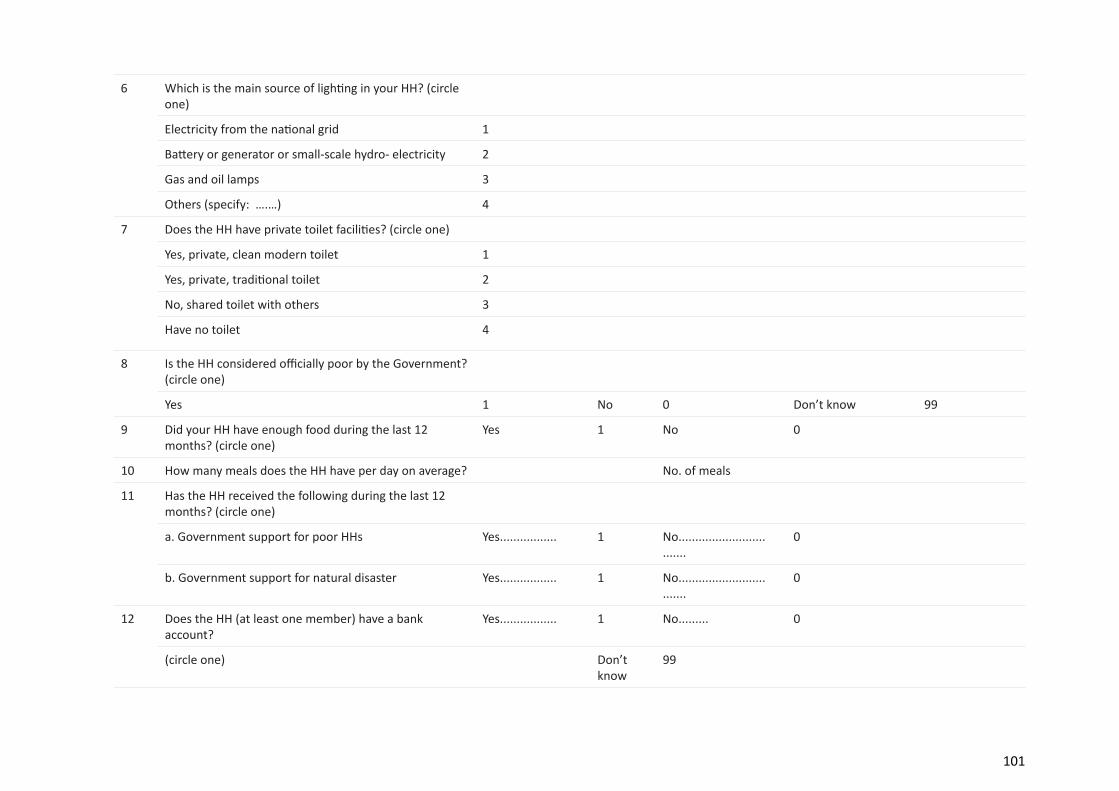
101
6
Which is the main source of lighting in your HH? (circle one)
Electricity from the national grid 1
Battery or generator or small-scale hydro- electricity 2
Gas and oil lamps 3
Others (specify: ….…) 4
7
Does the HH have private toilet facilities? (circle one)
Yes, private, clean modern toilet 1
Yes, private, traditional toilet 2
No, shared toilet with others 3
Have no toilet 4
8
Is the HH considered officially poor by the Government? (circle one)
Yes 1 No 0 Don’t know 99
9 Did your HH have enough food during the last 12 months? (circle one)
Yes 1 No 0
10 How many meals does the HH have per day on average? No. of meals
11
Has the HH received the following during the last 12 months? (circle one)
a. Government support for poor HHs Yes................. 1 No.................................
0
b. Government support for natural disaster Yes................. 1 No.................................
0
12
Does the HH (at least one member) have a bank account?
Yes................. 1 No......... 0
(circle one) Don’t know
99
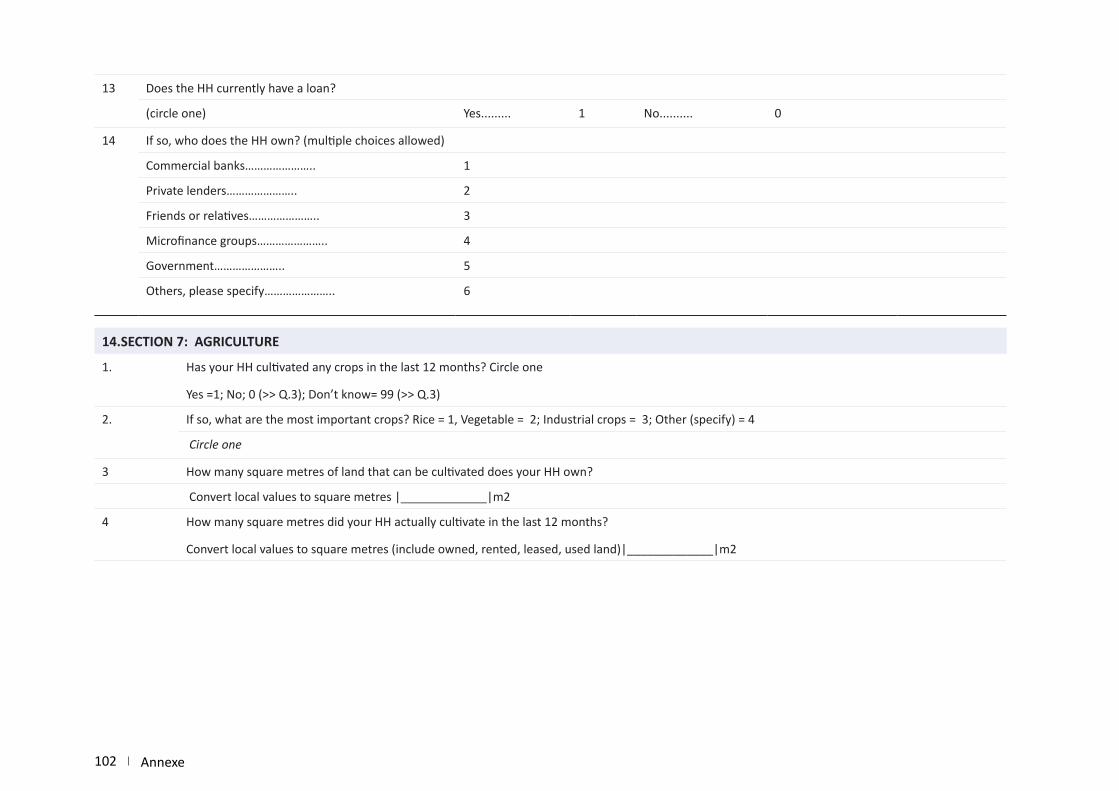
102 Annexe
13
Does the HH currently have a loan?
(circle one) Yes......... 1 No.......... 0
14
If so, who does the HH own? (multiple choices allowed)
Commercial banks………………….. 1
Private lenders………………….. 2
Friends or relatives………………….. 3
Microfinance groups………………….. 4
Government………………….. 5
Others, please specify………………….. 6
14. SECTION 7: AGRICULTURE
1. Has your HH cultivated any crops in the last 12 months? Circle one
Yes =1; No; 0 (>> Q.3); Don’t know= 99 (>> Q.3)
2.
If so, what are the most important crops? Rice = 1, Vegetable = 2; Industrial crops = 3; Other (specify) = 4
Circle one
3 How many square metres of land that can be cultivated does your HH own?
Convert local values to square metres |_____________|m2
4 How many square metres did your HH actually cultivate in the last 12 months?
Convert local values to square metres (include owned, rented, leased, used land)|_____________|m2
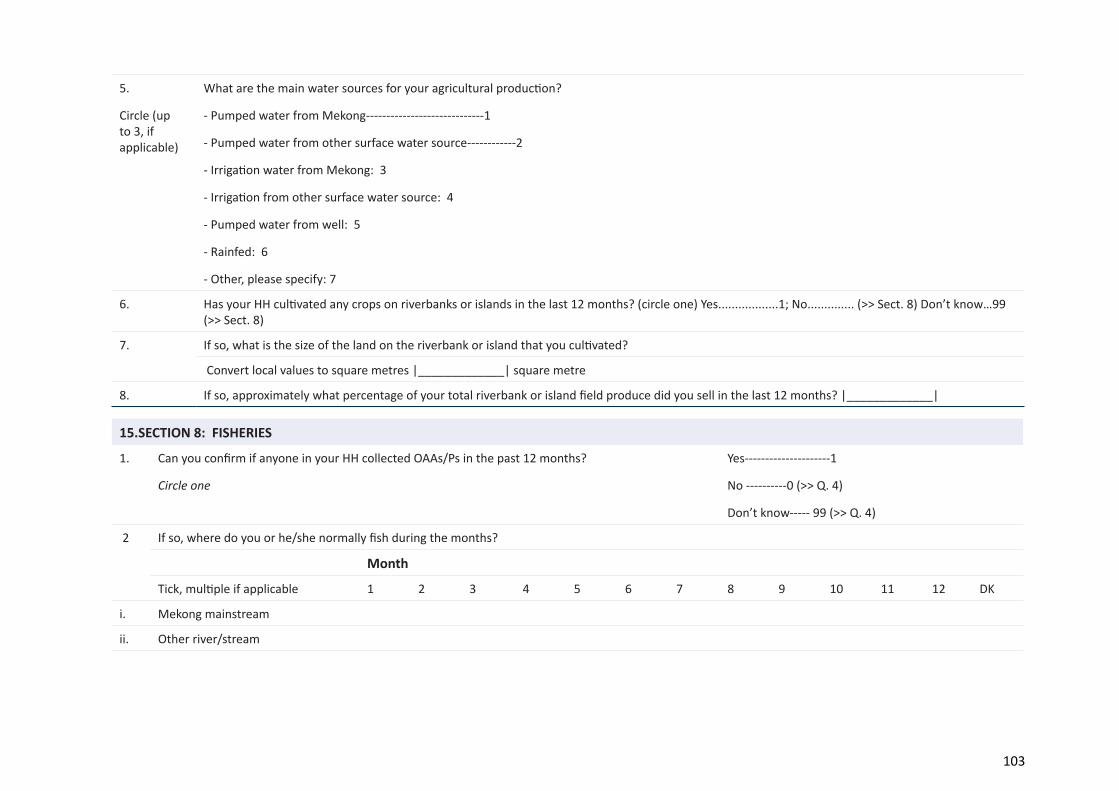
103
5.
Circle (up to 3, if applicable)
What are the main water sources for your agricultural production?
- Pumped water from Mekong-----------------------------1
- Pumped water from other surface water source------------2
- Irrigation water from Mekong: 3
- Irrigation from other surface water source: 4
- Pumped water from well: 5
- Rainfed: 6
- Other, please specify: 7
6. Has your HH cultivated any crops on riverbanks or islands in the last 12 months? (circle one) Yes..................1; No.............. (>> Sect. 8) Don’t know…99 (>> Sect. 8)
7. If so, what is the size of the land on the riverbank or island that you cultivated?
Convert local values to square metres |_____________| square metre
8. If so, approximately what percentage of your total riverbank or island field produce did you sell in the last 12 months? |_____________|
15. SECTION 8: FISHERIES
1. Can you confirm if anyone in your HH collected OAAs/Ps in the past 12 months?
Circle one
Yes---------------------1
No ----------0 (>> Q. 4)
Don’t know----- 99 (>> Q. 4)
2
If so, where do you or he/she normally fish during the months?
Month
Tick, multiple if applicable 1 2 3 4 5 6 7 8 9 10 11 12 DK
i. Mekong mainstream
ii. Other river/stream
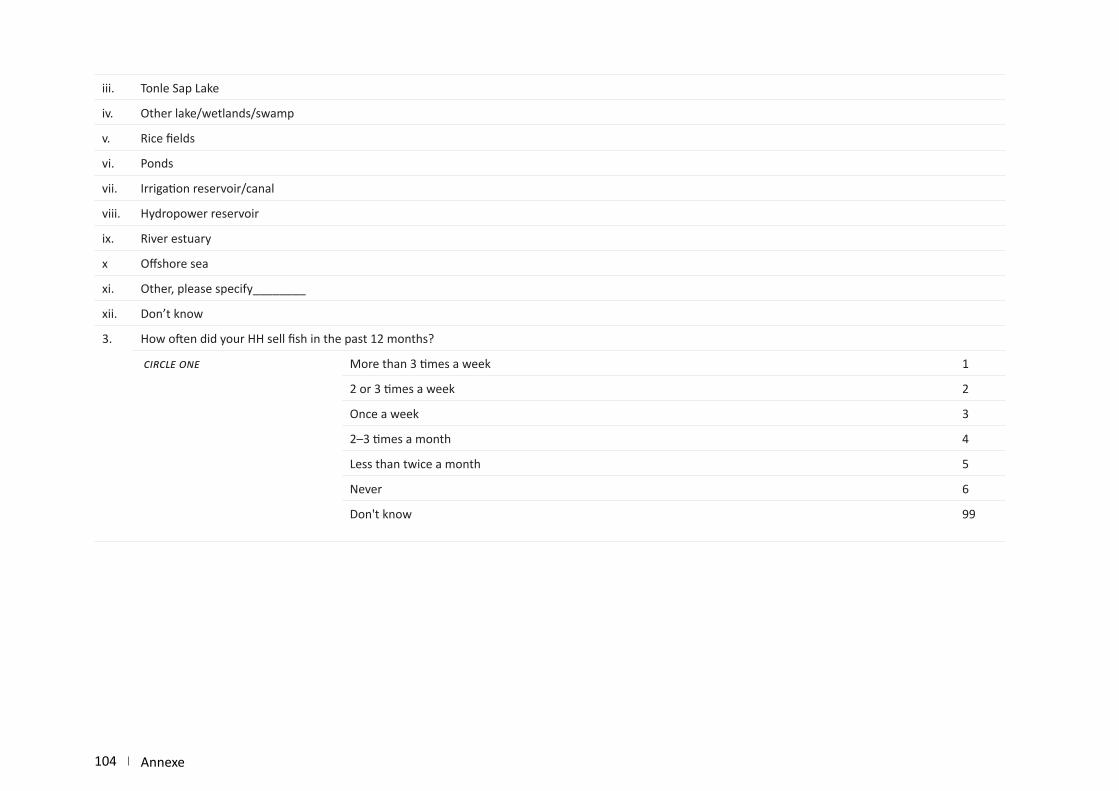
104 Annexe
iii. Tonle Sap Lake
iv. Other lake/wetlands/swamp
v. Rice fields
vi. Ponds
vii. Irrigation reservoir/canal
viii. Hydropower reservoir
ix. River estuary
x Offshore sea
xi. Other, please specify________
xii. Don’t know
3.
How often did your HH sell fish in the past 12 months?
CirCle one More than 3 times a week 1
2 or 3 times a week 2
Once a week 3
2–3 times a month 4
Less than twice a month 5
Never 6
Don't know 99
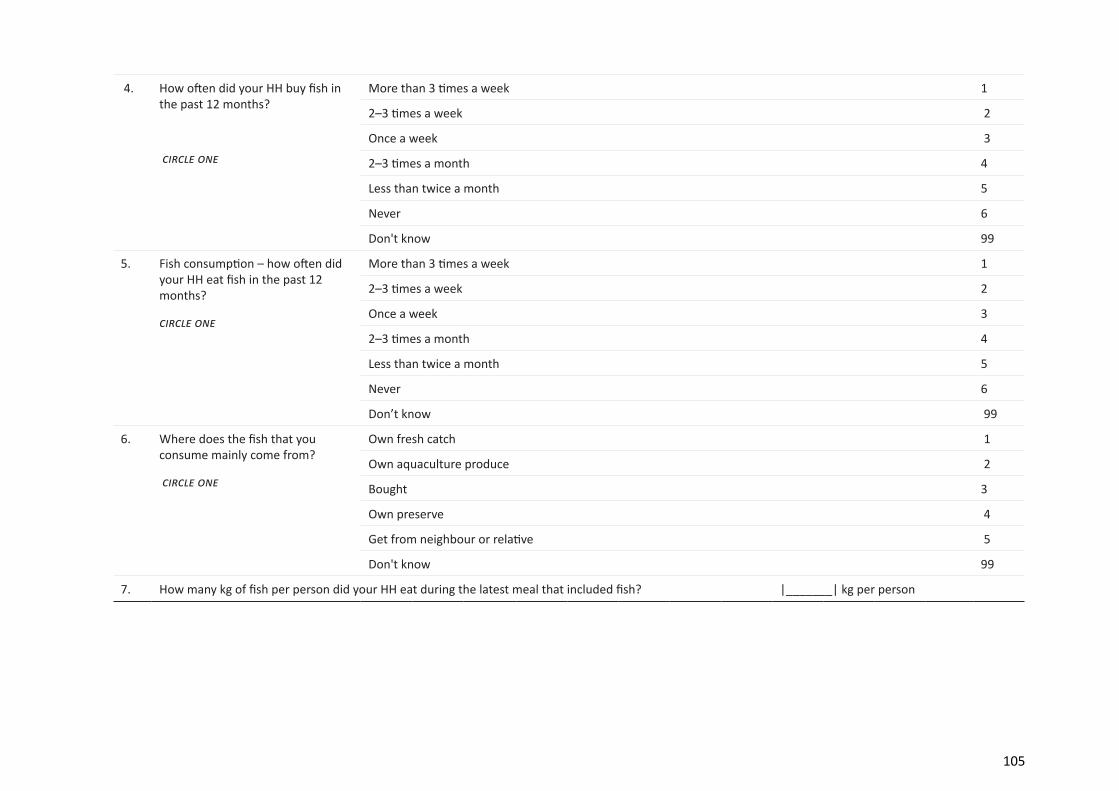
105
4. How often did your HH buy fish in the past 12 months?
CirCle one
More than 3 times a week 1
2–3 times a week 2
Once a week 3
2–3 times a month 4
Less than twice a month 5
Never 6
Don't know 99
5.
Fish consumption – how often did your HH eat fish in the past 12 months?
CirCle one
More than 3 times a week 1
2–3 times a week 2
Once a week 3
2–3 times a month 4
Less than twice a month 5
Never 6
Don’t know 99
6. Where does the fish that you consume mainly come from?
CirCle one
Own fresh catch 1
Own aquaculture produce 2
Bought 3
Own preserve 4
Get from neighbour or relative 5
Don't know 99
7. How many kg of fish per person did your HH eat during the latest meal that included fish? |_______| kg per person
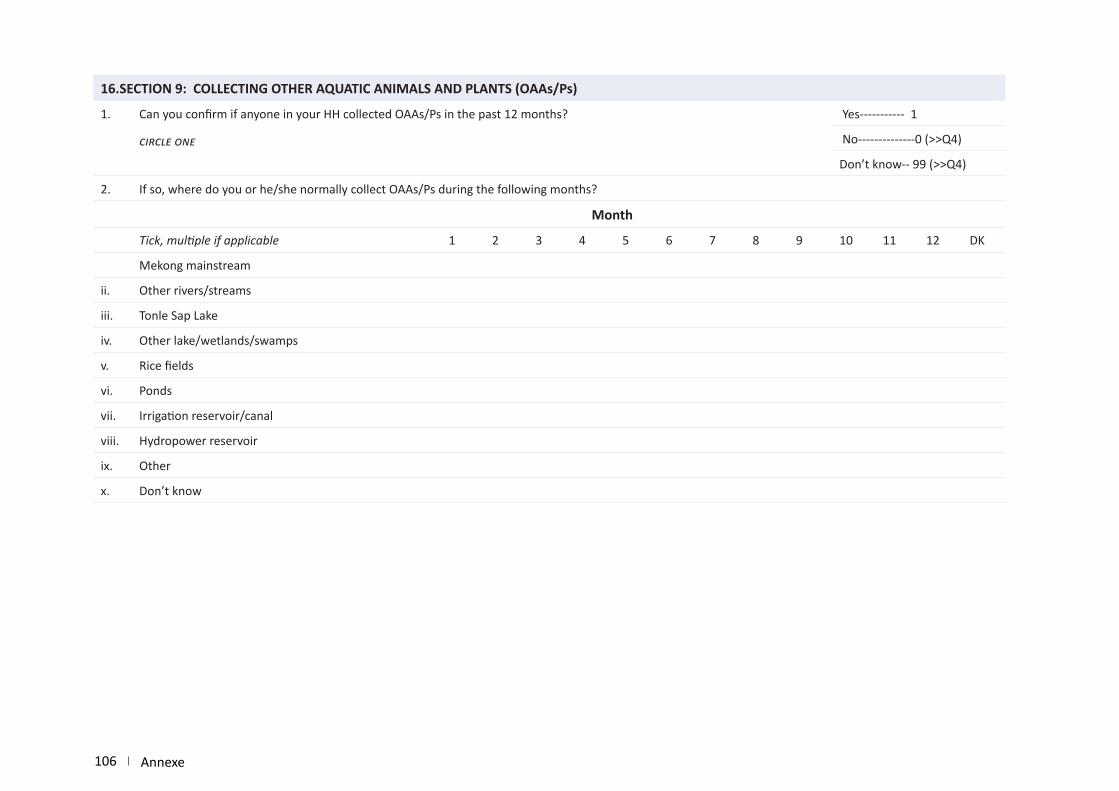
106 Annexe
16. SECTION 9: COLLECTING OTHER AQUATIC ANIMALS AND PLANTS (OAAs/Ps)
1. Can you confirm if anyone in your HH collected OAAs/Ps in the past 12 months?
CirCle one
Yes----------- 1
No--------------0 (>>Q4)
Don’t know-- 99 (>>Q4)
2. If so, where do you or he/she normally collect OAAs/Ps during the following months?
Month
Tick, multiple if applicable 1 2 3 4 5 6 7 8 9 10 11 12 DK
Mekong mainstream
ii. Other rivers/streams
iii. Tonle Sap Lake
iv. Other lake/wetlands/swamps
v. Rice fields
vi. Ponds
vii. Irrigation reservoir/canal
viii. Hydropower reservoir
ix. Other
x. Don’t know
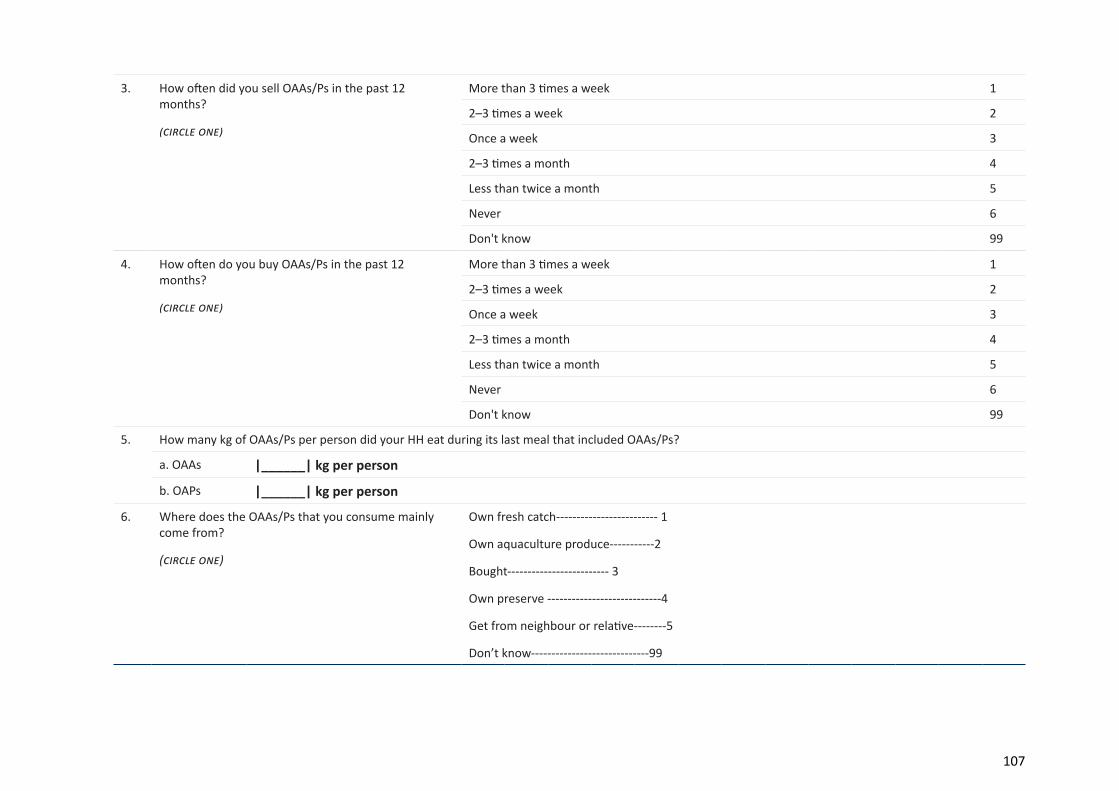
107
3. How often did you sell OAAs/Ps in the past 12 months?
(CirCle one)
More than 3 times a week 1
2–3 times a week 2
Once a week 3
2–3 times a month 4
Less than twice a month 5
Never 6
Don't know 99
4. How often do you buy OAAs/Ps in the past 12 months?
(CirCle one)
More than 3 times a week 1
2–3 times a week 2
Once a week 3
2–3 times a month 4
Less than twice a month 5
Never 6
Don't know 99
5. How many kg of OAAs/Ps per person did your HH eat during its last meal that included OAAs/Ps?
a. OAAs |______| kg per person
b. OAPs |______| kg per person
6. Where does the OAAs/Ps that you consume mainly come from?
(CirCle one)
Own fresh catch------------------------- 1
Own aquaculture produce-----------2
Bought------------------------- 3
Own preserve ----------------------------4
Get from neighbour or relative--------5
Don’t know-----------------------------99
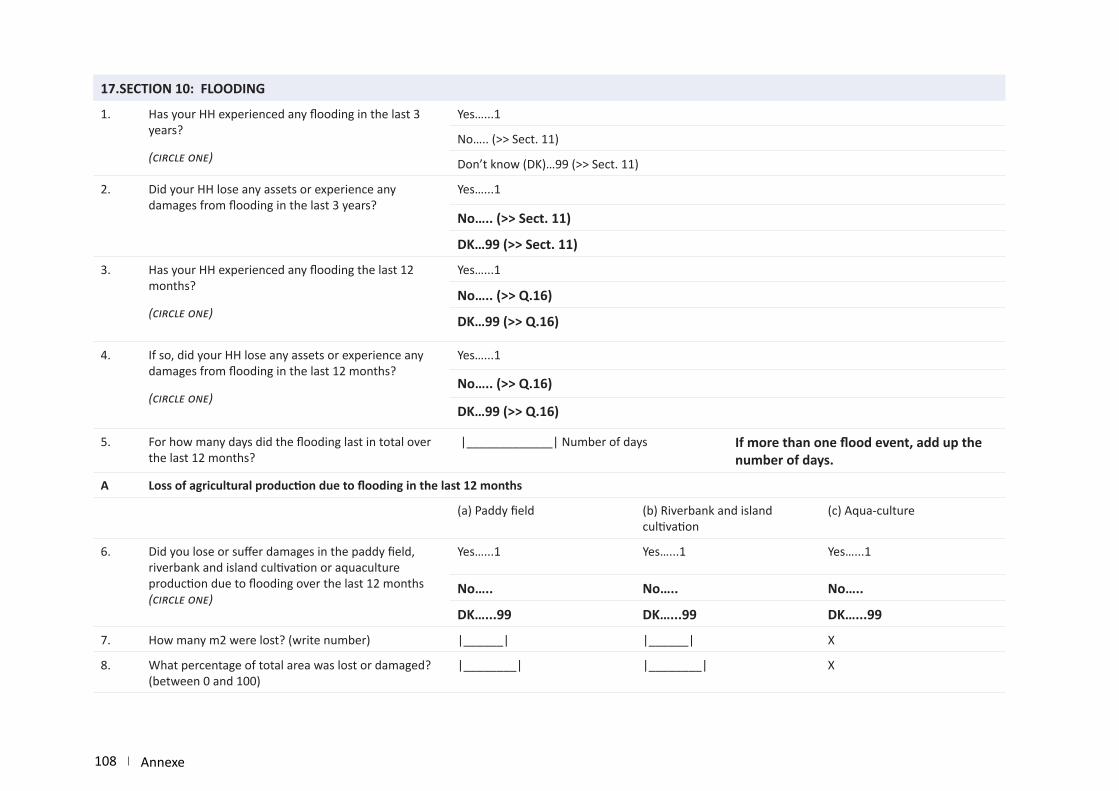
108 Annexe
17. SECTION 10: FLOODING
1. Has your HH experienced any flooding in the last 3 years?
(CirCle one)
Yes…...1
No….. (>> Sect. 11)
Don’t know (DK)…99 (>> Sect. 11)
2. Did your HH lose any assets or experience any damages from flooding in the last 3 years?
Yes…...1
No….. (>> Sect. 11)
DK…99 (>> Sect. 11)
3. Has your HH experienced any flooding the last 12 months?
(CirCle one)
Yes…...1
No….. (>> Q.16)
DK…99 (>> Q.16)
4. If so, did your HH lose any assets or experience any damages from flooding in the last 12 months?
(CirCle one)
Yes…...1
No….. (>> Q.16)
DK…99 (>> Q.16)
5. For how many days did the flooding last in total over the last 12 months?
|_____________| Number of days If more than one flood event, add up the number of days.
A Loss of agricultural production due to flooding in the last 12 months
(a) Paddy field (b) Riverbank and island cultivation
(c) Aqua-culture
6. Did you lose or suffer damages in the paddy field, riverbank and island cultivation or aquaculture production due to flooding over the last 12 months (CirCle one)
Yes…...1 Yes…...1 Yes…...1
No….. No….. No…..
DK…...99 DK…...99 DK…...99
7. How many m2 were lost? (write number) |______| |______| X
8. What percentage of total area was lost or damaged? (between 0 and 100)
|________| |________| X
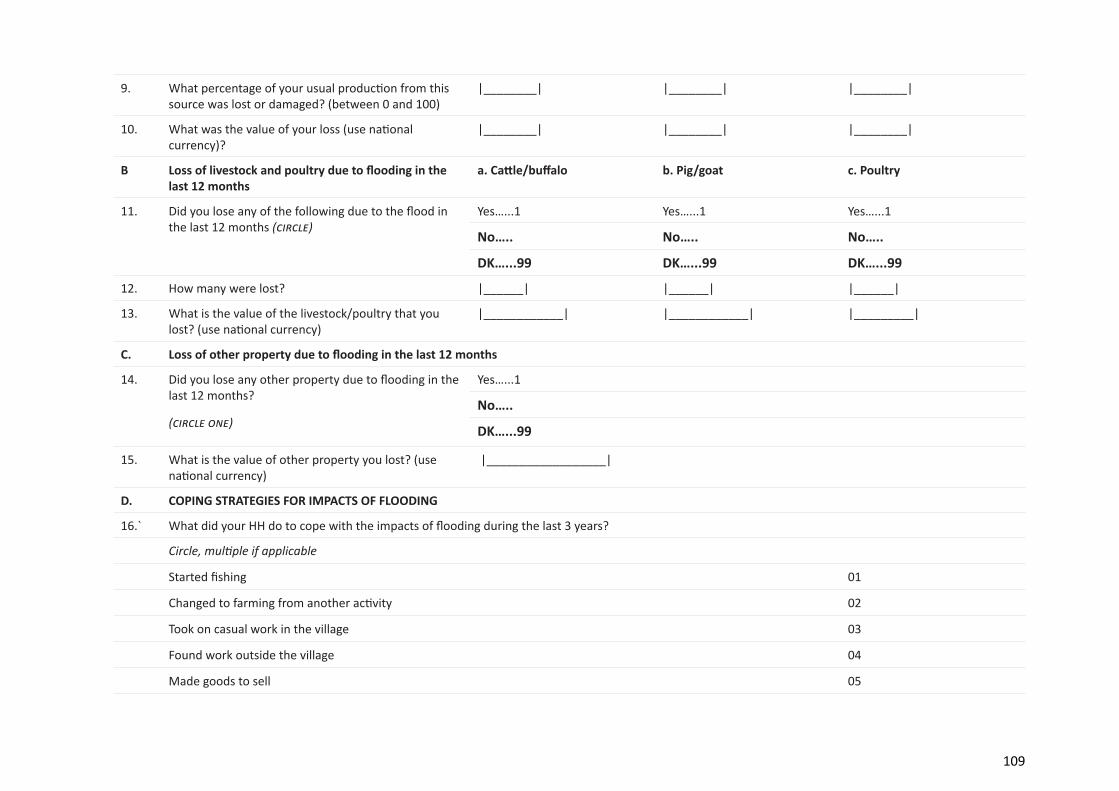
109
9. What percentage of your usual production from this source was lost or damaged? (between 0 and 100)
|________| |________| |________|
10. What was the value of your loss (use national currency)?
|________| |________| |________|
B Loss of livestock and poultry due to flooding in the last 12 months
a. Cattle/buffalo b. Pig/goat c. Poultry
11. Did you lose any of the following due to the flood in the last 12 months (CirCle)
Yes…...1 Yes…...1 Yes…...1
No….. No….. No…..
DK…...99 DK…...99 DK…...99
12. How many were lost? |______| |______| |______|
13. What is the value of the livestock/poultry that you lost? (use national currency)
|____________| |____________| |_________|
C. Loss of other property due to flooding in the last 12 months
14. Did you lose any other property due to flooding in the last 12 months?
(CirCle one)
Yes…...1
No…..
DK…...99
15. What is the value of other property you lost? (use national currency)
|__________________|
D. COPING STRATEGIES FOR IMPACTS OF FLOODING
16.` What did your HH do to cope with the impacts of flooding during the last 3 years?
Circle, multiple if applicable
Started fishing 01
Changed to farming from another activity 02
Took on casual work in the village 03
Found work outside the village 04
Made goods to sell 05
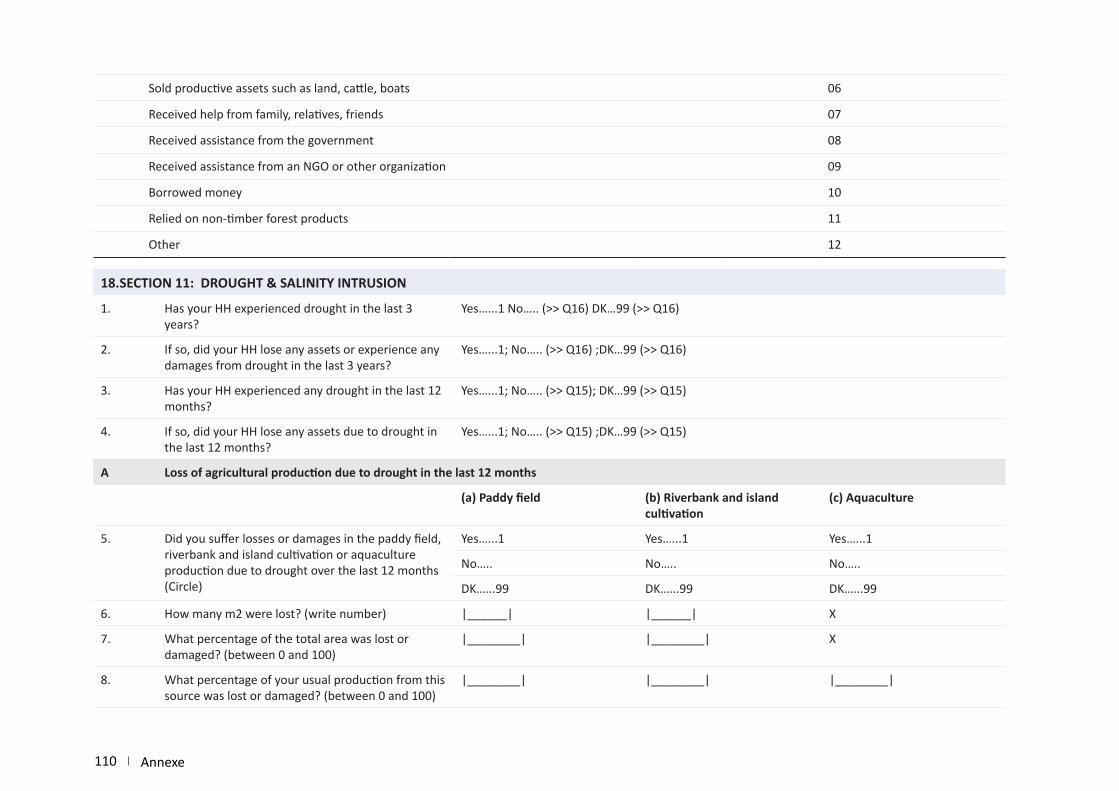
110 Annexe
Sold productive assets such as land, cattle, boats 06
Received help from family, relatives, friends 07
Received assistance from the government 08
Received assistance from an NGO or other organization 09
Borrowed money 10
Relied on non-timber forest products 11
Other 12
18. SECTION 11: DROUGHT & SALINITY INTRUSION
1. Has your HH experienced drought in the last 3 years?
Yes…...1 No….. (>> Q16) DK…99 (>> Q16)
2. If so, did your HH lose any assets or experience any damages from drought in the last 3 years?
Yes…...1; No….. (>> Q16) ;DK…99 (>> Q16)
3. Has your HH experienced any drought in the last 12 months?
Yes…...1; No….. (>> Q15); DK…99 (>> Q15)
4. If so, did your HH lose any assets due to drought in the last 12 months?
Yes…...1; No….. (>> Q15) ;DK…99 (>> Q15)
A Loss of agricultural production due to drought in the last 12 months
(a) Paddy field (b) Riverbank and island cultivation
(c) Aquaculture
5. Did you suffer losses or damages in the paddy field, riverbank and island cultivation or aquaculture production due to drought over the last 12 months (Circle)
Yes…...1 Yes…...1 Yes…...1
No….. No….. No…..
DK…...99 DK…...99 DK…...99
6. How many m2 were lost? (write number) |______| |______| X
7. What percentage of the total area was lost or damaged? (between 0 and 100)
|________| |________| X
8. What percentage of your usual production from this source was lost or damaged? (between 0 and 100)
|________| |________| |________|
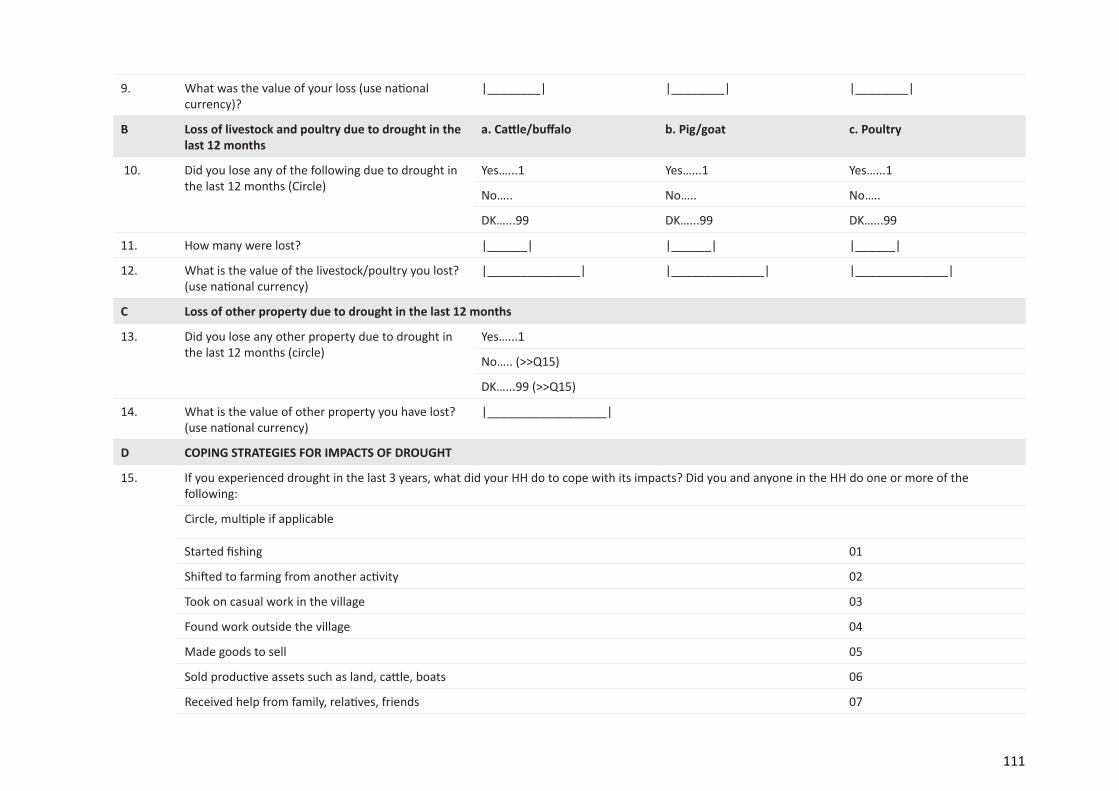
111
9. What was the value of your loss (use national currency)?
|________| |________| |________|
B Loss of livestock and poultry due to drought in the last 12 months
a. Cattle/buffalo b. Pig/goat c. Poultry
10. Did you lose any of the following due to drought in the last 12 months (Circle)
Yes…...1 Yes…...1 Yes…...1
No….. No….. No…..
DK…...99 DK…...99 DK…...99
11. How many were lost? |______| |______| |______|
12. What is the value of the livestock/poultry you lost? (use national currency)
|______________| |______________| |______________|
C Loss of other property due to drought in the last 12 months
13. Did you lose any other property due to drought in the last 12 months (circle)
Yes…...1
No….. (>>Q15)
DK…...99 (>>Q15)
14. What is the value of other property you have lost? (use national currency)
|__________________|
D COPING STRATEGIES FOR IMPACTS OF DROUGHT
15. If you experienced drought in the last 3 years, what did your HH do to cope with its impacts? Did you and anyone in the HH do one or more of the following:
Circle, multiple if applicable
Started fishing 01
Shifted to farming from another activity 02
Took on casual work in the village 03
Found work outside the village 04
Made goods to sell 05
Sold productive assets such as land, cattle, boats 06
Received help from family, relatives, friends 07
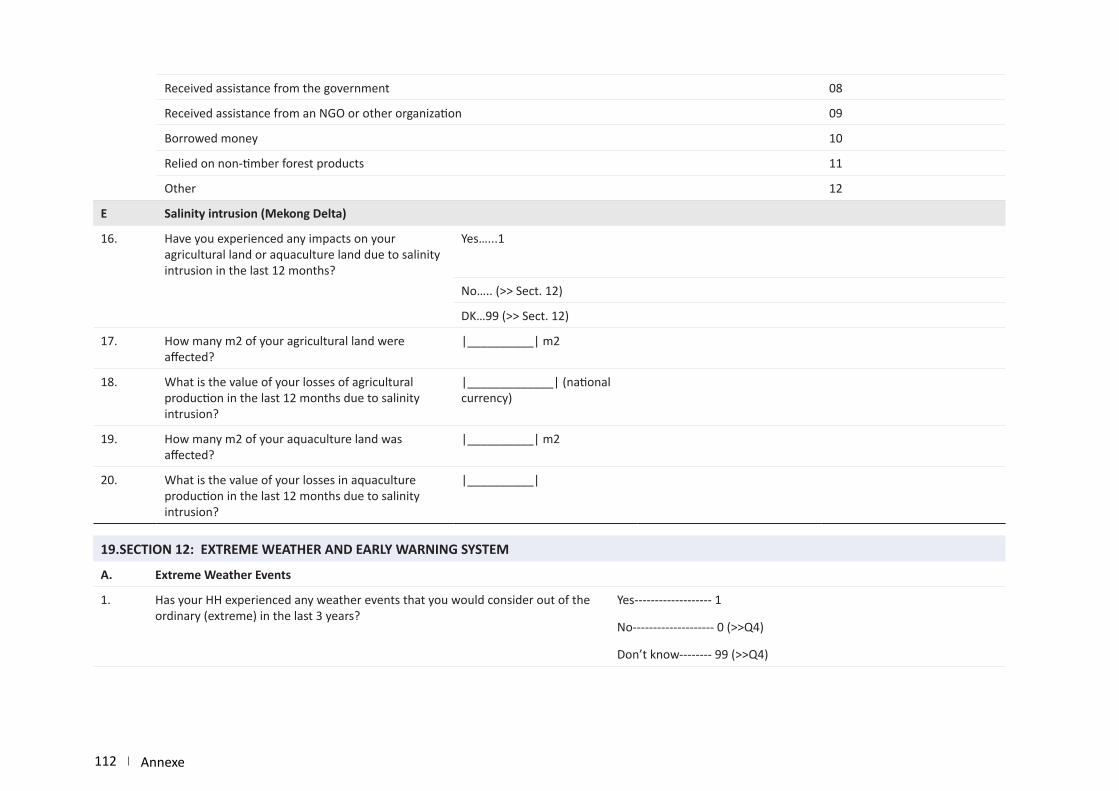
112 Annexe
Received assistance from the government 08
Received assistance from an NGO or other organization 09
Borrowed money 10
Relied on non-timber forest products 11
Other 12
E Salinity intrusion (Mekong Delta)
16. Have you experienced any impacts on your agricultural land or aquaculture land due to salinity intrusion in the last 12 months?
Yes…...1
No….. (>> Sect. 12)
DK…99 (>> Sect. 12)
17. How many m2 of your agricultural land were affected?
|__________| m2
18. What is the value of your losses of agricultural production in the last 12 months due to salinity intrusion?
|_____________| (national currency)
19. How many m2 of your aquaculture land was affected?
|__________| m2
20. What is the value of your losses in aquaculture production in the last 12 months due to salinity intrusion?
|__________|
19. SECTION 12: EXTREME WEATHER AND EARLY WARNING SYSTEM
A. Extreme Weather Events
1. Has your HH experienced any weather events that you would consider out of the ordinary (extreme) in the last 3 years?
Yes------------------- 1
No-------------------- 0 (>>Q4)
Don’t know-------- 99 (>>Q4)
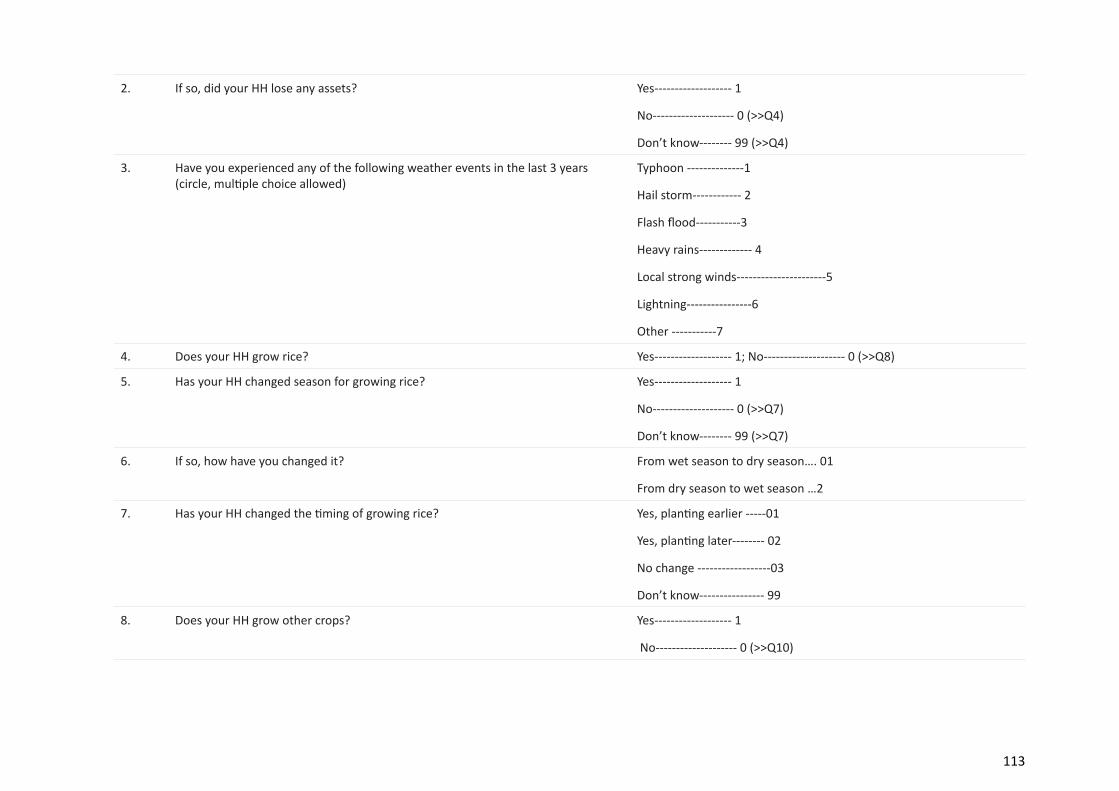
113
2. If so, did your HH lose any assets? Yes------------------- 1
No-------------------- 0 (>>Q4)
Don’t know-------- 99 (>>Q4)
3. Have you experienced any of the following weather events in the last 3 years (circle, multiple choice allowed)
Typhoon --------------1
Hail storm------------ 2
Flash flood-----------3
Heavy rains------------- 4
Local strong winds----------------------5
Lightning----------------6
Other -----------7
4. Does your HH grow rice? Yes------------------- 1; No-------------------- 0 (>>Q8)
5. Has your HH changed season for growing rice? Yes------------------- 1
No-------------------- 0 (>>Q7)
Don’t know-------- 99 (>>Q7)
6. If so, how have you changed it? From wet season to dry season…. 01
From dry season to wet season …2
7. Has your HH changed the timing of growing rice? Yes, planting earlier -----01
Yes, planting later-------- 02
No change ------------------03
Don’t know---------------- 99
8. Does your HH grow other crops? Yes------------------- 1
No-------------------- 0 (>>Q10)
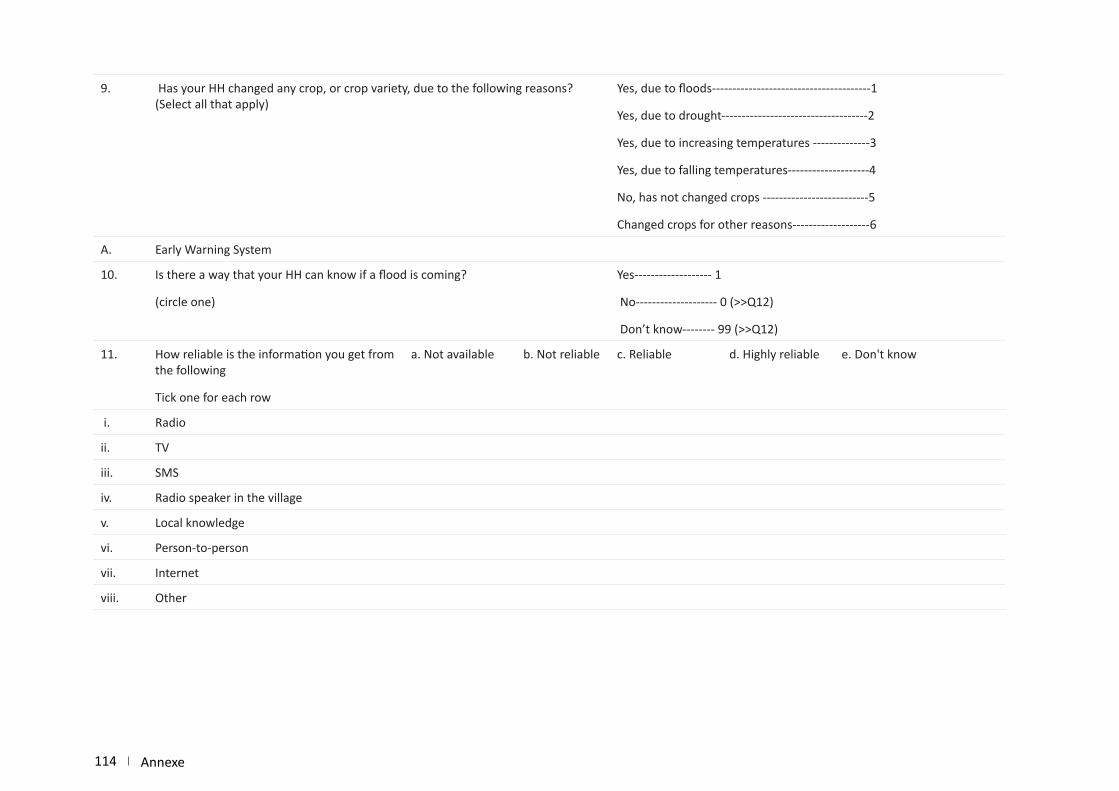
114 Annexe
9. Has your HH changed any crop, or crop variety, due to the following reasons? (Select all that apply)
Yes, due to floods---------------------------------------1
Yes, due to drought------------------------------------2
Yes, due to increasing temperatures --------------3
Yes, due to falling temperatures--------------------4
No, has not changed crops --------------------------5
Changed crops for other reasons-------------------6
A. Early Warning System
10. Is there a way that your HH can know if a flood is coming?
(circle one)
Yes------------------- 1
No-------------------- 0 (>>Q12)
Don’t know-------- 99 (>>Q12)
11. How reliable is the information you get from the following
Tick one for each row
a. Not available b. Not reliable c. Reliable d. Highly reliable e. Don't know
i. Radio
ii. TV
iii. SMS
iv. Radio speaker in the village
v. Local knowledge
vi. Person-to-person
vii. Internet
viii. Other
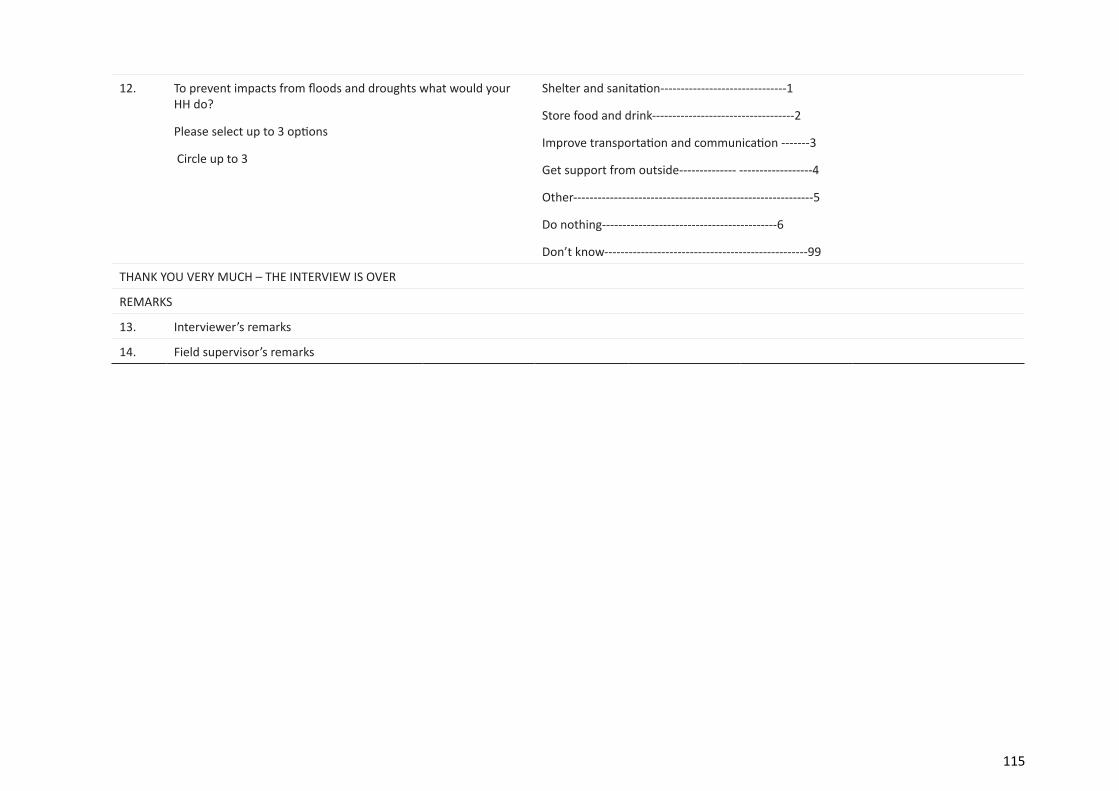
115
12. To prevent impacts from floods and droughts what would your HH do?
Please select up to 3 options
Circle up to 3
Shelter and sanitation-------------------------------1
Store food and drink-----------------------------------2
Improve transportation and communication -------3
Get support from outside-------------- ------------------4
Other-----------------------------------------------------------5
Do nothing-------------------------------------------6
Don’t know--------------------------------------------------99
THANK YOU VERY MUCH – THE INTERVIEW IS OVER
REMARKS
13. Interviewer’s remarks
14. Field supervisor’s remarks
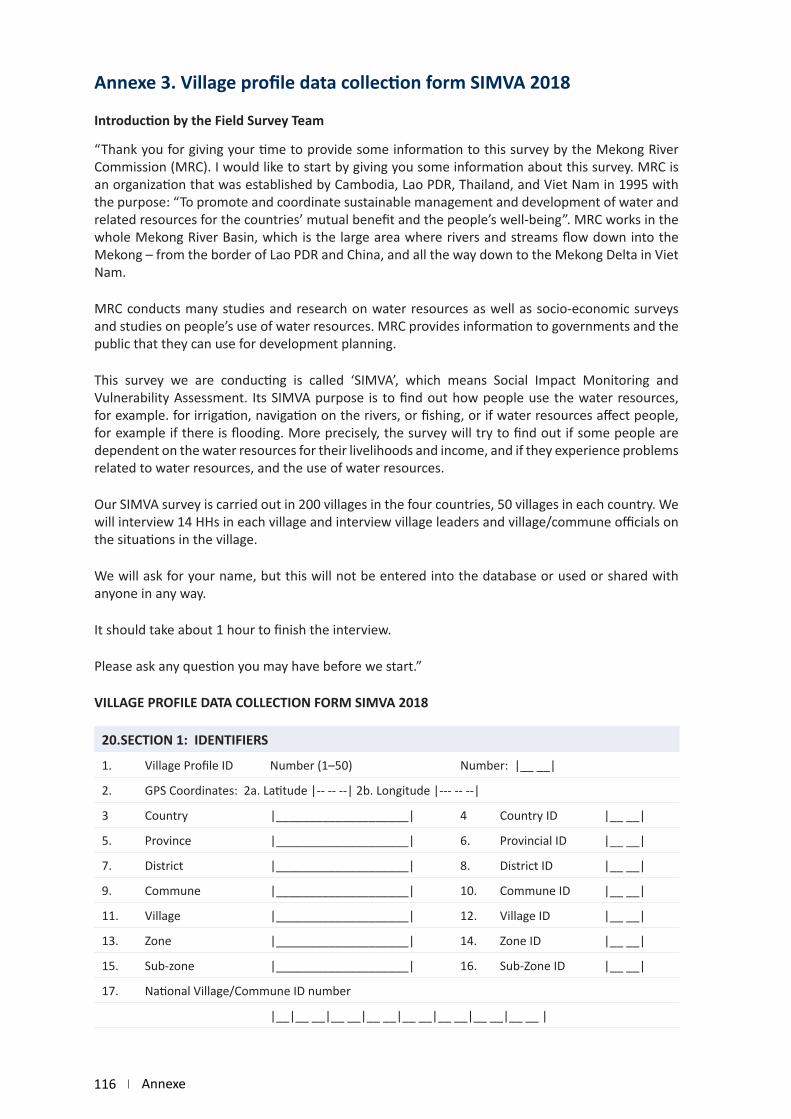
Annexe116
Annexe 3. Village profile data collection form SIMVA 2018
Introduction by the Field Survey Team
“Thank you for giving your time to provide some information to this survey by the Mekong River Commission (MRC). I would like to start by giving you some information about this survey. MRC is an organization that was established by Cambodia, Lao PDR, Thailand, and Viet Nam in 1995 with the purpose: “To promote and coordinate sustainable management and development of water and related resources for the countries’ mutual benefit and the people’s well-being”. MRC works in the whole Mekong River Basin, which is the large area where rivers and streams flow down into the Mekong – from the border of Lao PDR and China, and all the way down to the Mekong Delta in Viet Nam.
MRC conducts many studies and research on water resources as well as socio-economic surveys and studies on people’s use of water resources. MRC provides information to governments and the public that they can use for development planning.
This survey we are conducting is called ‘SIMVA’, which means Social Impact Monitoring and Vulnerability Assessment. Its SIMVA purpose is to find out how people use the water resources, for example. for irrigation, navigation on the rivers, or fishing, or if water resources affect people, for example if there is flooding. More precisely, the survey will try to find out if some people are dependent on the water resources for their livelihoods and income, and if they experience problems related to water resources, and the use of water resources.
Our SIMVA survey is carried out in 200 villages in the four countries, 50 villages in each country. We will interview 14 HHs in each village and interview village leaders and village/commune officials on the situations in the village.
We will ask for your name, but this will not be entered into the database or used or shared with anyone in any way.
It should take about 1 hour to finish the interview.
Please ask any question you may have before we start.”
VILLAGE PROFILE DATA COLLECTION FORM SIMVA 2018
20. SECTION 1: IDENTIFIERS
1. Village Profile ID Number (1–50) Number: |__ __|
2. GPS Coordinates: 2a. Latitude |-- -- --| 2b. Longitude |--- -- --|
3 Country |____________________| 4 Country ID |__ __|
5. Province |____________________| 6. Provincial ID |__ __|
7. District |____________________| 8. District ID |__ __|
9. Commune |____________________| 10. Commune ID |__ __|
11. Village |____________________| 12. Village ID |__ __|
13. Zone |____________________| 14. Zone ID |__ __|
15. Sub-zone |____________________| 16. Sub-Zone ID |__ __|
17. National Village/Commune ID number
|__|__ __|__ __|__ __|__ __|__ __|__ __|__ __ |
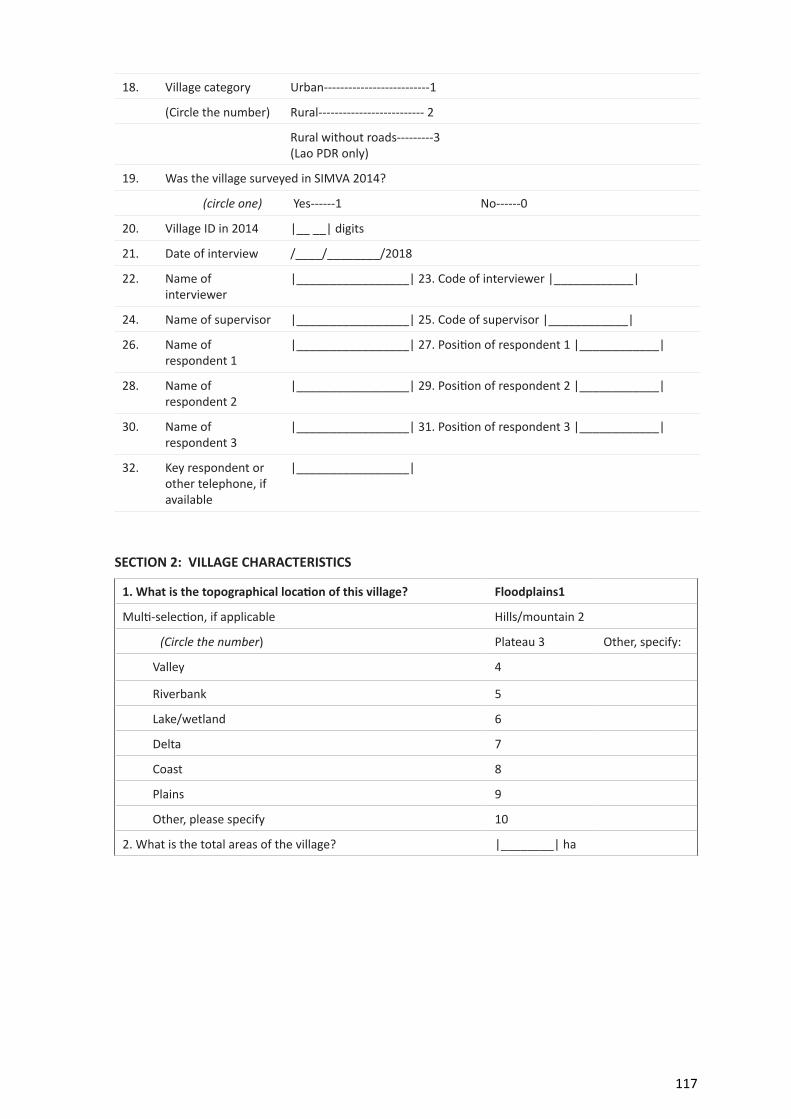
117
18. Village category Urban--------------------------1
(Circle the number) Rural-------------------------- 2
Rural without roads---------3 (Lao PDR only)
19. Was the village surveyed in SIMVA 2014?
(circle one) Yes------1 No------0
20. Village ID in 2014 |__ __| digits
21. Date of interview /____/________/2018
22. Name of interviewer
|_________________| 23. Code of interviewer |____________|
24. Name of supervisor |_________________| 25. Code of supervisor |____________|
26. Name of respondent 1
|_________________| 27. Position of respondent 1 |____________|
28. Name of respondent 2
|_________________| 29. Position of respondent 2 |____________|
30. Name of respondent 3
|_________________| 31. Position of respondent 3 |____________|
32. Key respondent or other telephone, if available
|_________________|
SECTION 2: VILLAGE CHARACTERISTICS
1. What is the topographical location of this village? Floodplains1
Multi-selection, if applicable Hills/mountain 2
(Circle the number) Plateau 3 Other, specify:
Valley 4
Riverbank 5
Lake/wetland 6
Delta 7
Coast 8
Plains 9
Other, please specify 10
2. What is the total areas of the village? |________| ha
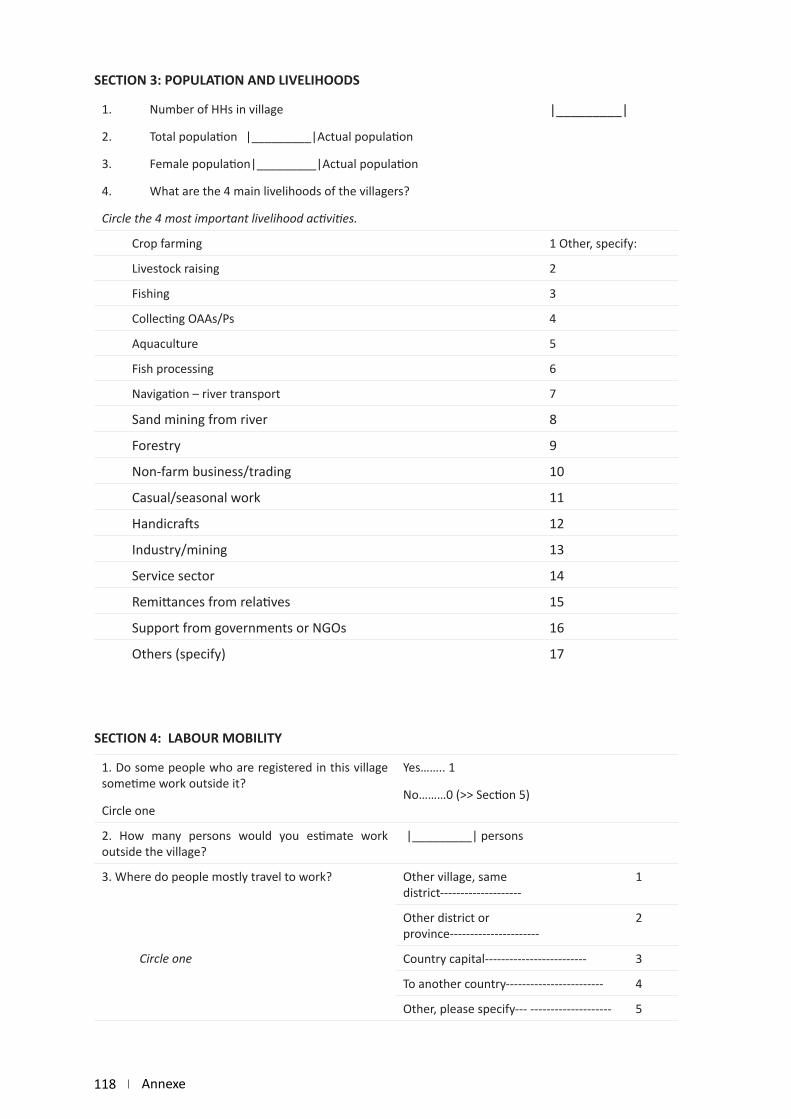
Annexe118
SECTION 3: POPULATION AND LIVELIHOODS
1. Number of HHs in village
2. Total population |_________|Actual population
3. Female population|_________|Actual population
4. What are the 4 main livelihoods of the villagers?
Circle the 4 most important livelihood activities.
|_________|
Crop farming 1 Other, specify:
Livestock raising 2
Fishing 3
Collecting OAAs/Ps 4
Aquaculture 5
Fish processing 6
Navigation – river transport 7
Sand mining from river 8
Forestry 9
Non-farm business/trading 10
Casual/seasonal work 11
Handicrafts 12
Industry/mining 13
Service sector 14
Remittances from relatives 15
Support from governments or NGOs 16
Others (specify) 17
SECTION 4: LABOUR MOBILITY
1. Do some people who are registered in this village sometime work outside it?
Circle one
Yes…….. 1
No………0 (>> Section 5)
2. How many persons would you estimate work outside the village?
|_________| persons
3. Where do people mostly travel to work?
Circle one
Other village, same district--------------------
1
Other district or province----------------------
2
Country capital------------------------- 3
To another country------------------------ 4
Other, please specify--- -------------------- 5
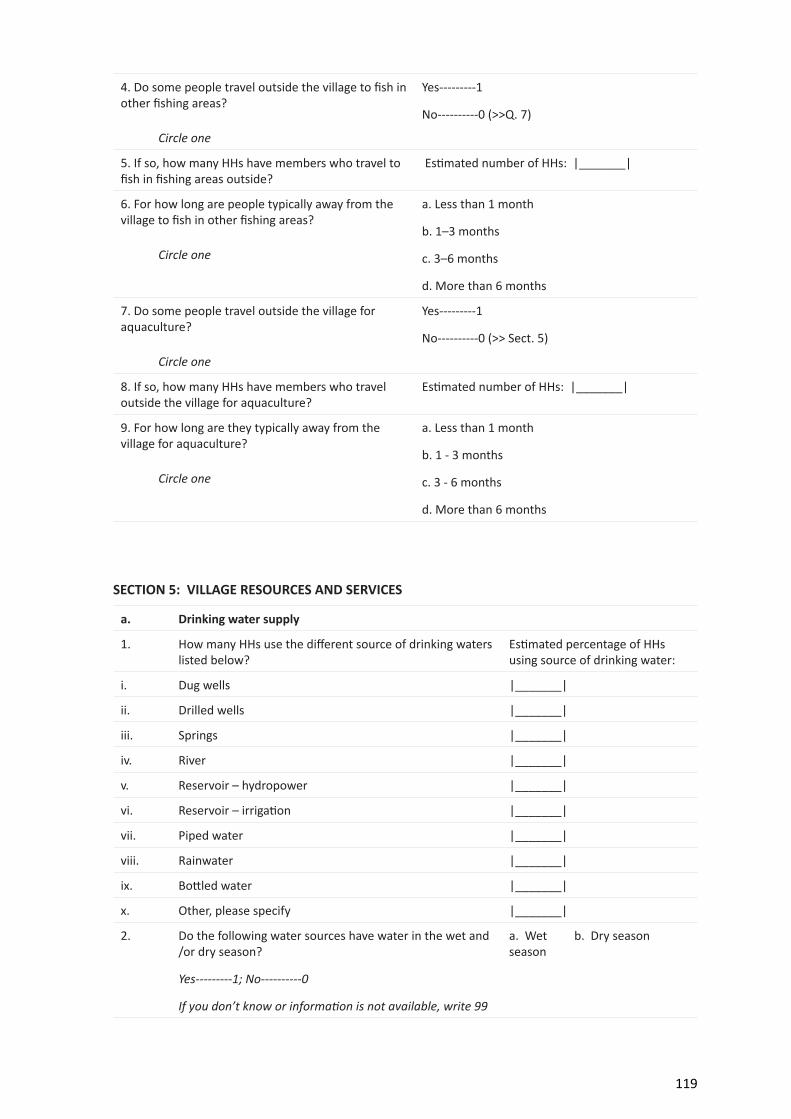
119
4. Do some people travel outside the village to fish in other fishing areas?
Circle one
Yes---------1
No----------0 (>>Q. 7)
5. If so, how many HHs have members who travel to fish in fishing areas outside?
Estimated number of HHs: |_______|
6. For how long are people typically away from the village to fish in other fishing areas?
Circle one
a. Less than 1 month
b. 1–3 months
c. 3–6 months
d. More than 6 months
7. Do some people travel outside the village for aquaculture?
Circle one
Yes---------1
No----------0 (>> Sect. 5)
8. If so, how many HHs have members who travel outside the village for aquaculture?
Estimated number of HHs: |_______|
9. For how long are they typically away from the village for aquaculture?
Circle one
a. Less than 1 month
b. 1 - 3 months
c. 3 - 6 months
d. More than 6 months
SECTION 5: VILLAGE RESOURCES AND SERVICES
a. Drinking water supply
1. How many HHs use the different source of drinking waters listed below?
Estimated percentage of HHs using source of drinking water:
i. Dug wells |_______|
ii. Drilled wells |_______|
iii. Springs |_______|
iv. River |_______|
v. Reservoir – hydropower |_______|
vi. Reservoir – irrigation |_______|
vii. Piped water |_______|
viii. Rainwater |_______|
ix. Bottled water |_______|
x. Other, please specify |_______|
2. Do the following water sources have water in the wet and /or dry season?
Yes---------1; No----------0
If you don’t know or information is not available, write 99
a. Wet season
b. Dry season
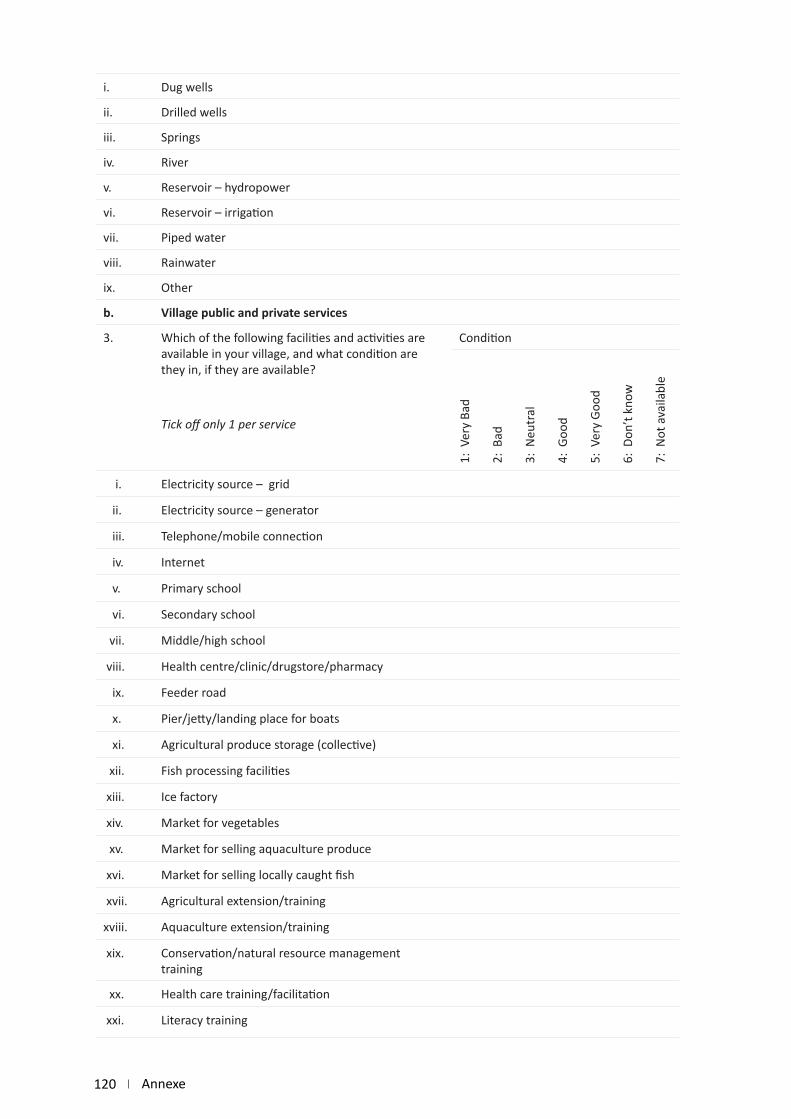
Annexe120
i. Dug wells
ii. Drilled wells
iii. Springs
iv. River
v. Reservoir – hydropower
vi. Reservoir – irrigation
vii. Piped water
viii. Rainwater
ix. Other
b. Village public and private services
3. Which of the following facilities and activities are available in your village, and what condition are they in, if they are available?
Tick off only 1 per service
Condition
1: V
ery
Bad
2: B
ad
3: N
eutr
al
4: G
ood
5: V
ery
Good
6: D
on’t
know
7: N
ot a
vaila
ble
i. Electricity source – grid
ii. Electricity source – generator
iii. Telephone/mobile connection
iv. Internet
v. Primary school
vi. Secondary school
vii. Middle/high school
viii. Health centre/clinic/drugstore/pharmacy
ix. Feeder road
x. Pier/jetty/landing place for boats
xi. Agricultural produce storage (collective)
xii. Fish processing facilities
xiii. Ice factory
xiv. Market for vegetables
xv. Market for selling aquaculture produce
xvi. Market for selling locally caught fish
xvii. Agricultural extension/training
xviii. Aquaculture extension/training
xix. Conservation/natural resource management training
xx. Health care training/facilitation
xxi. Literacy training
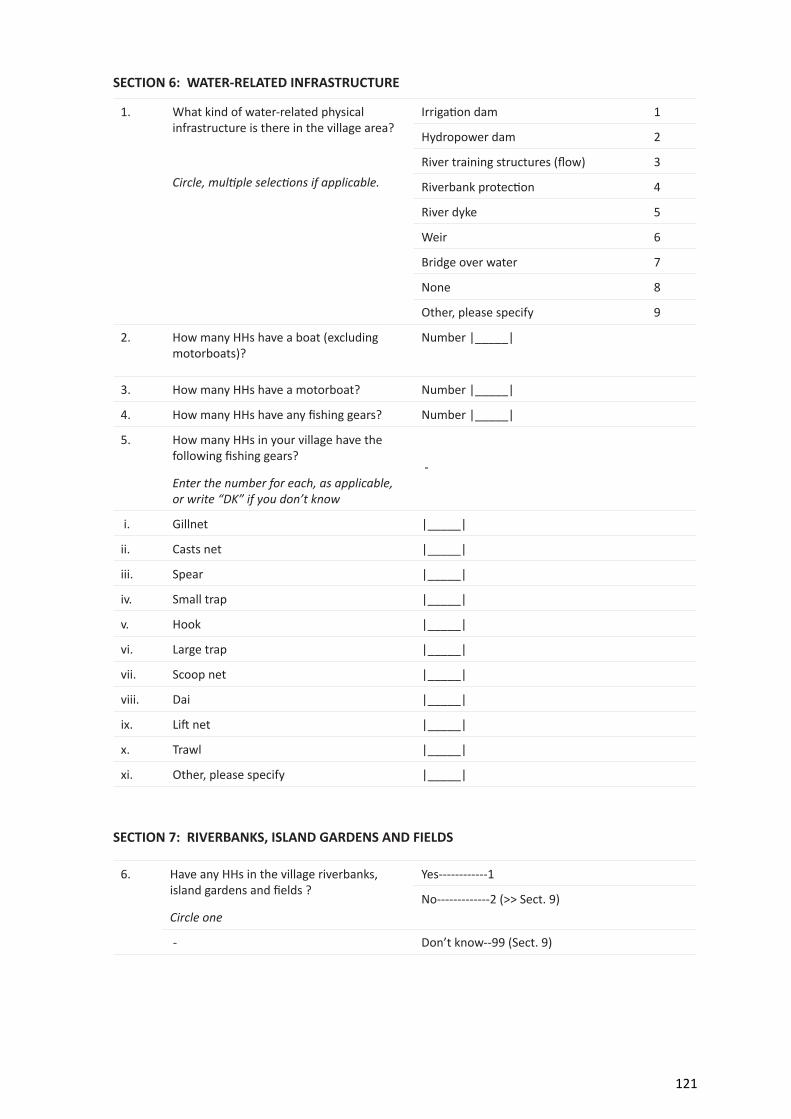
121
SECTION 6: WATER-RELATED INFRASTRUCTURE
1.
What kind of water-related physical infrastructure is there in the village area?
Circle, multiple selections if applicable.
Irrigation dam 1
Hydropower dam 2
River training structures (flow) 3
Riverbank protection 4
River dyke 5
Weir 6
Bridge over water 7
None 8
Other, please specify 9
2. How many HHs have a boat (excluding motorboats)?
Number |_____|
3. How many HHs have a motorboat? Number |_____|
4. How many HHs have any fishing gears? Number |_____|
5.
How many HHs in your village have the following fishing gears?
Enter the number for each, as applicable, or write “DK” if you don’t know
-
i. Gillnet |_____|
ii. Casts net |_____|
iii. Spear |_____|
iv. Small trap |_____|
v. Hook |_____|
vi. Large trap |_____|
vii. Scoop net |_____|
viii. Dai |_____|
ix. Lift net |_____|
x. Trawl |_____|
xi. Other, please specify |_____|
SECTION 7: RIVERBANKS, ISLAND GARDENS AND FIELDS
6.
Have any HHs in the village riverbanks, island gardens and fields ?
Circle one
Yes------------1
No-------------2 (>> Sect. 9)
- Don’t know--99 (Sect. 9)
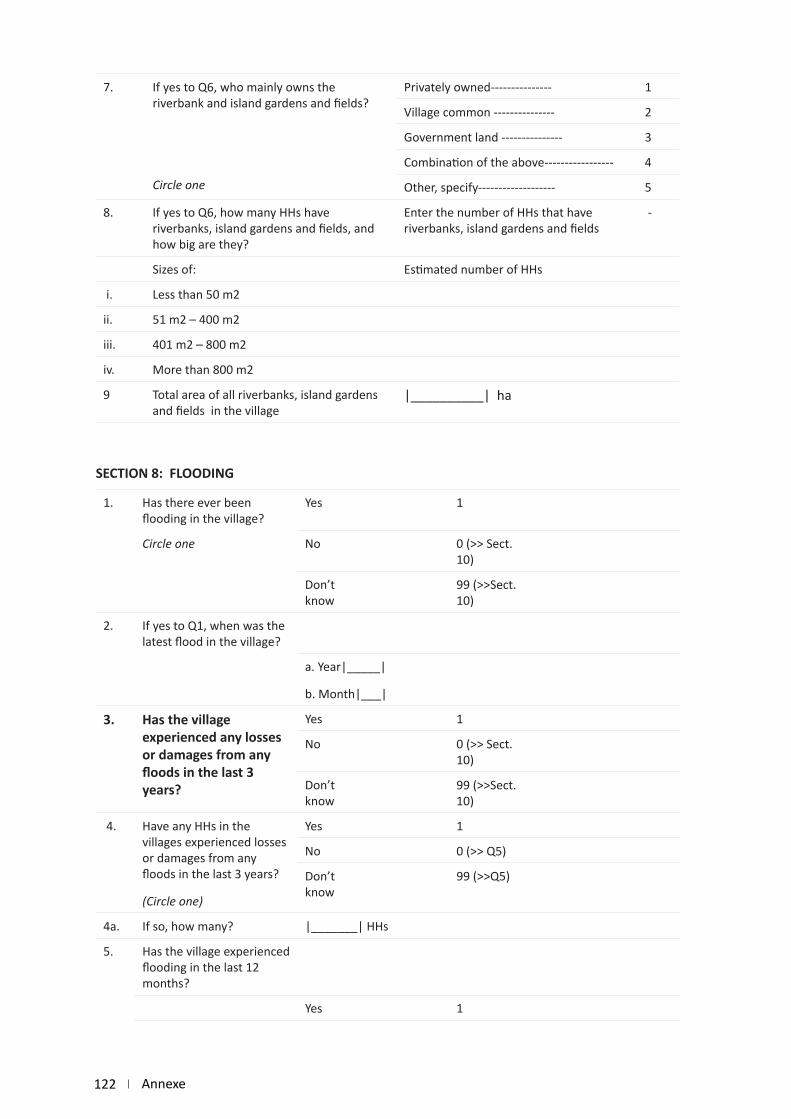
Annexe122
7. If yes to Q6, who mainly owns the riverbank and island gardens and fields?
Circle one
Privately owned--------------- 1
Village common --------------- 2
Government land --------------- 3
Combination of the above----------------- 4
Other, specify------------------- 5
8. If yes to Q6, how many HHs have riverbanks, island gardens and fields, and how big are they?
Enter the number of HHs that have riverbanks, island gardens and fields
-
Sizes of: Estimated number of HHs
i. Less than 50 m2
ii. 51 m2 – 400 m2
iii. 401 m2 – 800 m2
iv. More than 800 m2
9 Total area of all riverbanks, island gardens and fields in the village
|__________| ha
SECTION 8: FLOODING
1. Has there ever been flooding in the village?
Yes 1
Circle one No 0 (>> Sect. 10)
Don’t know
99 (>>Sect. 10)
2. If yes to Q1, when was the latest flood in the village?
a. Year|_____|
b. Month|___|
3. Has the village experienced any losses or damages from any floods in the last 3 years?
Yes 1
No 0 (>> Sect. 10)
Don’t know
99 (>>Sect. 10)
4. Have any HHs in the villages experienced losses or damages from any floods in the last 3 years?
(Circle one)
Yes 1
No 0 (>> Q5)
Don’t know
99 (>>Q5)
4a. If so, how many? |_______| HHs
5. Has the village experienced flooding in the last 12 months?
Yes 1
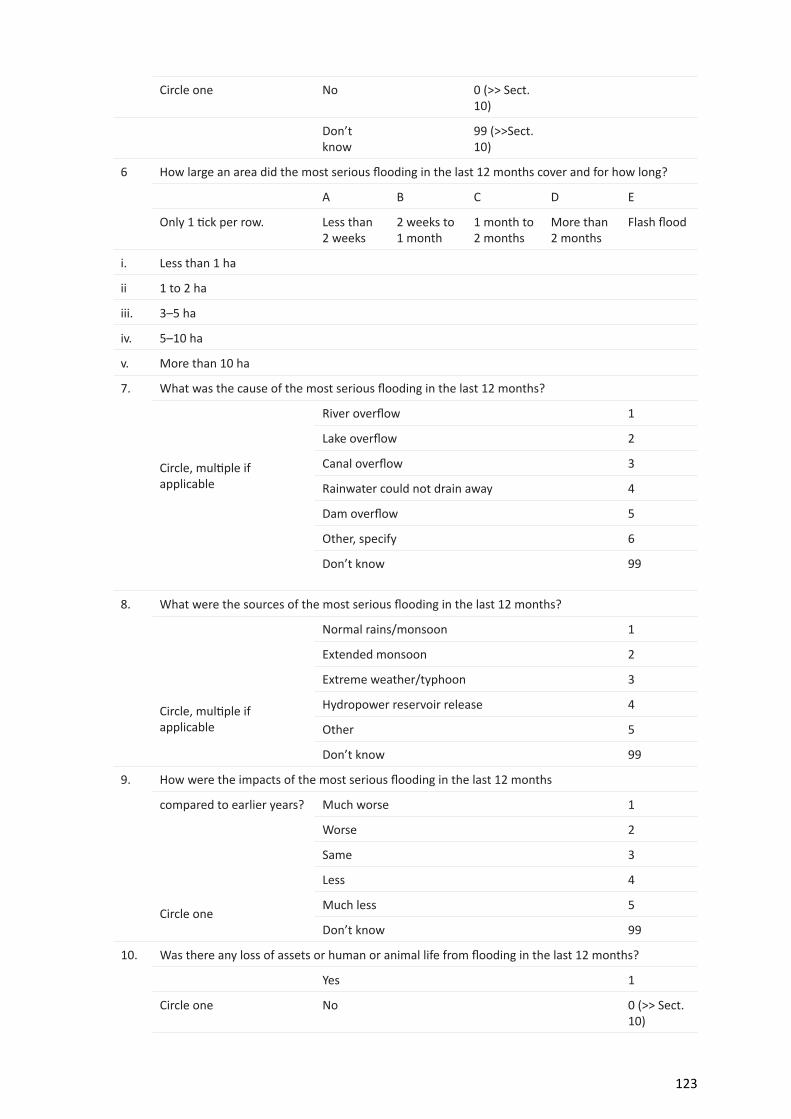
123
Circle one No 0 (>> Sect. 10)
Don’t know
99 (>>Sect. 10)
6 How large an area did the most serious flooding in the last 12 months cover and for how long?
A B C D E
Only 1 tick per row. Less than 2 weeks
2 weeks to 1 month
1 month to 2 months
More than 2 months
Flash flood
i. Less than 1 ha
ii 1 to 2 ha
iii. 3–5 ha
iv. 5–10 ha
v. More than 10 ha
7.
What was the cause of the most serious flooding in the last 12 months?
Circle, multiple if applicable
River overflow 1
Lake overflow 2
Canal overflow 3
Rainwater could not drain away 4
Dam overflow 5
Other, specify 6
Don’t know 99
8. What were the sources of the most serious flooding in the last 12 months?
Circle, multiple if applicable
Normal rains/monsoon 1
Extended monsoon 2
Extreme weather/typhoon 3
Hydropower reservoir release 4
Other 5
Don’t know 99
9. How were the impacts of the most serious flooding in the last 12 months
compared to earlier years?
Circle one
Much worse 1
Worse 2
Same 3
Less 4
Much less 5
Don’t know 99
10. Was there any loss of assets or human or animal life from flooding in the last 12 months?
Yes 1
Circle one No 0 (>> Sect. 10)
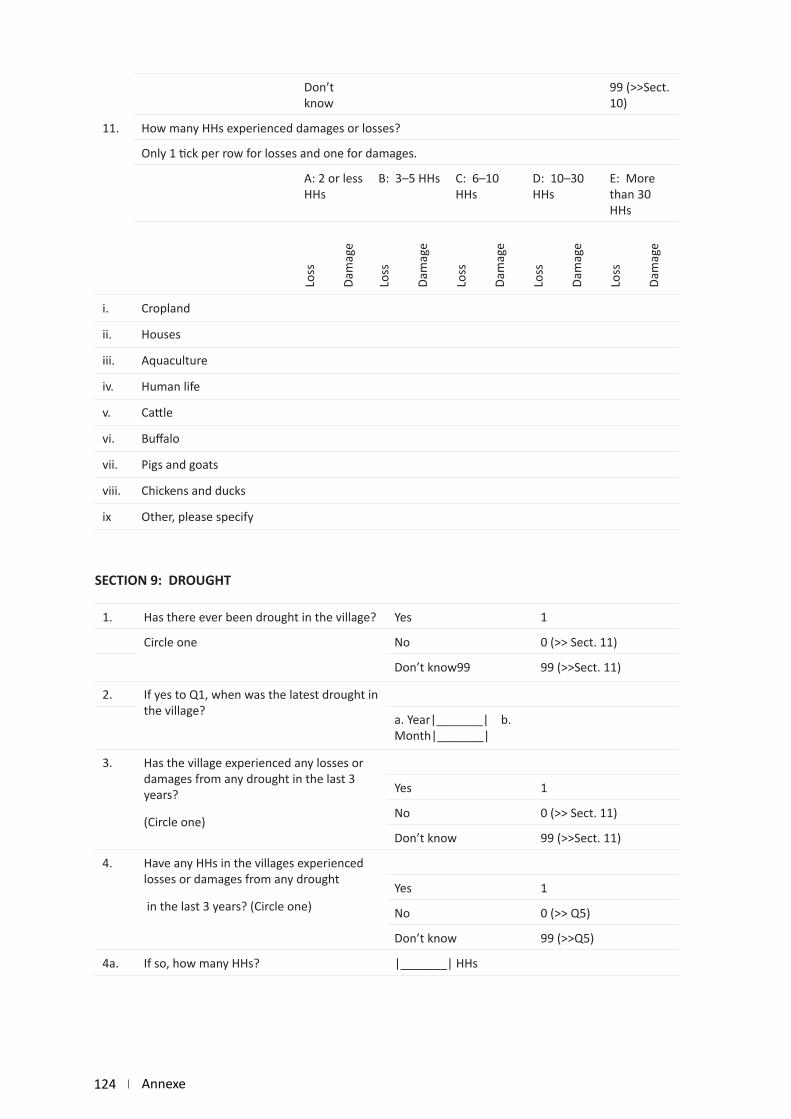
Annexe124
Don’t know
99 (>>Sect. 10)
11. How many HHs experienced damages or losses?
Only 1 tick per row for losses and one for damages.
A: 2 or less HHs
B: 3–5 HHs C: 6–10 HHs
D: 10–30 HHs
E: More than 30 HHs
Loss
Dam
age
Loss
Dam
age
Loss
Dam
age
Loss
Dam
age
Loss
Dam
age
i. Cropland
ii. Houses
iii. Aquaculture
iv. Human life
v. Cattle
vi. Buffalo
vii. Pigs and goats
viii. Chickens and ducks
ix Other, please specify
SECTION 9: DROUGHT
1. Has there ever been drought in the village? Yes 1
Circle one
No 0 (>> Sect. 11)
Don’t know99 99 (>>Sect. 11)
2. If yes to Q1, when was the latest drought in the village?
a. Year|_______| b. Month|_______|
3. Has the village experienced any losses or damages from any drought in the last 3 years?
(Circle one)
Yes 1
No 0 (>> Sect. 11)
Don’t know 99 (>>Sect. 11)
4. Have any HHs in the villages experienced losses or damages from any drought
in the last 3 years? (Circle one)
Yes 1
No 0 (>> Q5)
Don’t know 99 (>>Q5)
4a. If so, how many HHs? |_______| HHs
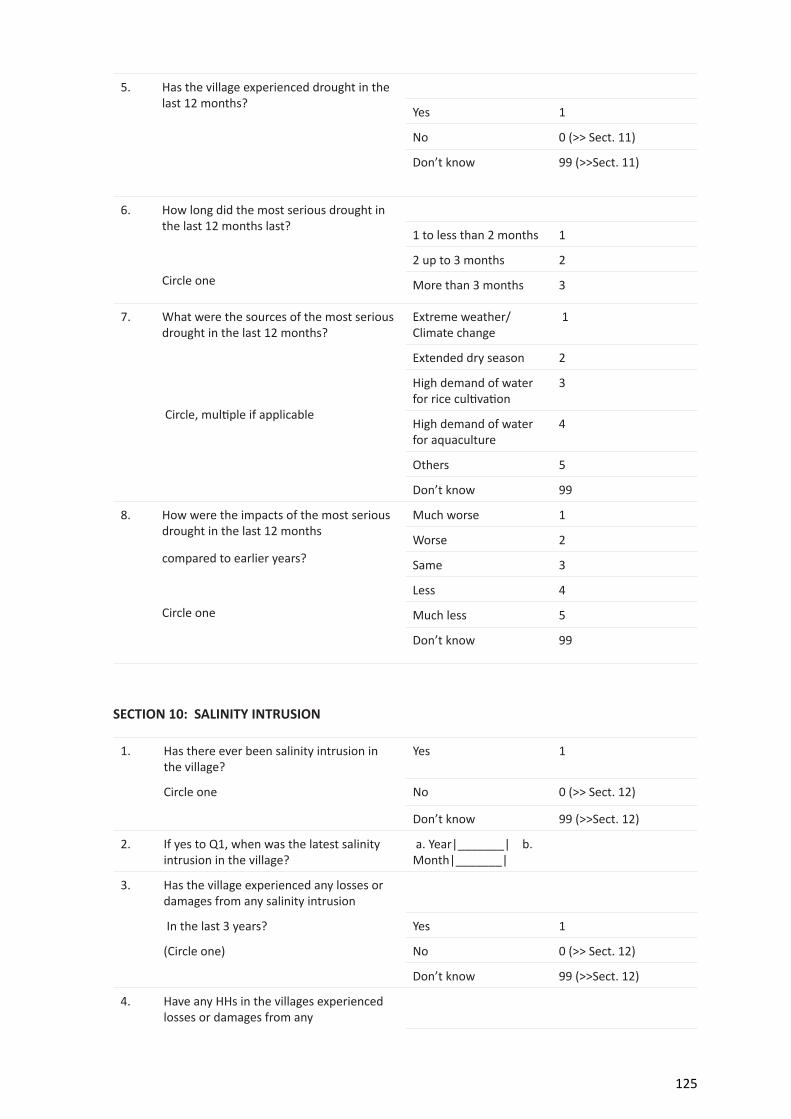
125
5.
Has the village experienced drought in the last 12 months?
Yes 1
No 0 (>> Sect. 11)
Don’t know 99 (>>Sect. 11)
6.
How long did the most serious drought in the last 12 months last?
Circle one
1 to less than 2 months 1
2 up to 3 months 2
More than 3 months 3
7.
What were the sources of the most serious drought in the last 12 months?
Circle, multiple if applicable
Extreme weather/Climate change
1
Extended dry season 2
High demand of water for rice cultivation
3
High demand of water for aquaculture
4
Others 5
Don’t know 99
8.
How were the impacts of the most serious drought in the last 12 months
compared to earlier years?
Circle one
Much worse 1
Worse 2
Same 3
Less 4
Much less 5
Don’t know 99
SECTION 10: SALINITY INTRUSION
1. Has there ever been salinity intrusion in the village?
Yes 1
Circle one No 0 (>> Sect. 12)
Don’t know 99 (>>Sect. 12)
2. If yes to Q1, when was the latest salinity intrusion in the village?
a. Year|_______| b. Month|_______|
3. Has the village experienced any losses or damages from any salinity intrusion
In the last 3 years? Yes 1
(Circle one) No 0 (>> Sect. 12)
Don’t know 99 (>>Sect. 12)
4. Have any HHs in the villages experienced losses or damages from any
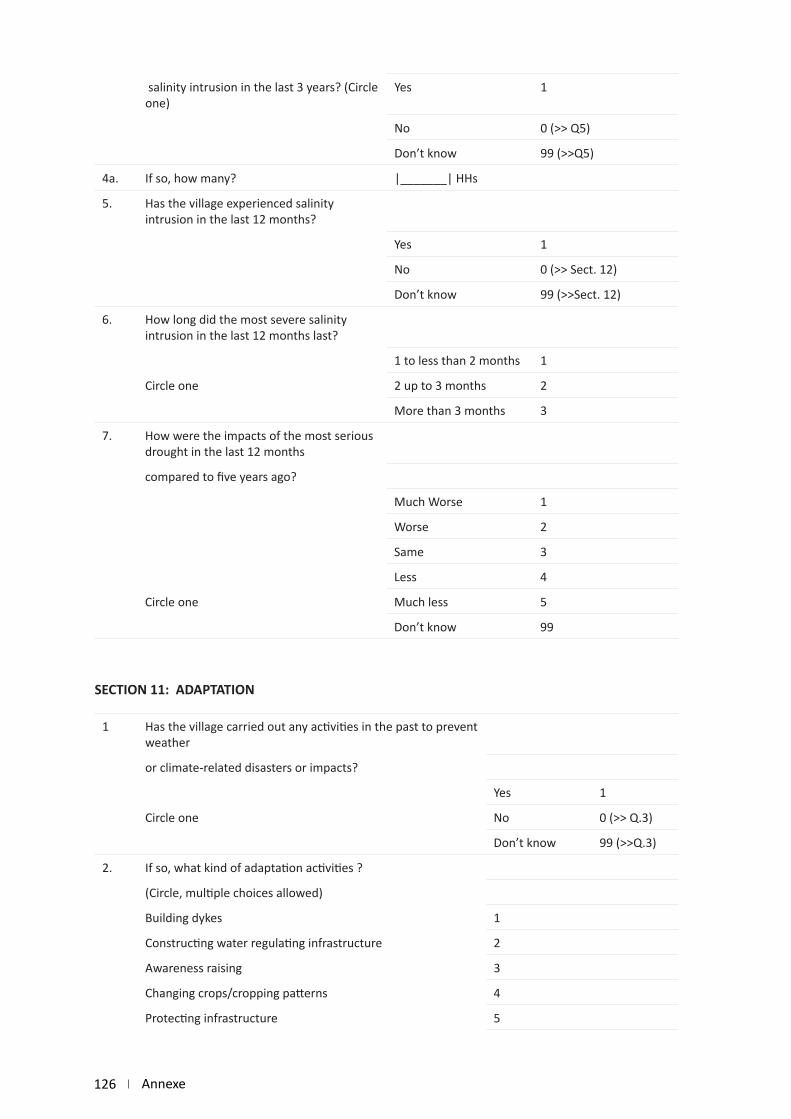
Annexe126
salinity intrusion in the last 3 years? (Circle one)
Yes 1
No 0 (>> Q5)
Don’t know 99 (>>Q5)
4a. If so, how many? |_______| HHs
5. Has the village experienced salinity intrusion in the last 12 months?
Yes 1
No 0 (>> Sect. 12)
Don’t know 99 (>>Sect. 12)
6. How long did the most severe salinity intrusion in the last 12 months last?
1 to less than 2 months 1
Circle one 2 up to 3 months 2
More than 3 months 3
7. How were the impacts of the most serious drought in the last 12 months
compared to five years ago?
Much Worse 1
Worse 2
Same 3
Less 4
Circle one Much less 5
Don’t know 99
SECTION 11: ADAPTATION
1 Has the village carried out any activities in the past to prevent weather
or climate-related disasters or impacts?
Yes 1
Circle one No 0 (>> Q.3)
Don’t know 99 (>>Q.3)
2. If so, what kind of adaptation activities ?
(Circle, multiple choices allowed)
Building dykes 1
Constructing water regulating infrastructure 2
Awareness raising 3
Changing crops/cropping patterns 4
Protecting infrastructure 5
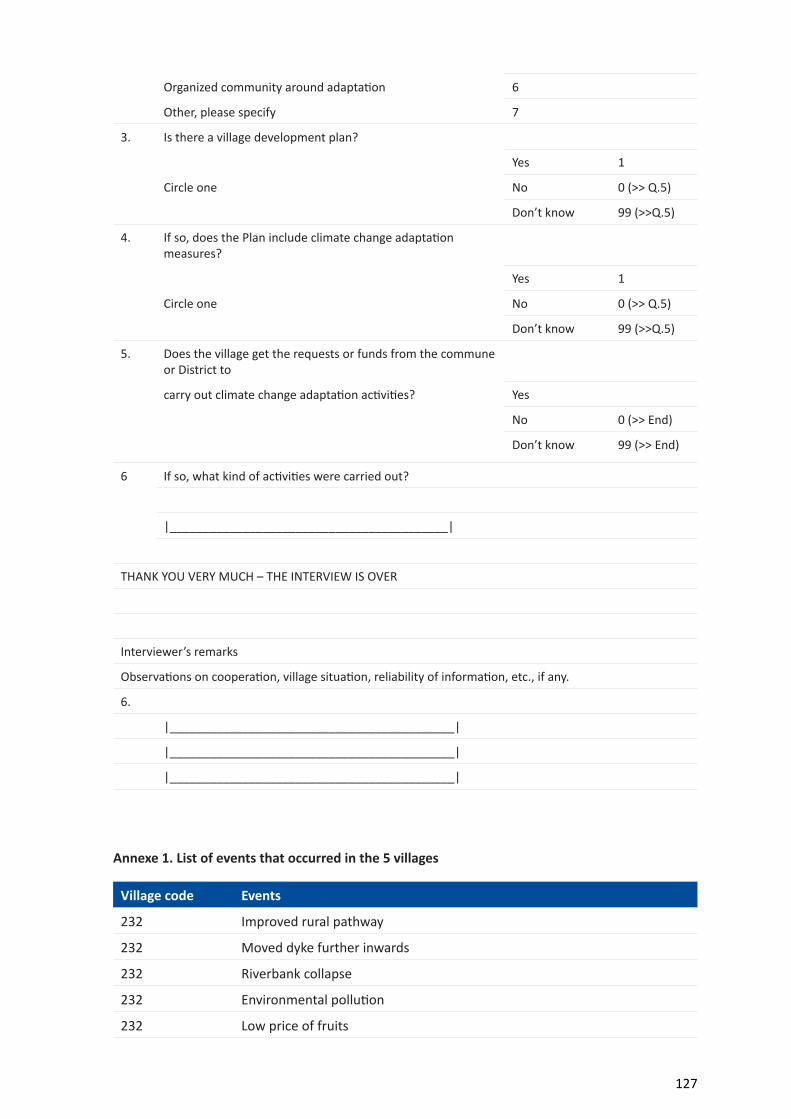
127
Organized community around adaptation 6
Other, please specify 7
3. Is there a village development plan?
Yes 1
Circle one No 0 (>> Q.5)
Don’t know 99 (>>Q.5)
4. If so, does the Plan include climate change adaptation measures?
Yes 1
Circle one No 0 (>> Q.5)
Don’t know 99 (>>Q.5)
5. Does the village get the requests or funds from the commune or District to
carry out climate change adaptation activities? Yes
No 0 (>> End)
Don’t know 99 (>> End)
6 If so, what kind of activities were carried out?
|__________________________________________|
THANK YOU VERY MUCH – THE INTERVIEW IS OVER
Interviewer’s remarks
Observations on cooperation, village situation, reliability of information, etc., if any.
6.
|___________________________________________|
|___________________________________________|
|___________________________________________|
Annexe 1. List of events that occurred in the 5 villages
Village code Events
232 Improved rural pathway
232 Moved dyke further inwards
232 Riverbank collapse
232 Environmental pollution
232 Low price of fruits
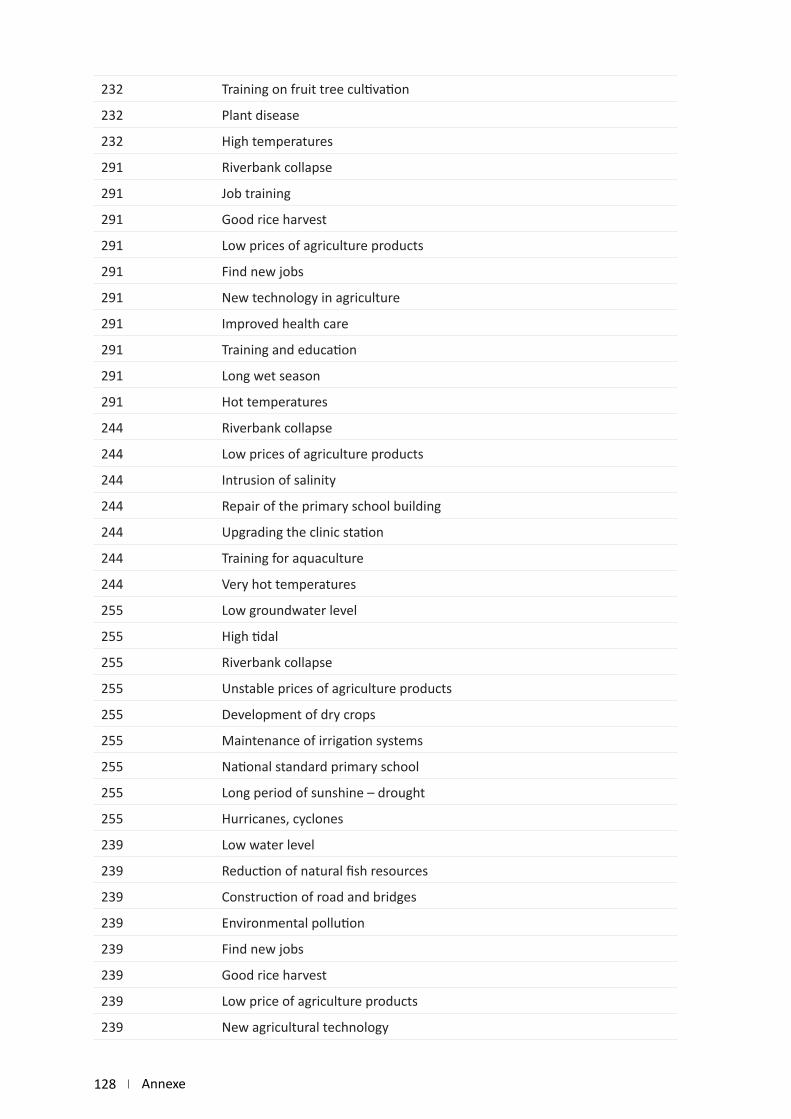
Annexe128
232 Training on fruit tree cultivation
232 Plant disease
232 High temperatures
291 Riverbank collapse
291 Job training
291 Good rice harvest
291 Low prices of agriculture products
291 Find new jobs
291 New technology in agriculture
291 Improved health care
291 Training and education
291 Long wet season
291 Hot temperatures
244 Riverbank collapse
244 Low prices of agriculture products
244 Intrusion of salinity
244 Repair of the primary school building
244 Upgrading the clinic station
244 Training for aquaculture
244 Very hot temperatures
255 Low groundwater level
255 High tidal
255 Riverbank collapse
255 Unstable prices of agriculture products
255 Development of dry crops
255 Maintenance of irrigation systems
255 National standard primary school
255 Long period of sunshine – drought
255 Hurricanes, cyclones
239 Low water level
239 Reduction of natural fish resources
239 Construction of road and bridges
239 Environmental pollution
239 Find new jobs
239 Good rice harvest
239 Low price of agriculture products
239 New agricultural technology
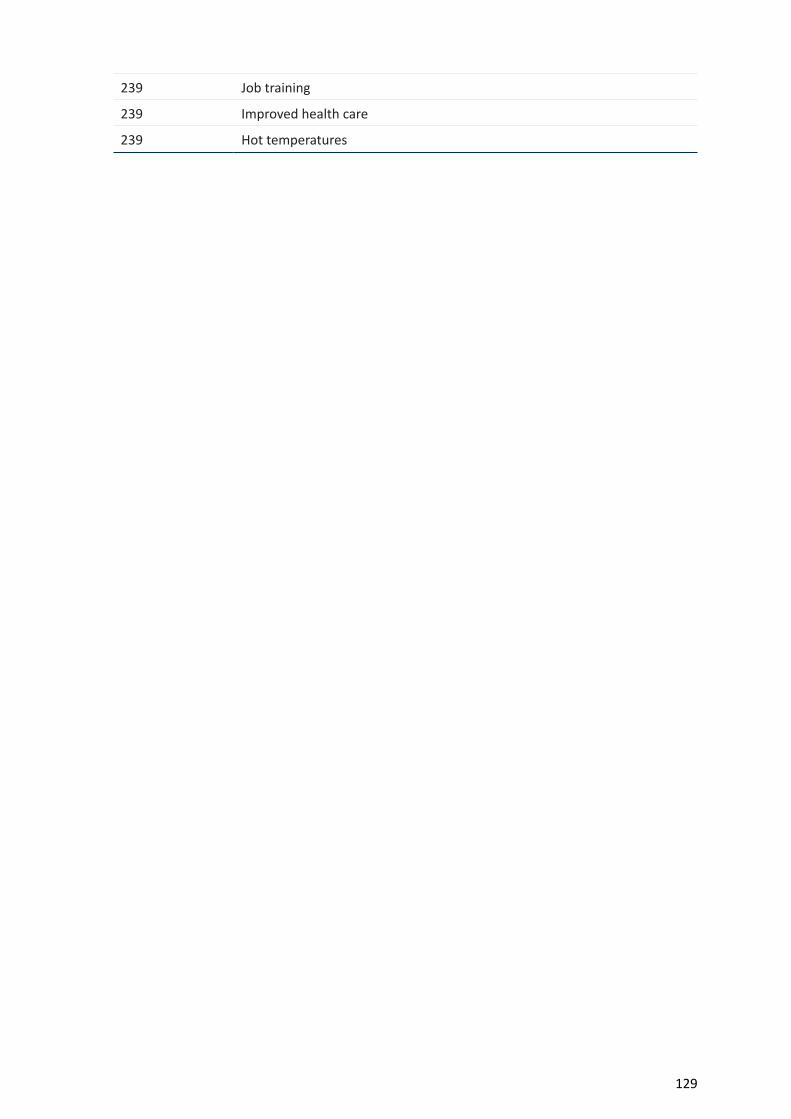
129
239 Job training
239 Improved health care
239 Hot temperatures
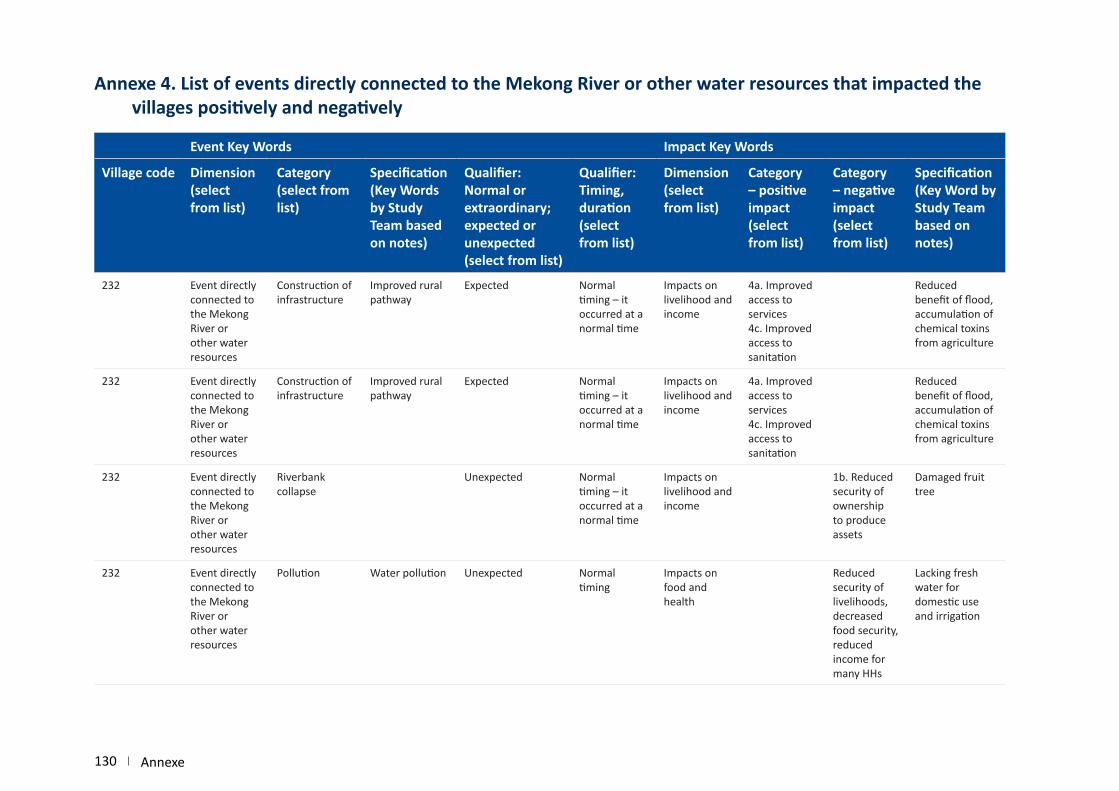
130 Annexe
Annexe 4. List of events directly connected to the Mekong River or other water resources that impacted the villages positively and negatively
Event Key Words Impact Key Words
Village code Dimension (select from list)
Category (select from list)
Specification (Key Words by Study Team based on notes)
Qualifier: Normal or extraordinary; expected or unexpected (select from list)
Qualifier: Timing, duration (select from list)
Dimension (select from list)
Category – positive impact (select from list)
Category – negative impact (select from list)
Specification (Key Word by Study Team based on notes)
232 Event directly connected to the Mekong River or other water resources
Construction of infrastructure
Improved rural pathway
Expected Normal timing – it occurred at a normal time
Impacts on livelihood and income
4a. Improved access to services 4c. Improved access to sanitation
Reduced benefit of flood, accumulation of chemical toxins from agriculture
232 Event directly connected to the Mekong River or other water resources
Riverbank collapse
Unexpected Normal timing – it occurred at a normal time
Impacts on livelihood and income
1b. Reduced security of ownership to produce assets
Damaged fruit tree
232 Event directly connected to the Mekong River or other water resources
Pollution Water pollution Unexpected Normal timing
Impacts on food and health
Reduced security of livelihoods, decreased food security, reduced income for many HHs
Lacking fresh water for domestic use and irrigation
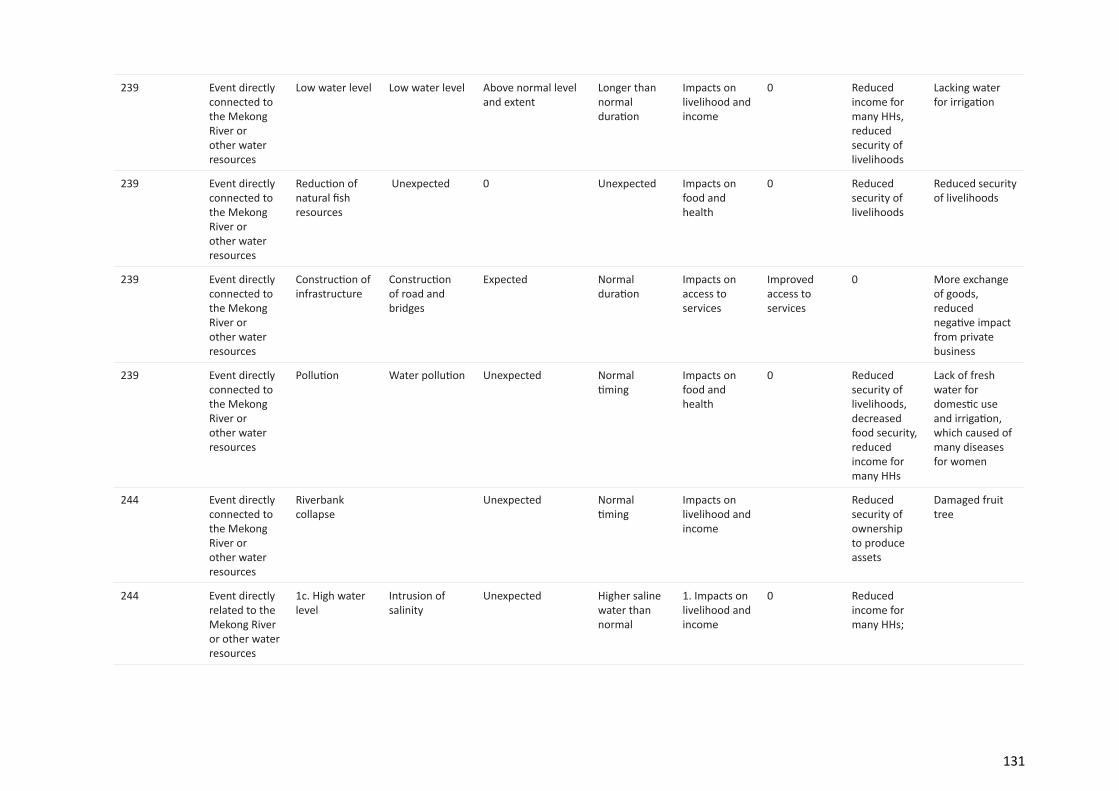
131
239 Event directly connected to the Mekong River or other water resources
Low water level Low water level Above normal level and extent
Longer than normal duration
Impacts on livelihood and income
0 Reduced income for many HHs, reduced security of livelihoods
Lacking water for irrigation
239 Event directly connected to the Mekong River or other water resources
Reduction of natural fish resources
Unexpected 0 Unexpected Impacts on food and health
0 Reduced security of livelihoods
Reduced security of livelihoods
239 Event directly connected to the Mekong River or other water resources
Construction of infrastructure
Construction of road and bridges
Expected Normal duration
Impacts on access to services
Improved access to services
0 More exchange of goods, reduced negative impact from private business
239 Event directly connected to the Mekong River or other water resources
Pollution Water pollution Unexpected Normal timing
Impacts on food and health
0 Reduced security of livelihoods, decreased food security, reduced income for many HHs
Lack of fresh water for domestic use and irrigation, which caused of many diseases for women
244 Event directly connected to the Mekong River or other water resources
Riverbank collapse
Unexpected Normal timing
Impacts on livelihood and income
Reduced security of ownership to produce assets
Damaged fruit tree
244 Event directly related to the Mekong River or other water resources
1c. High water level
Intrusion of salinity
Unexpected Higher saline water than normal
1. Impacts on livelihood and income
0 Reduced income for many HHs;
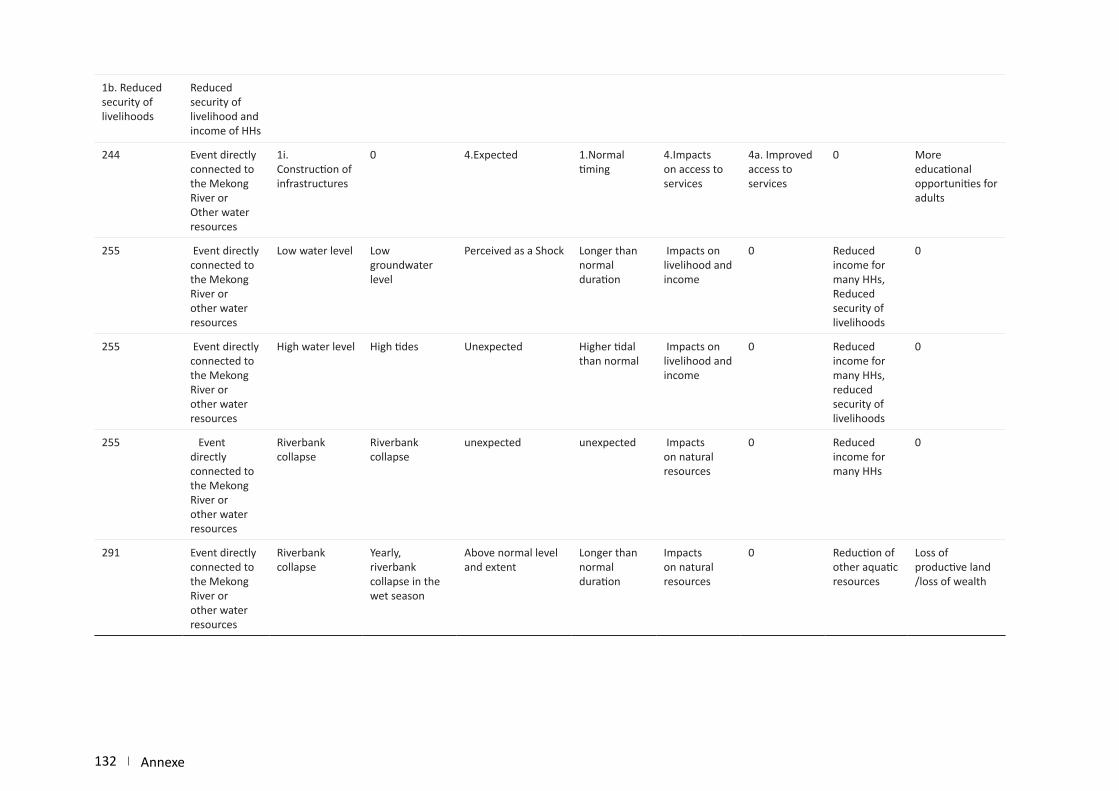
132 Annexe
1b. Reduced security of livelihoods
Reduced security of livelihood and income of HHs
244 Event directly connected to the Mekong River or Other water resources
1i. Construction of infrastructures
0 4.Expected 1.Normal timing
4.Impacts on access to services
4a. Improved access to services
0 More educational opportunities for adults
255 Event directly connected to the Mekong River or other water resources
Low water level Low groundwater level
Perceived as a Shock Longer than normal duration
Impacts on livelihood and income
0 Reduced income for many HHs, Reduced security of livelihoods
0
255 Event directly connected to the Mekong River or other water resources
High water level High tides Unexpected Higher tidal than normal
Impacts on livelihood and income
0 Reduced income for many HHs, reduced security of livelihoods
0
255 Event directly connected to the Mekong River or other water resources
Riverbank collapse
Riverbank collapse
unexpected unexpected Impacts on natural resources
0 Reduced income for many HHs
0
291 Event directly connected to the Mekong River or other water resources
Riverbank collapse
Yearly, riverbank collapse in the wet season
Above normal level and extent
Longer than normal duration
Impacts on natural resources
0 Reduction of other aquatic resources
Loss of productive land /loss of wealth
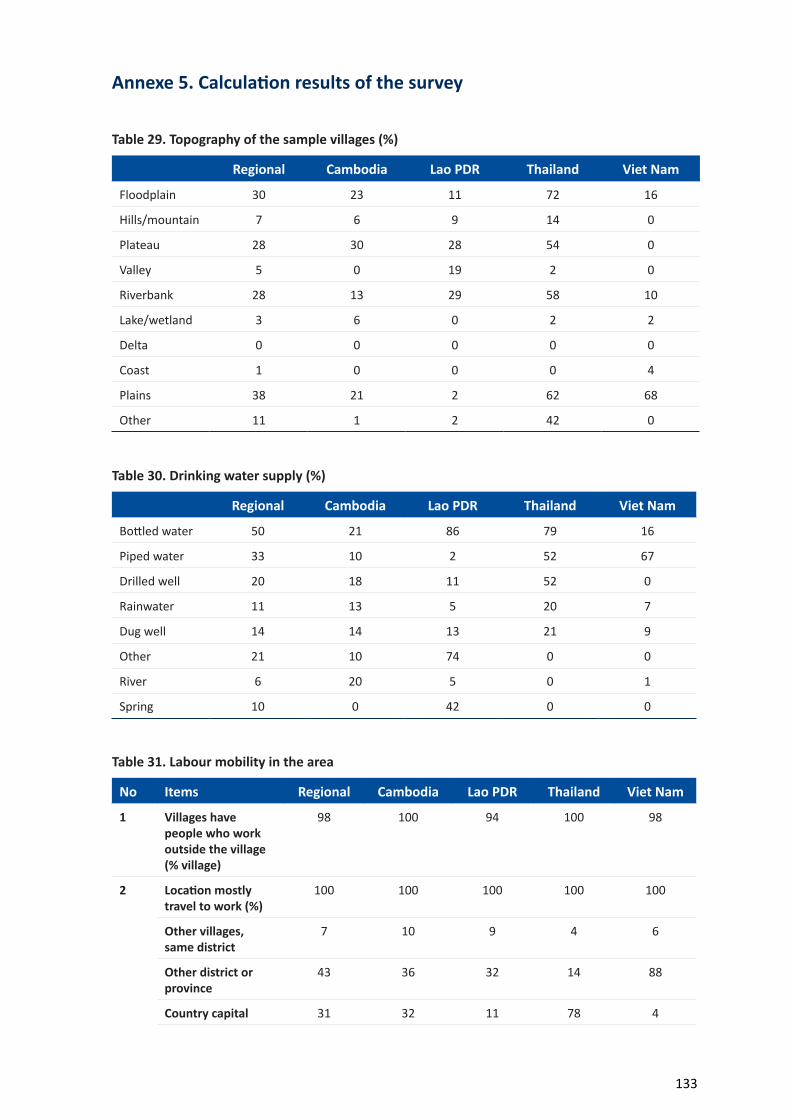
133
Annexe 5. Calculation results of the survey
Table 29. Topography of the sample villages (%)
Regional Cambodia Lao PDR Thailand Viet Nam
Floodplain 30 23 11 72 16
Hills/mountain 7 6 9 14 0
Plateau 28 30 28 54 0
Valley 5 0 19 2 0
Riverbank 28 13 29 58 10
Lake/wetland 3 6 0 2 2
Delta 0 0 0 0 0
Coast 1 0 0 0 4
Plains 38 21 2 62 68
Other 11 1 2 42 0
Table 30. Drinking water supply (%)
Regional Cambodia Lao PDR Thailand Viet Nam
Bottled water 50 21 86 79 16
Piped water 33 10 2 52 67
Drilled well 20 18 11 52 0
Rainwater 11 13 5 20 7
Dug well 14 14 13 21 9
Other 21 10 74 0 0
River 6 20 5 0 1
Spring 10 0 42 0 0
Table 31. Labour mobility in the area
No Items Regional Cambodia Lao PDR Thailand Viet Nam
1 Villages have people who work outside the village (% village)
98 100 94 100 98
2 Location mostly travel to work (%)
100 100 100 100 100
Other villages, same district
7 10 9 4 6
Other district or province
43 36 32 14 88
Country capital 31 32 11 78 4
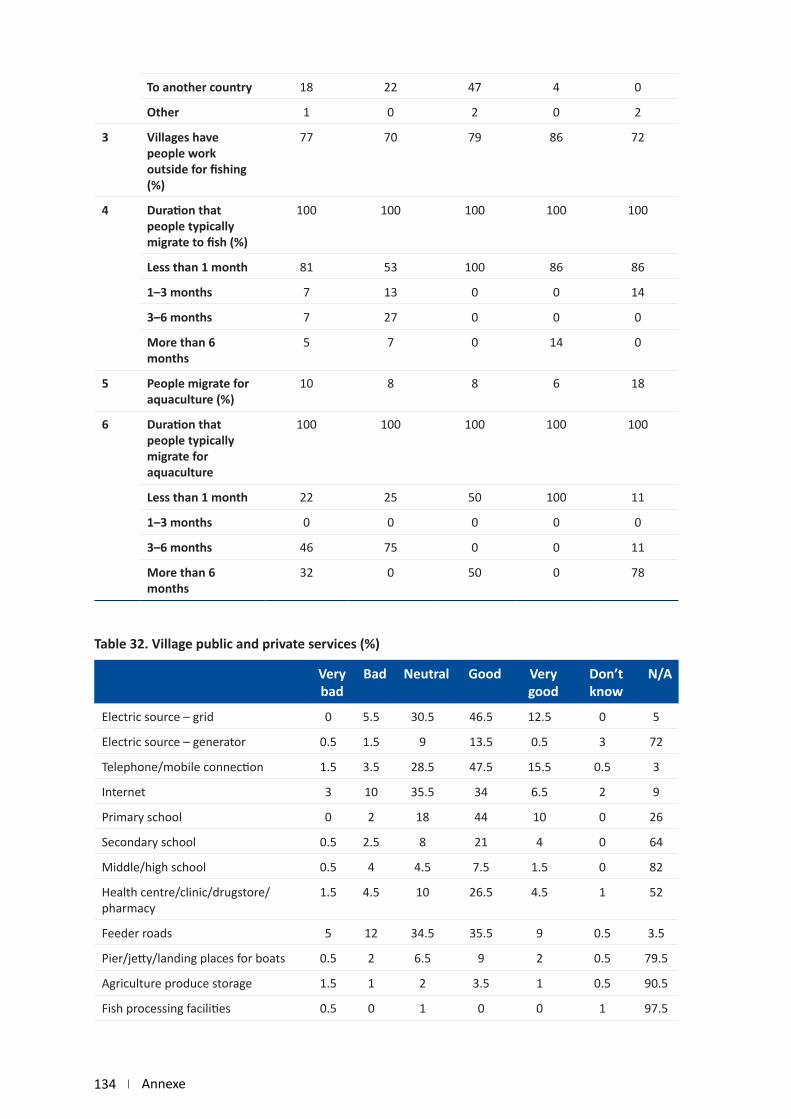
Annexe134
To another country 18 22 47 4 0
Other 1 0 2 0 2
3 Villages have people work outside for fishing (%)
77 70 79 86 72
4 Duration that people typically migrate to fish (%)
100 100 100 100 100
Less than 1 month 81 53 100 86 86
1–3 months 7 13 0 0 14
3–6 months 7 27 0 0 0
More than 6 months
5 7 0 14 0
5 People migrate for aquaculture (%)
10 8 8 6 18
6 Duration that people typically migrate for aquaculture
100 100 100 100 100
Less than 1 month 22 25 50 100 11
1–3 months 0 0 0 0 0
3–6 months 46 75 0 0 11
More than 6 months
32 0 50 0 78
Table 32. Village public and private services (%)
Very bad
Bad Neutral Good Very good
Don’t know
N/A
Electric source – grid 0 5.5 30.5 46.5 12.5 0 5
Electric source – generator 0.5 1.5 9 13.5 0.5 3 72
Telephone/mobile connection 1.5 3.5 28.5 47.5 15.5 0.5 3
Internet 3 10 35.5 34 6.5 2 9
Primary school 0 2 18 44 10 0 26
Secondary school 0.5 2.5 8 21 4 0 64
Middle/high school 0.5 4 4.5 7.5 1.5 0 82
Health centre/clinic/drugstore/pharmacy
1.5 4.5 10 26.5 4.5 1 52
Feeder roads 5 12 34.5 35.5 9 0.5 3.5
Pier/jetty/landing places for boats 0.5 2 6.5 9 2 0.5 79.5
Agriculture produce storage 1.5 1 2 3.5 1 0.5 90.5
Fish processing facilities 0.5 0 1 0 0 1 97.5
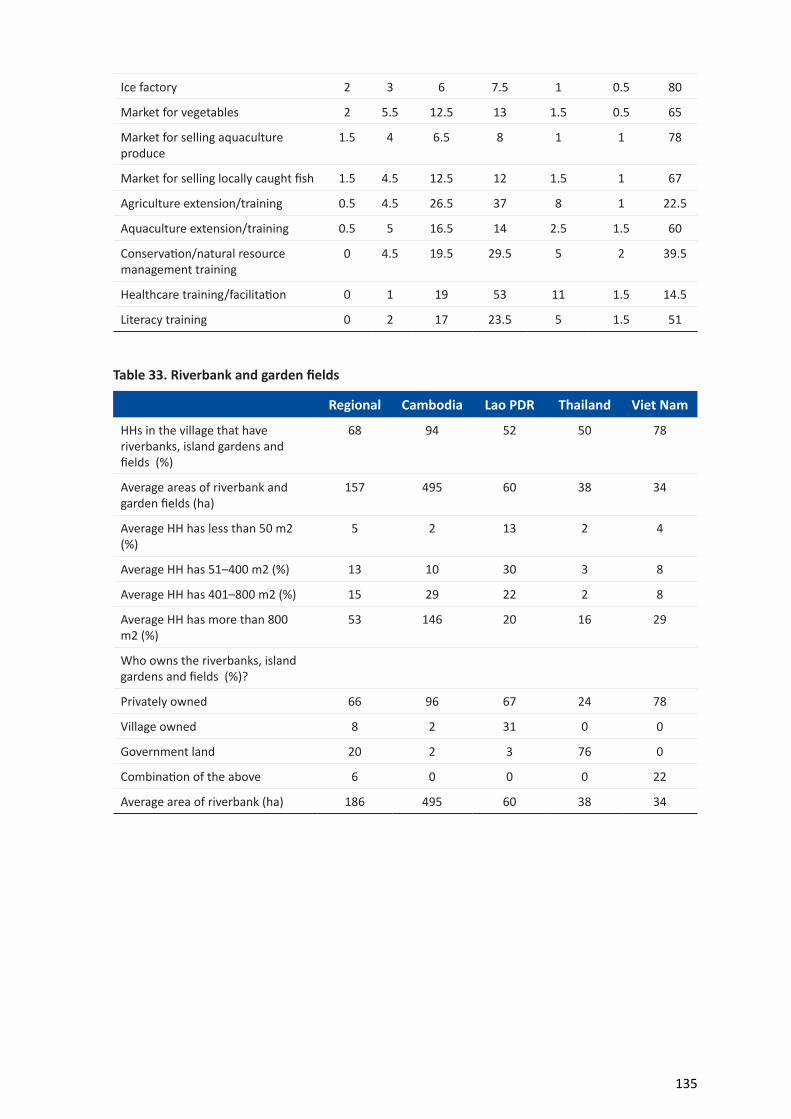
135
Ice factory 2 3 6 7.5 1 0.5 80
Market for vegetables 2 5.5 12.5 13 1.5 0.5 65
Market for selling aquaculture produce
1.5 4 6.5 8 1 1 78
Market for selling locally caught fish 1.5 4.5 12.5 12 1.5 1 67
Agriculture extension/training 0.5 4.5 26.5 37 8 1 22.5
Aquaculture extension/training 0.5 5 16.5 14 2.5 1.5 60
Conservation/natural resource management training
0 4.5 19.5 29.5 5 2 39.5
Healthcare training/facilitation 0 1 19 53 11 1.5 14.5
Literacy training 0 2 17 23.5 5 1.5 51
Table 33. Riverbank and garden fields
Regional Cambodia Lao PDR Thailand Viet Nam
HHs in the village that have riverbanks, island gardens and fields (%)
68 94 52 50 78
Average areas of riverbank and garden fields (ha)
157 495 60 38 34
Average HH has less than 50 m2 (%)
5 2 13 2 4
Average HH has 51–400 m2 (%) 13 10 30 3 8
Average HH has 401–800 m2 (%) 15 29 22 2 8
Average HH has more than 800 m2 (%)
53 146 20 16 29
Who owns the riverbanks, island gardens and fields (%)?
Privately owned 66 96 67 24 78
Village owned 8 2 31 0 0
Government land 20 2 3 76 0
Combination of the above 6 0 0 0 22
Average area of riverbank (ha) 186 495 60 38 34
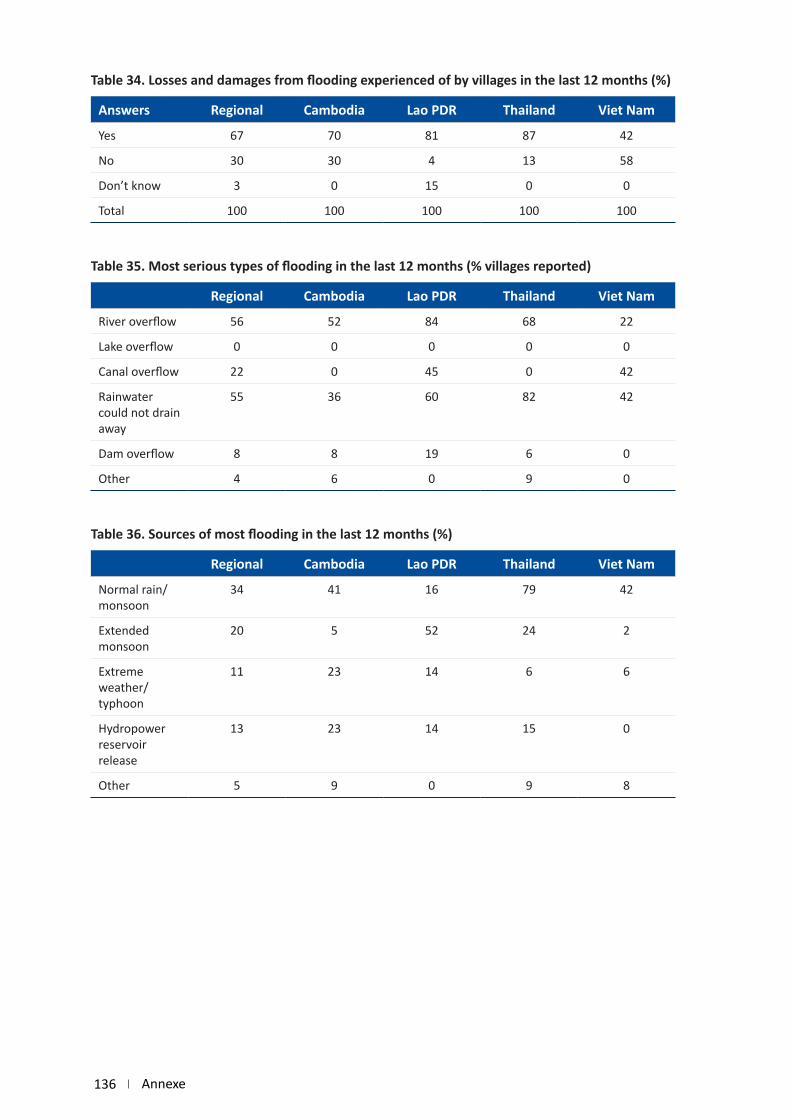
Annexe136
Table 34. Losses and damages from flooding experienced of by villages in the last 12 months (%)
Answers Regional Cambodia Lao PDR Thailand Viet Nam
Yes 67 70 81 87 42
No 30 30 4 13 58
Don’t know 3 0 15 0 0
Total 100 100 100 100 100
Table 35. Most serious types of flooding in the last 12 months (% villages reported)
Regional Cambodia Lao PDR Thailand Viet Nam
River overflow 56 52 84 68 22
Lake overflow 0 0 0 0 0
Canal overflow 22 0 45 0 42
Rainwater could not drain away
55 36 60 82 42
Dam overflow 8 8 19 6 0
Other 4 6 0 9 0
Table 36. Sources of most flooding in the last 12 months (%)
Regional Cambodia Lao PDR Thailand Viet Nam
Normal rain/monsoon
34 41 16 79 42
Extended monsoon
20 5 52 24 2
Extreme weather/typhoon
11 23 14 6 6
Hydropower reservoir release
13 23 14 15 0
Other 5 9 0 9 8
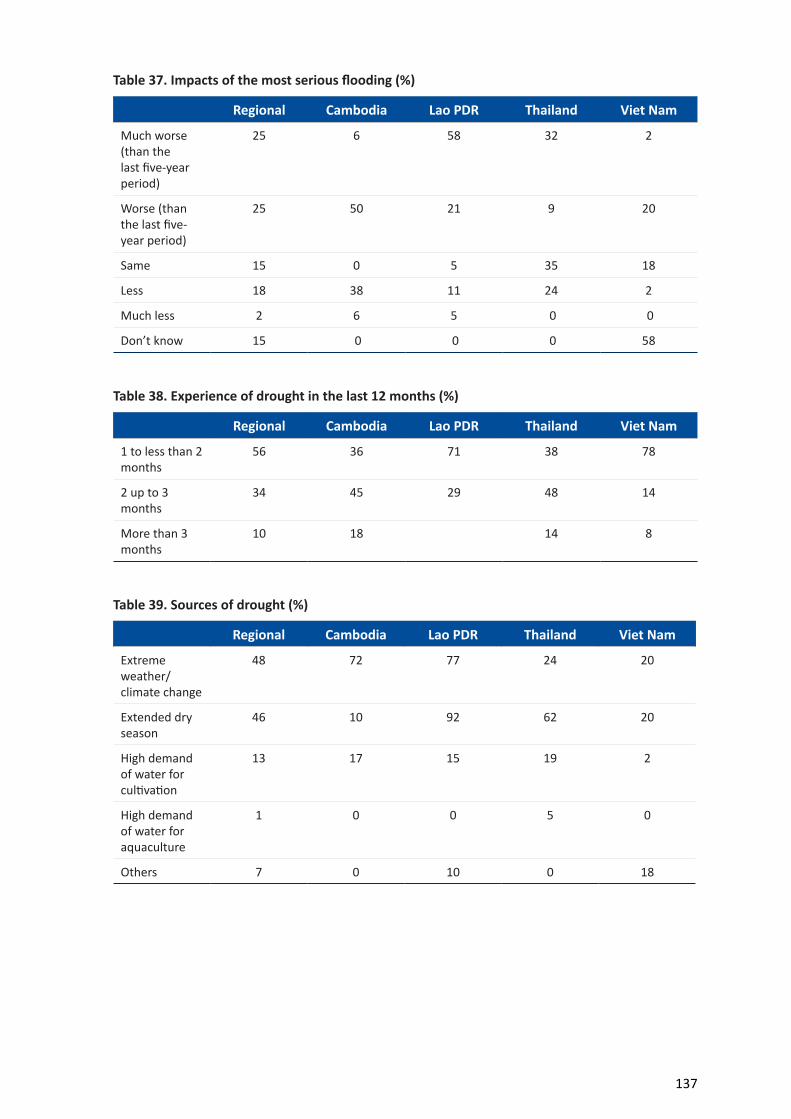
137
Table 37. Impacts of the most serious flooding (%)
Regional Cambodia Lao PDR Thailand Viet Nam
Much worse (than the last five-year period)
25 6 58 32 2
Worse (than the last five-year period)
25 50 21 9 20
Same 15 0 5 35 18
Less 18 38 11 24 2
Much less 2 6 5 0 0
Don’t know 15 0 0 0 58
Table 38. Experience of drought in the last 12 months (%)
Regional Cambodia Lao PDR Thailand Viet Nam
1 to less than 2 months
56 36 71 38 78
2 up to 3 months
34 45 29 48 14
More than 3 months
10 18 14 8
Table 39. Sources of drought (%)
Regional Cambodia Lao PDR Thailand Viet Nam
Extreme weather/climate change
48 72 77 24 20
Extended dry season
46 10 92 62 20
High demand of water for cultivation
13 17 15 19 2
High demand of water for aquaculture
1 0 0 5 0
Others 7 0 10 0 18
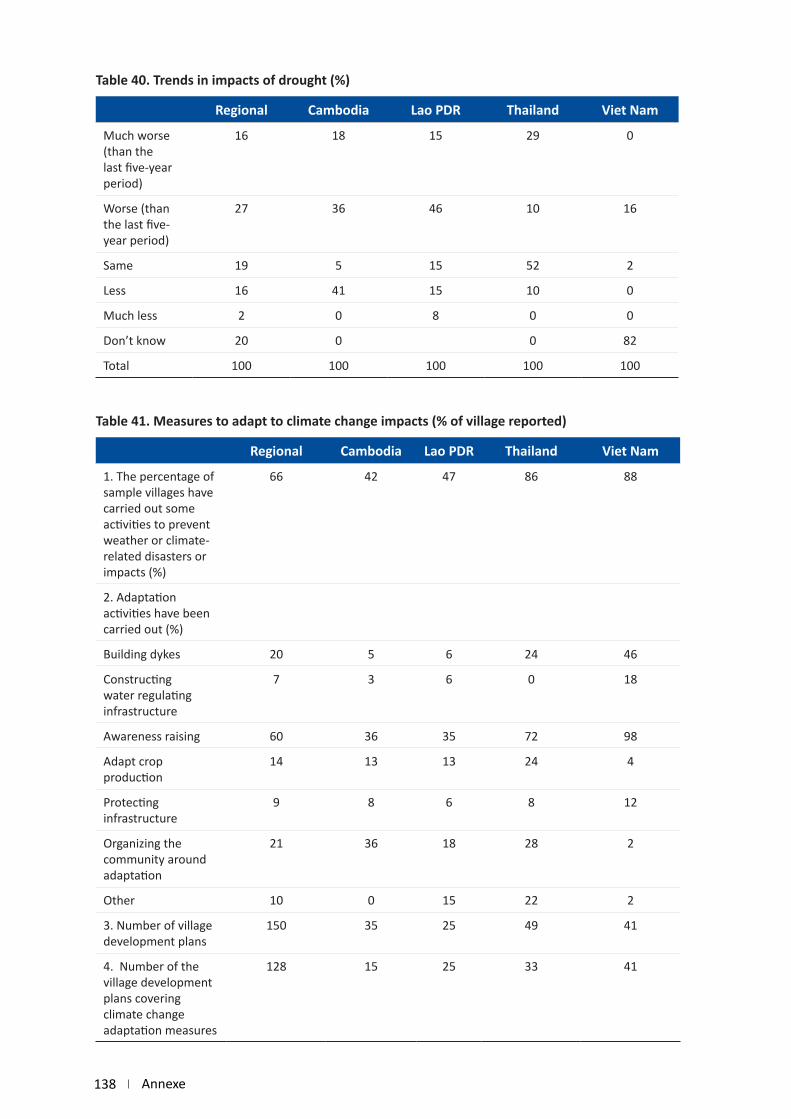
Annexe138
Table 40. Trends in impacts of drought (%)
Regional Cambodia Lao PDR Thailand Viet Nam
Much worse (than the last five-year period)
16 18 15 29 0
Worse (than the last five- year period)
27 36 46 10 16
Same 19 5 15 52 2
Less 16 41 15 10 0
Much less 2 0 8 0 0
Don’t know 20 0 0 82
Total 100 100 100 100 100
Table 41. Measures to adapt to climate change impacts (% of village reported)
Regional Cambodia Lao PDR Thailand Viet Nam
1. The percentage of sample villages have carried out some activities to prevent weather or climate-related disasters or impacts (%)
66 42 47 86 88
2. Adaptation activities have been carried out (%)
Building dykes 20 5 6 24 46
Constructing water regulating infrastructure
7 3 6 0 18
Awareness raising 60 36 35 72 98
Adapt crop production
14 13 13 24 4
Protecting infrastructure
9 8 6 8 12
Organizing the community around adaptation
21 36 18 28 2
Other 10 0 15 22 2
3. Number of village development plans
150 35 25 49 41
4. Number of the village development plans covering climate change adaptation measures
128 15 25 33 41
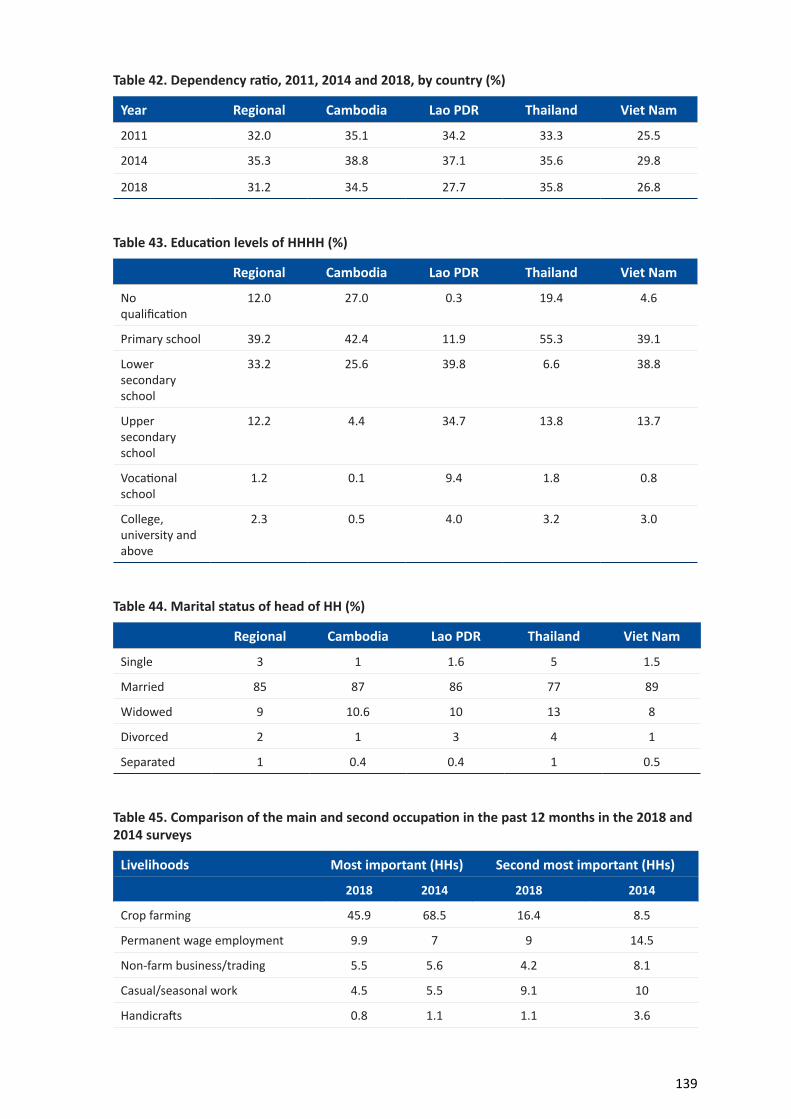
139
Table 42. Dependency ratio, 2011, 2014 and 2018, by country (%)
Year Regional Cambodia Lao PDR Thailand Viet Nam
2011 32.0 35.1 34.2 33.3 25.5
2014 35.3 38.8 37.1 35.6 29.8
2018 31.2 34.5 27.7 35.8 26.8
Table 43. Education levels of HHHH (%)
Regional Cambodia Lao PDR Thailand Viet Nam
No qualification
12.0 27.0 0.3 19.4 4.6
Primary school 39.2 42.4 11.9 55.3 39.1
Lower secondary school
33.2 25.6 39.8 6.6 38.8
Upper secondary school
12.2 4.4 34.7 13.8 13.7
Vocational school
1.2 0.1 9.4 1.8 0.8
College, university and above
2.3 0.5 4.0 3.2 3.0
Table 44. Marital status of head of HH (%)
Regional Cambodia Lao PDR Thailand Viet Nam
Single 3 1 1.6 5 1.5
Married 85 87 86 77 89
Widowed 9 10.6 10 13 8
Divorced 2 1 3 4 1
Separated 1 0.4 0.4 1 0.5
Table 45. Comparison of the main and second occupation in the past 12 months in the 2018 and 2014 surveys
Livelihoods Most important (HHs) Second most important (HHs)
2018 2014 2018 2014
Crop farming 45.9 68.5 16.4 8.5
Permanent wage employment 9.9 7 9 14.5
Non-farm business/trading 5.5 5.6 4.2 8.1
Casual/seasonal work 4.5 5.5 9.1 10
Handicrafts 0.8 1.1 1.1 3.6
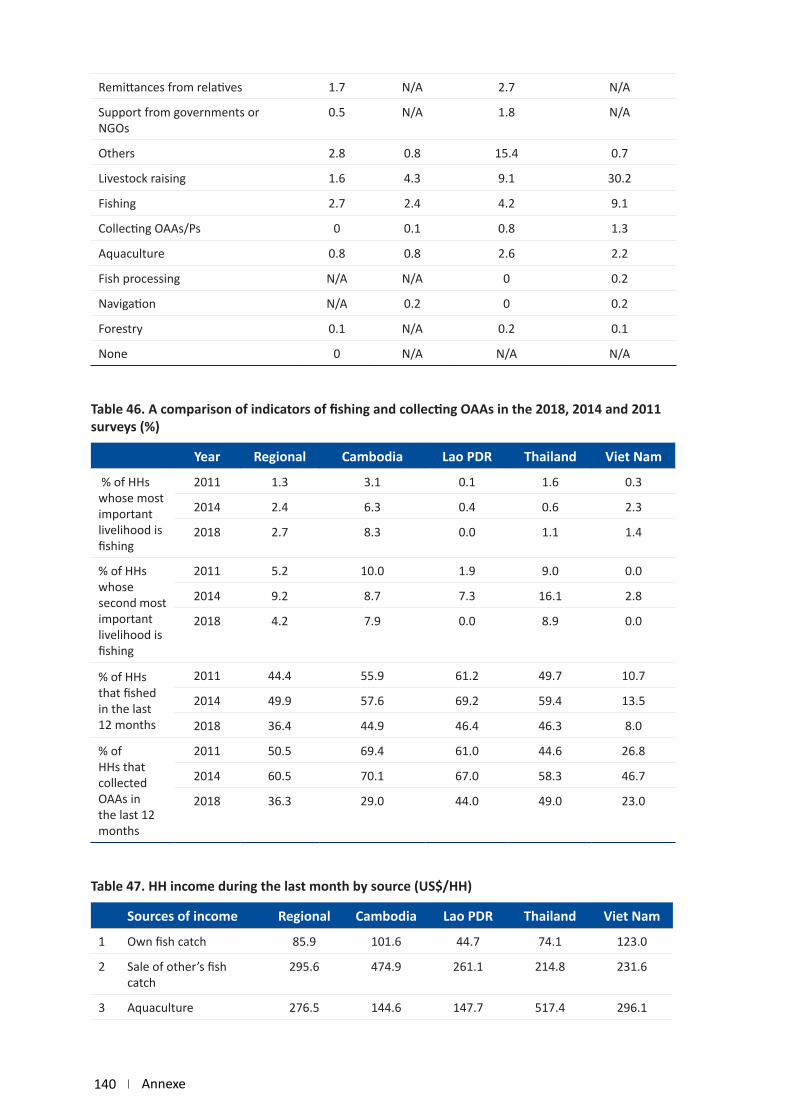
Annexe140
Remittances from relatives 1.7 N/A 2.7 N/A
Support from governments or NGOs
0.5 N/A 1.8 N/A
Others 2.8 0.8 15.4 0.7
Livestock raising 1.6 4.3 9.1 30.2
Fishing 2.7 2.4 4.2 9.1
Collecting OAAs/Ps 0 0.1 0.8 1.3
Aquaculture 0.8 0.8 2.6 2.2
Fish processing N/A N/A 0 0.2
Navigation N/A 0.2 0 0.2
Forestry 0.1 N/A 0.2 0.1
None 0 N/A N/A N/A
Table 46. A comparison of indicators of fishing and collecting OAAs in the 2018, 2014 and 2011 surveys (%)
Year Regional Cambodia Lao PDR Thailand Viet Nam
% of HHs whose most important livelihood is fishing
2011 1.3 3.1 0.1 1.6 0.3
2014 2.4 6.3 0.4 0.6 2.3
2018 2.7 8.3 0.0 1.1 1.4
% of HHs whose second most important livelihood is fishing
2011 5.2 10.0 1.9 9.0 0.0
2014 9.2 8.7 7.3 16.1 2.8
2018 4.2 7.9 0.0 8.9 0.0
% of HHs that fished in the last 12 months
2011 44.4 55.9 61.2 49.7 10.7
2014 49.9 57.6 69.2 59.4 13.5
2018 36.4 44.9 46.4 46.3 8.0
% of HHs that collected OAAs in the last 12 months
2011 50.5 69.4 61.0 44.6 26.8
2014 60.5 70.1 67.0 58.3 46.7
2018 36.3 29.0 44.0 49.0 23.0
Table 47. HH income during the last month by source (US$/HH)
Sources of income Regional Cambodia Lao PDR Thailand Viet Nam
1 Own fish catch 85.9 101.6 44.7 74.1 123.0
2 Sale of other’s fish catch
295.6 474.9 261.1 214.8 231.6
3 Aquaculture 276.5 144.6 147.7 517.4 296.1
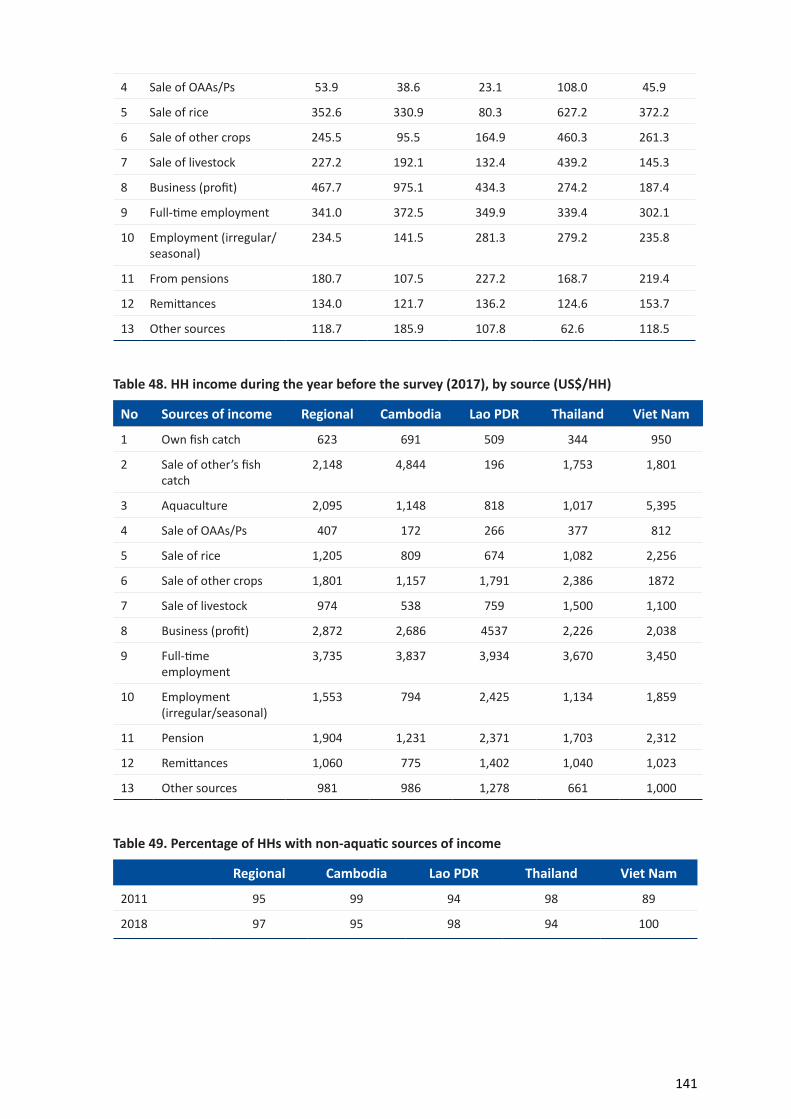
141
4 Sale of OAAs/Ps 53.9 38.6 23.1 108.0 45.9
5 Sale of rice 352.6 330.9 80.3 627.2 372.2
6 Sale of other crops 245.5 95.5 164.9 460.3 261.3
7 Sale of livestock 227.2 192.1 132.4 439.2 145.3
8 Business (profit) 467.7 975.1 434.3 274.2 187.4
9 Full-time employment 341.0 372.5 349.9 339.4 302.1
10 Employment (irregular/seasonal)
234.5 141.5 281.3 279.2 235.8
11 From pensions 180.7 107.5 227.2 168.7 219.4
12 Remittances 134.0 121.7 136.2 124.6 153.7
13 Other sources 118.7 185.9 107.8 62.6 118.5
Table 48. HH income during the year before the survey (2017), by source (US$/HH)
No Sources of income Regional Cambodia Lao PDR Thailand Viet Nam
1 Own fish catch 623 691 509 344 950
2 Sale of other’s fish catch
2,148 4,844 196 1,753 1,801
3 Aquaculture 2,095 1,148 818 1,017 5,395
4 Sale of OAAs/Ps 407 172 266 377 812
5 Sale of rice 1,205 809 674 1,082 2,256
6 Sale of other crops 1,801 1,157 1,791 2,386 1872
7 Sale of livestock 974 538 759 1,500 1,100
8 Business (profit) 2,872 2,686 4537 2,226 2,038
9 Full-time employment
3,735 3,837 3,934 3,670 3,450
10 Employment (irregular/seasonal)
1,553 794 2,425 1,134 1,859
11 Pension 1,904 1,231 2,371 1,703 2,312
12 Remittances 1,060 775 1,402 1,040 1,023
13 Other sources 981 986 1,278 661 1,000
Table 49. Percentage of HHs with non-aquatic sources of income
Regional Cambodia Lao PDR Thailand Viet Nam
2011 95 99 94 98 89
2018 97 95 98 94 100
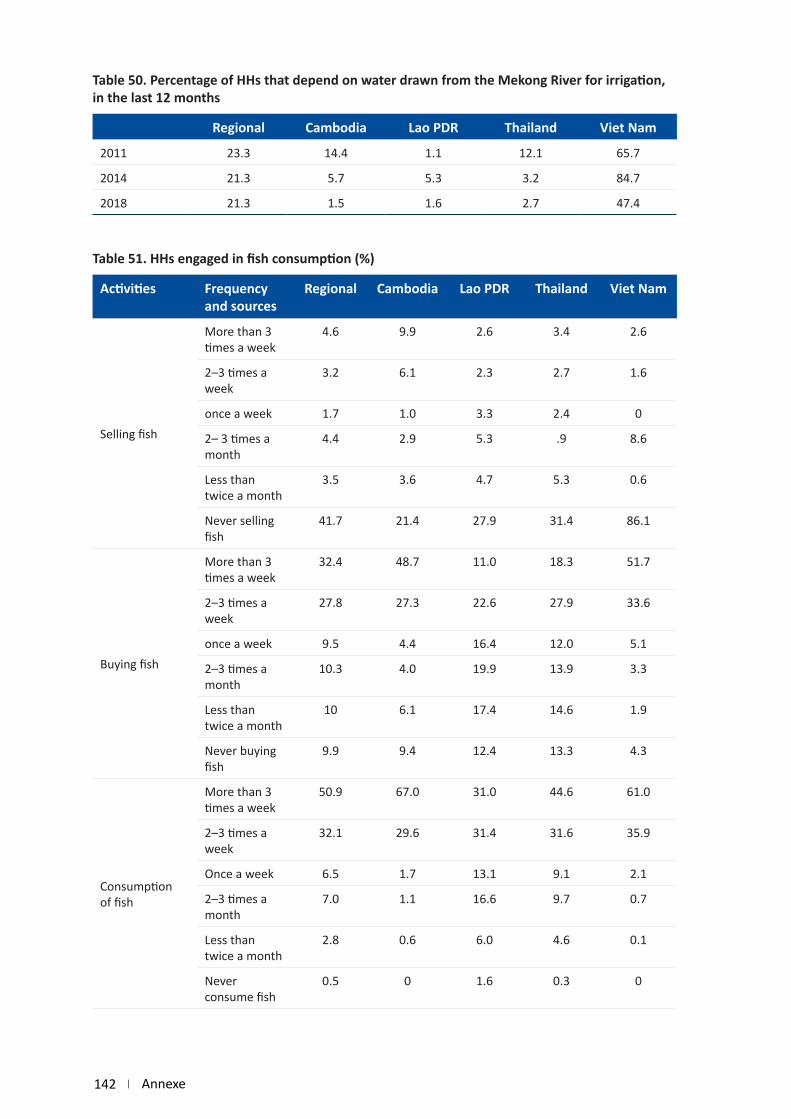
Annexe142
Table 50. Percentage of HHs that depend on water drawn from the Mekong River for irrigation, in the last 12 months
Regional Cambodia Lao PDR Thailand Viet Nam
2011 23.3 14.4 1.1 12.1 65.7
2014 21.3 5.7 5.3 3.2 84.7
2018 21.3 1.5 1.6 2.7 47.4
Table 51. HHs engaged in fish consumption (%)
Activities Frequency and sources
Regional Cambodia Lao PDR Thailand Viet Nam
Selling fish
More than 3 times a week
4.6 9.9 2.6 3.4 2.6
2–3 times a week
3.2 6.1 2.3 2.7 1.6
once a week 1.7 1.0 3.3 2.4 0
2– 3 times a month
4.4 2.9 5.3 .9 8.6
Less than twice a month
3.5 3.6 4.7 5.3 0.6
Never selling fish
41.7 21.4 27.9 31.4 86.1
Buying fish
More than 3 times a week
32.4 48.7 11.0 18.3 51.7
2–3 times a week
27.8 27.3 22.6 27.9 33.6
once a week 9.5 4.4 16.4 12.0 5.1
2–3 times a month
10.3 4.0 19.9 13.9 3.3
Less than twice a month
10 6.1 17.4 14.6 1.9
Never buying fish
9.9 9.4 12.4 13.3 4.3
Consumption of fish
More than 3 times a week
50.9 67.0 31.0 44.6 61.0
2–3 times a week
32.1 29.6 31.4 31.6 35.9
Once a week 6.5 1.7 13.1 9.1 2.1
2–3 times a month
7.0 1.1 16.6 9.7 0.7
Less than twice a month
2.8 0.6 6.0 4.6 0.1
Never consume fish
0.5 0 1.6 0.3 0
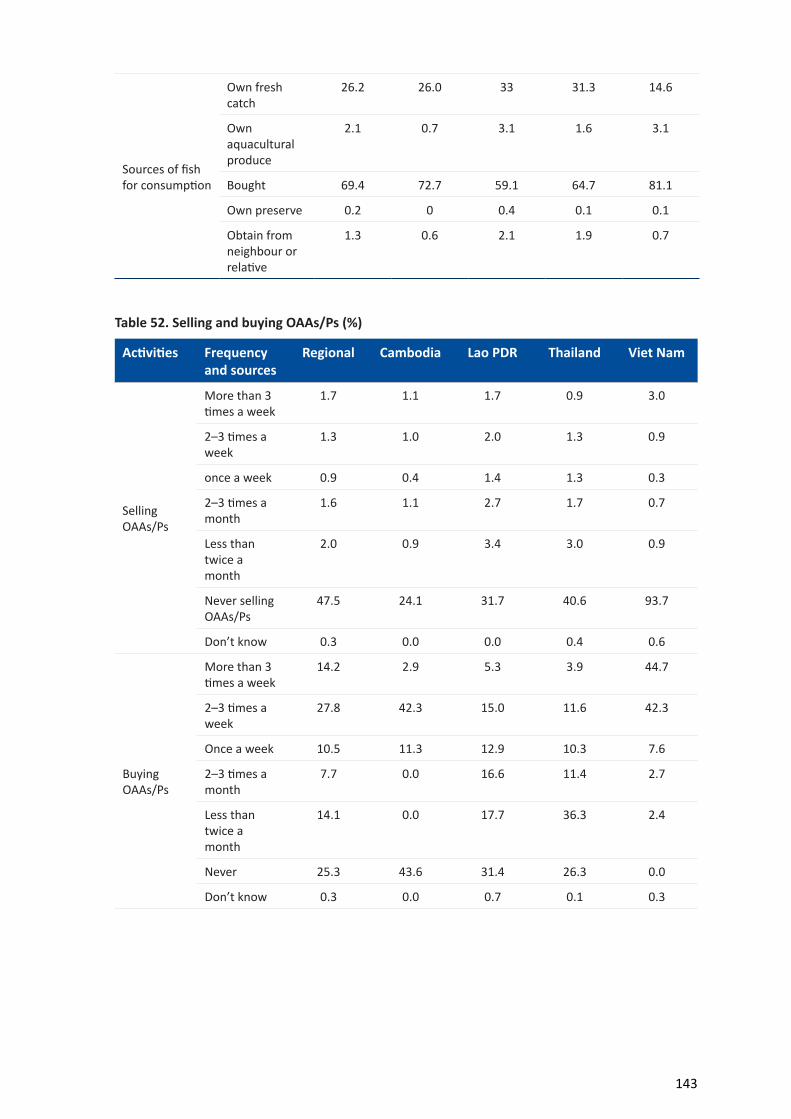
143
Sources of fish for consumption
Own fresh catch
26.2 26.0 33 31.3 14.6
Own aquacultural produce
2.1 0.7 3.1 1.6 3.1
Bought 69.4 72.7 59.1 64.7 81.1
Own preserve 0.2 0 0.4 0.1 0.1
Obtain from neighbour or relative
1.3 0.6 2.1 1.9 0.7
Table 52. Selling and buying OAAs/Ps (%)
Activities Frequency and sources
Regional Cambodia Lao PDR Thailand Viet Nam
Selling OAAs/Ps
More than 3 times a week
1.7 1.1 1.7 0.9 3.0
2–3 times a week
1.3 1.0 2.0 1.3 0.9
once a week 0.9 0.4 1.4 1.3 0.3
2–3 times a month
1.6 1.1 2.7 1.7 0.7
Less than twice a month
2.0 0.9 3.4 3.0 0.9
Never selling OAAs/Ps
47.5 24.1 31.7 40.6 93.7
Don’t know 0.3 0.0 0.0 0.4 0.6
Buying OAAs/Ps
More than 3 times a week
14.2 2.9 5.3 3.9 44.7
2–3 times a week
27.8 42.3 15.0 11.6 42.3
Once a week 10.5 11.3 12.9 10.3 7.6
2–3 times a month
7.7 0.0 16.6 11.4 2.7
Less than twice a month
14.1 0.0 17.7 36.3 2.4
Never 25.3 43.6 31.4 26.3 0.0
Don’t know 0.3 0.0 0.7 0.1 0.3
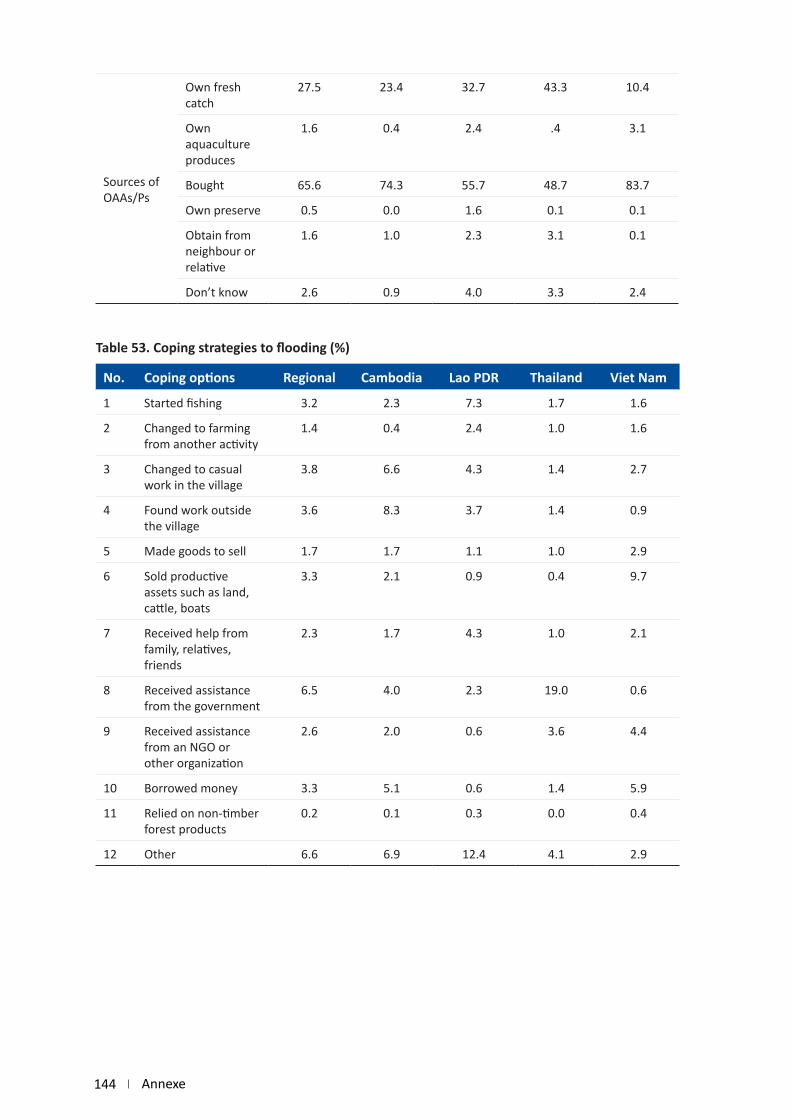
Annexe144
Sources of OAAs/Ps
Own fresh catch
27.5 23.4 32.7 43.3 10.4
Own aquaculture produces
1.6 0.4 2.4 .4 3.1
Bought 65.6 74.3 55.7 48.7 83.7
Own preserve 0.5 0.0 1.6 0.1 0.1
Obtain from neighbour or relative
1.6 1.0 2.3 3.1 0.1
Don’t know 2.6 0.9 4.0 3.3 2.4
Table 53. Coping strategies to flooding (%)
No. Coping options Regional Cambodia Lao PDR Thailand Viet Nam
1 Started fishing 3.2 2.3 7.3 1.7 1.6
2 Changed to farming from another activity
1.4 0.4 2.4 1.0 1.6
3 Changed to casual work in the village
3.8 6.6 4.3 1.4 2.7
4 Found work outside the village
3.6 8.3 3.7 1.4 0.9
5 Made goods to sell 1.7 1.7 1.1 1.0 2.9
6 Sold productive assets such as land, cattle, boats
3.3 2.1 0.9 0.4 9.7
7 Received help from family, relatives, friends
2.3 1.7 4.3 1.0 2.1
8 Received assistance from the government
6.5 4.0 2.3 19.0 0.6
9 Received assistance from an NGO or other organization
2.6 2.0 0.6 3.6 4.4
10 Borrowed money 3.3 5.1 0.6 1.4 5.9
11 Relied on non-timber forest products
0.2 0.1 0.3 0.0 0.4
12 Other 6.6 6.9 12.4 4.1 2.9
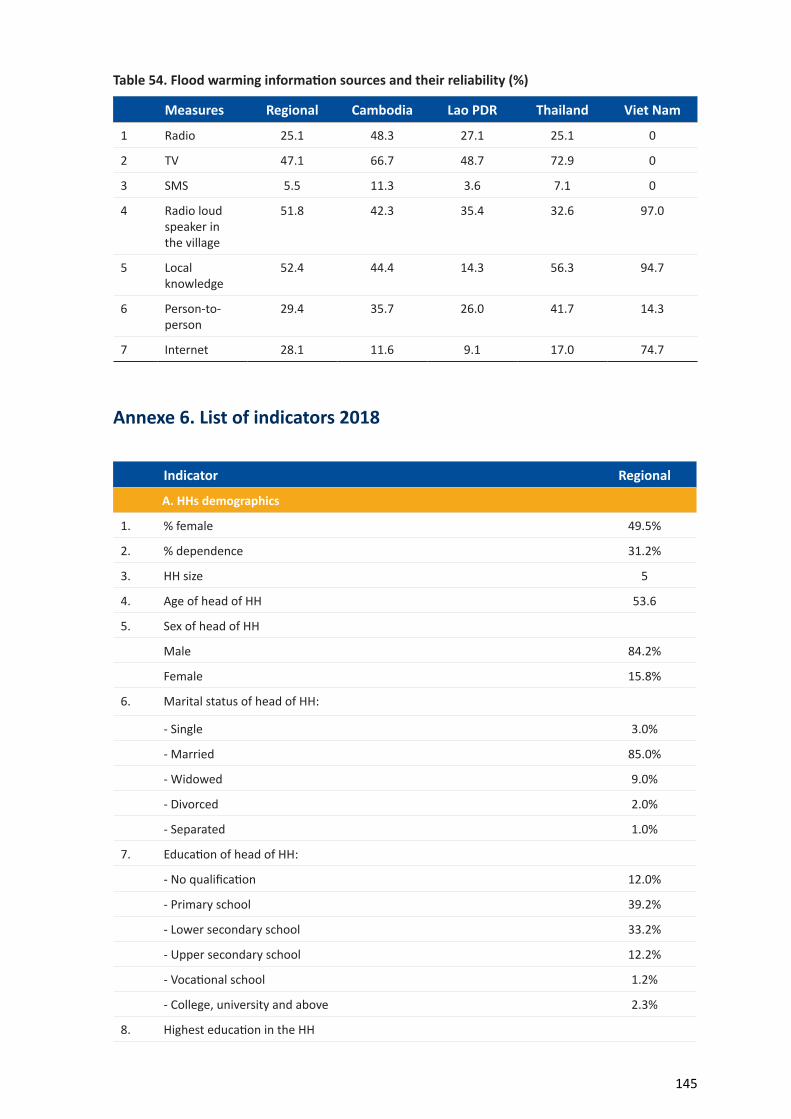
145
Table 54. Flood warming information sources and their reliability (%)
Measures Regional Cambodia Lao PDR Thailand Viet Nam
1 Radio 25.1 48.3 27.1 25.1 0
2 TV 47.1 66.7 48.7 72.9 0
3 SMS 5.5 11.3 3.6 7.1 0
4 Radio loud speaker in the village
51.8 42.3 35.4 32.6 97.0
5 Local knowledge
52.4 44.4 14.3 56.3 94.7
6 Person-to-person
29.4 35.7 26.0 41.7 14.3
7 Internet 28.1 11.6 9.1 17.0 74.7
Annexe 6. List of indicators 2018
Indicator Regional
A. HHs demographics
1. % female 49.5%
2. % dependence 31.2%
3. HH size 5
4. Age of head of HH 53.6
5. Sex of head of HH
Male 84.2%
Female 15.8%
6. Marital status of head of HH:
- Single 3.0%
- Married 85.0%
- Widowed 9.0%
- Divorced 2.0%
- Separated 1.0%
7. Education of head of HH:
- No qualification 12.0%
- Primary school 39.2%
- Lower secondary school 33.2%
- Upper secondary school 12.2%
- Vocational school 1.2%
- College, university and above 2.3%
8. Highest education in the HH
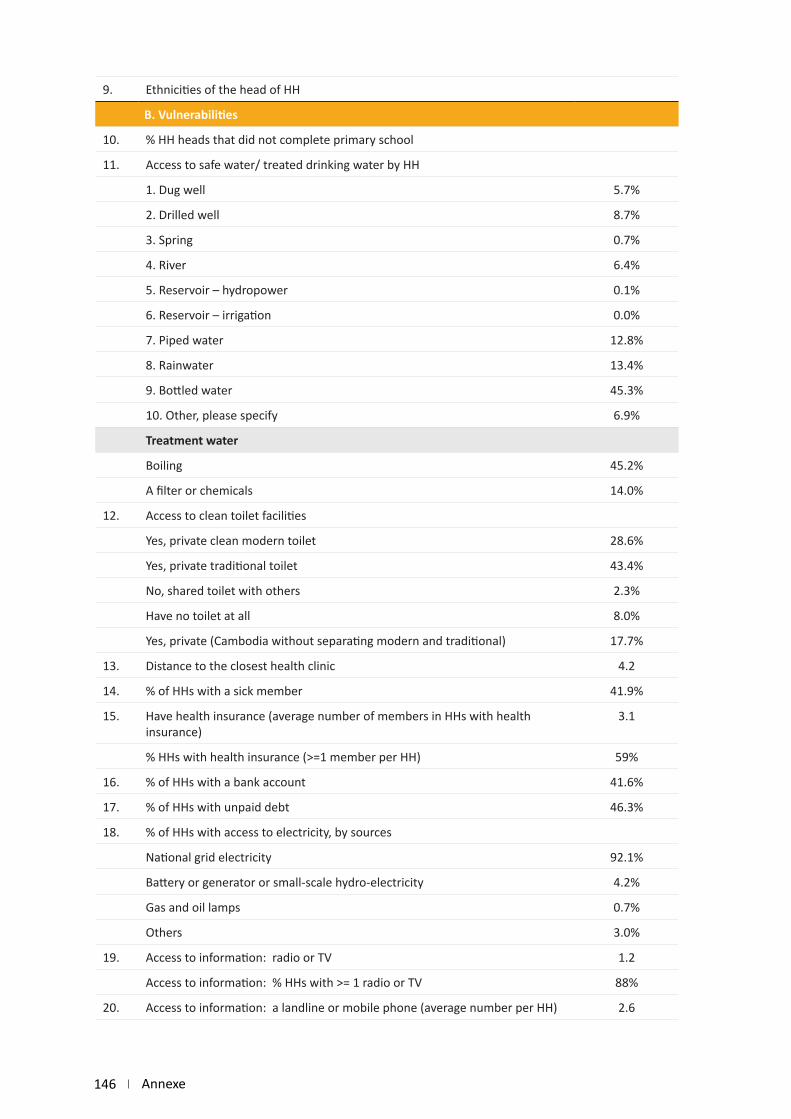
Annexe146
9. Ethnicities of the head of HH
B. Vulnerabilities
10. % HH heads that did not complete primary school
11. Access to safe water/ treated drinking water by HH
1. Dug well 5.7%
2. Drilled well 8.7%
3. Spring 0.7%
4. River 6.4%
5. Reservoir – hydropower 0.1%
6. Reservoir – irrigation 0.0%
7. Piped water 12.8%
8. Rainwater 13.4%
9. Bottled water 45.3%
10. Other, please specify 6.9%
Treatment water
Boiling 45.2%
A filter or chemicals 14.0%
12. Access to clean toilet facilities
Yes, private clean modern toilet 28.6%
Yes, private traditional toilet 43.4%
No, shared toilet with others 2.3%
Have no toilet at all 8.0%
Yes, private (Cambodia without separating modern and traditional) 17.7%
13. Distance to the closest health clinic 4.2
14. % of HHs with a sick member 41.9%
15. Have health insurance (average number of members in HHs with health insurance)
3.1
% HHs with health insurance (>=1 member per HH) 59%
16. % of HHs with a bank account 41.6%
17. % of HHs with unpaid debt 46.3%
18. % of HHs with access to electricity, by sources
National grid electricity 92.1%
Battery or generator or small-scale hydro-electricity 4.2%
Gas and oil lamps 0.7%
Others 3.0%
19. Access to information: radio or TV 1.2
Access to information: % HHs with >= 1 radio or TV 88%
20. Access to information: a landline or mobile phone (average number per HH) 2.6
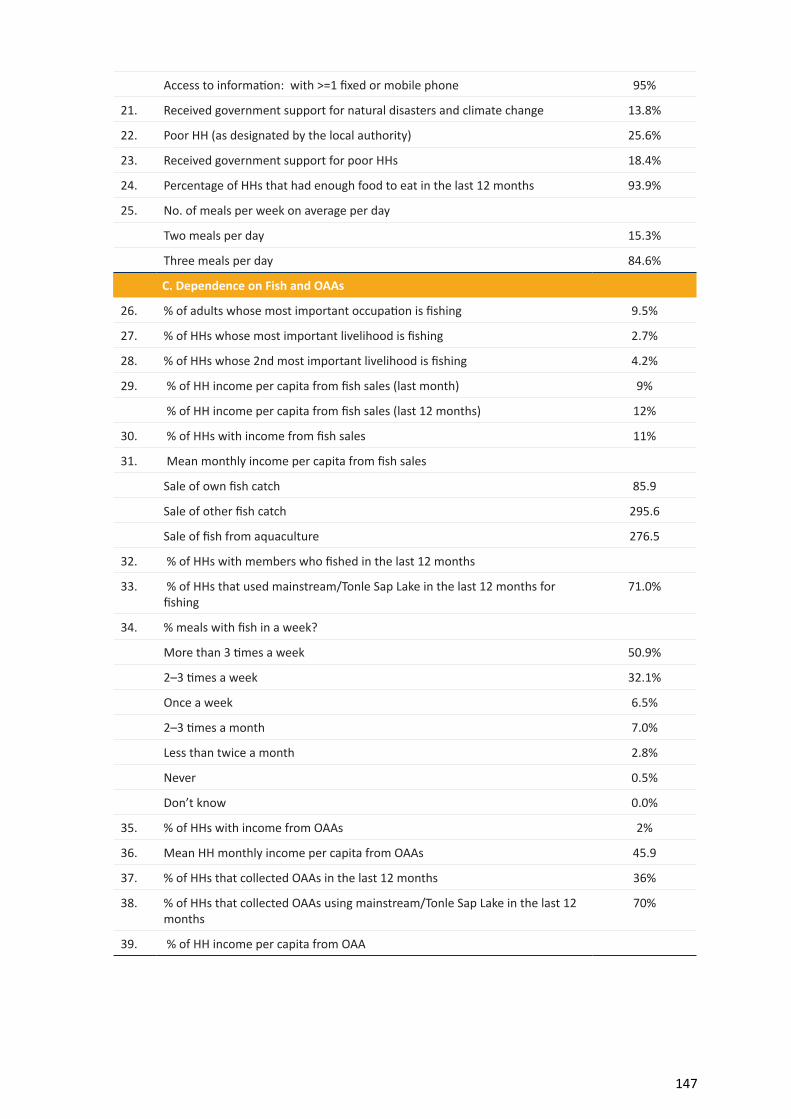
147
Access to information: with >=1 fixed or mobile phone 95%
21. Received government support for natural disasters and climate change 13.8%
22. Poor HH (as designated by the local authority) 25.6%
23. Received government support for poor HHs 18.4%
24. Percentage of HHs that had enough food to eat in the last 12 months 93.9%
25. No. of meals per week on average per day
Two meals per day 15.3%
Three meals per day 84.6%
C. Dependence on Fish and OAAs
26. % of adults whose most important occupation is fishing 9.5%
27. % of HHs whose most important livelihood is fishing 2.7%
28. % of HHs whose 2nd most important livelihood is fishing 4.2%
29. % of HH income per capita from fish sales (last month) 9%
% of HH income per capita from fish sales (last 12 months) 12%
30. % of HHs with income from fish sales 11%
31. Mean monthly income per capita from fish sales
Sale of own fish catch 85.9
Sale of other fish catch 295.6
Sale of fish from aquaculture 276.5
32. % of HHs with members who fished in the last 12 months
33. % of HHs that used mainstream/Tonle Sap Lake in the last 12 months for fishing
71.0%
34. % meals with fish in a week?
More than 3 times a week 50.9%
2–3 times a week 32.1%
Once a week 6.5%
2–3 times a month 7.0%
Less than twice a month 2.8%
Never 0.5%
Don’t know 0.0%
35. % of HHs with income from OAAs 2%
36. Mean HH monthly income per capita from OAAs 45.9
37. % of HHs that collected OAAs in the last 12 months 36%
38. % of HHs that collected OAAs using mainstream/Tonle Sap Lake in the last 12 months
70%
39. % of HH income per capita from OAA
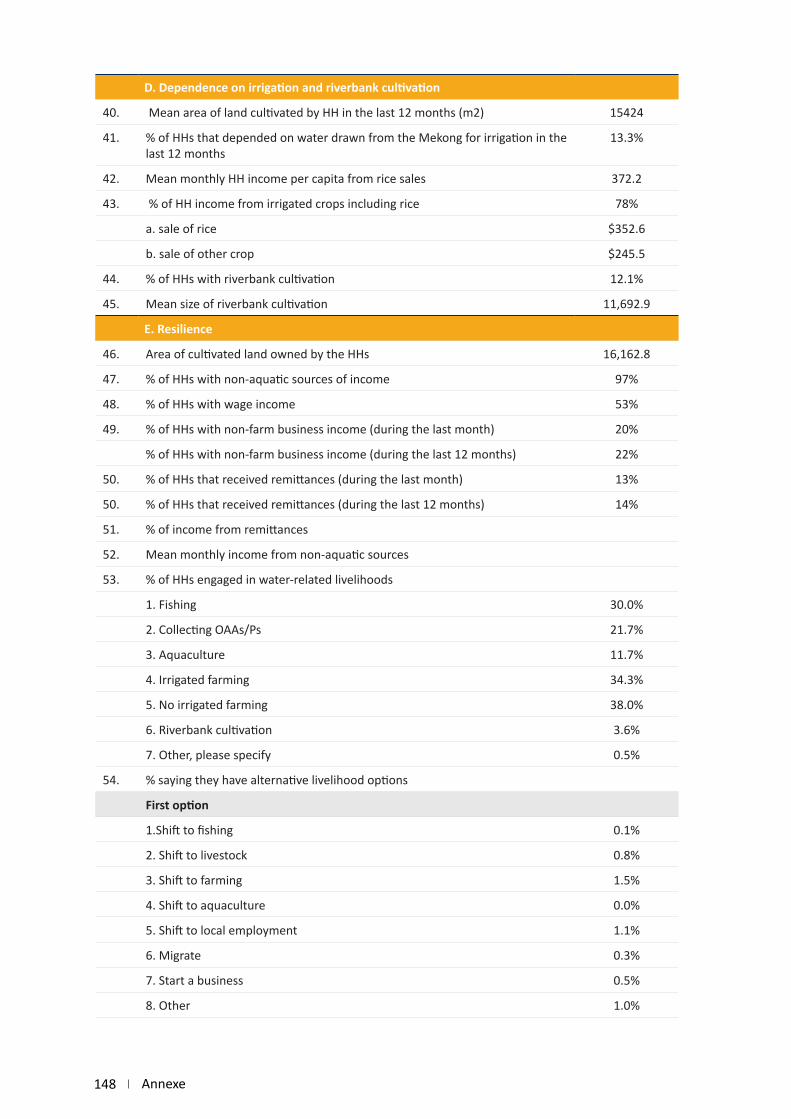
Annexe148
D. Dependence on irrigation and riverbank cultivation
40. Mean area of land cultivated by HH in the last 12 months (m2) 15424
41. % of HHs that depended on water drawn from the Mekong for irrigation in the last 12 months
13.3%
42. Mean monthly HH income per capita from rice sales 372.2
43. % of HH income from irrigated crops including rice 78%
a. sale of rice $352.6
b. sale of other crop $245.5
44. % of HHs with riverbank cultivation 12.1%
45. Mean size of riverbank cultivation 11,692.9
E. Resilience
46. Area of cultivated land owned by the HHs 16,162.8
47. % of HHs with non-aquatic sources of income 97%
48. % of HHs with wage income 53%
49. % of HHs with non-farm business income (during the last month) 20%
% of HHs with non-farm business income (during the last 12 months) 22%
50. % of HHs that received remittances (during the last month) 13%
50. % of HHs that received remittances (during the last 12 months) 14%
51. % of income from remittances
52. Mean monthly income from non-aquatic sources
53. % of HHs engaged in water-related livelihoods
1. Fishing 30.0%
2. Collecting OAAs/Ps 21.7%
3. Aquaculture 11.7%
4. Irrigated farming 34.3%
5. No irrigated farming 38.0%
6. Riverbank cultivation 3.6%
7. Other, please specify 0.5%
54. % saying they have alternative livelihood options
First option
1.Shift to fishing 0.1%
2. Shift to livestock 0.8%
3. Shift to farming 1.5%
4. Shift to aquaculture 0.0%
5. Shift to local employment 1.1%
6. Migrate 0.3%
7. Start a business 0.5%
8. Other 1.0%
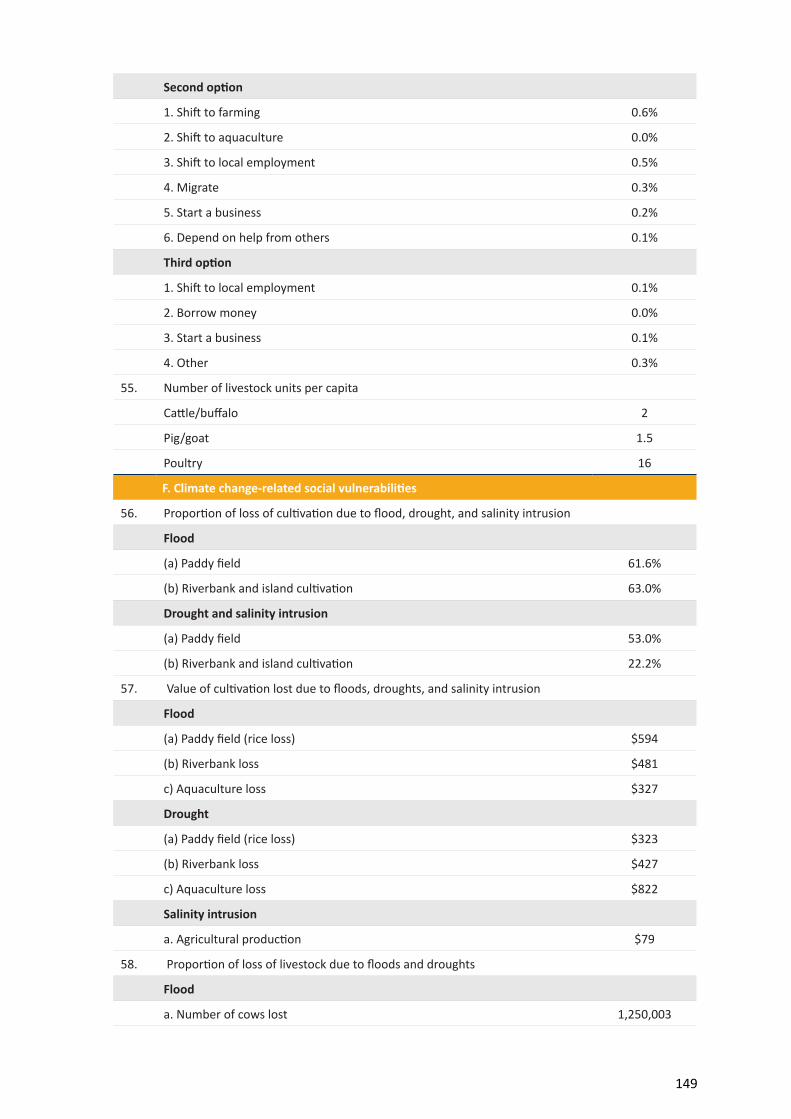
149
Second option
1. Shift to farming 0.6%
2. Shift to aquaculture 0.0%
3. Shift to local employment 0.5%
4. Migrate 0.3%
5. Start a business 0.2%
6. Depend on help from others 0.1%
Third option
1. Shift to local employment 0.1%
2. Borrow money 0.0%
3. Start a business 0.1%
4. Other 0.3%
55. Number of livestock units per capita
Cattle/buffalo 2
Pig/goat 1.5
Poultry 16
F. Climate change-related social vulnerabilities
56. Proportion of loss of cultivation due to flood, drought, and salinity intrusion
Flood
(a) Paddy field 61.6%
(b) Riverbank and island cultivation 63.0%
Drought and salinity intrusion
(a) Paddy field 53.0%
(b) Riverbank and island cultivation 22.2%
57. Value of cultivation lost due to floods, droughts, and salinity intrusion
Flood
(a) Paddy field (rice loss) $594
(b) Riverbank loss $481
c) Aquaculture loss $327
Drought
(a) Paddy field (rice loss) $323
(b) Riverbank loss $427
c) Aquaculture loss $822
Salinity intrusion
a. Agricultural production $79
58. Proportion of loss of livestock due to floods and droughts
Flood
a. Number of cows lost 1,250,003
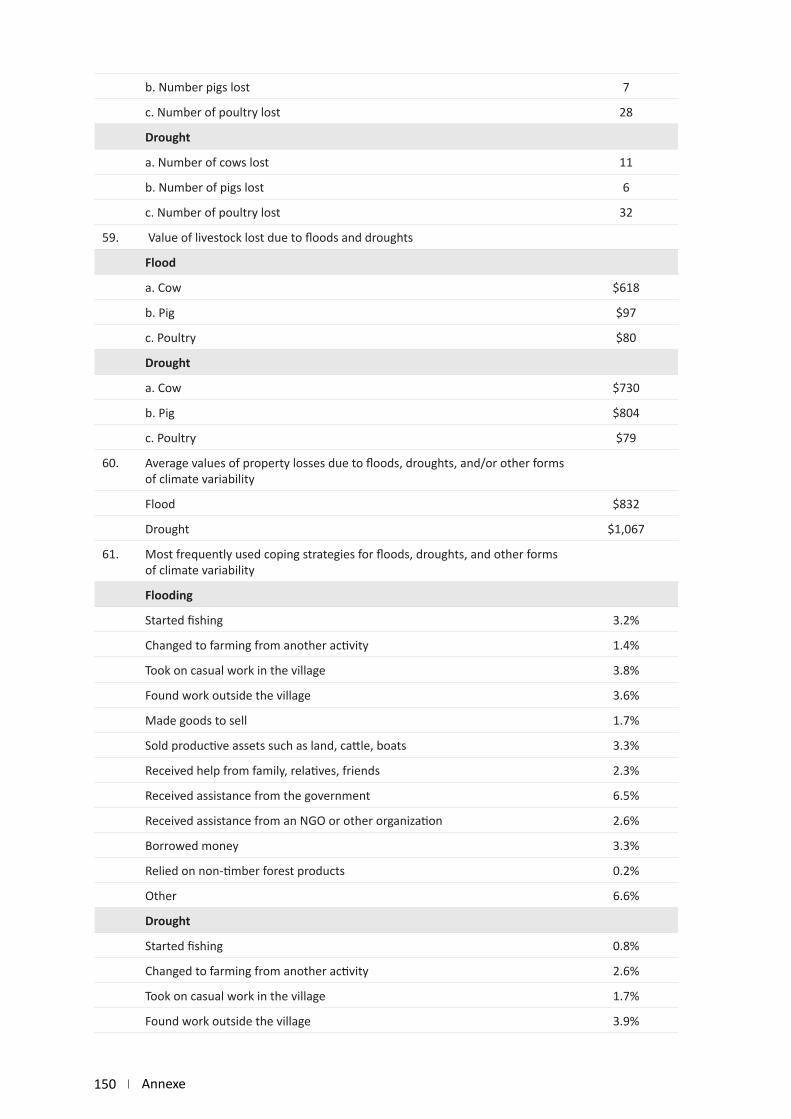
Annexe150
b. Number pigs lost 7
c. Number of poultry lost 28
Drought
a. Number of cows lost 11
b. Number of pigs lost 6
c. Number of poultry lost 32
59. Value of livestock lost due to floods and droughts
Flood
a. Cow $618
b. Pig $97
c. Poultry $80
Drought
a. Cow $730
b. Pig $804
c. Poultry $79
60. Average values of property losses due to floods, droughts, and/or other forms of climate variability
Flood $832
Drought $1,067
61. Most frequently used coping strategies for floods, droughts, and other forms of climate variability
Flooding
Started fishing 3.2%
Changed to farming from another activity 1.4%
Took on casual work in the village 3.8%
Found work outside the village 3.6%
Made goods to sell 1.7%
Sold productive assets such as land, cattle, boats 3.3%
Received help from family, relatives, friends 2.3%
Received assistance from the government 6.5%
Received assistance from an NGO or other organization 2.6%
Borrowed money 3.3%
Relied on non-timber forest products 0.2%
Other 6.6%
Drought
Started fishing 0.8%
Changed to farming from another activity 2.6%
Took on casual work in the village 1.7%
Found work outside the village 3.9%
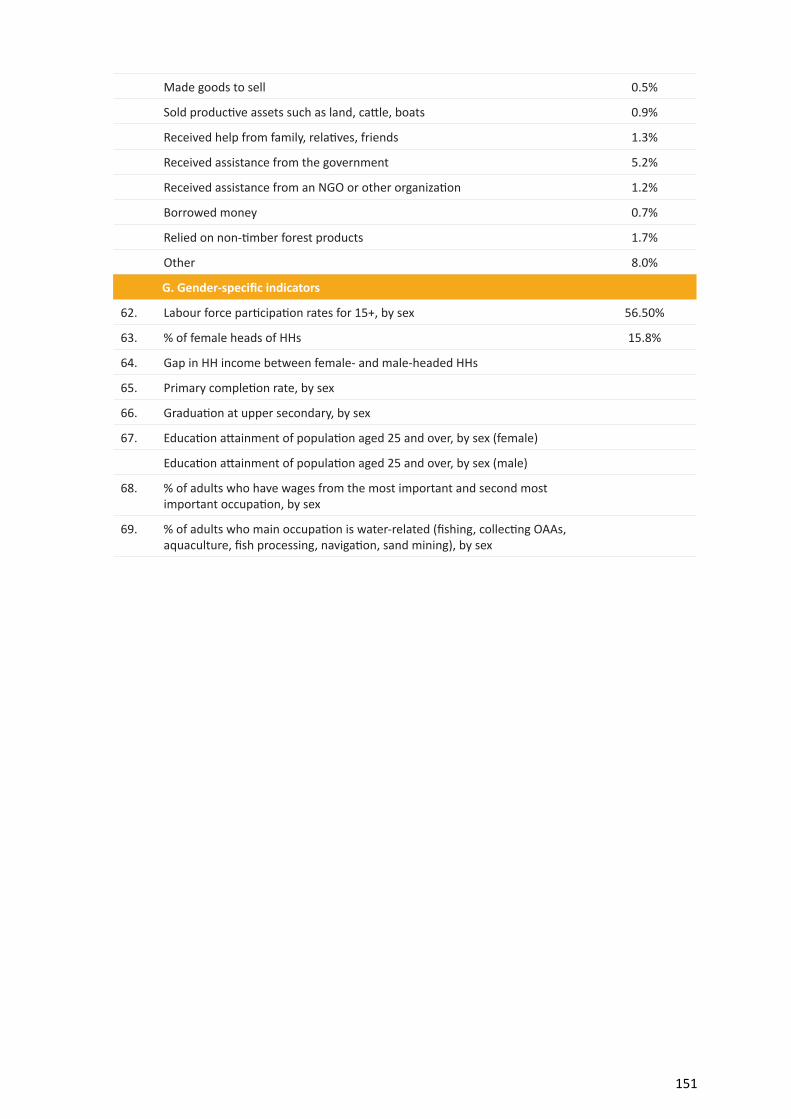
151
Made goods to sell 0.5%
Sold productive assets such as land, cattle, boats 0.9%
Received help from family, relatives, friends 1.3%
Received assistance from the government 5.2%
Received assistance from an NGO or other organization 1.2%
Borrowed money 0.7%
Relied on non-timber forest products 1.7%
Other 8.0%
G. Gender-specific indicators
62. Labour force participation rates for 15+, by sex 56.50%
63. % of female heads of HHs 15.8%
64. Gap in HH income between female- and male-headed HHs
65. Primary completion rate, by sex
66. Graduation at upper secondary, by sex
67. Education attainment of population aged 25 and over, by sex (female)
Education attainment of population aged 25 and over, by sex (male)
68. % of adults who have wages from the most important and second most important occupation, by sex
69. % of adults who main occupation is water-related (fishing, collecting OAAs, aquaculture, fish processing, navigation, sand mining), by sex

Mekong River Commission SecretariatP. O. Box 6101, 184 Fa Ngoum Road, Unit 18 Ban Sithane Neua,
Sikhott abong District, Vienti ane 01000, Lao PDRTel: +856 21 263 263. Fax: +856 21 263 264
ww.mrcmekong.org
© Mekong River Commission 2021