climate change impact and coastal vulnerability … | community | industrial & mining | carbon...
TRANSCRIPT

transport | community | industrial & mining | carbon & energy
Climate Change Impact and Coastal Vulnerability
Assessment of Proposed Quoin Development,
Flinders Island
Prepared for: Tom & Jo Youl Date: 6 July 2015 Rev00
Annexure 24 - A1 - October 2015

pitt&sherry ref: HB14638L001 CoastalVulRep 31P Rev00.docx/SR/as
Table of Contents 1. Introduction .......................................................................................................................................... 1
1.1 Purpose of Report ...................................................................................................................... 1 1.2 Site Details ................................................................................................................................. 1 1.3 Proposed Development ............................................................................................................. 3 1.4 Scope of Works .......................................................................................................................... 4 1.5 Investigation Programme .......................................................................................................... 4 1.6 Methodology .............................................................................................................................. 5 1.7 Limitations ................................................................................................................................. 6
2. Climate Change Considerations ............................................................................................................ 6 2.1 Sea Level Rise and Tidal Inundation ........................................................................................... 7
3. Geology ................................................................................................................................................. 8 3.1 Geological Mapping ................................................................................................................... 8 3.2 Project Area Geomorphological Assessment ............................................................................. 9
4. Assessment of Design Setback Levels for the Project ......................................................................... 15 4.1 Storm Erosion Impacts ............................................................................................................. 16 4.2 Zone of Reduced Foundation Capacity .................................................................................... 19 4.3 Coastal Recession / Progradation ............................................................................................ 19 4.4 Integrated Design Setback Allowance ..................................................................................... 20
5. Extreme Design Tidal Surface levels (Storm Surge Flooding).............................................................. 21 5.1 Extreme Tide Analysis .............................................................................................................. 21 5.2 Tidal Planes .............................................................................................................................. 21 5.3 Extreme Tide level projection for the year 2000 ..................................................................... 22 5.4 Extreme Inundation Design Level for the Project Area ........................................................... 24 5.5 Design Inundation Level for 2100 ............................................................................................ 25 5.6 Other Climate Change and Ocean Process Effects .................................................................. 25
6. Impact of Setback Allowance and Design Inundation Level ............................................................... 27 6.1 Adopted Design Setback Allowance and Inundation Level ..................................................... 27
7. Discussion / Conclusions ..................................................................................................................... 31 8. Recommendations .............................................................................................................................. 32 9. References ........................................................................................................................................... 33
List of figures Figure 1: Regional Location of project area (Google Maps,2015) ................................................................. 1 Figure 2: Satellite image of site location (Google Earth 2015). ..................................................................... 2 Figure 3: Local location of site (base map © Tasmap, TheList.tas.gov.au 2015) .......................................... 2 Figure 4: Detailed location of site (base map © Tasmap, TheList.tas.gov.au) ............................................. 3 Figure 5: Site Plan .......................................................................................................................................... 4 Figure 6: Observed sea level rise and projected changes (ACE CRC, 2009) .................................................. 7 Figure 7: Geologic mapping (MRT, 2010) ...................................................................................................... 8 Figure 8: ‘OzCoast 'Smartline' geomorphological assessment (as presented on TheList, 2015) .................. 9 Figure 9: Granodiorite coastal outcrops - north end of project area .......................................................... 10 Figure 10: Sediment units overlying granodiorite (North end of project) .................................................. 10 Figure 11: Unconformably deposited Sediment units underlying sand dunes ........................................... 11 Figure 12: Wave cut faces exposed in mid section of project area ............................................................. 11 Figure 13: Southern section of project area - wave worn cobble ............................................................... 12 Figure 14: Sand dune over soft sediment, south of project boundary ....................................................... 12 Figure 15: Photo location reference (with mapped geology indicated)...................................................... 13 Figure 16: Estimation of Coastal Hazard lines (reproduced from WRL,2012) ............................................. 16 Figure 17: Cross-section of erosion of a sandy beach. (www.ozcoasts.com.au) ........................................ 16
Annexure 24 - A1 - October 2015

pitt&sherry ref: HB14638L001 CoastalVulRep 31P Rev00.docx/SR/as
Figure 18: Dune Elevation Profile ................................................................................................................ 18 Figure 19: Illustrative sea level maps for Tasmania (McInnes et al, 2010) ................................................. 22 Figure 20: Components of elevated water levels (reproduced from WRL, 2012)....................................... 23 Figure 21: 100 year ARI Significant Wave Height (WRL, 2012).................................................................... 23 Figure 22: Setback allowance for coastal erosion ....................................................................................... 27 Figure 23: Set back allowance on preliminary concept plan ....................................................................... 28 Figure 24: 100 m setback allowance on concept plan overlain with mapped geology............................... 28 Figure 25: Erosion setback Allowance and Inundation level on concept plan ............................................ 29 Figure 26: Killiecrankie developed area indicating 10m topographic contour ........................................... 30
List of tables Table 1: Table of property titles ..................................................................................................................... 3 Table 2: Indicative width of zone of reduced foundation capacity (WRL,2012) ......................................... 19 Table 3: Integrated erosion setback allowances ......................................................................................... 20 Table 4: Tidal planes (in m AHD).................................................................................................................. 21 Table 5: Water level (m AHD) for various extreme tide probabilities ......................................................... 22 Table 6: Extreme wave inundation contributions ....................................................................................... 24 Table 7: Design Inundation Levels ............................................................................................................... 25
Appendix A Important Information about your Report Appendix B Climate Change Summary for Flinders Island
Prepared by: …………………………………………………. Date: 6 July 2015 Sven Rand Reviewed by: …………………………………………………. Date: 6 July 2015
Noel Carroll Authorised by: …………………………………………………. Date: 6 July 2015 David Finnigan
Revision History
Rev No.
Description Prepared by Reviewed by Authorised by Date
© 2015 pitt&sherry This document is and shall remain the property of pitt&sherry. The document may only be used for the purposes for which it was commissioned and in accordance with the Terms of Engagement for the commission. Unauthorised use of this document in any form is prohibited.
Annexure 24 - A1 - October 2015

Commercial – in – confidence
pitt&sherry ref: HB14638L001 CoastalVulRep 31P Rev00.docx/SR/as 1
1. Introduction
1.1 Purpose of Report
This report documents geotechnical investigation for a proposed private development at the Northern end of Flinders Island. The local resident landowners Tom and Jo Youl are investigating the potential for an ‘eco friendly’ development concept which may include luxury accommodation, restaurant, dining and conference facilities, wellness centre and staff accommodation located along the coastal section of the Quoin Farm on Flinders Island. The project is based around the concept of sustainable tourism, respecting the environment and providing an outlet for farm diversification and the promotion of local produce. The development proponents have engaged pitt&sherry to provide a coastal vulnerability assessment incorporating assessment of potential climate change impacts for the project.
1.2 Site Details
1.2.1 Regional Location
The Project Area is located on the northeast tip off Flinders Island, in the eastern end of Bass Strait). The regional location of the Project Area is indicated in Figures 1 and 2 below.
Figure 1: Regional Location of project area (Google Maps, 2015)
Project Area
Annexure 24 - A1 - October 2015

Commercial – in – confidence
pitt&sherry ref: HB14638L001 CoastalVulRep 31P Rev00.docx/SR/as 2
Figure 2: Satellite image of site location (Google Earth 2015)
1.2.2 Local Project Area Location
Detail of the local project location is provided in Figure 3 and Figure 4 following.
Figure 3: Local location of site (base map © Tasmap, TheList.tas.gov.au 2015)
Project Area
Annexure 24 - A1 - October 2015

Commercial – in – confidence
pitt&sherry ref: HB14638L001 CoastalVulRep 31P Rev00.docx/SR/as 3
Figure 4: Detailed location of site (base map © Tasmap, TheList.tas.gov.au)
1.3 Proposed Development
The Quoin property is made up of a number of titles: Table 1: Table of property titles
Property Address 3951 PALANA RD KILLIECRANKIE TAS 7255
Property ID 3368046
Title Reference 242997/1
Property Address 3951 PALANA RD KILLIECRANKIE TAS 7255
Property ID 3368046
Title Reference 170037/1/2/3/4/5/6/7/8
Property Address 322 KILLIECRANKIE RD KILLIECRANKIE TAS 7255
Property ID 3368046
Title Reference 112854/1
Property Address 322 KILLIECRANKIE RD KILLIECRANKIE TAS 7255
Property ID 3368046
Title Reference 116032/2
Property Address 3951 PALANA RD KILLIECRANKIE TAS 7255
Property ID 3368046
Title Reference 170038/1/2
Property Address 3951 PALANA RD KILLIECRANKIE TAS 7255
Property ID 3368046
Title Reference 30983/1
Annexure 24 - A1 - October 2015

Commercial – in – confidence
pitt&sherry ref: HB14638L001 CoastalVulRep 31P Rev00.docx/SR/as 4
The development will take place on part of CT170037/1/2/3/6, CT242997/1, CT170038/1 and CT112854/1 – 3951 Palana Road, Killiecrankie. Impacted titles are attached at Appendix B. The extent of the property holding is graphically illustrated below.
Figure 5: Site Plan
1.4 Scope of Works
The scope of works is to:
Undertake field investigation of project area
Utilise available datasets to identify tidal information, potential sea level rise analyses and wave data appropriate for use at the site
Utilise available geologic and geomorphological information for estimation of erosion vulnerability due to coastal processes for the site
Estimate potential sea level / storm erosion impacts on the parcel of land under current conditions and with projected changes to future sea levels
Assess potential 1 in 100 year inundation (1% annual exceedance probability) level due to an extreme storm surge tide event for 2010 and incorporating the potential high greenhouse gas emissions sea level rise scenario for 2100
Provide a technical report to the client.
1.5 Investigation Programme
The investigation involved a geotechnical / geomorphological investigation of the site involving a field inspection of the coastal section of the property in conjunction with a number of traverses to various proposed development footprint sites at elevations exceeding 10 m above sea level and exceeding 100m, and in many traverses up to 250m, from the waterline.
crown land
Annexure 24 - A1 - October 2015

Commercial – in – confidence
pitt&sherry ref: HB14638L001 CoastalVulRep 31P Rev00.docx/SR/as 5
1.6 Methodology
The methodology undertaken in preparing this preliminary coastal vulnerability assessment is as follows:-
Field assessment of site
Assess geology of the project area (indicates potential erosion vulnerability)
Review geological mapping (Mineral Resources Tasmania - MRT)
Review geomorphological mapping (Sharples, 2006 and Smartline)
Estimate wave climate (wave setup and runup)
Estimate projected potential inundation levels for appropriate design inundation level.
Current tidal plane
Extreme tidal levels
Wave climate / local elevation contributions
Sea level rise contribution
Assess potential coastal erosion impacts
Potential storm erosion / storm demand (short term erosion impacts)
Zone of Reduced Foundation Capacity
Long term recession effects (including ‘Bruun Rule’ estimation)
Determine assets affected by setback design zone and inundation design level.
The coastal vulnerability assessment was developed with reference to the following resources:
Antarctic Climate & Ecosystems Co-operative Research Centre (ACECRC) Estimating Sea Level Rise in an Uncertain Future. Sea Level rise extremes assessment Web Tool [http://canute2.sealevelrise.info/]; accessed May 2015.
ClimateAsyst – climate change vulnerability and communication tool – http://www.pittsh.com.au/climateasyst/ accessed 20 April 2015.
Hunter, J. 2008, Historical and Projected Sea-Levels Extremes for Hobart and Burnie, Tasmania, Technical Report prepared by the Antarctic and Climate and Ecosystems Cooperative Research Centre – December 2007. Published by the Department of Primary Industries and Water, Tasmania.
Hunter, J., 2010. Estimating Sea-Level Extremes Under Conditions of Uncertain Sea-Level Rise, Climatic Change, 99:331-350, DOI:10.1007/s10584-009-9671-6.
National Committee on Coastal and Ocean Engineering, Engineers Australia 2nd edition May 2012. Guidelines for responding to the effects of Climate Change in coastal and Ocean Engineering.
“Smartline’ http://www.ozcoasts.org.au/coastal/index.jsp accessed on 6 May 2015.
www.theLIST.tas.gov.au Cadastral and 250K geological maps accessed on 6 May 2015.
http://www.mrt.tas.gov.au. Geologic and airborne geophysical imagery, accessed and reviewed April 2015.
TASMANIAN STATE COASTAL POLICY 1996 - Revised 16 April 2003 in accordance with the State Coastal Policy Validation Act 2003, Revised to take account of a minor amendment that was Gazetted on 25 February 2009
Annexure 24 - A1 - October 2015

Commercial – in – confidence
pitt&sherry ref: HB14638L001 CoastalVulRep 31P Rev00.docx/SR/as 6
Additional information supplied by the client and associated sub consultants, including:
Site project concept plan
Site survey topographic contour plan
1.7 Limitations
The following limitations apply to this report:
The basis of the considerations in this report are datasets available publically, provided by the client and those available to pitt&sherry:
Sea level inundation information including wave setup data has been assessed from published analysis of tide gauges and modelling of meteorological conditions based on available wind, wave and barometric pressure information. No data was collected for the specific site location and therefore the modelling is applied through approximation.
Wave buoy information is not available for the north coast of Flinders Island and wave setup estimates were obtained from consideration of the estimated wave height interpolated from analysed datasets for the general region.
Photogrammetric modelling of historic coastal recession and/or estimating progradation for the site was beyond the scope of the project and was not undertaken
The values estimated in this report provide an order of magnitude for assessing climate change impacts and in particular climate change induced sea level rise impacts. The information is based on a collation of existing information and data, and does not utilise site specific modelling which would enhance the assessment for more precise design purposes. The analysis is considered to use conservative values to provide indicative setbacks and vulnerable locations which may be further refined with the assessment of more precise data.
In addition to the considerations described above, the report must be read in conjunction with limitations described in appendix A.
2. Climate Change Considerations
Assessment of current climate for Flinders Island was analysed for baseline data for a detailed climate change analysis project undertaken from 2008 by the Antarctic Climate and Ecosystems Cooperative Research Centre (ACECRC) from which a series of technical reports were produced in 2010 to 2012.
The projected changes in climate under two hypothetical but considered plausible scenarios of greenhouse gas emissions for the 21st century were produced at fine scale for Tasmania. Details of the specific modelling is available through the pitt&sherry climate change communication web tool ClimateAsyst1 with the summary of projected changes for the Flinders Island region produced by Dr Michael Grose included as appendix B.
While numerous changes are modelled for the end of the century, including for example increased numbers of summer Days (>250C), hot days (>300C) and also very hot days (>400C) the most significant impacts for the project area are considered to be changes in rainfall patterns and in sea levels. Rainfall patterns are projected to alter causing increased heavy rainfall events (>15mm increase in the average wettest day) and up to 7 more very wet days per annum, with a simultaneous reduction in the frequency of light rain fall events. Significant changes are projected for runoff (which follows an extension in the number of dry periods).
1 http://www.pittsh.com.au/climateasyst
Annexure 24 - A1 - October 2015

Commercial – in – confidence
pitt&sherry ref: HB14638L001 CoastalVulRep 31P Rev00.docx/SR/as 7
The majority of the changes projected are considered to have negligible impact on the proposed development. It is recommended that development designs incorporate consideration of projected increases in rainfall intensity and overland run-off flows in the design of stormwater runoff and drainage management systems.
A detrimental change in the projected future climate which may potentially impact on the proposed development is an increase in sea levels.
2.1 Sea Level Rise and Tidal Inundation
A vast array of scientific evidence has concluded that sea levels have risen globally over the last century (example provided in Figure 6).
Figure 6: Observed sea level rise and projected changes (ACE CRC, 2009)
Increased sea levels have the potential to contribute to increase risk of inundation (from extreme tide events) and potentially increased erosion of vulnerable coastal areas. Tasmania does not currently have a state sea level rise policy but consistent with other Australian states has provided guidance on planning allowances (Tasmanian Climate Change Office, 2012). A value of 0.8m has been identified as appropriate for use in Tasmania. A sea level rise projection value of 0.8 m is adopted as a sea level rise allowance for 2100 for use in this report.
Annexure 24 - A1 - October 2015

Commercial – in – confidence
pitt&sherry ref: HB14638L001 CoastalVulRep 31P Rev00.docx/SR/as 8
3. Geology
To assist in determination of the vulnerability of the site to erosion from coastal processes it is important to determine the geological and geomorphological characteristics of the site.
3.1 Geological Mapping
Geological mapping of surface geology is available from Mineral Resources Tasmania (MRT, 2015, as published on TheList). Geological mapping is shown in Figure 7 following. The mapping confirms that the portion north of the ‘northern’ crown land boundary northern is identified to be underlain by granodiorite considered likely to provide significant resilience to coastal erosion, the southern portion of the project however is indicated to be underlain by quaternary sediments described as sand, gravel and mud of alluvial, lacustrine and littoral origin.
Figure 7: Geologic mapping (MRT, 2010)
crown land
Annexure 24 - A1 - October 2015
Commercial – in – confidence
pitt&sherry ref: HB14638L001 CoastalVulRep 31P Rev00.docx/SR/as 9
3.2 Project Area Geomorphological Assessment
3.2.1 Foreshore assessment
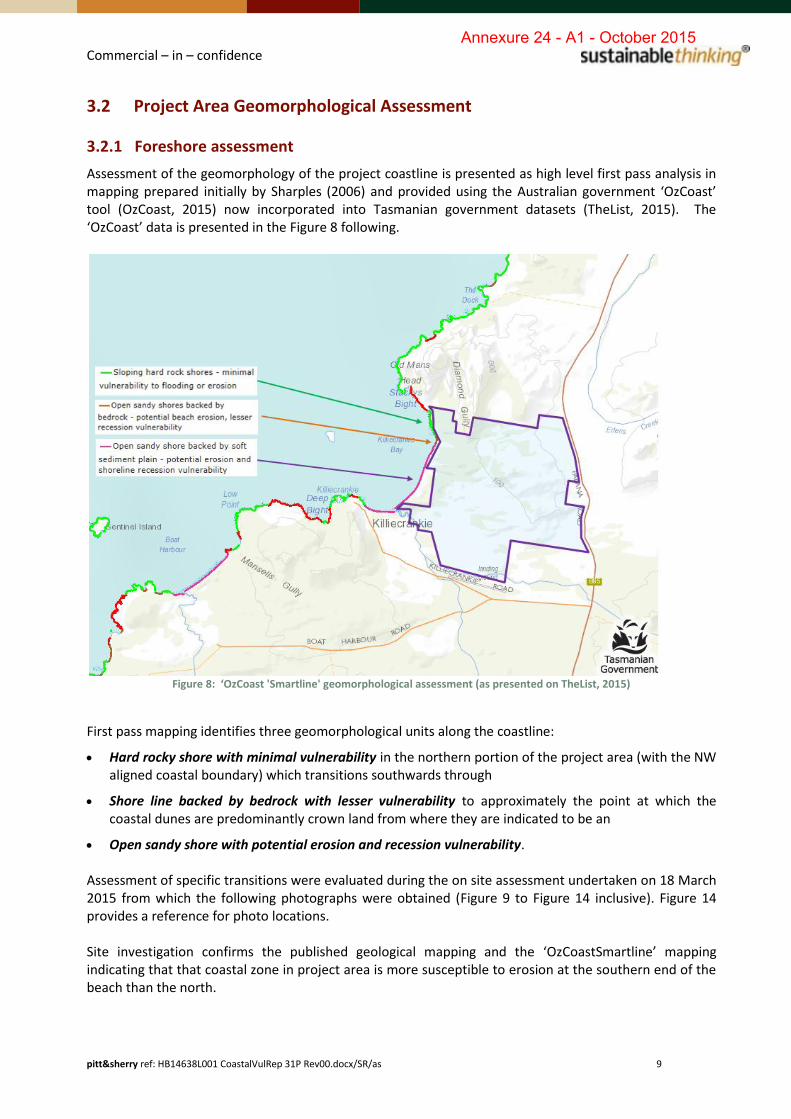
Assessment of the geomorphology of the project coastline is presented as high level first pass analysis in mapping prepared initially by Sharples (2006) and provided using the Australian government ‘OzCoast’ tool (OzCoast, 2015) now incorporated into Tasmanian government datasets (TheList, 2015). The ‘OzCoast’ data is presented in the Figure 8 following.
Figure 8: ‘OzCoast 'Smartline' geomorphological assessment (as presented on TheList, 2015)
First pass mapping identifies three geomorphological units along the coastline:
Hard rocky shore with minimal vulnerability in the northern portion of the project area (with the NW aligned coastal boundary) which transitions southwards through
Shore line backed by bedrock with lesser vulnerability to approximately the point at which the coastal dunes are predominantly crown land from where they are indicated to be an
Open sandy shore with potential erosion and recession vulnerability. Assessment of specific transitions were evaluated during the on site assessment undertaken on 18 March 2015 from which the following photographs were obtained (Figure 9 to Figure 14 inclusive). Figure 14 provides a reference for photo locations. Site investigation confirms the published geological mapping and the ‘OzCoastSmartline’ mapping indicating that that coastal zone in project area is more susceptible to erosion at the southern end of the beach than the north.
Annexure 24 - A1 - October 2015

Commercial – in – confidence
pitt&sherry ref: HB14638L001 CoastalVulRep 31P Rev00.docx/SR/as 10
Figure 9: Granodiorite coastal outcrops - north end of project area
Figure 10: Sediment units overlying granodiorite (North end of project)
Annexure 24 - A1 - October 2015

Commercial – in – confidence
pitt&sherry ref: HB14638L001 CoastalVulRep 31P Rev00.docx/SR/as 11
Figure 11: Unconformably deposited Sediment units underlying sand dunes
Figure 12: Wave cut faces exposed in mid section of project area
Annexure 24 - A1 - October 2015

Commercial – in – confidence
pitt&sherry ref: HB14638L001 CoastalVulRep 31P Rev00.docx/SR/as 12
Figure 13: Southern section of project area - wave worn cobble
Figure 14: Sand dune over soft sediment, south of project boundary
Annexure 24 - A1 - October 2015

Commercial – in – confidence
pitt&sherry ref: HB14638L001 CoastalVulRep 31P Rev00.docx/SR/as 13
Figure 15: Photo location reference (with mapped geology indicated)
Annexure 24 - A1 - October 2015

Commercial – in – confidence
pitt&sherry ref: HB14638L001 CoastalVulRep 31P Rev00.docx/SR/as 14
3.2.2 Dune Assessment
The dunal system in the northern portion of the project area (approximately North of the crown land northern most east west boundary indicated in figure 14) was assessed for suitability for the proposed development. The dune area distal from the waterline was inspected in reconnaissance traverses uphill from the foreshore to areas initially indicated to be at approximately the initial concept design site locations (in the order of approximately 100m from the seaward dune face and in excess of 10m vertically above the beach). The traverses up the dune face at the immediate foreshore and across the dune rises directly overlooking the coast passed through low grasses and low scrub (less than chest height). Large swathes of the near-coastal dune system appear to be dominated by coastal tussock grass and other native grasses typical of coastal and salt-laden dune soils. The proportion of low shrubs varies greatly, reflecting an ever-shifting succession dictated by wind. With increasing distance from the beach, in areas where there is an interpreted reduced exposure to the westerly winds, the dune system is considered to be in a more stable state. The canopy height significantly increases to over head height and transitions to denser and at times almost impenetrable vegetation cover, often with sparse or absent ground cover. Distal from the beach the dune system is considered to be a transgressive system, comprising dunal ridges perpendicular to the coast as opposed to the proximal dune face parallel to the coastline. Providing precise terminology for dune systems consistent with the Tasmanian State Coastal policy (1996 revised 2003) which requires identification of ‘actively mobile landforms’ and quotes “frontal dunes” as examples from which development should be excluded, has been recognised to problematic by a number of recent authors (for example Sharples, 2012 and Smith,2013). Page and Thorp (2010) in the Tasmanian Coastal works manual describe dunes nearest to the sea that run parallel to the beach as foredunes while the Institute of Engineers Australia (1983) describe a frontal dune as “large in an accreting or stable situation and is small where the coast is eroding” while also stating that “foredunes are constructed on the inner berm area which has not eroded over three or more years and where plants reduce the wind velocity at the ground surface”. For planning purposes and for use in application of the Tasmanian State Coastal policy a Water Research Laboratory senior coastal engineer2 states that
“a frontal dune system is part of a dune system that may be mobile or active over medium time scales (ie years to decades). ..From a functional perspective for land use planning, the frontal dune may be defined as the area seaward of the zone of reduced foundation capacity over a chosen planning horizon”.
2 James Carley, personal communication
Annexure 24 - A1 - October 2015

Commercial – in – confidence
pitt&sherry ref: HB14638L001 CoastalVulRep 31P Rev00.docx/SR/as 15
Consistent with the WRL interpretation is opinion of Sharples (2012) who argues that
“the problem of defining an ‘actively mobile landform’ in a planning or policy context is therefore one of defining what amount of movement (or shape change) over what duration or time frame is required. The coastal policy gives no guidance or definition on this matter at all. I have previously argued (in tribunal hearings involving proponents who wished to build or use dunes which are arguably ‘actively mobile’) that the relevant degree and timing of ‘active mobility’ should be a degree of movement (shape change by erosion and or accretion) sufficient to create a significant hazard for buildings or other relevant uses within a normal planning time frame of 50 or 100 years.”
For the purposes of the proposed development, it is recommended that, to remain consistent with the State Coastal Policy and avoid development within “actively mobile dunes”, the proposed works should be located a sufficient distance from the coast to avoid being subject to significant risk from potential coastal hazards including allowance for the projected effects of climate change. It is recommended that the building footprints be sited to ensure, consistent with the WRL interpretation, they are not closer to the coast than the zone of potential reduced foundation capacity estimated for the end of the current century (ie by around 2100).
4. Assessment of Design Setback Levels for the Project
The following section describes assessment of potential extreme coastal erosion (horizontal encroachment) estimated for the project area. The section describes estimation of the potential vulnerability of the proposed development to erosional coastal processes and determines a recommended potential set back zone within which development should be restricted due to the identified erosion risks. Risks arising from coastal processes to which development on the project site may be exposed include:
Erosion through high energy coastal storm processes
Effective over short time frames, (with longer term equilibrium processes potentially restoring the eroded material)
Coastline recession
Where normal equilibrium is not returned or re-attained to restore the sand/material potential as a result of climate change induced sea level rise affecting the longer term processes
Five key components are typically determined for coastal setback estimation with the elements presented diagrammatically in the following:
S1: allowance for short term storm erosion (storm demand)
S2: Allowance for ongoing underlying recession
S3: Allowance for recession due to future sea level rise
S4: Allowance for beach rotation
S5: Allowance for dune stability (Zone of Reduced Foundation Capacity – ZRFC as defined by Nielsen et al, 1992)
Annexure 24 - A1 - October 2015

Commercial – in – confidence
pitt&sherry ref: HB14638L001 CoastalVulRep 31P Rev00.docx/SR/as 16
Figure 16: Estimation of Coastal Hazard lines (reproduced from WRL,2012)
4.1 Storm Erosion Impacts
Preliminary assessment of potential erosion that may occur during extreme or rare storm events was provided by estimation and approximation with published information for similar coastal environments. A photogrammetric assessment of historic storm impacts for the site combined with a geotechnical sample programme would provide more accurate indications of sand volumes removed during storms or close spaced multiple storm events from which to more precisely model appropriate set back allowances. Quantitative modelling of storm erosion impacts was beyond the scope of this report. Figure 17 following provides a schematic illustration of erosion occurring during low probability (rare) storm events. The figure illustrates the significant difference in the volume of sediment eroded in high-magnitude storms (1:100 year) compared to seasonal erosion events.
Figure 17: Cross-section of erosion of a sandy beach. (www.ozcoasts.com.au)
Annexure 24 - A1 - October 2015

Commercial – in – confidence
pitt&sherry ref: HB14638L001 CoastalVulRep 31P Rev00.docx/SR/as 17
To provide an estimate of potential storm erosion allowances, the method of stability analysis described by Nielsen, Lord and Poulos (1992) has been applied with approximations that are considered reasonably applicable to the project area. In studying erosion events, Nielsen, Lord and Poulus noted that few quantitative measurements were available but eroded volumes of between 170 and 430m3/mwere observed for various, generally severe, storm erosion impacts on Northern NSW and Qld beaches between 1967 and 1999. They determined that the design storm erosion demand typically varies between 125 and 250 m3/m (for open coastal beaches in New South Wales). Estimation of storm erosion is through subtraction of the estimated erosion storm demand from the available sand storage. WRL (2012) provided suggested design erosion volumes for a broad range of beach types and locations around the Australian coastline. For the project area (north cast of Tasmania), WRL indicate the suggested design storm erosion (measured above AHD) is 100m3/m and for the east coast of Tasmania the value suggested is 150m3/m. Field inspection of the coastal zone identified the presence of lithified sediments which appear to underlay, in particular, the northern sections of the project beach for which the proponents are proposing development of hard infrastructure. A figure of 100m3/m is considered to represent a reasonable estimation of potential storm erosion for the project area. A value of 100m3/m has been adopted for storm erosion volume for the project area. Indicative cross sections of the dune elevation and project onshore topography are shown in Figure 18 following.
While the sections vary in specific detail it can be generally observed that the dune profiles reach approximately 15m in height a distance of approximately 100m from mean sea level. Based on the adopted 100m3/m storm demand and the averaged dune cross sections an estimated 1% probability storm erosion event may be anticipated to erode in the order of 36 m horizontal distance. A horizontal setback of 40m has been adopted as an allowance for storm dune erosion. It should be noted however, that the estimation does not imply that erosion will be observed in the project area or that values exceeding those estimated may not occur. It is important to note, however, that the setback allowance has been estimated for the area on the northern side of the crown land boundary with a quite steep rise from the coast as indicated in transects 1 and 2 in Figure 18. For the shallower gradient sections at the rear of the southern half of the beach it may be necessary to determine larger setback allowances. Further field investigation would be necessary to assist in evaluating and verifying the foredune extent in those areas.
Annexure 24 - A1 - October 2015

Commercial – in – confidence
pitt&sherry ref: HB14638L001 CoastalVulRep 31P Rev00.docx/SR/as 18
Figure 18: Dune Elevation Profile
Section elevations are in m AHD
Annexure 24 - A1 - October 2015

Commercial – in – confidence
pitt&sherry ref: HB14638L001 CoastalVulRep 31P Rev00.docx/SR/as 19
4.2 Zone of Reduced Foundation Capacity
Nielsen, Lord and Poulos (1992) identified that many beach front assets destroyed or damaged in storms were a result of failure of the soil mass rather than from direct wave impact loadings on the foundations. A zone of reduced foundation capacity (ZRFC) hazard was recommended in addition to the zone of potential storm erosion. Buildings constructed in the ZRFC are recommended by Nielsen, Lord and Poulos (1992) to be constructed on piles due to the reduced bearing capacity in the zone. Specific geotechnical assessment is required to accurately determine both the storm erosion set back and the ZRFC though estimated indicative widths are provided in Table 2 following . Table 2: Indicative width of zone of reduced foundation capacity (WRL,2012)
Dune Crest Level (m AHD) Indicative width of Zone of Reduced Foundation Capacity – at surface (m)
4 11 6 13
10 19
For the estimated storm erosion allowance of 26m the average dune height is estimated to be less than 10m (refer to Figure 18 transects). To provide conservative estimation a value of 20m has been adopted for the zone of reduced foundation capacity based on the indicative dune topography for the project. The adopted zone of reduced foundation capacity for the project area is 20m.
4.3 Coastal Recession / Progradation
It is anticipated that open coast sandy beaches exposed to high energy wind and wave processes will experience changes in their shoreline position, measured in many different ways, such as change of fore-dune position or changes in the vegetation line. It was beyond the scope of the project to assess potential shoreline erosion and recession based on analysis of historic aerial imagery. To provide an indication of the erosion vulnerability of the project area an assessment of potential erosion due to shoreline recession was undertaken using a generalised model, the ‘Bruun Rule’.
4.3.1 Bruun Rule for Modelling Shoreline Recession due to Sea Level Rise
Assessment of historic shoreline recession or progradation can provide an indication of long term trends, though uncertainty exists regarding whether present trends will continue into the future. An alternative method of estimating potential shoreline retreat or recession which may result from sea level rise is application of the Bruun Rule. There are few subjects within coastal engineering/science which generate as much controversy and literature as the Bruun Rule. It is acknowledged by many critics that few, if any, sandy shores in the real world are as simple as that modelled by application of the Bruun Rule.
Annexure 24 - A1 - October 2015

Commercial – in – confidence
pitt&sherry ref: HB14638L001 CoastalVulRep 31P Rev00.docx/SR/as 20
However, it is also similarly conceded, even by strident critics (eg Pilkey and Cooper, 2004) that there are few alternatives for model estimation of sea level rise impacts on coastal recession, though Ranasinghe et al. (2007) caution against its inappropriate application. Nonetheless, it is becoming entrenched in policy and common practice in many states use (Ranasinghe et al., 2007). WRL (2012) have estimated generic coastal erosion hazard volume setbacks for the entire Australian coastline. The ACE CRC’s sea level rise online tool “Canute” incorporates the WRL estimated volumes as generic indications of coastal erosion hazards for a range of varying beach types for all sandy coasts Australia wide, as part of a nationwide first pass assessment of coastal erosion hazard. For the project area, bathymetry profiles were not assessed, though visual site inspection and assessment of the aerial imagery indicate that the shallow gradients observed in the intertidal zone continue for some distance offshore indicative of a highly dissipative beach type. The north eastern portion of the beach in the project area, however, presents aspects more typical of beach type 5 (‘Canute’ and WRL, 2012) Based on the assessed beach types, the generic erosion “Bruun” factor is indicated to be 20 for type 9 and 50 for type 5, though the recommended ‘generic factor’ for use in both cases is 50 (WRL, 2012). That is, for every 1m of sea level rise projected the horizontal erosion is estimated to be 50m. A Bruun Factor of 50 is adopted for this report Applying the Bruun Rule to estimate an appropriate allowance for possible recession due to the adopted sea level rise value for 2100 of 0.8 m (refer to section 2.1) therefore provides an indicative set back allowance as follows Recession = Bruun Factor X Sea Level Rise (section 7.5)
Recession = 50 x 0.8 m Allowance for recession due to sea level rise is adopted as 40 m.
4.4 Integrated Design Setback Allowance
Set back allowances estimated for the project area are summarised in the following. Table 3: Integrated erosion setback allowances
estimated storm
erosion
zone of reduced
foundation capacity
(ZRFC)
Sea level rise erosion
allowance
(generic Bruun rule)
Integrated allowance
for erosion
40m 20m 40m 100m
Total minimum setback recommended is 100m. The setback should be applied from the high water mark.
Annexure 24 - A1 - October 2015

Commercial – in – confidence
pitt&sherry ref: HB14638L001 CoastalVulRep 31P Rev00.docx/SR/as 21
For simplicity in applying the setback it is recommended that the 3.0m contour3 be used as the basis for establishing the setback areas. The 3m contour approximates the vegetation growth currently established on the seaward face of the dunes. While a ‘high water’ mark is considered to represent a more traditional mark for establishing boundaries use of the vegetation (and the 3m topographic contour) provides an additional level of conservancy in the estimation. The estimated setback allowance is provided for preliminary assessment of climate change impacts and is not suitable for specific design purposes without collection of specific geotechnical information and additional modelling.
5. Extreme Design Tidal Surface levels (Storm Surge Flooding)
The following section describes assessment of potential extreme tidal inundation estimated for the project area.
5.1 Extreme Tide Analysis
Two methods of estimation of a potential inundation allowance have been determined:
Assessment of individual tidal, wave and sea level rise contribution components
Assessment of integrated extreme tides developed from tide gauge analysis and incorporating projected sea level rise impacts (per the ACECRC, ‘Canute’ extreme sea level calculator) together with the additional wave setup contributions.
5.2 Tidal Planes
The specific tidal plane information for the project area is not known. Tidal plane information for the Port of Lady Barron together with the long record tide gauges at George Town and Point Lonsdale are indicated in Table 4 following:-
Table 4: Tidal planes (in m AHD)
Georgetown
(m above LAT)
Lady Barron4
(m chart datum)
Port Lonsdale (Vic)
(m relative to MSL)5
Highest Astronomical tide (HAT)
1.5 1.2 0.88
Mean Sea Level (MSL) 0.0 0.0 0.0
Lowest Astronomical Tide -2.0 -1.2
Variations of the tidal plane levels for the specific project area are not known to me.
3 As height above MSL measured in AHD. 4 Source: Australian Chart AUS 179 (Australian Hydrographic Service, 2002) 5 Australian Tide tables in McInnes et al, 2009
Annexure 24 - A1 - October 2015

Commercial – in – confidence
pitt&sherry ref: HB14638L001 CoastalVulRep 31P Rev00.docx/SR/as 22
5.3 Extreme Tide level projection for the year 2000
Water levels for a range of annual exceedance probabilities have been determined from long record tide gauges by the ACECRC (Hunter, 2008) and which have been projected by interpolation around the entire Australian coastline in the ACECRC’s ‘Canute’ sea level calculator. Relevant extreme tide levels, including storm surge, are indicated in Table 5 (extracted from the ACECRC ‘Canute’ sea level calculator - June 2015).
Table 5: Water level (m AHD) for various extreme tide probabilities
Location
Annual Exceedance Probability (AEP)
[~ Annual Recurrence Interval ARI,years]
Levels as at 2015
0.1 [10]
0.05 [20]
0.02 [50]
0.01 [100]
Georgetown levels (m AHD)
1.95 1.98 2.03 2.05
Point Lonsdale levels (m AHD)
1.27 1.30 1.34 1.37
Analysis of tide variations for the region of Bass Straight has been undertaken by the CSIRO (McInnes et al, 2010) and the distribution of various tidal levels is indicated in Figure 19 following.
Figure 19: Illustrative sea level maps for Tasmania (McInnes et al, 2010)
CSIRO modelling indicates that extreme tidal ranges in the project area are lower than those for the northern coast of the Tasmanian mainland. Consequently, it is considered that adoption of values determined for the Georgetown tide gauge will provide a conservative estimate of extreme tide values that may be experienced at the project site. A value of 2.05 m AHD is adopted as the 1% probability extreme tide level for the project area in the year 2015.
Annexure 24 - A1 - October 2015

Commercial – in – confidence
pitt&sherry ref: HB14638L001 CoastalVulRep 31P Rev00.docx/SR/as 23
5.3.1 Wave Setup Modelling
Large ocean waves can cause wave setup contributing to increased sea levels around beaches. Wave setup is defined as the quasi- steady increase in water level inside a surf zone due to the conversion of part of a wave’s kinetic energy into potential energy. The concept is illustrated in Figure 20 following
Figure 20: Components of elevated water levels (reproduced from WRL, 2012)
I am unaware of specific wave climate information for the project. An assessment of wave climate information summarised for the Australian coastline is provided in WRL (2011 and 2012) and is reproduced in Figure 21 following. The northern coast of mainland Tasmania and the southern section of the Victorian coastline are indicated to have 100 year ARI significant wave heights of 8m, while the eastern exposed sections of the coastline (northeast Tas and NSW) are indicated to have significant wave heights of 9m.
Figure 21: 100 year ARI Significant Wave Height (WRL, 2012)
The adopted significant wave height for use in wave setup estimation is 10 m.
Annexure 24 - A1 - October 2015

Commercial – in – confidence
pitt&sherry ref: HB14638L001 CoastalVulRep 31P Rev00.docx/SR/as 24
Extreme offshore waves and wave set-up
The estimated wave set-up such waves would cause at the shore of a dissipative beach can be estimated based on 15% of the offshore significant wave height, used as a general rule of thumb in the absence of detailed investigation6. An indicative estimate of wave setup indicates a super-elevation of 1.5 m above the still water levels. For this analysis, however, wave setup and run up calculation was determined in accordance with the US army coastal engineering manual7as presented in the ACECRC sea level calculator tool set. Based on a significant wave height of 10m, period of 10s and a beach gradient of .03 the estimated wave setup is 2.5 m. In addition to elevation above still water levels, for directly exposed beach faces, an additional component is allowed for wave run-up. Wave run-up is the maximum elevation of wave uprush above still-water level: it is the sum of the setup and incident wave runup (ACECRC,2015). Based on the adopted wave climate, the total potential inundation height, including an additional component of wave runup of 4.5 m, is estimated to be 7.0 m Inundation potential caused by wave activity, based on the design waves which may be experienced on the shore adjacent to the project area, is adopted as 7.0 m above the transitory elevated still water level including storm surge on a high tide.
5.4 Extreme Inundation Design Level for the Project Area
Given the occurrence of large waves is not independent from the barometric conditions contributing to sea surface level elevation, it is considered reasonable to combine the contributions as an integrated 1% inundation extreme sea level (Carley pers. com. 2010). The following table presents the estimate contributions to inundation for the project area that may be experienced in the event of extreme storm circumstances (estimated for a probability of 1% exceedance probability or a once in one hundred year event). Table 6: Extreme wave inundation contributions
Contribution Elevation (topographic
level)
Predicted storm surge tidal height (1% annual exceedance probability event) as at 2015
2.05 m (AHD)
Wave Setup 2.5 m
Wave Runup 4.5 m
Total 9.05 m (AHD)
The adopted 1% extreme storm surge inundation level adopted for 2015 is 9.05 m AHD.
6 Carley pers comm. (2010 and WRL technical report 2010/04, 2010).
7 U.S. Army Corps of Engineers, 2003: Coastal engineering manual. Publication Number EM 1110-2-1100, 215 pp.
EMA (Federal Emergency Management Agency), 2003. Guidelines and Specifications for Flood Hazard Mapping Partners, Appendix D: Guidance for Coastal Flooding Analyses and Mapping. Washington, DC: Federal Emergency Management Agency, 177p.
Annexure 24 - A1 - October 2015

Commercial – in – confidence
pitt&sherry ref: HB14638L001 CoastalVulRep 31P Rev00.docx/SR/as 25
5.5 Design Inundation Level for 2100
An estimated design inundation level for the project is obtained by combining the estimated inundation contributions that may be experienced during an extreme high tide in addition to contributions from the design wave activity and incorporating an allowance for climate change projected sea level rise. In addition it is considered appropriate to incorporate an allowance for design freeboard for infrastructure floor levels. The total combined inundation allowance is presented in Table 7 following:- Table 7: Design Inundation Levels
2015 2100
Predicted storm “surge” tidal height (1% AEP event)
2.05 m AHD 2.05 m (AHD)
Wave Setup 2.5 m 2.5 m
Sea Level Rise 0.0 m 0.8 m
Free board allowance 0.3 m 0.3 m
TOTAL INUNDATION Design Level
(excl wave runup) 4.85 m AHD 5.65 m AHD
Wave runup allowance* 4.5 m 4.5 m
Vulnerability design level (incl wave runup)
9.35 m AHD 10.15 m AHD
It should be noted however, that the estimation does not imply that inundation or erosion will be observed in the project area or that values exceeding those estimated may not occur.
5.6 Other Climate Change and Ocean Process Effects
A number of potential contributions to coastal flood risk and erosion have not been assessed in detail for this study, namely underlying beach recession, shoreline rotation, varied long term wind speeds and potential land subsidence. Analysis of long term underlying recession was beyond the scope of the project, however, based on estimation of geology for the project area it is considered likely that the presence of significant hard outcropping rock particularly for the northern sections of the project area will limit the magnitude of underlying recession to within the bounds of precision incorporated in the adopted values applied above. Beach rotation occurs when erosion occurs at varying rates along the foreshore contributing to differing recession and/or progradation of the shoreline and a subsequent rotation. Assessment of potential rotation as beyond the scope of the report, though it is noted however, that the beach is not considered to be uniform for its entire width with the southernmost portion indicating a shallower profile than the northernmost section. The presence of hard lithology ‘bedrock’ interpreted to underlay the northern section further indicates that uniform recession is unlikely. Detailed modelling of the specific effects of underlying rock and the varying shoreline profile was beyond the scope of the project.
Annexure 24 - A1 - October 2015

Commercial – in – confidence
pitt&sherry ref: HB14638L001 CoastalVulRep 31P Rev00.docx/SR/as 26
However, it is noted that the project proponents have designed all elements of hard infrastructure (ie buildings) to be situated towards the northern half of the project area and consequently within sections of the beach for which the estimated recession allowances are considered to be more conservative8. Altered wind speeds as a result of climate change may contribute to an increased intensity of storms and consequently increase the effects of waves through wave setup and storm erosion. However, the potential changes to these effects are considered to be within the conservative allowances used in the estimations of impacts. The potential effects of land subsidence, which may impact on the project site by lowering the land level and in effect simulating sea level rise, has not been assessed for the project area. Tasmania is considered to be within a relatively stable tectonic plate and this effect is likely to be negligible within the short time frame considered in this report.
8 More conservative in that the estimate is considered to represent allowance for a more pessimistic or low
likelihood scenarios.
Annexure 24 - A1 - October 2015

Commercial – in – confidence
pitt&sherry ref: HB14638L001 CoastalVulRep 31P Rev00.docx/SR/as 27
6. Impact of Setback Allowance and Design Inundation Level
6.1 Adopted Design Setback Allowance and Inundation Level
The following figure (Figure 22) provides an indication of the recommended 100 m setback allowance overlain on the project area.
Figure 22: Setback allowance for coastal erosion
The minimum 100 m set back allowance (shown as the orange zone) incorporates the allowances for storm erosion and sea level rise induced recession and are to be applied for the northern half of the project area. The following figures (Figure 23 and Figure 24) indicate the set back allowance on preliminary concept plans for the proposed development and incorporating mapped geology respectively.
Annexure 24 - A1 - October 2015

Commercial – in – confidence
pitt&sherry ref: HB14638L001 CoastalVulRep 31P Rev00.docx/SR/as 28
Figure 23: Set back allowance on preliminary concept plan
Figure 24: 100 m setback allowance on concept plan overlain with mapped geology
Annexure 24 - A1 - October 2015

Commercial – in – confidence
pitt&sherry ref: HB14638L001 CoastalVulRep 31P Rev00.docx/SR/as 29
Figure 25: Erosion setback Allowance and Inundation level on concept plan
Annexure 24 - A1 - October 2015

Commercial – in – confidence
pitt&sherry ref: HB14638L001 CoastalVulRep 31P Rev00.docx/SR/as 30
For comparison with the proposed development, the flowing figure (Figure 26) indicates an equivalent inundation level (10 m AHD) overlain on the existing township of Killiecrankie, confirming the conservative approach adopted in this report.
Figure 26: Killiecrankie developed area indicating 10m topographic contour
6.1.1 Impact of Erosion Setback Allowance on the proposed Concept Development
As depicted in the majority of development proposed for the Quoin concept are located well outside (inland and at higher elevations) than the indicated set back allowance. The approximate location of the proposed main facility is indicated to have built infrastructure further inland than the indicated erosion setback recommended and is considered unlikely to be impacted by coastal erosion process including allowance for climate change by the end of the century. Villa sites 5 and 6 as currently indicatively marked (Figure 23) however contain the eastern edges of the site boundary closer to the coast than the indicated allowance for erosion. While development within indicated villa sites 5 and 6 does not need to be precluded it is recommended that any built ‘hard’ infrastructure be sited at the upper elevations (ie landward side) of the marked site and sited a minimum of 100 m from the high water mark9. For development proposed close to the indicated erosion setback allowance it is recommended that specific detailed geotechnical assessment of foundation stability be investigated to ensure appropriate foundation structures.
9 Note the setback boundary depicted in this report has been drawn from the supplied 3 m topographic contour which is likely
to be further inland than the high water mark and represents an additional element of conservatism incorporated in the indicated allowance.
Annexure 24 - A1 - October 2015
Commercial – in – confidence
pitt&sherry ref: HB14638L001 CoastalVulRep 31P Rev00.docx/SR/as 31
‘Soft’ Infrastructure
The set back allowance zone is considered to represent areas which may potentially be subject to coastal erosion and consequently it is recommended that permanent ‘hard’ structures such as residences be excluded from the zone. Soft activities including for recreational use are considered unlikely to be significantly affected by coastal erosion processes and are typically likely to be easily relocated or incorporate any modified environment as features within the use. It is not considered necessary to preclude soft infrastructure from the zone allowed for coastal erosion processes subject to compliance with State and local council requirements for coastal development (refer to section 3.2.2).
6.1.2 Impact of Inundation Level on the proposed Concept Development
As identified in this report, while considered conservative, it is possible that by the end of the century, the coastal zone in the project area may be subject to extreme storm event that results in inundation levels reaching an altitude of 9.8 m. With a recommended design floor freeboard allowance of 0.3 m this report identifies 10.1 m as a level below which permanent hard infrastructure should be avoided. As depicted in Figure 23 no hard infrastructure development is proposed for areas at lower elevation than 10 m. The design level estimated to represent a 1% probability event (or potential occurrence of once on average every 100 yrs) may never be observed or alternatively may in fact be exceeded during extreme storm conditions. It should be noted that the estimated inundation design level represents the peak of an extreme high tide event and as such the inundation is likely to cause inundation for no more than a few hours. It may be possible that the extreme storm conditions producing the storm tide may persist into the next tidal cycle when inundation levels approaching the estimated design level may be repeated.
7. Discussion / Conclusions
The following points are made based on the assessment of the available technical data:- Climate change is projected to cause numerous variations from the historic climate experienced at the project area.
The majority of the changes projected are considered to have negligible impact on the proposed development. It is recommended that development designs incorporate consideration of projected increases in rainfall intensity and overland run-off flows in the design of stormwater runoff and drainage management systems.
A detrimental change in the projected future climate which may potentially impact on the proposed development is an increase in sea levels.
Coastal Erosion / Recession Design Setback
A design setback of 100 m from high water has been estimated as appropriate to accommodate a combination of recession due to sea level processes and storm erosion, incorporating an allowance for climate change induced sea level rise.
Annexure 24 - A1 - October 2015

Commercial – in – confidence
pitt&sherry ref: HB14638L001 CoastalVulRep 31P Rev00.docx/SR/as 32
It is recommended that built ‘hard’ infrastructure be sited a minimum of 100 m from the high water mark10. The setback allowance is considered to be appropriate for coastline adjacent to the majority of the proposed project site it is considered to be highly conservative for the northern portion of the project area where the dunes and vegetation are formed over granodiorite. The zone is considered to represent area that may be affected by short duration 1% annual exceedance probability storm events and longer term processes to the end of this century. While development does not need to be precluded from the allowance zone it should be recognised that the zone represents areas where potential coastal processes may impact on any structures or infrastructure. For development proposed close to the indicated erosion setback allowance it is recommended that specific detailed geotechnical assessment of foundation stability be investigated to ensure appropriate foundation structures.
Design Inundation Level
An inundation level of 10.1 m AHD is adopted as a conservative estimate of potential areas affected by coastal inundation processes in a 1% annual exceedance probability event at the end of the century The maximum inundation level would likely be reached gradually over a tidal cycle and with the extreme design level representing inundation only at the peak of the extreme tide. The estimation does not imply this inundation event will occur or that an inundation event of greater depth is not possible. Future designs of the development should accommodate the inundation level that could potentially occur on the site. Future treatment or design of onsite stormwater and waste water management must also consider the potential future water table levels and the possibility of inundation from extreme tides.
8. Recommendations
To ensure that potential impacts resulting from projected changes in climate at the project site over the remainder of the century are considered in design the following recommendations are made:-
It is recommended that development designs incorporate consideration of projected increases in rainfall intensity and overland run-off flows in the design of stormwater runoff and drainage management systems.
It is recommended that built ‘hard’ infrastructure be sited a minimum of 100 m from the high water mark11.
10 Note the setback boundary depicted in this report has been drawn from the supplied 3 m topographic contour which is likely
to be further inland than the high water mark and represents an additional element of conservatism incorporated in the indicated allowance. 11 Note the setback boundary depicted in this report has been drawn from the supplied 3m topographic contour which is likely to
be further inland than the high water mark and represents an additional element of conservatism incorporated in the indicated allowance.
Annexure 24 - A1 - October 2015

Commercial – in – confidence
pitt&sherry ref: HB14638L001 CoastalVulRep 31P Rev00.docx/SR/as 33
For any development proposed close to the indicated erosion setback allowance it is recommended that specific detailed geotechnical assessment of foundation stability be investigated to ensure appropriate foundation structures.
The design of the proposed development should acknowledge that, based on a global high greenhouse gas emissions scenario, the extreme tidal inundation level that could potentially occur on the site including localised affects of wave run-up is in the order of 9.8 m AHD for a 1% probability event by 2100. Incorporating a free board allowance of 300 mm the minimum floor level for any design proposed for the development should be greater than 10.1 m AHD
Appropriate drainage will be required to ensure any constructed infrastructure and final project does not contribute to impedance of the outflow of sea water which may infiltrate the lower sections of the site during an extreme inundation event.
Design of onsite stormwater and waste water management must take account of the water table and the possibility of inundation from extreme tides.
Geotechnical analysis could be undertaken to determine more precise information for use in quantifying potential storm erosion and reduced foundation capacity setback distances should construction or infrastructure be planned within either the indicated set back allowance or the area of potential inundation.
It is considered that for the northern section of the project area, providing that built infrastructure proposed for the development as indicated in initial concept plans is restricted to sites inland of the indicated setback boundary, a minimum of 100m from the high water mark, for the purposes of the State Coastal Policy the proposed development will not involve construction within or impact on ‘actively mobile landforms’.
9. References
Antarctic Climate & Ecosystems Cooperative Research Centre (ACE CRC), 20150. Estimating Sea Level Rise in an Uncertain Future. Sea Level rise extremes assessment Web Tool. web tool www.slr.sealevelrise.info accessed on May 2015.
Bruun, P., 1988, “The Bruun Rule of Erosion by Sea Level Rise: A Discussion on Large Scale Two- and Three-Dimensional Usages”, Journal of Coastal Research, 4(4), 627-648.
Carley, J.T. 2004 Stanley Tasmania Coastal Climate Change Case Study. The University of New South Wales School of Civil and Environmental Engineering Water Research Laboratory. WRL Technical Report to Pitt&Sherry 2008.
ClimateAsyst, 2015. Climate change vulnerability and communication tool. http://www.pittsh.com.au/climateasyst/ accessed 20 April 2015.
DCC, Department of Climate Change, Climate Change Risks to Australia's Coasts, A First Pass National Assessment. 2009. http://www.climatechange.gov.au/publications/coastline/climate-change-risks-to-australias-coasts.aspx. Accessed May 2015.
DPIPWE, 2008. Sea-Level Extremes in Tasmania, Summary and Practical Guide for Planners and Managers.
Annexure 24 - A1 - October 2015

Commercial – in – confidence
pitt&sherry ref: HB14638L001 CoastalVulRep 31P Rev00.docx/SR/as 34
Hunter, J. 2008, Historical and Projected Sea-Levels Extremes for Hobart and Burnie, Tasmania, Technical Report prepared by the Antarctic and Climate and Ecosystems Cooperative Research Centre – December 2007. Published by the Department of Primary Industries and Water, Tasmania.
Hunter, J., 2010. Estimating Sea-Level Extremes Under Conditions of Uncertain Sea-Level Rise, Climatic Change, 99:331-350, DOI:10.1007/s10584-009-9671-6.
IPCC (2001), Intergovernmental Panel on Climate Change, Technical Summary of the Working Group I Report and summary for Policymakers, The United Nations Intergovernmental Panel on Climate Change, Cambridge, University Press, UK. 2001
IPCC (2007), Intergovernmental Panel on Climate Change, Climate Change – The Physical Science Basis. Contribution of Working Group I to the Fourth Assessment Report of the Intergovernmental Panel on Climate Change, (ISBN 978 0521 88009-1 Hardback; 978 0521 70596-7 Paperback), [Solomon, S., D. Qin, M. Manning, Z. Chen, M. Marquis, K.B. Averyt, M. Tignor and H.L. Miller (eds.)]. Cambridge University Press, Cambridge, United Kingdom and New York, NY, USA, 996 pp. 2007
Kulmar, M., D.Lord & B.Sanderson, 2005. “Future Directions For Wave Data Collection In New South Wales”, Proceedings of Australasian Coasts and Ports conference, Adelaide, The Institute of Engineers Australia.
Lord, D.B. and M. Kulmar, 2000. “The 1974 storms revisited: 25 years Experience in Ocean Wave Measurement along the South East Australian Coast”, Proceedings International Conference of Coastal Engineering, pp 559-572, American Society of Civil Engineers, USA.
MRT (Mineral Resources Tasmania), 2015. Geologic and airborne geophysical imagery. http://www.mrt.tas.gov.au accessed and reviewed April 2015.
Nielsen, A.F., D.B.Lord & H.G.Poulos, 1992. Dune Stability Considerations for Building Foundations. Engineers Australia, Vol CE34, No 2, June.
NCCOE, National Committee on Coastal and Ocean Engineering, Engineers Australia, 2004. Guidelines for responding to the effects of Climate Change in coastal and Ocean Engineering, The Institution of Engineers Australia.
OZcoasts, 2015. Australian Online Coastal Information. Geoscience Australia. http://www.ozcoasts.gov.au/index.jspe. accessed April 2015.
Page, L. and Thorp, V. (2010), Tasmanian Coastal Works Manual: A best practice management guide for changing coastlines. Department of Primary Industries, Parks, water and Environment (DPIPWE). http://dpipwe.tas.gov.au/conservation/coastal-and-marine-environment/managing-the-coast/tasmanian-coastal-works-manual accessed March 2015.
Pilkey,O.H and J.A.G. Cooper, 2004. “Society and Sea Level Rise”, Science, 303, pp1781-1782.
Ranasinghe, Roshanka, Phil Watson, Doug Lord, David Hanslow and Peter Cowell, 2007. “Sea Level Rise, Coastal Recession and the Bruun Rule”, Proceedings of Australasian Coasts and Ports Conference, Melbourne, The Institute of Engineers Australia.
Annexure 24 - A1 - October 2015

Commercial – in – confidence
pitt&sherry ref: HB14638L001 CoastalVulRep 31P Rev00.docx/SR/as 35
Sharples, C. 2006. Indicative Mapping of Tasmanian Coastal Vulnerability to Climate Change and Sea Level Rise: Explanatory Report; 2nd Edition. Consultant Report to Department of Primary Industries & Water, Tasmania. http:/www.dpiw.tas.gov.au/climatechange.
Sharples 2012, The problem of the use of ambiguous terms in Tasmanian coastal planning policy documents for defining appropriate coastal development zones. Reproduced in Cromer, 2015. Foredunes and coastal development in Tasmania. http://www.williamccromer.com/foredunes-and-coastal-development-in-tasmania/ accessed May 2015.
“Smartline”, 2015. Refer to Ozcoasts, 2015.
Smith, G. 2013. Definition of Frontal Dunes. Unpublished professional opinion research investigation, Water Research Laboratory – The University of New South Wales.
TASMANIAN STATE COASTAL POLICY 1996 - Revised 16 April 2003 in accordance with the State Coastal Policy Validation Act 2003, Revised to take account of a minor amendment that was Gazetted on 25 February 2009
TCCO, 2012, Tasmanian Climate Change Office. ,Derivation of the Tasmanian Sea Level Rise Planning Allowances Technical Paper August 2012
TheList, 2015. Tasmanian Government online mapping system. Cadastral and 250K geological maps www.theLIST.tas.gov.au accessed on 6 May 2015.
U.S. Army Corps of Engineers, 2003: Coastal engineering manual. Publication Number EM 1110-2-1100, 215 pp. EMA (Federal Emergency Management Agency), 2003. Guidelines and Specifications for Flood Hazard Mapping Partners, Appendix D: Guidance for Coastal Flooding Analyses and Mapping. Washington, DC: Federal Emergency Management Agency, 177p.
WRL (2011). “Coastal Storm Data Analysis: Provision of Extreme Wave Data for Adaptation Planning”, Research report for National Climate Change Adaptation Research Facility 2011.
WRL (2012). “Generic Design Coastal Erosion Volumes and setbacks for Australia”, report for Antarctic Climate and Ecosystems Cooperative Research Centre, 2012.
Annexure 24 - A1 - October 2015

pitt&sherry ref: HB14638L001 CoastalVulRep 31P Rev00.docx/SR/as
Appendix A
Important Information about your Report
Annexure 24 - A1 - October 2015

pitt&sherry ref: HB14638L001 CoastalVulRep 31P Rev00.docx/SR/as
Appendix B
Climate Change Summary for Flinders Island
Annexure 24 - A1 - October 2015

transport | community | industrial & mining | carbon & energy
E: [email protected] W: www.pittsh.com.au
incorporated as Pitt & Sherry (Operations) Pty Ltd ABN 67 140 184 309
Brisbane Level 2 276 Edward Street Brisbane QLD 4000 T: (07) 3221 0080 F: (07) 3221 0083 Canberra LGF, Ethos House 28-36 Ainslie Place Canberra City ACT 2601 PO Box 122 Civic Square ACT 2608 T: (02) 6274 0100
Launceston Level 4 113 Cimitiere Street PO Box 1409 Launceston TAS 7250 T: (03) 6323 1900 F: (03) 6334 4651 Melbourne Level 1, HWT Tower 40 City Road Southbank VIC 3006 PO Box 259 South Melbourne VIC 3205 T: (03) 9682 5290 F: (03) 9682 5292
Devonport Level 1 35 Oldaker Street PO Box 836 Devonport TAS 7310 T: (03) 6424 1641 F: (03) 6424 9215 Hobart 199 Macquarie Street GPO Box 94 Hobart TAS 7001 T: (03) 6210 1400 F: (03) 6223 1299
Best Consulting Engineering Firm (revenue under $50 million) Best Professional Service Firm (revenue under $50 million)
Contact Sven Rand 03 6323 1900 [email protected]
Annexure 24 - A1 - October 2015