smud’s pv program: - donald aitken associates€¦ · web viewit is also important to realize...
TRANSCRIPT
SMUD PV PROGRAM REVIEW
SMUD’S PV PROGRAM:Past, Present, and Future
FINAL REPORTDecember 30, 2000
A Report to the Sacramento Municipal Utility District
Prepared by:
Donald W. Aitken, Ph.D.Donald Aitken Associates
Warren SchirtzingerHigh Tech Strategies, Inc.
Steven StrongSolar Design Associates
Sponsored by theSacramento Municipal Utility District
SMUD Consulting Services Contract No. I-143
SMUD Project ManagerDonald E. Osborn

1
EXECUTIVE SUMMARY
This SMUD PV Program Review looks at elements of SMUD’s PV Program success to date, assesses what elements may continue to work in the future, and suggests ways in which SMUD’s program might be progressively reoriented to place it in a position of long term sustainability while also becoming internally self-supporting. This study was initiated by the Solar Program within SMUD, under the direction of Donald Osborn.
Section 1: Overview of SMUD’s PV Program Technology Decisions and Experience
From the beginning SMUD elected not to choose a single type of PV application, but rather to gain both technical and economic experience from multiple applications. Early on, however, they made a decision to go for applications that would allow them to purchase PV modules by bid in substantial quantities, to progressively reduce the cost of their PV along a “Sustained Orderly Development and Commercialization” (SODC) path. In this regard, SMUD did not place much emphasis on the “high value”, but small and labor-intensive, “niche” markets, preferring to reduce market costs for the majority of its customers, rather than simply to exploit applications that are already cost-effective within present market costs.
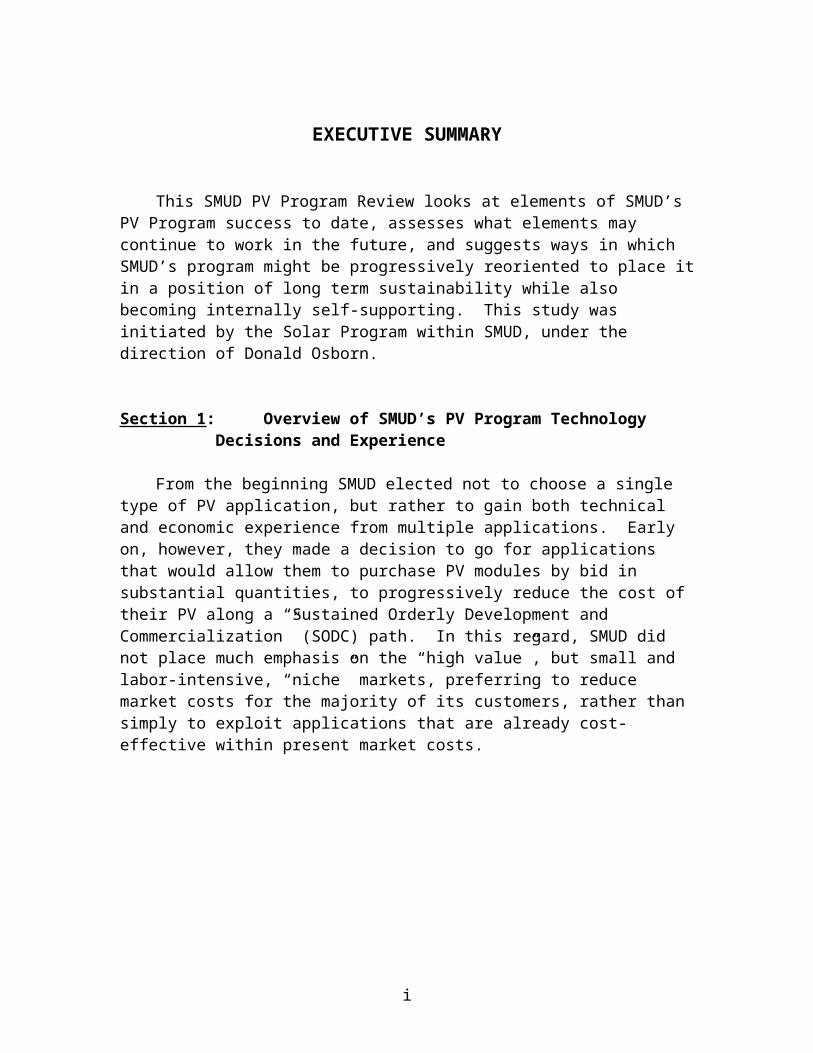
Figure ES-1
i
SMUD put more effort into their residential solar applications than into any other single program area. During the first years of the “PV Pioneer Program” the homeowner simply lent his roof—and paid a small surcharge to SMUD for that favor—with the PV connected into the utility side of the meter, to give SMUD experience in the application of distributed PV resources within its system, and to gain the confidence of SMUD’s customers for having PV on their homes. This then evolved into their “PV Pioneer II” program, in which the homeowners pay a subsidized amount for their systems, but claim complete ownership of them and gain the benefit of the power into their side of the meter, in a “net metered” configuration with the grid. The residual subsidized cost to the customer is low enough to justify the purchase of the PV system on a 30-mortgage with normal bank financing.
SMUD managed to support their PV Program with a combination of fees from Pioneer I customers, fees charged for their services, and a portion of the “Public Goods Surcharge” that they imposed upon themselves, with total residual PV program costs equaling about 0.6% of gross revenues. The Solar Program was not helped internally in this matter by the failure of other operations within SMUD to ascribe real value to peak-load reduction and system operation benefits from the PV installed in the district, making the SMUD PV program actually appear to be more costly for SMUD than it is.
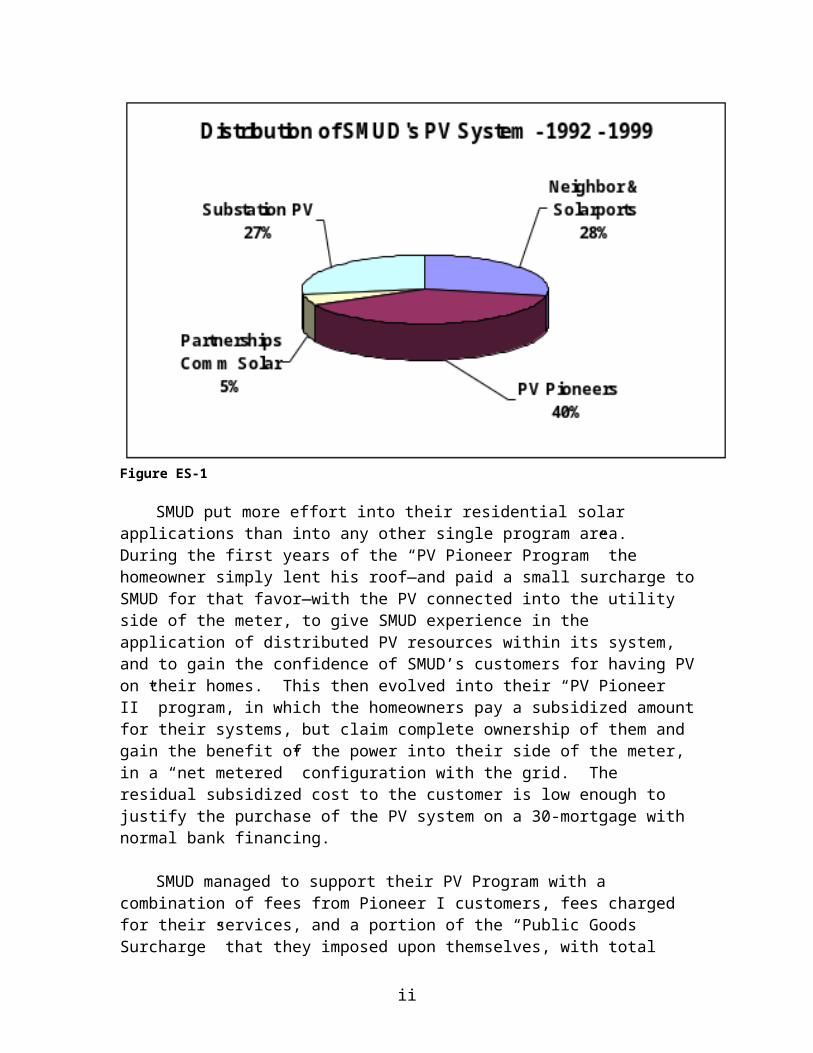
Table ES-1: Utility Benefits Summarized
Benefits DescriptionService Revenues (Economic Development)
Net service revenues from a new local PV manufacturing plant (result of economic development efforts)
Externalities Value of reduced fossil emissionsFuel Price Risk Mitigation Value of reducing risk from uncertain gas price projectionsGreen Pricing Voluntary monthly contributions from PV PioneersLosses Electric loss reduction (accounted for in each benefit)Distribution Distribution capacity investment deferralSub-Transmission Sub-Transmission capacity investment deferralBulk-Transmission Transmission capacity investment deferralCapacity Avoided marginal cost of systemwide generation capacityEnergy Avoided marginal cost of systemwide energy productionReduced Peak Time Purchases Avoided peak pricing on energy purchases
SMUD backed up their PV Program with strong technical support, quality control and quality assurance, and warranty backing, resulting in excellent system performance with high availability and reliability.
ii
Section 1 Recommendations
The authors of this Review believe that SMUD’s emphasis on residential rooftop applications of PV should be continued, as this will be the largest, most stable market within its District, and allows for cost-reducing standardization.
It is important, as future phases of the program take form, that SMUD continues to maintain contractual flexibility in terms of options, so that the program’s success is not dependent on any single supplier.
SMUD should work with their chosen suppliers to identify ways to mitigate the area-related penalty from low-efficiency PV at both the module and system level.
SMUD should work with their chosen contractors and suppliers to identify and/or develop cost-effective methods to retrofit residential rooftop systems on non-composition roofs.
SMUD should work with their chosen suppliers to identify ways to expand the options for PV roof-integration in new residential and light commercial constructions, as well as for roof replacements.
SMUD should work with their chosen suppliers to develop PV-friendly design and construction approaches that make future retrofits easier.
SMUD should work with their chosen suppliers to expand the range of cost-competitive hardware options for BIPV to commercial buildings.
SMUD should investigate the prospect of offering residential PV Pioneer II customers a battery bank option capable of carrying some portion of the house loads through a “typical” power outage, to tap into the market segment where reliability of electrical service is an important feature.
SMUD needs to develop a closer integration of their energy efficiency and solar programs to realize the benefits of both as part of an overall approach.
As solar domestic water heating (SDWH) can return three to four times the energy savings per unit roof area as PV, the SDWH program should be vigorously pursued and integrated with the efficiency and solar programs.
As the popularity of the PV Pioneer II systems continues to grow, SMUD should begin to develop PV Pioneer II systems for commercial buildings.
SMUD should concentrate on their own service territory first and foremost, as this provides the greatest opportunity for achieving their program goals.
SMUD absolutely must give internal recognition for actual value added to SMUD operations and cost reductions for operations and infrastructure by the PV systems installed in its District.
In the promotion of the PV Pioneer II options, SMUD should emphasize the highly valued but intangible benefits of owning a PV system, and capitalize on the security of having it backed by SMUD—a known and trusted partner in the community which will be there for the long term.
Section 2: SMUD’s PV Market Development and its Relationship to Other Utility Programs
iii
The involvement of SMUD in photovoltaic applications began seriously with their installation in 1984 of their first 1MW PV powerplant, and they have not looked back. SMUD’s goal is to obtain half of its energy from energy efficiency, existing hydroelectric plants, and renewable energy resources, but SMUD has also determined that the SMUD Solar Program is a business development and commercialization activity.
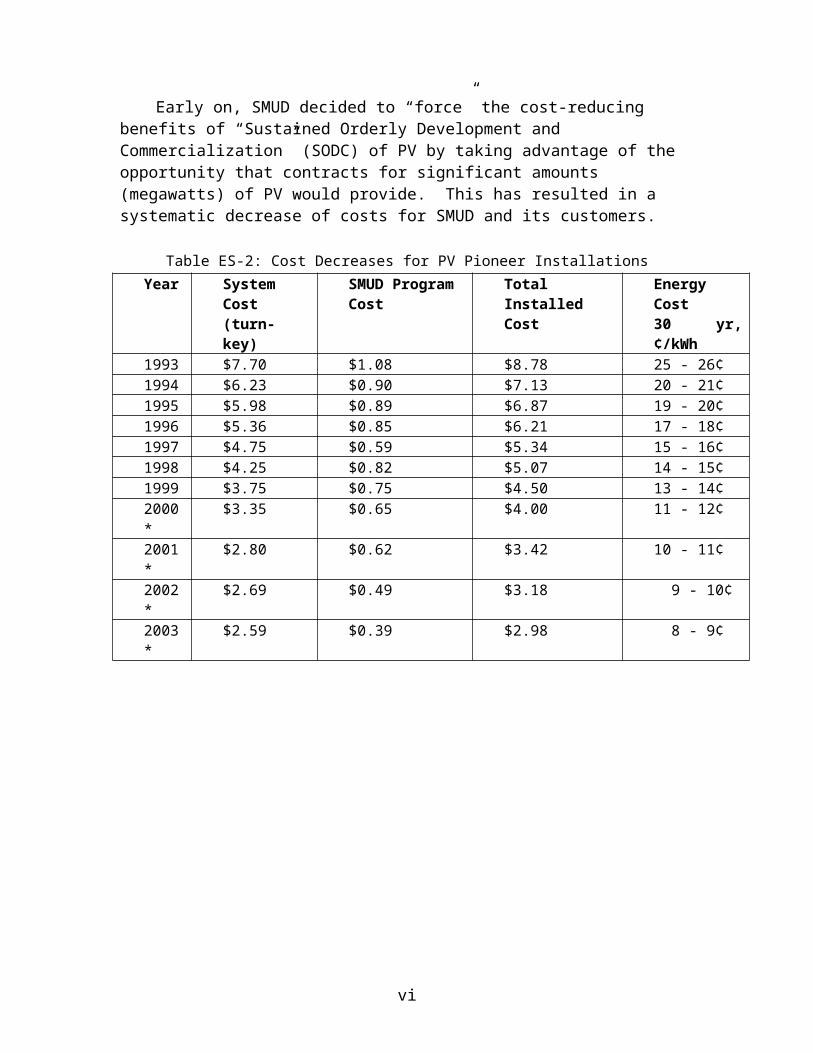
Early on, SMUD decided to “force” the cost-reducing benefits of “Sustained Orderly Development and Commercialization” (SODC) of PV by taking advantage of the opportunity that contracts for significant amounts (megawatts) of PV would provide. This has resulted in a systematic decrease of costs for SMUD and its customers.
Table ES-2: Cost Decreases for PV Pioneer InstallationsYear System Cost
(turn-key)SMUD ProgramCost
Total InstalledCost
Energy Cost30 yr, ¢/kWh
1993 $7.70 $1.08 $8.78 25 - 26¢1994 $6.23 $0.90 $7.13 20 - 21¢1995 $5.98 $0.89 $6.87 19 - 20¢1996 $5.36 $0.85 $6.21 17 - 18¢1997 $4.75 $0.59 $5.34 15 - 16¢1998 $4.25 $0.82 $5.07 14 - 15¢1999 $3.75 $0.75 $4.50 13 - 14¢2000* $3.35 $0.65 $4.00 11 - 12¢2001* $2.80 $0.62 $3.42 10 - 11¢2002* $2.69 $0.49 $3.18 9 - 10¢2003* $2.59 $0.39 $2.98 8 - 9¢
iv
It was also important for SMUD to contribute to the larger economic development goals of the City of Sacramento. A long-term contract with EPV for the manufacture of PV within the Sacramento City limits, as well as for Trace inverters to be assembled within Sacramento, bring significant additional economic benefits to the City.
SMUD participates in the “Utility Photovoltaic Group” (UPVG), an organization of over 100 utilities with some interest in the development and application of PV. While it might then be expected that the success of SMUD’s large effort in PV applications would lead to a number of replications, this has not turned out to be the case. Only two municipal utilities have renewable programs with elements and goals that reflect portions of SMUD’s, the Los Angeles Department of Water and Power (LADWP) and Austin Energy. The LADWP program stands alone in its goals for the application of PV, but has slipped in the last couple of years in getting its ambitious program launched full-scale. Investor-owned utilities are still driven by short-term price motives, and are only engaged in PV applications either as part of their “green” programs, financed by surcharges, or in response to governmental mandates, such as renewable portfolio standards (required percentage increases over time for renewable energy applications). SMUD, therefore, continues to pioneer its integrated, large-scale PV program and thereby to provide valuable potential experience for other, later followers.
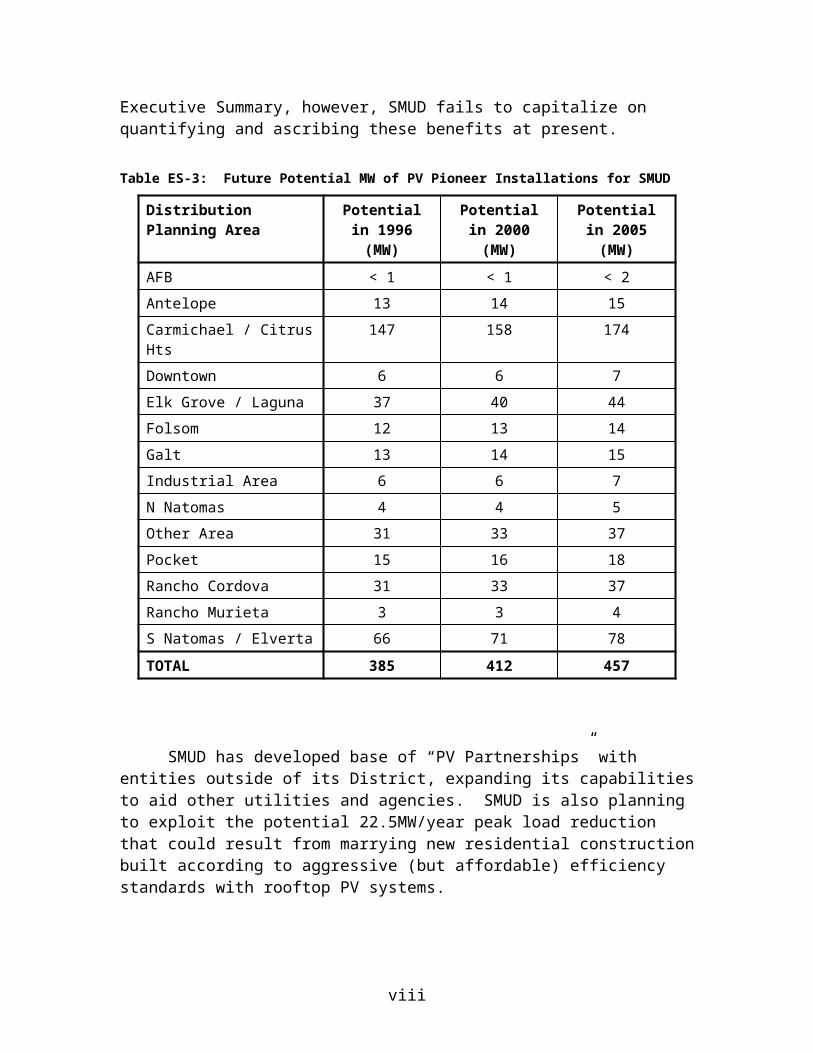
SMUD has the opportunity within its own District, provided it carefully targets its evolving customer segments (see Section 3), to maintain a stable PV program for many years to come. The ability of SMUD to remain organized as a “vertically integrated” company, whereas the investor-owned utilities are being disaggregated into multiple entities, gives SMUD a uniquely valuable framework for realizing the benefits of PV within its various operations, all under one financial accounting system. As noted earlier in this Executive Summary, however, SMUD fails to capitalize on quantifying and ascribing these benefits at present.
Table ES-3: Future Potential MW of PV Pioneer Installations for SMUD
Distribution Planning Area
Potential in 1996 (MW)
Potential in 2000 (MW)
Potential in 2005 (MW)
AFB < 1 < 1 < 2Antelope 13 14 15Carmichael / Citrus Hts 147 158 174Downtown 6 6 7Elk Grove / Laguna 37 40 44Folsom 12 13 14Galt 13 14 15Industrial Area 6 6 7N Natomas 4 4 5Other Area 31 33 37Pocket 15 16 18
v
Rancho Cordova 31 33 37Rancho Murieta 3 3 4S Natomas / Elverta 66 71 78
TOTAL 385 412 457
SMUD has developed base of “PV Partnerships” with entities outside of its District, expanding its capabilities to aid other utilities and agencies. SMUD is also planning to exploit the potential 22.5MW/year peak load reduction that could result from marrying new residential construction built according to aggressive (but affordable) efficiency standards with rooftop PV systems.
Section 2 Recommendations
SMUD should continue to seek to make the PV program self-supporting within SMUD—indeed, possibly an internal “profit” center—so that SMUD’s public goods funds can be allocated to other socially important needs (e.g. low-income, efficiency, or RD&D).
SMUD should nevertheless continue subsidies at a modest level for the PV program, even as it becomes essentially self-supporting, to continue to accelerate the accrual of benefits.
SMUD needs to continue to obtain PV systems at bulk, multi-year prices, and to pass the savings on to their customers, to provide incentives to a long-term market in their District.
SMUD should more vigorously identify and exploit other “niche” markets for PV in its District, but not let this drain attention or resources from the primary large-volume installation programs, e.g. BIPV.
SMUD should continue and expand their “PV Partnership Program”, with “profits” going to defray some PV program and personnel costs, but not let this drain attention or resources from the primary large-volume installation programs within their District.
SMUD should continue to develop their PV-in-new-construction program, in conjunction with their own architectural department, and to strive for the goal of “zero net peak demand” new houses, as their District customer-base expands.
SMUD should continue to collaborate actively with other utilities; local, state and federal agencies; and other stakeholders, to continue to facilitate the application of PV and the reduction of costs.
vi
Section 3: A Blueprint for Commercialization
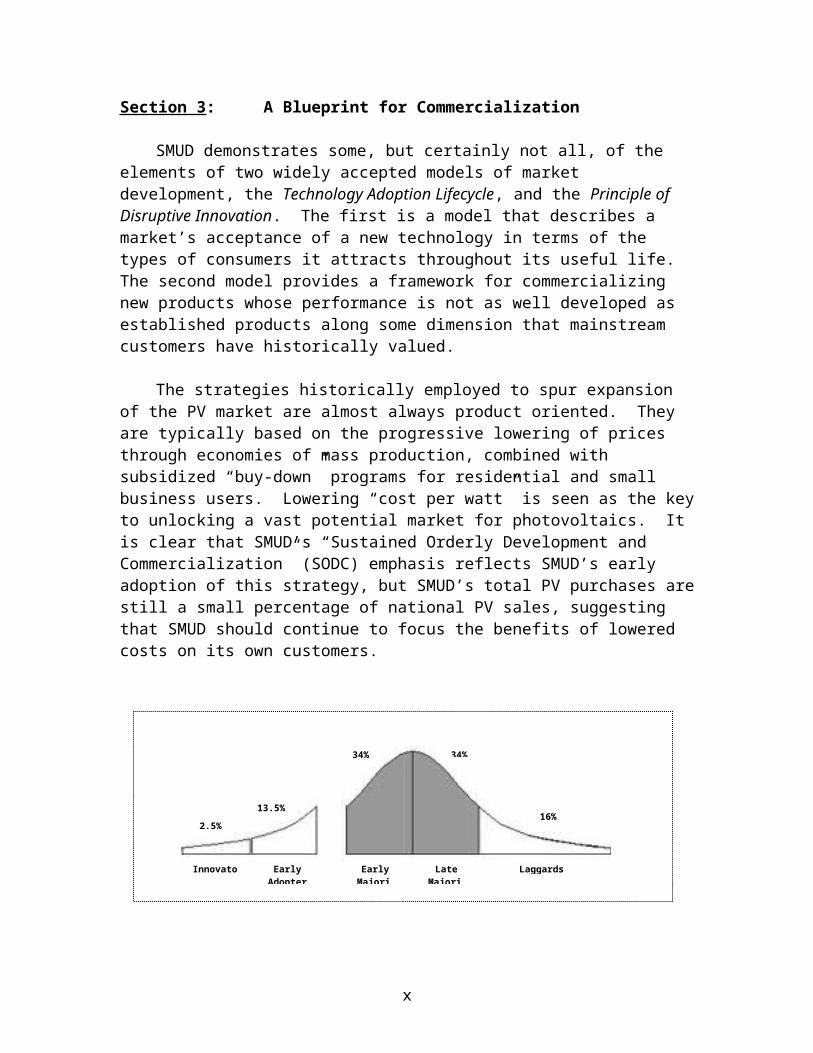
SMUD demonstrates some, but certainly not all, of the elements of two widely accepted models of market development, the Technology Adoption Lifecycle, and the Principle of Disruptive Innovation. The first is a model that describes a market’s acceptance of a new technology in terms of the types of consumers it attracts throughout its useful life. The second model provides a framework for commercializing new products whose performance is not as well developed as established products along some dimension that mainstream customers have historically valued.
The strategies historically employed to spur expansion of the PV market are almost always product oriented. They are typically based on the progressive lowering of prices through economies of mass production, combined with subsidized “buy-down” programs for residential and small business users. Lowering “cost per watt” is seen as the key to unlocking a vast potential market for photovoltaics. It is clear that SMUD’s “Sustained Orderly Development and Commercialization” (SODC) emphasis reflects SMUD’s early adoption of this strategy, but SMUD’s total PV purchases are still a small percentage of national PV sales, suggesting that SMUD should continue to focus the benefits of lowered costs on its own customers.
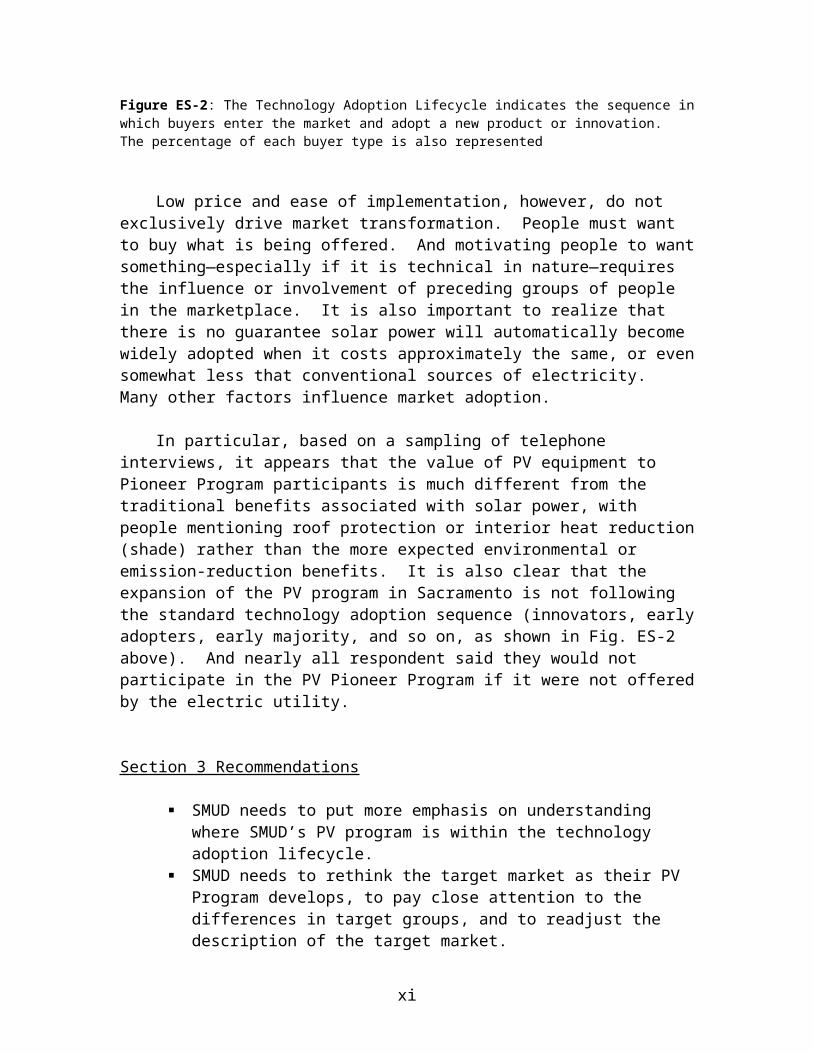
Figure ES-2: The Technology Adoption Lifecycle indicates the sequence in which buyers enter the market and adopt a new product or innovation. The percentage of each buyer type is also represented
Low price and ease of implementation, however, do not exclusively drive market transformation. People must want to buy what is being offered. And motivating people to want something—especially if it is technical in nature—requires the influence or involvement of preceding groups of people in the marketplace. It is also important to realize that there is no guarantee solar power will automatically become widely adopted when it costs approximately the same, or even somewhat less that conventional sources of electricity. Many other factors influence market adoption.
In particular, based on a sampling of telephone interviews, it appears that the value of PV equipment to Pioneer Program participants is much different from the traditional benefits associated with solar power, with people mentioning roof protection or interior
2.5%
34% 34%
16%13.5%
Innovators EarlyAdopters
EarlyMajority
LaggardsLateMajority
vii
heat reduction (shade) rather than the more expected environmental or emission-reduction benefits. It is also clear that the expansion of the PV program in Sacramento is not following the standard technology adoption sequence (innovators, early adopters, early majority, and so on, as shown in Fig. ES-2 above). And nearly all respondent said they would not participate in the PV Pioneer Program if it were not offered by the electric utility.
Section 3 Recommendations
SMUD needs to put more emphasis on understanding where SMUD’s PV program is within the technology adoption lifecycle.
SMUD needs to rethink the target market as their PV Program develops, to pay close attention to the differences in target groups, and to readjust the description of the target market.
Each target market needs to be clearly identified and profiled, as well as tracked as that profile changes over time.
SMUD needs to develop a testimonial program where early users discuss and promote their experience with PV to the appropriate audience.
SMUD needs to promote more of the intangible benefits of PV using communications techniques that are acceptable to the type of customer being targeted.
SMUD needs to keep an eye out for unconventional applications that exploit PV’s limitations.
SMUD needs to determine and clarify what makes the product “complete” in the eyes of the target customer.
SMUD needs to continue to build a customer-oriented channel of distribution so that customers are comfortable making the PV purchase.
If SMUD were to follow the relevant guidelines offered by the Technology Adoption Lifecycle and the Principle of Disruptive Innovation, several fundamental practices would emerge:
1. SMUD would focus on serving specific groups of customers in sequence, one group at a time. This is often called target marketing.
2. A new emphasis would be placed on discovering the psychographic and value profiles of potential customers.
3. SMUD would continue to build the organization needed to install and service PV systems for customers. As a utility SMUD lowers risk for conservative customers and therefore accelerates market transformation.
4. SMUD would tailor their promotional activities to fit the preferences of their target market.
viii
CONTENTS
INTRODUCTION………………………………………………………………..1
1. OVERVIEW OF SMUD’S PV PROGRAM TECHNOLOGY DECISIONSAND EXPERIENCE…………………………………………………………31.1 Introduction………………………………………………………………..31.2 PV Application Assessment……………………………………………….3
1.2.1 Applications Selected……………………………………………...31.2.2 Niche Markets……………………………………………………..81.2.3 Process and Suitability of Selection……………………………….8
1.3 Ascribing an Appropriate Market Value to PV Generation……………...101.4 Assessment of Program Implementation………………………………... 13
1.4.1 Contractor Selection and Management…………………………..131.4.2 Technical Support and Warranties……………………………….141.4.3 System Performance/Availability……………………………….. 151.4.4 Potential Technical Application Evolution of the
SMUD PV Program…………………………………………. 151.5 Summary of Technical Approach……………………………………….. 17
1.5.1 How is the program doing relative to its goals?………………… 171.5.2 Recommendations for the Future……………………………….. 17
2. SMUD’S PV MARKET DEVELOPMENT AND ITS RELATIONSHIPTO OTHER UTILITY PROGRAMS…………………………………….. 192.1 Introduction………………………………………………………………192.2 Overview of SMUD’s Market Development Philosophy………………..192.3 Evidence for the Emulation of the SMUD Model by Other Utilities…… 23
2.3.1 Lessons Learned from Comparing the LADWP ProgramTo SMUD’s…………………………………………………..24
2.3.2 Some Observations on Other Utility PV Programs……………... 262.3.2.1 Commonwealth Edison, the City of Chicago, and
the SPIRE Corporation……………………………… 262.3.2.2 Idaho Power………………………………………………272.3.2.3 Tucson Electric and Global Solar………………………...272.3.2.4 Austin Energy…………………………………………… 28
2.3.3 Conclusion from These Other Utility Experiences………………282.4 Marketing Challenges Facing SMUD……………………………………292.5 Trends in Emerging Utility Market Structures…………………………...312.6 Additional Market Potential for SMUD’s PV Program………………….332.7 Conclusions………………………………………………………………36
ix
3. A BLUEPRINT FOR COMMERCIALIZATION………………………. 383.1 Introduction………………………………………………………………38
3.2 Definitions and Assumptions…………………………………………….383.3 New Business Fundamentals……………………………………………. 383.4 Overview of Commercial/Market Adoption Models…………………….393.5 Historical Perspective: Sustained Orderly Development and
Commercialization (SODC)………………………………………….413.6 Comparing SMUD With Commercial Market Development…………… 423.7 The Delivered Value of PV………………………………………………433.8 Migrating Toward a Commercial Enterprise……………………………. 443.9 Summary…………………………………………………………………46Appendix: Psychographic Profiles of Each Buyer Type in the
Adoption process………………………………………... 48
FIGURES
Figure 1: The Distribution of SMUD’ PV System Applications……………….. 4Figure 2: Utility Benefits of Tracking & Fixed PV in the SMUD System
At Distribution Voltages…………………………………………10Figure 3: System Load and PV Output Profiles on Peak Day, July 14, 1994…. 12Figure 4: Cost of PV vs. Year, “Business as Usual” Compared to
“SMUD With SODC”………………………………………………..21Figure 5: Direct and Indirect Effects of SMUD’s PV Purchase Commitment…22Figure 6: Surveyed Market Potential for PV Pioneer II PV Installations……... 30Figure 7: The Technology Adoption Lifecycle………………………………...40Figure 8: The Shift From Customer Tangibles to Intangibles………………….44
TABLES
Table 1: Summary of SMUD PV Installations through 1999………………….. 5Table 2: Cost Decreases for PV Pioneer Installations……………… 13, and 21Table 3: Future Potential MW of PV Pioneer Installations for SMUD………. 31Table 4: PV Pioneer II: Estimated Unit Prices………………………………..32Table 5: SMUD PV Partnerships 1997 Through 1999………………………...34
x
xi
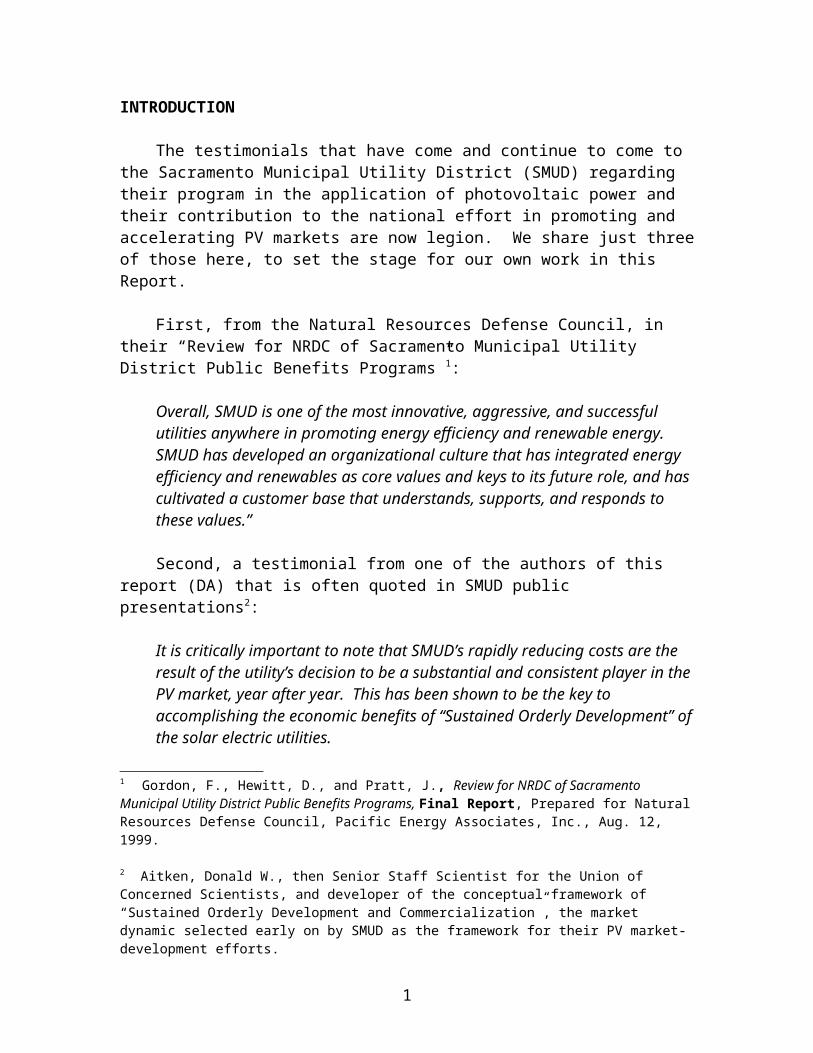
INTRODUCTION
The testimonials that have come and continue to come to the Sacramento Municipal Utility District (SMUD) regarding their program in the application of photovoltaic power and their contribution to the national effort in promoting and accelerating PV markets are now legion. We share just three of those here, to set the stage for our own work in this Report.
First, from the Natural Resources Defense Council, in their “Review for NRDC of Sacramento Municipal Utility District Public Benefits Programs”1:
Overall, SMUD is one of the most innovative, aggressive, and successful utilities anywhere in promoting energy efficiency and renewable energy. SMUD has developed an organizational culture that has integrated energy efficiency and renewables as core values and keys to its future role, and has cultivated a customer base that understands, supports, and responds to these values.”
Second, a testimonial from one of the authors of this report (DA) that is often quoted in SMUD public presentations2:
It is critically important to note that SMUD’s rapidly reducing costs are the result of the utility’s decision to be a substantial and consistent player in the PV market, year after year. This has been shown to be the key to accomplishing the economic benefits of “Sustained Orderly Development” of the solar electric utilities.
And third, a quote from a private memorandum to the authors of this report from a very well known management consultant with special expertise in solar energy3:
SMUD was a true pioneer in proving that people will choose renewables if given he opportunity, and that they will pay more for environmentally-superior power generation…there is no doubt that SMUD’s program is one of the major programs in the world, and it is worth caring about.
In those three testimonials lie our reasons for preparing this SMUD PV Program Review, and selecting the topical areas included in it. SMUD is “worth caring about”, not only because it has made pioneering contributions to utility applications of photovoltaics to date, but also because it has the potential to continue to play a critically important and, indeed, a leadership role for utilities in the future.
1 Gordon, F., Hewitt, D., and Pratt, J., Review for NRDC of Sacramento Municipal Utility District Public Benefits Programs, Final Report, Prepared for Natural Resources Defense Council, Pacific Energy Associates, Inc., Aug. 12, 1999.
2 Aitken, Donald W., then Senior Staff Scientist for the Union of Concerned Scientists, and developer of the conceptual framework of “Sustained Orderly Development and Commercialization”, the market dynamic selected early on by SMUD as the framework for their PV market-development efforts.3
? The author of this comment, and the memorandum, prefers to remain anonymous.
1
To realize this potential, however, requires looking at the elements of SMUD’s success to date, assessing what elements may continue to work in the future, and suggesting ways in which SMUD’s program might be progressively reoriented to place it in a position of long term sustainability while also becoming internally self-supporting. This is the task we have set before us.
The authors of this SMUD PV Program Review do not proclaim to be the last word on these subjects, nor the ultimate experts in gazing into the crystal PV ball of the future. But each of us has experience relevant to SMUD, and two of us (DA and SS) have long contributed directly and indirectly to SMUD’s PV programs, giving us perspectives that have developed over time, while the 3rd author (WS) has unique experience in understanding the transition steps from the early stages of the introduction of a new technology (PV) to full public and market acceptance.
Each of us has principally authored one of the three main sections of this Review: Section 1, “Overview of SMUD’s PV Program Technology Decisions and Experience” (SS); Section 2, “SMUD’s PV Market Development and its Relationship to Other Utility Programs” (DA); and Section 3, “A Blueprint for Commercialization” (WS). We have fully collaborated on the mutual editing of all three sections, and the agreement upon the recommendations set forth.
It is in the spirit of our admiration for SMUD’s leadership to date, our faith in SMUD’s commitment to its customers to continue to protect their interests in the progressive energy resource transition that must and will take place this century, and our acknowledgement that SMUD recognizes that adaptability and change are necessary for continued success, that we offer the following review and recommendations.
2
1. OVERVIEW OF SMUD’S PV PROGRAM TECHNOLOGY DECISIONS AND EXPERIENCE
1.1 Introduction
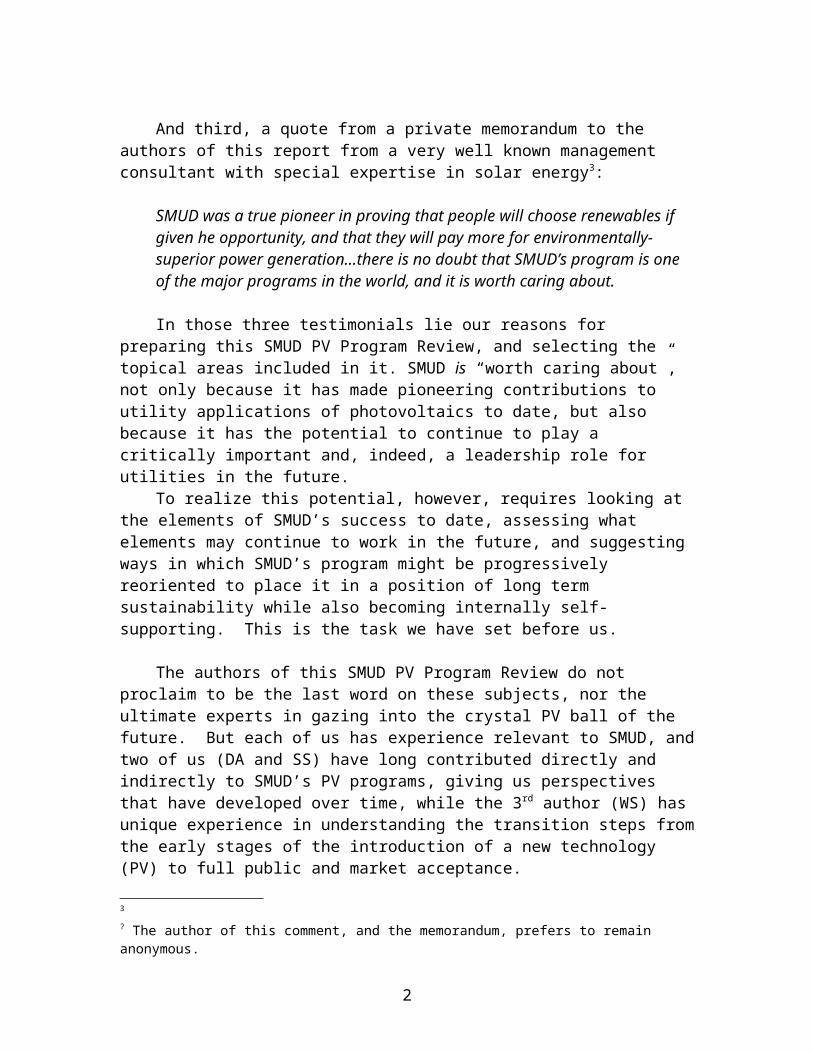
In 1984 the Sacramento Municipal Utility District embarked on a program with no precedent—an ambitious effort to bring PV power first to their system and later, more directly, to hundreds of their customers while also using PV power for other useful purposes within SMUD’s system. Without humility, their first step was simply to build the world’s largest PV plant on the grounds of the decommissioned Rancho Seco Nuclear Plant. Phase 1, consisting of 1MW of modules (which, because of tracking, operate as effectively 1.23 MW), was constructed in 1984, and phase 2, also for 1 MW (or 1.23 MW with tracking benefits) was constructed in 1986. That system has been working ever since, day after day delivering power reliably to the SMUD grid, the value of which has never depended on the availability or cost of fuel, and never will. Expansions since then and planned for this coming year will bring the size of that system to over 3.5MW, making it once again the world’s largest central station PV plant.
In 1993 SMUD continued to move forward, launching a program that would see a total of over 8 Megawatts (MW) in place in over 650 different PV applications in Sacramento within the next 7 years, and 8MW more planned by 2003. As with any new venture, there was an element of risk, greater than the traditionally conservative utility company criteria would normally accept. But with an unwavering consistency of vision, SMUD soon became a model for other utilities to follow, also becoming known worldwide for their courage and their mounting grid-connected PV experience, and receiving national and international recognition and honors for the utility and for its employees.
It is our task to look at the ingredients of this (obviously successful to date) experience, and to extrapolate to conditions and circumstances that we see in our energy crystal ball.
In this section of this SMUD PV Program Review, we look at the technical aspects of SMUD’s PV Program choices, and draw conclusions and recommendations.
1.2 PV Application Assessment
1.2.1 Applications Selected
Right from the beginning, SMUD clearly elected not to choose a single type of PV application, but rather to gain both technical and economic experience from multiple applications. Early on, however, they made a decision to go for applications that would allow them to purchase PV modules by bid in substantial quantities, to progressively reduce the cost of their installed PV systems along a “Sustained Orderly Development
3
and Commercialization” (SODC) path. (The marketing philosophy of this is described and evaluated in Section 2 of this Report.) The relevance here is that this approach led SMUD to favor applications that required modest amounts of PV (from 1 to 400 KW), and with the smaller units (1-4 kW) installed on residences in great numbers. On the basis of their years of PV applications, SMUD has the benefit of actual real-world performance and cost data to assess the pros and cons of all PV system options. SMUD is well positioned to prioritize their program emphasis as their scale-up continues.
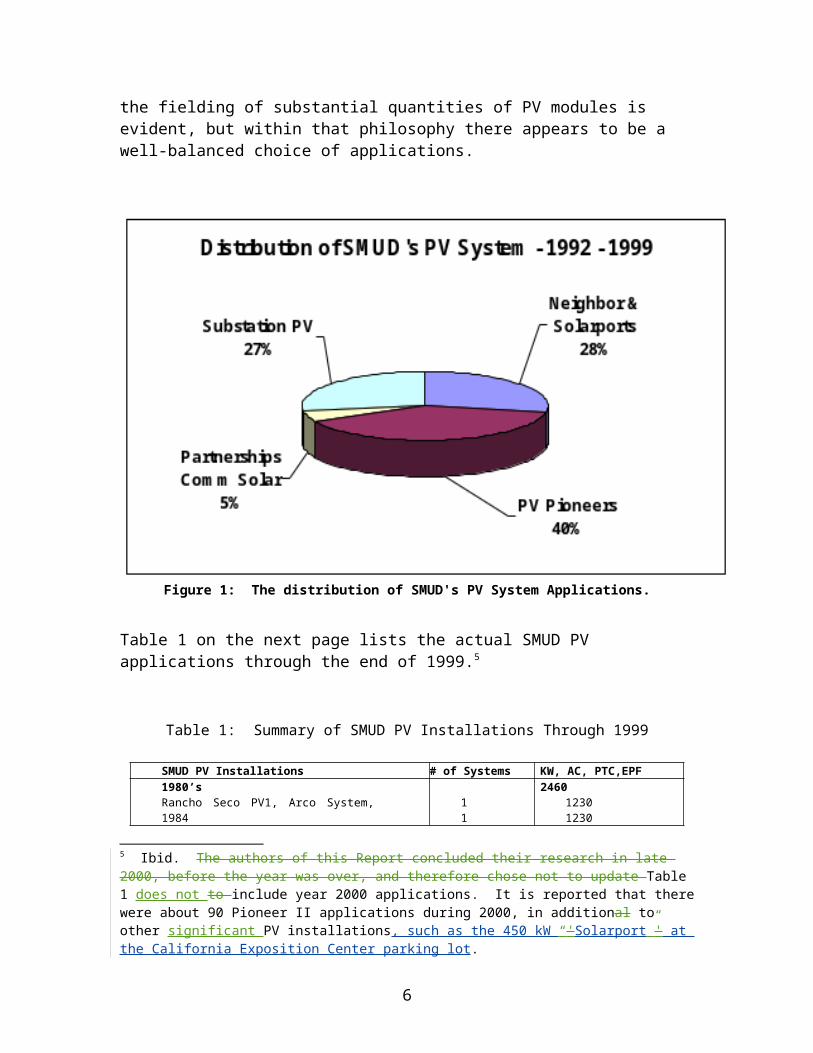
The distribution of SMUD’s PV system applications (for all but the Rancho Seco central PV stations) is shown below in Figure 1.4 The reliance on systems that would result in the fielding of substantial quantities of PV modules is evident, but within that philosophy there appears to be a well-balanced choice of applications.
Figure 1: The distribution of SMUD's PV System Applications.
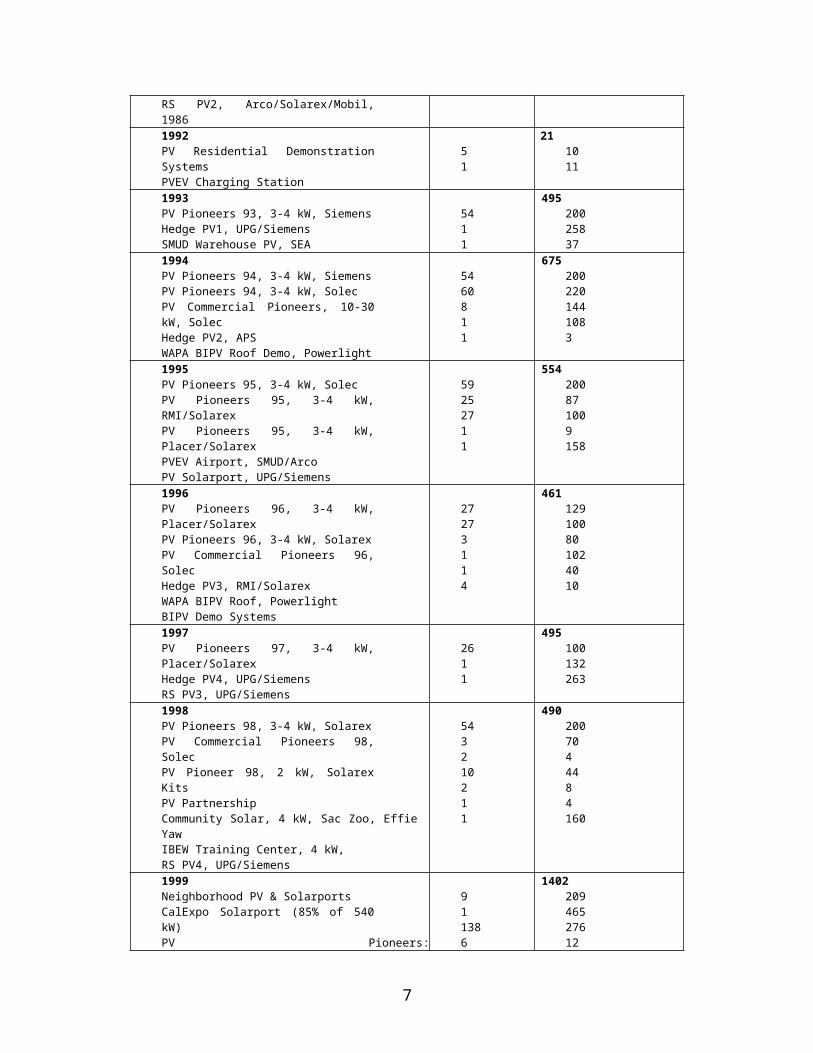
Table 1 on the next page lists the actual SMUD PV applications through the end of 1999.5
Table 1: Summary of SMUD PV Installations Through 1999
4 Osborn, D., Sustained Orderly Development and Commercialization of Grid-Connected Photovoltaics: SMUD as a Case Example, Advances in Solar Energy, Vol. .., No. .. (2001)5 Ibid. The authors of this Report concluded their research in late 2000, before the year was over, and therefore chose not to update Table 1 does not to include year 2000 applications. It is reported that there were about 90 Pioneer II applications during 2000, in additional to other significant PV installations, such as the 450 kW “'Solarport”' at the California Exposition Center parking lot.
4
SMUD PV Installations # of Systems KW, AC, PTC,EPF1980’sRancho Seco PV1, Arco System, 1984RS PV2, Arco/Solarex/Mobil, 1986
11
246012301230
1992PV Residential Demonstration SystemsPVEV Charging Station
51
211011
1993PV Pioneers 93, 3-4 kW, SiemensHedge PV1, UPG/SiemensSMUD Warehouse PV, SEA
5411
49520025837
1994PV Pioneers 94, 3-4 kW, SiemensPV Pioneers 94, 3-4 kW, SolecPV Commercial Pioneers, 10-30 kW, SolecHedge PV2, APSWAPA BIPV Roof Demo, Powerlight
5460811
6752002201441083
1995PV Pioneers 95, 3-4 kW, SolecPV Pioneers 95, 3-4 kW, RMI/SolarexPV Pioneers 95, 3-4 kW, Placer/SolarexPVEV Airport, SMUD/ArcoPV Solarport, UPG/Siemens
59252711
554200871009158
1996PV Pioneers 96, 3-4 kW, Placer/SolarexPV Pioneers 96, 3-4 kW, SolarexPV Commercial Pioneers 96, SolecHedge PV3, RMI/SolarexWAPA BIPV Roof, PowerlightBIPV Demo Systems
27273114
461129100801024010
1997PV Pioneers 97, 3-4 kW, Placer/SolarexHedge PV4, UPG/SiemensRS PV3, UPG/Siemens
2611
495100132263
1998PV Pioneers 98, 3-4 kW, SolarexPV Commercial Pioneers 98, SolecPV Pioneer 98, 2 kW, Solarex KitsPV PartnershipCommunity Solar, 4 kW, Sac Zoo, Effie YawIBEW Training Center, 4 kW, RS PV4, UPG/Siemens
543210211
4902007044484160
1999 Neighborhood PV & SolarportsCalExpo Solarport (85% of 540 kW) PV Pioneers: UPG/Shawnee/Siemens/Solarex/EPVCommunity SolarPV PartnershipsRS PV5a (35% of 750 kW) UPG/EPV
91138681
140220946527612180260
TOTAL TODATE PV PioneersNeighborhood PV & SolarportsPV PartnershipsCommunity SolarSubstation PV (Hedge PV 1-4, RS PV 3-5a)Substation PV (RS PV 1&2)
5583518872
7053182612752242012482460
It is evident from Table 1 and Figure 1 that SMUD put more effort into their residential solar applications than into any other single program area. The authors believe this emphasis was and is correctly placed as the potential for the residential
5
rooftop market is very large indeed. Further, these systems tend to be the most amenable to standardization, which further reduces costs. While this emphasis continues today, the nature of the residential PV program has evolved.
During the first years of the PV Pioneer program (1993-99), the PV was connected into the utility side of the meter, giving the homeowner no direct value for lending his rooftop to SMUD, and even asking him to pay $4 each month for the privilege! This approach allowed SMUD to “test the market” for acceptance of residential roof-top PV while also assessing the geographically disbursed benefits of “distributed PV”, a PV version of a larger structural direction—distributed generation--that is today becoming increasingly important for all utilities.
In particular, all distributed PV systems:
Provide grid support Eliminate costs and losses in transmission and distribution Create a diverse and resilient energy system Typically require no special “impact assessment”, approvals or permits Can be fielded very rapidly, in response to need
Mounting distributed PV on buildings such as on residential rooftops also provides SMUD with these additional benefits:
The real estate comes “free” with the building There are no site development costs—the PV is simply placed on the building
roof Customer acceptance (e.g. willingness to make their roofs available to SMUD
and even to pay a little each month to subsidize it) arises in part as the rooftop PV systems are a highly visible expression of the homeowner’s environmental commitment.
The utility interconnection already exists to serve the building There is no (additional) real estate tax on land to support the PV system or on
the PV itself
SMUD’s “Neighbors and Solarports”, the second largest slice of the Figure 1 pie, represents larger distributed PV systems, but with much the same benefits for SMUD as the residential applications. The third largest slice of that pie was for “Substation PV”using even larger arrays integrated into their distribution facility support systems.
In 1999 SMUD began offering the PV Pioneer II Program as an alternative to its customers. In this case, the residential customer purchases and owns the PV system, enabled both by SMUD’s low costs and by SMUD’s attractive “buy down” incentives and financing. (This is presented in more detail in Section 2 of this Report.) The PV system output is therefore connected on the customer’s side of the meter. The meters run in a “net metering” configuration, recording power flow both ways between the building and the grid, thereby automatically providing a credit at full retail value for the customer
6
which can be used in evening hours to offset the evening purchases of electricity. (In simple language, the meter runs both forwards and backwards.)
With the PV Pioneer II program, the customer gains considerable benefits from the systems on their roofs. Most important, they receive the full use of the solar-generated electricity either directly in their home or, via the ‘net metering’ policy that SMUD has implemented system-wide, they realize measurable financial return from their investment. SMUD also gains many of the benefits of distributed PV on their system from these applications, while having the benefit that the customers now share a major portion of the costs
Another innovation that SMUD now provides as part of their PV Pioneer II program, as well as their PV programs for commercial establishments, is offering distributed PV generation as “Building integrated PV” (BIPV). While this does not gain SMUD further benefits from the installations, it brings further benefits and incentives to building owners and occupants. Among these are:
BIPV can displace conventional building material and labor, reducing the net installed cost of the PV system on both residential and commercial applications
The architecturally clean, well-integrated systems increase market acceptance for PV
For commercial buildings, BIPV can provide significant demand charge reductions
With building-integrated PV systems, building owners are already paying for facade and/or roofing materials and the labor to install them. The land is already paid for, the support structure is already in place, the building is already wired, the utility is already connected, and developers can finance the PV as part of their overall project. Another benefit comes from distributing the BIPV installations over a very broad geographic area and a large number of buildings, mitigating the effects of local weather conditions on the aggregate, and producing a very resilient source of supply.
With reduced installation costs, improved aesthetics and all the benefits of distributed generation, building-integrated PV systems are a prime candidate for early widespread market adoption. These systems should be encouraged especially within the architectural community, as the architects are the ones who make the decisions to incorporate BIPV.
In closing this brief discussion about SMUD’s choice of applications, it is interesting to note that, in 1992, while they were gaining the experience that enabled them to launch the PV Pioneer I program, SMUD also built the first PV electric vehicle charging station in California (and only the second one in the U.S.), to service their own Evs at their headquarters building, showing their interest in having their solar program support other important energy conserving programs within SMUD.
1.2.2 Niche Markets
7

SMUD elected not to invest much of their emphasis into “niche” or “high value” applications early in their PV program. While the economics of these applications are easier to justify on a case-by-case basis, they also tend to be applications for very small quantities of PV, thereby not contributing to a sufficient market impact to reduce the costs of the PV systems. Niche markets also often require custom configuration of PV modules and balance-of-system (BOS) equipment, which requires design-intensive support. If this support is provided directly by the SMUD program it could adversely dilute SMUD’s technical resources that might be better used to pursue the greater overall program goals. This is further discussed in Section 2 of this Report.
1.2.3 Process and Suitability of Selection
SMUD began their PV program with a broad cross section of applications from individual residential and commercial rooftop systems to medium-scale PV at the ‘neighborhood’ and substation level to central-station PV. This was a wise starting point, as it would provide SMUD program personnel with a broad base of both technical operating experience and economic performance on all of the PV system applications.
The authors believe that all of the key PV systems applications that SMUD has selected will achieve widespread commercial acceptance. We believe that the sequence of commercialization will start with residential roof-top systems, followed by roof-top and BIPV systems for commercial buildings with substation and ‘neighborhood’ systems coming next and central station systems following last.
Our reasons for these conclusions are that residential and commercial PV systems can and do displace utility power on the customers’ side of the meter at the retail rate, while the substation and central station systems compete with the cost of avoided fuel or bulk kilowatt-hours – both at the wholesale level.
The reason that residential systems are favored as the first application to reach widespread commercial acceptance is that residential customers have access to home mortgage financing for home improvements (such as PV systems). This provides 15 – 30-year financing terms at reasonable rates with tax deductible interest. Further, residential electric rates have traditionally been the highest rate class so the PV power is worth more to the residential customer who is also more likely to accept a longer-term ‘payback’ than a commercial customer.
We believe the commercial building market will follow because there are generous federal incentives for commercial customers with a federal tax liability to field PV on their facilities. Further, commercial electric rates are on the rise as are (or will be) the demand charges associated with on-peak consumption.
The substation systems can and will be fielded to provide grid support and, when the value of this grid support is recognized, this will put the substation systems ahead of the central station deployment.
8
The retail value of the electricity is well known and the payment method (displaced utility bills via net metering) is already defined and in place, while the value of the PV-generated electricity to the utility is still, in our opinion, way undervalued – even at SMUD. Until the real value of PV-generated electricity is recognized, the larger systems at the substation and, especially at the central station scale, will lag behind the smaller distributed systems for individual buildings when market forces, rather than government policies, are the drivers for the applications.
It is important to note here that in other utility circumstances very different decisions from SMUD's may also emerge. For example, Tucson Electric Power (TEP), an investor-owned utility (and hence unlike SMUD) is now required to commit to significant PV applications by the state government-mandated "Environmental Portfolio Standard". (This is presented in more detail in Section 2 of this SMUD PV Program Review.)
TEP is therefore seeking ways to install the maximum amount of PV at the minimum cost to the utility, leading them to conclude from their analyses that central station PV will be the least expensive starting point for them. They will just put up big systems, rather than many smaller ones. (The legislated requirement does not permit the utility to recoup costs from individual customers. Those are done in separate "green power" programs, which do not qualify towards meeting the mandated installation percentages.)
The conclusion of this is that PV program development priorities for utilities are highly situational. Conclusions appropriate to one utility (e.g. in this case TEP) do not extrapolate to other utilities (e.g. SMUD), nor are our recommendations to SMUD necessarily appropriate to other utilities. We have seen criticisms of the SMUD program, which have confused this point.
It is important that SMUD focus their PV Program’s near-term resources on those applications that show the highest near-term promise for meeting the overall goals established for the program and SODC. Although the application mix will vary and special opportunities will come up (perhaps stimulated by compelling political motivation), we recommend that SMUD prioritize the allocation of financial and technical resources to distributed PV systems for individual buildings. If the number of opportunities are limited by these applications, SMUD should take pro-active steps to increase them.
1.3 Ascribing an Appropriate Market Value to PV Generation
9
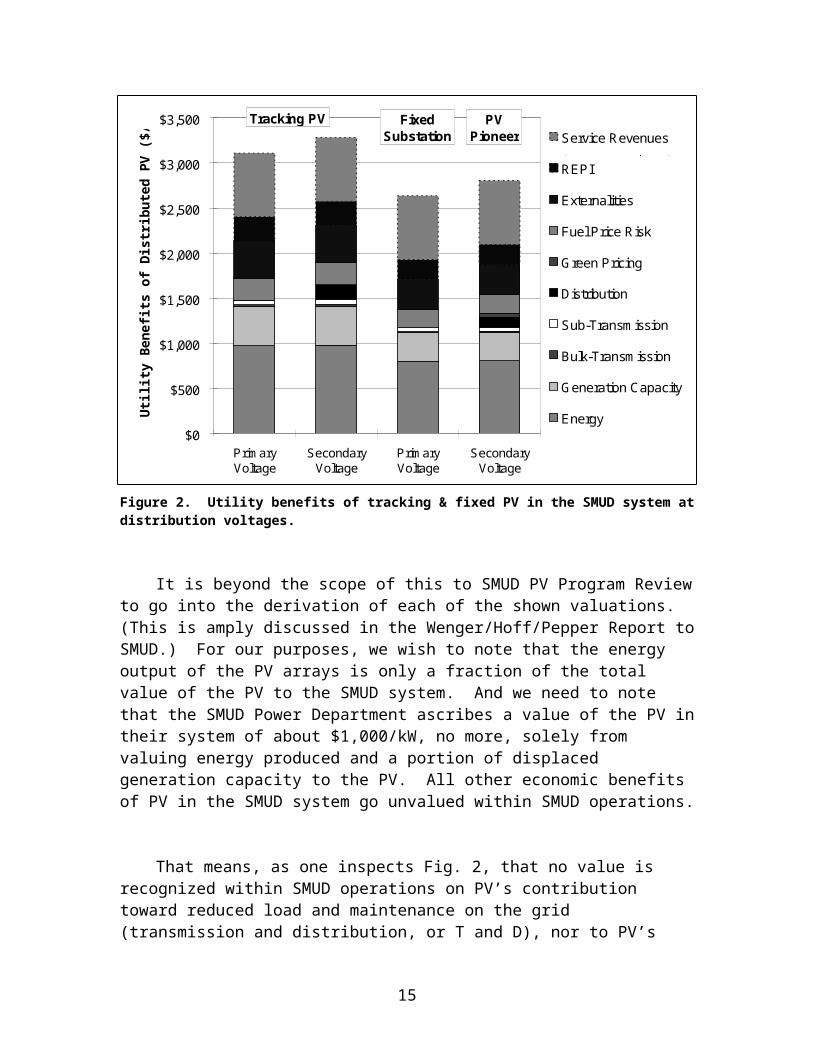
A detailed analysis of “Photovoltaic Economics and Markets” that focused on SMUD was prepared in 1996.6 Figure 2 below summarizes the benefits that the authors of that report determined could be ascribed to the value of PV in SMUD grid-connected applications.
$0
$500
$1,000
$1,500
$2,000
$2,500
$3,000
$3,500
PrimaryVoltage
SecondaryVoltage
PrimaryVoltage
SecondaryVoltage
Utili
ty B
enef
its o
f Dis
tribu
ted
PV ($
/kW
, 199
6) Service Revenues
REPI
Externalities
Fuel Price Risk
Green Pricing
Distribution
Sub-Transmission
Bulk-Transmission
Generation Capacity
Energy
Tracking PV PVPioneer
FixedSubstation
(economic development)
Figure 2. Utility benefits of tracking & fixed PV in the SMUD system at distribution voltages.
It is beyond the scope of this to SMUD PV Program Review to go into the derivation of each of the shown valuations. (This is amply discussed in the Wenger/Hoff/Pepper Report to SMUD.) For our purposes, we wish to note that the energy output of the PV arrays is only a fraction of the total value of the PV to the SMUD system. And we need to note that the SMUD Power Department ascribes a value of the PV in their system of about $1,000/kW, no more, solely from valuing energy produced and a portion of displaced generation capacity to the PV. All other economic benefits of PV in the SMUD system go unvalued within SMUD operations.
That means, as one inspects Fig. 2, that no value is recognized within SMUD operations on PV’s contribution toward reduced load and maintenance on the grid (transmission and distribution, or T and D), nor to PV’s value in reducing fuel price risk, 6 Wenger, H., Hoff, H., and Pepper, J., Photovoltaic Economics and Markets: The Sacramento Municipal Utility District as a Case Study, SMUD Contract G253
10
nor to the contribution of PV toward clean air (“externalities”). SMUD sets aside $20 million per year as a “hedge” against purchased energy costs in low hydropower years, and yet gives no value to its renewable energy programs as a means to reduce dependence on varying hydro capacity. And power providers certainly don’t care for the economic benefits resulting from locating manufacturing plants in the District (shown in Fig. 2 as the resultant “Service Revenues”). These value omissions all add up to an unwarranted barrier within SMUD’s own accounting and operations systems.
We wish to examine just one of the omissions in valuing SMUD’s investment in grid-connected PV, the time-of-day economic benefits of PV output, which has emerged during the summer of 2000 as especially significant.
Renewable resources are often devalued because of their intermittency (depending on variable sun or wind resources), with “capacity factors” around 20% to 25%, and compared unfavorably to “baseload” resources which can run all night with consequent high capacity factors (but why do the need to?). And renewable energy resources are also frequently devalued by the inability to “dispatch” them on demand. But since the greatest time of need for power is during the daytime, and especially during sunny days when it is also hot, generating a considerable peak in demand for cooling in the Sacramento climate, it is the “effective” capacity factor of the PV that is important—its availability when the power it produces is actually needed. It has been shown by Professor Richard Perez of the State University of New York in Albany that PV can in favorable circumstances have an “effective capacity factor” for delivering valuable energy to the grid exceeding 90%.
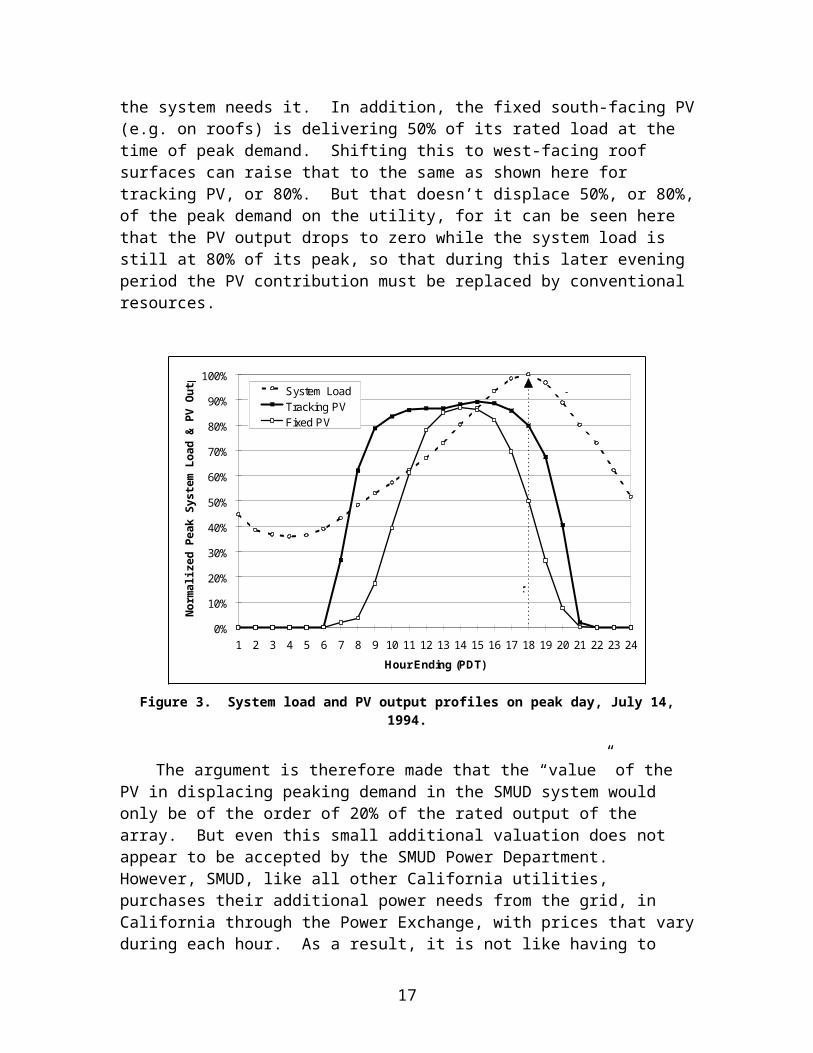
Fig. 3 on the next page shows the coincidence of the output of grid-connected PV in the SMUD District in proportion to overall system load on the peak demand day in 1994. The PV delivers energy during most of the time that the system needs it. In addition, the fixed south-facing PV (e.g. on roofs) is delivering 50% of its rated load at the time of peak demand. Shifting this to west-facing roof surfaces can raise that to the same as shown here for tracking PV, or 80%. But that doesn’t displace 50%, or 80%, of the peak demand on the utility, for it can be seen here that the PV output drops to zero while the system load is still at 80% of its peak, so that during this later evening period the PV contribution must be replaced by conventional resources.
11
0%
10%
20%
30%
40%
50%
60%
70%
80%
90%
100%
1 2 3 4 5 6 7 8 9 10 11 12 13 14 15 16 17 18 19 20 21 22 23 24
Hour Ending (PDT)
Norm
aliz
ed P
eak
Syst
em L
oad
& PV
Out
put System Load
Tracking PVFixed PV
System Load
Peak Hour
Figure 3. System load and PV output profiles on peak day, July 14, 1994.
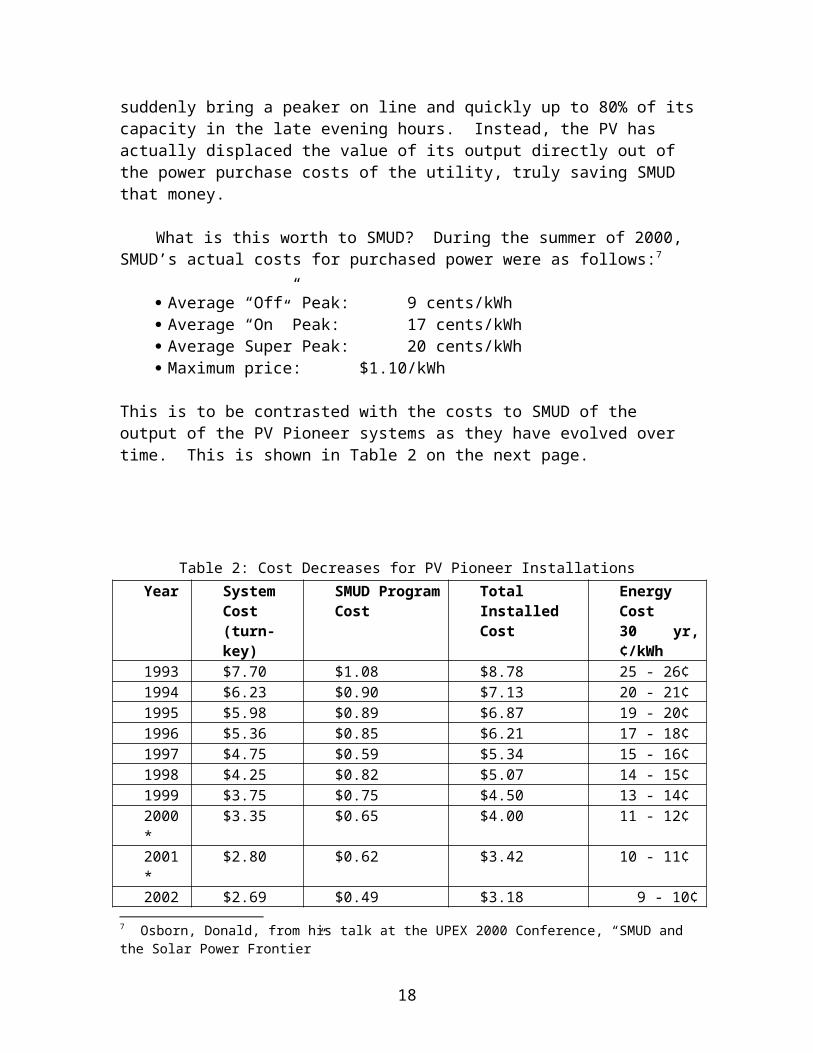
The argument is therefore made that the “value” of the PV in displacing peaking demand in the SMUD system would only be of the order of 20% of the rated output of the array. But even this small additional valuation does not appear to be accepted by the SMUD Power Department. However, SMUD, like all other California utilities, purchases their additional power needs from the grid, in California through the Power Exchange, with prices that vary during each hour. As a result, it is not like having to suddenly bring a peaker on line and quickly up to 80% of its capacity in the late evening hours. Instead, the PV has actually displaced the value of its output directly out of the power purchase costs of the utility, truly saving SMUD that money.
What is this worth to SMUD? During the summer of 2000, SMUD’s actual costs for purchased power were as follows:7
Average “Off” Peak: 9 cents/kWh Average “On” Peak: 17 cents/kWh Average Super Peak: 20 cents/kWh Maximum price: $1.10/kWh
This is to be contrasted with the costs to SMUD of the output of the PV Pioneer systems as they have evolved over time. This is shown in Table 2 on the next page.
7 Osborn, Donald, from his talk at the UPEX 2000 Conference, “SMUD and the Solar Power Frontier”
12

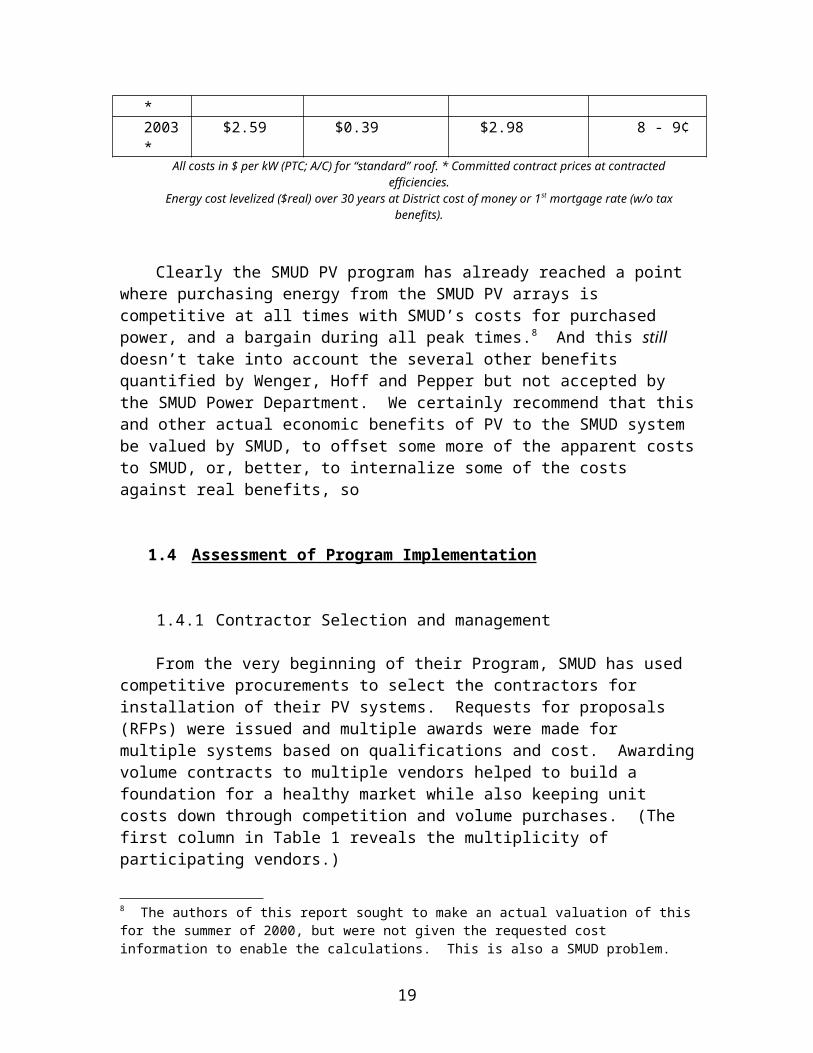
Table 2: Cost Decreases for PV Pioneer InstallationsYear System
Cost(turn-key)
SMUD ProgramCost
Total InstalledCost
Energy Cost30 yr, ¢/kWh
1993 $7.70 $1.08 $8.78 25 - 26¢1994 $6.23 $0.90 $7.13 20 - 21¢1995 $5.98 $0.89 $6.87 19 - 20¢1996 $5.36 $0.85 $6.21 17 - 18¢1997 $4.75 $0.59 $5.34 15 - 16¢1998 $4.25 $0.82 $5.07 14 - 15¢1999 $3.75 $0.75 $4.50 13 - 14¢2000* $3.35 $0.65 $4.00 11 - 12¢2001* $2.80 $0.62 $3.42 10 - 11¢2002* $2.69 $0.49 $3.18 9 - 10¢2003* $2.59 $0.39 $2.98 8 - 9¢
All costs in $ per kW (PTC; A/C) for “standard” roof. * Committed contract prices at contracted efficiencies.Energy cost levelized ($real) over 30 years at District cost of money or 1st mortgage rate (w/o tax benefits).
Clearly the SMUD PV program has already reached a point where purchasing energy from the SMUD PV arrays is competitive at all times with SMUD’s costs for purchased power, and a bargain during all peak times.8 And this still doesn’t take into account the several other benefits quantified by Wenger, Hoff and Pepper but not accepted by the SMUD Power Department. We certainly recommend that this and other actual economic benefits of PV to the SMUD system be valued by SMUD, to offset some more of the apparent costs to SMUD, or, better, to internalize some of the costs against real benefits, so
1.4 Assessment of Program Implementation
1.4.1 Contractor Selection and management
From the very beginning of their Program, SMUD has used competitive procurements to select the contractors for installation of their PV systems. Requests for proposals (RFPs) were issued and multiple awards were made for multiple systems based on qualifications and cost. Awarding volume contracts to multiple vendors helped to build a foundation for a healthy market while also keeping unit costs down through competition and volume purchases. (The first column in Table 1 reveals the multiplicity of participating vendors.)
In 1997, SMUD changed their approach and, in an effort to gain maximum purchasing leverage issued single five-year contracts for module and inverter supply. Since these two contracts were issued under a competitive solicitation, the lowest cost
8 The authors of this report sought to make an actual valuation of this for the summer of 2000, but were not given the requested cost information to enable the calculations. This is also a SMUD problem.
13
was assured. However, the five-year contracts meant that SMUD would be dependent on this single supplier for the success of the program for the period of the contract.
To reduce this exposure, SMUD did structure these contracts so that if the given supplier did not perform, SMUD was free to look elsewhere for sources of supply. The result was that SMUD limited the downside exposure to the loss of time, which would result from sub-par performance or total non-performance.
In retrospect, this strategy appears to be paying off. Although both the inverter and module supplier were late in meeting their delivery schedules, there has been little negative impact on the program. SMUD simply supplemented module delivery from its contracted supplier with modules purchased ‘on the market’ to meet its program plan and accepted substitute product and/or rescheduled installation sequences to accommodate the lateness of the inverter delivery.
In general, management of the contractors has been quite good under the program. The SMUD purchasing group issued contracts with performance terms favorable to SMUD, and SMUD’s technical group kept a watchful eye on field installations. While there was some schedule slippage, overall performance of the suppliers and installation contractors has been very positive, especially when one considers that the entire PV program was breaking new ground.
It is important, as future phases of the program take form, that SMUD continue to maintain maximum contractual flexibility in terms of options so that the program’s success is not dependent on the performance of any single supplier.
1.4.2 Technical Support and Warranties
One of the great strengths of the SMUD Solar program is the quality of their technical support. This does not just mean service in the field, or replacement of faulty product. SMUD has developed a careful quality assurance/quality control (QA/QC) program to which all suppliers of PV and components must adhere. They actually sign QA/QC assurance documents.
Furthermore, SMUD’s own constant testing has turned up potential problems that they have then gone back to the manufacturer to solve—often using the suggestions of SMUD’s technicians—as a means of avoiding problems before they can occur in the field. This is a significant factor in the overall excellent and long-term performance that SMUD is realizing in the field.
Warranty provisions were clearly established for key components during the RFP process and reinforced as the contracts were put into place. SMUD has had little in the way of field failures and has gotten the manufacturers to make good on their equipment under the terms of the warranties.
14
1.4.3 System performance/availability
In the Introduction to this section we noted that SMUD’s 1984 and 1986 PV installations at the Rancho Seco site have been working reliably ever since. The only difficulties have been with the inverter for the Phase II array. Replacing that cleared up those problems, but that was an indicator of the fact that, while the hundreds of PV arrays that SMUD has installed show no signs of lifetime degradation or lack of reliability, the weak point has been in the power conditioning electronics.
SMUD is in the unique utility position of having 16 years of experience with a multi-megawatt grid-connected application, thus lending confidence to SMUD’s expectations of future reliability. Quoting from Osborn (see footnote #1):
After 16 years, 7MW [now, in 2000, 8MW] and nearly 600 PV systems of PV operational experience, SMUD has determined that PV can be simply installed and operated with high reliability. Indeed, the performance and reliability improves with volume. Installation of large numbers of like systems results in better performance than that of demonstration projects of a few systems…
Scientists from the Sandia National Laboratory studied 100 of the first Pioneer I PV systems, installed in 1993 and 1994. This analysis produced “availability factors” (PV systems working) of 92% or higher for 88% of the systems, with the one lowest still at 44%. A second way of rating PV system performance is the “Performance Index”9, which rates the actual performance of PV systems against their simulated performance, taking into account realistic variables and losses. A PI of better than 90% is considered excellent. Measurements on SMUD’s installed systems consistently show this kind of performance.
1.4.4 Potential Technical Application Evolution of the SMUD PV Program
The leading candidate technologies to meet the goals for low-cost PV are thin-film products. While they currently promise lower cost per watt, all the available thin-film technologies are lower in efficiency than their crystalline counterparts – some dramatically so. A thin-film array needs to be larger in size to deliver a given amount of power when compared to an array of crystalline modules. Thus, the number of individual modules that need to be mounted, fastened and wired is greater. This is an important criterion as it can reduce or eliminate the cost advantage of the thin-film products.
SMUD should work with their chosen suppliers to identify ways to mitigate this area-related cost penalty at both the module and system level. In this regard it is noteworthy that the new Sacramento-based EPV plant is beginning to produce Copper Indium diselenide (CIS) modules, a technology which has achieved the highest efficiency
9 Wenger, Hoff and Pepper, see footnote 6.
15
of all thin film products, potentially competitive with crystalline efficiencies. That should be a good technical choice for SMUD.
As the number of residential rooftop retrofit systems increases within the SMUD service territory, the availability of candidate sites with ‘ideal roofs’ will eventually become a constraining factor to limit further program opportunity. One of the factors, which currently make a residential roof attractive, is if it has composition (asphalt) shingles. There are many homes within the District with tile or shake roofing, which, save for the difference in roof materials, would be good candidates. SMUD should work with their chosen contractors and suppliers to identify and/or develop cost effective methods to retrofit residential roof-top systems on non-composition roofs. This will expand the pool of desirable candidate roofs, allowing the program more room for growth while satisfying a larger cross-section of customers.
New residential construction represents a major opportunity for the SMUD PV program. SMUD’s present method of installing a PV array on a new residence during the initial construction makes use of solar tiles called ‘Sunslates’ which displace conventional roofing materials to become the finished roof. While this concept is very appealing, the present product is too expensive to achieve the longer-term cost goals set out for the rooftop program. SMUD should work with their chosen suppliers to identify ways to expand the options for PV roof integration in new residential and light commercial construction as well as roof replacements. One option might be to explore the development of larger-area modules using lower-cost thin-film PV configured for direct roof-integration.
Another aspect of new residential construction is the provision of the basic infrastructure to make the future installation of a rooftop PV system easier in homes where the systems cannot be installed during construction. SMUD should work with their chosen suppliers to develop PV-friendly design and construction approaches, which make future PV retrofits easier.
There is considerable potential promise for the SMUD program in the use of building-integrated PV in new commercial construction. The architects are the gatekeepers to this market and must be inspired to incorporate BIPV at the very beginning of the design process. SMUD has begun to successfully engage the architectural community and interest in building. One way to help to increase the incorporation of BIPV systems is to expand the range of options for available PV modules. Currently the thin-film PV modules are only available in a two by four foot format. Architects constantly ask for other sizes and options. SMUD should work with their chosen suppliers to identify ways to expand the range of cost-competitive hardware options for BIPV in commercial buildings.
16
1.5 Summary of Technical Approach
1.5.1 How is the program doing relative to its goals?
Any program working with the initial introduction of a wholly new technology on such a scale represents considerable risk. The authors believe that SMUD has understood and managed this risk well. In most respects, the SMUD PV program seems ‘on track’ with their overall goals and in some respects is actually ahead. Some could argue that the cost reductions in the coming phase of the program may be more of a challenge to achieve than those of prior phases. While this may be true, the PV industry has changed dramatically during the first decade of the SMUD PV program and is now far more able to reach the goals set out for the program than it has been previously. With continued consistent support from upper management, the SMUD program appears well positioned to achieve its overall goals for Sustained Orderly Development and Commercialization during the next phase of the effort.
1.5.2 Recommendations for the future.
During the author of this Section’s (SS) work with PV for residences, the one thing homeowners have most often inquired about is the availability of their utility-interactive PV system in the event of a utility outage. It is suggested that SMUD investigate the prospect of offering residential PV Pioneer II customers a battery bank option capable of carrying some portion of the house loads (such as the critical ‘core’ loads) through a ‘typical’ power outage. While this would add cost and complexity to the residential program offering, it is the function most often requested and could be offered only when the customer wanted it.
One of the most important opportunities available to SMUD is to leverage the PV program effort with the Energy-efficiency program. It is well known that it is easier to save energy than it is to produce it. Further, if the energy needs of, for example, a new house are reduced during the planning and construction, the contribution from a roof-top PV system would contribute a far more meaningful percentage of the home’s power.
Energy-efficient demonstration homes have been designed and constructed in hot climates where cooling requirements dominate, that combine advanced conservation techniques with solar water heating and rooftop PV. The results are impressive, with no net addition to the utility peak demand from the residence even during heavy cooling periods.10
These results emphasize the benefits of an integrated approach where the energy efficiency and the solar systems are incorporated together as part of an overall approach. The results further would suggest that SMUD revisit the emphasis of their solar water-heating program. While solar water heating systems do compete for available roof area
10 “Field Evaluation of Efficient Building Technology With Photovoltaic Power Production in New Florida Residential Housing”, FSEC-CR 1044-98, November, 1998. See also Parker, D., and Sheinkopf, K., “Cool Home Features Bring Peak Energy Savings”, Home Energy, July/August 1999 (pp. 22-27).
17
with PV systems, the properly designed and installed solar water heating system will displace 3 to 4 times the kWh per dollar when compared to the same investment in a PV system. Just as PV hardware and systems have evolved in recent years, so have SDHW systems. The authors believe these systems can and should play a more important role in SMUD’s overall strategy.
As the popularity of the PV Pioneer II systems continues to grow, SMUD should begin to develop PV Pioneer 2 systems for commercial buildings. While the authors believe that the residential market will be the first to reach full commercial status, the commercial buildings market will not be far behind. The SMUD program has fielded many PV systems on commercial buildings. It will be a relatively simple task of defining the optimum system package, with perhaps a few variations in size and configuration, to offer to the commercial customer.
Other recommendations for SMUD’s PV Future:
SMUD should concentrate on their own service territory first and foremost as this is the area that provides the greatest opportunity for achieving their program goals. If organizations outside of SMUD request collaboration, SMUD should help them as it can. But SMUD should not spend a significant amount of resources cultivating such opportunities until later in the program
In the promotion of the PV Pioneer 2 options, SMUD should emphasize the highly valued but intangible benefits of owning your own PV system, such as:• It is environmentally responsible• It has a clear and very visible ‘green appeal’• It is backed by SMUD – a known and trusted partner in the community who will be there in the long term.
SMUD should seek to understand in more detail the market development cycle as described in Section 3 of this report and market first to the innovators and early adopters as they are indeed the first customers. The use of detailed web site will help to reach and convince these prospects.
18
2. SMUD’s PV MARKET DEVELOPMENT AND ITS RELATIONSHIP TO OTHER UTILITY PROGRAMS
2.1 Introduction
The involvement of SMUD in photovoltaic applications arises from the utility’s goal of obtaining at least half of its energy from energy efficiency, existing hydroelectric plants, and renewable energy resources, beginning in the year 2000 and extending beyond. But the involvement of SMUD in the market development of PV goes beyond these aims, for SMUD has also been convinced that their large and visible role in the PV market should contribute in a significant way toward the lowering of costs for installed PV systems in general, which would benefit all PV purchasers, and lower the costs for SMUD’s own PV applications even further. And SMUD has clearly seen a business opportunity growing out of this that transcends their own applications.
This latter aim is confirmed in written descriptions of SMUD’s commercialization philosophy, such as “The SMUD Solar Program is a business development and commercialization effort for the sustained orderly development and commercialization (SODC) of grid-connected PV.”11 And “SMUD would rather…provide photovoltaics as a business opportunity than concede that to someone else.”12
This being the case, it is important to look at the ingredients of SMUD’s “business plan for photovoltaics” as shown by the history of their Solar Program since 1993, to look for evidence that their business plan has also stimulated other utilities to follow their lead, and to appraise elements of a future business plan for photovoltaics that might help SMUD to achieve their long-range PV business goals. This and the next major Section of this report seeks to present our views on this.
2.2 Overview of SMUD’s Market Development Philosophy
The underlying philosophy adopted for the SMUD Solar Program had first been enunciated by one of the authors of this report (DA) in a report to the State of California in 1991, and further refined in later publications13:
Simply stated, it [SODC] represents a condition in which the costs of a new technology progressively decline through the action of a growing and stable market that is stimulated by orders placed on a reliable and predictable schedule. The orders increase in magnitude as previous deliveries and engineering and field experience lead to further reductions in costs. And, with respect to the renewable electric power resource, the reliability of these orders can be projected many years
11 Osborn, Donald E., Sustained Orderly Development and Commercialization of Grid-Connected Photovoltaics: SMUD as a Case Example, Advances in Solar Energy, Vol. , No. , pp. 12 Ibid.13 See, for example, Aitken, D.W., Sustained Orderly Development of the Solar Electric Technologies, SOLAR TODAY, Vol. 6, No. 3, p. 20 (May/June, 1992).
19
into the future, on the basis of long term contracts, to minimize market risks and investor exposure.14
Early on, SMUD decided to “force” the cost-reducing benefits of SODC by taking advantage of the opportunity those contracts for significant amounts (megawatts) of PV would provide. These were initially awarded on a year-by-year basis to the winning bidders. But then SMUD added the advantage of a five-year guaranteed contract, again for MWs of PV. PV manufacturers and installers willingly responded with bids guaranteeing continuing year-by-year cost reductions, on the assumption that they could reduce their own costs at a sufficiently rapid pace to provide at least minimal profit over the term of the contract. The results, from the inception of the Solar Program to the end of the present 5-year cycle, for systems applied to the PV “Pioneer” programs, were first shown in Table 2, Section 1 of this SMUD PV Program Review. We reproduce that here for convenience.
Table 2: Cost Decreases for PV Pioneer InstallationsYear System Cost
(turn-key)SMUD ProgramCost
Total InstalledCost
Energy Cost30yr, ¢/kWh
1993 $7.70 $1.08 $8.78 25 - 26¢1994 $6.23 $0.90 $7.13 20 - 21¢1995 $5.98 $0.89 $6.87 19 - 20¢1996 $5.36 $0.85 $6.21 17 - 18¢1997 $4.75 $0.59 $5.34 15 - 16¢1998 $4.25 $0.82 $5.07 14 - 15¢1999 $3.75 $0.75 $4.50 13 - 14¢2000* $3.35 $0.65 $4.00 11 - 12¢2001* $2.80 $0.62 $3.42 10 - 11¢2002* $2.69 $0.49 $3.18 9 - 10¢2003* $2.59 $0.39 $2.98 8 - 9¢
All costs in $ per kW (PTC; A/C) for “standard” roof. * Committed contract prices at contracted efficiencies.Energy cost levelized ($real) over 30 years at District cost of money or 1st mortgage rate (w/o tax benefits).
The result of this, though, is that SMUD’s SOD experience and projections departed from national expectations and experience elsewhere. This is illustrated in Fig. 4 on the next page, with costs shown for PV modules only.
14 Aitken, Donald W., New Economic Thinking and Approaches to Utility Scale Application of Solar Energy in the 90s, Advances in Solar Energy, Vol. 11 (1997). The “SOD” market dynamic was only recently slightly retitled by SMUD to “SODC”, to take into explicit account the commercialization aim of the philosophy.
20
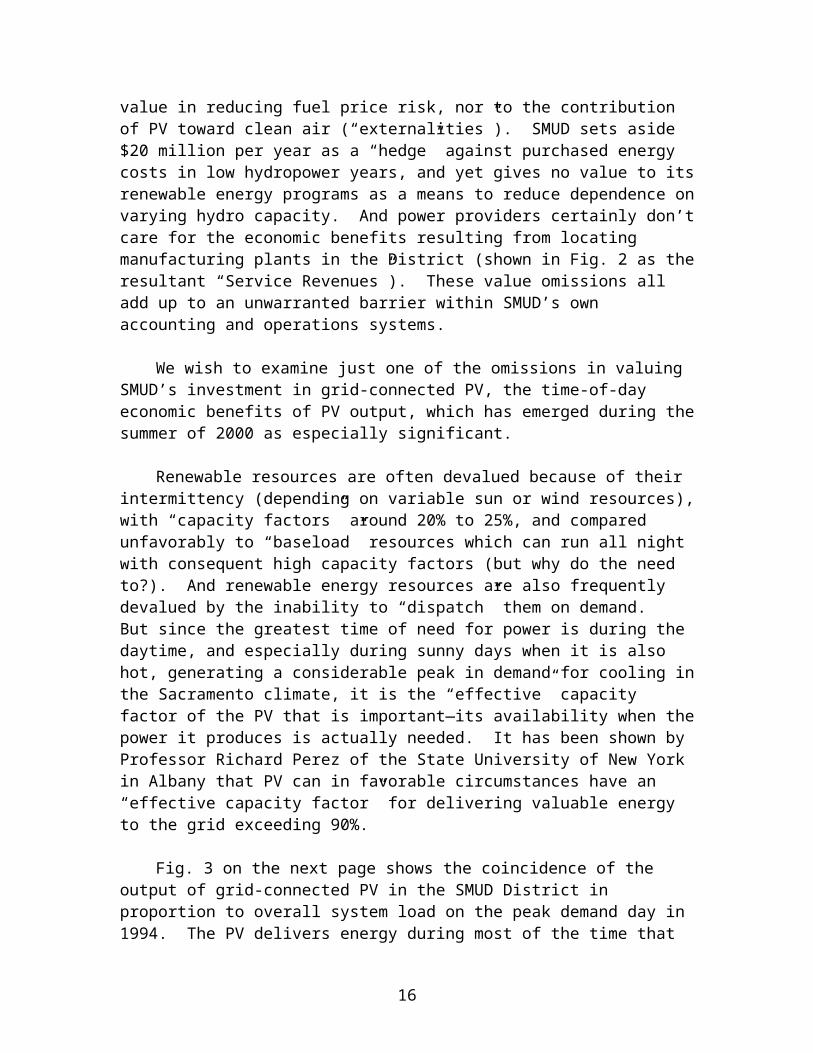
Figure 4: Cost of PV vs. Year, “Business as Usual” Compared to “SMUD With SODC”
Comparing the “Business as Usual” scenario for actual and projected cost-reductions for photovoltaics with the SMUD experience (1993-1996), SMUD guaranteed contract (1997-2002) and SMUD projected after that. The three different levels of cost-effectiveness refer to PV costs delivering energy and capacity at competitive rates (“Traditional”), or the inclusion of T&D system benefits (“Non-Traditional”), or the inclusion also of the benefits to Sacramento from having the EPV plant within the city (“With Service Revenues”).
It is clear that the SMUD market development philosophy has succeeded, certainly in the first ten years of the program, in yielding costs to SMUD that are well below levels outside of the SMUD district. This, in turn, benefits the SMUD customers, for it allows SMUD to provide the attractively low PV Pioneer costs, thereby stimulating installations (PV Pioneer I) and sales (PV Pioneer II) with relatively little contribution from the kitty established by SMUD’s Public Goods charge, and with that contribution declining each year and dropping to zero by 2002.
A second important part of SMUD’s market development philosophy is to leverage the societal benefit of the funds that they spend for PV by developing PV and balance-of-system production and assembly within the SMUD District. In this way jobs and tax revenues are produced locally, with consequent “multiplier” benefits of those expenditures. The winning bidder in SMUD’s present five-year contractual period, Energy Photovoltaics, Inc. (EPV) has indeed located a plant within Sacramento, and will soon deliver Copper Indium diselenide modules (CIS) manufactured in that facility to SMUD. Fig. 5 schematically illustrates two of the three multiple economic benefits resulting from PV-related expenditures when such a PV manufacturing facility is located in the District. [The three levels of benefits are 1) direct (sales of manufactured product),
21
2) indirect (acquisition of materials and supplies from within the District for the manufacture of finished product), and 3) induced (tax revenues, job-production and expenditure of PV plant employee income in the District)].15
Produc.Costs
PurchaseCosts
SMUD PVManufacturer
Other Firms & New
Ratepayers
Service Costs
OtherPurchases
Service Revenues
Direct Effects Indirect Effects
External Effects
Figure 5. Direct and indirect effects of SMUD’s PV purchase commitment.
Fig. 4 had already revealed how those benefits can effectively accelerate the time at which PV becomes a cost-effective expenditure for a city-owned utility. (See the hashed “With Service Revenues” range shown on that figure.) And those shown in Fig. 4 were only the direct and indirect effects, as the authors of Ref. #15 did not conduct a full input/output analysis of the impact. Nevertheless they recommended that a lower-bound “placeholder” value to SMUD of the product produced at the EPV plant is worth $708/kW to SMUD.
How much greater might this be worth to the City of Sacramento? A 1992 analysis commissioned by the U.S. Department of Energy for a PV manufacturing plant in Fairfield (close to Sacramento) revealed planned direct expenditures of $25 million per year for 10 MW of PV module sales, leading to $40/million per year for indirect expenditures, and a whopping $300 million in the county resulting from the sum total of “induced” expenditures16. One might conclude, therefore, that the benefits to Sacramento 15 Wenger, H., Hoff, T., and Pepper, J.: Photovoltaic Economics and Markets: A Case Study of the Sacramento Municipal Utility District, report sponsored by the California Energy Commission, Sacramento Municipal Utility District and the U.S. Department of Energy (1996).16 Demeter, Christian, Economic Impacts of a Photovoltaic Module Manufacturing Facility, United States Department of Energy, Office of Conservation and Renewable Energy, Office of Solar Energy Conversion, Photovoltaic Program, Washington, D.C. May 7, 1992.
22
from locating the EPV plant within City limits could be from 8 to 12 times the direct value, greatly enhancing the economic benefits of SMUD’s PV program for the City. And it should also be pointed out that SMUD has succeed in attracting a major components manufacturer, Trace Engineering, to locate the assembly of the inverters within the SMUD District, further enhancing the economic benefits to Sacramento.
The questions to be posed now are whether this marketing philosophy is
sustainable, or in what ways might SMUD begin to position their evolving Solar Program to keep it as a sustainable business element within SMUD that at least earns back its own costs, while continuing to benefit their customers and their District in important and practical ways.
2.3 Evidence for the Emulation of the SMUD Model by Other Utilities
One way to approach the question posed just above is to examine the extent to which other utilities may have emulated SMUD’s program, or at least some elements of it, perhaps revealing that they also believe that it is or will be good utility business to get into the PV business early, and in a significant way. In his fine contribution to the publication “Advances in Solar Energy”17, author Donald Osborn presented several case examples, specifically for LADWP, the Spire/ComEd/City of Chicago SODC Solar Program, GPU Solar, Idaho Power’s Applied Power Corporation, Tucson Electric Company and Global Solar, Duke Solar, and the Arizona Environmental Portfolio Standard. The author of this section of the present report (DA) visited the LADWP offices to interview the founder of both that program and SMUD’s (David Freeman), along with representatives from the LADWP PV program. He also conducted telephone interviews with the solar program managers for all of the other programs, save for Duke Solar, which is a solar thermal-electric program. In the interest of brevity of the present report, we shall not repeat the descriptions of those other programs, preferring to refer the reader to Osborn’s publication. Nevertheless, some comments on the results of these interviews are presented in the following as they affect an interpretation of SMUD’s marketing philosophy.
The overall conclusions from the telephoned interviews is that there is really only one other utility program that is of a scope in both size and multi-year focus similar to that of SMUD, and which also shares the same sort of utility-benefit-centered PV marketing goals as SMUD, and that is the LADWP solar program. As noted above, both programs were founded by the same person, David Freeman, who was SMUD’s Administrator during the conception of SMUD’s Solar Program, and who hired Donald Osborn to direct it. So the LADWP program is not exactly an “emulation” so much as an “evolution of concept”. It nevertheless demonstrates that elements of the SMUD model work in other and even larger municipal utility frameworks, and therefore that the
17 See Footnote 11. Donald Osborn is SMUD’s Superintendent for Renewable Generation including Photovoltaic and Distributed Technologies (PV/DT) group in the Power Generation Department.
23
extrapolation of the SMUD model rests more on utility leadership than on the particulars of the model.
This is both an interesting and discouraging circumstance. It suggests that, while considerable interest by other utilities has been shown toward the SMUD program [e.g. leading to awards to SMUD by the national coalition of over 100 utilities with interests in photovoltaic applications, the Utility Photovoltaic Group (UPVG)], the same leadership that produced the SMUD program has produced the only other full-scale variation of it. In most other cases, utilities engaged in relationships with manufacturers or suppliers of PV who appear to be pursuing PV as a utility business are doing so either because they have been required to develop solar programs in legal settlements (e.g. Commonwealth Edison), or because they must meet legislatively mandated goals (Tucson Electric), or because the utility’s holding company is interested in making money through a legal subsidiary that is selling PV primarily out of the utility’s district, to high value, remote, or international markets (Idaho Power).
In other words, SMUD’s accomplishments and internal benefits from their PV program have not yet stimulated similar programs in areas other than Los Angeles18. This is partly the result of short-term economic approaches by most utilities, which continue to choose conventional resources as the presently favored low-cost option, and partly due to the uncertainties related to actual or impending restructuring (deregulation). The important point we wish to make of this, though, is that this failure to jump on the SMUD-model bandwagon by other utilities does not portend a failure of the SMUD model. Indeed, SMUD will probably continue to be able to position itself better in terms of coping with the increasing volatility of fuel prices and electricity supply constraints, as well as for potential emission-charges (e.g. carbon taxes) that may result from international pressures, than other utilities (save perhaps for LADWP), by maintaining and strengthening their aggressive efficiency and renewable energy programs. Still, a comparison between SMUD and the LADWP can illuminate other features of potential value to SMUD’s future PV program directions.
2.3.1 Lessons Learned from Comparing the LADWP PV Program with SMUD’s
The LADWP PV program matches SMUD’s in aggressiveness and exceeds it in scale, proportionate to the much greater number of customers and resulting larger budget for such activities (e.g. SMUD’s goal toward the U.S. Million Solar Roofs Initiative by 2010 is 25,000 roofs, while that for the LADWP is 100,000.) The LADWP plans to spend $65 million to accomplish the installation of 14 MW of PV over the next five years (2000-2005). While an expected arrangement with British Petroleum (BP) to laminate PV modules within Los Angeles City limits, and to provide 2-3MW of product each year to the LADWP over a five-year period at progressively declining costs (and, hence, very similar to the arrangement between SMUD and EPV) collapsed, setting the LADWP 18 This is not precisely true, for the City of Davis, directly adjacent to Sacramento, is pursuing a PV program, but contracting with SMUD to provide the expertise and hardware, under SMUD’s PV Partnership Program. And the City of Austin, Texas, Municipal Utility also shares some of the elements of the SMUD program.
24
program back, it is still the goal of the LADWP to enhance the economic benefits of their PV program through a regional economic development opportunity. This is now being negotiated with other potential PV suppliers.
The LADWP also shares a number of the SMUD programmatic aims. They support their Green Power for L.A. program, for example, similar to SMUD’s Pioneer I program, in which the homeowners do not pay for the PV installed on their roofs, nor do they get any discounted power from the proximity of that PV. But the volunteers are providing space for distributed PV resources, which are then paid for by the green power surcharges.
In addition, Los Angeles homeowners can elect to purchase their own PV systems with the benefit of a $3/watt buydown by the LADWP, paid for by the LADWP Public Goods Charge. But here is a major difference between the SMUD and LADWP PV programs. The bulk-purchases of PV modules by the LADWP are reserved for LADWP installations. Homeowners purchasing their own systems will receive the buydown incentive, but will contract with private installers, not with the LADWP, and for the going rate for PV installations by private contractors in the region, not necessarily just in Los Angeles. This does not produce as favorable a financial circumstance for the homeowners as in Sacramento, but, according to LADWP Administrator David Freeman, it keeps the LADWP as a participant with all other regional PV installation contractors, rather than as a competitor.
Freeman reasons that it is the wish of the LADWP to have the PV installations in their district (3 million utility customers) stimulate by example installations for the 20 million utility customers living nearby, but out of their district (e.g. Orange County), and that this can best be accomplished if the costs are uniform across District boundaries. The $3/watt LADWP buydown from within their District is matched by the $3/watt buydown offered to customers of California’s investor owned utilities outside of the LADWP district, while all other costs are the same. This removes a potential marketing constraint for PV beyond the LADWP District that SMUD will have to face, namely, the higher costs of PV installations as SMUD seeks to have influence in the nearby territory of an investor-owned utility. This is discussed in part 2.5 of this Section.
A major tenant of the SMUD marketing philosophy is that SMUD’s program can have an impact on nationwide PV and PV system costs, that is, that SMUD’s SODC program will help propel the national SODC benefits to lower costs at earlier dates (see Fig. 4). And yet SMUD’s actual PV purchases, as large as they are, represent only about 1.5% of PV sales by U.S. manufacturers, which could not directly have much of an impact on national prices. The LADWP, with a larger PV program than SMUD’s over the next five years, acknowledges up front that their PV program itself won’t drive down the PV costs, but the ancillary benefits, resulting from publicity, educating architects, and gaining public confidence in PV as a standard way of doing business, will bring benefits to the entire PV community from increased sales, and hence lower prices indirectly.
25
Finally, we addressed in Section 1 of this report the apparent reluctance of SMUD’s Power Generation Department to ascribe real value to benefits of grid-connected PV to the SMUD system, beyond energy and a portion of the rated PV capacity. It is interesting to note in this regard that the rationale by the LADWP for expending funds on PV comes in large part from a “non-traditional” benefit: earthquake reliability and security (for end-users of electricity), which the LADWP sees as a rapidly growing concern by their customers.
The LADWP engaged in a $1 million marketing effort to its customers. In addition to offering PV for earthquake reliability and security, they appealed to their customer’s “pride in living in a home for the 21st century”, “pride in using homegrown electricity” and using PV as a “ hedge against energy price inflation.”19
2.3.2 Some Observations on Other Utility PV Programs
A few brief observations resulting from interviews with other utilities or suppliers regarding their PV marketing programs are offered in the three examples that follow, but only as they supplement or expand on the descriptions in the article by Osborn (see footnote #1 on p. 1 of this Section). The purpose of this is to generalize to the observation presented at the end of these examples.
2.3.2.1 Commonwealth Edison, the City of Chicago, and the SPIRE Corporation
Commonwealth Edison and the City of Chicago have an agreement with the SPIRE Corporation to build a PV factory on a 6-acre “Brownfield” in Chicago and to construct an adjacent 2.5 MW PV generating station on the Brownfield land (producing electricity at 0.4MW/acre), selling power to Commonwealth Edison, and for SPIRE to provide a total of $12 million in PV products over a five-year period to Commonwealth. The City of Chicago reaps the economic “multiplier” benefits of 50 new employees and a new business, as well as a cleaner power mix. Commonwealth’s involvement, however, resulted from a settlement with the City of Chicago following a power outage, and they are reluctant participants. Commonwealth has apparently done no analyses at all on “non-traditional” PV benefits, such as peak load shaving, reliability enhancement, or T&D benefits. Indeed, it was the SPIRE Corporation that pointed out to Commonwealth that turning the “Brownfield” into a “Brightfield” would save the utility $0.5 million per acre of clean-up costs. Taking this one “non-traditional” benefit into account, SPIRE calculated a 20-year resultant cost of energy from the PV applications to Commonwealth of $0.23/kWh. This is still almost three times higher than SMUD’s 30-year estimate for the 2003 end of its present program (see Table 2), leaving Commonwealth with little interest in the PV ventures.
2.3.2.2 Idaho Power
19 Administrator David Freeman expressed these views in a conversation on 11/19/99.
26
The utility Idaho Power is involved in a multi-corporation ownership relationship with the Applied Power Corporation, now billed as the largest domestic supplier of PV in the U.S. Included in the APC “package” are Ascension Technologies (for on-grid applications), Solar Electric Specialties (SEC), and Alternative Energy Engineering (AEE). But Idaho Power and all of the other companies are also owned by their parent, Idacorps Technology, which also has an interest in fuel cells (Idatech). These are all business ventures for Idacorps, which are certainly laudable, but Idaho Power’s participation in the PV applications is now almost negligible. Starting in 1991 Idaho Power offered a pioneering program to new customers to substitute off-grid PV power for line extensions when the PV was cheaper. About 250 of those were installed, but then the program stalled out, and today Idaho Power basically just maintains them, although they are looking at a few possible high-value applications, such as cathodic protection and remote communications. But with 60% of Idaho Power’s energy from low-cost hydroelectric, Idaho Power continues to have little interest in PV for itself.
2.3.2.3 Tucson Electric and Global Solar
Unisource Energy owns Tucson Electric Power (TEP) and has a 2/3 equity position in the thin-film flexible-substrate PV company Global Solar, also located in Tucson. This marriage has enabled TEP to install 260kW of PV systems in 5 projects, using product provided by, but not yet manufactured by, Global Solar. This relationship would seem to bode well for a SMUD-like future. Indeed, TEP’s responsibility under the new pioneering Arizona Environmental Portfolio Standard (EPS) will be for 10MW of PV by 2007. Since TEP is only 1/3 the size of SMUD, this would be equivalent to 30MW of new PV by SMUD in the next 7 years. Accordingly, TEP will continue with an aggressive PV program, relying on multiple providers, yet only using a portion of the product manufactured by Global Solar.
While this would seem to be fully similar to SMUD’s program and the potential benefits for Tucson customers, TEP’s careful economic calculations continue to show little financial benefit of PV to TEP. The “value” of the PV power, taking into account the system load profile and the time-of-day PV output, is still lower than either the output of their nuclear plant (Palo Verde) or a possible wind-electric plant. The late evening peak power demand in that hot climate leaves PV with only a 20% coincidence at best with the peak, and the remaining peak after sunset would still load down infrastructure, giving PV no T and D value. As a result, TEP is building PV applications only in response to the legislated EPS mandate, but not because they see any intrinsic value for the utility. Still, they want to keep the PV costs down, so they recommend the economics of large central PV plants as being better for this than building-integrated PV applications (BIPV). The ground-mounted PV arrays at TEP switchyards are there only as cheaper methods to meet the EPS, not because of any perceived value to the switchyard.
2.3.2.4 Austin Energy 20
20 This description was taken from an earlier work by one of us (SS).
27
Austin Energy (formerly the City of Austin Electric Utility Department) currently owns 2,450 megawatts of generation capacity, mostly from coal, natural gas, and nuclear sources.
Customers in the Austin Energy service territory have shown a strong interest in participating in and supporting efficiency and renewable energy programs. Austin Energy and the City of Austin are already recognized for some of the most comprehensive and successful energy conservation programs in the nation. Since 1982, more than 100,000 Austinites have used Austin Energy rebates or low-interest loans to make home energy improvements. Austin Energy's Green Building program, which provides assistance to builders in the design of energy and resource-efficient and environmentally friendly homes, is the largest in the country in terms of the number of builders participating (58), the number of architects and designers (59), and the number of homes built (681 in FY 1999) with Green Builder features. Now, Austin Energy is beginning to incorporate PV and other renewables in its service territory as a test of clean, distributed generation.
In support of these clean energy alternatives, Austin Energy is committing to $7.8 million in spending in each of the next 10 years to build its green power program.
Austin Energy's GreenChoice is a program aimed at providing power generated from wind, sun and biomass sufficient to meet 5% of the utility's energy sales by 2005. Through March 2000, about 700 residential customers have signed up for GreenChoice and another 500 have received brochures. The program costs subscribers an additional $0.004 per kWh-the smallest premium of any green power program in the nation, according to a Department of Energy survey. Subscriptions of five large companies alone will absorb about 15 percent of the initial 40 MW of green power that began to flow into the Austin Energy grid by the fall of 2000.
Solar Explorer is Austin's newest renewable energy program. For just $3.50 per month, residents of Austin can share the cost of constructing PV systems, but these are not mounted on residences, and the focus of the Austin program is not on a systematic development of a PV market. Austin’s program is perhaps more closely allied with Wisconsin’s “Solarwise Schools” program as far as the use of public funds for the construction of PV is concerned. So while the Austin Energy model is laudable, it is not really a replication of the main market-based ingredients of the SMUD PV program.
2.3.3 Conclusions from these other utility experiences
The perceived economic “value” to the utility and/or its customers is still the short-term driving force behind most utility interest in PV. If the benefits are not there, or cannot be demonstrated, the utilities remain uninterested, only moved into PV programs by various forms of legislated or PUC or court-mandated coercion. This is
28
unfortunate. But this underscores the necessity for SMUD to continue to determine, evaluate, and publicize the economic benefits of its PV applications to its customers as well as internally to other SMUD departments. And this also underscores the need for SMUD to demonstrate that the PV programs earn their own way. For the next 12 years this is safe for SMUD, because of the extension of the California Public Goods Charge program and SMUD’s adoption of its share of that. But these funds can be used broadly for public goods, so the more that SMUD’s PV programs earn their own way, or have costs covered by green surcharges or PV partner expense reimbursements, the more Public Goods funds can be diverted to other programs within SMUD.
2.4 Marketing Challenges Facing SMUD
There are now at least three major marketing questions before SMUD, as they look toward projecting their PV market development philosophy well into the future. The first is whether their low costs are sustainable, in light of continuing experience outside of their district that would suggest that higher prices are the norm and in face of criticism from contractors outside of the SMUD District who argue that SMUD is “subsidizing” their low costs in a competitively unfair manner. This becomes an apples and oranges argument, however, for the higher prices quoted by others are not based upon multi-year, multi-megawatt acquisitions, therefore requiring PV suppliers outside of the SMUD District with the need to recoup costs of each sale from each sale, rather than over a period of time during which hardware costs also decline.
SMUD can also reasonably argue that any other utility, or any other sales entity, for that matter, could achieve the same cost reductions as SMUD, if it embarked on programs of the same type and magnitude. Therefore, it is appropriate to examine the possibility of SMUD’s continuing success based upon the SODC curve shown as “B” in Figure 4 (“SMUD with SOD”), for it does indeed pertain to the reality of SMUD’s accomplishments and projections. That it diverges from the national SODC projection is not really relevant to SMUD, except to underscore the earlier arrival by SMUD at full economic justification for its PV Program.
The second marketing question before SMUD, though, is whether the market demand within their District will be sufficient over a large number of years to provide for a stable market at costs that keeps SMUD on their SODC path, or whether they can and should supplement those activities and revenues with expansions beyond their District, such as their “PV Partnership” program, in order to continue to provide a sufficient market for multi-MW PV acquisitions at continuing favorable prices.
Two projections made for SMUD’s PV market potential in the Pioneer programs are presented on the following 2 pages as Fig. 6 and Table 3.21 They are basically consistent, both suggesting hundreds of MW of realistic customer potential just within
21 From Wenger and Hoff—see footnote 6.
29

the SMUD District, certainly enough to provide SMUD with years of reliable sales for its multi-year programs from within its own District, but clearly price-sensitive, requiring SMUD to continue to obtain PV systems at bulk, multi-year prices, to pass the savings on to their customers.
Figure 6: Surveyed market potential for PV Pioneer II PV installations
Table 3. Future Potential MW of PV Pioneer Installations for SMUD
Distribution Planning Area
Potential in 1996 (MW)
Potential in 2000 (MW)
Potential in 2005 (MW)
AFB < 1 < 1 < 2Antelope 13 14 15
30

Carmichael / Citrus Hts 147 158 174Downtown 6 6 7Elk Grove / Laguna 37 40 44Folsom 12 13 14Galt 13 14 15Industrial Area 6 6 7N Natomas 4 4 5Other Area 31 33 37Pocket 15 16 18Rancho Cordova 31 33 37Rancho Murieta 3 3 4S Natomas / Elverta 66 71 78
TOTAL 385 412 457
A third marketing challenge before SMUD is to manage to gain better evaluation of PV’s true economic value within the other operations of SMUD. It does not make sense, for example, as first argued in Section 1 of this report, for the peak-shaving benefit of SMUD’s 8 MW of PV to be given no value. It does not make sense for the contribution of PV located on buildings or at substations toward enhanced reliability of service to be given no value. It does not make sense to give no value to the growing security of customer costs from SMUD’s renewable energy supplies, or to the value of the non-hydro renewables as a “hedge” against low hydro potential years. It does not even make sense not to appreciate the huge public relations benefits accruing to SMUD from giving customers what they want and believe in. These are challenges, however, that can only be met within SMUD, and so we can only recommend—as we do—that this policy within SMUD be changed.
2.5 Trends in Emerging Utility Market Structures
People who live in Sacramento are privileged, for they participate in the very favorable combined buy-downs and low system costs provided by SMUD. People who live outside of Sacramento can only look at those costs with envy, as they receive higher quotes from private contractors, and may be discouraged from PV applications by the higher costs that they must pay. This in principle could severely limit the ability of SMUD to extrapolate its program benefits to areas outside of its District.
But there are at least three ways out of this, which can in principle continue to provide the low-cost PV installations that SMUD customers enjoy, but also enhancing the value of the SMUD PV Program to outside of the District. The first has already been mentioned, and that is that any other utility can elect to undertake the same multi-year bulk PV purchases and, hence, offer the same attractively low prices to their own customers. But electricity customers just outside of the SMUD territory are served by the
31
Pacific Gas and Electric Co. (PG&E), which is an investor-owned utility, and hence which operates on very different financial assumptions, because of the deregulated nature of California investor-owned power suppliers.
SMUD is still a “vertically integrated” company, managing all aspects of the delivery of power to its customers, and hence able to realize PV benefits from one internal operation as they benefit other operations, whereas PG&E is now a restructured company selling the distribution of power that it buys from the California Power Exchange, so the accrual of financial benefits from PV installations are no longer centered within one company. This is a major potential stumbling block. Indeed, as PG&E is paid by its customers today on the basis of the energy delivered over their T&D system, reductions in energy use by end-users could have a negative effect on PG&E’s earnings. And PG&E purchases its power from the California Power Exchange, and has little intrinsic incentive to acquire more costly power.
The way out of this dilemma is the second “leveling the field” policy, in that California legislation requires utilities to gather a surcharge from each customer and apply this “Systems Benefits Charge” to “Public Goods” Programs, of which renewable energy is one. There may have been some long-term uncertainty in this, in that the present $54 million for PV is to be expended by March 2002. But the Public Goods program, recently extended ten years by the California legislature, will produce well over an additional billion dollars for renewables over that period, guaranteeing important PV buydown potential through 2012.
The $3/watt present California Energy Commission buydown for PV is similar to SMUD’s first-year buydown rate for its customer-owned rooftop systems (see Table 4 below). And as PV applications increase, the basic cost for installed systems by the private sector will be lowered, while SMUD will reduce its own contribution to its customers in proportion to a decrease in SMUD PV system costs. (Table 4 shows that SMUD’s costs charged to its customers level at $2.50/watt starting in 2001.) This may serve to bring the SMUD costs and the private sector costs for customers outside of the SMUD territory considerably closer than they are now, reducing the apparent SMUD District advantage.
Table 4: PV Pioneer II: Estimated Unit Prices – ($/W) 1998 1999 2000 2001 2002 2003
SMUD Cost $ 5.07 $ 4.50 $ 4.00 $ 3.42 $ 3.18 $ 2.98“Buydown” $ 2.84 $ 2.13 $ 1.60 $ 0.92 $ 0.68 $ 0.48Customer Cost* $ 2.23 $ 2.37 $ 2.40 $ 2.50 $ 2.50 $ 2.50
* Available to SMUD distribution customers.
A third method by which SMUD can help to reduce the inequity of costs for its own customers and those outside of its District is for SMUD to provide services that would otherwise be more costly in the private sector, and to embrace aggregation of PV purchases with other entities outside of its District. This begins to describe the “PV Partnership Program”, which is discussed in the next part of this Section.
32

2.6 Additional Market Potential for SMUD’s PV Program
There appear to be at least four areas in which SMUD can (and, to a good extent, already does) expand its PV Program influence and activities. Three involve conventional PV applications. The fourth would be for SMUD to more aggressively seek opportunities for “high-value” or “Niche” PV applications within its own District, such as applications for streetlights, billboards, building security systems, and perhaps peak-shaving for commercial buildings, to reduce the high end of their bills (see footnote #8.) The authors of the NRDC Review of the SMUD Public Benefits Programs suggest that this could also diversify SMUD’s financial risk in its own PV program22.
We have already expressed out opinion in Section 1, however, that this “safe” haven for PV investments is not an adequate cornerstone on which to build a marketing plan based on large future volume and to continue accomplishing program cost reductions:
The advocacy of the Niche Market approach as the primary basis of a PV commercialization policy today is much like building the Maginot Line; it is a policy that responds to past conditions, not to the changed conditions of the present nor of the future. Commercialization policy for this decade must reach beyond the Niche Market approach if that policy is to make a significant impact towards commercializing PV for the broader grid-connected markets and permitting PV to make a real impact towards being part of the solution of our critical energy and environmental problems…The Niche market does continue to be important as a precursor to these other, volume driven strategies and as an excellent way for new players to gain useful experience and develop confidence with PV.23
A published research report on “Expanding Markets for Photovoltaics: What to Do Next”, recommended a number of market strategies24. One of those, and consistent with the discussion above, was the author’s view that “…the secret to expanding markets for PVs seems to include both the exploitation of high-value markets and subsequent volume-driven cost reductions.” SMUD has reversed this process by using high-volume PV programs to reduce their costs before investing in other applications. The result is that their future investments in “high value” PV applications will now be even “higher value” for SMUD.
The REPP research report also stressed the importance of “buy down” policies, net metering, standardized interconnection requirements, and minimal additional fees. There
22 Gordon, F., Hewitt, D., and Pratt, J., Pacific Energy Associates, Inc., Review for Sacramento Municipal Utility District Public Benefits Programs, Final Report, prepared for The Natural Resources Defense Council, August 12, 1999.23 See footnote #1124 Serchuk, A., and Singh, V., Expanding Markets for Photovoltaics: What to Do Next”, Renewable Energy Policy Project, Special Report, December, 1998
33

is no doubt that SMUD’s program is certainly consistent with this package of nationally recommended marketing strategies.
SMUD has already developed its “PV Partnership Program”, in which it offers procurement support (e.g. in the form of aggregated orders to reduce costs), technical consultation and programmatic assistance (with SMUD paid for its professional time), and joint development projects. Continuation and expansion of this could presumably help to support staff personnel and SMUD overhead in SMUD’s PV program, while meeting SMUD’s goal to extend its influence and benefits to a wider field. SMUD PV partnerships from 1997 through 1999 are shown below in Table 5.
Table 5: SMUD PV Partnerships 1997 through 1999Partner Scope of activity with SMUD
Alameda Bureau of Electricity TEAM-UP, 4kW system supplied
Citizens Utilities, AZ TEAM-UP, 16 kW systems supply
Los Angeles Dept. Water & Power TEAM-UP, 28 kW inverter supply, consulting
Main Power, New Zealand 4 kW system, program assistance
Western Area Power Administration TEAM-UP, 51 kW systems supply, program assistance
Northern CA Power Agency TEAM-UP
New York Power Authority TEAM-UP
Salt River Project TEAM-UP, Renewables & Distributed Generation Joint MOU
Tucson Solar Alliance TEAM-UP
CA State Parks Department 4 kW Visitor Center PV system
City of Roseville Electric Department TEAM-UP, 8.5 kW Bleacher/PV system
State of CA 20.5 kW Parking Garage Solarport
Jacksonville Electric, FL MOU, 8 kW systems
National Park Service/NREL PV energy supply system for Alcatraz, 85+ kW
Truckee-Donner Public Utility District, CA TEAM-UP, 2 kW system, DAS
State of CA EPA 30 kW turnkey rooftop system on new high-rise
A third potential market expansion area is for SMUD to be the provider of components and expertise to other utilities, partnering with them in bulk and multi-year PV module and balance-of-system procurements, and being reimbursed for SMUD expertise. SMUD has long offered this opportunity, but there have been few takers, and only for selected projects (see Table 5), not for long-term multi-megawatt joint programs. These would be mutually beneficial in reducing PV costs for SMUD as well as for its
34
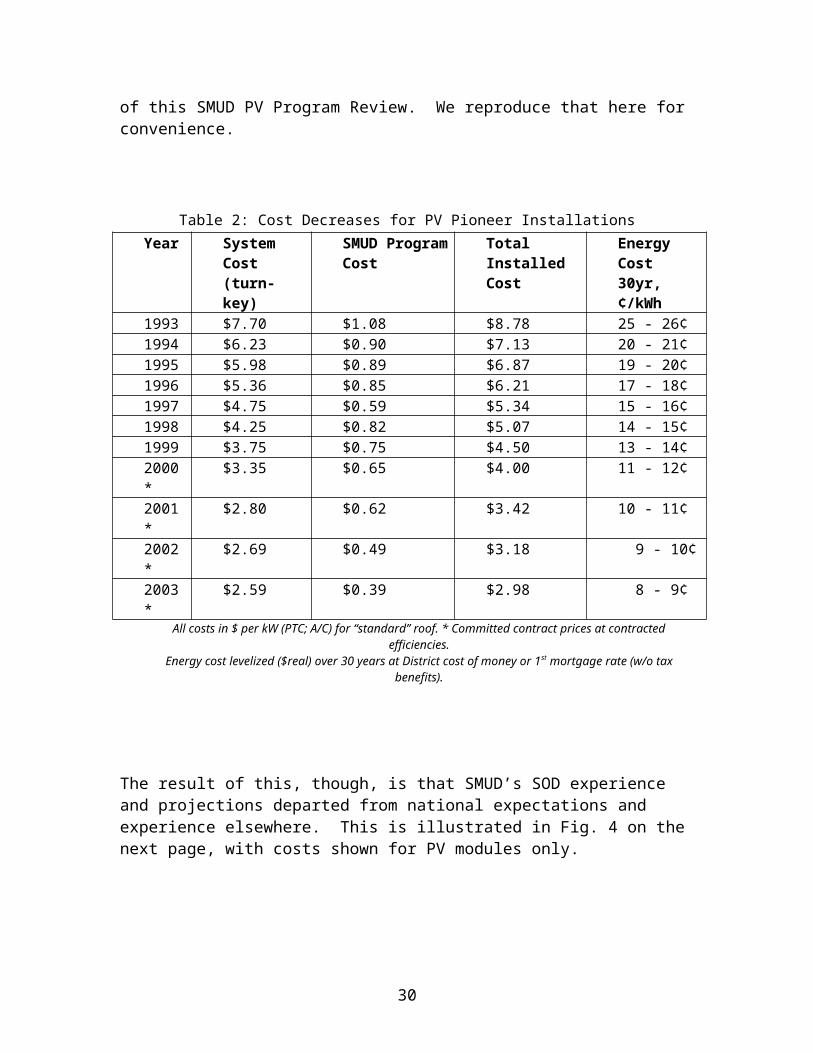
procurement partner. But it will require a commitment by the partnering utility equivalent to SMUD’s own, and, as we have presented, we are not aware that this has yet emerged in places other than Los Angeles, and perhaps partly also in Austin, Texas.
A fourth market expansion area, which SMUD is also already seriously pursuing, is in the field of new residential construction. One-half of the projected load growth for the utility (and for the State) is expected to come from new residential construction. Toward this end the SMUD Solar Program is actively teaming up with its own architectural department to develop and complement substantially more efficient residential designs (Energy Advantage Tier III) with modest-sized (2kW) rooftop PV systems. The aim of this is to produce “zero net peak demand” houses, so that the new residential construction in its district does not exacerbate the expensive power purchase needs by SMUD during peak demand times. This was shown in a careful Florida experiment to be an effective and realistic option25.
The aim of the partnership of the SMUD Solar and SMUD New Construction Programs is to remove the new on-peak load while retaining the off-peak load. The estimated maximum potential of this could be 22.5MW/year load reduction, at post-2003 costs of less than $3/W for installation and 8-9 cents/kWh for energy costs,26 well below those for either standby peak load generation or power purchases to meet peak loads. As argued several times by us, though, this also requires recognition inside SMUD of these financial benefits accruing to SMUD from combined architectural and PV applications, so that the economic savings enjoyed by SMUD’s power purchasing department can be attributed to the PV and New Construction Programs, to offset the architectural and PV program costs, possibly neutralizing those costs in view of internal bookkeeping. Under the present system, the savings are absorbed by SMUD, while the costs are seen as separate budget line items that “subsidize” the PV program.
An additional benefit of the new construction program, however, would be to reduce costs for future SMUD PV applications, since it is easier and cheaper to install PV in new construction than in retrofit applications.
Further market development aspects of the future SMUD Solar Program are
presented in Section 3 of this report.
2.7 Conclusions
The purpose of this section has been to examine the economic basis and wisdom of SMUD’s solar marketing program to date, and to see if weaknesses are showing up. SMUD’s aim is for the solar program to become essentially self-supporting.
25 Parker, D., and Sheinkopf, K., see Footnote #10.26 Osborn, Donald, from his talk at the UPEX 2000 Conference, “SMUD and the Solar Power Frontier”
35
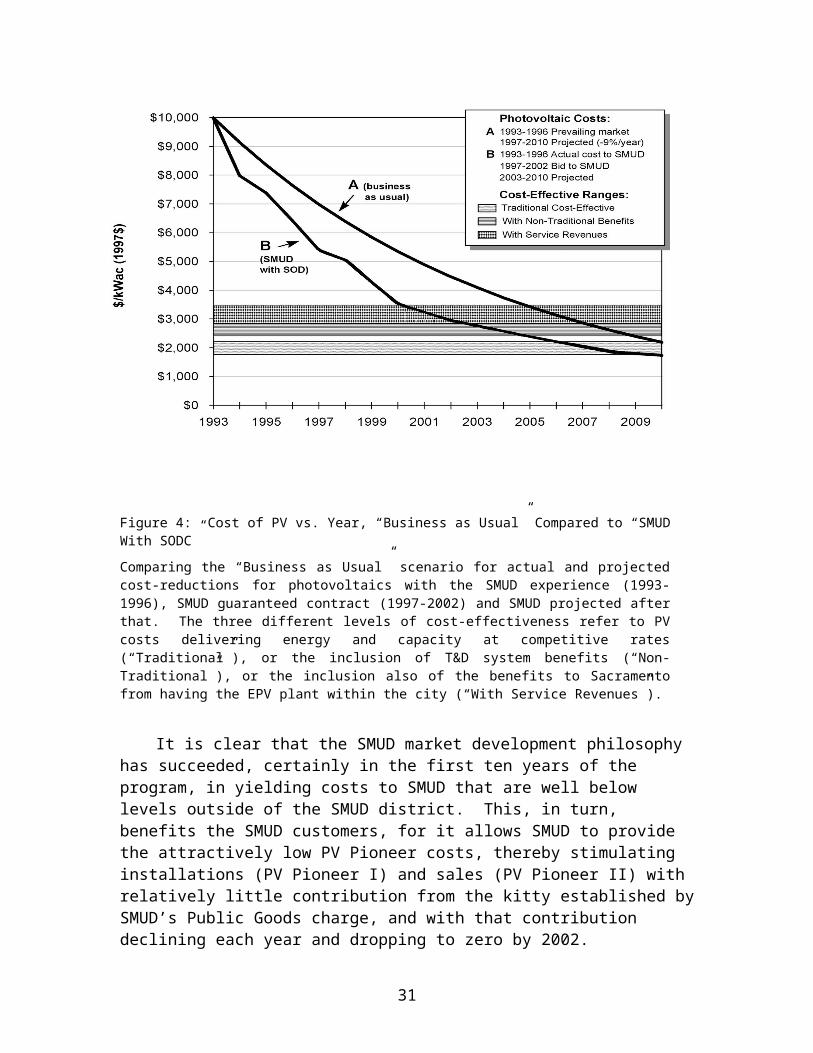
With regard to potential program or marketing weaknesses, no glaring ones have appeared in our analysis. Indeed, we see emerging new strengths as the SMUD Solar Program staff embarks on many of the directions that we suggest. It is good that this has been accomplished to date with so little impact on SMUD’s finances. Quoting from Osborn’s review paper (see footnote #8):
The multi-year, 10MW program is being funded by SMUD mainly through the market value of the PV generated energy and just 0.6% of annual District revenues being committed to PV under the Public Good Fund (PGF) program at SMUD. Over the 5-year period, 7.5 MW of the full 10 MW is funded by the value to SMUD of the PV generation as a wholesale, power market commodity (about 2 to 3 cents/kWh) and the 0.6% of revenues that is committed to the renewables portion of SMUD’s Public Goods Funds (about $3.6 million per year). The balance of the 10MW, about 2.5MW, is covered by leveraged funds that include PV Pioneer II sales, PV Partnership sales, and grants or cost-shares such as TEAM-UP funding.
We believe that it is not at all unreasonable to aim to have the SMUD Solar Program become essentially fully self-supporting within this next five-year cycle of PV procurements. But we also note that SMUD should plan to continue subsidies for the PV program anyway, to accelerate the accrual of benefits.
We echo Osborn’s stress on collaboration among utilities; local, state and federal agencies; and other stakeholders, as a necessary ingredient to accomplish the commercialization of PV, and anticipate that SMUD’s future PV marketing strategy will continue to include (and perhaps expand upon) the kind of collaborative efforts they have already shown with, for example, the federal TEAM-UP program.
A federally sponsored “PV Technology Roadmap Workshop”, jointly conducted by the U.S. Department of Energy (National Center for Photovoltaics) and the U.S. Photovoltaics industry in June, 1999.27 Highlighted two recommendations for “Commercialization”:
Encourage consistent multiple-year funding Offer long-term low-interest financing for appropriate, easily integrated,
reliable PV systems.
And in their “Summary Session” the participants at that Workshop noted several strategies critical to the expansion of the PV market. Among them were:
Alternative subsidy opportunities to enhance the grid-tied PV market need to be developed.
Installed system prices must be significantly reduced.
27 See Report of the Photovoltaic (PV) Industry Roadmap Workshop, Energetics, Inc., Columbia, MD, September 30, 1999
36

For grid-tied systems, customer expectations in terms of performance and reliability need to be met.
Grid-tied PV applications must be accepted by the electric utility industry
. SMUD’s strategies for developing their PV market since 1993 have certainly been consistent with these recommendations. And SMUD is one of the “alternative subsidy opportunities” recommended by the PV industry and federal government.
3. A Blueprint for Commercialization
3.1 Introduction
This section of the SMUD program review addresses the question of how SMUD’s market development activities compare to those of a new business or commercial enterprise. Given SMUD’s goal of extending the PV Pioneer Program to new geographical areas or markets, a comparison of the SMUD program to accepted
37
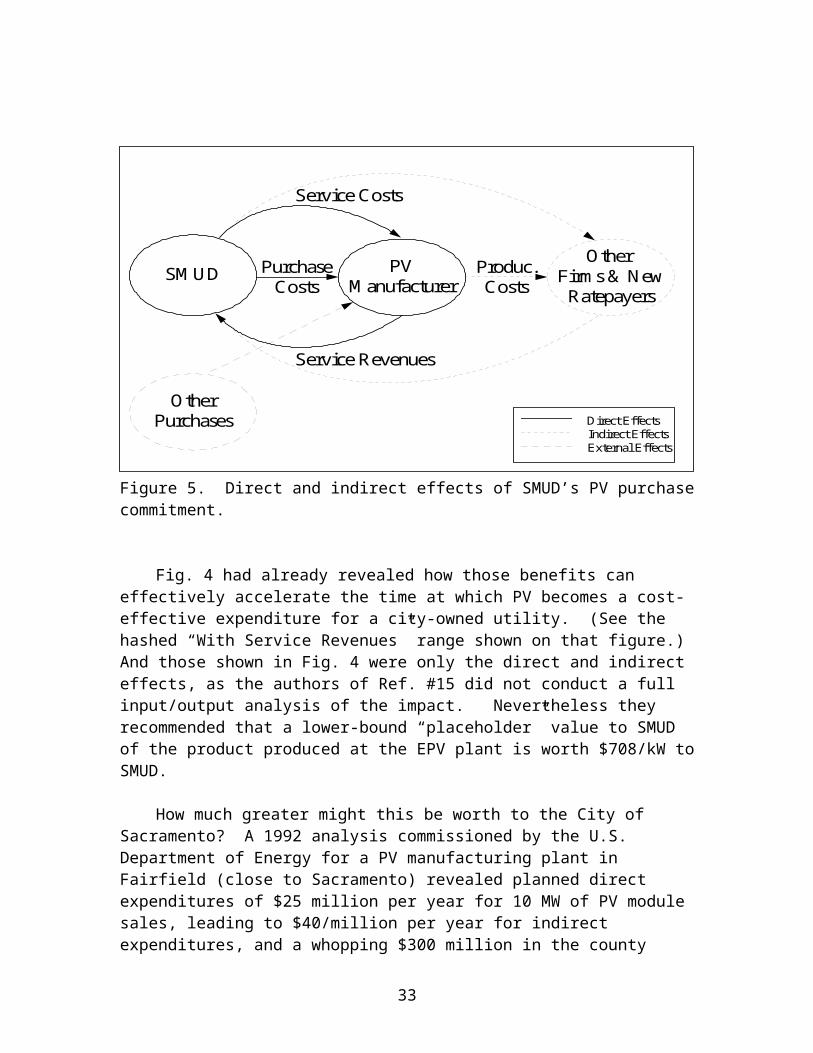
commercialization and market development models can be helpful in guiding management’s future efforts.
Included with this comparison is an acknowledgement of “best practices,” or those areas where SMUD is doing the right things from a commercialization point of view. Areas for potential improvement and requirements for commercial success are also discussed.
The material presented in this section forms a foundation from which SMUD’s market development activities can be augmented or refined.
3.2 Definitions and Assumptions
Mainstream Market – the portion of a total market represented by conservative buyers, who are referred to as the early and late majority. The mainstream market segment contains 67% of a market’s total population.
Discontinuous Innovations - new products or services that require the end user to significantly change their past behavior.
Disruptive Technology – a technology whose performance or potential is not fully developed, but offers commercial value because it is cheaper, simpler, smaller or more convenient to use than established products.
Market Transformation - a process whereby new products or technologies are introduced into the marketplace and, over time, penetrate a large portion of the eligible market. Once a new product (or other type of innovation) is introduced, its penetration begins to rise through a sequence of buyer types. Penetration then "takes off" as awareness of the technology and its advantages grows. Market transformation involves ongoing and lasting change such that the market does not regress to lower levels of utilization at some later time.
3.3 New Business Fundamentals
The task of any business is to deliver value to the market at a profit. There are at least two views of how an organization goes about the task of delivering value. The traditional view is that the firm makes something and then sells it. This view assumes that the organization knows what to make and that the market will buy enough units to produce profits for the organization.
Alternatively, there is a contemporary view that says organizations must design or customize an offering for well-defined target markets. Instead of emphasizing making and selling, this view describes the business process in terms of a sequence of value creation and delivery. In this sequence, the company must segment the market, select the appropriate market target, and develop an offering that has great value to people in the target market.
38
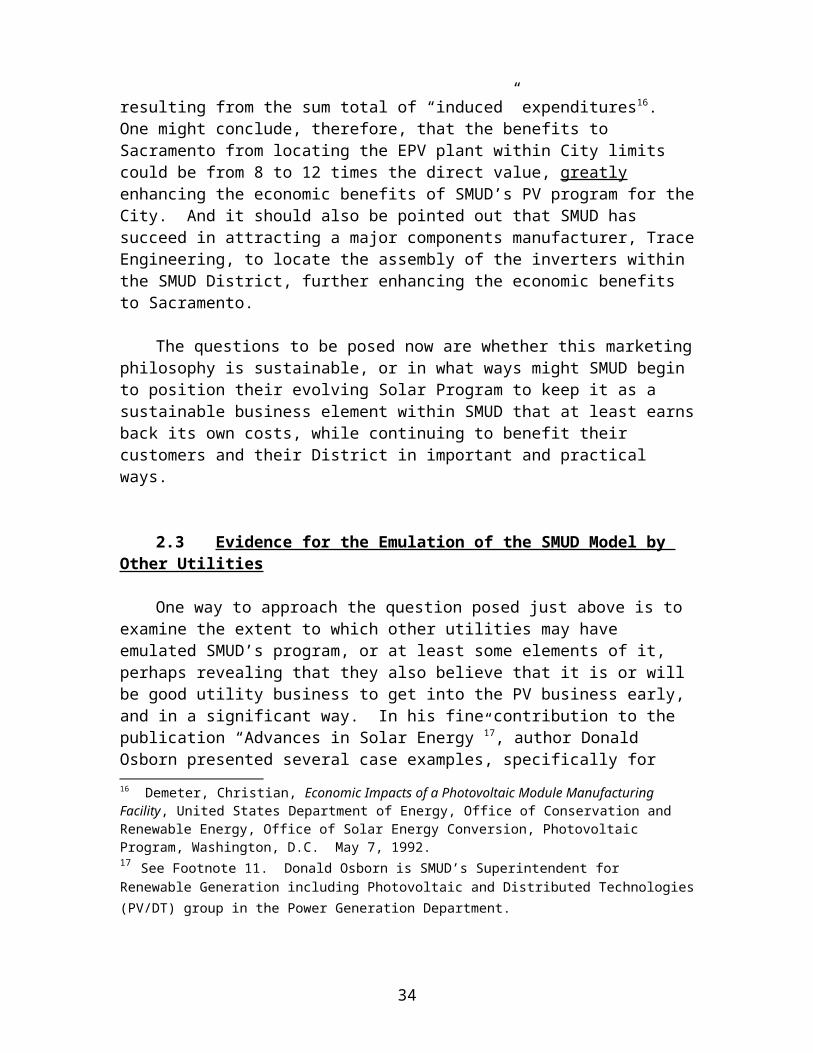
The contemporary view of business is most relevant when the product offering is complex. The traditional view is appropriate in economies marked by goods shortages, where people buy whatever is available. If an organization chooses to embrace the contemporary view of business, then an understanding of market segmentation and market adoption is required.
3.4 Overview of Commercial/Market Adoption Models
There are a number of widely accepted models of market development or “market transformation” that offer guidelines for accelerating the adoption of new technologies in an emerging marketplace. Two of them provide useful background information for this review of the SMUD PV Program.
To set the stage for an objective assessment of the SMUD program, two models of market transformation are presented prior to making comparisons with the SMUD program. Please note that not all aspects of high-technology market development theory apply to SMUD’s situation, and this introductory discussion of the market adoption process does not specifically refer to photovoltaics or to SMUD.
The first model is the Technology Adoption Lifecycle which was originally developed in 1957 based on social research about how communities respond to discontinuous innovations--new products or services that require the end user to change their past behavior. Everett Rogers broadened this model six years later in his book, Diffusion of Innovations28.
The Technology Adoption Lifecycle is a model that describes a market’s acceptance of a new technology in terms of the types of consumers it attracts throughout its useful life. It is probably the most well established model in “new product marketing” because it provides useful insight at all stages of market development.
The underlying thesis of the Technology Adoption Lifecycle is that innovations are absorbed into any given user base in stages corresponding to psychological and social profiles of segments within that user community. The process can be represented by a bell curve with definable stages; each associated with a definable group, and each group making up a predictable portion of the whole community (see Figure 7).
28 Everett M. Rogers, Diffusion of Innovations, The Free Press, New York, 19622.5%
34% 34%
16%13.5%
Innovators EarlyAdopters
EarlyMajority
LaggardsLateMajority
39
Figure 7: The Technology Adoption Lifecycle indicates the sequence in which buyers enter the market and adopt a new product or innovation. The percentage of each buyer type is also represented.
The prescription for success in introducing a new product or technology into any community is to work the curve from left to right, focusing first on the innovators, growing that market, then moving on to the early adopters, growing that market, and so on. To do this effectively, it is necessary to know and understand the psychological characteristics of each group of buyers. (The Appendix at the end of this section provides psychographic profiles of each buyer type in the adoption process)
The psychographics of each group in the adoption process influences the development and dynamics of the market. For example, each group places a different value on product intangibles, and on endorsements or references from other groups. As products move through the adoption process, intangibles and user references assume more importance. Often, pioneering new products lose their initial prominence because a new entrant is more successful in product positioning based on a more effective mix of intangibles. This can be the case even if the second product is not technically superior.
Another useful, albeit less developed model of market adoption is the Principle of Disruptive Innovation. This model provides a framework for commercializing new products whose performance is not as well developed as established products along some dimension that mainstream customers have historically valued. Developed by Clayton Christensen, an associate professor at the Harvard Business School, the fundamental principle is that new technologies usually fail when offered in direct competition (or in direct comparison) to established offerings because they are not initially able to deliver the value provided by mainstream products.
Although disruptive technologies often become competitive over time, the task of an organization is to discover alternative applications or uses that have the greatest value to early customers, and focus on those first. Historically, the attributes that make disruptive technologies unattractive in established markets often are the very ones that constitute their greatest value in emerging markets.
The Technology Adoption Lifecycle and the Principle of Disruptive Innovation share at least two fundamental attributes. First, both models describe market development in terms of the changing nature of the user rather than the product. Using similar terminology, both suggest that products are initially used by early customers who base their purchase decisions primarily on the product’s functionality. Then, once the demand for functionality has been met, vendors must begin to address the need for reliability that is demanded by an initial wave of mainstream buyers. A third phase of growth occurs when market followers and conservatives require that vendors meet their needs for convenience. The final group is mostly concerned with price.
Another shared attribute is, despite a track record of proven success, both models are counterintuitive to most business managers. When struggling for survival, a new
40
organization will find it incongruous to focus on the peculiar or specialized needs of a small group of potential buyers, before addressing the more common needs of larger groups. Too often managers attempt to serve an entire market all at once, and unintentionally delay the market transformation process.
The inescapable task of winning over a sequence of buyer types, combined with the necessity of promoting intangible benefits tailored to the user’s point-of-view, form the cornerstones of market transformation. These principles have repeatedly guided new products and companies to the achievement of mainstream market acceptance and commercial success. Much of the history and experience behind these models can be translated into helpful guidance for SMUD.
3.5 Historical Perspective: Sustained Orderly Development and Commercialization (SODC)
The strategies historically employed to spur expansion of the PV market are almost always product oriented. They are typically based on the progressive lowering of prices through economies of mass production, combined with subsidized “buy-down” programs for residential and small business users. Lowering “cost per watt” is seen as the key to unlocking a vast potential market for photovoltaics.
The cost-per-watt model requires coordinated, volume procurement of PV, suppliers willing to offer low-profit pricing and long-term service contracts, and the belief that PV installers need to prepare for the consumer market, which will soon emerge. At the same time, steps are taken to make the product (PV) more “attractive” to the consumer. These include: legislation that encourages deployment of PV systems, sales tax exemptions, interconnection standards, net metering laws, and other programs designed to ease or eliminate barriers to adoption.
A comprehensive description of SMUD’s SODC Program is provided in Section Two of this report. The purpose of this section is to provide a comparison of the SMUD program to the accepted commercialization and market development models discussed above.
3.6 Comparing SMUD with Commercial Market Development
One of the important objectives of this report is to compare SMUD’s SODC Program with the accepted principles of commercial market development. Although municipal utilities are not subject to exactly the same competitive conditions found in a free market environment, this comparison has the potential to help SMUD migrate their PV efforts toward a more commercial orientation.
Numerous past studies and development efforts have promoted a “product path” to PV market expansion, similar to SMUD’s SODC Program. PV products are subsidized
41
or supported with the primary goal of achieving economies of mass production and eliminating barriers to use. Examples include:
federal and state buy-down programs coordinated government procurement of PV elimination of barriers to capital formation legislative packages supporting distributed energy legislative and regulatory assistance to states prohibition of restrictive covenants and ordinances
As stated in a recent research report by the Renewable Energy Policy Project (REPP):
The product path requires government involvement to increase the diffusion rate of consumer [PV] products through setting market rules, making strategic purchases, and other innovative support.29
This product-centric approach emphasizes pushing photovoltaics into various applications or markets under the assumption that lower prices, attractive financing options, and the absence of barriers to implementation, will automatically lead to consumer demand.
In contrast, the underlying belief in a commercial enterprise is that people do things for their own reasons. So low price and ease of implementation do not exclusively drive market transformation. People must want to buy what is being offered. And motivating people to want something—especially if it’s technical in nature—requires the influence or involvement of preceding groups of people in the marketplace.
Most “for profit” organizations working to accelerate market transformation focus on winning over groups of buyers in sequence according to their psychographic profiles. This involves identifying a group of early buyers who initially value a product offering, and then communicating or promoting a combination of tangible and intangible benefits in ways that lead to the sale of product. After capturing the first group, the organization refocuses its collective attention on the unique needs of the next group, and so on. In this way a succession of customers act to pull the market forward as the product is adapted or “positioned” to address their varying needs.
From the standpoint of pure capitalism, it is important to realize that there is no guarantee solar power will automatically become widely adopted when it costs approximately the same, or even somewhat less than conventional sources of electricity. Many other factors influence market adoption.
3.7 The Delivered Value of PV
Qualitative interviews conducted with participants in SMUD’s PV Pioneer programs reveal some interesting information regarding the end user’s perception of
29 Serchuk, A., and Singh, V., see Footnote #24.
42
value. Results from telephone interviews highlight the differences between the customer’s value profile, and traditional beliefs about why people use PV. When asked why they decided to participate in PV Pioneer I, the most common responses were:
1. roof protection2. interior heat reduction (panel shade)3. environmental benefits
Although this survey is not statistically valid, it appears that the value of PV equipment to Pioneer Program participants is much different than the traditional benefits associated with solar power: reduced pollution, lower energy-related emissions of greenhouse gases, renewable source of energy, etc.
Furthermore, the Technology Adoption Lifecycle would lead us to expect that initially, customers would participate in the PV Pioneer Program strictly due to their love of technology. (Please refer to the psychographic profile for innovators at the end of this section) But interview responses indicate that many PV Pioneers are conservative by nature and therefore we know the expansion of the PV program in Sacramento is not following the standard technology adoption sequence (innovators, early adopters, early majority, and so on)
Also notable was the fact that nearly all respondents said they would not participate in the PV Pioneer Program if it were not offered by their electric utility. This is significant because the image or reputation of a supplier is one of the intangible benefits that lead a conservative buyer to purchase. And clearly SMUD is able to off that specific benefit whereas others may not.
The relationship between product tangibles and intangibles shifts dramatically as different stages of the adoption process are achieved. This shift in customer emphasis from tangibles to intangibles can be demonstrated schematically, as shown on the next page in fig. 8.
Innovator Early Adopter Early Majority Late Majority
43
Figure 8: The Shift From Customer Tangibles to Intangibles
As products move through the adoption process, intangibles assume more importance. This confirms the need for utilities to be part of the value chain that ultimately expands the residential use of PV.
3.8 Migrating Toward a Commercial Enterprise
One of SMUD’s stated goals is to develop a business and marketing strategy that will lead to an unsubsidized commercial market in which solar power achieves widespread acceptance. In support of that goal, SMUD can immediately begin to use many of the techniques prescribed in market transformation models originally developed for high technology.
For example SMUD can begin to accelerate the adoption of PV through use of the following “commercial” practices and conventions:
Put more emphasis on understanding where SMUD’s PV Program is within the technology adoption lifecycle. In order to apply the principles of commercial market adoption, the first step is to determine where you are on the technology adoption life cycle bell curve. Only then will you know what types of buyers are available to address, and which programs are appropriate for that group.
You can roughly estimate the progression of the market by applying the percentages underlying the Technology Adoption Lifecycle curve to the population that is served by SMUD. So in the SMUD service area of approximately 508,000 customers there are:
1. 12,700 innovators (2.5%)2. 68,580 early adopters (13.5%)3. 172,720 early majority (34%)4. 172,720 late majority (34%)5. 81,280 laggards (16%)
Rethink the target market as you progress. Just as the characteristics of a PV system changes over time, so too will the appropriate market. Readjust the description of your target market and pay close attention to the differences in the groups. For example, innovators and early adopters may be excited about a "new" product but the early and late majority will want reassurances that risk is minimal and the product will do what is promised.
Furthermore, target marketing is a critical practice for SMUD to embrace. History shows that clearly targeted products diffuse more rapidly than non-targeted products. Complicating this factor is overwhelming evidence that the customer base changes
Product Intangibles
Product Tangibles
44

for each stage of the product life cycle as different segments of the market become interested in PV at different times. Consequently, it is important to recognize the need to clearly identify and profile a target market as well as take into account that the profile of the target market will change over time.
Develop a testimonial program where early users discuss and promote their experience with PV to the appropriate audience. Because consumers see technology purchases as fundamentally high risk, they look for signs of comfort before buying. A positive reference from an existing PV customer can accelerate the purchase decision provided the relationship between the two customers is correct. For example, innovators can provide references for early adopters, but no one else. Members of the late majority are the only credible reference for other members of the late majority. A successful testimonial program must provide the appropriate reference at the right time.
Begin to promote more of the intangible benefits of PV using communications techniques that are acceptable to the type of customer you are targeting. Each group in the Technology Adoption Lifecycle has strong preferences regarding how they like to receive information. For example, innovators and early adopters hate magazine articles about current users, because they like being “first.” And members of the early and late majority despise technology conferences. So all promotional activities must be in step with the target market.
Keep an eye out for unconventional applications that exploit PV’s limitations. The Principle of Disruptive Innovation shows that historically, the very attributes that make certain technology products uncompetitive in mainstream markets actually count as positive attributes in new or emerging markets. This would indicate that SMUD might discover a group of buyers who view the inherent limitations of PV-- dependence on sunshine, limited generation capacity, generation restricted to certain times of day, requires land or roof coverage, etc--as desirable characteristics that they are willing to pay for.
This may seem counterintuitive but please consider the following. Electric cars offer many desirable attributes to potential buyers—zero pollution, quiet, low operating cost per mile, etc. But their limited range makes them unattractive in direct comparison to gasoline-powered cars. Until battery technology progresses to allow greater range, electric cars could be marketed to people who WANT limited range, such as the parents of teenage drivers. Odd as it sounds, the limitation of range is what makes an electric vehicle most attractive to certain buyers. Unfortunately automakers don’t understand the Principle of Disruptive Innovation and are missing the opportunity to help accelerate the adoption of electric vehicles in the marketplace. Instead they sell EVs through their existing dealer channel in direct competition with gasoline-powered cars, where electric cars are seen as inadequate.
The Principle of Disruptive Innovation has some interesting implications for PV. Buyers probably exist who are willing to purchase solar power specifically to get the attributes that are considered to be weaknesses by mainstream consumers. In fact, participants in SMUD’s PV Pioneer Program have indicated in interviews that they
45
value panel shade and roof protection above all else--attributes that are seen as unfavorable by mainstream purchasers of electric power.
Determine what makes the product “complete” in the eyes of the target customer. Although innovators and early adopters easily tolerate missing pieces, the conservative buyers that make up the early and late majority will not accept an incomplete product. Frequently, the product is not seen as complete unless it contains several intangible attributes. Discovering what those intangibles are, and how to incorporate them, takes a great deal of time and attention focused on the target buyer.
Continue to build a customer-oriented channel of distribution so that customers are comfortable making the purchase. Please note that SMUD is doing an excellent job of this already and continued strength in this area will be SMUD’s greatest long-term competitive advantage should they ever face free market conditions. When PV becomes a mainstream product, conservative customers will feel most comfortable buying a system from their local utility.
3.9 Summary
Like all business or market development initiatives, the success of SMUD’s PV Pioneer Program in a free market environment will depend on how well the organization tailors its offering to deliver perceived value to a changing base of prospective users over time.
When applied to SMUD, there is substantial value in the Technology Adoption Life Cycle as a marketing model. By isolating the psychographics of customers based on when they tend to enter the market, it gives clear guidance on how to develop a marketing program for an innovative product, such as PV.
If SMUD were to follow the relevant guidelines offered by the Technology Adoption Lifecycle and the Principle of Disruptive Innovation, several fundamental practices would emerge:
1. SMUD would focus on serving specific groups of customers in sequence, one group at a time. This is often called target marketing.
2. A new emphasis would be placed on discovering the psychographic and value profiles of potential customers.
3. SMUD would continue to build the organization needed to install and service PV systems for customers. As a utility SMUD lowers risk for conservative customers and therefore accelerates market transformation.
4. SMUD would tailor their promotional activities to fit the preferences of their target market.
46
47
Appendix Psychographic Profiles of Each Buyer Type in the Adoption process
Innovators Innovators pursue new technology products aggressively. They sometimes seek them out even before a formal marketing program has been launched. This is because technology is a central interest in their life, regardless of what function it is performing. At root they are intrigued with any fundamental advance and often make a technology purchase simply for the pleasure of exploring the new device’s properties. There are not very many innovators in any given market segment, but winning them over at the outset of a marketing campaign is key nonetheless, because their endorsement reassures the other players in the marketplace that the product does in fact work.
Early Adopters Early Adopters, like innovators, buy into new product concepts very early in their life cycle, but unlike innovators, they are not technologists. Rather they are people who find it easy to imagine, understand and appreciate the benefits of a new technology, and to relate these potential benefits to their other concerns. Whenever they find a strong match, early adopters are willing to base their buying decisions upon it. Because early adopters do not rely on well-established references in making these buying decisions, preferring instead to rely on their own intuition and vision, they are key to opening up any high-tech market segment.
Early Majority The early majority shares some of the early adopter’s ability to relate to technology, but ultimately they are driven by a strong sense of practicality. They know that many of these newfangled inventions end up as passing fads, so they are content to wait and see how other people are making out before they buy in themselves. They want to see well-established references before investing substantially. Because there are so many people in this segment—roughly one-third of the whole adoption life cycle—winning their business is key to any substantial profits and growth.
Late Majority The late majority share all the concerns of the early majority, plus one major additional one: Whereas people in the early majority are comfortable with their ability to handle a technology product, should they finally decide to purchase it, members of the late majority are not. As a result, they wait until something has become an established standard, and even they want to see lots of support and tend to buy, therefore, from large, well-established companies. Like the early majority, this group comprises about one-third of the total buying population in any given segment. Courting its favor is highly profitable indeed, for while profit margins decrease as the products mature, so do selling costs, and virtually all the research and development costs have been amortized.
Laggards Finally there are the laggards. These people simply don’t want anything to do with new technology, for any of a variety of reasons, some personal and some economic. The only time they ever buy a technological product is when it is buried so deep inside another product—for example a microprocessor that is designed into the braking system of a new car—that they don’t even know it is there. Laggards are generally regarded as not worth pursuing on any other basis.
48