smud’s compact with the customer - usaid … · smud’s compact with the customer ... provide...
TRANSCRIPT

SMUD’s Compact With the Customer
Alice PerezManager Customer Strategy
Sacramento Municipal Utility District
2
SMUD: An Overview
♦About SMUD♦5th largest electric utility in California♦6th largest municipal utility in U.S., 2nd in
California♦900 square mile service area covering
Sacramento County and a portion of Placer County
♦590,000 customers within a 1.4 million service area population

3
Industry Challenges
Board’s Strategic Objectives
•SB1 •AB 2021•SB 1368•AB 32
Workforce Changes
AMI

4
Meeting the Challenges: General Manager Initiatives
Compact with the Customer
Sustainable Power Supply
Changing Workforce

5
The District’s New Vision
♦ Increase energy efficiency♦Protect the environment♦Reduce global warming♦Lower the cost to serve our region
Empower customers with solutions and options that:
6
“Customer Compact” Teams Formed
♦Energy Efficiency♦Demand Response♦Rate Design♦Advanced Metering Technologies♦Renewable Resources♦Community Engagement♦ Integrated Marketing

7
The Paradigm has shifted
♦The District’s “compact with the customer” concept will give customers choices of how they participate, not whether they participate

Engaging the Customer

9
Community Engagement
Principles• Partner with customers and the
community to achieve customer compact goals
• Open new lines of communication for customer input
• Place a concentrated focus on ethnic, business and community based organizations
• Engage key leaders and organizations to support customer compact goals
• Engage more employees in building relationships in the community
Program Designs• Coordinate a monthly working group
to strategically enhance and integrate community outreach efforts
• Provide guidance and support for achieving the Compact with the Customer
• Utilize tools (i.e. database) to gain efficiencies and synergy with customer engagement
• Engage SMUD employees to take SMUD’s message to the community.
• Engage key groups and leadership to embrace SMUD’s new goals
10
Education Plan
♦Creation of strategic marketing, advertising and media plan designed to update SMUD brand around the new vision
♦Launch of “Green Portal” to raise customer awareness and action
♦Community education through newly formed Community Engagement group

Focusing on the Consumer
12
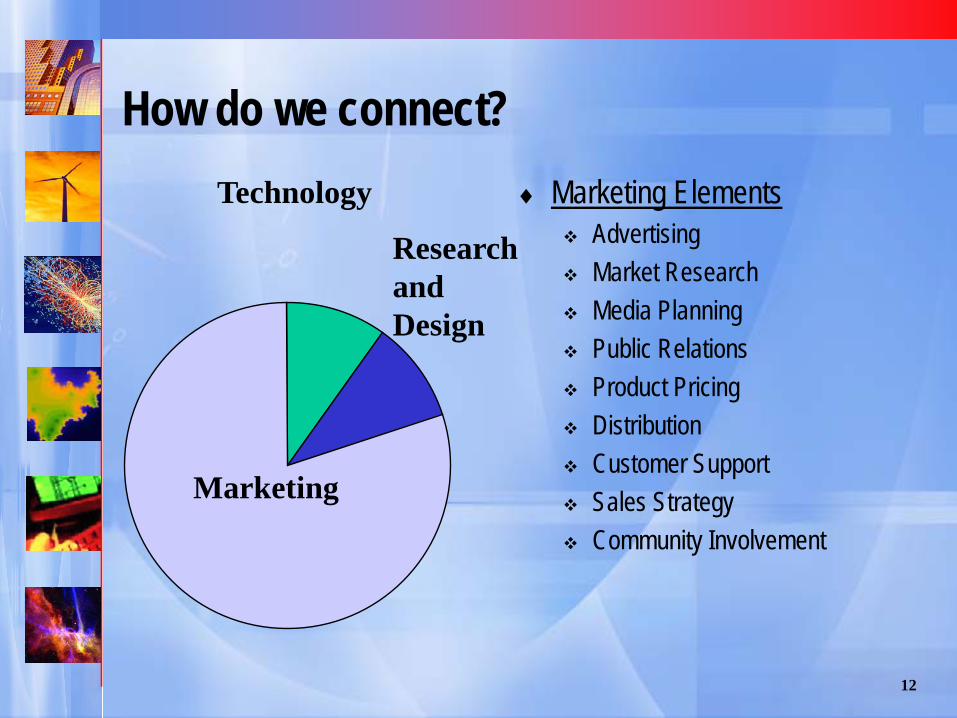
How do we connect?♦ Marketing Elements
Advertising Market Research Media Planning Public Relations Product Pricing Distribution Customer Support Sales Strategy Community Involvement
Marketing
Technology
Research and Design

13
Consumer Research• Segmentation • Targeting• Defining Consumer
Preferences and Needs• Messaging• Media Consumption
Program and Communications Delivery
• Deliver program or campaign
• Track activity - Code BRC’s, create URL’s/tags and phone numbers
Metrics• Collect Data - Automate• Analyze and Develop Reports• Key Metrics – Response
Rates, Cost per Acquisition, Purchase Funnel, Participation Trends
BT InfrastructureData Management
Develop Marketing Plan• Define the value proposition• Create/amend programs to meet
consumers needs• Relevant and persuasive
communications • Select optimal media outlets• Define key metrics
VOICE OF THE CUSTOMER

14
Segmentation Tools
PRIZM
VALS
Young Families21%
Money Minded Strivers20%
Green Echoes21%
Senior Savers9%
Green Boomers7%
Boomers, Buyers, and Browsers6%
Big Toys, Big Spenders4%
Uninvolved Achievers12%
SMUD

15
♦ Business typically comes from a relatively small, core audience SMUD currently does well with approximately 30% of the customer base, but this is not sufficient to reach
our goals (15% reduction over 10 years) The segmentation can help us penetrate our current core and identify opportunities to connect with new
consumers
Residential Segment Size
Young Families21%
Money Minded Strivers20%
Green Echoes21%
Senior Savers9%
Green Boomers7%
Boomers, Buyers, and Browsers
6%
Big Toys, Big Spenders4%
Uninvolved Achievers12%

Creative Research
17
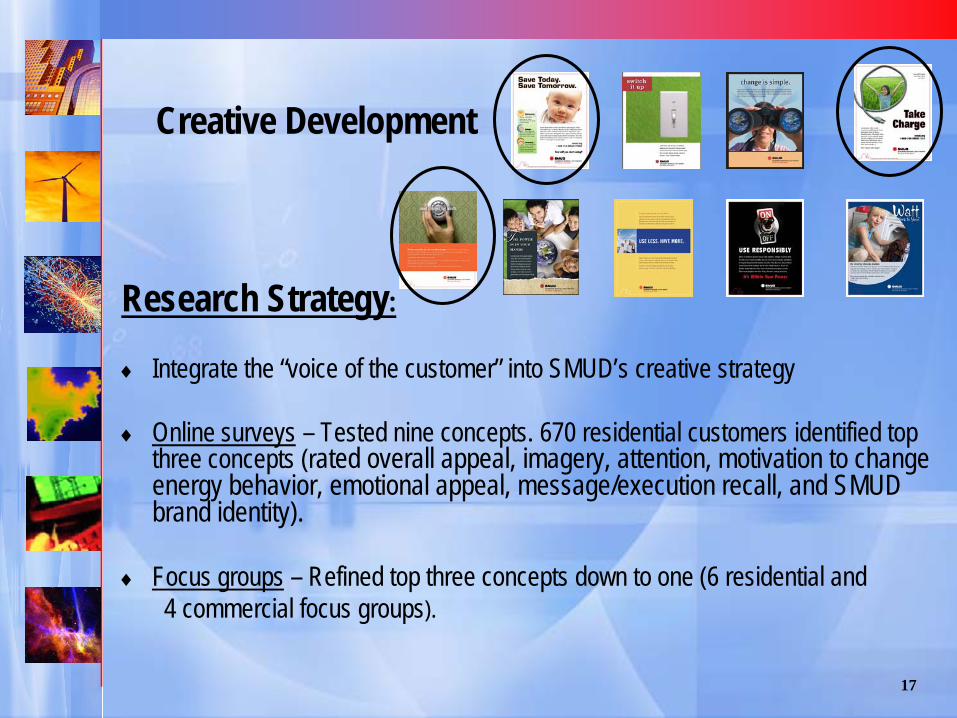
Creative Development
Research Strategy:
♦ Integrate the “voice of the customer” into SMUD’s creative strategy
♦ Online surveys – Tested nine concepts. 670 residential customers identified top three concepts (rated overall appeal, imagery, attention, motivation to change energy behavior, emotional appeal, message/execution recall, and SMUD brand identity).
♦ Focus groups – Refined top three concepts down to one (6 residential and 4 commercial focus groups).

18
Perception TrackerPhone surveys - measure campaign impact:SMUD brand – customer perceptionsProgram awareness, familiarity, consideration,
participation, and satisfaction
Timeline:Baseline – mid-JunePeak Campaign – SeptemberEnergy Efficiency Campaign - December

19
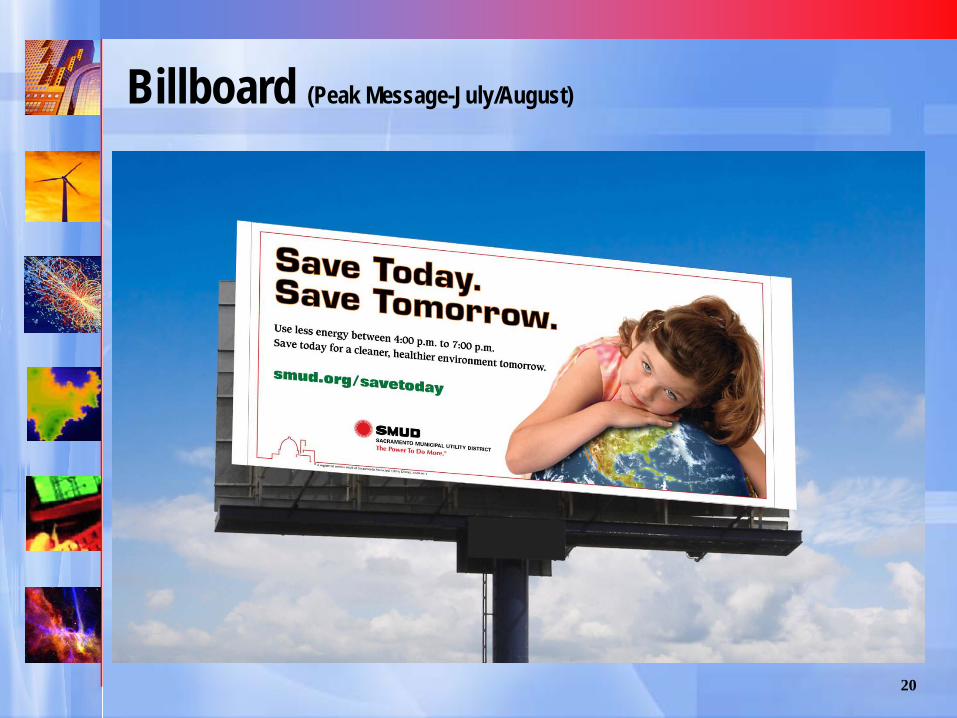
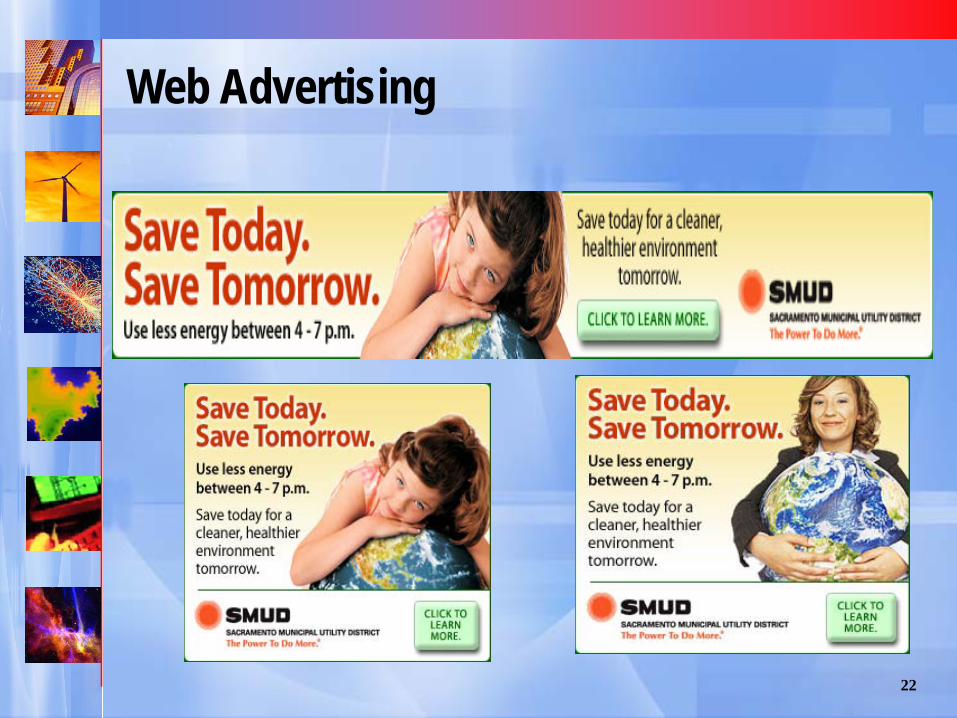
Media Campaign “Save Today, Save Tomorrow”
20
Billboard (Peak Message-July/August)

21
Program Ad Energy Efficiency Rebates–bill insert
22
Web Advertising

23
TV Commercial - Peak Message
This is simple.
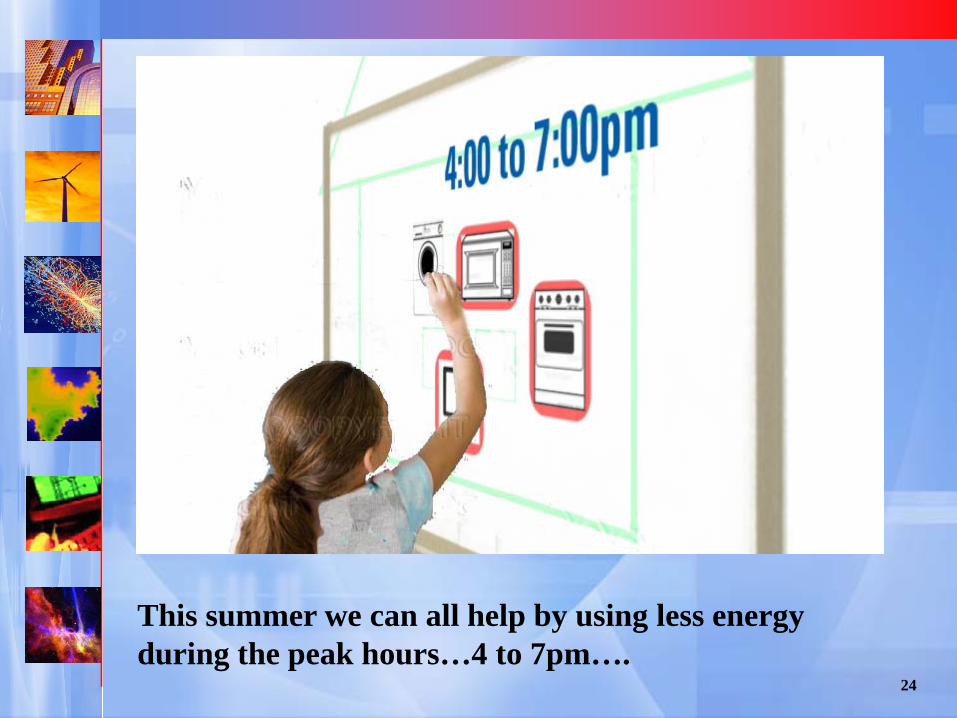
24
This summer we can all help by using less energy during the peak hours…4 to 7pm….

25
…and turning our thermostats to 78 degrees.

Home Energy Report Pilot

27
Pilot OverviewObjectives:
• 2% overall energy savings• Lead generation for other programs• Customer satisfaction• Customer awareness of energy use, knowledge of ways to save• Identify best target segments for potential wider rollout
Design:
Duration 12 months
Target Audience 35,000 select customers
Control Audience 50,000 like customers
Frequency Monthly and quarterly
Report Style Graphic and text weighted
Envelop Type Regular SMUD and larger with test

28
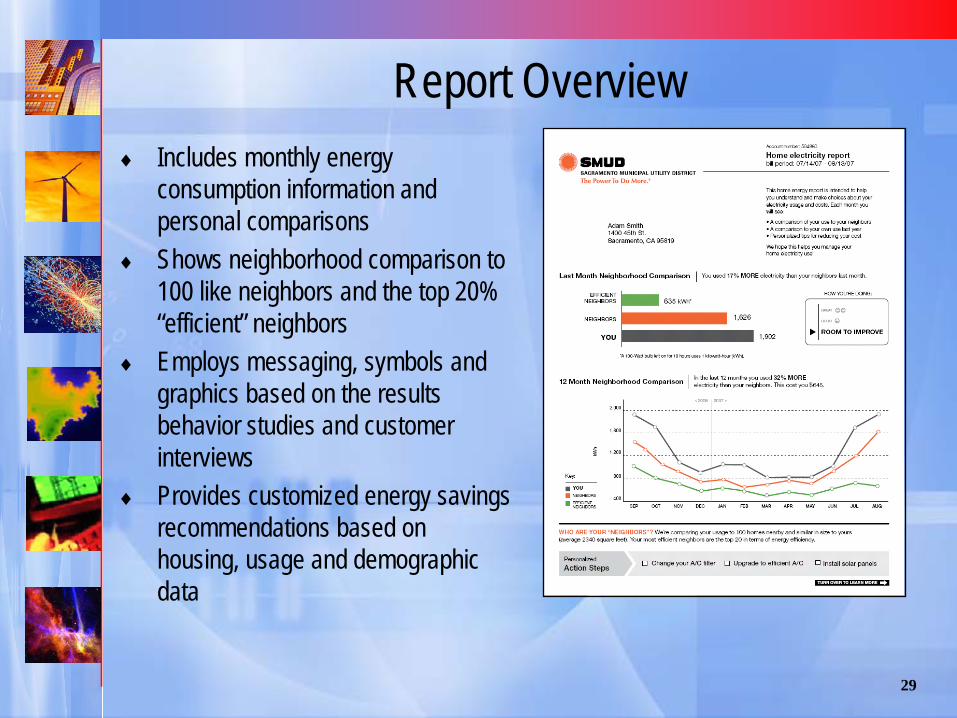
Report Description Each report is customized to the home receiving it Reports include detailed energy consumption information and
personal comparisons Reports also include a neighborhood comparison to 100 like
neighbors and the top 20% efficient neighbors Messaging, symbols and graphics were employed based on the
results of other utility behavior studies Each household is targeted with appropriate recommendations
based on housing, usage and demographic data Homes with pools are encouraged to buy efficient pumps Homes with high summer use are encouraged to change
thermostat settings
29
Report Overview♦ Includes monthly energy
consumption information and personal comparisons
♦ Shows neighborhood comparison to 100 like neighbors and the top 20% “efficient” neighbors
♦ Employs messaging, symbols and graphics based on the results behavior studies and customer interviews
♦ Provides customized energy savings recommendations based on housing, usage and demographic data

30
June Update
Changes to the Report based on customer negative feedback Removing the Frowning Face
from the Narrative Report Changes to Neighbor Description Changes to Introductory
Paragraph Changes to How You’re Doing Including a URL For FAQs
Home Electricity Report Statistics
Customers in Pilot 35,000
Reports Mailed 67,425
Calls Received 386
Calls to Discuss 116
Calls for Capers DVD 110
Calls to Opt Out 104
Calls Forwarded to BISs 48
Calls Forwarded to ESs 8
Call Rate (out of 67K) 0.6%
Emails Received 49
Emails to Opt Out 22
Emails Thank You 14
Emails Info 13
Opt Out Rate (out of 35K) 0.4%

31
Results of SMUD Impact Evaluation (October, 2008)
Percent of kWh savings attributed to Home Energy Reports, May through September, 2008
SMUD’s Positive Energy
Monthly 1.95% 2.58%
Quarterly 0.76% 1.76%
Overall 1.75% 2.35%

3232
Monthly reports were triggered by bills after 3/15/08Quarterly reports were triggered by bills after 4/1/08
-0.2%
1.4%
2.1%
2.6%
-1.0%
0.0%
1.0%
2.0%
3.0%
4.0%
April May June July (to date)
Monthly report impact by month
0.6%
1.7% 1.8%
-1.0%
0.0%
1.0%
2.0%
3.0%
4.0%
April May June July (to date)
Quarterly report impact by month
Internal savings estimates are lower
The purpose of this slide is to show that savings increased over time, for the first few months

33Monthly reports only; excludes 1st post-report bill for all households
2.3% 2.3%
1.4%
3.7%
-2.0%
-1.0%
0.0%
1.0%
2.0%
3.0%
4.0%
5.0%
6.0%
7.0%
< 40 40-49 50-59 60+
Impact by age of resident
3.5%
2.0% 1.7%
-2.0%
-1.0%
0.0%
1.0%
2.0%
3.0%
4.0%
5.0%
6.0%
7.0%
0-75k 75-100k 100k+
Impact by household income
Internal savings estimates are lower
Low income customers may be a future target since energy savings also save the District in EAPR rate subsidy dollars

34
The average savings for all participants during the months of May – Sept. are 1.75% or 16.83 kWhs/month/participant.
The average savings for participants who received monthly reports during May – Sept. are 1.95% or 22.26 kWhs/month/participant.
The average savings for participants who received quarterly reports during May – Sept. are 0.76% or 3.9 kWhs/month/participant (this number needs validation).
The average total kWh savings for all participants during the months of May through Sept. 2008 calculated at the 1.75% savings rate is approximately 3GWhs.
Energy savings cannot be extrapolated through the rest of the year because winter and shoulder months may have different savings rates due to seasonal energy usage.
Savings Estimates

35
Conclusions It will be important to determine where the savings are coming from—
behavior changes or the implementation of measures from other SMUD programs—so that we don’t count savings twice. We will conduct a survey and a program participation analysis in April
2009 to help determine this. It is unclear how long savings from behavior will persist.
Continued measurement can help us plan. The savings are significant, almost 2% for a randomly selected population.
Targeting will likely increase that number. At 2%, the cost is around 4 cents per kWh which puts it at the average EE
portfolio cost/kWh, despite sending the reports to randomly-selected customers rather than to the ideal targets.
There are some customer types that don’t like being compared. We will analyze this group to determine who they are (and if they actually saved despite their criticisms).

Leveraging Stumulas Funding

37
Objectives of the Sacramento Regional Energy Alliance (Federal Stimulus Proposal)
♦ Ensure all agencies’ efforts are aligned, complementary and supportive
♦ Leverage existing efforts and delivery infrastructure♦ Maximize energy savings throughout the region♦ Create sustainable jobs and business models with a
promotional ladder to higher-paid jobs and higher-profit businesses
♦ Set the Sacramento regional economy on a path capable of meeting AB32 goals (and to profit in a carbon-constrained future)
♦ Provide opportunities for all customers and businesses to participate (and make it easy)
38
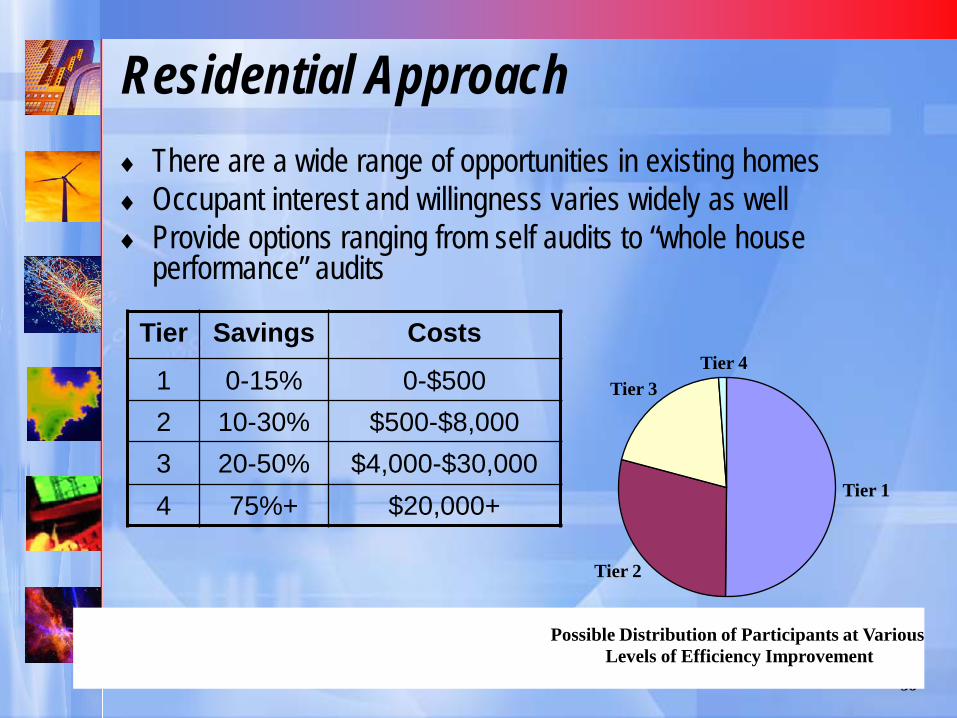
Residential Approach♦ There are a wide range of opportunities in existing homes♦ Occupant interest and willingness varies widely as well♦ Provide options ranging from self audits to “whole house
performance” audits
Tier Savings Costs
1 0-15% 0-$5002 10-30% $500-$8,0003 20-50% $4,000-$30,0004 75%+ $20,000+
Possible Distribution of Participants at Various Levels of Efficiency Improvement
Tier 1
Tier 2
Tier 3Tier 4
39
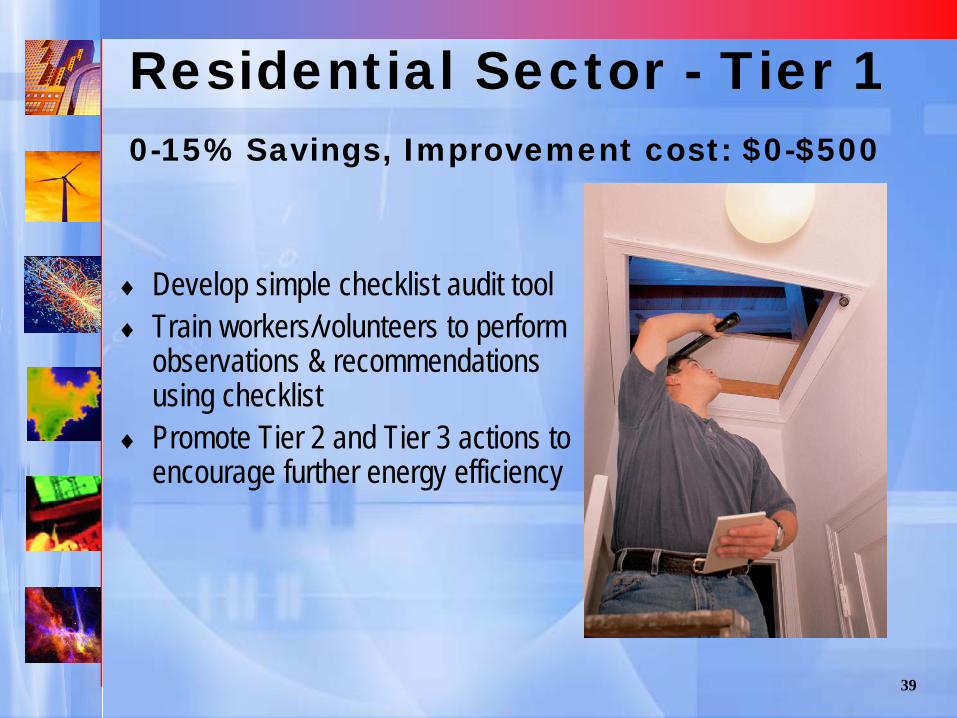
Residential Sector - Tier 10-15% Savings, Improvement cost: $0-$500
♦ Develop simple checklist audit tool ♦ Train workers/volunteers to perform
observations & recommendations using checklist
♦ Promote Tier 2 and Tier 3 actions to encourage further energy efficiency

40
Residential Sector – Tier 210-30% savings Improvement cost: $500-$8,000♦ Home energy rating by trained HERS II rater/auditor
Guarantee that evaluation will identify worthwhile improvements Incentives for implementing comprehensive improvements Ultimately, incorporate HERS II rating scores into regional MLS listings
♦ Develop neighborhood/subdivision prescriptive contractor program
41
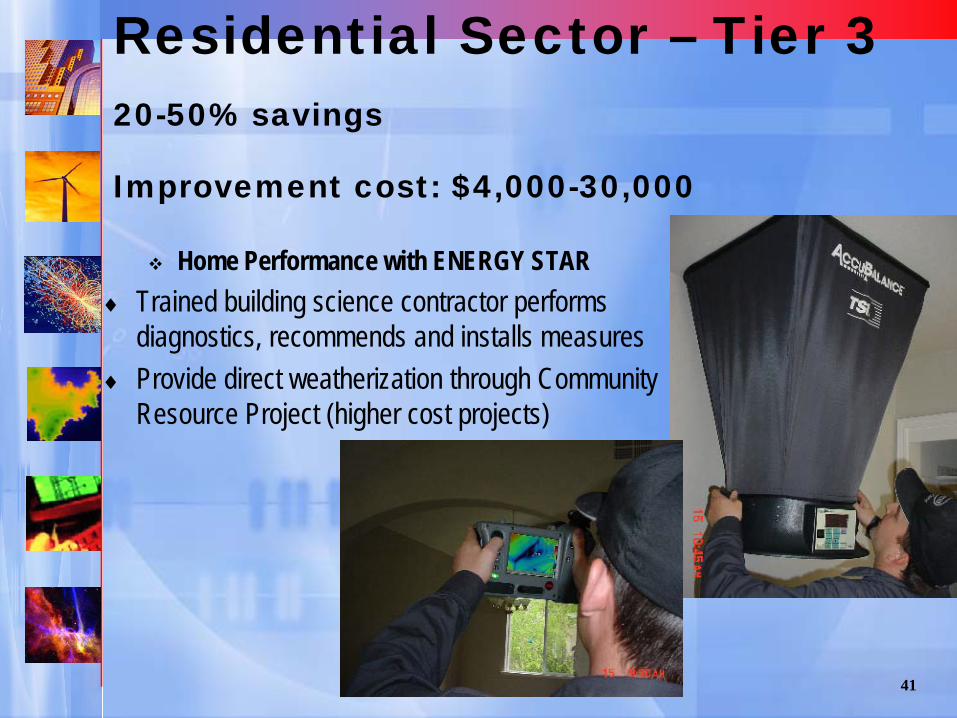
Residential Sector – Tier 320-50% savings
Improvement cost: $4,000-30,000
Home Performance with ENERGY STAR♦ Trained building science contractor performs
diagnostics, recommends and installs measures♦ Provide direct weatherization through Community
Resource Project (higher cost projects)
42
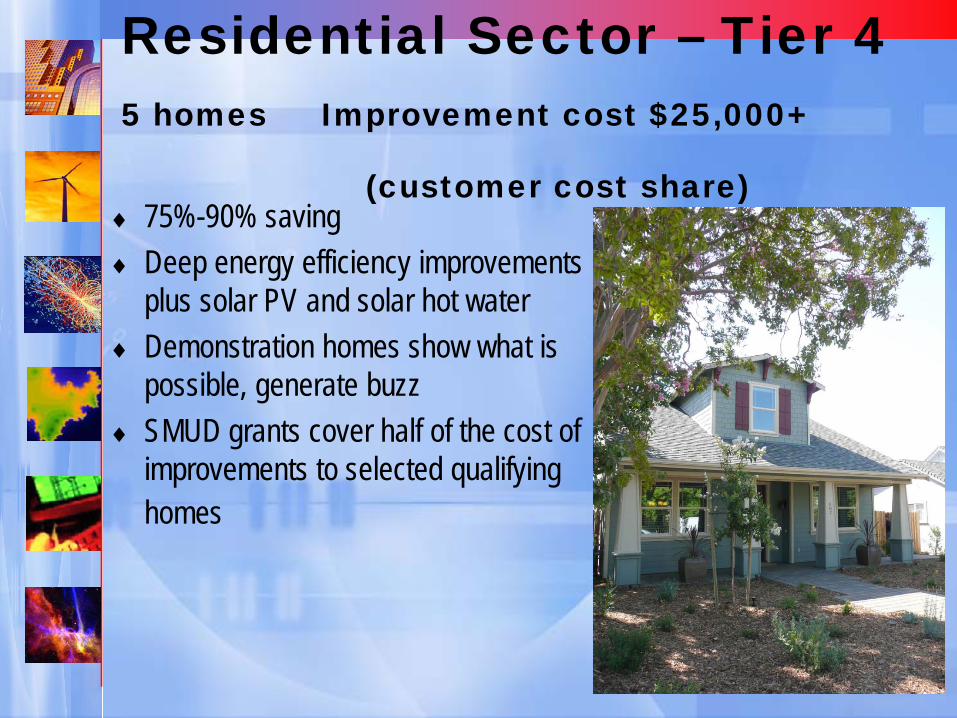
Residential Sector – Tier 45 homes Improvement cost $25,000+
(customer cost share)♦ 75%-90% saving♦ Deep energy efficiency improvements
plus solar PV and solar hot water♦ Demonstration homes show what is
possible, generate buzz♦ SMUD grants cover half of the cost of
improvements to selected qualifying homes
43
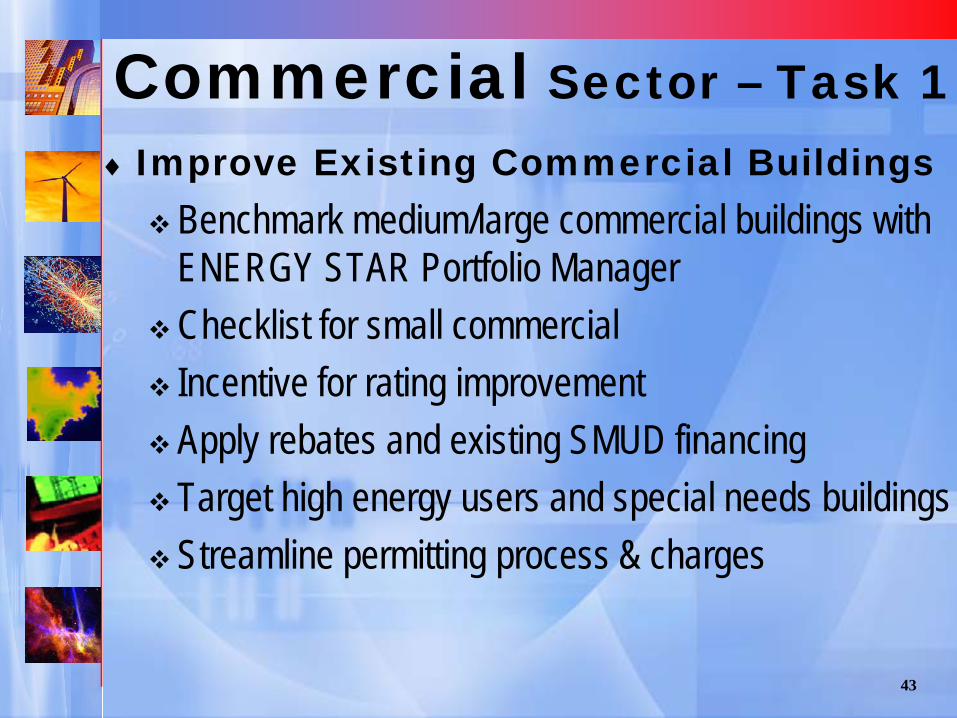
Commercial Sector – Task 1♦ Improve Existing Commercial Buildings Benchmark medium/large commercial buildings with
ENERGY STAR Portfolio Manager Checklist for small commercial Incentive for rating improvement Apply rebates and existing SMUD financing Target high energy users and special needs buildingsStreamline permitting process & charges
44
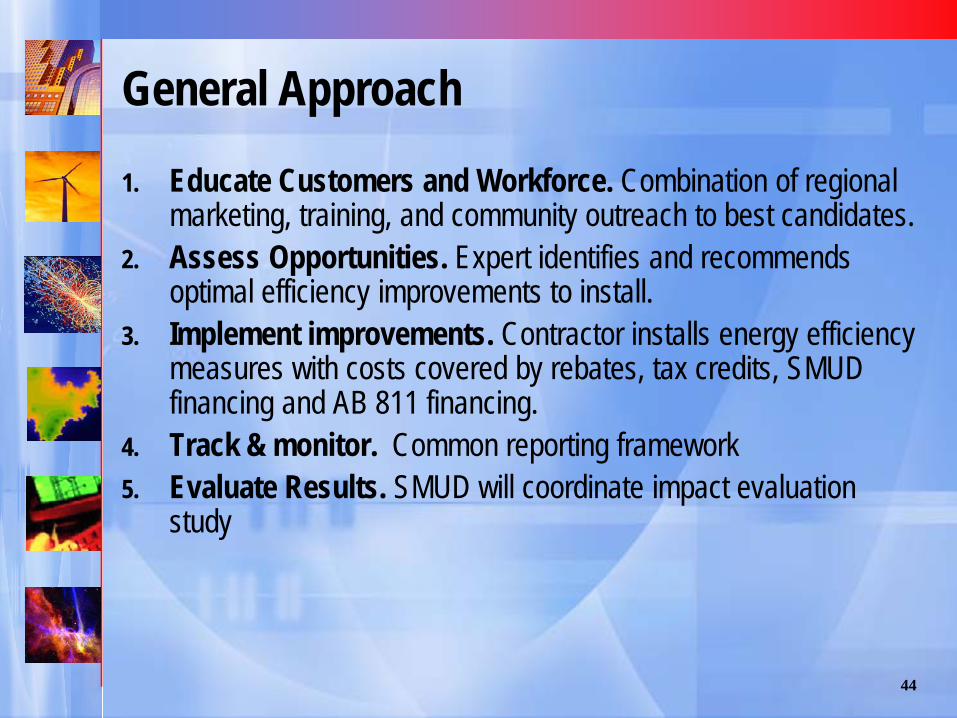
General Approach
1. Educate Customers and Workforce. Combination of regional marketing, training, and community outreach to best candidates.
2. Assess Opportunities. Expert identifies and recommends optimal efficiency improvements to install.
3. Implement improvements. Contractor installs energy efficiency measures with costs covered by rebates, tax credits, SMUD financing and AB 811 financing.
4. Track & monitor. Common reporting framework5. Evaluate Results. SMUD will coordinate impact evaluation
study
