smithville independent school district - legislative budget board
TRANSCRIPT
Smithville Independent School District
With 1,807 students, Smithville ISD is one of the smaller school districts studied by my Texas School Performance Review (TSPR) team. When TSPR began its performance review, we found a district with some notable successes. Yet, as with any good district Smithville is also facing several challenges including fluctuating student performance, a transportation system with skyrocketing costs and old facilities badly in need of replacement and/or major renovation.
Not only has the student performance fluctuated on the Texas Assessment of Academic Skills (TAAS), but the exemption rates for minority students are outrageously high–31 percent of African American students and 22 percent of Hispanic students were not tested. My top recommendation is for the district to study the results of the TAAS tests to identify problem areas and to develop strategies to close the gap in student performance between those who are economically disadvantaged and those who are not, and to reduce the exemption rates of its minority students. Smithville ISD needs to raise the bar on student performance.
One of my 10 Principles for Texas in the 21st Century is to drive more of every education dollar directly into the classroom. And my Texas School Performance Review (TSPR) team has done just that for Smithville ISD with 34 recommendations that, if fully implemented, could result in net savings of $339,072 over the next five years.
Transportation stands out as one of the most rapidly growing expenses in the district. TSPR found that the number of miles driven have increased by 27 percent from the 1994-95 school year to the 1998-99 school year. During that same time, operating costs have increased by 203 percent! I strongly recommend that the district look into ways to cut costs or increase revenues including
contracting with a neighboring school district or a commercial vendor for its transportation services.
Finally, I am recommending that the district refine its long-range facilities master plan. The district currently has a long-range plan and a facilities survey, but neither plan includes financing alternatives and a schedule for completion, both of which are crucial for a successful plan.
These major recommendations would help redirect administrative costs and dedicate dollars to improving the education of our children–our most precious resource. I am confident that school board members, school administrators, teachers and parents are all committed to making Smithville ISD the best it can be for their students.
Carole Keeton Rylander Comptroller of Public Accounts
Key Findings and Recommendations
During its five-month review, the Texas School Performance Review (TSPR) examined Smithville ISD operations and interviewed employees, school board members, teachers, students, parents, and community and business leaders. Following are the major proposals TSPR developed to help the district address various issues.
Major Proposals
Transportation
• Explore ways to reduce the cost of transportation–District bus drivers drove students 27 percent more miles in the 1998-99 school year, compared to the 1994-95 school year. Yet, operating costs increased at 203 percent during that same time. The district’s transportation function is clearly not operating efficiently. The district should conduct a study to determine strategies to improve efficiency, including possibly contracting with another district or vendor to perform this function.
Facilities
• Finalize the existing facilities plan with a schedule for completion and financing alternatives–The superintendent developed a board-approved long-range facilities plan in February 2000, and the director of Maintenance and Transportation completed a thorough review of each district facility and prepared a facility survey report in May 2000. However, neither assessment addresses Smithville ISD facility needs in an integrated manner. Crucial factors such as financing alternatives and program management are not addressed, even though both have been particular problems for the district. The district’s plan establishes a priority for each project, but it does not identify a timeframe with which the work will be completed. The district must refine the facilities plan by including a community review of the
plan, a schedule for completion and financing alternatives.
• Develop a process for facilities maintenance that ties prioritized items to the budget–In 1999-2000, the director of Maintenance and Transportation conducted a detailed needs assessment for maintenance at each existing Smithville ISD facility. The director prioritized the needs at each facility in a report to the superintendent. While this is a good starting point for determining Maintenance Department priorities for the year, the district must develop an ongoing process that ties budget dollars to identified and prioritized maintenance needs.
Student Performance
• Use Texas Assessment of Academic Skills (TAAS) data to identify student needs and improve performance–Progress in the performance of minority and economically disadvantaged students in Smithville ISD has fluctuated since 1995-96, especially from 1998-99, when the percentage of African American students passing the writing test declined by 1.4 percentage points. Additionally, Hispanic students passing the reading and math tests declined by 3.2 and 9.1 percentage points, respectively during that time; and economically disadvantaged students passing the reading test declined by 2.7 percentage points. The district has had difficulty closing the performance gap between Anglo, minority and economically disadvantaged students. To address this problem, the district should use TAAS data to identify student and teacher needs and to improve student performance.
• Reduce the number of TAAS exemption–The district’s TAAS exemption rates are as troubling as its fluctuating minority student performance. In 1998-99, 31.1 percent of African American students and 22 percent of Hispanic students were not tested. Smithville ISD is working with the individual campuses on a student-by-student basis to identify specific students who should not be exempted. While this is a good start, it is imperative that the district focus on reducing TAAS exemptions for minority
students. Assessing each student’s strengths and weaknesses is the first critical step necessary for creating programs to help these children succeed.
Food Service
• Recover the full cost of events catered by the district’ and expand the program–The Food Services Department is not recovering the full costs for catering events. The district charges all events at the cost for food and supplies, but labor is not always calculated into the cost. Last year, the department was able to recover approximately $4,500 in food and supply costs for catering activities, but labor of approximately $1,500 was paid out of the department’s budget. The district should establish a policy to recover the full cost of catering events, including the cost of labor, supplies and food, and consider expanding the catering activities to give Career and Technology students an opportunity to learn in the process.
• Relocate trash dumpsters at the main kitchen–The location of the dumpsters at the main kitchen is inappropriate and is not in compliance with the Texas Department of Health’s requirements regarding location, proximity to the kitchen and cleanliness of the dumpster area. The district should relocate the dumpsters according to health code guidelines, and eliminate unnecessary employee time in transporting and handling of garbage.
Technology
• Document the computer network infrastructure–Smithville ISD does not have its network infrastructure documented. While the superintendent and the network administrator understand the system and are capable of analyzing and correcting problems, written documentation is essential so others maintaining the infrastructure in the future will understand the workings of the network.
Exemplary Programs and Practices in the
Smithville Independent School District
TSPR identified numerous best practices in the Smithville ISD. Through commendations in each chapter, the report highlights model programs, operations and services provided by Smithville ISD administrators, teachers and staff. Below are some of the highlights from the report. Other school districts throughout Texas are encouraged to examine these exemplary programs and services to see if they could be adapted to meet local needs.
• Job training–Smithville ISD students who will not be attending college have several job training course options in areas where local job opportunities abound. For example,
1. Tech Prep is a program that leads students toward associate or baccalaureate degree programs and helps students prepare for high skill, high wage jobs in at least one field of engineering technology, applied science health or business through a planned, sequential program of study.
2. The Capital Area Tech Prep Consortium allows Smithville ISD students to take courses at one of three junior colleges–Weatherford Junior College in Agriculture; Austin Community College in Business and Blinn College–in Home Economics/Child Care, Business and Technology. Students take a sequence of courses while in high school that will earn them Credit-in-Escrow at colleges with which the high school has partnerships.
• Food Services Quality Assurance Review–The district implemented a Food Services Quality Assurance Review during the 1999-2000 school year that improve services. The members of the team include parents and other community
representatives. A checklist and report have been developed to assist with the review and provide measurable results. The summary report contains sections for food quality, service, facilities and schedule, general evaluation and a follow up, and quality team meeting comments and recommendations. Each response is rated on a scale of one to five, poor to outstanding. The reviews are unannounced and the results are shared with the Food Service Department for corrective action.
• Teacher hiring practices–Region 13 Personnel Services Cooperative expands the availability of teacher applicants for Smithville ISD. The cooperative has 24 member school districts, and assists school districts with recruiting, selecting and hiring teachers. Smithville ISD pays a one-time membership fee and an annual maintenance fee, both of which are based on average daily attendance. The district receives the advantages of reduced paper due to an almost entirely electronic application and distribution process; decreased staff time associated with recruitment and applicant processing; an increased number of applicants; and availability of information to districts seven days per week, 24 hours per day. This cooperative helps Smithville ISD fill its 15-20 teacher vacancies each year.
• Monthly budget analysis reports–Smithville ISD prepares informative budget analysis reports every month for the board and the public. Budget reports are part of the monthly board meeting packets, which include variances from the amounts budgeted. Business office personnel routinely answer detailed questions concerning the budget at the monthly board meeting. The monthly board report also includes the district’s ongoing budgeted and actual financial results. The report includes the budgeted amount, actual financial result and variances from the budget at a selected level of detail.
• Budgetary planning process–District officials are developing a sound planning process that ties budget allocations to the district and to campus improvement strategies that are designed to increase student performance. Prior to 1996, site-
based decision-making was not seriously addressed. When school started in fall 1999, the director of Curriculum and Technology provided training to every campus site-based committee in the roles and responsibilities of the district and campus site-based committees. The purpose of this effort was to clearly define the roles and responsibilities of the superintendent, central office staff, principals, teachers, district-level committee members and campus-level committee members in the areas of planning, budgeting, staffing patterns, staff development and school organization.
• Maintenance–The district Maintenance Department is responsive to the needs of the schools and provides quality services. They use a manual work order system with three levels of priority: emergency, priority and routine. The principal determines the priority, and the director of maintenance usually agrees with the principal’s determination.
What Is TSPR?
The Texas School Performance Review (TSPR), a program of the Texas Comptroller's office, is the nation's first state-level vehicle designed to improve the management and finances of public school districts.
Since its creation in 1991, TSPR has conducted in-depth, on-site management reviews of 37 Texas school districts serving 1 million students, or 26 percent of the state’s 3.9 million public school students. More than $469 million in five-year net savings have been identified in the previous 37 reviews conducted to date.
These reviews diagnose districts’ administrative, organizational, and financial problems and recommend ways to cut costs, increase revenues, reduce overhead, streamline operations, and improve the delivery of educational services. TSPR’s overall goal is to ensure that every possible education dollar is directed to the classroom.
A TSPR review is more than a traditional financial audit. Instead, TSPR examines the entire scope of district operations, including organization and management, educational service delivery, personnel management, community involvement, facilities use and management, financial management, asset and risk management, purchasing and warehousing functions, computers and technology, food services, transportation, and safety and security.
Reviews can be requested or districts can be selected for a review. A cross-section of Texas school districts–large and small, wealthy and poor, urban and rural–are selected so that a wide variety of other districts can apply TSPR’s recommendations to their own circumstances. Priority is given to districts with a poor academic performance and/or a poor financial performance, and where the greatest number of students will benefit from an audit.
Nearly 90 percent of all recommendations are being voluntarily implemented to date in the 30 districts that
have had more than one year to implement TSPR recommendations.
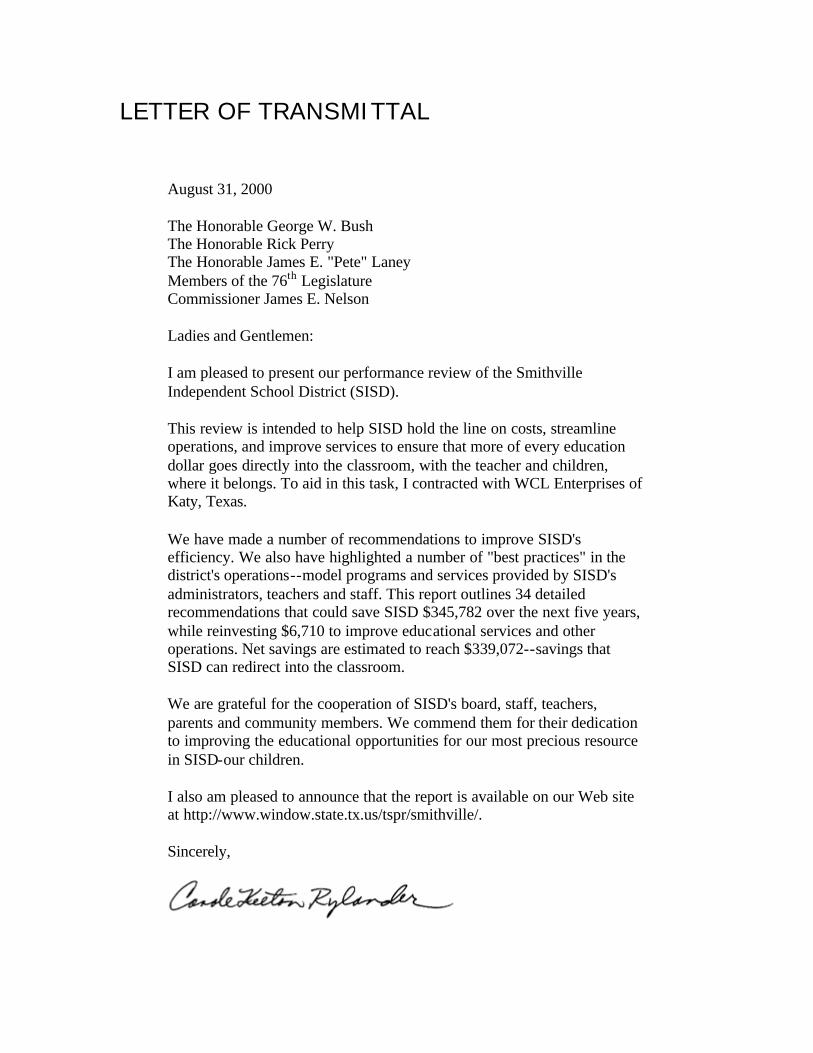
LETTER OF TRANSMITTAL
August 31, 2000 The Honorable George W. Bush The Honorable Rick Perry The Honorable James E. "Pete" Laney Members of the 76th Legislature Commissioner James E. Nelson
Ladies and Gentlemen:
I am pleased to present our performance review of the Smithville Independent School District (SISD).
This review is intended to help SISD hold the line on costs, streamline operations, and improve services to ensure that more of every education dollar goes directly into the classroom, with the teacher and children, where it belongs. To aid in this task, I contracted with WCL Enterprises of Katy, Texas.
We have made a number of recommendations to improve SISD's efficiency. We also have highlighted a number of "best practices" in the district's operations--model programs and services provided by SISD's administrators, teachers and staff. This report outlines 34 detailed recommendations that could save SISD $345,782 over the next five years, while reinvesting $6,710 to improve educational services and other operations. Net savings are estimated to reach $339,072--savings that SISD can redirect into the classroom.
We are grateful for the cooperation of SISD's board, staff, teachers, parents and community members. We commend them for their dedication to improving the educational opportunities for our most precious resource in SISD-our children.
I also am pleased to announce that the report is available on our Web site at http://www.window.state.tx.us/tspr/smithville/.
Sincerely,
Executive Summary
In March 2000, the Comptroller's office began a performance review of the Smithville Independent School District (SISD) as part of a countywide project to review the four districts in Bastrop County-Smithville, Bastrop, Elgin and McDade. This review signaled the first time since the initial pilot study in 1991 that the Comptroller has conducted a simultaneous review of all of the districts in a single county.
After nearly five months of work, this report identifies SISD's exemplary programs and suggests concrete ways to improve district operations. If fully implemented, the Comptroller's 34 recommendations could result in net savings of $339,072 over the next five years.
Improving the Texas School Performance Review
Soon after taking office in January 1999, Texas Comptroller Carole Keeton Rylander consulted school district officials, parents and teachers from across Texas and carefully examined past reviews and progress reports to make the Texas School Performance Review (TSPR) more valuable to the state's school districts. With the perspective of having served as a former teacher and school board president, the Comptroller has vowed to use TSPR to increase local school districts' accountability to the communities they serve.
Recognizing that only 52 cents of every education dollar is spent on instruction, Comptroller Rylander's approach is designed to give local school officials in Smithville and in other Texas communities the ability to move more of every education dollar directly into the classroom. Comptroller Rylander also has ordered TSPR staff to share best practices and exemplary programs quickly and systematically with all the state's school districts and with anyone else who requests such information. Comptroller Rylander has directed TSPR to serve as a clearinghouse of the best ideas in Texas public education.
Under Comptroller Rylander's approach, consultants and the TSPR team will work with districts to:
• Ensure students and teachers receive the support and resources necessary to succeed;
• Identify innovative ways to address the district's core management challenges;
• Ensure administrative duties are performed efficiently, without duplication, and in a way that fosters education;
• Develop strategies to ensure the district's processes and programs are continuously assessed and improved;
• Challenge any process, procedure, program or policy that impedes instruction and recommend ways to reduce or eliminate obstacles; and
• Put goods and services to the "Yellow Pages Test": government should do no job if a business in the Yellow Pages can do that job better and at a lower cost.
Finally, Comptroller Rylander has opened her door to Texans who share her optimism about the potential for public education. Suggestions to improve Texas schools or the school reviews are welcome at any time. The Comptroller believes public schools deserve all the attention and assistance they can get.
For more information, contact TSPR by calling toll-free 1-800-531-5441, extension 5-3676, or see the Comptroller's Website at www.window.state.tx.us.
TSPR in Smithville ISD
In March 2000, when TSPR began its performance review of the Smithville ISD, we found a district facing several challenges including old facilities badly in need of replacement and/or major renovation and fluctuating student performance. The board and superintendent had developed a multi-phase facility plan, but there still is division in the community about the nature of needed facilities and where those facilities should be located.
We also found a district where the superintendent is involving staff, parents and the community in a variety of ways, such as evaluating the food served in the schools to make sure that key performance issues are addressed. Campus and central management changes have been made with the intent of increasing the overall quality of staff leadership, and leadership and team-building training is provided to all managers.
As this report is released, the district has an opportunity to successfully face its challenges, and maintain and enhance its current successes. Campus and central staff leadership will be important to moving the district to a higher level of student and district performance. This report contains a series of recommendations and implementation steps to help the district to achieve its objectives.
The Comptroller's office selected WCL Enterprises, a consulting firm based in Katy, Texas, to assist the agency with this review. The TSPR team interviewed district employees, school board members, parents,
business leaders and community members and held a community meeting in SISD's Intermediate School. To obtain additional comments, the review team conducted focus group sessions with parents, teachers, principals, business leaders and representatives from community organizations. The Comptroller also received letters from a wide array of parents, teachers and community members, and staff received calls to the Comptroller's toll-free hotline.
Fifty-five campus and 11 central administrators and support staff; 10 principals, assistant principals and professional support staff; 73 teachers; 110 parents and 138 students completed written surveys as part of the review. Details from the surveys and public forums appear in Appendices A through G.
The review team also consulted two databases of comparative educational information maintained by the Texas Education Agency (TEA)-the Academic Excellence Indicator System (AEIS) and the Public Education Information Management System (PEIMS).
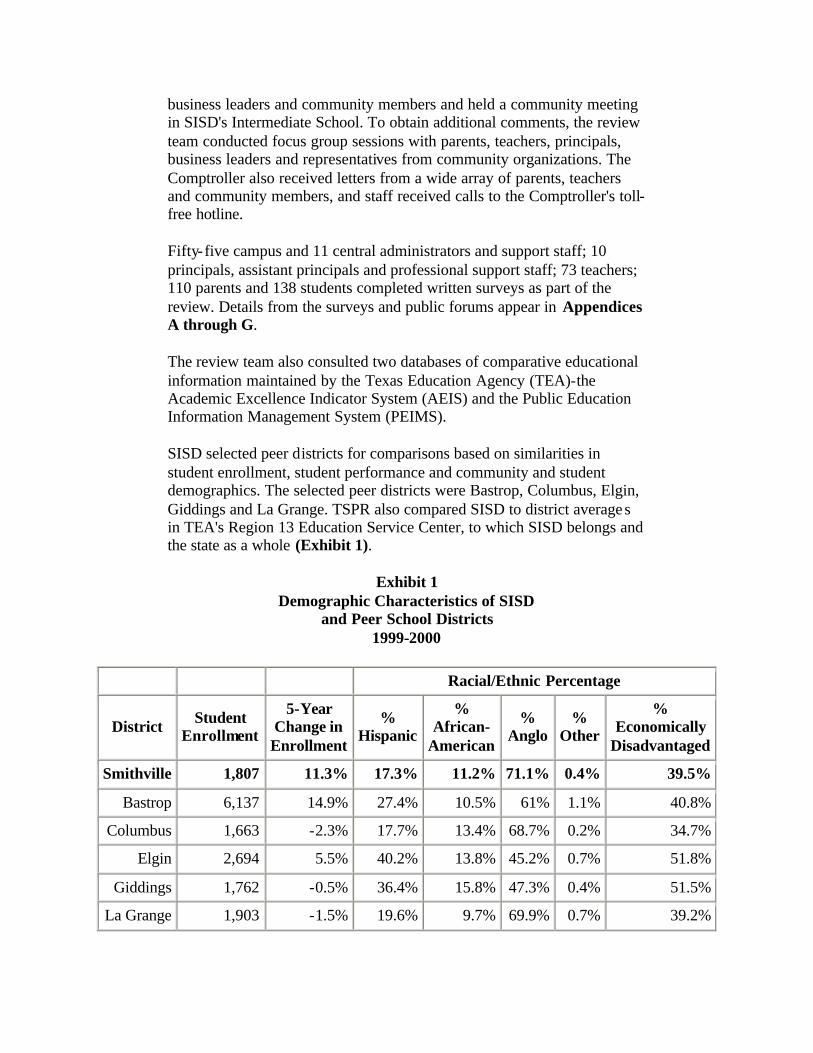
SISD selected peer districts for comparisons based on similarities in student enrollment, student performance and community and student demographics. The selected peer districts were Bastrop, Columbus, Elgin, Giddings and La Grange. TSPR also compared SISD to district averages in TEA's Region 13 Education Service Center, to which SISD belongs and the state as a whole (Exhibit 1).
Exhibit 1 Demographic Characteristics of SISD
and Peer School Districts 1999-2000
Racial/Ethnic Percentage
District Student Enrollment
5-Year Change in Enrollment
% Hispanic
% African-
American
% Anglo
% Other
% Economically
Disadvantaged
Smithville 1,807 11.3% 17.3% 11.2% 71.1% 0.4% 39.5%
Bastrop 6,137 14.9% 27.4% 10.5% 61% 1.1% 40.8%
Columbus 1,663 -2.3% 17.7% 13.4% 68.7% 0.2% 34.7%
Elgin 2,694 5.5% 40.2% 13.8% 45.2% 0.7% 51.8%
Giddings 1,762 -0.5% 36.4% 15.8% 47.3% 0.4% 51.5%
La Grange 1,903 -1.5% 19.6% 9.7% 69.9% 0.7% 39.2%
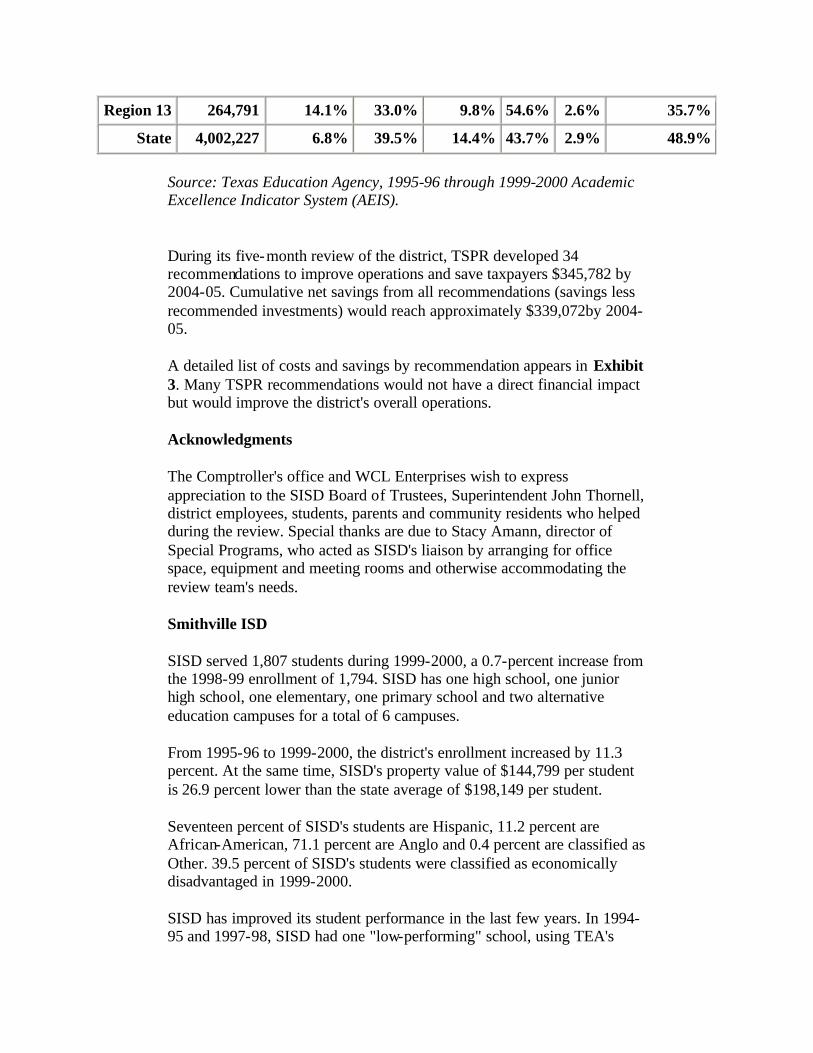
Region 13 264,791 14.1% 33.0% 9.8% 54.6% 2.6% 35.7%
State 4,002,227 6.8% 39.5% 14.4% 43.7% 2.9% 48.9%
Source: Texas Education Agency, 1995-96 through 1999-2000 Academic Excellence Indicator System (AEIS).
During its five-month review of the district, TSPR developed 34 recommendations to improve operations and save taxpayers $345,782 by 2004-05. Cumulative net savings from all recommendations (savings less recommended investments) would reach approximately $339,072by 2004-05.
A detailed list of costs and savings by recommendation appears in Exhibit 3. Many TSPR recommendations would not have a direct financial impact but would improve the district's overall operations.
Acknowledgments
The Comptroller's office and WCL Enterprises wish to express appreciation to the SISD Board of Trustees, Superintendent John Thornell, district employees, students, parents and community residents who helped during the review. Special thanks are due to Stacy Amann, director of Special Programs, who acted as SISD's liaison by arranging for office space, equipment and meeting rooms and otherwise accommodating the review team's needs.
Smithville ISD
SISD served 1,807 students during 1999-2000, a 0.7-percent increase from the 1998-99 enrollment of 1,794. SISD has one high school, one junior high school, one elementary, one primary school and two alternative education campuses for a total of 6 campuses.
From 1995-96 to 1999-2000, the district's enrollment increased by 11.3 percent. At the same time, SISD's property value of $144,799 per student is 26.9 percent lower than the state average of $198,149 per student.
Seventeen percent of SISD's students are Hispanic, 11.2 percent are African-American, 71.1 percent are Anglo and 0.4 percent are classified as Other. 39.5 percent of SISD's students were classified as economically disadvantaged in 1999-2000.
SISD has improved its student performance in the last few years. In 1994-95 and 1997-98, SISD had one "low-performing" school, using TEA's

measurement criteria. In 1999-2000, the district received an "Academically Acceptable" rating from TEA with zero low-performing schools.
In 1998-99, 78.5 percent of all SISD students passed the TAAS compared to 58 percent in 1994-95*.The performance gains over this same period are even more significant for minority students and economically disadvantaged students.(*1999-2000 rates for all tests taken were not available at the time of this printing.)
In 1998-99, 64.8 percent of African American students passed the TAAS compared to 32.9 percent in 1994-95; 66.7 percent of Hispanic students passed the TAAS in 1998-99, compared to 30.8 percent in 1994-95; and 66.9 percent of economically disadvantaged students passed the TAAS in 1998-99, compared to 43.3 percent in 1994-95. Clearly, the district has made significant improvements, but work still remains to be done in the area of student performance.
During 1999-2000, the district employed a staff of 282 employees, with teachers accounting for 138 or 50 percent of SISD staffing. The district had expenditures of $12.1 million in 1999-2000. Thirty-three percent of SISD's revenues were generated locally, 60 percent came from the state and 2.6 percent came from the federal government. Some 4 percent came from other sources.
In 1998-99, SISD spent 51.8 percent of every education dollar in classroom instruction. In 1999-2000 that percent decreased to 50.6.
Exemplary Programs and Practices
TSPR identified numerous "best practices" in SISD. Through commendations in each chapter, the report highlights model programs, operations and services provided by SISD administrators, teachers and staff. Other school districts throughout Texas are encouraged to examine these exemplary programs and services to see if they could be adapted to meet local needs. TSPR's commendations are listed below.
• SISD is developing a sound planning process that ties budget allocations to the district and to campus improvement strategies that are designed to increase student performance. Prior to 1996, site-based decision-making was not seriously addressed. When school started in fall 1999, the director of Curriculum and Technology provided training to every campus site-based committee in the roles and responsibilities of the district and campus site-based committees. The purpose of this effort was to clearly define the roles and responsibilities of the superintendent,
central office staff, principals, teachers, district- level committee members and campus-level committee members in the areas of planning, budgeting, staffing patterns, staff development and school organization.
• SISD uses Region 13 Personnel Services Cooperative to expand the availability of teacher applicants. The cooperative has 24 members school districts, and assists school districts with recruiting, selecting and hiring teachers. SISD pays a one-time membership fee and an annual maintenance fee, both of which are based on average daily attendance. The district receives the advantages of reduced paper due to an almost entirely electronic application and distribution process; decreased staff time associated with recruitment and applicant processing; an increased number of applicants from what a district could generate itself; and availability of information to districts seven days per week, 24 hours per day. SISD fills 15-20 teacher vacancies each year.
• SISD is undertaking a series of initiatives to address the needs of its non-college bound students. Tech Prep is a program that leads students toward associate or baccalaureate degree programs and helps students prepare for high skill, high wage jobs in at least one field of engineering technology, applied science health or business through a planned, sequential program of study. SISD participates in the Capital Area Tech Prep Consortium and enters into articulation agreements with three junior colleges: Weatherford Junior College in Agriculture; Austin Community College in Business and Blinn College in Home Economics/Child Care, Business and Technology. Students take a coherent sequence of courses while in high school that will earn them Credit in -Escrow at colleges with which the high school has articulation agreements.
• SISD's Maintenance Department is responsive to the needs of the schools and provides quality services. The district has a manual work order system with three levels of priority: emergency, priority and routine. The principal determines the priority, and the director of Maintenance usually agrees with the principal's determination.
• SISD prepares informative budget analysis reports every month for the board and the public. Budget reports are included the monthly board meeting packets, which include variances from the amounts budgeted. Business Office personnel routinely answer detailed questions concerning the budget at the monthly board meeting. The monthly board report also includes the district's ongoing budgeted and actual financial results. The report includes the budgeted amount, actual financial result and variances from the budget at a selected level of detail.
• The district implemented a Food Services Quality Assurance Review during the 1999-2000 school year that improve services.
The members of the team include parents and other community representatives. A checklist and report have been developed to assist with the review and provide for measurable results. The summary report contains sections for food quality, service, facilities and schedule, general evaluation and a follow up, and quality team meeting comments and recommendations. Each response is rated on a scale of one to five, poor to outstanding. The reviews are unannounced and the results are shared with the Food Service Department for corrective action.
Key Findings and Recommendations
TSPR's recommendations emphasize improved student performance, better facilities management and planning and full cost recovery.
Facilities Planning: While the superintendent developed a board-approved long-range facilities plan in February 2000, and the director of Maintenance and Transportation completed a thorough review of each SISD facility and prepared a facility survey report in May 2000, neither assessment addresses its facilities needs in an integrated manner. Crucial factors such as financing alternatives and program management are not addressed, even though both have been particular problems for the district. SISD's plan does establish a priority for each project, but it does not identify a timeframe with which the work will be completed. The district must refine the facilities plan by including a community review of the plan, a schedule for completion and financing alternatives.
Facilities Maintenance: In 1999-2000, the director of Maintenance and Transportation conducted a detailed needs assessment for maintenance at each existing SISD facility. The director prioritized the needs at each facility in a report to the superintendent. While this is a good starting point for determining Maintenance Department priorities for the year, the district must develop an ongoing process that ties budget dollars to identified and prioritized maintenance needs.
Student Performance: Progress in the performance of minority and economically disadvantaged students in SISD has fluctuated since 1995-96, especially from 1998-99, when the percentage of African American students passing the writing test declined by 1.4 percentage points. Additionally, Hispanic students passing the reading and math tests declined by 3.2 and 9.1 percentage points, respectively; and economically disadvantaged students passing the reading test declined by 2.7 percentage points. The district also had difficulty closing the performance gap between Anglo students and minority and economically disadvantaged students. While the performance gap has narrowed between Anglo students and minority and economically disadvantaged students on the
TAAS reading test, the gap began to widen again in 1999-2000 among Hispanic and economically disadvantaged students. To address this problem, the district should use TAAS data to identify student and teacher needs and to improve student performance.
TAAS Exemptions: The district's TAAS exemption rates are as troubling as is its fluctuating minority student performance. In 1998-99, 31.1 percent of African American students and 22 percent of Hispanic students were not tested. SISD is working with the individual campuses on a student-by-student basis to identify specific modifications and the least restrictive placement for each student. While this is a good start, it is imperative that the district increase the emphasis on reducing TAAS exemptions for minority students. Assessing each student's strengths and weaknesses are the first critical step necessary to creating programs that can help those children succeed.
Food Services: The Food Services Department is not recovering the full costs for catering events. The district charges all events at the cost for food and supplies, but labor is not calculated into the cost. Last year, the department was able to recover approximately $4,500 in food and supply costs for catering activities, but the labor of approximately $1,500 was paid out of the department's budget. The district should establish a policy to recover the full cost of catering events, including the cost of labor, supplies and food, and expand the catering activities to include Career and Technology students in the process.
Food Services Facilities: The location of the dumpsters at the main kitchen is inappropriate and is not in compliance with the Texas Department of Health's requirements regarding location, proximity to the kitchen and cleanliness of the dumpster area. The district should relocate the dumpsters according to health code guidelines, and eliminate unnecessary employee time in transporting and handling of garbage.
Network Infrastructure: SISD does not have its network infrastructure documented. While the superintendent and the network administrator understand the system and are capable of analyzing and correcting problems, written documentation is essential so others maintaining the infrastructure in the future can understand the network's function.
Transportation Services: The district's transportation function is not operating efficiently. From 1994-95 to 1998-99, miles driven increased at a rate of 27 percent, while operating costs increased at 200.3 percent. The district must conduct a study and determine strategies to improve efficiency, including possibly contracting with another district or vendor to perform the function.
Savings and Investment Requirements
Many TSPR's recommendations would result in savings and increased revenue that could be used to improve classroom instruction. The savings opportunities identified in this report are conservative and should be considered minimums. Proposed investments of additional funds usually are related to increased efficiencies or savings or improved productivity and effectiveness.
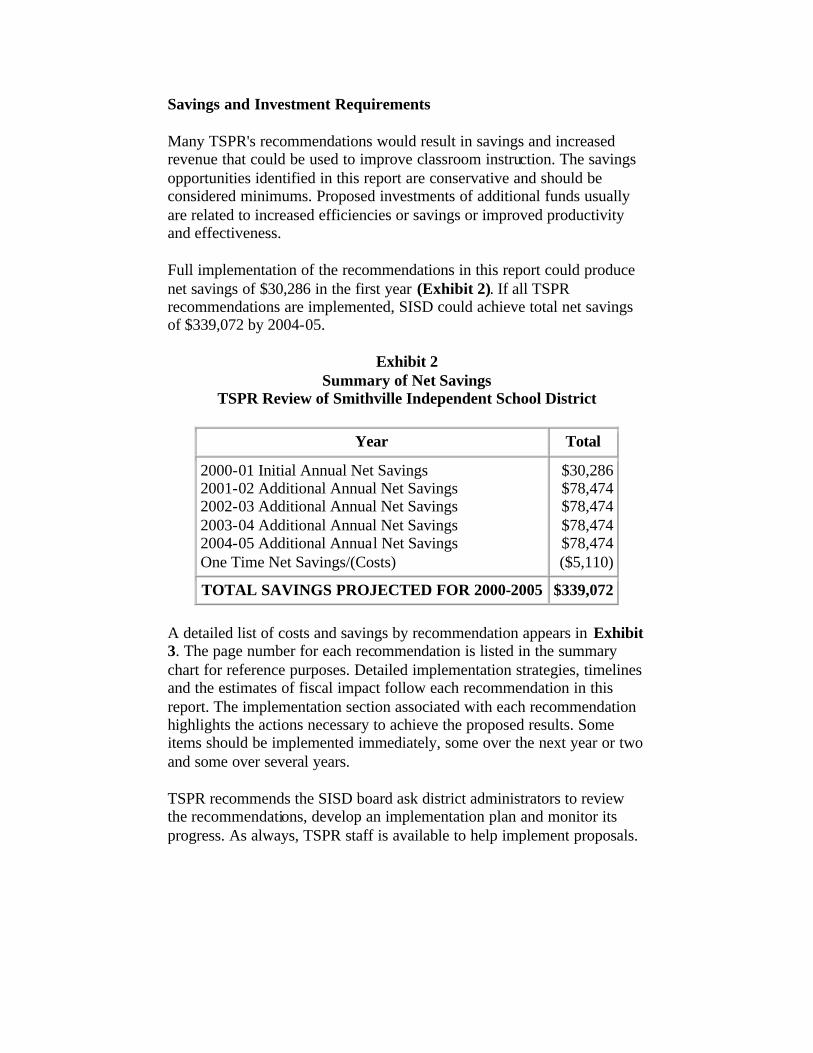
Full implementation of the recommendations in this report could produce net savings of $30,286 in the first year (Exhibit 2). If all TSPR recommendations are implemented, SISD could achieve total net savings of $339,072 by 2004-05.
Exhibit 2 Summary of Net Savings
TSPR Review of Smithville Independent School District
Year Total
2000-01 Initial Annual Net Savings 2001-02 Additional Annual Net Savings 2002-03 Additional Annual Net Savings 2003-04 Additional Annual Net Savings 2004-05 Additional Annual Net Savings One Time Net Savings/(Costs)
$30,286 $78,474 $78,474 $78,474 $78,474 ($5,110)
TOTAL SAVINGS PROJECTED FOR 2000-2005 $339,072
A detailed list of costs and savings by recommendation appears in Exhibit 3. The page number for each recommendation is listed in the summary chart for reference purposes. Detailed implementation strategies, timelines and the estimates of fiscal impact follow each recommendation in this report. The implementation section associated with each recommendation highlights the actions necessary to achieve the proposed results. Some items should be implemented immediately, some over the next year or two and some over several years.
TSPR recommends the SISD board ask district administrators to review the recommendations, develop an implementation plan and monitor its progress. As always, TSPR staff is available to help implement proposals.

Executive Summary Exhibit 3 (Detail List of Cost Savings by Recommendation)
Exhibit 3 Summary of Costs and Savings by Recommendation
Recommendation 2000-2001
2001-2002
2002-2003
2003-2004
2004-2005
Total 5-Year
(Costs) or
Savings
One Time
(Costs) or
Savings
Chapter 1 District Organization and Management
1 Increase teacher participation in the site-based decision-making process by allowing them to serve as chairs of campus site-based decision-making committees. p.26
$0 $0 $0 $0 $0 $0 $0
2 Establish a parent-volunteer/community involvement program. p.40
$0 $0 $0 $0 $0 $0 $0
Totals-Chapter 1 $0 $0 $0 $0 $0 $0 $0
Chapter 2 Educational Service Delivery and Performance Measures
3 Use TAAS data to identify student and teacher needs and to improve student performance. p.61
$0 $0 $0 $0 $0 $0 $0
4 Increase the emphasis on reducing TAAS exemptions for minority students. p.64
$0 $0 $0 $0 $0 $0 $0
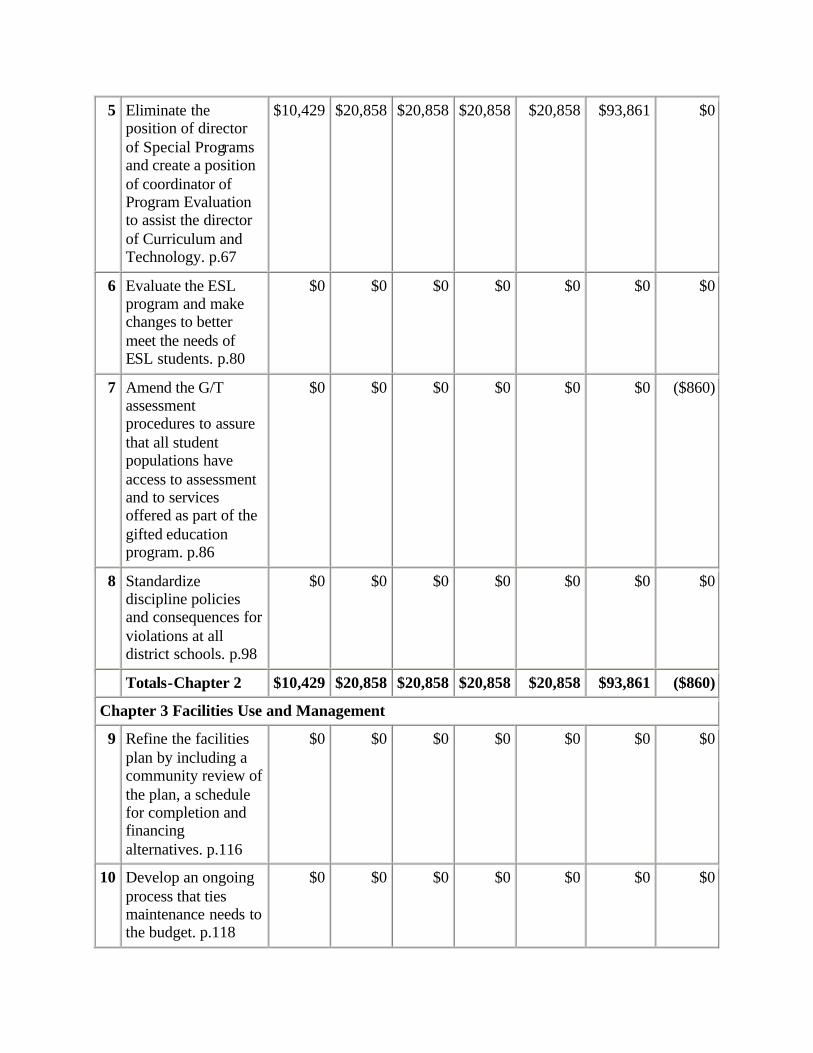
5 Eliminate the position of director of Special Programs and create a position of coordinator of Program Evaluation to assist the director of Curriculum and Technology. p.67
$10,429 $20,858 $20,858 $20,858 $20,858 $93,861 $0
6 Evaluate the ESL program and make changes to better meet the needs of ESL students. p.80
$0 $0 $0 $0 $0 $0 $0
7 Amend the G/T assessment procedures to assure that all student populations have access to assessment and to services offered as part of the gifted education program. p.86
$0 $0 $0 $0 $0 $0 ($860)
8 Standardize discipline policies and consequences for violations at all district schools. p.98
$0 $0 $0 $0 $0 $0 $0
Totals-Chapter 2 $10,429 $20,858 $20,858 $20,858 $20,858 $93,861 ($860)
Chapter 3 Facilities Use and Management
9 Refine the facilities plan by including a community review of the plan, a schedule for completion and financing alternatives. p.116
$0 $0 $0 $0 $0 $0 $0
10 Develop an ongoing process that ties maintenance needs to the budget. p.118
$0 $0 $0 $0 $0 $0 $0
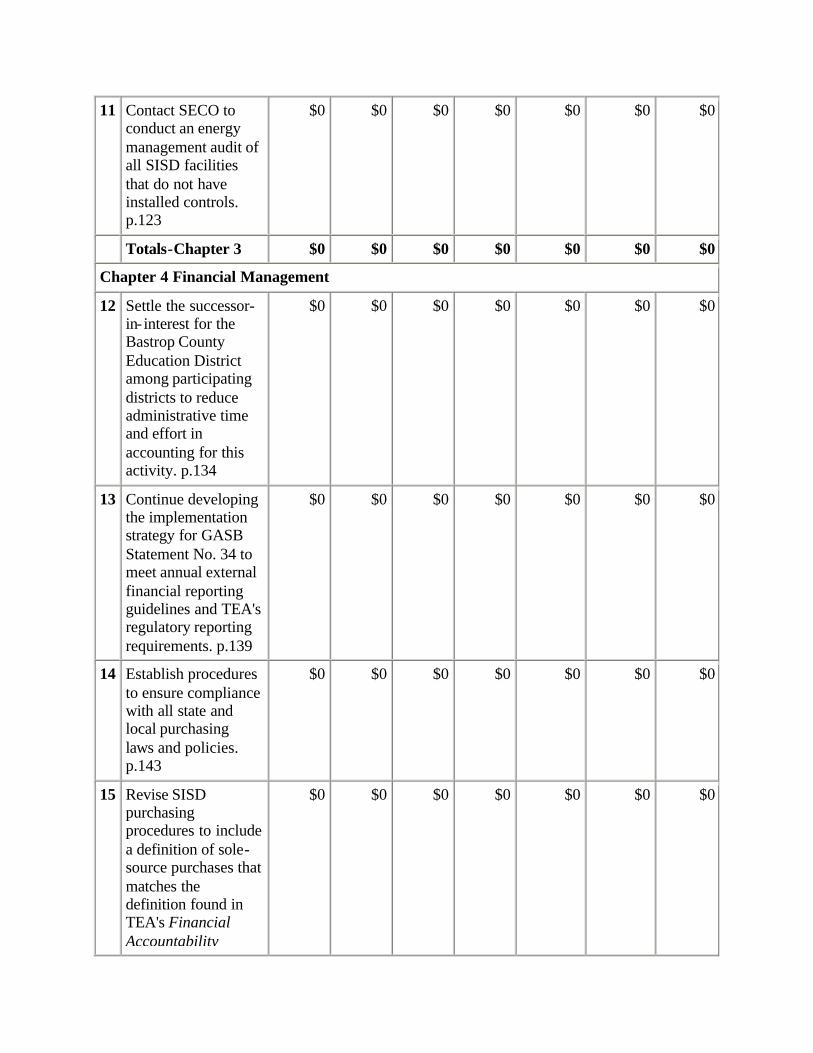
11 Contact SECO to conduct an energy management audit of all SISD facilities that do not have installed controls. p.123
$0 $0 $0 $0 $0 $0 $0
Totals-Chapter 3 $0 $0 $0 $0 $0 $0 $0
Chapter 4 Financial Management
12 Settle the successor-in- interest for the Bastrop County Education District among participating districts to reduce administrative time and effort in accounting for this activity. p.134
$0 $0 $0 $0 $0 $0 $0
13 Continue developing the implementation strategy for GASB Statement No. 34 to meet annual external financial reporting guidelines and TEA's regulatory reporting requirements. p.139
$0 $0 $0 $0 $0 $0 $0
14 Establish procedures to ensure compliance with all state and local purchasing laws and policies. p.143
$0 $0 $0 $0 $0 $0 $0
15 Revise SISD purchasing procedures to include a definition of sole-source purchases that matches the definition found in TEA's Financial Accountability
$0 $0 $0 $0 $0 $0 $0
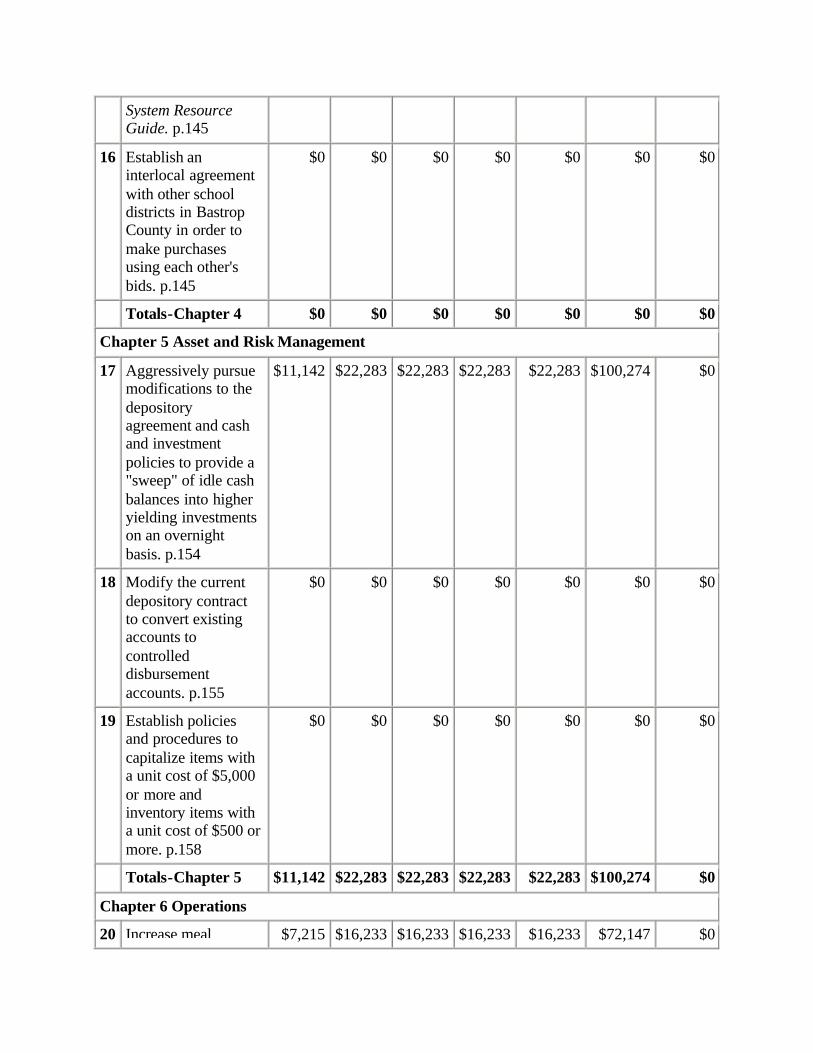
System Resource Guide. p.145
16 Establish an interlocal agreement with other school districts in Bastrop County in order to make purchases using each other's bids. p.145
$0 $0 $0 $0 $0 $0 $0
Totals-Chapter 4 $0 $0 $0 $0 $0 $0 $0
Chapter 5 Asset and Risk Management
17 Aggressively pursue modifications to the depository agreement and cash and investment policies to provide a "sweep" of idle cash balances into higher yielding investments on an overnight basis. p.154
$11,142 $22,283 $22,283 $22,283 $22,283 $100,274 $0
18 Modify the current depository contract to convert existing accounts to controlled disbursement accounts. p.155
$0 $0 $0 $0 $0 $0 $0
19 Establish policies and procedures to capitalize items with a unit cost of $5,000 or more and inventory items with a unit cost of $500 or more. p.158
$0 $0 $0 $0 $0 $0 $0
Totals-Chapter 5 $11,142 $22,283 $22,283 $22,283 $22,283 $100,274 $0
Chapter 6 Operations
20 Increase meal $7,215 $16,233 $16,233 $16,233 $16,233 $72,147 $0
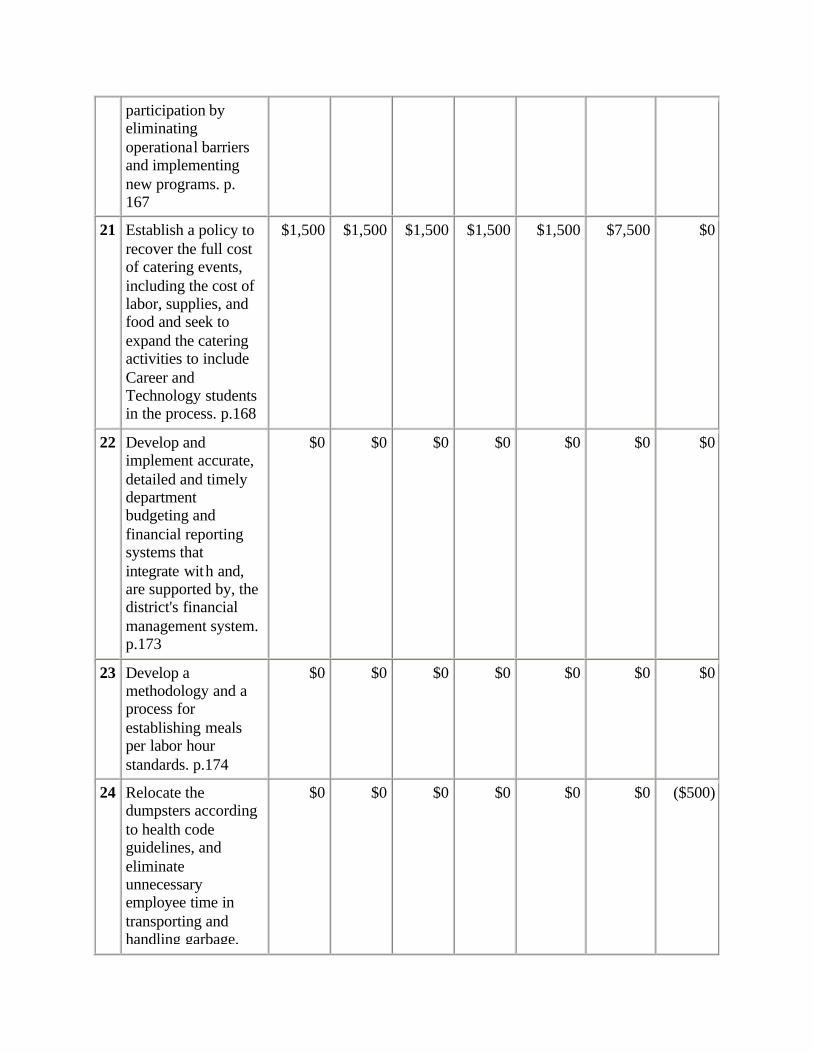
participation by eliminating operational barriers and implementing new programs. p. 167
21 Establish a policy to recover the full cost of catering events, including the cost of labor, supplies, and food and seek to expand the catering activities to include Career and Technology students in the process. p.168
$1,500 $1,500 $1,500 $1,500 $1,500 $7,500 $0
22 Develop and implement accurate, detailed and timely department budgeting and financial reporting systems that integrate with and, are supported by, the district's financial management system. p.173
$0 $0 $0 $0 $0 $0 $0
23 Develop a methodology and a process for establishing meals per labor hour standards. p.174
$0 $0 $0 $0 $0 $0 $0
24 Relocate the dumpsters according to health code guidelines, and eliminate unnecessary employee time in transporting and handling garbage.
$0 $0 $0 $0 $0 $0 ($500)
p.176
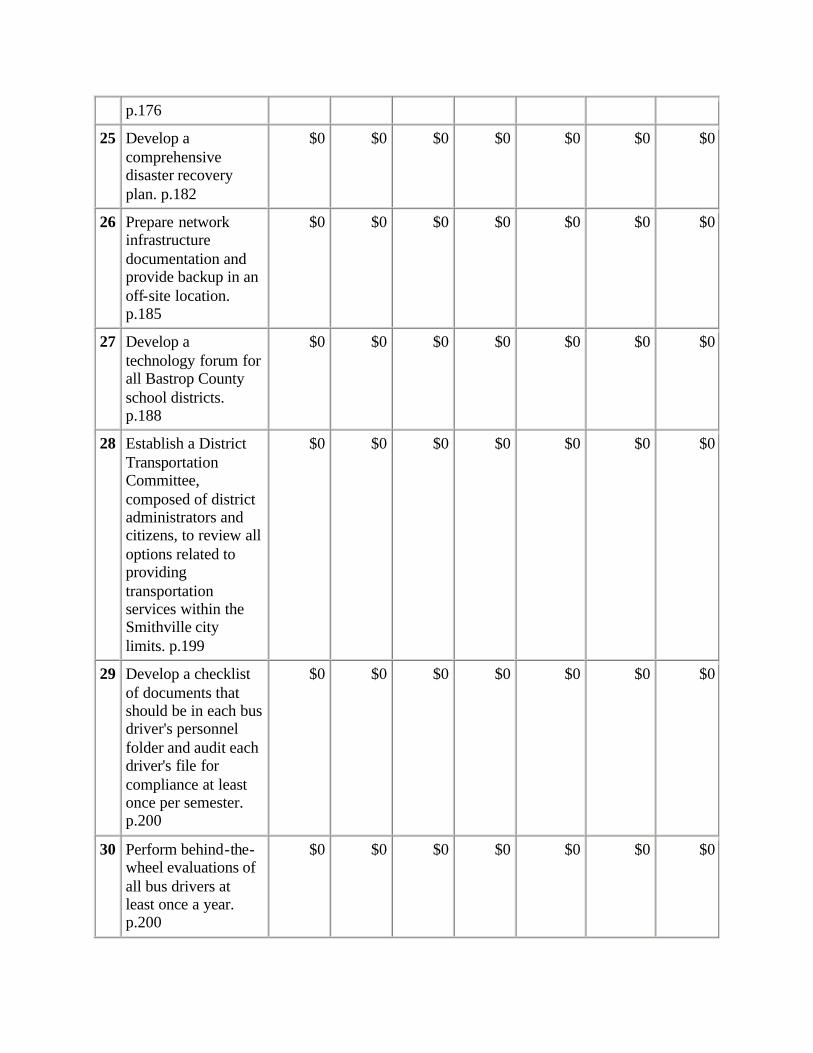
25 Develop a comprehensive disaster recovery plan. p.182
$0 $0 $0 $0 $0 $0 $0
26 Prepare network infrastructure documentation and provide backup in an off-site location. p.185
$0 $0 $0 $0 $0 $0 $0
27 Develop a technology forum for all Bastrop County school districts. p.188
$0 $0 $0 $0 $0 $0 $0
28 Establish a District Transportation Committee, composed of district administrators and citizens, to review all options related to providing transportation services within the Smithville city limits. p.199
$0 $0 $0 $0 $0 $0 $0
29 Develop a checklist of documents that should be in each bus driver's personnel folder and audit each driver's file for compliance at least once per semester. p.200
$0 $0 $0 $0 $0 $0 $0
30 Perform behind-the-wheel evaluations of all bus drivers at least once a year. p.200
$0 $0 $0 $0 $0 $0 $0
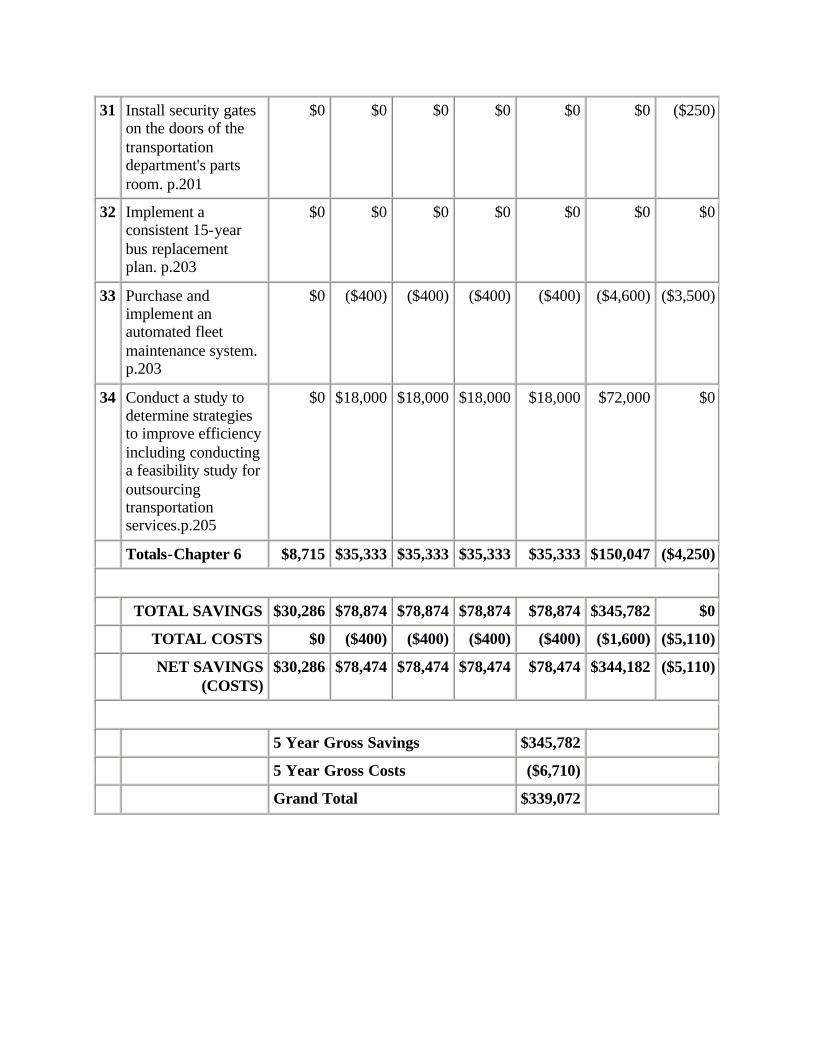
31 Install security gates on the doors of the transportation department's parts room. p.201
$0 $0 $0 $0 $0 $0 ($250)
32 Implement a consistent 15-year bus replacement plan. p.203
$0 $0 $0 $0 $0 $0 $0
33 Purchase and implement an automated fleet maintenance system. p.203
$0 ($400) ($400) ($400) ($400) ($4,600) ($3,500)
34 Conduct a study to determine strategies to improve efficiency including conducting a feasibility study for outsourcing transportation services.p.205
$0 $18,000 $18,000 $18,000 $18,000 $72,000 $0
Totals-Chapter 6 $8,715 $35,333 $35,333 $35,333 $35,333 $150,047 ($4,250)
TOTAL SAVINGS $30,286 $78,874 $78,874 $78,874 $78,874 $345,782 $0
TOTAL COSTS $0 ($400) ($400) ($400) ($400) ($1,600) ($5,110)
NET SAVINGS (COSTS)
$30,286 $78,474 $78,474 $78,474 $78,474 $344,182 ($5,110)
5 Year Gross Savings $345,782
5 Year Gross Costs ($6,710)
Grand Total $339,072
Chapter 1
DISTRICT ORGANIZATION AND MANAGEMENT
This chapter describes the organization and management of the Smithville Independent School District (SISD) in the following areas:
A. Planning and Site-Based Decision-Making B. Organization and Staffing C. Personnel Management D. Community and Parental Involvement
The organization and management of a school district requires cooperation between elected members of the Board of Trustees and the district's staff. The board should set the district's goals and objectives in both instructional and operational areas, determine the policies which will govern the district, approve the plans to implement those policies, provide the funding necessary to carry out those plans and evaluate the results.
The staff is responsible for managing the day-to-day implementation of the plans approved by the board and for recommending the modifications necessary to ensure the district's programs operate efficiently. The superintendent, as the chief executive officer of the district, recommends the level of staffing and the amount of resources necessary to operate the district and to accomplish the board's goals and objectives.
BACKGROUND
Smithville ISD is responsible for providing public education for all the students who live within the district's 191 square miles. The district's mission is to improve students' academic performance. To achieve this mission, the school district should provide effective instructional leadership, responsible fiscal management and create an atmosphere in which all students can develop and mature academically, physically, emotionally and socially.
SISD provides these educational opportunities through its four schools and one alternative school. In the 1998-99 Texas Education Agency (TEA) rated SISD "Academically Acceptable," and rated the four regular education schools "Acceptable." TEA did not rate the alternative school. The district's May 2000 enrollment reached 1,805 students.
The district is served by Regional Education Service Center 13 (Region 13), which is located in Austin.
Each Texas school district is governed by an elected Board of Trustees, which governs and oversees the schools' management of the schools. School board members are elected by district residents either at- large, districtwide or from single-member districts that cover only a portion of the school district.
Each board derives its legal status from the Texas Constitution and the Texas Legislature. The board must comply with applicable state and federal statutes, controlling court decisions and applicable regulations. Under Section 11.151 of the Texas Education Code, each board has specific statutory powers and duties, including:
• Govern and oversee the management of the district's public schools;
• Adopt such rules, regulations and bylaws as the board may deem proper;
• Approve a district-developed plan for site-based decision-making and provide for its implementation;
• Levy and collect taxes and issue bonds; • Select tax officials appropriate to the district's need; • Prepare, adopt and file a budget for the next succeeding fiscal year
and file a report of disbursements and receipts for the preceding fiscal year;
• Have district fiscal accounts audited at district expense by a Texas certified public accountant holding a permit from the Texas State Board of Public Accountancy following the close of each fiscal year;
• Publish an annual report describing the district's educational performance, including campus performance objectives and the progress of each campus toward these objectives;
• Receive bequests and donations or other money coming legally into its hands in the name of the district;
• Select a depository for district funds; • Order elections, canvass the returns, declare results and issue
certificates of election as required by law; • Dispose of property no longer necessary to operate the school
district; • Acquire and hold real and personal property in the name of the
district; and • Hold all powers and duties not specifically delegated by statute to
the Texas Education Agency or the State Board of Education.
The SISD board consists of seven members elected at large for three-year terms (Exhibit 1-1).
Elections are held each year on the first Saturday in May.
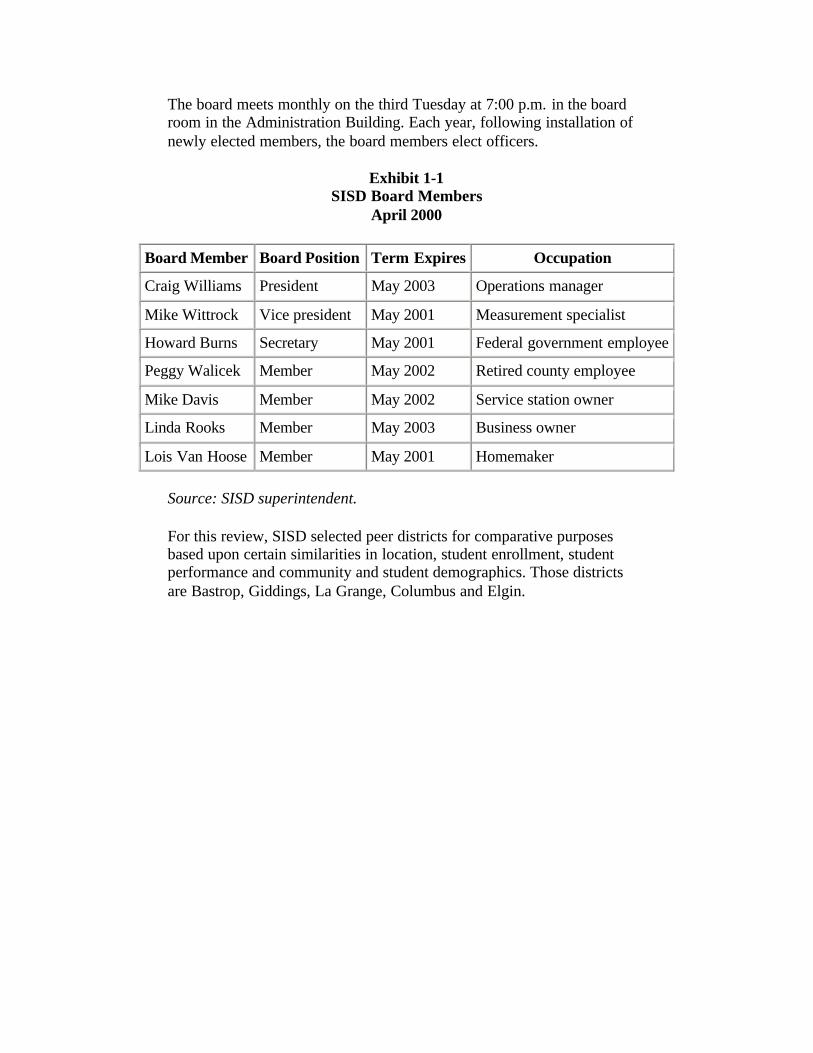
The board meets monthly on the third Tuesday at 7:00 p.m. in the board room in the Administration Building. Each year, following installation of newly elected members, the board members elect officers.
Exhibit 1-1 SISD Board Members
April 2000
Board Member Board Position Term Expires Occupation
Craig Williams President May 2003 Operations manager
Mike Wittrock Vice president May 2001 Measurement specialist
Howard Burns Secretary May 2001 Federal government employee
Peggy Walicek Member May 2002 Retired county employee
Mike Davis Member May 2002 Service station owner
Linda Rooks Member May 2003 Business owner
Lois Van Hoose Member May 2001 Homemaker
Source: SISD superintendent.
For this review, SISD selected peer districts for comparative purposes based upon certain similarities in location, student enrollment, student performance and community and student demographics. Those districts are Bastrop, Giddings, La Grange, Columbus and Elgin.
Chapter 1
PLANNING AND SITE-BASED DECISION-MAKING
Planning and budgeting are critical to effective management. Planning enables a district to define goals and objectives, establish priorities, select appropriate implementation strategies and determine critical measures of performance.
The budget process should follow the plan's development and implementation by allocating resources necessary to reaching the performance targets established in the plan. When coordinated properly, the combination of planning and budgeting reduces confusion and conflict over how scarce resources are distributed.
School districts with effective planning systems divide the process into a series of key components that provide the information necessary to develop the plan, update it or implement plan priorities. These key components include annual district priorities; campus improvement plans; a regular program evaluation cycle; work plans; ongoing evaluation of the personnel implementing the plan; a budget tied to the plan's priorities; and a management information system.
The board adopts its annual priorities each year and indicates what the district will do in a given year to achieve its goals and objectives. The plan must set priorities and clearly measurable objectives, assign responsibility for implementation at each level and create a mechanism to measure the extent to which district priorities are accomplished.
The program cycle indicates what will happen in each program taught in the district and whether new programs or modifications to existing ones are necessary.
Work plans define who is responsible for plan implementation and monitoring at all levels of the district. The work plans also identify specific tasks and what department and position will be he ld accountable for completing each task.
The budget clearly identifies the resources that are provided to support each priority. The budget also should be in a format easily understood by the public and disseminated widely.
The personnel evaluation system measures how well district personnel performed in accomplishing objectives. A summary annual evaluation provides information for individual and system improvement.
Finally, the management information system reflects how well the total system has performed in accomplishing the plan's priorities. This system collects information to determine how well objectives are achieved and what should be changed.
In Texas, Section 11.252 of the Texas Education Code provides the requirements for district-level planning and decision-making. Each school district must have a district improvement plan (DIP) that is developed, evaluated and revised annually. The plan must include:
• A comprehensive needs assessment addressing student performance on the Academic Excellence Indicators (AEI);
• Measurable district performance objectives for all student groups; • Strategies for improving student performance; • Resources needed to implement identified strategies; • Staff responsible for ensuring each strategy is accomplished; • Timelines for monitoring implementation; and • Criteria for determining if the strategies are improving student
performance.
In SISD, district improvement planning and site-based decision-making are closely aligned. The district committee in SISD is called the District Site-Based Decision-Making/Planning Committee. Chaired by the superintendent, it prepares the DIP and serves as the district's site-based decision-making committee.
In SISD, Campus Improvement Plans (CIPs) are developed by the site-based decision-making committee (SBDM) on each campus and identify what each school will do in a given year to help achieve district and school objectives. By board policy, the principal at each campus chairs the SBDM.
Section 21 of the Texas Education Code describes certain requirements associated with implementing site-based decision-making (SBDM) in Texas school districts. The major theme of SBDM is the empowerment of students, parents, teachers, principals and schools. The code describes the requirements for annual district and campus improvement plans, composition of district and campus decision-making committees, election of representatives to each committee, terms of office, meetings and general responsibilities.
SISD adopted a policy in 1996 to create district and school-based collaborative decision-making committees to comply with state law and has amended the original policy several times since then, most recently in 1999. These policies provide authorization, the scope of responsibility, the
composition of committees, the electoral processes for membership selection, and the approval processes.
The district committee consists of representatives of campus-based professional staff, district- level professional staff, parents, businesses and the community. At least two-thirds of the district and campus professional staff must be teachers. The remaining one-third must be professional non-teaching district and campus-level staff. The committee meets as needed but at least six times per year. All district committee representatives serve for three-year terms.
The campus committee consists of representatives of campus-based professional staff, district- level professional staff, parents, businesses and the community. At least two-thirds of the district and campus professional staff must be teachers. The remaining one-third must be professional non-teaching district or campus- level staff. With the exception of parent, community and business representatives, all remaining committee members are to be elected by the group that they represent. The committees meet when the principal determines it is necessary. All campus committee representatives serve for three-year terms.
FINDING
Site-based decision making was not seriously addressed at Smithville ISD until 1996. The district did have the required committees identified, but they really did not perform the statutory functions. The district did not have a written district improvement plan until 1996. The reason was that SISD's junior high school was rated low performing that year, and the Texas Education Agency was conducting an on-site visit.
The original pre-1996 plans, both district and campus, were weak in content and had little impact upon student academic improvement. Even though SISD policy says the superintendent chairs the district site-based decision-making committee, which prepares the DIP, the previous superintendent rarely even attended the district site-based meetings and did not hold principals accountable for the content of their improvement plans. The assistant superintendent was assigned to chair the district committee meetings and reported on the status of the plans, but the superintendent did not follow up to improve the plans.
The budgeting process occurs in the spring and summer of each year, but has been disconnected from the site-based decision-making process. The rationale given by the previous superintendent was that the district did not receive data on student performance from TEA until the fall and, therefore, did not work on new improvement plans until the district had its outcome data from the previous year.
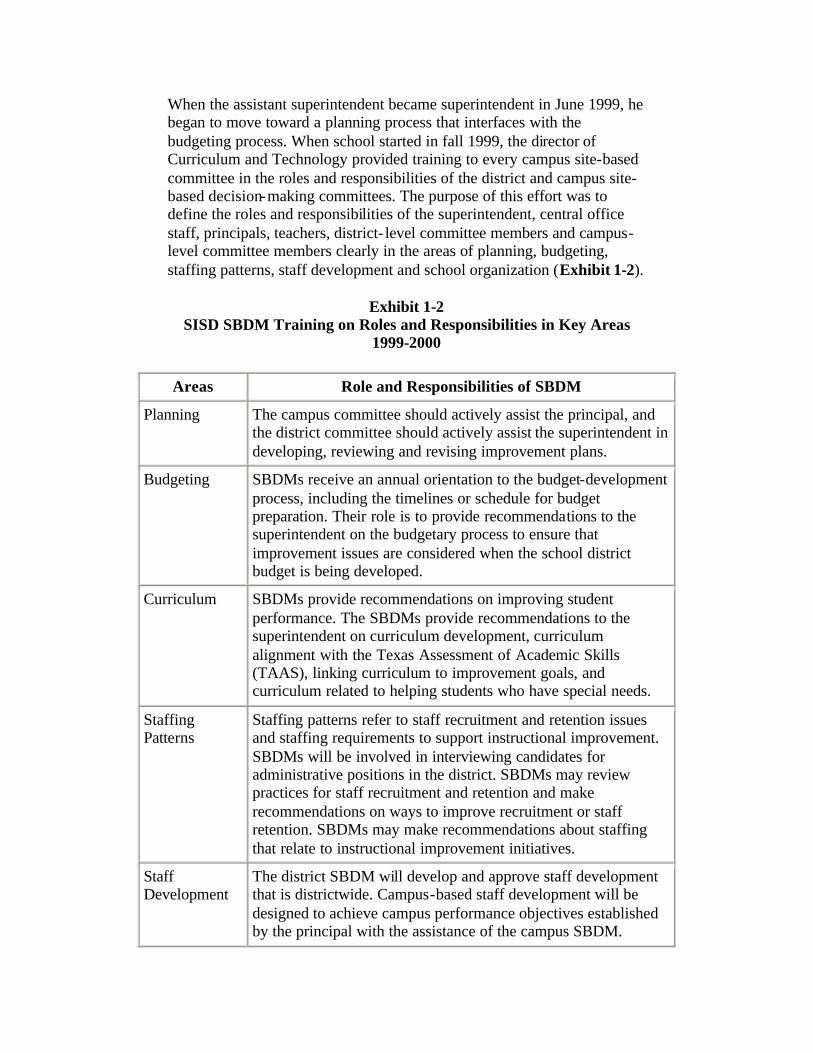
When the assistant superintendent became superintendent in June 1999, he began to move toward a planning process that interfaces with the budgeting process. When school started in fall 1999, the director of Curriculum and Technology provided training to every campus site-based committee in the roles and responsibilities of the district and campus site-based decision-making committees. The purpose of this effort was to define the roles and responsibilities of the superintendent, central office staff, principals, teachers, district- level committee members and campus-level committee members clearly in the areas of planning, budgeting, staffing patterns, staff development and school organization (Exhibit 1-2).
Exhibit 1-2 SISD SBDM Training on Roles and Responsibilities in Key Areas
1999-2000
Areas Role and Responsibilities of SBDM
Planning The campus committee should actively assist the principal, and the district committee should actively assist the superintendent in developing, reviewing and revising improvement plans.
Budgeting SBDMs receive an annual orientation to the budget-development process, including the timelines or schedule for budget preparation. Their role is to provide recommendations to the superintendent on the budgetary process to ensure that improvement issues are considered when the school district budget is being developed.
Curriculum SBDMs provide recommendations on improving student performance. The SBDMs provide recommendations to the superintendent on curriculum development, curriculum alignment with the Texas Assessment of Academic Skills (TAAS), linking curriculum to improvement goals, and curriculum related to helping students who have special needs.
Staffing Patterns
Staffing patterns refer to staff recruitment and retention issues and staffing requirements to support instructional improvement. SBDMs will be involved in interviewing candidates for administrative positions in the district. SBDMs may review practices for staff recruitment and retention and make recommendations on ways to improve recruitment or staff retention. SBDMs may make recommendations about staffing that relate to instructional improvement initiatives.
Staff Development
The district SBDM will develop and approve staff development that is districtwide. Campus-based staff development will be designed to achieve campus performance objectives established by the principal with the assistance of the campus SBDM.
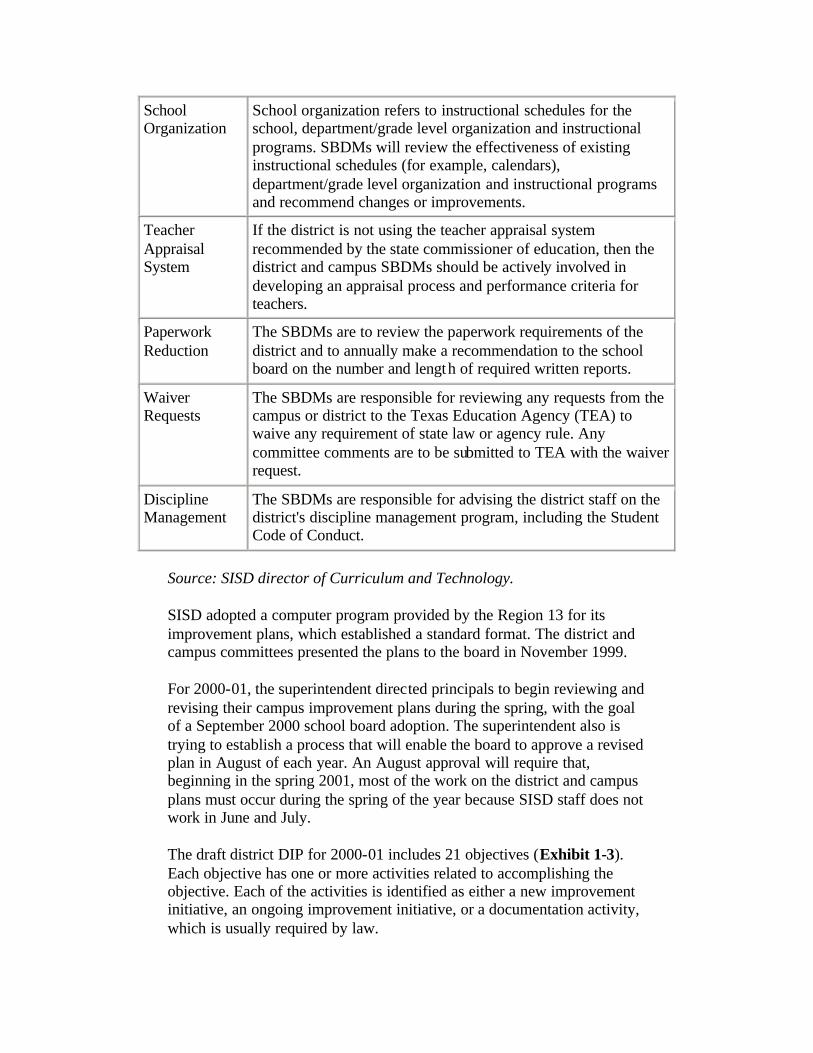
School Organization
School organization refers to instructional schedules for the school, department/grade level organization and instructional programs. SBDMs will review the effectiveness of existing instructional schedules (for example, calendars), department/grade level organization and instructional programs and recommend changes or improvements.
Teacher Appraisal System
If the district is not using the teacher appraisal system recommended by the state commissioner of education, then the district and campus SBDMs should be actively involved in developing an appraisal process and performance criteria for teachers.
Paperwork Reduction
The SBDMs are to review the paperwork requirements of the district and to annually make a recommendation to the school board on the number and length of required written reports.
Waiver Requests
The SBDMs are responsible for reviewing any requests from the campus or district to the Texas Education Agency (TEA) to waive any requirement of state law or agency rule. Any committee comments are to be submitted to TEA with the waiver request.
Discipline Management
The SBDMs are responsible for advising the district staff on the district's discipline management program, including the Student Code of Conduct.
Source: SISD director of Curriculum and Technology.
SISD adopted a computer program provided by the Region 13 for its improvement plans, which established a standard format. The district and campus committees presented the plans to the board in November 1999.
For 2000-01, the superintendent directed principals to begin reviewing and revising their campus improvement plans during the spring, with the goal of a September 2000 school board adoption. The superintendent also is trying to establish a process that will enable the board to approve a revised plan in August of each year. An August approval will require that, beginning in the spring 2001, most of the work on the district and campus plans must occur during the spring of the year because SISD staff does not work in June and July.
The draft district DIP for 2000-01 includes 21 objectives (Exhibit 1-3). Each objective has one or more activities related to accomplishing the objective. Each of the activities is identified as either a new improvement initiative, an ongoing improvement initiative, or a documentation activity, which is usually required by law.
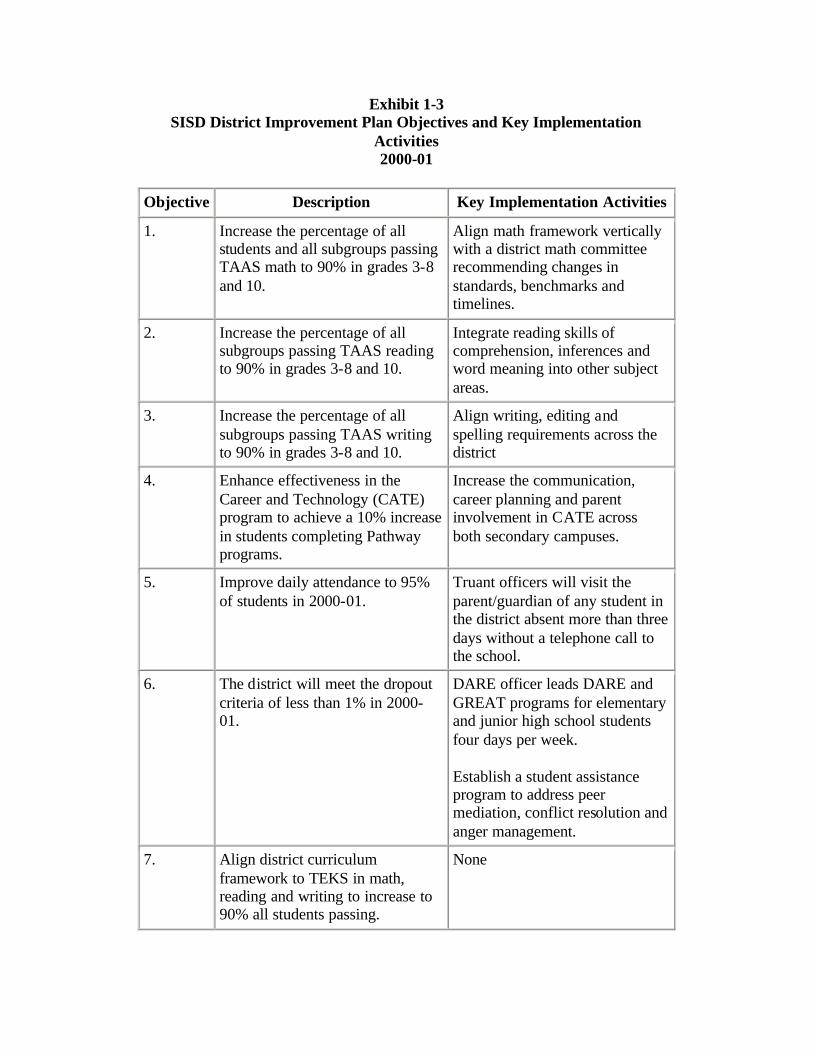
Exhibit 1-3 SISD District Improvement Plan Objectives and Key Implementation
Activities 2000-01
Objective Description Key Implementation Activities
1. Increase the percentage of all students and all subgroups passing TAAS math to 90% in grades 3-8 and 10.
Align math framework vertically with a district math committee recommending changes in standards, benchmarks and timelines.
2. Increase the percentage of all subgroups passing TAAS reading to 90% in grades 3-8 and 10.
Integrate reading skills of comprehension, inferences and word meaning into other subject areas.
3. Increase the percentage of all subgroups passing TAAS writing to 90% in grades 3-8 and 10.
Align writing, editing and spelling requirements across the district
4. Enhance effectiveness in the Career and Technology (CATE) program to achieve a 10% increase in students completing Pathway programs.
Increase the communication, career planning and parent involvement in CATE across both secondary campuses.
5. Improve daily attendance to 95% of students in 2000-01.
Truant officers will visit the parent/guardian of any student in the district absent more than three days without a telephone call to the school.
6. The district will meet the dropout criteria of less than 1% in 2000-01.
DARE officer leads DARE and GREAT programs for elementary and junior high school students four days per week.
Establish a student assistance program to address peer mediation, conflict resolution and anger management.
7. Align district curriculum framework to TEKS in math, reading and writing to increase to 90% all students passing.
None
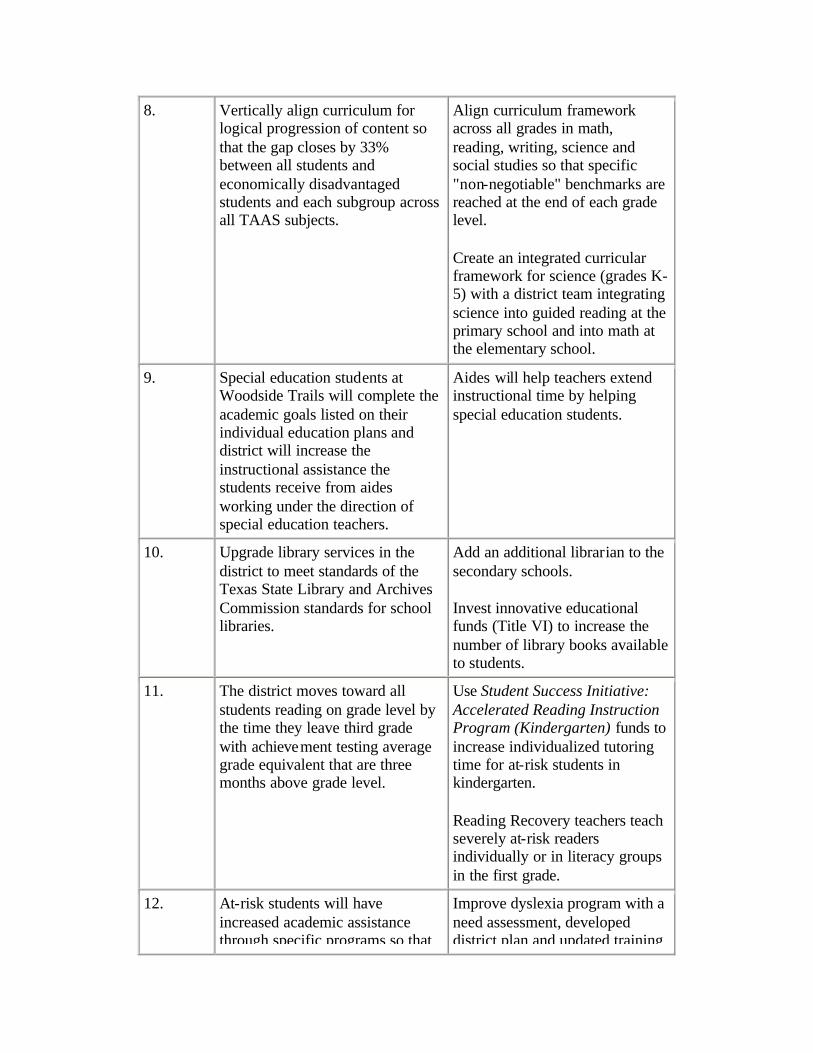
8. Vertically align curriculum for logical progression of content so that the gap closes by 33% between all students and economically disadvantaged students and each subgroup across all TAAS subjects.
Align curriculum framework across all grades in math, reading, writing, science and social studies so that specific "non-negotiable" benchmarks are reached at the end of each grade level.
Create an integrated curricular framework for science (grades K-5) with a district team integrating science into guided reading at the primary school and into math at the elementary school.
9. Special education students at Woodside Trails will complete the academic goals listed on their individual education plans and district will increase the instructional assistance the students receive from aides working under the direction of special education teachers.
Aides will help teachers extend instructional time by helping special education students.
10. Upgrade library services in the district to meet standards of the Texas State Library and Archives Commission standards for school libraries.
Add an additional librarian to the secondary schools.
Invest innovative educational funds (Title VI) to increase the number of library books available to students.
11. The district moves toward all students reading on grade level by the time they leave third grade with achievement testing average grade equivalent that are three months above grade level.
Use Student Success Initiative: Accelerated Reading Instruction Program (Kindergarten) funds to increase individualized tutoring time for at-risk students in kindergarten.
Reading Recovery teachers teach severely at-risk readers individually or in literacy groups in the first grade.
12. At-risk students will have increased academic assistance through specific programs so that
Improve dyslexia program with a need assessment, developed district plan and updated training
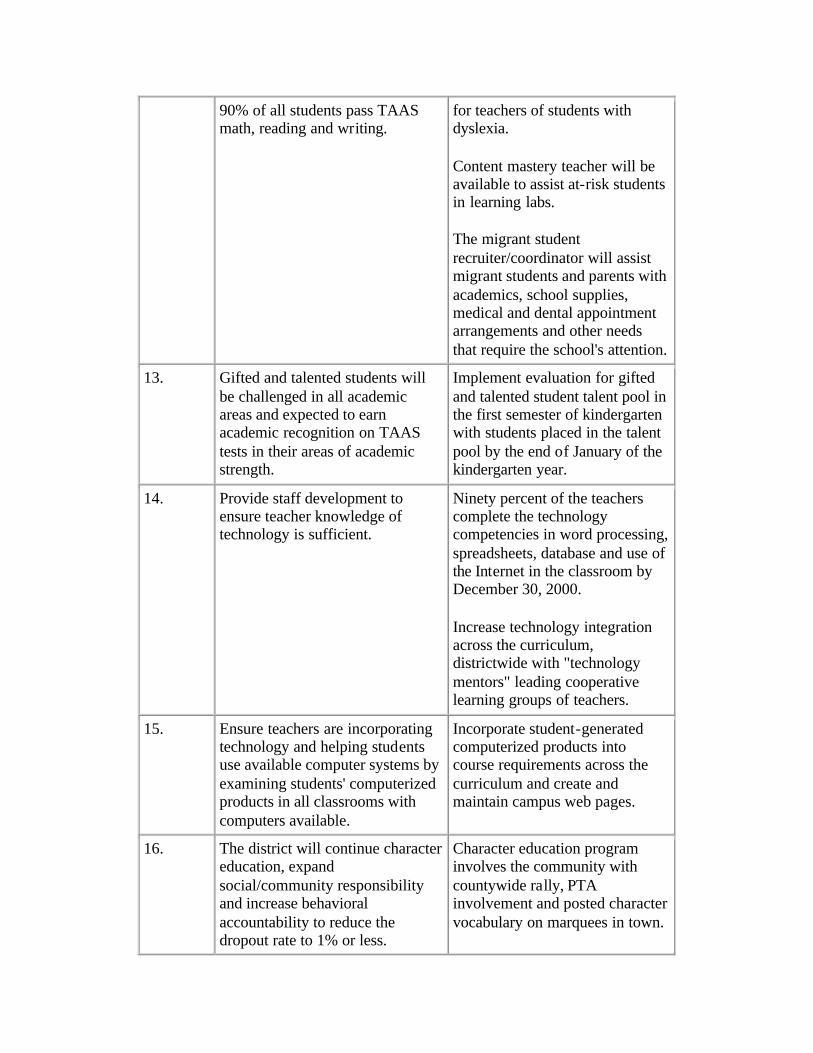
90% of all students pass TAAS math, reading and writing.
for teachers of students with dyslexia.
Content mastery teacher will be available to assist at-risk students in learning labs.
The migrant student recruiter/coordinator will assist migrant students and parents with academics, school supplies, medical and dental appointment arrangements and other needs that require the school's attention.
13. Gifted and talented students will be challenged in all academic areas and expected to earn academic recognition on TAAS tests in their areas of academic strength.
Implement evaluation for gifted and talented student talent pool in the first semester of kindergarten with students placed in the talent pool by the end of January of the kindergarten year.
14. Provide staff development to ensure teacher knowledge of technology is sufficient.
Ninety percent of the teachers complete the technology competencies in word processing, spreadsheets, database and use of the Internet in the classroom by December 30, 2000.
Increase technology integration across the curriculum, districtwide with "technology mentors" leading cooperative learning groups of teachers.
15. Ensure teachers are incorporating technology and helping students use available computer systems by examining students' computerized products in all classrooms with computers available.
Incorporate student-generated computerized products into course requirements across the curriculum and create and maintain campus web pages.
16. The district will continue character education, expand social/community responsibility and increase behavioral accountability to reduce the dropout rate to 1% or less.
Character education program involves the community with countywide rally, PTA involvement and posted character vocabulary on marquees in town.

17. The district will furnish more restrictive behavioral settings for students who need a higher level of structure and discipline referrals will decrease 5% on PEIMS.
Students will be assigned to in-school suspension to improve self control and social/community responsibility.
Students will be assigned or placed by ARD in least restrictive placement in the behavior unit to improve self control and social/community responsibility.
18. A school resource officer will prevent campus violence at the high school and his presence will help decrease assaults and violence by 5% on PEIMS.
A school resource officer will improve student's self control and social/community responsibility.
19. Encourage campus organizations to increase their community involvement by increasing by one the number of involvement events.
Campus organizations will commit to participation in an additional community event this school year.
Establish a weekly "Meet the Teacher" article in the local newspaper.
20. Create a district initiative for professional development for administrators with participation in Leadership 2000 and with development of an individualized professional development plan.
All administrators will write a professional development plan and will meet with the superintendent. Completion of the plan will be part of all administrators' evaluation.
21. Inform all students in grades 6-12 of higher education opportunities in admissions, financial aid, new Texas Grant programs and the opportunity to attend college for those ranked in the top 10 percent.
Notify students in grades 6-12 of the admission opportunities for attending higher education.
Notify students in grades 6-12 of the new financial opportunities for attending higher education through Teach for Texas and TEXAS.
Source: SISD director of Curriculum and Technology.
The superintendent also wants to coordinate the district's improvement initiatives with the budget development process. Before the preparation of the 2000-01 budget, final changes usually occurred in late July or early

August, and the final budget was presented to the board for approval in late August. The process in the past was an incremental process. For example, small changes were permitted within the existing framework but no major overhaul of the assumptions upon which that framework was based was allowed.
With the preparation of the 2000-01 budget, the superintendent began a new process. In mid-February 2000, the business manager sent a budget worksheet to each principal and program director. The principals gave their teachers budget request sheets to complete and return to the principal. The principal then put it all together, made whatever adjustments he/she wanted and submitted it to the business manager by the end of March 2000.
The next step was to hold budget meetings with all principals and program directors during April 2000. The business manager, the campus principal and the superintendent met to review the budget submitted by each campus and program. The use of every staff position was reviewed. Any principal who could not properly justify a staff position lost that position.
The superintendent requested justification for budget requests. If an item could not be justified, funding was reduced. In some cases, funding increased for some line items based upon campus improvement plan strategies. According to the superintendent, the purpose of this approach was to establish an expectation that principals must be knowledgeable about their campus budgets and to ensure principals articulate the need for their programs and educational services in terms of the costs involved.
The business manager then put all the principals' submissions in one document, the superintendent made some adjustments, and presented the first draft to the board in May 2000. Adjustments were made during the summer months as tax data became available and staffing changes were made (for example, retirements, termination). Additional drafts were presented to the board each month during the summer.
The superintendent plans to move the budgeting process toward a program driven, zero-based budgeting process. The first step toward this process was the requirement that all campuses identify all special programs funded with federal or state compensatory education funds in campus improvement plans. This process requires program identification, the number of full-time-equivalent positions allocated to the program, the total dollars allocated for each program and program evaluation strategies.
The superintendent plans to have campus and district improvement plans reviewed in the spring of each year to parallel the budget development process. Improvement plan status reports were initiated in January 2000,
and the superintendent plans to continue to require the campus and district plans to be evaluated for implementation status and those reports shared with the board in January. The implementation status reports will serve as the springboard for an annual spring review of the improvement plans.
The superintendent plans to have improvement strategies drive budget development. Eventually, the superintendent plans to use a budget allocation process in which dollars are allocated to a campus based upon numbers of students and give campus principals and site-based committees the responsibility for deciding how to spend the dollars.
COMMENDATION
SISD is developing a sound planning process that ties budget allocation to district and campus improvement strategies that are designed to increase student performance.
FINDING
In Smithville ISD, some staff members and residents indicate they have limited opportunities for input and legitimate involvement in matters that directly affect them. Some staff members said they felt they were not appreciated or recognized and said that they lacked opportunities for input. This perceived lack of mutual respect and shared responsibility were conveyed through individual comments and focus groups, as quoted below.
• "Teachers need more support as far as being listened to and their views being used."
• "Teachers need to know that they are appreciated." • "The superintendent does not listen or welcome input." • "Teachers need to receive positive feedback." • "Site-based duties: more work, no extra pay and no one listens to
you."
As part of the climate survey (a survey that measures staff morale and staff concerns about the district) that SISD has conducted since the spring of 1998, two questions relate to site-based decision-making:
• "(Do) you participate in the administrative decisions affecting your classroom teaching assignment?"
• "(Do) teachers on your campus have a voice (heard and considered) in the site-base decision-making process?"

In 1999, the average score on the first question was 3.5 based on a range of 1=never, 2=seldom, 3=occasionally, 4=often, and 5=always. The average score on the second question was 3.3.
In the spring of 1998, 53 out of 107 teacher respondents, or 49.5 percent, said that they either often or always participate in the administrative decisions affecting their classroom teaching assignment. Of 116 teacher respondents, 53, or 45.6 percent, said that they either often or always felt that teachers have a voice, which is heard and considered, in the site-based planning and decision-making process on their respective campuses.
In the spring of 1999, 95 out of 159 teacher respondents, or 59.7 percent, said that they either often or always participate in the administrative decisions affecting their classroom teaching assignment. Of 167 respondents, 81, or 48.5 percent, said that they either often or always felt that teachers have a voice, which is heard and considered, in the site-based planning and decision-making process on their respective campus.
In the spring of 2000, 89 out of 158 teacher respondents, or 56.3 percent, said their voice was either heard and considered often or always; 46 teacher respondents, or 29.1 percent, said their voice was heard and considered occasionally; and 28, or 17.7 percent, said their voice was heard and considered either seldom or never.
Districts that are successful in implementing site-based decision-making involve teachers in the decisions. At Weis Middle School in Galveston ISD, according to the teacher who chairs the SBDM committee, the SBDM committee feels like the school is "their school." As a result, "people want to serve on the committee," and this feeling has positively impacted student achievement and teacher morale by the collaborative, participatory atmosphere that it embodies.
According to the principal and the SBDM chair, everyone at the school has "bought into the site-based approach." Budget allocations are determined by the committee based upon district and campus priorities. The principal does not override the decisions of the committee. For example, the issue of whether students at Weis Middle School should wear uniforms was a very heated issue for several years at the school. The principal opposed students wearing uniforms; however, the SBDM approved uniforms for students beginning with the 1999-2000 school year, and the principal implemented the policy.
Recommendation 1:
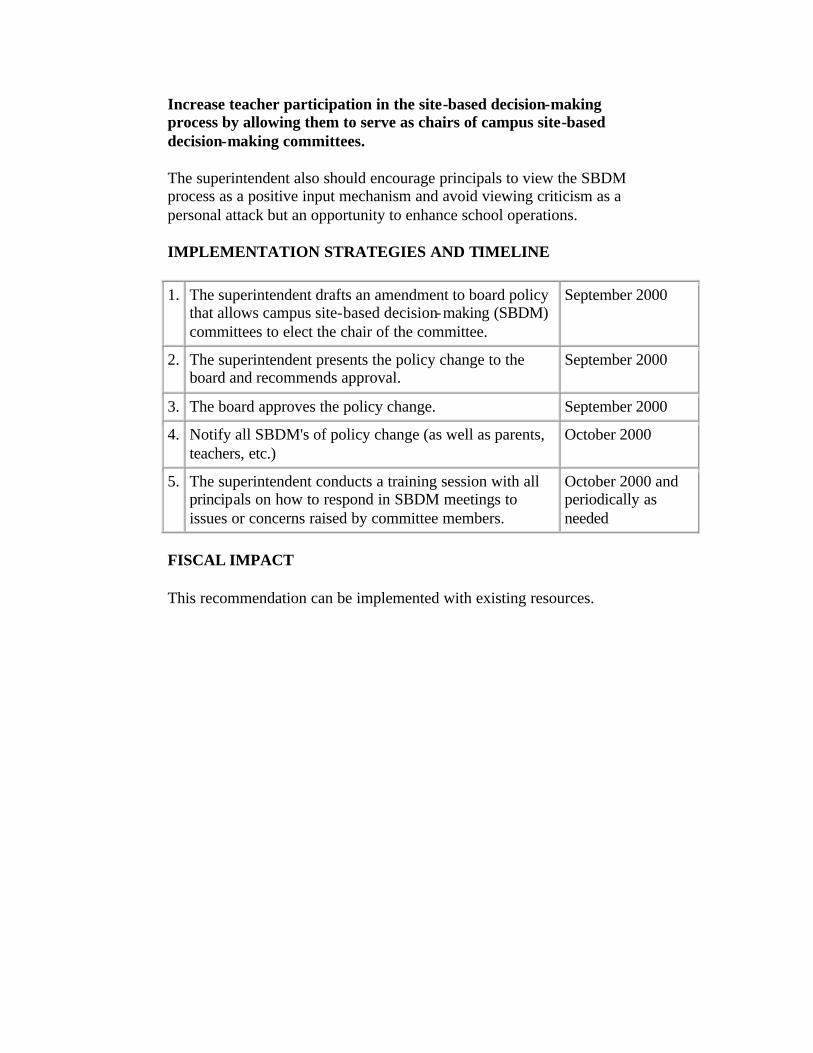
Increase teacher participation in the site-based decision-making process by allowing them to serve as chairs of campus site-based decision-making committees.
The superintendent also should encourage principals to view the SBDM process as a positive input mechanism and avoid viewing criticism as a personal attack but an opportunity to enhance school operations.
IMPLEMENTATION STRATEGIES AND TIMELINE
1. The superintendent drafts an amendment to board policy that allows campus site-based decision-making (SBDM) committees to elect the chair of the committee.
September 2000
2. The superintendent presents the policy change to the board and recommends approval.
September 2000
3. The board approves the policy change. September 2000
4. Notify all SBDM's of policy change (as well as parents, teachers, etc.)
October 2000
5. The superintendent conducts a training session with all principals on how to respond in SBDM meetings to issues or concerns raised by committee members.
October 2000 and periodically as needed
FISCAL IMPACT
This recommendation can be implemented with existing resources.
Chapter 1
A. ORGANIZATION AND STAFFING
SISD is managed by a superintendent and senior staff members who report to the superintendent. As specified by Section 11.201 of the Texas Education Code, the superintendent is primarily responsible for:
• Administrative responsibility for the planning, operation, supervision, and evaluation of the educational programs, services, and facilities of the district and for annual performance appraisals of the staff.
• Administrative authority and responsibility for the assignment and evaluation of all district personnel.
• Termination or suspension of staff members or the nonrenewal of staff members' term contracts.
• Day-to-day management of district operations. • Preparation of district budgets. • Preparation of policy recommendations for the board and
administration of the implementation of adopted policies. • Development of appropriate administrative regulations to
implement board policies. • Leadership in attainment of student performance. • Organization of the district's central administration.
Exhibit 1-4 presents SISD's current organization.
Exhibit 1-4 Current SISD Organization
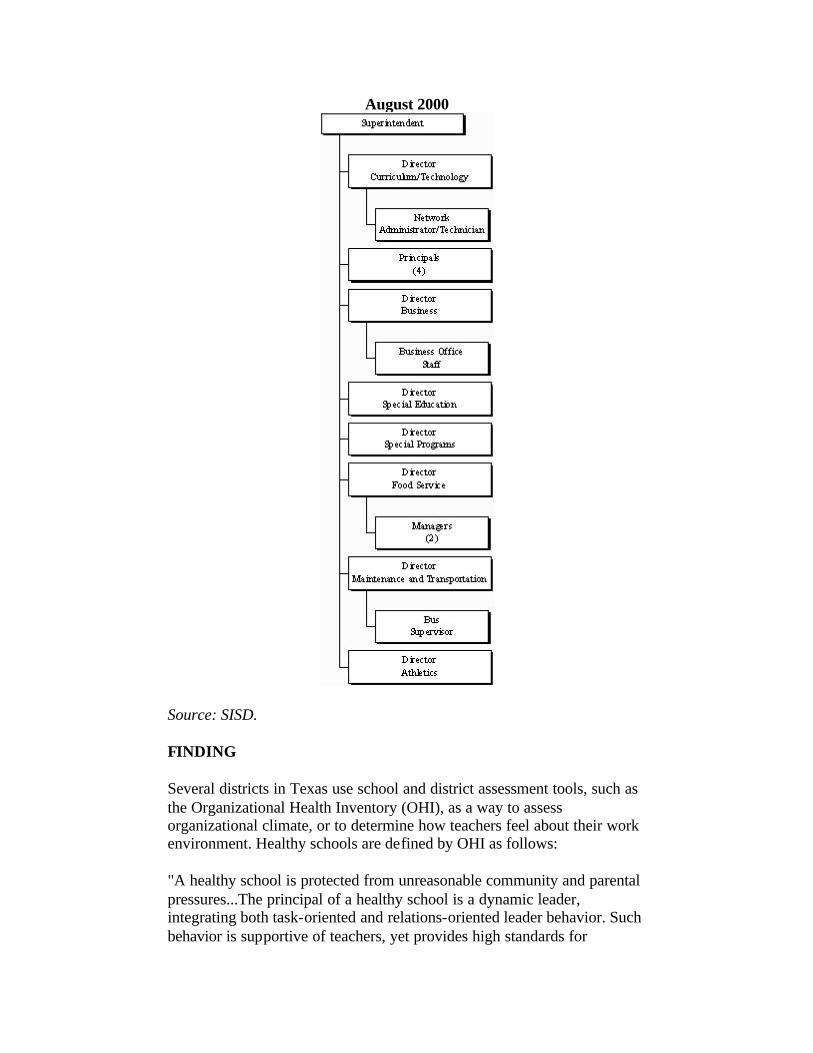
August 2000
Source: SISD.
FINDING
Several districts in Texas use school and district assessment tools, such as the Organizational Health Inventory (OHI), as a way to assess organizational climate, or to determine how teachers feel about their work environment. Healthy schools are defined by OHI as follows:
"A healthy school is protected from unreasonable community and parental pressures...The principal of a healthy school is a dynamic leader, integrating both task-oriented and relations-oriented leader behavior. Such behavior is supportive of teachers, yet provides high standards for

performance...Moreover, the principal has influence with his or her superiors, which is demonstrated by the ability to get what is needed for the effective operation of the school..."
A profile is prepared for each school addressing the areas noted above. Areas of strength, as well as areas that need improvement, are identified and serve as the basis for increasing the effectiveness of a principal as a leader and in strengthening his or her working relationship with teachers, staff and students.
In May 1998, 1999 and 2000, SISD conducted a school climate assessment of each school in SISD using anonymous questionnaires. Teachers and principals completed the survey. The first two were conducted under the administration of the prior superintendent. The May 2000 survey was the first to be conducted under the current superintendent (Exhibit 1-5). The superintendent uses this information in targeting areas for individual school improvement, areas for districtwide improvement and counseling principals.
Exhibit 1-5 Teacher Responses to Climate Survey
May 2000
Prompt/Question Never/Seldom Occasionally Often/Always
School Learning Climate
Positive and optimistic climate 3% 25% 72%
Teaching staff works together as a team
2% 25% 72%
Board decisions in the best interests of students
20% 42% 38%
School Improvement and Vision
Clear common vision for improvement
10% 30% 61%
Instructional changes are data driven
6% 24% 70%
Superintendent leadership for improvement 12% 27% 61%
Parent Communication and Involvement
Effective communication with parents
8% 25% 67%
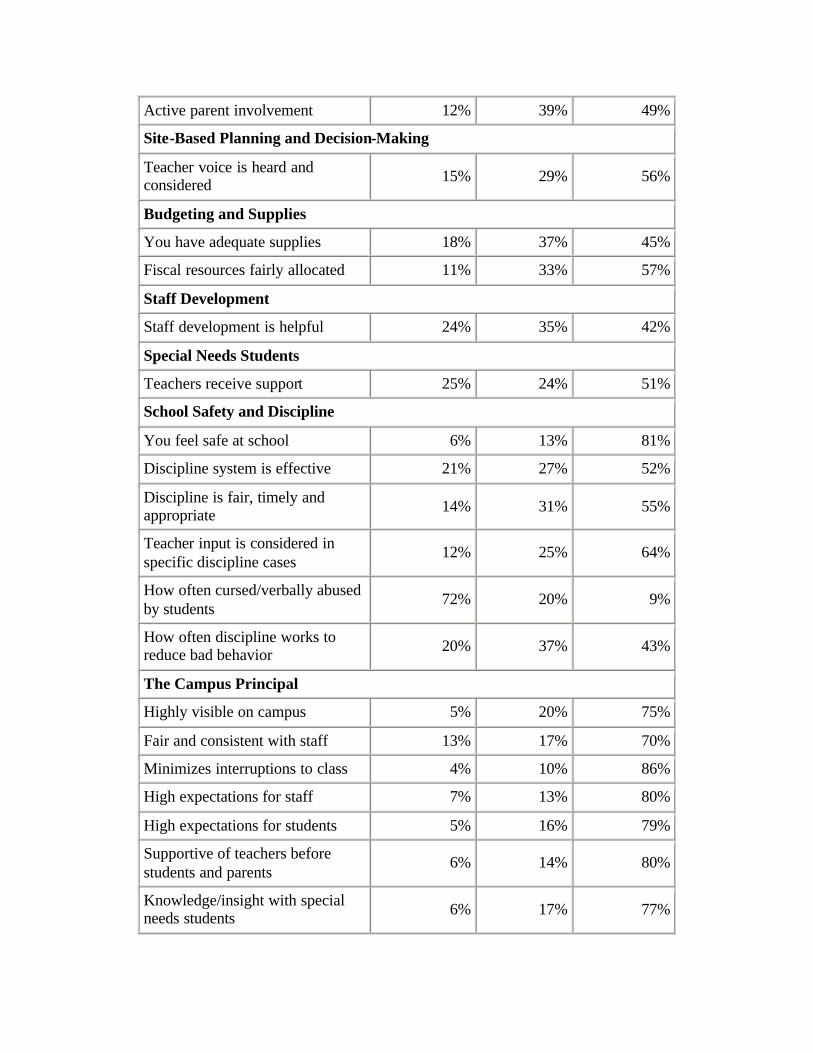
Active parent involvement 12% 39% 49%
Site-Based Planning and Decision-Making
Teacher voice is heard and considered 15% 29% 56%
Budgeting and Supplies
You have adequate supplies 18% 37% 45%
Fiscal resources fairly allocated 11% 33% 57%
Staff Development
Staff development is helpful 24% 35% 42%
Special Needs Students
Teachers receive support 25% 24% 51%
School Safety and Discipline
You feel safe at school 6% 13% 81%
Discipline system is effective 21% 27% 52%
Discipline is fair, timely and appropriate 14% 31% 55%
Teacher input is considered in specific discipline cases
12% 25% 64%
How often cursed/verbally abused by students
72% 20% 9%
How often discipline works to reduce bad behavior 20% 37% 43%
The Campus Principal
Highly visible on campus 5% 20% 75%
Fair and consistent with staff 13% 17% 70%
Minimizes interruptions to class 4% 10% 86%
High expectations for staff 7% 13% 80%
High expectations for students 5% 16% 79%
Supportive of teachers before students and parents
6% 14% 80%
Knowledge/insight with special needs students 6% 17% 77%
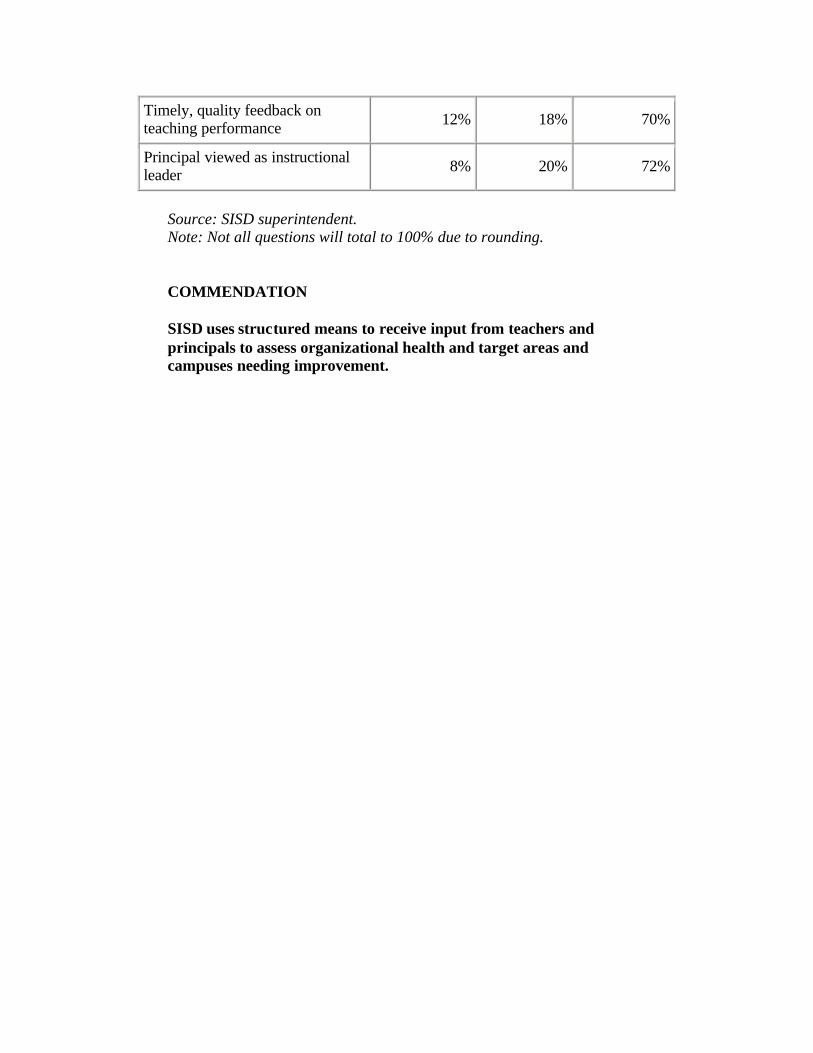
Timely, quality feedback on teaching performance 12% 18% 70%
Principal viewed as instructional leader 8% 20% 72%
Source: SISD superintendent. Note: Not all questions will total to 100% due to rounding.
COMMENDATION
SISD uses structured means to receive input from teachers and principals to assess organizational health and target areas and campuses needing improvement.
Chapter 1
C. PERSONNEL MANAGEMENT
Factors critical to the success of any personnel or human resources function include: recruitment of qualified candidates for all positions; efficient processing of all personnel actions; appropriate staffing, proper salary administration; and compliance with state and federal personnel laws.
In most public school districts, a personnel or human resources office manages employee-related tasks. These tasks include:
• Developing wage and salary schedules; • Administering salary systems that include placing positions on the
salary schedules and periodically reviewing the schedules to ensure they are competitive with area employers;
• Classifying all positions; • Developing job descriptions for all positions and the periodic
update/modification of the job descriptions to reflect changes in responsibilities;
• Developing personnel staffing tables and reviewing staff allocation formulas;
• Administering an employee grievance process; • Recruiting personnel to fill vacant positions; • Maintaining required employee records; • Administering certification and permit processes; • Issuing contracts and nonrenewal or dismissal notices; • Placing substitutes; • Recruiting and placing student teachers; • Developing board policies on personnel issues; • Developing and administering an employee benefits program; and • Preparing periodic reports to comply with local board and state
reporting requirements.
In SISD, the director of Special Programs coordinates recruiting, primarily through the Region 13 Personnel Services Cooperative; the superintendent responds to employee relations issues and employee grievances; the superintendent and the board update personnel policies; and the superintendent and the director of Business manage and update the salary plan. The superintendent's secretary conducts the criminal history checks, relying on information from the Texas Department of Public Safety. The employee benefits coordinator handles the employee health benefit program. The director of Business handles all remaining insurance programs.
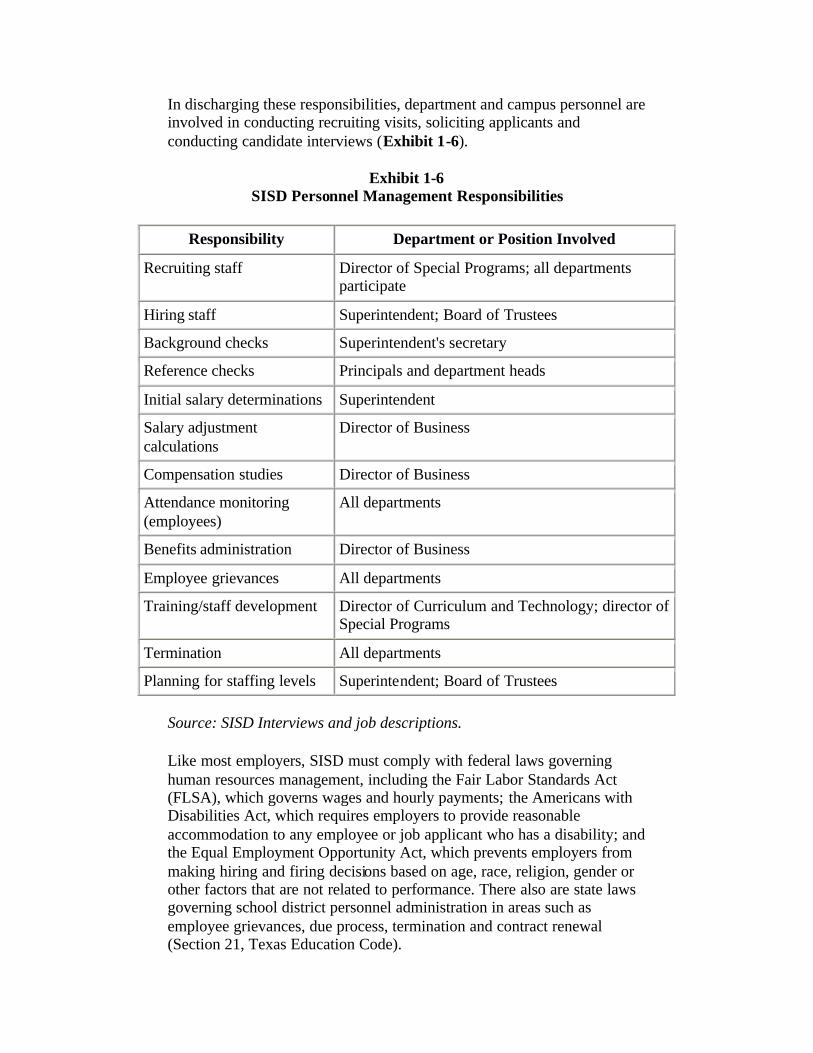
In discharging these responsibilities, department and campus personnel are involved in conducting recruiting visits, soliciting applicants and conducting candidate interviews (Exhibit 1-6).
Exhibit 1-6 SISD Personnel Management Responsibilities
Responsibility Department or Position Involved
Recruiting staff Director of Special Programs; all departments participate
Hiring staff Superintendent; Board of Trustees
Background checks Superintendent's secretary
Reference checks Principals and department heads
Initial salary determinations Superintendent
Salary adjustment calculations
Director of Business
Compensation studies Director of Business
Attendance monitoring (employees)
All departments
Benefits administration Director of Business
Employee grievances All departments
Training/staff development Director of Curriculum and Technology; director of Special Programs
Termination All departments
Planning for staffing levels Superintendent; Board of Trustees
Source: SISD Interviews and job descriptions.
Like most employers, SISD must comply with federal laws governing human resources management, including the Fair Labor Standards Act (FLSA), which governs wages and hourly payments; the Americans with Disabilities Act, which requires employers to provide reasonable accommodation to any employee or job applicant who has a disability; and the Equal Employment Opportunity Act, which prevents employers from making hiring and firing decisions based on age, race, religion, gender or other factors that are not related to performance. There also are state laws governing school district personnel administration in areas such as employee grievances, due process, termination and contract renewal (Section 21, Texas Education Code).
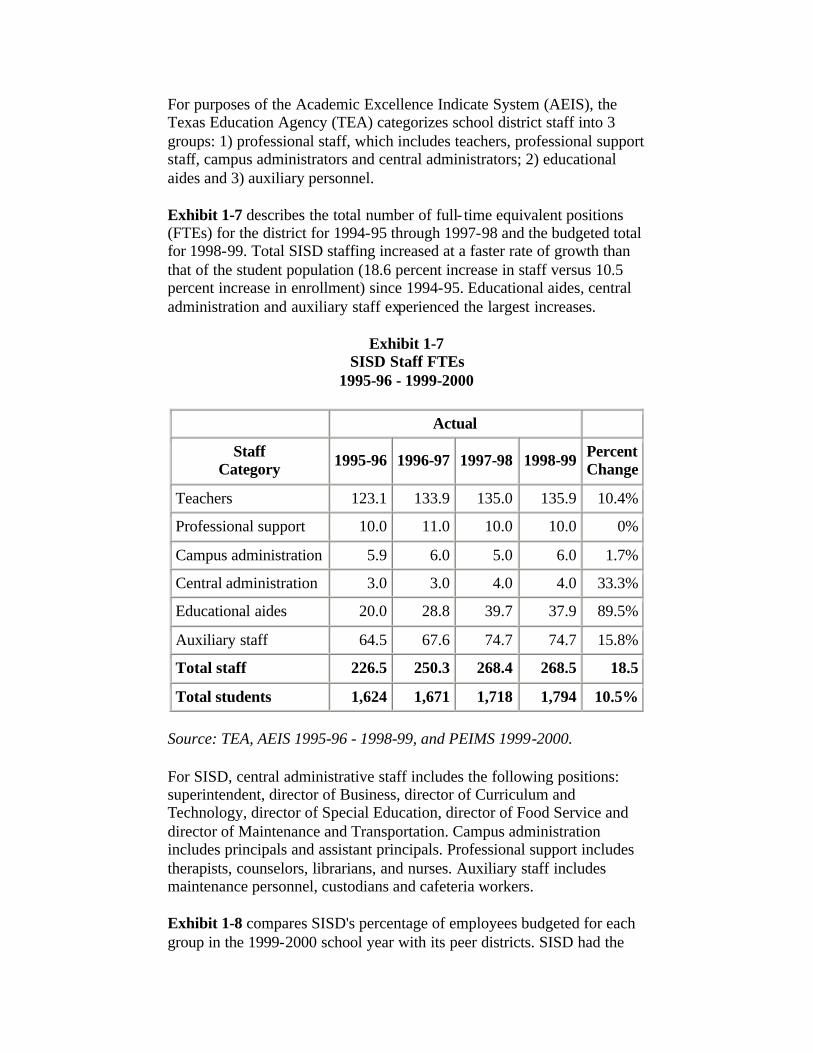
For purposes of the Academic Excellence Indicate System (AEIS), the Texas Education Agency (TEA) categorizes school district staff into 3 groups: 1) professional staff, which includes teachers, professional support staff, campus administrators and central administrators; 2) educational aides and 3) auxiliary personnel.
Exhibit 1-7 describes the total number of full- time equivalent positions (FTEs) for the district for 1994-95 through 1997-98 and the budgeted total for 1998-99. Total SISD staffing increased at a faster rate of growth than that of the student population (18.6 percent increase in staff versus 10.5 percent increase in enrollment) since 1994-95. Educational aides, central administration and auxiliary staff experienced the largest increases.
Exhibit 1-7 SISD Staff FTEs
1995-96 - 1999-2000
Actual
Staff Category 1995-96 1996-97 1997-98 1998-99 Percent
Change
Teachers 123.1 133.9 135.0 135.9 10.4%
Professional support 10.0 11.0 10.0 10.0 0%
Campus administration 5.9 6.0 5.0 6.0 1.7%
Central administration 3.0 3.0 4.0 4.0 33.3%
Educational aides 20.0 28.8 39.7 37.9 89.5%
Auxiliary staff 64.5 67.6 74.7 74.7 15.8%
Total staff 226.5 250.3 268.4 268.5 18.5
Total students 1,624 1,671 1,718 1,794 10.5%
Source: TEA, AEIS 1995-96 - 1998-99, and PEIMS 1999-2000.
For SISD, central administrative staff includes the following positions: superintendent, director of Business, director of Curriculum and Technology, director of Special Education, director of Food Service and director of Maintenance and Transportation. Campus administration includes principals and assistant principals. Professional support includes therapists, counselors, librarians, and nurses. Auxiliary staff includes maintenance personnel, custodians and cafeteria workers.
Exhibit 1-8 compares SISD's percentage of employees budgeted for each group in the 1999-2000 school year with its peer districts. SISD had the

highest percentage of teachers and central office administrators; the second highest percentage of educational aides; and the second lowest percentage of auxiliary staff, professional support staff and campus administrators.
Exhibit 1-8 SISD Staffing Compared to Peer Districts
1999-2000
District Teachers Professional Support
Campus Administrators
Central Administrators
Educational Aides
Auxiliary Staff
Smithville 50.8% 3.7% 2.2% 1.5% 14.2% 27.5%
Bastrop 50.1% 7.3% 2.5% 0.6% 10.6% 28.8%
Columbus 50.1% 5.6% 2.6% 1.3% 14.5% 25.8%
Elgin 50.1% 6.8% 2.3% 1.1% 10.6% 29.1%
La Grange 49.8% 3.0% 2.3% 0.6% 13.7% 30.6%
Source: TEA, PEIMS 1999-2000. Note: Not all rows may total to 100 percent due to rounding.
Any employee required to have a commercial driver's license is subject to drug and alcohol testing. Teachers, coaches and other employees who primarily perform duties other than driving are subject to testing requirements when they are driving. The program is coordinated by the director of Transportation, and tests are administered under contract by Pinnacle for bus drivers and other SISD personnel who drive district vehicles.
All employees are evaluated annually by their immediate supervisor. Written evaluations for all administrator and teacher positions are completed on generic forms prepared by the Texas Education Agency. Evaluations of paraprofessional and auxiliary personnel are completed using forms prepared by the Personnel Department. Each department head is responsible for ensuring evaluations are conducted for all employees annually.
Staff development activities are predominantly handled by the director of Curriculum and Technology and by individual campuses based upon their campus performance objectives.
For each central administration department, the department head allocates a training budget annually based upon historical usage or requests for
specific training. The department head recommends appropriate training for staff personnel and refers it to the appropriate senior staff member.
The Texas Association of School Boards completed a compensation study for SISD in March 2000. The study recommended a pay structure, salary schedules, changes in administrative practices, job classifications and implementation alternatives for all administrative, professional, paraprofessional and manual trades positions. The district plans to implement the recommendations beginning with the 2000-01 school year.
Salary supplements are provided to individuals assuming additional duties, such as Academic Decathlon advisor, debate sponsor, band director, cheerleader sponsor or other responsibilities.
Group insurance is available to all full-time employees and includes: health, dental, life, supplemental life, workers' compensation, unemployment compensation and cafeteria plan coverage. Before annual enrollment, each employee receives an information packet on the available coverages, options and the related costs. The district makes an annual contribution to cover a portion of the insurance premium cost.
Humana is the care provider network used by SISD. The benefit plan is coordinated by the benefits coordinator, who reports to the director of Business. Other employee benefits, such as personal leave, sick leave, local leave, temporary disability, family and medical leave, military leave and compensation for jury duty also are provided to employees. These benefits are described in the employee handbook issued to each employee annually.
The district maintains a set of personnel policies and updates them in accordance with changes mandated by the federal and state governments and Texas Education Agency (TEA). Each employee annually receives an employee handbook that reflects all current SISD personnel policies. Each employee must sign indicating his/her receipt of the handbook. Copies of the signed sheets are maintained at each campus and at work sites.
An external vendor conducts criminal history reviews for all positions. The district contracts with the Texas Department of Public Safety for this service.
FINDING
SISD is a member of the Personnel Services Cooperative of Central Texas that is managed by Region 13. Started in 1997-98, the cooperative has 25 member school districts: Smithville, Burnet, Comal, Del Valle, Eanes, Elgin, Gonzales, Hays, Hutto, Johnson City, Lago Vista, Lake Travis,

Lexington, Liberty Hill, Luling, Manor, New Braunfels, Pflugerville, Round Rock, Round Top-Carmine, San Marcos, Schertz-Cibolo-Universal City, Smithville, Taylor and Waco.
The purpose of the cooperative is to assist school districts with recruiting, selecting and hiring teachers. According to the cooperative director, the cooperative has several advantages: reduction in paper due to an almost entirely electronic application and distribution process; decreased staff time associated with recruitment and applicant processing; increased number of applicants from what a district could generate itself; and information availability seven days per week, 24 hours per day. SISD fills 15-20 teacher vacancies each year.
Each district pays a one-time membership fee and an annual maintenance fee. Both fees are based upon average daily student attendance (Exhibit 1-9). SISD paid an initial membership fee of $4,000 in 1997-98 and pays $5,000 per year as its maintenance fee.
Exhibit 1-9 Region 13 Personnel Services Cooperative Fee Schedule
1999-2000
Average Daily Attendance (ADA)
Membership Fee
Maintenance Fee
Less than 500 $1,500 $1,500
501-1,000 $2,500 $2,500
1,001-1,500 $3,000 $3,000
1,501-2,000 $4,000 $5,000
2,001-3,000 $5,000 $6,500
3,001-4,000 $6,000 $7,500
4,001-7,000 $7,500 $10,000
7,001-12,000 $10,000 $12,500
12,001-30,000 $12,500 $15,000
30,001+ $0.40/ADA $1.00/ADA
Source: Region 13 Personnel Services Cooperative director.
The member districts receive a number of brochures each Spring to take with them on recruiting trips. The brochure describes how the cooperative works, details how to apply and provides one page of information on each
member district, such as location, number of school and their accountability rating, awards/distinctions and salary ranges
Member districts distribute the brochures at each college or university recruiting trip or at each job fair they attend. Member districts also may distribute addit ional information about their district.
Interested applicants complete a resume in a prescribed format, which they submit to the cooperative. Guidelines for completing the resume are provided in the cooperative's brochure. In completing the resume, applicants are encouraged to be as specific as possible about the types of positions in which they are interested. As of May 2000, the cooperative had received 4,500 applications compared to 3,000 at the same time the prior year.
Once a resume is received and scanned into the system, the system generates letters to the candidates. The letters thank the applicants for their interest in the cooperative and provide the name of each member district and an identification number. The applicant is instructed to call an 800 number and participate in a 25-minute, automated, telephone interview. The questions in the interview were prepared by the human resource staffs of the member districts based upon what criteria they believed were most important.
Interactive voice recognition (IVR) software is used to ask the questions, score each response and assign a point total to the candidate. At the conclusion of the interview, the applicant is asked to select, using the identification number provided in the thank you letter they received, which districts they want their information to be available. According to the director, one-third of the applicants select all cooperative members.
When the telephone call is completed, the applicant's portfolio is complete.
Each member district completes a written requisition form, which can be updated regularly, that identifies vacancies in the district with qualifications for each position. The cooperative uses Resumix software to match words in the requisition with like words in the resumes of applicants. From that match, a district can select all the applicants who qualify for a vacant position that selected that district, or the district can select only those with a given point total or above on the IVR interview.
According to the director of the cooperative, 4,516 resumes were received through April 30, 2,000 for applicants looking for teaching positions for the 2000-01 school year. Of that total, 21 percent of the applicants were from outside of Texas, for example, at locations that cooperative members
would seldom, if ever, visit on recruiting trips. This percentage is more than double those received from out-of-state applicants the prior year. According to the director, this increase is due to two factors: the cooperative is recruiting in more non-Texas locations, and it is using an electronic resume builder on its Web site.
COMMENDATION
SISD uses the Region 13 Personnel Services Cooperative to expand the availability of teacher applicants.
Chapter 1
D. COMMUNITY AND PARENTAL INVOLVMENT
School districts are a vital part of communities, especially small communities. Providing accurate and timely information to the public builds positive relationships with parents, area businesses, civic and faith organizations and other citizens. Accurate information allows the citizens to draw conclusions and make decisions based on fact rather than rumor and gossip. An effective school district not only communicates its goals and accomplishments, but also solicits input from the community to establish its goals. The manner in which school districts perform this function affects how the public views the district.
Districts vary widely in how they involve the community in district activities and how they keep them informed of district activities. Newsletters, town hall meetings, cable television programs, the Internet, school calendars, brochures and inserts in news media published by other entities are some of the methods that districts use to communicate with parents and other community members.
In SISD, the superintendent and campus administrators are responsible for communications outreach to public.
The superintendent publishes the SISD Parent~Student Information Guide and mails the guide to all parents and citizens of SISD each August. This publication is a 20-page newsprint document, which contains general information on policies, procedures, activities and opportunities for community involvement. Sections on specific campus information, the Student Code of Conduct, sports schedules and the school calendar are included. Pictures of students in various activities are featured throughout the guide. This publication is mailed to all parents and citizens of SISD.
Each SISD campus publishes some type of newsletter. Brown Primary Booster Club publishes Booster Club News each month. This newsletter reports the activities of the Booster Club and provides a calendar of upcoming events at the school. Booster Club News is distributed through the school to all parents. Smithville Junior High publishes and distributes Just a Minute ***Tiger Pause for the News four times each year. This flyer reports on accomplishments of students and activities at the school and is given to the students to take home. At Smithville High School, the Business Computer Information Systems (BCIS) classes publish the Tiger Times, a school newsletter.
SISD publishes a Curriculum Catalog that lists the credit requirements for the different graduation plans, details Career Pathways (a sequence of courses for career preparation), explains advanced measures, provides a sample four-year plan and lists and describes all courses offered. The high school counselors provide this publication to parents and students.
The superintendent and other administrators are active in several community organizations. School district news can be provided as part of the program at these meetings. The superintendent is on the program at the Smithville Lions Club frequently to provide information on the school district. He is also a member of the Chamber of Commerce.
FINDING
SISD disseminates extensive information through its Web site on the Internet and on the local cable channel. The Web site contains an overview of the district, the district's mission, a list of board members, board agendas, board briefs, SISD accountability ratings, the school calendar, a list of administrators, e-mail addresses of all staff, Character Education Program traits and specific campus information. Homework guidelines with strategies for teachers and parents are posted on the site. The superintendent updates the information each week.
Board meeting notices, board briefs, lunch menus, the character traits of the month from the Character Education Program and parenting tips are part of the information disseminated on the cable channel.
COMMENDATION
The district's use of the Internet and cable provides an effective way to disseminate information in a very cost-efficient, timely manner.
FINDING
SISD enjoys a positive relationship with the local newspaper, The Smithville Times. Each week, the paper spotlights a SISD teacher. Several pages include stories and pictures of student accomplishments in academics and sports. These pages are titled "Education-Youth," "Tiger Pride," "Tiger Sports" and "Smithville Proud."
COMMENDATION
Partnering with the local weekly newspaper is an excellent way to reach a large number of parents and other interested parties.
FINDING
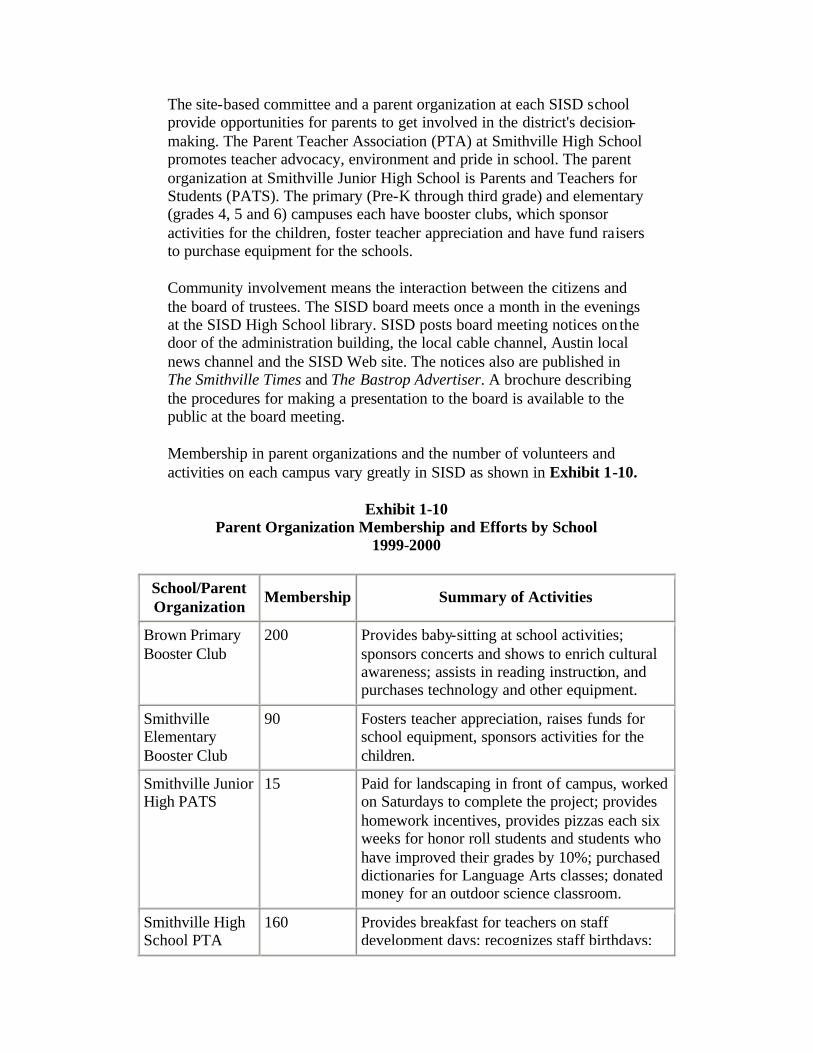
The site-based committee and a parent organization at each SISD school provide opportunities for parents to get involved in the district's decision-making. The Parent Teacher Association (PTA) at Smithville High School promotes teacher advocacy, environment and pride in school. The parent organization at Smithville Junior High School is Parents and Teachers for Students (PATS). The primary (Pre-K through third grade) and elementary (grades 4, 5 and 6) campuses each have booster clubs, which sponsor activities for the children, foster teacher appreciation and have fund raisers to purchase equipment for the schools.
Community involvement means the interaction between the citizens and the board of trustees. The SISD board meets once a month in the evenings at the SISD High School library. SISD posts board meeting notices on the door of the administration building, the local cable channel, Austin local news channel and the SISD Web site. The notices also are published in The Smithville Times and The Bastrop Advertiser. A brochure describing the procedures for making a presentation to the board is available to the public at the board meeting.
Membership in parent organizations and the number of volunteers and activities on each campus vary greatly in SISD as shown in Exhibit 1-10.
Exhibit 1-10 Parent Organization Membership and Efforts by School
1999-2000
School/Parent Organization
Membership Summary of Activities
Brown Primary Booster Club
200 Provides baby-sitting at school activities; sponsors concerts and shows to enrich cultural awareness; assists in reading instruction, and purchases technology and other equipment.
Smithville Elementary Booster Club
90 Fosters teacher appreciation, raises funds for school equipment, sponsors activities for the children.
Smithville Junior High PATS
15 Paid for landscaping in front of campus, worked on Saturdays to complete the project; provides homework incentives, provides pizzas each six weeks for honor roll students and students who have improved their grades by 10%; purchased dictionaries for Language Arts classes; donated money for an outdoor science classroom.
Smithville High School PTA
160 Provides breakfast for teachers on staff development days; recognizes staff birthdays;
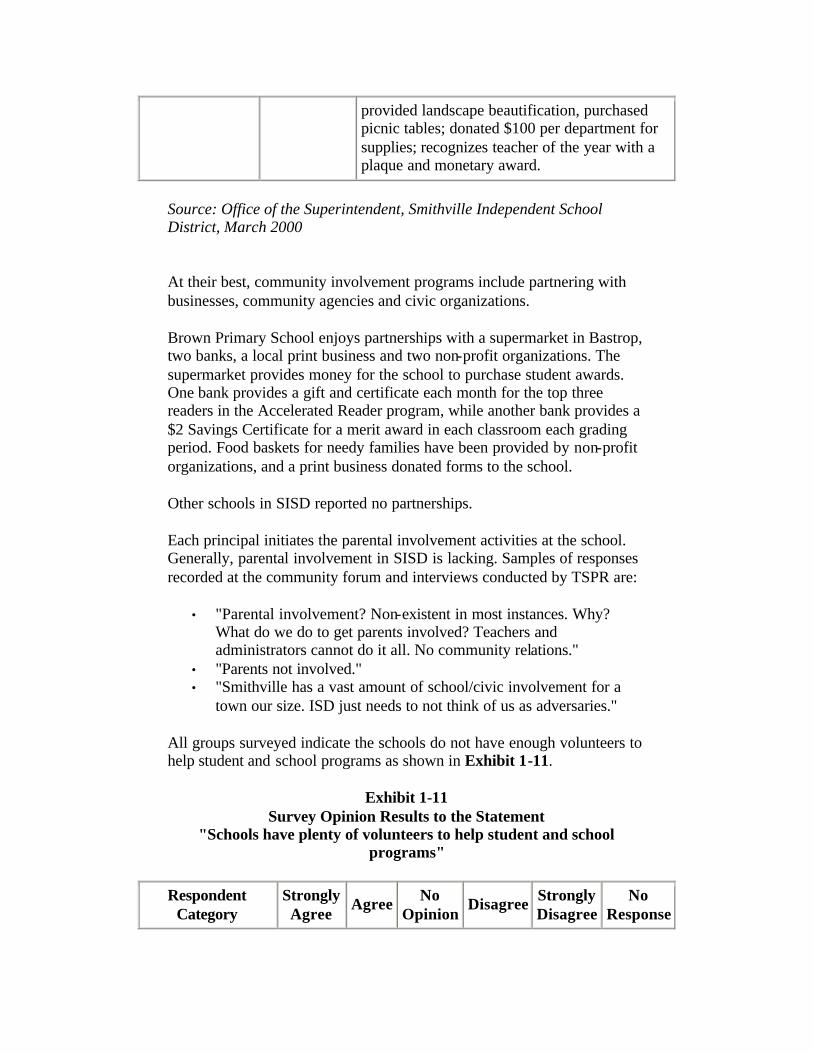
provided landscape beautification, purchased picnic tables; donated $100 per department for supplies; recognizes teacher of the year with a plaque and monetary award.
Source: Office of the Superintendent, Smithville Independent School District, March 2000
At their best, community involvement programs include partnering with businesses, community agencies and civic organizations.
Brown Primary School enjoys partnerships with a supermarket in Bastrop, two banks, a local print business and two non-profit organizations. The supermarket provides money for the school to purchase student awards. One bank provides a gift and certificate each month for the top three readers in the Accelerated Reader program, while another bank provides a $2 Savings Certificate for a merit award in each classroom each grading period. Food baskets for needy families have been provided by non-profit organizations, and a print business donated forms to the school.
Other schools in SISD reported no partnerships.
Each principal initiates the parental involvement activities at the school. Generally, parental involvement in SISD is lacking. Samples of responses recorded at the community forum and interviews conducted by TSPR are:
• "Parental involvement? Non-existent in most instances. Why? What do we do to get parents involved? Teachers and administrators cannot do it all. No community relations."
• "Parents not involved." • "Smithville has a vast amount of school/civic involvement for a
town our size. ISD just needs to not think of us as adversaries."
All groups surveyed indicate the schools do not have enough volunteers to help student and school programs as shown in Exhibit 1-11.
Exhibit 1-11 Survey Opinion Results to the Statement
"Schools have plenty of volunteers to help student and school programs"
Respondent Category
Strongly Agree
Agree No Opinion
Disagree Strongly Disagree
No Response
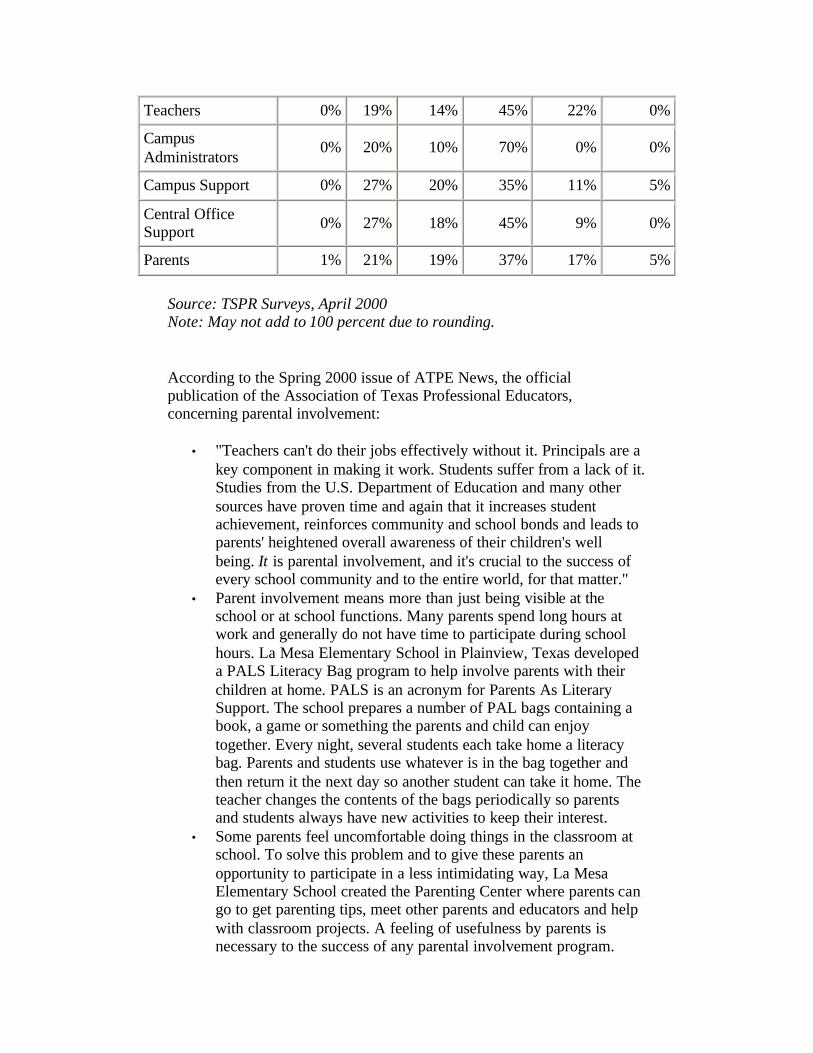
Teachers 0% 19% 14% 45% 22% 0%
Campus Administrators
0% 20% 10% 70% 0% 0%
Campus Support 0% 27% 20% 35% 11% 5%
Central Office Support 0% 27% 18% 45% 9% 0%
Parents 1% 21% 19% 37% 17% 5%
Source: TSPR Surveys, April 2000 Note: May not add to 100 percent due to rounding.
According to the Spring 2000 issue of ATPE News, the official publication of the Association of Texas Professional Educators, concerning parental involvement:
• "Teachers can't do their jobs effectively without it. Principals are a key component in making it work. Students suffer from a lack of it. Studies from the U.S. Department of Education and many other sources have proven time and again that it increases student achievement, reinforces community and school bonds and leads to parents' heightened overall awareness of their children's well being. It is parental involvement, and it's crucial to the success of every school community and to the entire world, for that matter."
• Parent involvement means more than just being visible at the school or at school functions. Many parents spend long hours at work and generally do not have time to participate during school hours. La Mesa Elementary School in Plainview, Texas developed a PALS Literacy Bag program to help involve parents with their children at home. PALS is an acronym for Parents As Literary Support. The school prepares a number of PAL bags containing a book, a game or something the parents and child can enjoy together. Every night, several students each take home a literacy bag. Parents and students use whatever is in the bag together and then return it the next day so another student can take it home. The teacher changes the contents of the bags periodically so parents and students always have new activities to keep their interest.
• Some parents feel uncomfortable doing things in the classroom at school. To solve this problem and to give these parents an opportunity to participate in a less intimidating way, La Mesa Elementary School created the Parenting Center where parents can go to get parenting tips, meet other parents and educators and help with classroom projects. A feeling of usefulness by parents is necessary to the success of any parental involvement program.
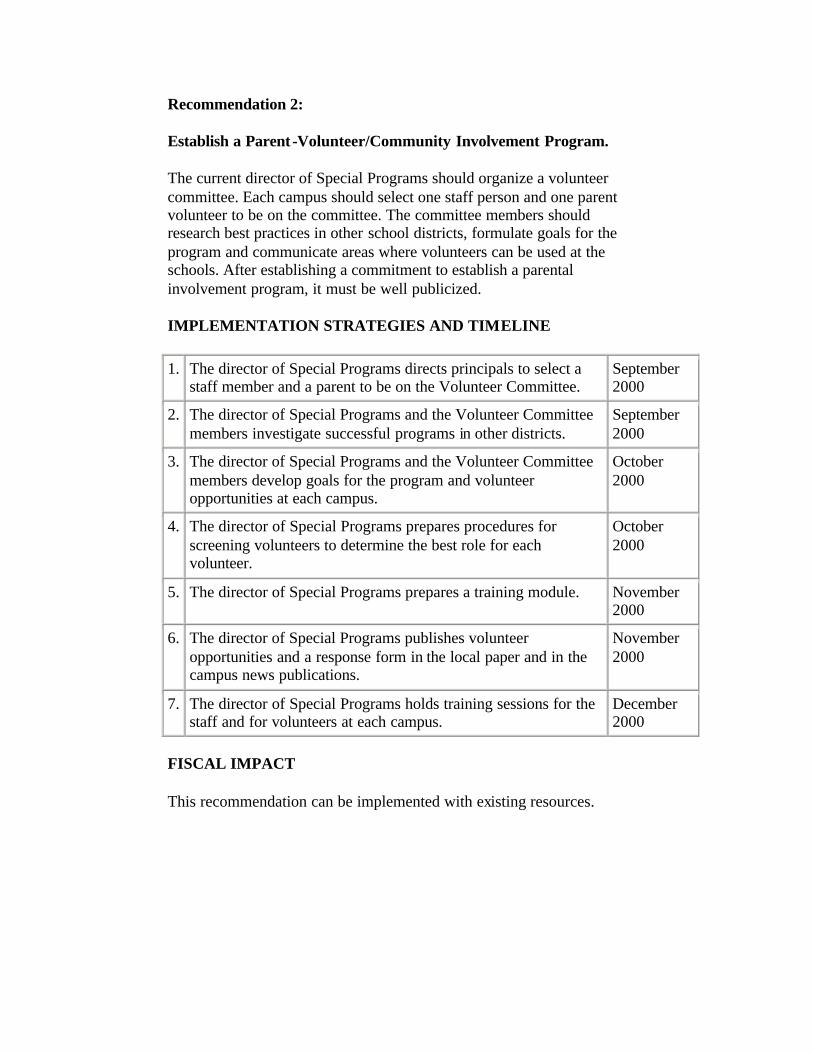
Recommendation 2:
Establish a Parent-Volunteer/Community Involvement Program.
The current director of Special Programs should organize a volunteer committee. Each campus should select one staff person and one parent volunteer to be on the committee. The committee members should research best practices in other school districts, formulate goals for the program and communicate areas where volunteers can be used at the schools. After establishing a commitment to establish a parental involvement program, it must be well publicized.
IMPLEMENTATION STRATEGIES AND TIMELINE
1. The director of Special Programs directs principals to select a staff member and a parent to be on the Volunteer Committee.
September 2000
2. The director of Special Programs and the Volunteer Committee members investigate successful programs in other districts.
September 2000
3. The director of Special Programs and the Volunteer Committee members develop goals for the program and volunteer opportunities at each campus.
October 2000
4. The director of Special Programs prepares procedures for screening volunteers to determine the best role for each volunteer.
October 2000
5. The director of Special Programs prepares a training module. November 2000
6. The director of Special Programs publishes volunteer opportunities and a response form in the local paper and in the campus news publications.
November 2000
7. The director of Special Programs holds training sessions for the staff and for volunteers at each campus.
December 2000
FISCAL IMPACT
This recommendation can be implemented with existing resources.
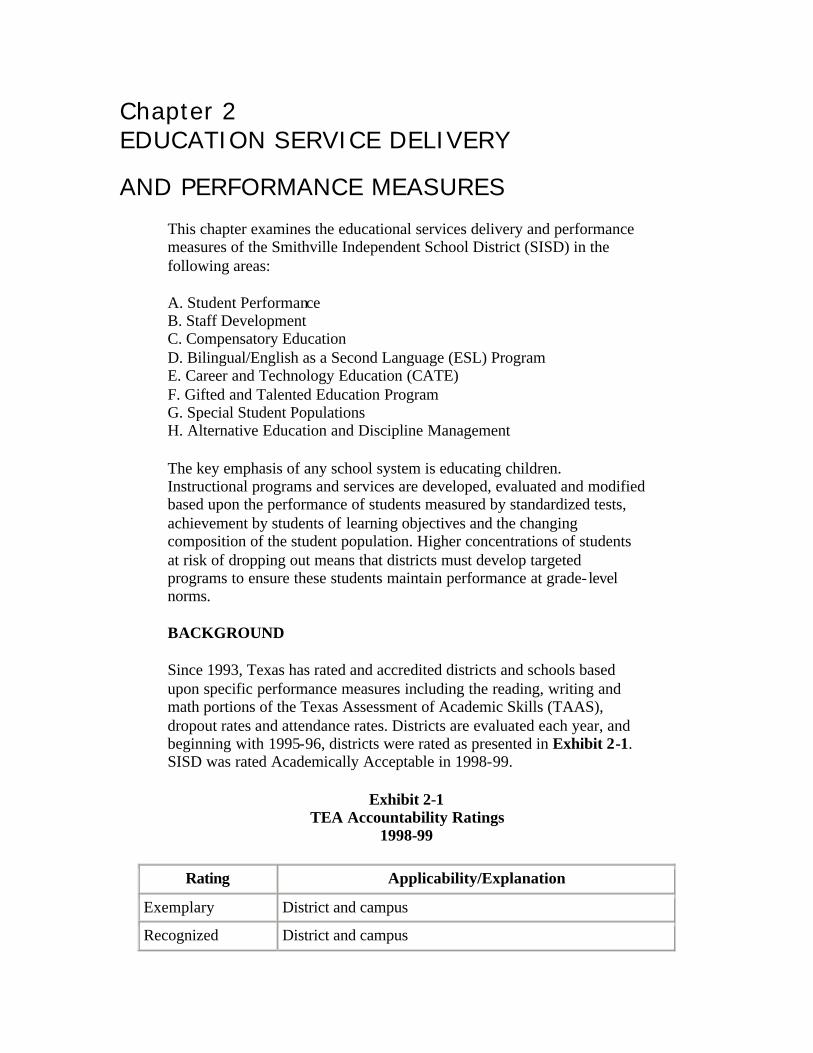
Chapter 2
EDUCATION SERVICE DELIVERY
AND PERFORMANCE MEASURES
This chapter examines the educational services delivery and performance measures of the Smithville Independent School District (SISD) in the following areas:
A. Student Performance B. Staff Development C. Compensatory Education D. Bilingual/English as a Second Language (ESL) Program E. Career and Technology Education (CATE) F. Gifted and Talented Education Program G. Special Student Populations H. Alternative Education and Discipline Management
The key emphasis of any school system is educating children. Instructional programs and services are developed, evaluated and modified based upon the performance of students measured by standardized tests, achievement by students of learning objectives and the changing composition of the student population. Higher concentrations of students at risk of dropping out means that districts must develop targeted programs to ensure these students maintain performance at grade- level norms.
BACKGROUND
Since 1993, Texas has rated and accredited districts and schools based upon specific performance measures including the reading, writing and math portions of the Texas Assessment of Academic Skills (TAAS), dropout rates and attendance rates. Districts are evaluated each year, and beginning with 1995-96, districts were rated as presented in Exhibit 2-1. SISD was rated Academically Acceptable in 1998-99.
Exhibit 2-1 TEA Accountability Ratings
1998-99
Rating Applicability/Explanation
Exemplary District and campus
Recognized District and campus
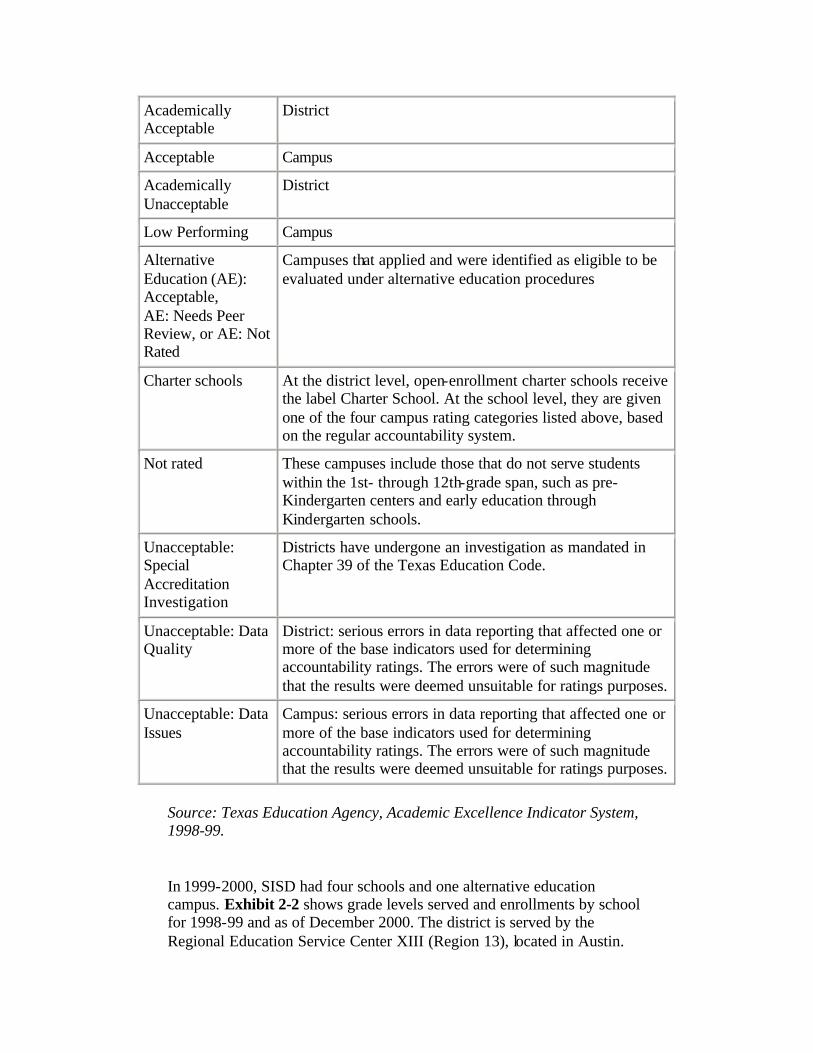
Academically Acceptable
District
Acceptable Campus
Academically Unacceptable
District
Low Performing Campus
Alternative Education (AE): Acceptable, AE: Needs Peer Review, or AE: Not Rated
Campuses that applied and were identified as eligible to be evaluated under alternative education procedures
Charter schools At the district level, open-enrollment charter schools receive the label Charter School. At the school level, they are given one of the four campus rating categories listed above, based on the regular accountability system.
Not rated These campuses include those that do not serve students within the 1st- through 12th-grade span, such as pre-Kindergarten centers and early education through Kindergarten schools.
Unacceptable: Special Accreditation Investigation
Districts have undergone an investigation as mandated in Chapter 39 of the Texas Education Code.
Unacceptable: Data Quality
District: serious errors in data reporting that affected one or more of the base indicators used for determining accountability ratings. The errors were of such magnitude that the results were deemed unsuitable for ratings purposes.
Unacceptable: Data Issues
Campus: serious errors in data reporting that affected one or more of the base indicators used for determining accountability ratings. The errors were of such magnitude that the results were deemed unsuitable for ratings purposes.
Source: Texas Education Agency, Academic Excellence Indicator System, 1998-99.
In 1999-2000, SISD had four schools and one alternative education campus. Exhibit 2-2 shows grade levels served and enrollments by school for 1998-99 and as of December 2000. The district is served by the Regional Education Service Center XIII (Region 13), located in Austin.
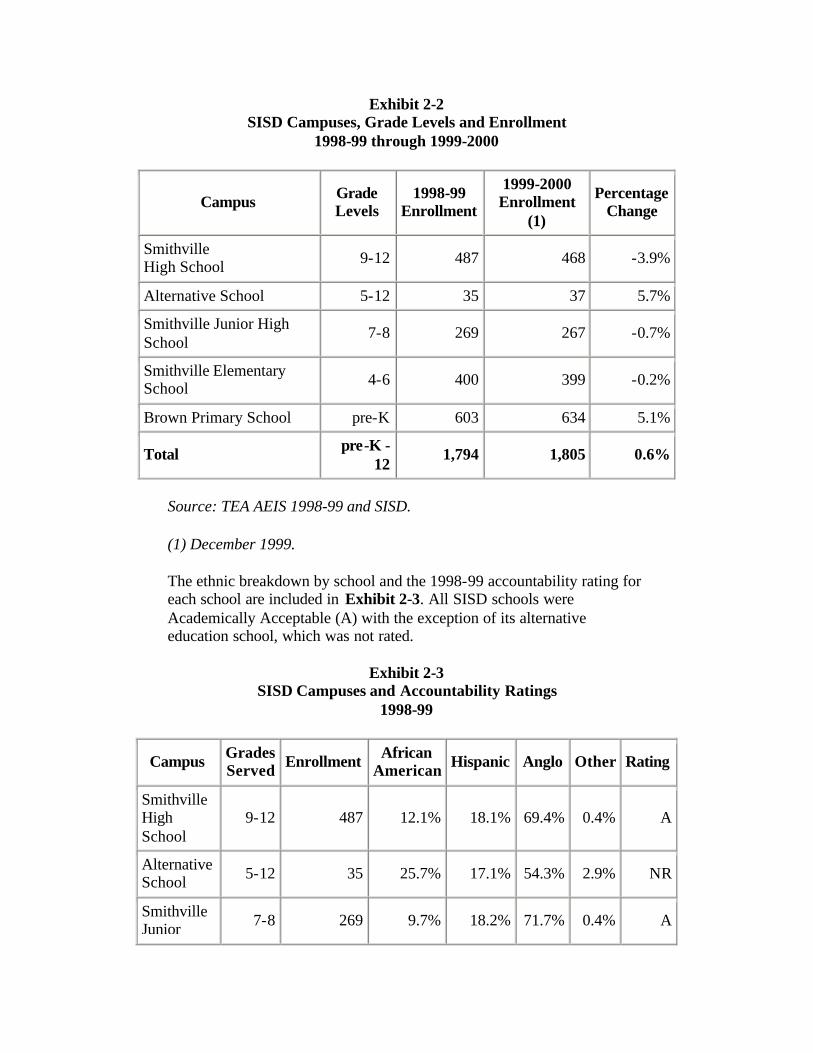
Exhibit 2-2 SISD Campuses, Grade Levels and Enrollment
1998-99 through 1999-2000
Campus Grade Levels
1998-99 Enrollment
1999-2000 Enrollment
(1)
Percentage Change
Smithville High School 9-12 487 468 -3.9%
Alternative School 5-12 35 37 5.7%
Smithville Junior High School
7-8 269 267 -0.7%
Smithville Elementary School 4-6 400 399 -0.2%
Brown Primary School pre-K 603 634 5.1%
Total pre-K - 12
1,794 1,805 0.6%
Source: TEA AEIS 1998-99 and SISD.
(1) December 1999.
The ethnic breakdown by school and the 1998-99 accountability rating for each school are included in Exhibit 2-3. All SISD schools were Academically Acceptable (A) with the exception of its alternative education school, which was not rated.
Exhibit 2-3 SISD Campuses and Accountability Ratings
1998-99
Campus Grades Served Enrollment African
American Hispanic Anglo Other Rating
Smithville High School
9-12 487 12.1% 18.1% 69.4% 0.4% A
Alternative School 5-12 35 25.7% 17.1% 54.3% 2.9% NR
Smithville Junior 7-8 269 9.7% 18.2% 71.7% 0.4% A
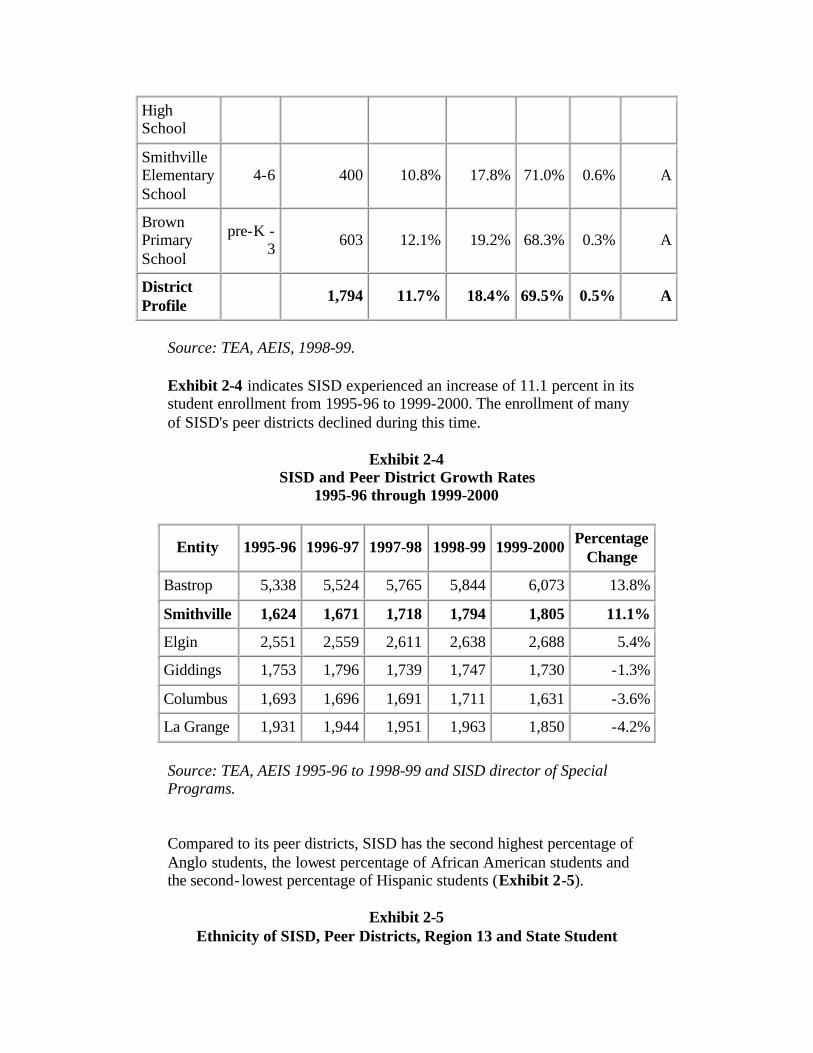
High School
Smithville Elementary School
4-6 400 10.8% 17.8% 71.0% 0.6% A
Brown Primary School
pre-K - 3 603 12.1% 19.2% 68.3% 0.3% A
District Profile
1,794 11.7% 18.4% 69.5% 0.5% A
Source: TEA, AEIS, 1998-99.
Exhibit 2-4 indicates SISD experienced an increase of 11.1 percent in its student enrollment from 1995-96 to 1999-2000. The enrollment of many of SISD's peer districts declined during this time.
Exhibit 2-4 SISD and Peer District Growth Rates
1995-96 through 1999-2000
Entity 1995-96 1996-97 1997-98 1998-99 1999-2000 Percentage Change
Bastrop 5,338 5,524 5,765 5,844 6,073 13.8%
Smithville 1,624 1,671 1,718 1,794 1,805 11.1%
Elgin 2,551 2,559 2,611 2,638 2,688 5.4%
Giddings 1,753 1,796 1,739 1,747 1,730 -1.3%
Columbus 1,693 1,696 1,691 1,711 1,631 -3.6%
La Grange 1,931 1,944 1,951 1,963 1,850 -4.2%
Source: TEA, AEIS 1995-96 to 1998-99 and SISD director of Special Programs.
Compared to its peer districts, SISD has the second highest percentage of Anglo students, the lowest percentage of African American students and the second- lowest percentage of Hispanic students (Exhibit 2-5).
Exhibit 2-5 Ethnicity of SISD, Peer Districts, Region 13 and State Student
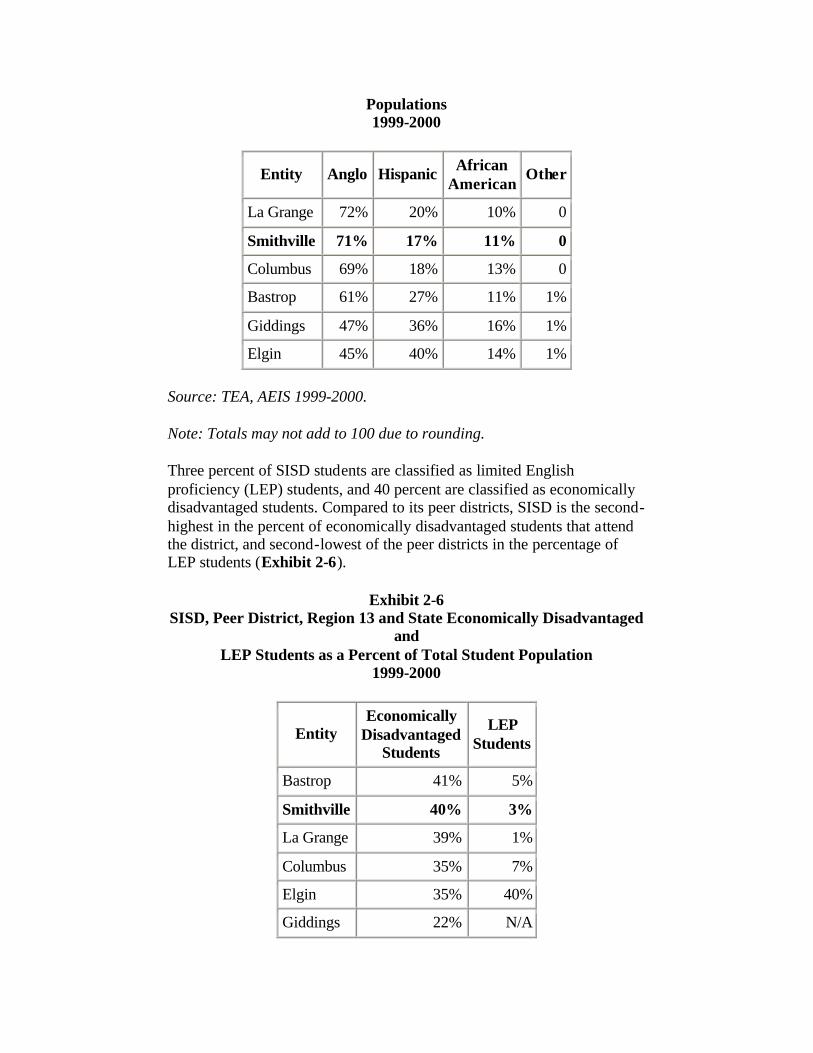
Populations 1999-2000
Entity Anglo Hispanic African American
Other
La Grange 72% 20% 10% 0
Smithville 71% 17% 11% 0
Columbus 69% 18% 13% 0
Bastrop 61% 27% 11% 1%
Giddings 47% 36% 16% 1%
Elgin 45% 40% 14% 1%
Source: TEA, AEIS 1999-2000.
Note: Totals may not add to 100 due to rounding.
Three percent of SISD students are classified as limited English proficiency (LEP) students, and 40 percent are classified as economically disadvantaged students. Compared to its peer districts, SISD is the second-highest in the percent of economically disadvantaged students that attend the district, and second-lowest of the peer districts in the percentage of LEP students (Exhibit 2-6).
Exhibit 2-6 SISD, Peer District, Region 13 and State Economically Disadvantaged
and LEP Students as a Percent of Total Student Population
1999-2000
Entity Economically
Disadvantaged Students
LEP Students
Bastrop 41% 5%
Smithville 40% 3%
La Grange 39% 1%
Columbus 35% 7%
Elgin 35% 40%
Giddings 22% N/A
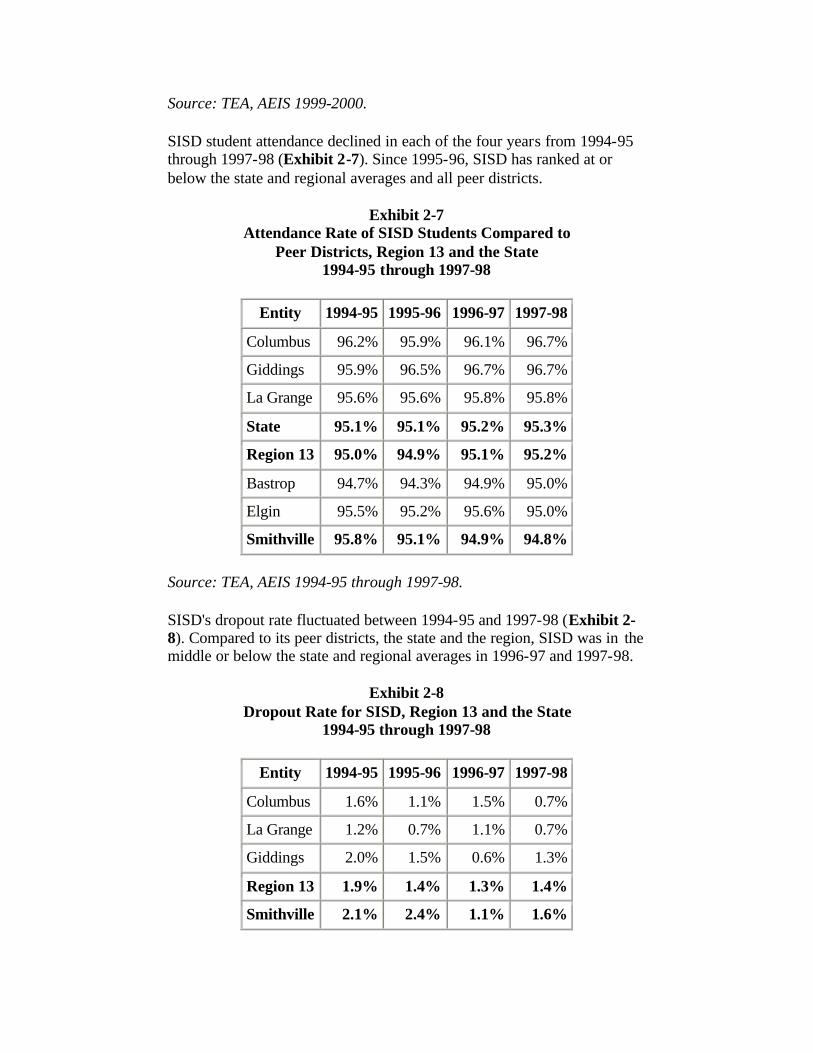
Source: TEA, AEIS 1999-2000.
SISD student attendance declined in each of the four years from 1994-95 through 1997-98 (Exhibit 2-7). Since 1995-96, SISD has ranked at or below the state and regional averages and all peer districts.
Exhibit 2-7 Attendance Rate of SISD Students Compared to
Peer Districts, Region 13 and the State 1994-95 through 1997-98
Entity 1994-95 1995-96 1996-97 1997-98
Columbus 96.2% 95.9% 96.1% 96.7%
Giddings 95.9% 96.5% 96.7% 96.7%
La Grange 95.6% 95.6% 95.8% 95.8%
State 95.1% 95.1% 95.2% 95.3%
Region 13 95.0% 94.9% 95.1% 95.2%
Bastrop 94.7% 94.3% 94.9% 95.0%
Elgin 95.5% 95.2% 95.6% 95.0%
Smithville 95.8% 95.1% 94.9% 94.8%
Source: TEA, AEIS 1994-95 through 1997-98.
SISD's dropout rate fluctuated between 1994-95 and 1997-98 (Exhibit 2-8). Compared to its peer districts, the state and the region, SISD was in the middle or below the state and regional averages in 1996-97 and 1997-98.
Exhibit 2-8 Dropout Rate for SISD, Region 13 and the State
1994-95 through 1997-98
Entity 1994-95 1995-96 1996-97 1997-98
Columbus 1.6% 1.1% 1.5% 0.7%
La Grange 1.2% 0.7% 1.1% 0.7%
Giddings 2.0% 1.5% 0.6% 1.3%
Region 13 1.9% 1.4% 1.3% 1.4%
Smithville 2.1% 2.4% 1.1% 1.6%
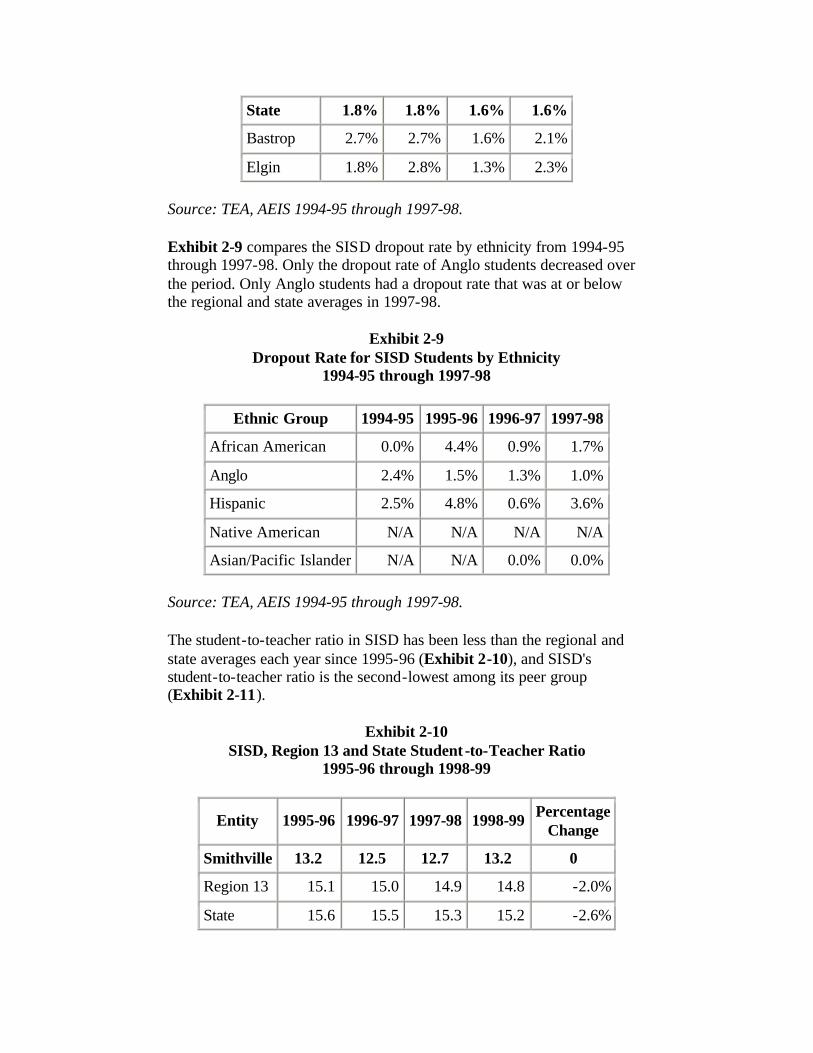
State 1.8% 1.8% 1.6% 1.6%
Bastrop 2.7% 2.7% 1.6% 2.1%
Elgin 1.8% 2.8% 1.3% 2.3%
Source: TEA, AEIS 1994-95 through 1997-98.
Exhibit 2-9 compares the SISD dropout rate by ethnicity from 1994-95 through 1997-98. Only the dropout rate of Anglo students decreased over the period. Only Anglo students had a dropout rate that was at or below the regional and state averages in 1997-98.
Exhibit 2-9 Dropout Rate for SISD Students by Ethnicity
1994-95 through 1997-98
Ethnic Group 1994-95 1995-96 1996-97 1997-98
African American 0.0% 4.4% 0.9% 1.7%
Anglo 2.4% 1.5% 1.3% 1.0%
Hispanic 2.5% 4.8% 0.6% 3.6%
Native American N/A N/A N/A N/A
Asian/Pacific Islander N/A N/A 0.0% 0.0%
Source: TEA, AEIS 1994-95 through 1997-98.
The student-to-teacher ratio in SISD has been less than the regional and state averages each year since 1995-96 (Exhibit 2-10), and SISD's student-to-teacher ratio is the second-lowest among its peer group (Exhibit 2-11).
Exhibit 2-10 SISD, Region 13 and State Student -to-Teacher Ratio
1995-96 through 1998-99
Entity 1995-96 1996-97 1997-98 1998-99 Percentage Change
Smithville 13.2 12.5 12.7 13.2 0
Region 13 15.1 15.0 14.9 14.8 -2.0%
State 15.6 15.5 15.3 15.2 -2.6%
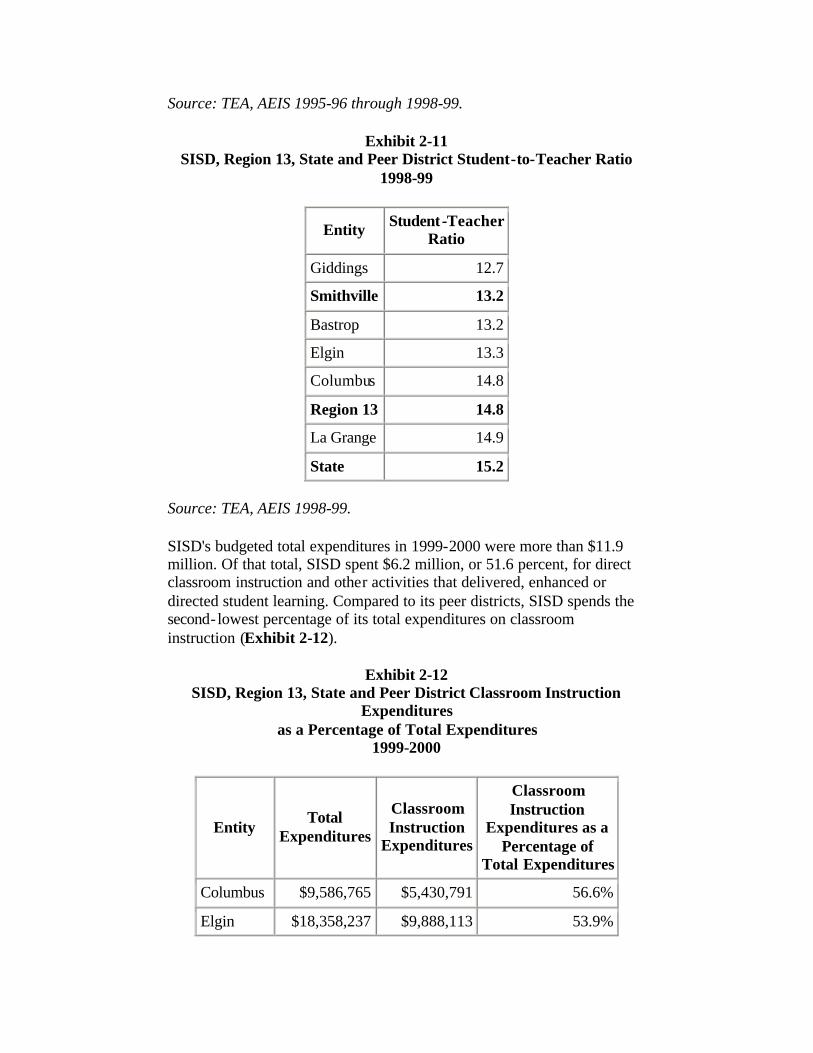
Source: TEA, AEIS 1995-96 through 1998-99.
Exhibit 2-11 SISD, Region 13, State and Peer District Student-to-Teacher Ratio
1998-99
Entity Student-Teacher Ratio
Giddings 12.7
Smithville 13.2
Bastrop 13.2
Elgin 13.3
Columbus 14.8
Region 13 14.8
La Grange 14.9
State 15.2
Source: TEA, AEIS 1998-99.
SISD's budgeted total expenditures in 1999-2000 were more than $11.9 million. Of that total, SISD spent $6.2 million, or 51.6 percent, for direct classroom instruction and other activities that delivered, enhanced or directed student learning. Compared to its peer districts, SISD spends the second- lowest percentage of its total expenditures on classroom instruction (Exhibit 2-12).
Exhibit 2-12 SISD, Region 13, State and Peer District Classroom Instruction
Expenditures as a Percentage of Total Expenditures
1999-2000
Entity Total
Expenditures
Classroom Instruction
Expenditures
Classroom Instruction
Expenditures as a Percentage of
Total Expenditures
Columbus $9,586,765 $5,430,791 56.6%
Elgin $18,358,237 $9,888,113 53.9%
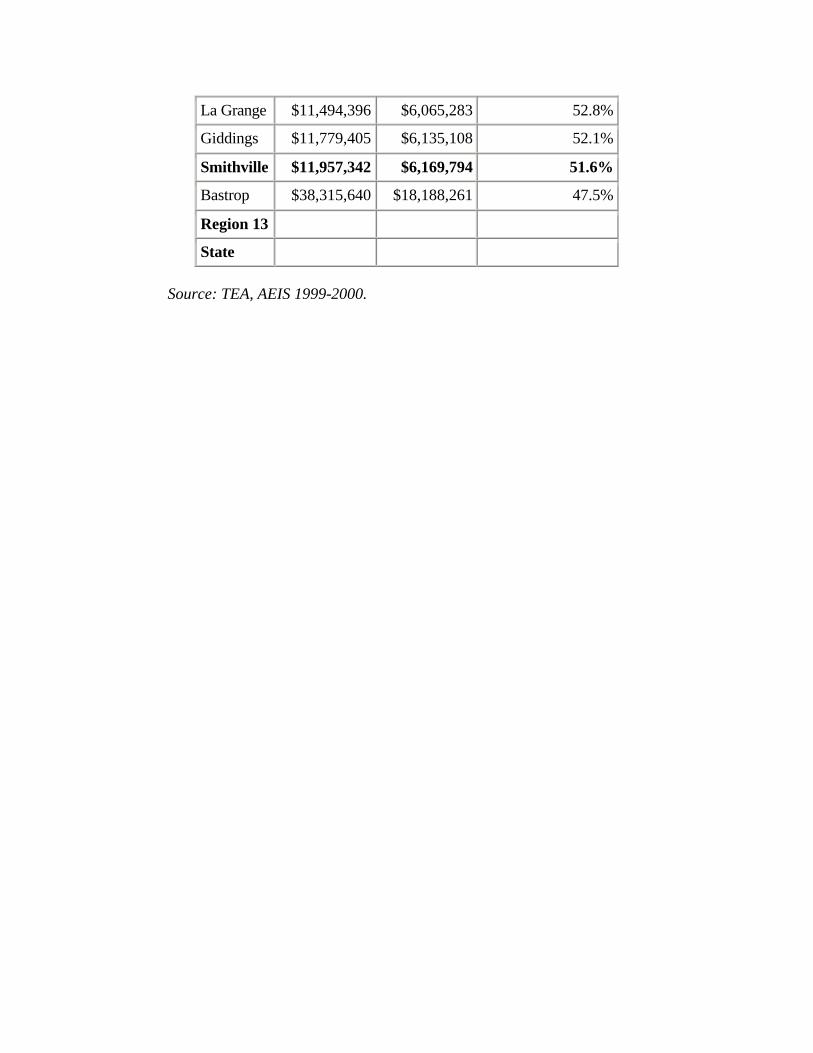
La Grange $11,494,396 $6,065,283 52.8%
Giddings $11,779,405 $6,135,108 52.1%
Smithville $11,957,342 $6,169,794 51.6%
Bastrop $38,315,640 $18,188,261 47.5%
Region 13
State
Source: TEA, AEIS 1999-2000.
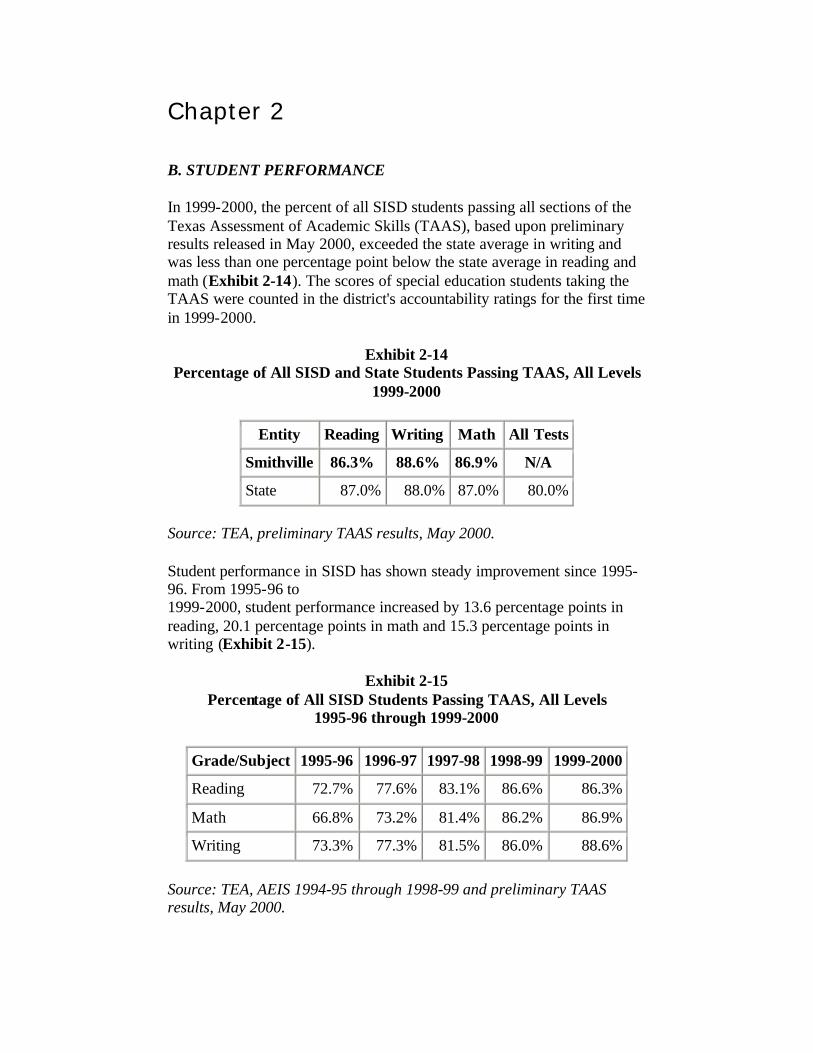
Chapter 2
B. STUDENT PERFORMANCE
In 1999-2000, the percent of all SISD students passing all sections of the Texas Assessment of Academic Skills (TAAS), based upon preliminary results released in May 2000, exceeded the state average in writing and was less than one percentage point below the state average in reading and math (Exhibit 2-14). The scores of special education students taking the TAAS were counted in the district's accountability ratings for the first time in 1999-2000.
Exhibit 2-14 Percentage of All SISD and State Students Passing TAAS, All Levels
1999-2000
Entity Reading Writing Math All Tests
Smithville 86.3% 88.6% 86.9% N/A
State 87.0% 88.0% 87.0% 80.0%
Source: TEA, preliminary TAAS results, May 2000.
Student performance in SISD has shown steady improvement since 1995-96. From 1995-96 to 1999-2000, student performance increased by 13.6 percentage points in reading, 20.1 percentage points in math and 15.3 percentage points in writing (Exhibit 2-15).
Exhibit 2-15 Percentage of All SISD Students Passing TAAS, All Levels
1995-96 through 1999-2000
Grade/Subject 1995-96 1996-97 1997-98 1998-99 1999-2000
Reading 72.7% 77.6% 83.1% 86.6% 86.3%
Math 66.8% 73.2% 81.4% 86.2% 86.9%
Writing 73.3% 77.3% 81.5% 86.0% 88.6%
Source: TEA, AEIS 1994-95 through 1998-99 and preliminary TAAS results, May 2000.
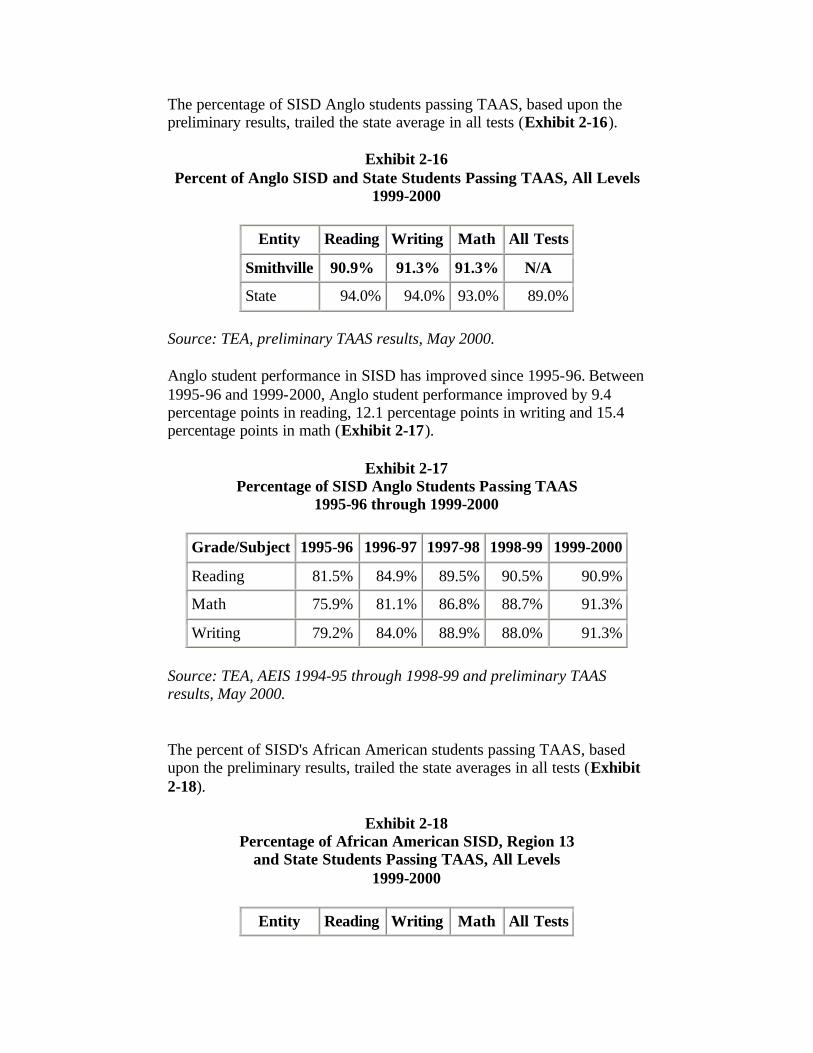
The percentage of SISD Anglo students passing TAAS, based upon the preliminary results, trailed the state average in all tests (Exhibit 2-16).
Exhibit 2-16 Percent of Anglo SISD and State Students Passing TAAS, All Levels
1999-2000
Entity Reading Writing Math All Tests
Smithville 90.9% 91.3% 91.3% N/A
State 94.0% 94.0% 93.0% 89.0%
Source: TEA, preliminary TAAS results, May 2000.
Anglo student performance in SISD has improved since 1995-96. Between 1995-96 and 1999-2000, Anglo student performance improved by 9.4 percentage points in reading, 12.1 percentage points in writing and 15.4 percentage points in math (Exhibit 2-17).
Exhibit 2-17 Percentage of SISD Anglo Students Passing TAAS
1995-96 through 1999-2000
Grade/Subject 1995-96 1996-97 1997-98 1998-99 1999-2000
Reading 81.5% 84.9% 89.5% 90.5% 90.9%
Math 75.9% 81.1% 86.8% 88.7% 91.3%
Writing 79.2% 84.0% 88.9% 88.0% 91.3%
Source: TEA, AEIS 1994-95 through 1998-99 and preliminary TAAS results, May 2000.
The percent of SISD's African American students passing TAAS, based upon the preliminary results, trailed the state averages in all tests (Exhibit 2-18).
Exhibit 2-18 Percentage of African American SISD, Region 13
and State Students Passing TAAS, All Levels 1999-2000
Entity Reading Writing Math All Tests
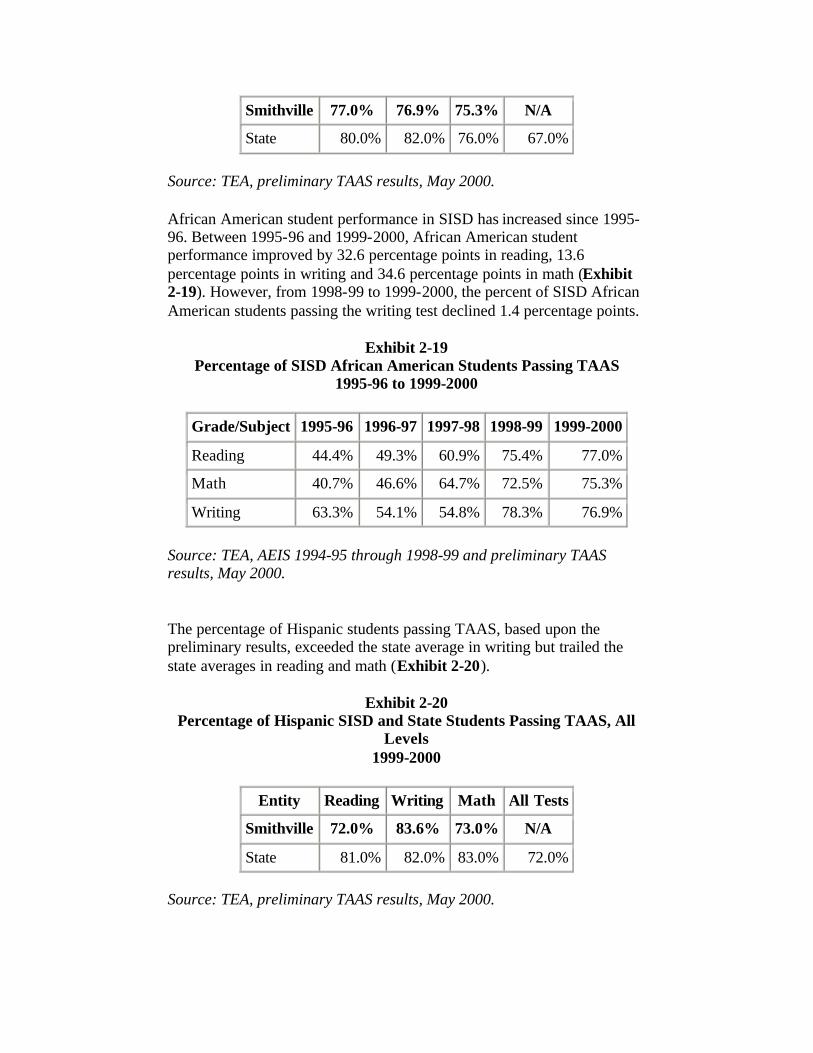
Smithville 77.0% 76.9% 75.3% N/A
State 80.0% 82.0% 76.0% 67.0%
Source: TEA, preliminary TAAS results, May 2000.
African American student performance in SISD has increased since 1995-96. Between 1995-96 and 1999-2000, African American student performance improved by 32.6 percentage points in reading, 13.6 percentage points in writing and 34.6 percentage points in math (Exhibit 2-19). However, from 1998-99 to 1999-2000, the percent of SISD African American students passing the writing test declined 1.4 percentage points.
Exhibit 2-19 Percentage of SISD African American Students Passing TAAS
1995-96 to 1999-2000
Grade/Subject 1995-96 1996-97 1997-98 1998-99 1999-2000
Reading 44.4% 49.3% 60.9% 75.4% 77.0%
Math 40.7% 46.6% 64.7% 72.5% 75.3%
Writing 63.3% 54.1% 54.8% 78.3% 76.9%
Source: TEA, AEIS 1994-95 through 1998-99 and preliminary TAAS results, May 2000.
The percentage of Hispanic students passing TAAS, based upon the preliminary results, exceeded the state average in writing but trailed the state averages in reading and math (Exhibit 2-20).
Exhibit 2-20 Percentage of Hispanic SISD and State Students Passing TAAS, All
Levels 1999-2000
Entity Reading Writing Math All Tests
Smithville 72.0% 83.6% 73.0% N/A
State 81.0% 82.0% 83.0% 72.0%
Source: TEA, preliminary TAAS results, May 2000.
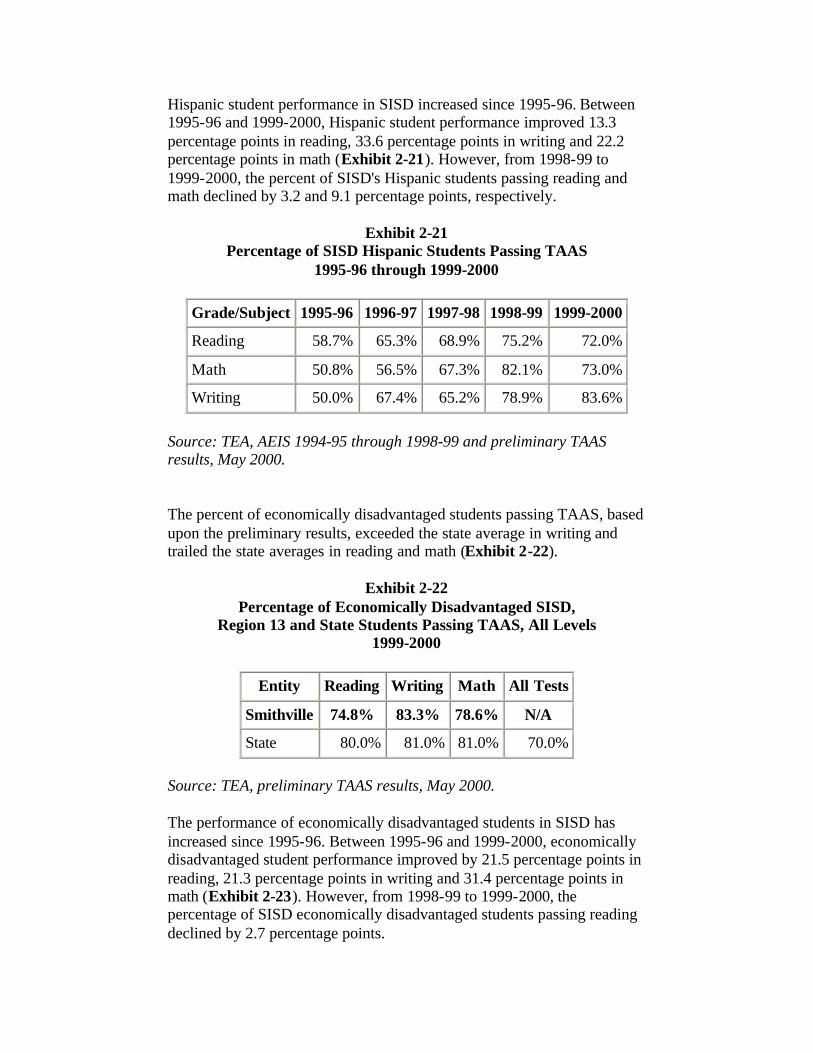
Hispanic student performance in SISD increased since 1995-96. Between 1995-96 and 1999-2000, Hispanic student performance improved 13.3 percentage points in reading, 33.6 percentage points in writing and 22.2 percentage points in math (Exhibit 2-21). However, from 1998-99 to 1999-2000, the percent of SISD's Hispanic students passing reading and math declined by 3.2 and 9.1 percentage points, respectively.
Exhibit 2-21 Percentage of SISD Hispanic Students Passing TAAS
1995-96 through 1999-2000
Grade/Subject 1995-96 1996-97 1997-98 1998-99 1999-2000
Reading 58.7% 65.3% 68.9% 75.2% 72.0%
Math 50.8% 56.5% 67.3% 82.1% 73.0%
Writing 50.0% 67.4% 65.2% 78.9% 83.6%
Source: TEA, AEIS 1994-95 through 1998-99 and preliminary TAAS results, May 2000.
The percent of economically disadvantaged students passing TAAS, based upon the preliminary results, exceeded the state average in writing and trailed the state averages in reading and math (Exhibit 2-22).
Exhibit 2-22 Percentage of Economically Disadvantaged SISD,
Region 13 and State Students Passing TAAS, All Levels 1999-2000
Entity Reading Writing Math All Tests
Smithville 74.8% 83.3% 78.6% N/A
State 80.0% 81.0% 81.0% 70.0%
Source: TEA, preliminary TAAS results, May 2000.
The performance of economically disadvantaged students in SISD has increased since 1995-96. Between 1995-96 and 1999-2000, economically disadvantaged student performance improved by 21.5 percentage points in reading, 21.3 percentage points in writing and 31.4 percentage points in math (Exhibit 2-23). However, from 1998-99 to 1999-2000, the percentage of SISD economically disadvantaged students passing reading declined by 2.7 percentage points.
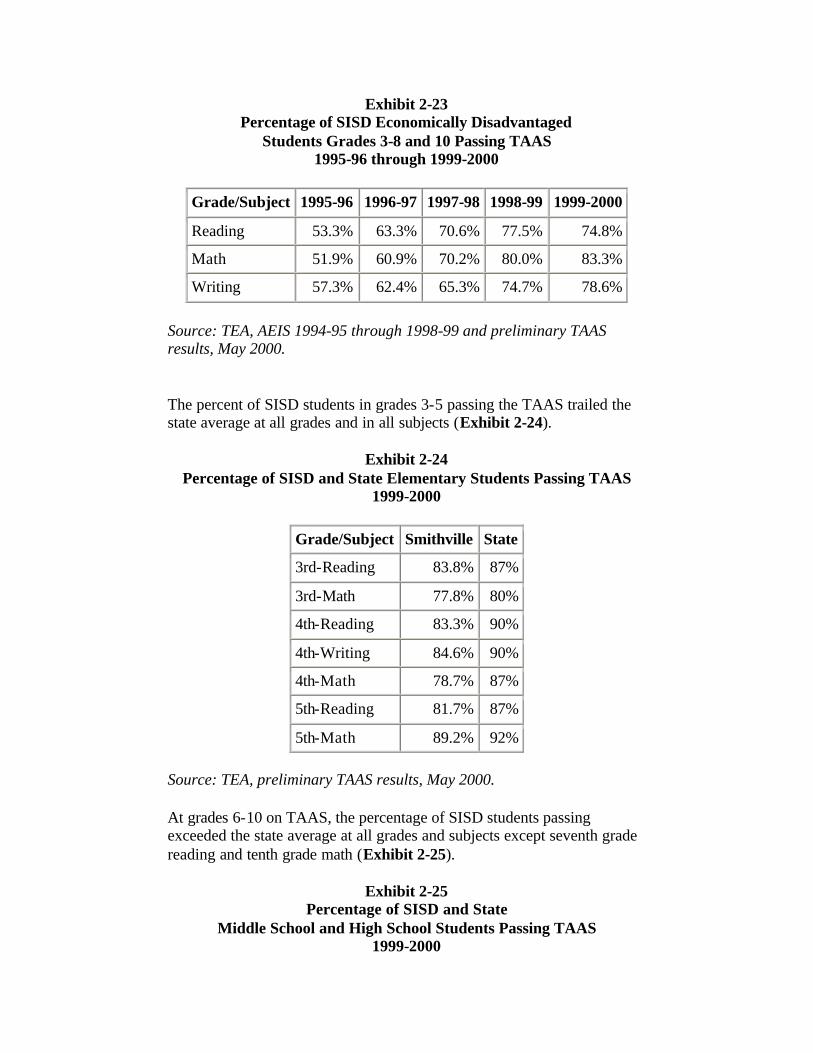
Exhibit 2-23 Percentage of SISD Economically Disadvantaged
Students Grades 3-8 and 10 Passing TAAS 1995-96 through 1999-2000
Grade/Subject 1995-96 1996-97 1997-98 1998-99 1999-2000
Reading 53.3% 63.3% 70.6% 77.5% 74.8%
Math 51.9% 60.9% 70.2% 80.0% 83.3%
Writing 57.3% 62.4% 65.3% 74.7% 78.6%
Source: TEA, AEIS 1994-95 through 1998-99 and preliminary TAAS results, May 2000.
The percent of SISD students in grades 3-5 passing the TAAS trailed the state average at all grades and in all subjects (Exhibit 2-24).
Exhibit 2-24 Percentage of SISD and State Elementary Students Passing TAAS
1999-2000
Grade/Subject Smithville State
3rd-Reading 83.8% 87%
3rd-Math 77.8% 80%
4th-Reading 83.3% 90%
4th-Writing 84.6% 90%
4th-Math 78.7% 87%
5th-Reading 81.7% 87%
5th-Math 89.2% 92%
Source: TEA, preliminary TAAS results, May 2000.
At grades 6-10 on TAAS, the percentage of SISD students passing exceeded the state average at all grades and subjects except seventh grade reading and tenth grade math (Exhibit 2-25).
Exhibit 2-25 Percentage of SISD and State
Middle School and High School Students Passing TAAS 1999-2000
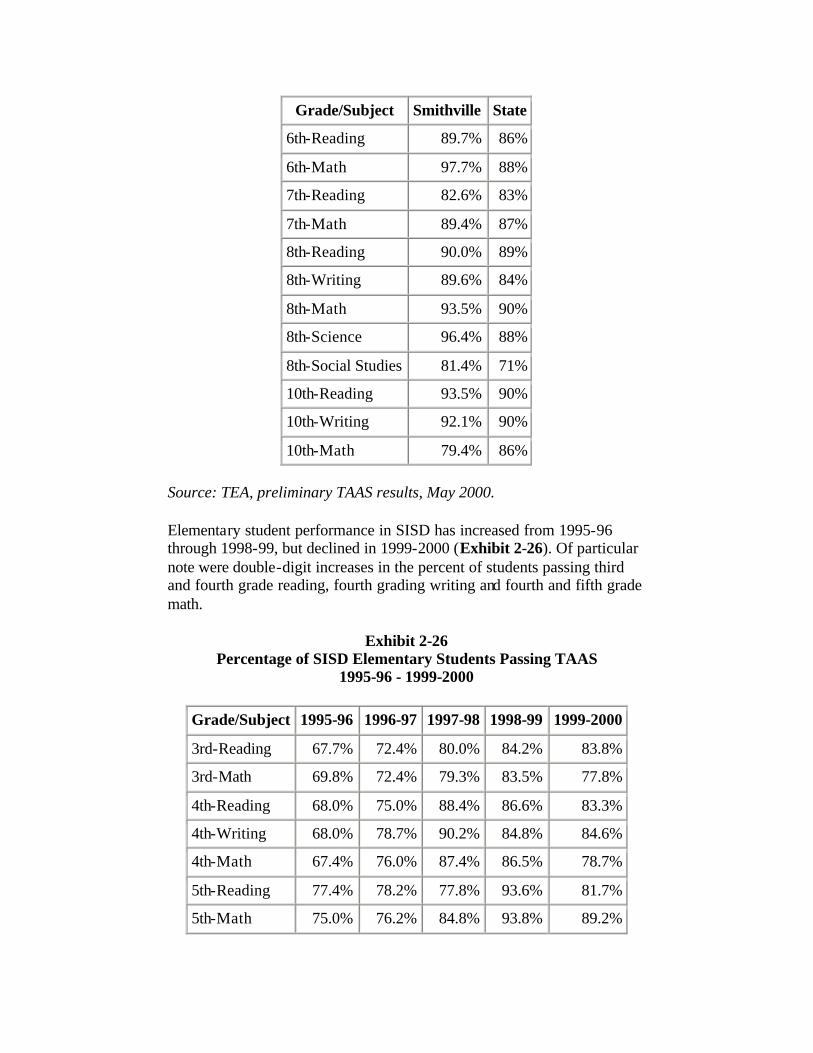
Grade/Subject Smithville State
6th-Reading 89.7% 86%
6th-Math 97.7% 88%
7th-Reading 82.6% 83%
7th-Math 89.4% 87%
8th-Reading 90.0% 89%
8th-Writing 89.6% 84%
8th-Math 93.5% 90%
8th-Science 96.4% 88%
8th-Social Studies 81.4% 71%
10th-Reading 93.5% 90%
10th-Writing 92.1% 90%
10th-Math 79.4% 86%
Source: TEA, preliminary TAAS results, May 2000.
Elementary student performance in SISD has increased from 1995-96 through 1998-99, but declined in 1999-2000 (Exhibit 2-26). Of particular note were double-digit increases in the percent of students passing third and fourth grade reading, fourth grading writing and fourth and fifth grade math.
Exhibit 2-26 Percentage of SISD Elementary Students Passing TAAS
1995-96 - 1999-2000
Grade/Subject 1995-96 1996-97 1997-98 1998-99 1999-2000
3rd-Reading 67.7% 72.4% 80.0% 84.2% 83.8%
3rd-Math 69.8% 72.4% 79.3% 83.5% 77.8%
4th-Reading 68.0% 75.0% 88.4% 86.6% 83.3%
4th-Writing 68.0% 78.7% 90.2% 84.8% 84.6%
4th-Math 67.4% 76.0% 87.4% 86.5% 78.7%
5th-Reading 77.4% 78.2% 77.8% 93.6% 81.7%
5th-Math 75.0% 76.2% 84.8% 93.8% 89.2%
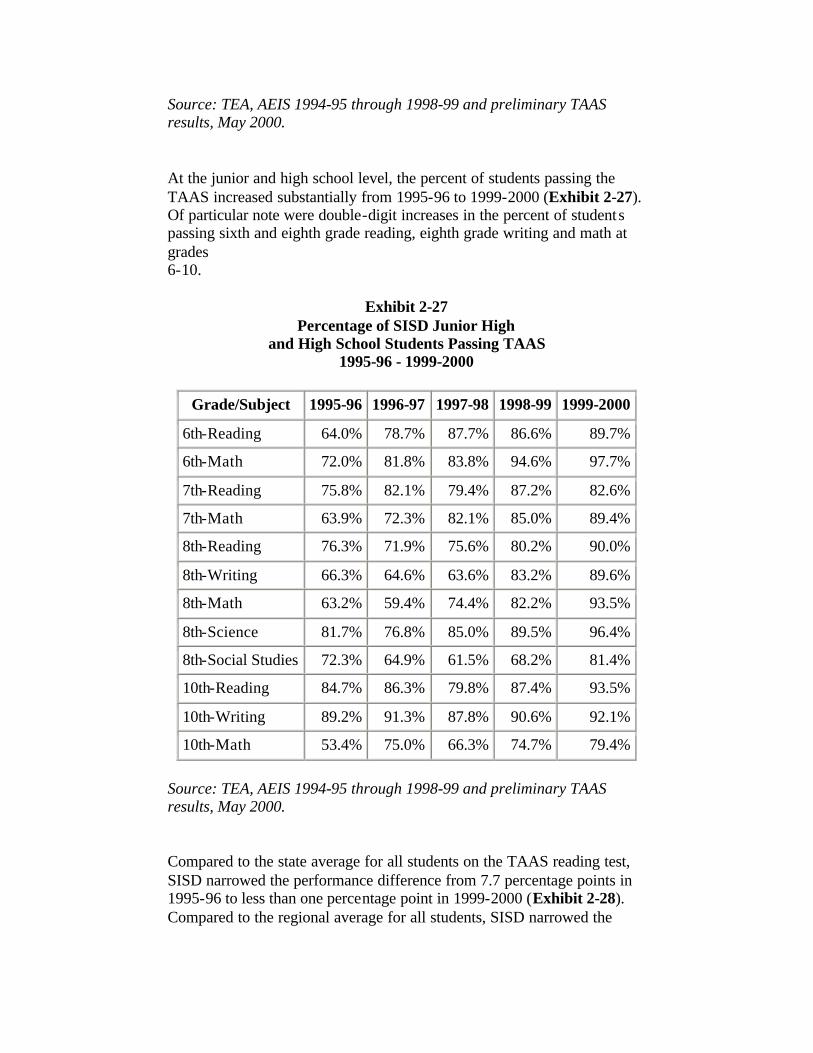
Source: TEA, AEIS 1994-95 through 1998-99 and preliminary TAAS results, May 2000.
At the junior and high school level, the percent of students passing the TAAS increased substantially from 1995-96 to 1999-2000 (Exhibit 2-27). Of particular note were double-digit increases in the percent of student s passing sixth and eighth grade reading, eighth grade writing and math at grades 6-10.
Exhibit 2-27 Percentage of SISD Junior High
and High School Students Passing TAAS 1995-96 - 1999-2000
Grade/Subject 1995-96 1996-97 1997-98 1998-99 1999-2000
6th-Reading 64.0% 78.7% 87.7% 86.6% 89.7%
6th-Math 72.0% 81.8% 83.8% 94.6% 97.7%
7th-Reading 75.8% 82.1% 79.4% 87.2% 82.6%
7th-Math 63.9% 72.3% 82.1% 85.0% 89.4%
8th-Reading 76.3% 71.9% 75.6% 80.2% 90.0%
8th-Writing 66.3% 64.6% 63.6% 83.2% 89.6%
8th-Math 63.2% 59.4% 74.4% 82.2% 93.5%
8th-Science 81.7% 76.8% 85.0% 89.5% 96.4%
8th-Social Studies 72.3% 64.9% 61.5% 68.2% 81.4%
10th-Reading 84.7% 86.3% 79.8% 87.4% 93.5%
10th-Writing 89.2% 91.3% 87.8% 90.6% 92.1%
10th-Math 53.4% 75.0% 66.3% 74.7% 79.4%
Source: TEA, AEIS 1994-95 through 1998-99 and preliminary TAAS results, May 2000.
Compared to the state average for all students on the TAAS reading test, SISD narrowed the performance difference from 7.7 percentage points in 1995-96 to less than one percentage point in 1999-2000 (Exhibit 2-28). Compared to the regional average for all students, SISD narrowed the

performance difference from 9.4 percentage points in 1995-96 to 0.4 percentage points in 1998-99.
Exhibit 2-28 Percentage of SISD Students Grades 3-8 and 10 Passing TAAS
Reading Test 1995-96 through 1999-2000
Category 1995-96
1996-97
1997-98
1998-99
1999-2000
All students 72.7% 77.6% 81.3% 86.6% 86.3%
African American students 44.4% 49.3% 60.3% 75.4% 77.0%
Hispanic students 58.7% 65.3% 69.0% 75.2% 72.0%
Anglo students 81.5% 84.9% 87.0% 90.5% 90.9%
Economically disadvantaged students
53.3% 63.3% 68.0% 77.5% 74.8%
State - all students 80.4% 84.0% 83.3% 86.5% 87.0%
Region 13 - all students 82.1% 85.6% 84.2% 87.0% N/A
Source: TEA, AEIS 1994-95 through 1998-99 and preliminary TAAS results, May 2000.
Compared to the state average for all students on the TAAS math test, SISD narrowed the performance difference from 7.4 percentage points in 1995-96 to less than one percentage point in 1999-2000 (Exhibit 2-29). Compared to the regional average for all students, SISD eliminated the performance difference between 1995-96 and 1998-99.
Exhibit 2-29 Percentage of SISD Students Grades 3-8 and 10 Passing TAAS Math
Test 1995-96 through 1999-2000
Category 1995-96
1996-97
1997-98
1998-99
1999-2000
All students 66.8% 73.2% 80.1% 86.2% 86.9%
African American students 40.7% 46.6% 62.5% 72.5% 75.3%
Hispanic students 50.8% 56.5% 65.8% 82.1% 73.0%
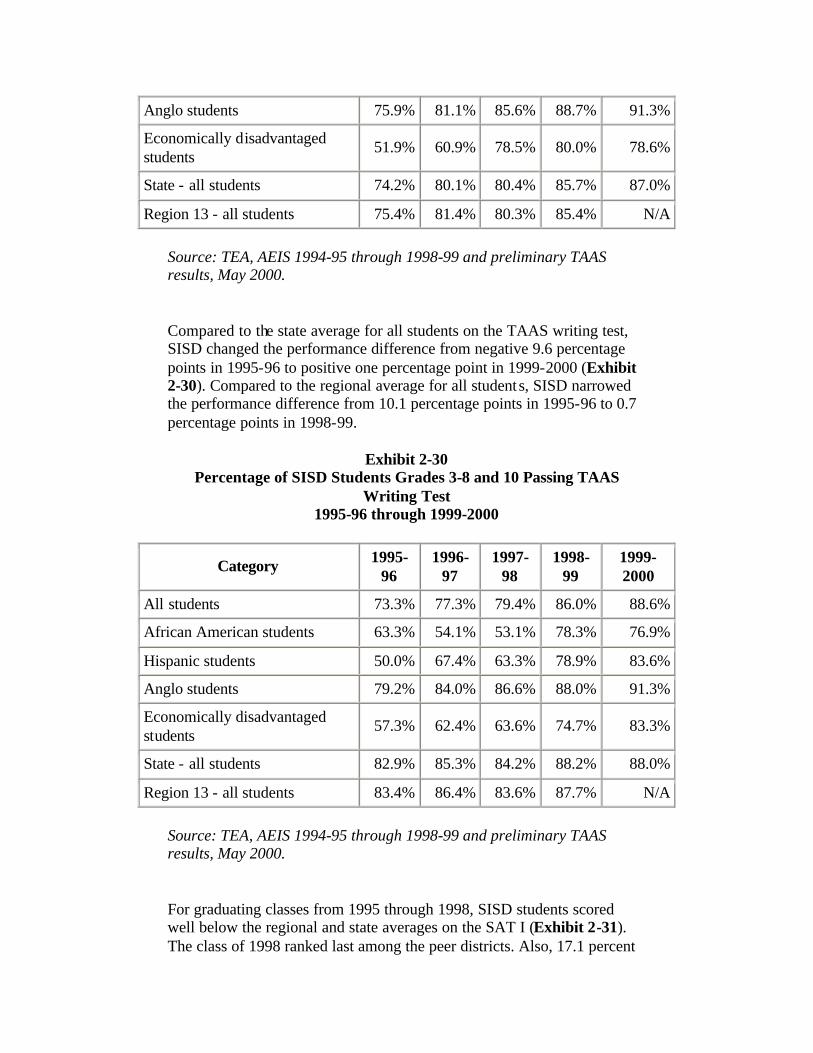
Anglo students 75.9% 81.1% 85.6% 88.7% 91.3%
Economically disadvantaged students
51.9% 60.9% 78.5% 80.0% 78.6%
State - all students 74.2% 80.1% 80.4% 85.7% 87.0%
Region 13 - all students 75.4% 81.4% 80.3% 85.4% N/A
Source: TEA, AEIS 1994-95 through 1998-99 and preliminary TAAS results, May 2000.
Compared to the state average for all students on the TAAS writing test, SISD changed the performance difference from negative 9.6 percentage points in 1995-96 to positive one percentage point in 1999-2000 (Exhibit 2-30). Compared to the regional average for all student s, SISD narrowed the performance difference from 10.1 percentage points in 1995-96 to 0.7 percentage points in 1998-99.
Exhibit 2-30 Percentage of SISD Students Grades 3-8 and 10 Passing TAAS
Writing Test 1995-96 through 1999-2000
Category 1995-96
1996-97
1997-98
1998-99
1999-2000
All students 73.3% 77.3% 79.4% 86.0% 88.6%
African American students 63.3% 54.1% 53.1% 78.3% 76.9%
Hispanic students 50.0% 67.4% 63.3% 78.9% 83.6%
Anglo students 79.2% 84.0% 86.6% 88.0% 91.3%
Economically disadvantaged students
57.3% 62.4% 63.6% 74.7% 83.3%
State - all students 82.9% 85.3% 84.2% 88.2% 88.0%
Region 13 - all students 83.4% 86.4% 83.6% 87.7% N/A
Source: TEA, AEIS 1994-95 through 1998-99 and preliminary TAAS results, May 2000.
For graduating classes from 1995 through 1998, SISD students scored well below the regional and state averages on the SAT I (Exhibit 2-31). The class of 1998 ranked last among the peer districts. Also, 17.1 percent
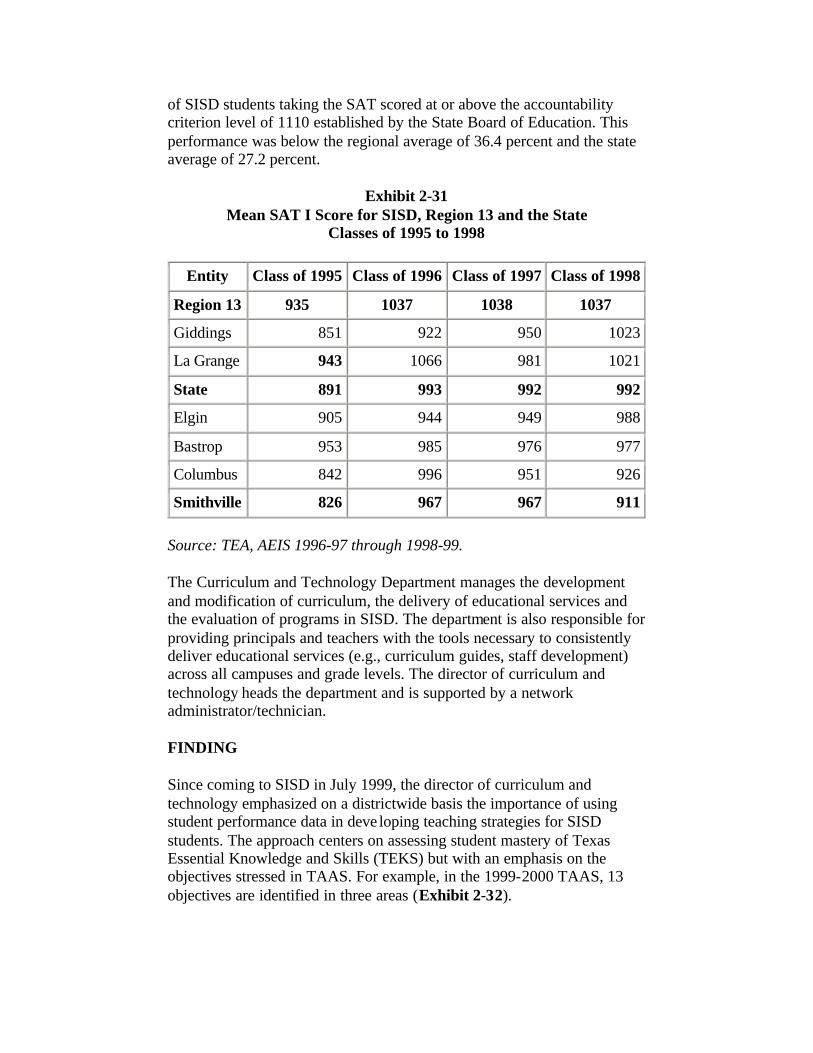
of SISD students taking the SAT scored at or above the accountability criterion level of 1110 established by the State Board of Education. This performance was below the regional average of 36.4 percent and the state average of 27.2 percent.
Exhibit 2-31 Mean SAT I Score for SISD, Region 13 and the State
Classes of 1995 to 1998
Entity Class of 1995 Class of 1996 Class of 1997 Class of 1998
Region 13 935 1037 1038 1037
Giddings 851 922 950 1023
La Grange 943 1066 981 1021
State 891 993 992 992
Elgin 905 944 949 988
Bastrop 953 985 976 977
Columbus 842 996 951 926
Smithville 826 967 967 911
Source: TEA, AEIS 1996-97 through 1998-99.
The Curriculum and Technology Department manages the development and modification of curriculum, the delivery of educational services and the evaluation of programs in SISD. The department is also responsible for providing principals and teachers with the tools necessary to consistently deliver educational services (e.g., curriculum guides, staff development) across all campuses and grade levels. The director of curriculum and technology heads the department and is supported by a network administrator/technician.
FINDING
Since coming to SISD in July 1999, the director of curriculum and technology emphasized on a districtwide basis the importance of using student performance data in deve loping teaching strategies for SISD students. The approach centers on assessing student mastery of Texas Essential Knowledge and Skills (TEKS) but with an emphasis on the objectives stressed in TAAS. For example, in the 1999-2000 TAAS, 13 objectives are identified in three areas (Exhibit 2-32).
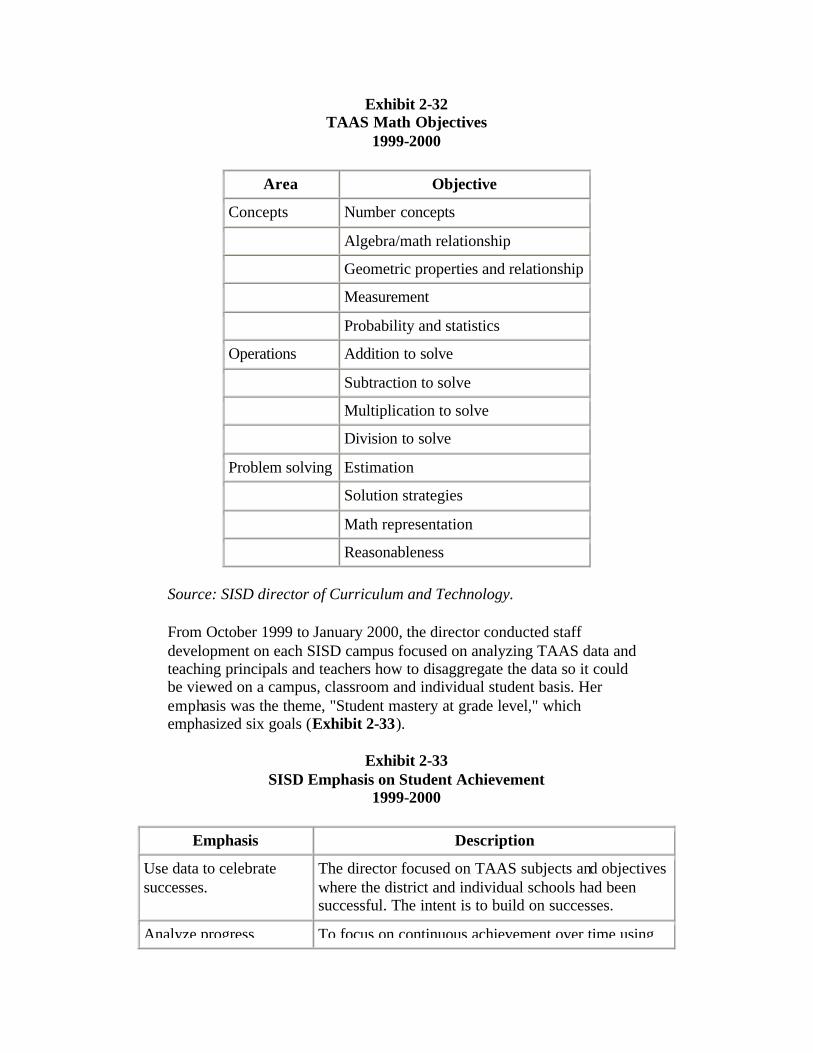
Exhibit 2-32 TAAS Math Objectives
1999-2000
Area Objective
Concepts Number concepts
Algebra/math relationship
Geometric properties and relationship
Measurement
Probability and statistics
Operations Addition to solve
Subtraction to solve
Multiplication to solve
Division to solve
Problem solving Estimation
Solution strategies
Math representation
Reasonableness
Source: SISD director of Curriculum and Technology.
From October 1999 to January 2000, the director conducted staff development on each SISD campus focused on analyzing TAAS data and teaching principals and teachers how to disaggregate the data so it could be viewed on a campus, classroom and individual student basis. Her emphasis was the theme, "Student mastery at grade level," which emphasized six goals (Exhibit 2-33).
Exhibit 2-33 SISD Emphasis on Student Achievement
1999-2000
Emphasis Description
Use data to celebrate successes.
The director focused on TAAS subjects and objectives where the district and individual schools had been successful. The intent is to build on successes.
Analyze progress To focus on continuous achievement over time using
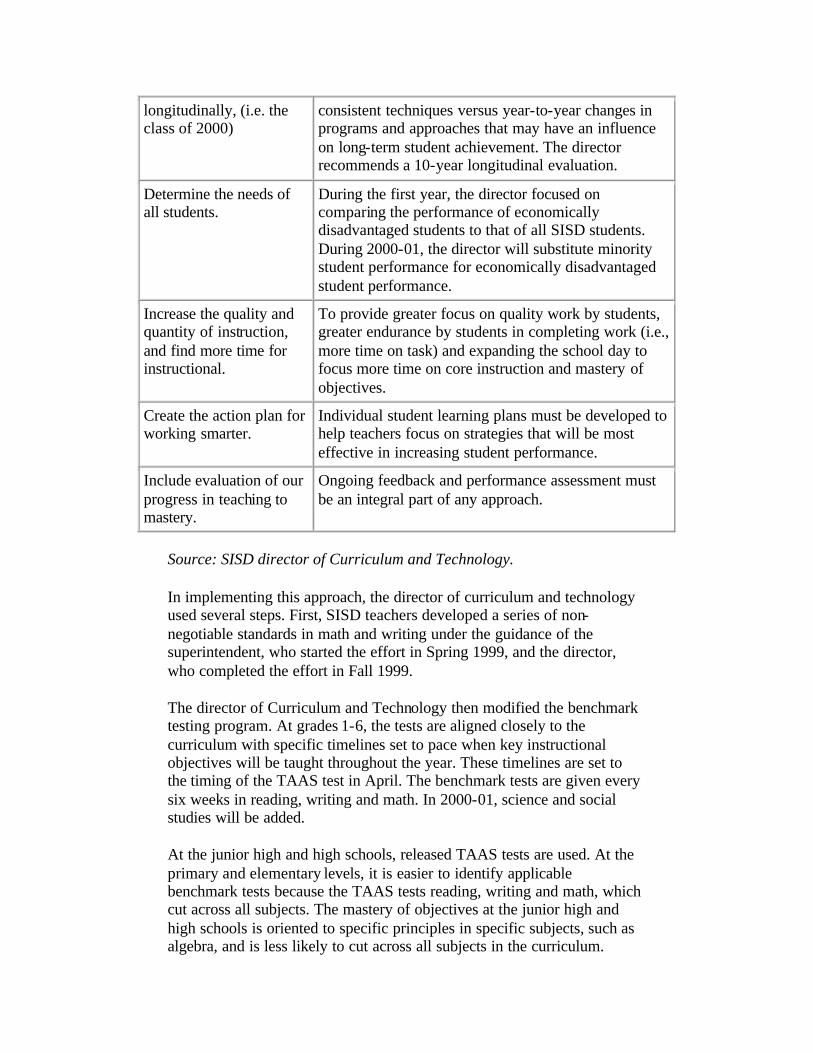
longitudinally, (i.e. the class of 2000)
consistent techniques versus year-to-year changes in programs and approaches that may have an influence on long-term student achievement. The director recommends a 10-year longitudinal evaluation.
Determine the needs of all students.
During the first year, the director focused on comparing the performance of economically disadvantaged students to that of all SISD students. During 2000-01, the director will substitute minority student performance for economically disadvantaged student performance.
Increase the quality and quantity of instruction, and find more time for instructional.
To provide greater focus on quality work by students, greater endurance by students in completing work (i.e., more time on task) and expanding the school day to focus more time on core instruction and mastery of objectives.
Create the action plan for working smarter.
Individual student learning plans must be developed to help teachers focus on strategies that will be most effective in increasing student performance.
Include evaluation of our progress in teaching to mastery.
Ongoing feedback and performance assessment must be an integral part of any approach.
Source: SISD director of Curriculum and Technology.
In implementing this approach, the director of curriculum and technology used several steps. First, SISD teachers developed a series of non-negotiable standards in math and writing under the guidance of the superintendent, who started the effort in Spring 1999, and the director, who completed the effort in Fall 1999.
The director of Curriculum and Technology then modified the benchmark testing program. At grades 1-6, the tests are aligned closely to the curriculum with specific timelines set to pace when key instructional objectives will be taught throughout the year. These timelines are set to the timing of the TAAS test in April. The benchmark tests are given every six weeks in reading, writing and math. In 2000-01, science and social studies will be added.
At the junior high and high schools, released TAAS tests are used. At the primary and elementary levels, it is easier to identify applicable benchmark tests because the TAAS tests reading, writing and math, which cut across all subjects. The mastery of objectives at the junior high and high schools is oriented to specific principles in specific subjects, such as algebra, and is less likely to cut across all subjects in the curriculum.
After each round of benchmark and release testing, the director went to each school and worked directly with teachers to show how to take apart the total data and break it down by classroom and individual students. The director then taught the teachers how to modify the benchmark testing to identify and address weaknesses in skills. Individual student learning strategies are emphasized.
Teaching strategies were developed in quality and quantity. Quality is an emphasis on how accurate a student's work is. Quantity refers to endurance, for example, the ability to work through 40 or 50 problems with accuracy rather than just 10 or 15, showing all work and continuing to work problems until a particular skill is mastered.
SISD has several campus-specific programs that address different aspects of student performance: Student Assistance Program, Pathways, Peer Assistance and Leadership and Accelerated Reader.
The Student Assistance Program is located on elementary, junior high and high school campuses. The program helps students experiencing problems that interfere with learning, such as emotional distress, family problems and chemical dependency. Students can be referred to the program by staff, parents, community members, peers or by themselves.
A committee comprised of a special education teacher, grade level or subject area teachers, a nurse, a counselor and an assistant principal at each school reviews information regarding referred students. Members of the core teams at SISD underwent an extensive training session on the SAP process at the onset of the program in September 1999.
The information gathered on referred students includes patterns of behavior observed by each of a student's teachers; information on attendance, discipline and past academic performance; and comments from teachers and the school nurse. The committee uses this information to determine if there is a significant problem, and to develop a plan of action and refer the student to on-campus resources such as a support group, counseling, mentoring, mediation or other existing services. If the problem is beyond the scope of the school, parents are given recommendations for a community-based or outside assessment, which is free and is designed to connect the parents and students with appropriate treatment solutions.
Pathways is an alternative school on the high school campus for students who are potential dropouts. The program was initiated by the principal in 1999-2000. The school is limited to 20 students. Students must apply for admission to the school, and must have parental approval. The students are served by one teacher and one aide.
The school is modeled after the alternative school program at Westlake High School in Eanes ISD, where the SISD high school principal previously served as an assistant principal. Learning at Pathways is self-paced and may involve tutoring and/or mentoring depending upon a student's needs. A minimum score of 80 is required on all tests. If a student does not score that high, the student must retake the test. Progress reports are issued every three weeks, and students must demonstrate progress toward achieving the necessary credits for graduation.
Peer Assistance and Leadership is a program approved by the Texas Education Agency (TEA) and exists solely at the high school. The program recruits students, primarily at the secondary level, who serve as mentors and tutors for students at lower grade levels.
Brown Primary School and Smithville Elementary School both use the Accelerated Reader (AR) program to assist students with difficulties learning to read. The program awards points based upon reading grade-level specific books (e.g., fifth grade = 5 points) and answering questions using a computer-based program. At Brown, the school established a Wall of Fame. Each student who earns AR points gets a star on the wall. Stars are grouped in point total categories of 10, 20, 30, 40, 50, 60-100 and 100 plus points. Students with stars in the last two categories are called Super Stars and Top Tigers, respectively.
Every six weeks, each of the 25 participating classes in grades 1-3 holds a ceremony in front of the wall where movement from one point category to another by a student is recognized. At the same time, a school store, stocked with items gathered by the Booster Club or donated by HEB Stores, is open for students to redeem points for items. Also, the First National Bank of Bastrop donates a savings bond every six weeks to the top three point producers in each of the 25 classes.
Smithville Elementary School uses a similar process. Points are accumulated and can be redeemed by students every six weeks at a school store, which is stocked with items purchased from the library activity fund. At the end of the school year, the principal treats the students in each grade level with the highest point totals to a special lunch.
COMMENDATION
SISD focuses on individual student learning needs and prepares staff and students to develop appropriate solutions to meet those needs.
FINDING

Progress in the performance of minority and economically disadvantaged students in SISD has fluctuated since 1995-96, especially from 1998-99 to 1999-2000:
• African American students passing the writing test declined by 1.4 percentage points.
• Hispanic students passing the reading and math tests declined by 3.2 and 9.1 percentage points, respectively; and
• Economically disadvantaged students passing the reading test declined by 2.7 percentage points.
SISD has also had difficulty closing the performance gap between Anglo students and minority and economically disadvantaged students. Exhibit 2-34 shows that while the performance gap has narrowed between Anglo students and minority and economically disadvantaged students on the TAAS reading test, the gap began to widen again in 1999-2000 among Hispanic and economically disadvantaged students.
Exhibit 2-34 Gap in Percent Passing TAAS Reading Test, Anglo Students vs.
Minority and Economically Disadvantaged Students 1995-96 through 1999-2000
Percentage Point Difference from Anglo Student Performance Category
1995-96 1996-97 1997-98 1998-99 1999-2000
African American students -37.1 -35.6 -26.7 -15.1 -13.9
Hispanic students -22.8 -19.6 -18.0 -15.3 -18.9
Economically disadvantaged students
-28.2 -21.6 -19.0 -13.0 -16.1
Source: TEA, AEIS 1994-95 through 1998-99 and preliminary TAAS results, May 2000.
The gap in performance on the TAAS math test between Anglo, African American, Hispanic, and economically disadvantaged students has narrowed considerably since 1995-96 (Exhibit 2-35). However, since closing the gap to 7.7 percentage points in 1997-98 between Anglo and economically disadvantaged students, that gap increased to 12.7 percentage point in 1999-2000. Since closing the gap to 6.6 percentage points between Anglo and Hispanic students in 1998-99, that gap nearly tripled in 1999-2000.
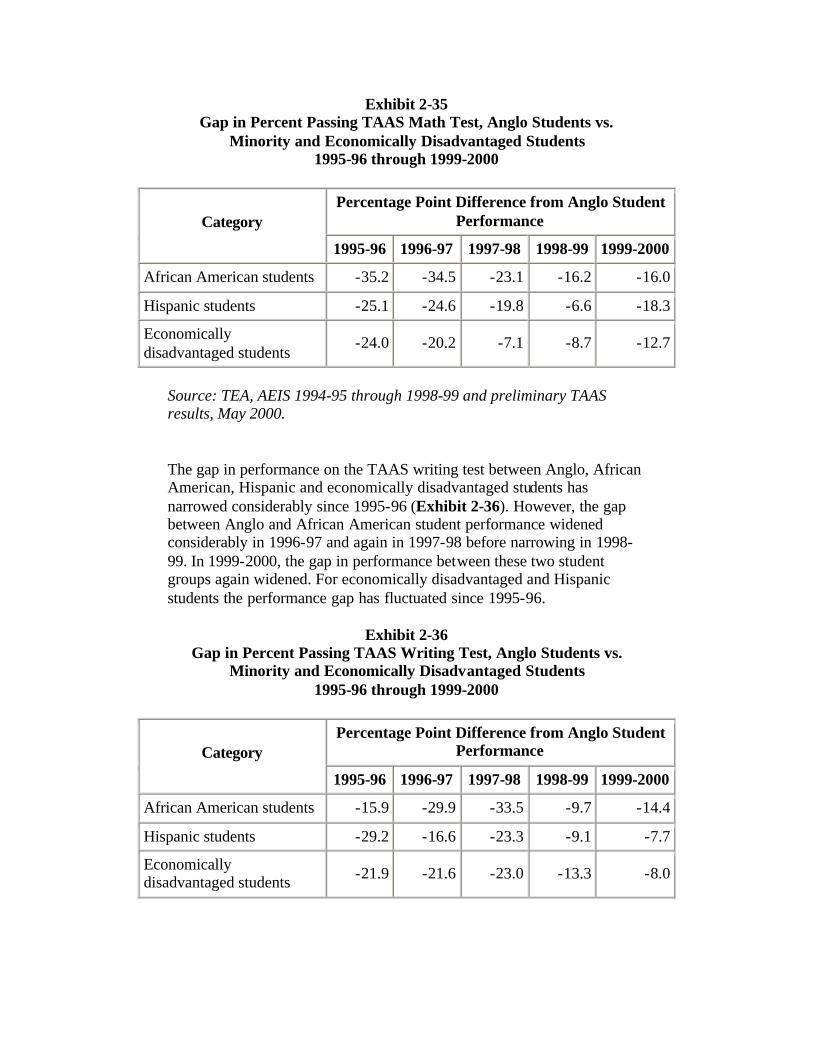
Exhibit 2-35 Gap in Percent Passing TAAS Math Test, Anglo Students vs.
Minority and Economically Disadvantaged Students 1995-96 through 1999-2000
Percentage Point Difference from Anglo Student Performance Category
1995-96 1996-97 1997-98 1998-99 1999-2000
African American students -35.2 -34.5 -23.1 -16.2 -16.0
Hispanic students -25.1 -24.6 -19.8 -6.6 -18.3
Economically disadvantaged students
-24.0 -20.2 -7.1 -8.7 -12.7
Source: TEA, AEIS 1994-95 through 1998-99 and preliminary TAAS results, May 2000.
The gap in performance on the TAAS writing test between Anglo, African American, Hispanic and economically disadvantaged students has narrowed considerably since 1995-96 (Exhibit 2-36). However, the gap between Anglo and African American student performance widened considerably in 1996-97 and again in 1997-98 before narrowing in 1998-99. In 1999-2000, the gap in performance between these two student groups again widened. For economically disadvantaged and Hispanic students the performance gap has fluctuated since 1995-96.
Exhibit 2-36 Gap in Percent Passing TAAS Writing Test, Anglo Students vs.
Minority and Economically Disadvantaged Students 1995-96 through 1999-2000
Percentage Point Difference from Anglo Student Performance Category
1995-96 1996-97 1997-98 1998-99 1999-2000
African American students -15.9 -29.9 -33.5 -9.7 -14.4
Hispanic students -29.2 -16.6 -23.3 -9.1 -7.7
Economically disadvantaged students -21.9 -21.6 -23.0 -13.3 -8.0
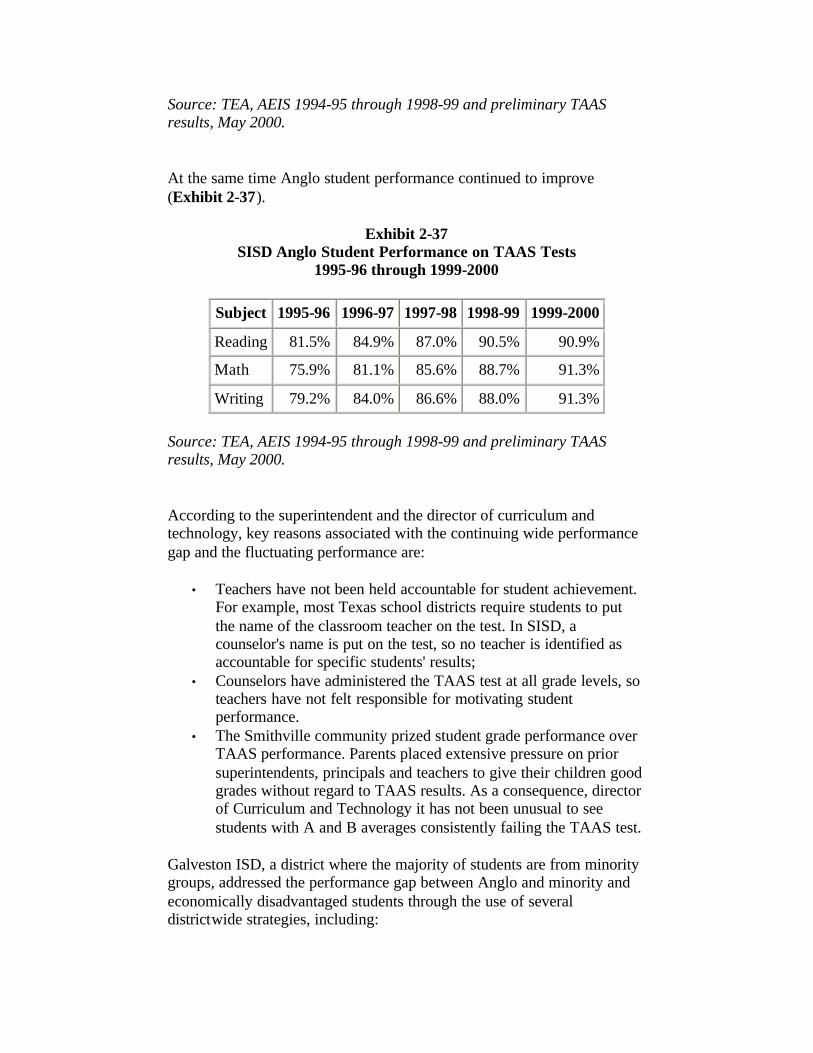
Source: TEA, AEIS 1994-95 through 1998-99 and preliminary TAAS results, May 2000.
At the same time Anglo student performance continued to improve (Exhibit 2-37).
Exhibit 2-37 SISD Anglo Student Performance on TAAS Tests
1995-96 through 1999-2000
Subject 1995-96 1996-97 1997-98 1998-99 1999-2000
Reading 81.5% 84.9% 87.0% 90.5% 90.9%
Math 75.9% 81.1% 85.6% 88.7% 91.3%
Writing 79.2% 84.0% 86.6% 88.0% 91.3%
Source: TEA, AEIS 1994-95 through 1998-99 and preliminary TAAS results, May 2000.
According to the superintendent and the director of curriculum and technology, key reasons associated with the continuing wide performance gap and the fluctuating performance are:
• Teachers have not been held accountable for student achievement. For example, most Texas school districts require students to put the name of the classroom teacher on the test. In SISD, a counselor's name is put on the test, so no teacher is identified as accountable for specific students' results;
• Counselors have administered the TAAS test at all grade levels, so teachers have not felt responsible for motivating student performance.
• The Smithville community prized student grade performance over TAAS performance. Parents placed extensive pressure on prior superintendents, principals and teachers to give their children good grades without regard to TAAS results. As a consequence, director of Curriculum and Technology it has not been unusual to see students with A and B averages consistently failing the TAAS test.
Galveston ISD, a district where the majority of students are from minority groups, addressed the performance gap between Anglo and minority and economically disadvantaged students through the use of several districtwide strategies, including:
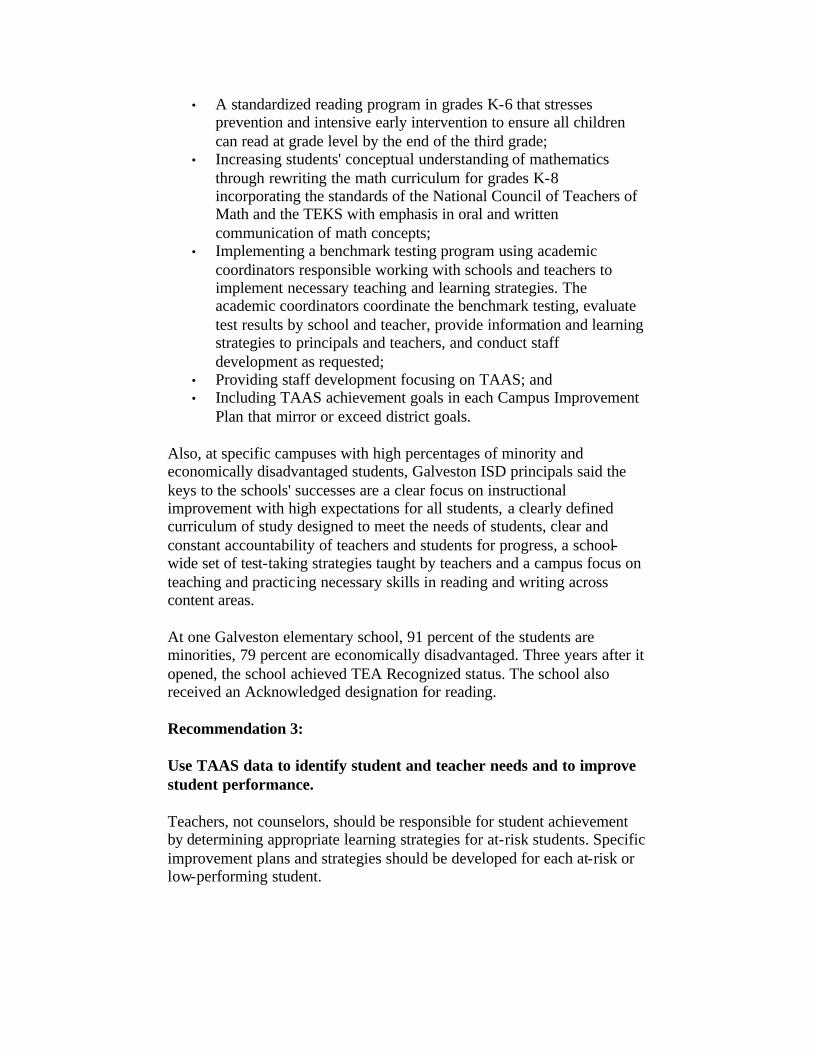
• A standardized reading program in grades K-6 that stresses prevention and intensive early intervention to ensure all children can read at grade level by the end of the third grade;
• Increasing students' conceptual understanding of mathematics through rewriting the math curriculum for grades K-8 incorporating the standards of the National Council of Teachers of Math and the TEKS with emphasis in oral and written communication of math concepts;
• Implementing a benchmark testing program using academic coordinators responsible working with schools and teachers to implement necessary teaching and learning strategies. The academic coordinators coordinate the benchmark testing, evaluate test results by school and teacher, provide information and learning strategies to principals and teachers, and conduct staff development as requested;
• Providing staff development focusing on TAAS; and • Including TAAS achievement goals in each Campus Improvement
Plan that mirror or exceed district goals.
Also, at specific campuses with high percentages of minority and economically disadvantaged students, Galveston ISD principals said the keys to the schools' successes are a clear focus on instructional improvement with high expectations for all students, a clearly defined curriculum of study designed to meet the needs of students, clear and constant accountability of teachers and students for progress, a school-wide set of test-taking strategies taught by teachers and a campus focus on teaching and practicing necessary skills in reading and writing across content areas.
At one Galveston elementary school, 91 percent of the students are minorities, 79 percent are economically disadvantaged. Three years after it opened, the school achieved TEA Recognized status. The school also received an Acknowledged designation for reading.
Recommendation 3:
Use TAAS data to identify student and teacher needs and to improve student performance.
Teachers, not counselors, should be responsible for student achievement by determining appropriate learning strategies for at-risk students. Specific improvement plans and strategies should be developed for each at-risk or low-performing student.
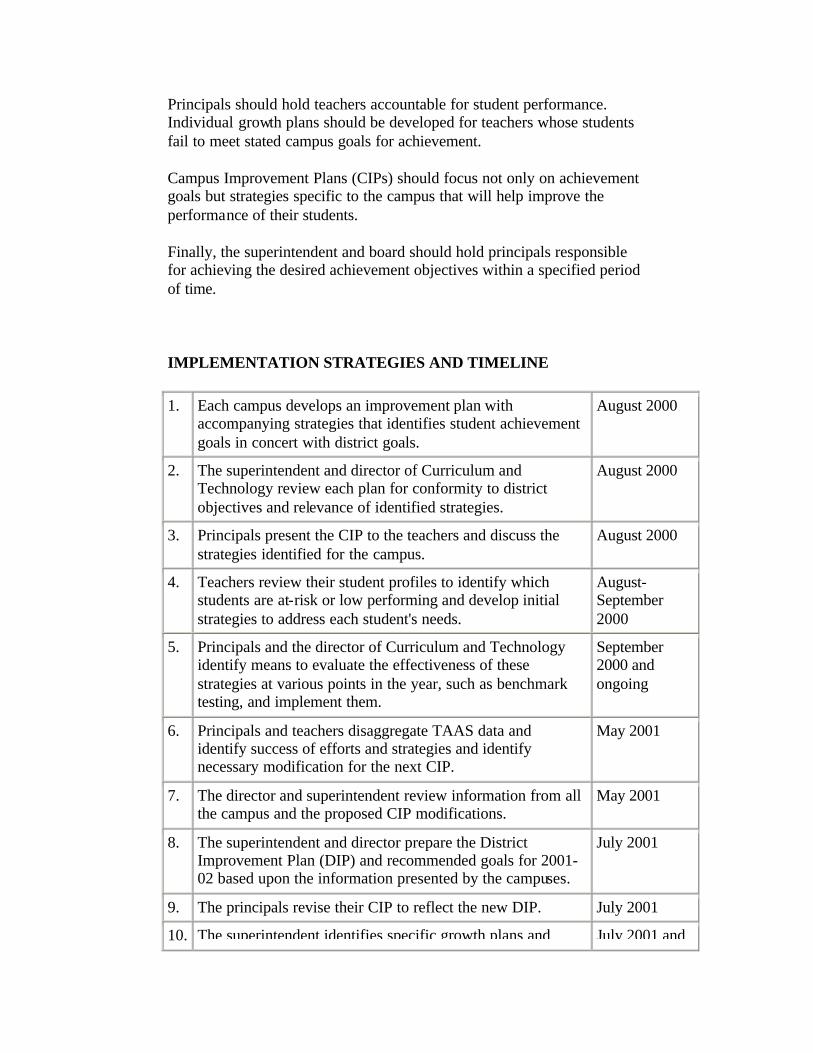
Principals should hold teachers accountable for student performance. Individual growth plans should be developed for teachers whose students fail to meet stated campus goals for achievement.
Campus Improvement Plans (CIPs) should focus not only on achievement goals but strategies specific to the campus that will help improve the performance of their students.
Finally, the superintendent and board should hold principals responsible for achieving the desired achievement objectives within a specified period of time.
IMPLEMENTATION STRATEGIES AND TIMELINE
1. Each campus develops an improvement plan with accompanying strategies that identifies student achievement goals in concert with district goals.
August 2000
2. The superintendent and director of Curriculum and Technology review each plan for conformity to district objectives and relevance of identified strategies.
August 2000
3. Principals present the CIP to the teachers and discuss the strategies identified for the campus.
August 2000
4. Teachers review their student profiles to identify which students are at-risk or low performing and develop initial strategies to address each student's needs.
August-September 2000
5. Principals and the director of Curriculum and Technology identify means to evaluate the effectiveness of these strategies at various points in the year, such as benchmark testing, and implement them.
September 2000 and ongoing
6. Principals and teachers disaggregate TAAS data and identify success of efforts and strategies and identify necessary modification for the next CIP.
May 2001
7. The director and superintendent review information from all the campus and the proposed CIP modifications.
May 2001
8. The superintendent and director prepare the District Improvement Plan (DIP) and recommended goals for 2001-02 based upon the information presented by the campuses.
July 2001
9. The principals revise their CIP to reflect the new DIP. July 2001
10. The superintendent identifies specific growth plans and July 2001 and
expectations for principal performance at appropriate campuses and monitors the plan throughout the year.
ongoing
11. The principals identify specific growth plans and expectations for individual teacher performance at their campus and monitor the plan throughout the year.
July 2001 and ongoing
FISCAL IMPACT
This recommendation can be implemented with existing resources.
FINDING
Every student enrolled in a Texas public school in grades 3-8 and 10 must be given the opportunity to take the TAAS. There are circumstances under which some students are not tested. Also, of the students who are tested, not all students' test performances are considered for a school or district's accountability ratings. The reasons for exemption or exclusion in the state's accountability ratings are as follows:
• Students may take the test, but be excluded because they were not enrolled in that district by the last Friday in the previous October
• Students may be excluded because they took the Spanish TAAS given in fifth or sixth grade, or the Spanish TAAS writing test in fourth grade;
• Students may be absent during every test administration; • Students may receive a special education Admission, Review, and
Dismissal (ARD) exemption for every test; and • Students may receive a limited English proficiency exemption
(LEP) for every test.
Exhibit 2-38 shows the exemptions from TAAS for SISD, Region 13, and the state for 1997-98 and 1998-99. ARD exemptions are granted to individual special education students in a process controlled by the ARD committee on each campus. Each special education student receives an annual evaluation of their progress by the ARD committee, which includes the regular education teacher, the special education teacher, an assessment person (e.g., diagnostician, counselor), and an administrator empowered to commit the school district to whatever services are determined necessary by the ARD committee.
LEP exemptions are also granted to individual bilingual/ESL students by the Language Proficiency Assessment Committee (LPAC) on each campus. This committee is comprised of the same types of positions as the ARD committee but instead of a special education teacher, the LPAC has a bilingual or ESL teacher.
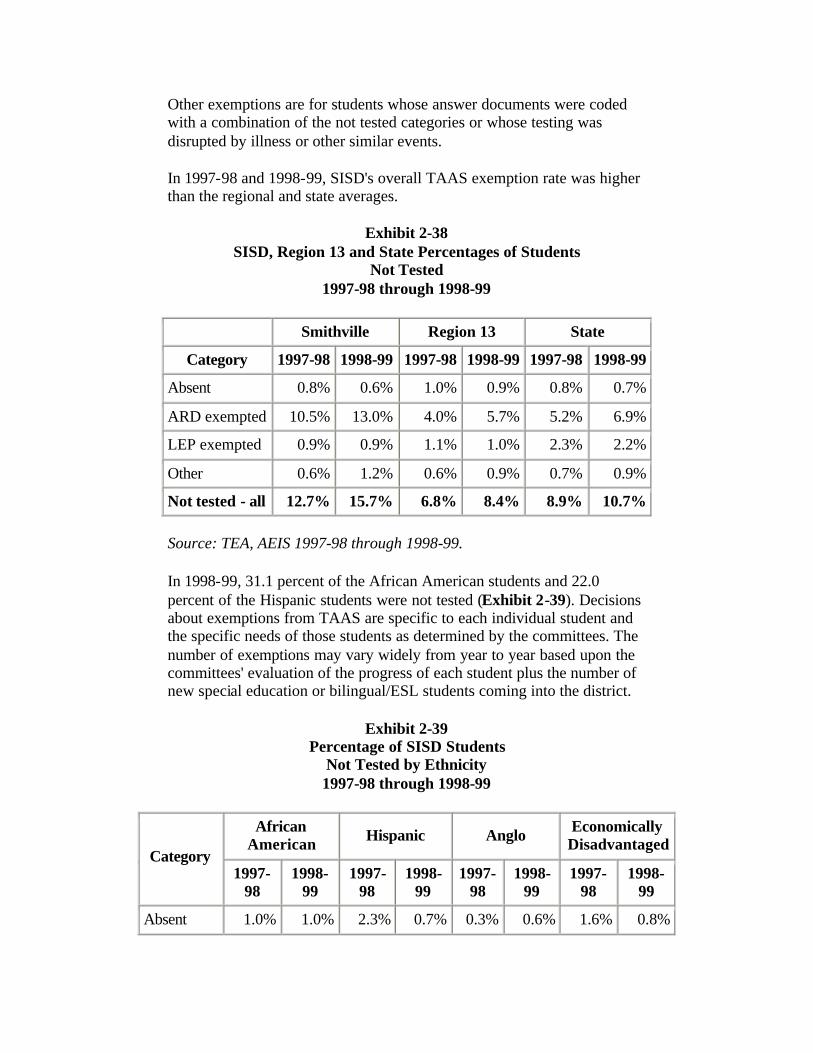
Other exemptions are for students whose answer documents were coded with a combination of the not tested categories or whose testing was disrupted by illness or other similar events.
In 1997-98 and 1998-99, SISD's overall TAAS exemption rate was higher than the regional and state averages.
Exhibit 2-38 SISD, Region 13 and State Percentages of Students
Not Tested 1997-98 through 1998-99
Smithville Region 13 State
Category 1997-98 1998-99 1997-98 1998-99 1997-98 1998-99
Absent 0.8% 0.6% 1.0% 0.9% 0.8% 0.7%
ARD exempted 10.5% 13.0% 4.0% 5.7% 5.2% 6.9%
LEP exempted 0.9% 0.9% 1.1% 1.0% 2.3% 2.2%
Other 0.6% 1.2% 0.6% 0.9% 0.7% 0.9%
Not tested - all 12.7% 15.7% 6.8% 8.4% 8.9% 10.7%
Source: TEA, AEIS 1997-98 through 1998-99.
In 1998-99, 31.1 percent of the African American students and 22.0 percent of the Hispanic students were not tested (Exhibit 2-39). Decisions about exemptions from TAAS are specific to each individual student and the specific needs of those students as determined by the committees. The number of exemptions may vary widely from year to year based upon the committees' evaluation of the progress of each student plus the number of new special education or bilingual/ESL students coming into the district.
Exhibit 2-39 Percentage of SISD Students
Not Tested by Ethnicity 1997-98 through 1998-99
African American Hispanic Anglo Economically
Disadvantaged Category
1997-98
1998-99
1997-98
1998-99
1997-98
1998-99
1997-98
1998-99
Absent 1.0% 1.0% 2.3% 0.7% 0.3% 0.6% 1.6% 0.8%
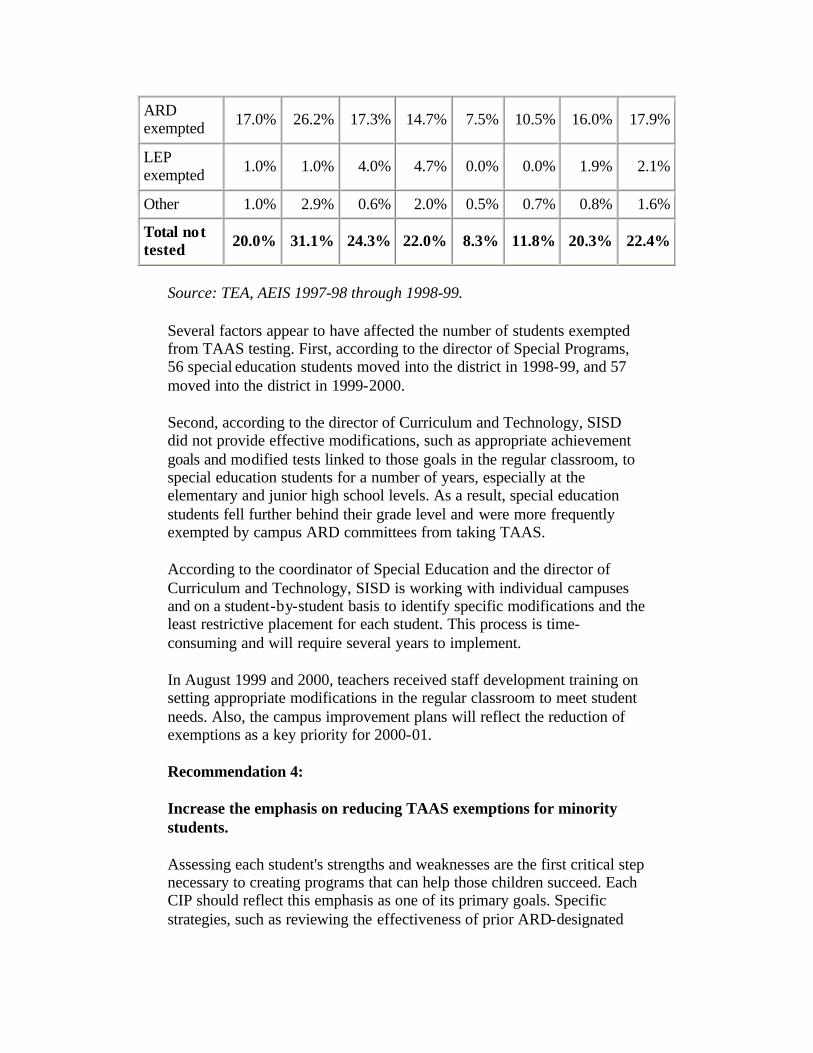
ARD exempted 17.0% 26.2% 17.3% 14.7% 7.5% 10.5% 16.0% 17.9%
LEP exempted 1.0% 1.0% 4.0% 4.7% 0.0% 0.0% 1.9% 2.1%
Other 1.0% 2.9% 0.6% 2.0% 0.5% 0.7% 0.8% 1.6%
Total not tested 20.0% 31.1% 24.3% 22.0% 8.3% 11.8% 20.3% 22.4%
Source: TEA, AEIS 1997-98 through 1998-99.
Several factors appear to have affected the number of students exempted from TAAS testing. First, according to the director of Special Programs, 56 special education students moved into the district in 1998-99, and 57 moved into the district in 1999-2000.
Second, according to the director of Curriculum and Technology, SISD did not provide effective modifications, such as appropriate achievement goals and modified tests linked to those goals in the regular classroom, to special education students for a number of years, especially at the elementary and junior high school levels. As a result, special education students fell further behind their grade level and were more frequently exempted by campus ARD committees from taking TAAS.
According to the coordinator of Special Education and the director of Curriculum and Technology, SISD is working with individual campuses and on a student-by-student basis to identify specific modifications and the least restrictive placement for each student. This process is time-consuming and will require several years to implement.
In August 1999 and 2000, teachers received staff development training on setting appropriate modifications in the regular classroom to meet student needs. Also, the campus improvement plans will reflect the reduction of exemptions as a key priority for 2000-01.
Recommendation 4:
Increase the emphasis on reducing TAAS exemptions for minority students.
Assessing each student's strengths and weaknesses are the first critical step necessary to creating programs that can help those children succeed. Each CIP should reflect this emphasis as one of its primary goals. Specific strategies, such as reviewing the effectiveness of prior ARD-designated
modifications, should be evaluated and revised or new strategies developed.
The profile and performance of each student previously exempted from the TAAS test, especially by ARD designation, should be reviewed. Grade- level assessments of student performance should be administered to see if students have improved from the prior year and are prepared to take the TAAS.
IMPLEMENTATION STRATEGIES AND TIMELINE
1. The director of Curriculum and Technology contacts several districts and the Region 13 Educational Service Center to identify successful methods of reducing TAAS exemptions.
September 2000
2. The director, special education director and principals meet to discuss the information and to develop targeted methods at each campus to reduce exemptions and monitor student achievement.
September-October 2000
3. The director develops a plan based upon these discussions and presents it to the superintendent for approval.
October 2000
4. The superintendent approves the plan, with modifications, and directs the director to implement the plan.
October 2000
5. The director implements the plan and monitors the results. November 2000 and Ongoing
FISCAL IMPACT
This recommendation can be implemented with existing resources.
FINDING
There is no regular program evaluation process in SISD. During the less than two years that the superintendent and director of Curriculum and Technology have been in their positions, program focus took a temporary back seat to addressing ind ividual campus needs, both in leadership and student performance.
Program evaluation is comprehensive, and should focus on program results and effectiveness, be independently conducted, and examine issues including:
• Economy, efficiency or effectiveness of the program; • Structure or design of the program to accomplish its goals and
objectives; • Adequacy of the program to meet needs identified by the school
board, governmental agencies or law; • Alternative methods of providing program services or products; • Program goals and objectives clearly link to and support
department, division and district priorities and strategic goals and objectives;
• Adequate benchmarks and comparisons have been set for student outcomes, program cost efficiency and cost effectiveness;
• Compliance with appropriate policies, rules and laws; and • Adequacy and appropriateness of goals, objectives and
performance measures used by the program to monitor, assess and report on program accomplishments.
Program objectives are measurable and adequately define the specific effect the program is expected to have on student achievement, especially on student performance.
The 2000-01 has minor references to program evaluation, including:
• Each campus evaluates the effectiveness of their math benchmark testing as it aligns with the TAAS and end-of-course math results; and
• Each campus assesses needs by disaggregating 2000 TAAS writing data and analyzing multi-year improvement by students, subgroups and grade levels.
The director of Curriculum and Technology is responsible for program evaluation. However, that position is also responsible for coordinating staff development, analyzing student performance data and developing districtwide strategies to improve student achievement, training principals and teachers in data disaggregation and analysis, coordinating the delivery of technology support to the campuses and monitoring implementation of district and campus improvement plans.
Effective program evaluation processes in school districts describe standards to be applied to the evaluation of all district educational programs. It involves the preparation of written curriculum guides and pacing calendars to time learning objectives to meet benchmark testing efforts; preparation of curriculum matrices tha t identify TEKS requirements by grade level and subject area; vertical alignment of curriculum and scope and sequencing of the curriculum to ensure adequate coverage of TEKS and mastery of TAAS objectives by grade level and
subject matter; and evaluation of the success of programs to meet student achievement needs.
In Waco ISD, district staff developed a What Works process that allows schools to use discretionary funds to implement a program if it meets one of three conditions:
• It is listed in the What Works compendium developed after a comprehensive review of educational research;
• The site-based decision-making committee can provide documentation showing the program has produced desired outcomes under similar circumstances; and
• It is a pilot project for which research design is developed and used to measure results for a period of time not to exceed three years. The principal and site-based committee must agree to discontinue the program if results are not achieved.
The 1990 Spring Independent School District Standard Process for Program Evaluation describes standards to be applied to the evaluation of all educational programs in Spring ISD. Its intent is "to establish program evaluation as an expected, systematic, and continuing process integrated with an organized program development cycle." The plan gathers information useful to improving, revising and determining the value of programs. Two types of evaluation are included for these purposes: evaluation designed to improve the implementation of programs in progress and to judge the merit of programs.
A select number of programs are reviewed each year. These program evaluations identify both strengths and concerns. Instructional and administrative staff and the board use evaluation results as the basis for program planning and revision. In addition to these evaluations, Spring ISD evaluates programs periodically through surveys of parents, teachers and students. Spring ISD also surveys graduates annually. Specific staff responsibilities are identified at each organizational level, with overall program coordination invested in one district-level position.
Spring ISD's five-year curriculum evaluation program was created based on Standards for Evaluation of Educational Programs, Projects and Materials, produced by the Joint Committee on Standards for Educational Evaluation. Variables addressed in the program evaluation process include:
• Measures of the Degree of Program Implementation; • Measures of Student Performance; • Measures of the Quality of Teacher Preparation and Development; • Measures of Teacher Satisfaction and Concern;
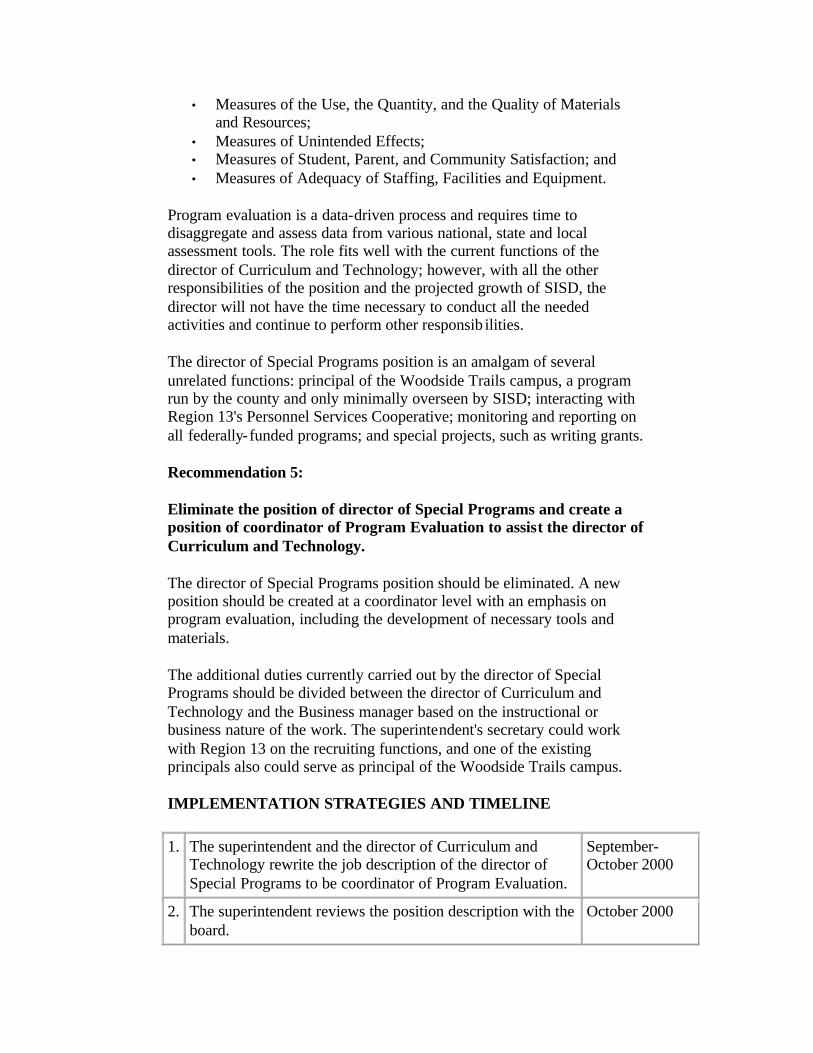
• Measures of the Use, the Quantity, and the Quality of Materials and Resources;
• Measures of Unintended Effects; • Measures of Student, Parent, and Community Satisfaction; and • Measures of Adequacy of Staffing, Facilities and Equipment.
Program evaluation is a data-driven process and requires time to disaggregate and assess data from various national, state and local assessment tools. The role fits well with the current functions of the director of Curriculum and Technology; however, with all the other responsibilities of the position and the projected growth of SISD, the director will not have the time necessary to conduct all the needed activities and continue to perform other responsib ilities.
The director of Special Programs position is an amalgam of several unrelated functions: principal of the Woodside Trails campus, a program run by the county and only minimally overseen by SISD; interacting with Region 13's Personnel Services Cooperative; monitoring and reporting on all federally-funded programs; and special projects, such as writing grants.
Recommendation 5:
Eliminate the position of director of Special Programs and create a position of coordinator of Program Evaluation to assist the director of Curriculum and Technology.
The director of Special Programs position should be eliminated. A new position should be created at a coordinator level with an emphasis on program evaluation, including the development of necessary tools and materials.
The additional duties currently carried out by the director of Special Programs should be divided between the director of Curriculum and Technology and the Business manager based on the instructional or business nature of the work. The superintendent's secretary could work with Region 13 on the recruiting functions, and one of the existing principals also could serve as principal of the Woodside Trails campus.
IMPLEMENTATION STRATEGIES AND TIMELINE
1. The superintendent and the director of Curriculum and Technology rewrite the job description of the director of Special Programs to be coordinator of Program Evaluation.
September-October 2000
2. The superintendent reviews the position description with the board.
October 2000
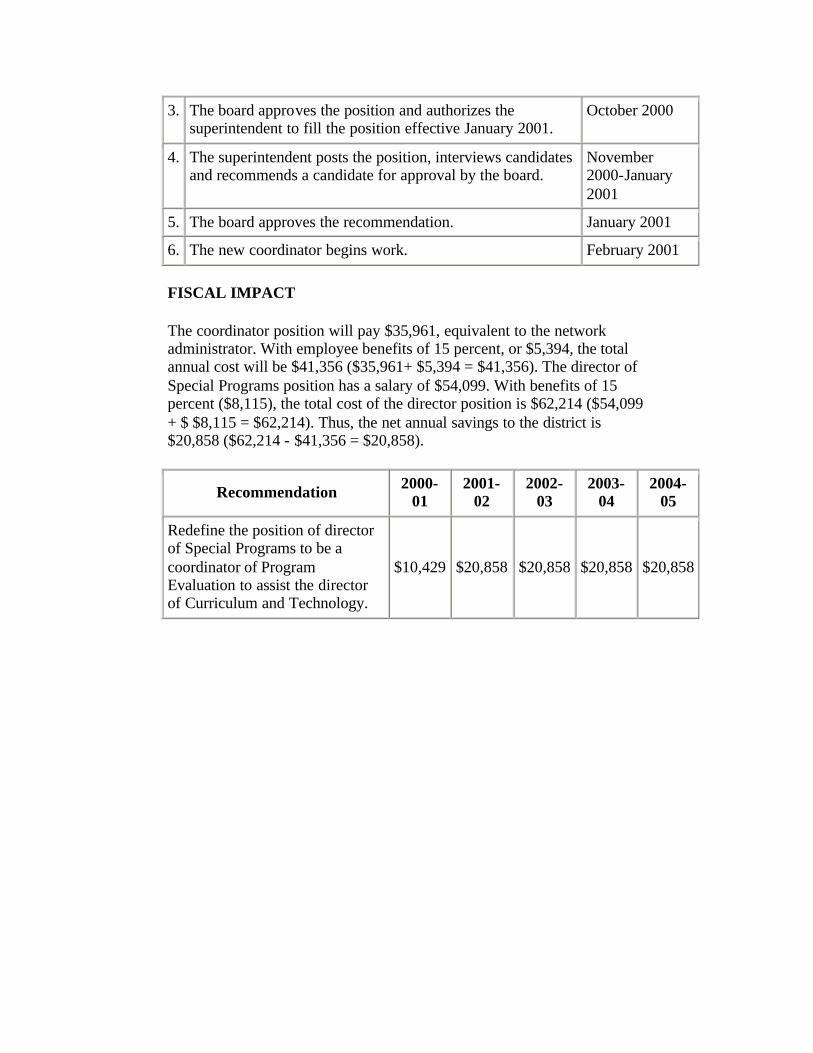
3. The board approves the position and authorizes the superintendent to fill the position effective January 2001.
October 2000
4. The superintendent posts the position, interviews candidates and recommends a candidate for approval by the board.
November 2000-January 2001
5. The board approves the recommendation. January 2001
6. The new coordinator begins work. February 2001
FISCAL IMPACT
The coordinator position will pay $35,961, equivalent to the network administrator. With employee benefits of 15 percent, or $5,394, the total annual cost will be $41,356 ($35,961+ $5,394 = $41,356). The director of Special Programs position has a salary of $54,099. With benefits of 15 percent ($8,115), the total cost of the director position is $62,214 ($54,099 + $ $8,115 = $62,214). Thus, the net annual savings to the district is $20,858 ($62,214 - $41,356 = $20,858).
Recommendation 2000-01
2001-02
2002-03
2003-04
2004-05
Redefine the position of director of Special Programs to be a coordinator of Program Evaluation to assist the director of Curriculum and Technology.
$10,429 $20,858 $20,858 $20,858 $20,858
Chapter 2
B. STAFF DEVELOPMENT
The Texas Education Code prescribes criteria for staff development in a Texas school district (Subchapter J. Staff Development, Section 21.451). The key requirements are that staff development:
• Must include training in technology, conflict resolution strategies and discipline strategies;
• May include instruction as to what is permissible under law; • Must be predominantly campus-based, related to achieving
performance objectives; and • Must be developed and approved by the campus site-based
decision-making committee.
Campus staff development may include activities that enable the campus staff to plan together to enhance existing skills, share effective strategies, reflect on curricular and instructional issues, analyze student achievement results, reflect on means of increasing student achievement, study research, practice new methods, identify students' strengths and needs, develop meaningful programs for students, appropriately implement site-based decision making, and conduct action research.
According to TEA, an effective policy on staff development needs to include:
• How needs for training will be identified; • Specific training requirements; • How campus- level staff development operates; • A focus on staff deve lopment for student achievement; • Criteria for how campus staff will be reimbursed for attending
training on their own time; • Requirements for special programs training (e.g., gifted and
talented, Title I, students with disabilities); and • Administrator training policy.
In SISD, the districtwide staff development calendar for 1998-99 was limited in content (Exhibit 2-40).
Exhibit 2-40 SISD Districtwide Staff Development
1998-99
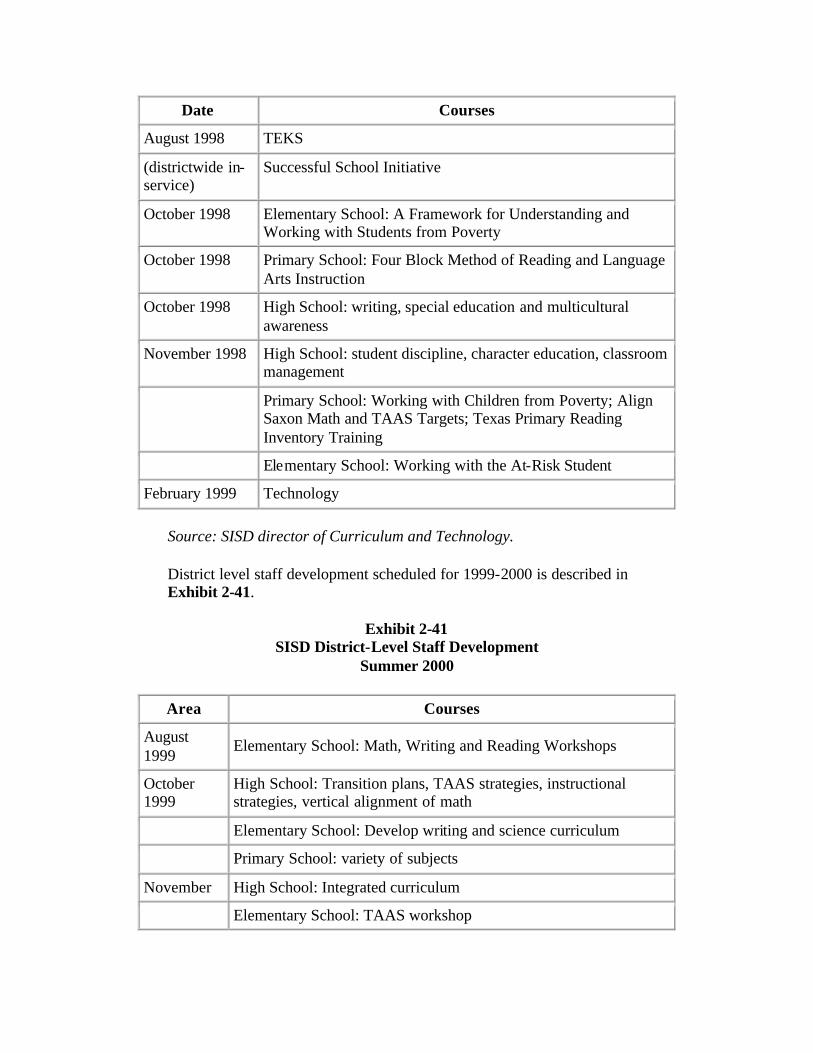
Date Courses
August 1998 TEKS
(districtwide in-service)
Successful School Initiative
October 1998 Elementary School: A Framework for Understanding and Working with Students from Poverty
October 1998 Primary School: Four Block Method of Reading and Language Arts Instruction
October 1998 High School: writing, special education and multicultural awareness
November 1998 High School: student discipline, character education, classroom management
Primary School: Working with Children from Poverty; Align Saxon Math and TAAS Targets; Texas Primary Reading Inventory Training
Elementary School: Working with the At-Risk Student
February 1999 Technology
Source: SISD director of Curriculum and Technology.
District level staff development scheduled for 1999-2000 is described in Exhibit 2-41.
Exhibit 2-41 SISD District-Level Staff Development
Summer 2000
Area Courses
August 1999
Elementary School: Math, Writing and Reading Workshops
October 1999
High School: Transition plans, TAAS strategies, instructional strategies, vertical alignment of math
Elementary School: Develop writing and science curriculum
Primary School: variety of subjects
November High School: Integrated curriculum
Elementary School: TAAS workshop
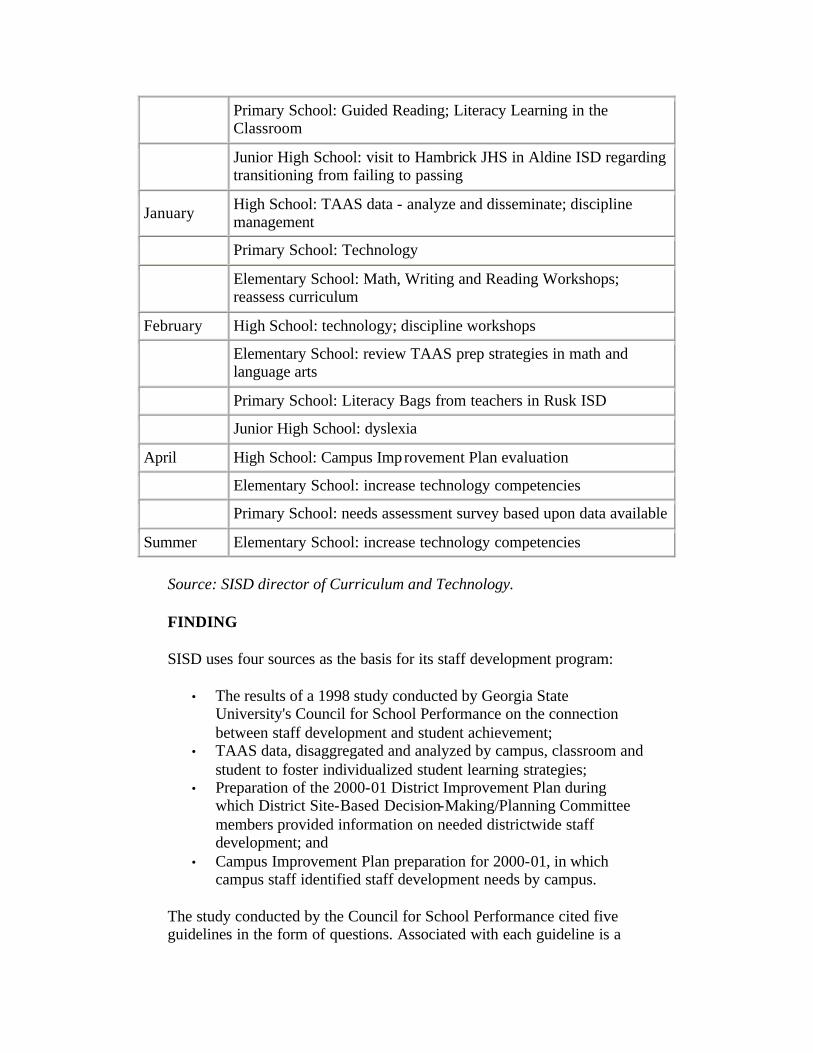
Primary School: Guided Reading; Literacy Learning in the Classroom
Junior High School: visit to Hambrick JHS in Aldine ISD regarding transitioning from failing to passing
January High School: TAAS data - analyze and disseminate; discipline management
Primary School: Technology
Elementary School: Math, Writing and Reading Workshops; reassess curriculum
February High School: technology; discipline workshops
Elementary School: review TAAS prep strategies in math and language arts
Primary School: Literacy Bags from teachers in Rusk ISD
Junior High School: dyslexia
April High School: Campus Improvement Plan evaluation
Elementary School: increase technology competencies
Primary School: needs assessment survey based upon data available
Summer Elementary School: increase technology competencies
Source: SISD director of Curriculum and Technology.
FINDING
SISD uses four sources as the basis for its staff development program:
• The results of a 1998 study conducted by Georgia State University's Council for School Performance on the connection between staff development and student achievement;
• TAAS data, disaggregated and analyzed by campus, classroom and student to foster individualized student learning strategies;
• Preparation of the 2000-01 District Improvement Plan during which District Site-Based Decision-Making/Planning Committee members provided information on needed districtwide staff development; and
• Campus Improvement Plan preparation for 2000-01, in which campus staff identified staff development needs by campus.
The study conducted by the Council for School Performance cited five guidelines in the form of questions. Associated with each guideline is a

series of conditions that, if present, would likely lead to a yes answer to the question/guideline (Exhibit 2-42).
Exhibit 2-42 Council for School Performance Staff Development Guidelines
Guideline Associated Conditions
School improvement plans and goals provide direction for staff development.
School administrators provide strong support for staff development.
Part- or full-time school staff members have multiple staff development responsibilities.
Sufficient resources, including time and funding, support staff development.
Is leadership for staff development provided in the school?
Staff development activities are integral to school operations and expectations at the school.
Teams (grade level/leadership/department) have staff development responsibilities for planning decisions, delivery and implementation.
Training in adult collaborative skills occurs regularly for teachers in the school.
The school uses a collaborative process for staff development decisions.
The decision process emphasizes results measured by student and teacher changes.
Is the faculty collectively involved in staff development decisions and implementation?
Teachers see staff development participation as essential to being professional.
Desire to improve student performance drives selection of staff development.
Teachers participate in staff development in order to have an impact on students.
Data on student performance are used in planning staff development activities.
Is staff development focused on improving student performance?
Results of staff development are monitored by changes in student performance.
Is staff development focused on the classroom?
The desire to improve curriculum and instruction drives staff development selection.
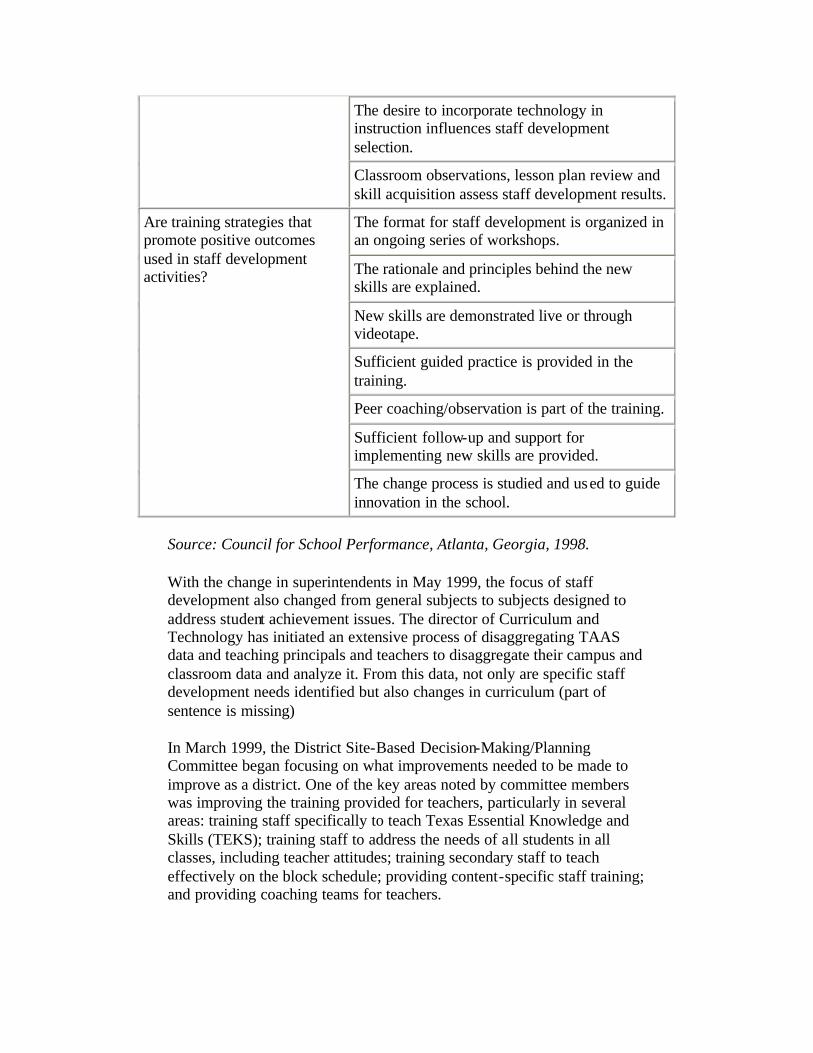
The desire to incorporate technology in instruction influences staff development selection.
Classroom observations, lesson plan review and skill acquisition assess staff development results.
The format for staff development is organized in an ongoing series of workshops.
The rationale and principles behind the new skills are explained.
New skills are demonstrated live or through videotape.
Sufficient guided practice is provided in the training.
Peer coaching/observation is part of the training.
Sufficient follow-up and support for implementing new skills are provided.
Are training strategies that promote positive outcomes used in staff development activities?
The change process is studied and used to guide innovation in the school.
Source: Council for School Performance, Atlanta, Georgia, 1998.
With the change in superintendents in May 1999, the focus of staff development also changed from general subjects to subjects designed to address student achievement issues. The director of Curriculum and Technology has initiated an extensive process of disaggregating TAAS data and teaching principals and teachers to disaggregate their campus and classroom data and analyze it. From this data, not only are specific staff development needs identified but also changes in curriculum (part of sentence is missing)
In March 1999, the District Site-Based Decision-Making/Planning Committee began focusing on what improvements needed to be made to improve as a district. One of the key areas noted by committee members was improving the training provided for teachers, particularly in several areas: training staff specifically to teach Texas Essential Knowledge and Skills (TEKS); training staff to address the needs of all students in all classes, including teacher attitudes; training secondary staff to teach effectively on the block schedule; providing content-specific staff training; and providing coaching teams for teachers.

At its December 1999 meeting, the District Site-Based Decision-Making/Planning Committee discussed an idea to consider allowing teachers to substitute a day of SISD staff development for training that teachers would receive individually from outside trainers. In exchange for going to a customized staff development session, the teacher would receive one SISD staff development day as a compensated non-attendance day. All costs associated with the customized training would be borne by the teacher.
At its January 2000 meeting, members reviewed in detail the idea of a customized staff development day. The recommendation was for one day per year to be set aside as a customized day specifically designed to fit the professional development needs of the teacher. The day would consist of a minimum of six hours of pre-approved staff development on a non-employment day (i.e., during the summer or on a Saturday). The committee asked for input from the campus site-based committees.
At its February 2000 meeting, the District Site-Based Decision-Making/Planning Committee approved and recommended to the board the customized staff development plan to be implemented with the 2000-01 school year. The effectiveness of the program will be evaluated in January 2001 by both the administration and the site-based committees. If the program proves successful, the District Site-Based Decision-Making/Planning Committee discussed expanding the program to two days per year.
Beginning in April 2000, SISD campus site-based decision-making committees reviewed campus improvement plans for 1999-2000 to determine what areas need additional staff training. Those needs were submitted to the superintendent and will be used in developing the staff development plan for 2000-01.
In February 2000, SISD began meeting with four other area districts to develop a staff development initiative, called Eastern Cluster Districts, supported by Region 13. The districts included Smithville, La Grange, Carmine, Fayetteville and Giddings. The purpose of the cluster would be to use Region 13 instructional specialists to provide staff development in a location convenient to the districts on the eastern edge of Region 13. The cluster concept would reduce travel time and costs and encourage greater participation in staff development by the participating districts.
COMMENDATION
SISD provides cost-effective staff development targeted at improving teacher skills and increasing student performance.
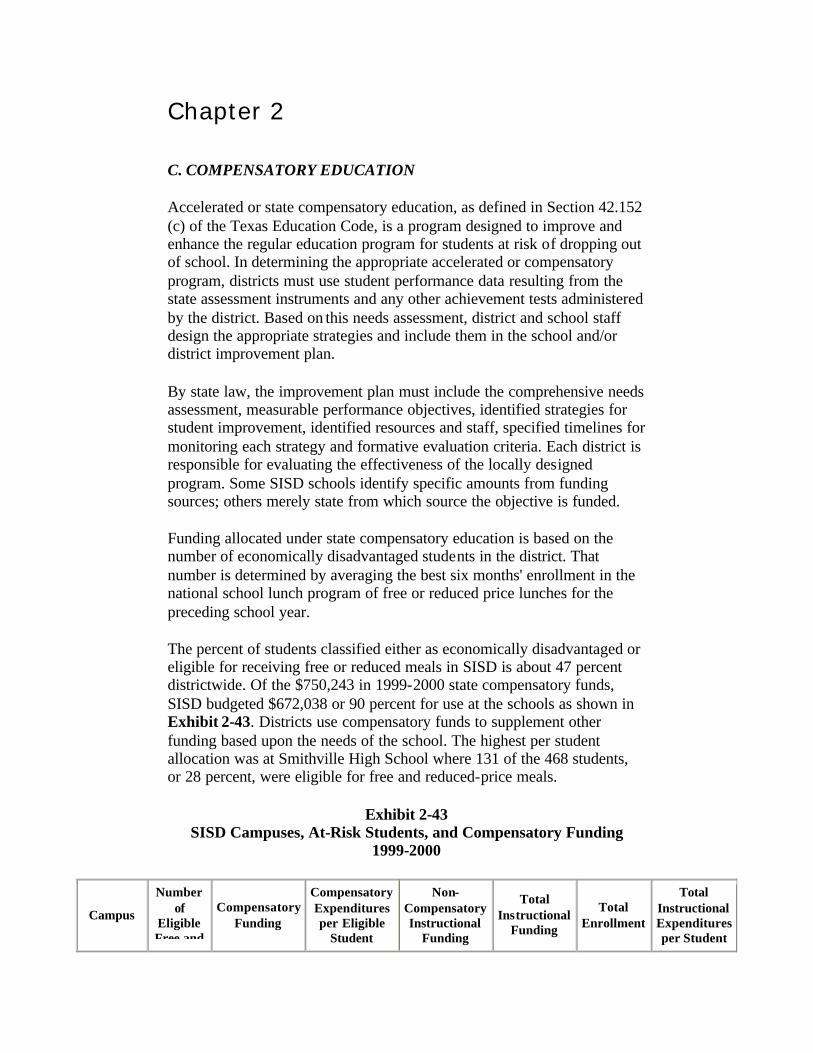
Chapter 2
C. COMPENSATORY EDUCATION
Accelerated or state compensatory education, as defined in Section 42.152 (c) of the Texas Education Code, is a program designed to improve and enhance the regular education program for students at risk of dropping out of school. In determining the appropriate accelerated or compensatory program, districts must use student performance data resulting from the state assessment instruments and any other achievement tests administered by the district. Based on this needs assessment, district and school staff design the appropriate strategies and include them in the school and/or district improvement plan.
By state law, the improvement plan must include the comprehensive needs assessment, measurable performance objectives, identified strategies for student improvement, identified resources and staff, specified timelines for monitoring each strategy and formative evaluation criteria. Each district is responsible for evaluating the effectiveness of the locally designed program. Some SISD schools identify specific amounts from funding sources; others merely state from which source the objective is funded.
Funding allocated under state compensatory education is based on the number of economically disadvantaged students in the district. That number is determined by averaging the best six months' enrollment in the national school lunch program of free or reduced price lunches for the preceding school year.
The percent of students classified either as economically disadvantaged or eligible for receiving free or reduced meals in SISD is about 47 percent districtwide. Of the $750,243 in 1999-2000 state compensatory funds, SISD budgeted $672,038 or 90 percent for use at the schools as shown in Exhibit 2-43. Districts use compensatory funds to supplement other funding based upon the needs of the school. The highest per student allocation was at Smithville High School where 131 of the 468 students, or 28 percent, were eligible for free and reduced-price meals.
Exhibit 2-43 SISD Campuses, At-Risk Students, and Compensatory Funding
1999-2000
Campus
Number of
Eligible Free and
Compensatory Funding
Compensatory Expenditures per Eligible
Student
Non-Compensatory Instructional
Funding
Total Instructional
Funding
Total Enrollment
Total Instructional Expenditures per Student
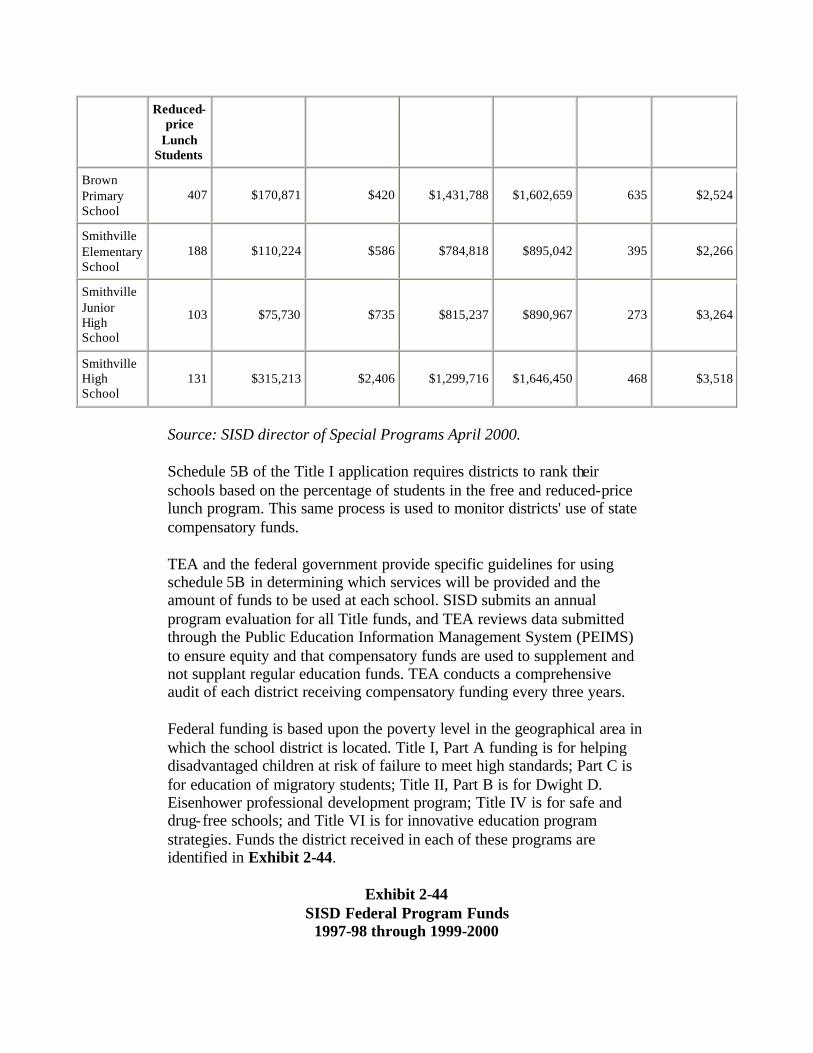
Reduced-price
Lunch Students
Brown Primary School
407 $170,871 $420 $1,431,788 $1,602,659 635 $2,524
Smithville Elementary School
188 $110,224 $586 $784,818 $895,042 395 $2,266
Smithville Junior High School
103 $75,730 $735 $815,237 $890,967 273 $3,264
Smithville High School
131 $315,213 $2,406 $1,299,716 $1,646,450 468 $3,518
Source: SISD director of Special Programs April 2000.
Schedule 5B of the Title I application requires districts to rank their schools based on the percentage of students in the free and reduced-price lunch program. This same process is used to monitor districts' use of state compensatory funds.
TEA and the federal government provide specific guidelines for using schedule 5B in determining which services will be provided and the amount of funds to be used at each school. SISD submits an annual program evaluation for all Title funds, and TEA reviews data submitted through the Public Education Information Management System (PEIMS) to ensure equity and that compensatory funds are used to supplement and not supplant regular education funds. TEA conducts a comprehensive audit of each district receiving compensatory funding every three years.
Federal funding is based upon the poverty level in the geographical area in which the school district is located. Title I, Part A funding is for helping disadvantaged children at risk of failure to meet high standards; Part C is for education of migratory students; Title II, Part B is for Dwight D. Eisenhower professional development program; Title IV is for safe and drug-free schools; and Title VI is for innovative education program strategies. Funds the district received in each of these programs are identified in Exhibit 2-44.
Exhibit 2-44 SISD Federal Program Funds
1997-98 through 1999-2000
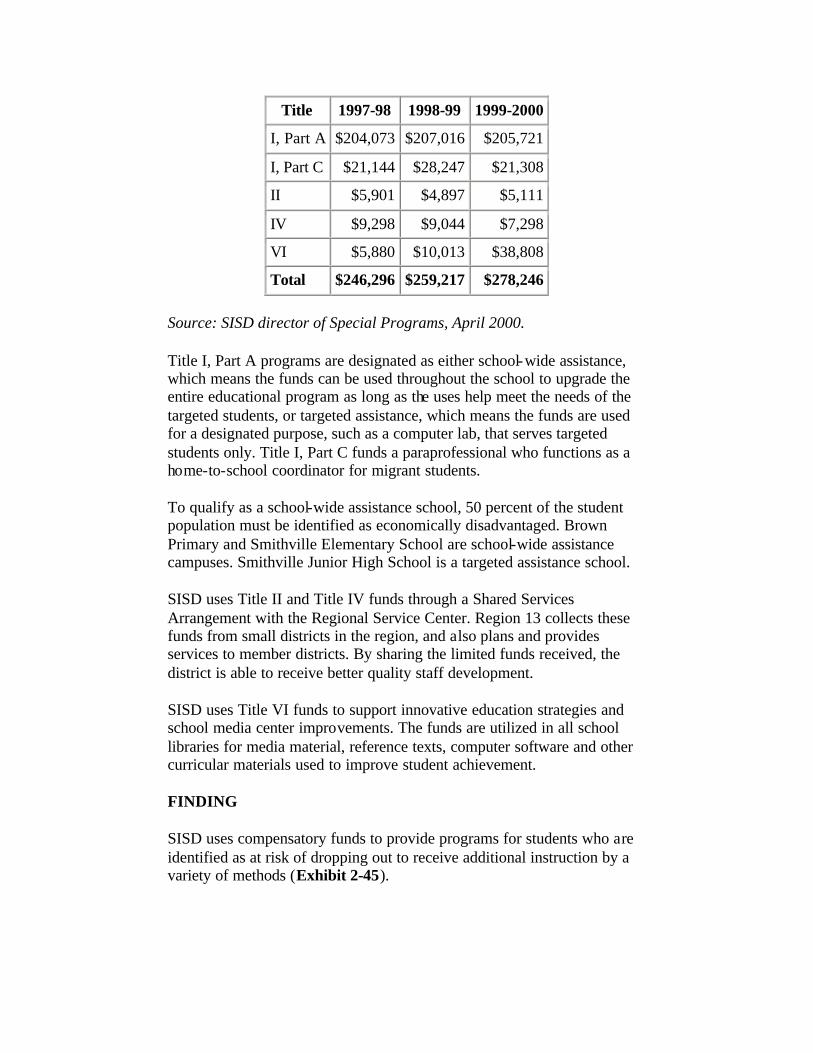
Title 1997-98 1998-99 1999-2000
I, Part A $204,073 $207,016 $205,721
I, Part C $21,144 $28,247 $21,308
II $5,901 $4,897 $5,111
IV $9,298 $9,044 $7,298
VI $5,880 $10,013 $38,808
Total $246,296 $259,217 $278,246
Source: SISD director of Special Programs, April 2000.
Title I, Part A programs are designated as either school-wide assistance, which means the funds can be used throughout the school to upgrade the entire educational program as long as the uses help meet the needs of the targeted students, or targeted assistance, which means the funds are used for a designated purpose, such as a computer lab, that serves targeted students only. Title I, Part C funds a paraprofessional who functions as a home-to-school coordinator for migrant students.
To qualify as a school-wide assistance school, 50 percent of the student population must be identified as economically disadvantaged. Brown Primary and Smithville Elementary School are school-wide assistance campuses. Smithville Junior High School is a targeted assistance school.
SISD uses Title II and Title IV funds through a Shared Services Arrangement with the Regional Service Center. Region 13 collects these funds from small districts in the region, and also plans and provides services to member districts. By sharing the limited funds received, the district is able to receive better quality staff development.
SISD uses Title VI funds to support innovative education strategies and school media center improvements. The funds are utilized in all school libraries for media material, reference texts, computer software and other curricular materials used to improve student achievement.
FINDING
SISD uses compensatory funds to provide programs for students who are identified as at risk of dropping out to receive additional instruction by a variety of methods (Exhibit 2-45).

Exhibit 2-45 SISD Compensatory Education Programs
1999-2000
Program Description Campus Location
CEI Labs CEI is a comprehensive CD-ROM based program for elementary students in language arts and math.
Brown Primary School Smithville Elementary School
Reading Recovery
Two teachers certified in the Reading Recovery Program individually teach severely at-risk readers in first grade. These teachers also work with literacy groups in first grade.
Brown Primary School
Reading and Writing Connection
Reading and Writing Connection is a program for at-risk students identified by TAAS scores. Students are enrolled in addition to their regular language arts course.
Smithville Junior High School
Challenge Program
Challenge is a program designed to provide extended instructional time for remediation of at-risk students in fourth and fifth grade.
Smithville Elementary School (Fourth and fifth grade)
Texas Scottish Rite Reading Program
Students in this program receive strategies to improve their reading performance. The students have been identified as dyslexic or Exhibit some of the signs of dyslexia.
All campuses
Optional Extended Year Program
Additional instruction is provided after school and during the summer.
Brown Primary, Smithville Elementary School and Smithville Junior High School
TAAS Reading and Math Prep Courses
Courses designed to concentrate on reading and math skills
Smithville High School
School within a School
A self-paced program for non-traditional students. Smithville High School.
Computer Lab visits
Students go as a group or individually to strengthen skills.
All campuses
Source: SISD Director of Special Programs, April 2000.
COMMENDATION
SISD implements a variety of programs designed to meet the needs of students identified as at-risk of dropping out.
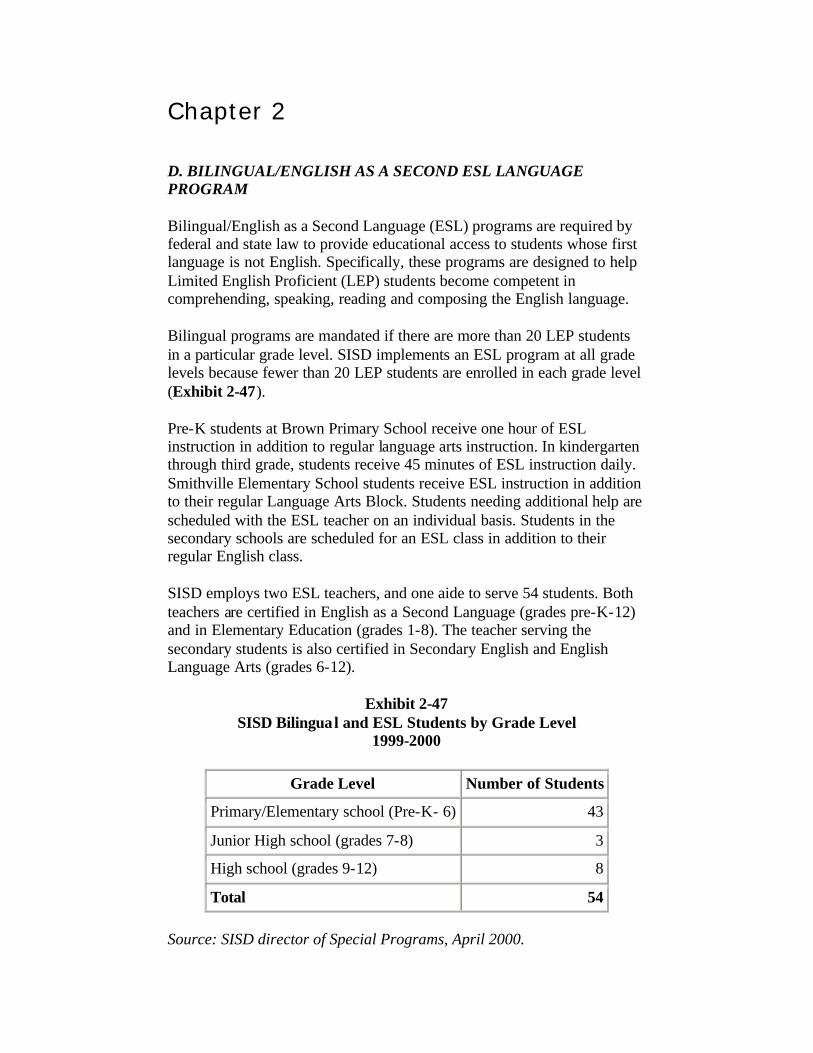
Chapter 2
D. BILINGUAL/ENGLISH AS A SECOND ESL LANGUAGE PROGRAM
Bilingual/English as a Second Language (ESL) programs are required by federal and state law to provide educational access to students whose first language is not English. Specifically, these programs are designed to help Limited English Proficient (LEP) students become competent in comprehending, speaking, reading and composing the English language.
Bilingual programs are mandated if there are more than 20 LEP students in a particular grade level. SISD implements an ESL program at all grade levels because fewer than 20 LEP students are enrolled in each grade level (Exhibit 2-47).
Pre-K students at Brown Primary School receive one hour of ESL instruction in addition to regular language arts instruction. In kindergarten through third grade, students receive 45 minutes of ESL instruction daily. Smithville Elementary School students receive ESL instruction in addition to their regular Language Arts Block. Students needing additional help are scheduled with the ESL teacher on an individual basis. Students in the secondary schools are scheduled for an ESL class in addition to their regular English class.
SISD employs two ESL teachers, and one aide to serve 54 students. Both teachers are certified in English as a Second Language (grades pre-K-12) and in Elementary Education (grades 1-8). The teacher serving the secondary students is also certified in Secondary English and English Language Arts (grades 6-12).
Exhibit 2-47 SISD Bilingual and ESL Students by Grade Level
1999-2000
Grade Level Number of Students
Primary/Elementary school (Pre-K- 6) 43
Junior High school (grades 7-8) 3
High school (grades 9-12) 8
Total 54
Source: SISD director of Special Programs, April 2000.
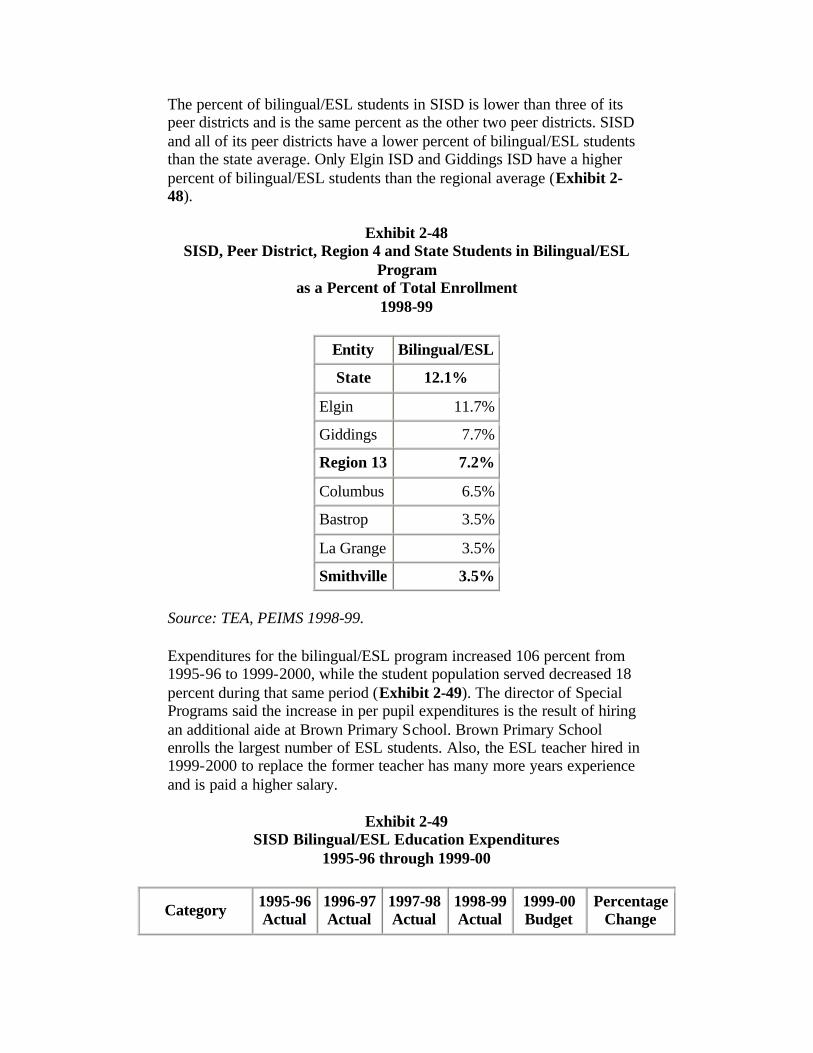
The percent of bilingual/ESL students in SISD is lower than three of its peer districts and is the same percent as the other two peer districts. SISD and all of its peer districts have a lower percent of bilingual/ESL students than the state average. Only Elgin ISD and Giddings ISD have a higher percent of bilingual/ESL students than the regional average (Exhibit 2-48).
Exhibit 2-48 SISD, Peer District, Region 4 and State Students in Bilingual/ESL
Program as a Percent of Total Enrollment
1998-99
Entity Bilingual/ESL
State 12.1%
Elgin 11.7%
Giddings 7.7%
Region 13 7.2%
Columbus 6.5%
Bastrop 3.5%
La Grange 3.5%
Smithville 3.5%
Source: TEA, PEIMS 1998-99.
Expenditures for the bilingual/ESL program increased 106 percent from 1995-96 to 1999-2000, while the student population served decreased 18 percent during that same period (Exhibit 2-49). The director of Special Programs said the increase in per pupil expenditures is the result of hiring an additional aide at Brown Primary School. Brown Primary School enrolls the largest number of ESL students. Also, the ESL teacher hired in 1999-2000 to replace the former teacher has many more years experience and is paid a higher salary.
Exhibit 2-49 SISD Bilingual/ESL Education Expenditures
1995-96 through 1999-00
Category 1995-96 Actual
1996-97 Actual
1997-98 Actual
1998-99 Actual
1999-00 Budget
Percentage Change

Bilingual/ESL expenditures $49,298 $55,748 $66,979 $67,832 $101,658 106%
Bilingual/ESL students served 66 67 71 63 54 -18%
Bilingual/ESL expenditures per student
$747 $832 $943 $1,077 $1,883 152%
Source: TEA, PEIMS, 1995-96 through 1998-99.
Compared to its peer districts SISD spends the second- lowest dollar amount on its bilingual/ESL education program, and has the third highest per student expenditure (Exhibit 2-50). It should be noted that while some districts include all state and local dollars in the bilingual/ESL program expenditures, not all districts include that funding, which may skew the comparison.
Exhibit 2-50 SISD and Peer District Bilingual/ESL Education Expenditures
1998-99 Budget
Entity Bilingual/ESL Expenditures
Expenditures per
Eligible Student
Bastrop $631,063 $3,124
La Grange $92,158 $1,336
Smithville $67,832 $1,077
Giddings $103,294 $771
Elgin $178,234 $577
Columbus $36,380 $325
Source: TEA PEIMS, 1998-99.
FINDING
Oral language proficiency tests used to identify limited English proficient students in Texas include: Pre-Idea Proficiency Test-Oral (IPT), Ages 3-5 English; IPT-Test I-Oral, Grades K-6 English, Forms C and D and IPT-Test II-Oral, Grades 7-12 English, Forms C and D.
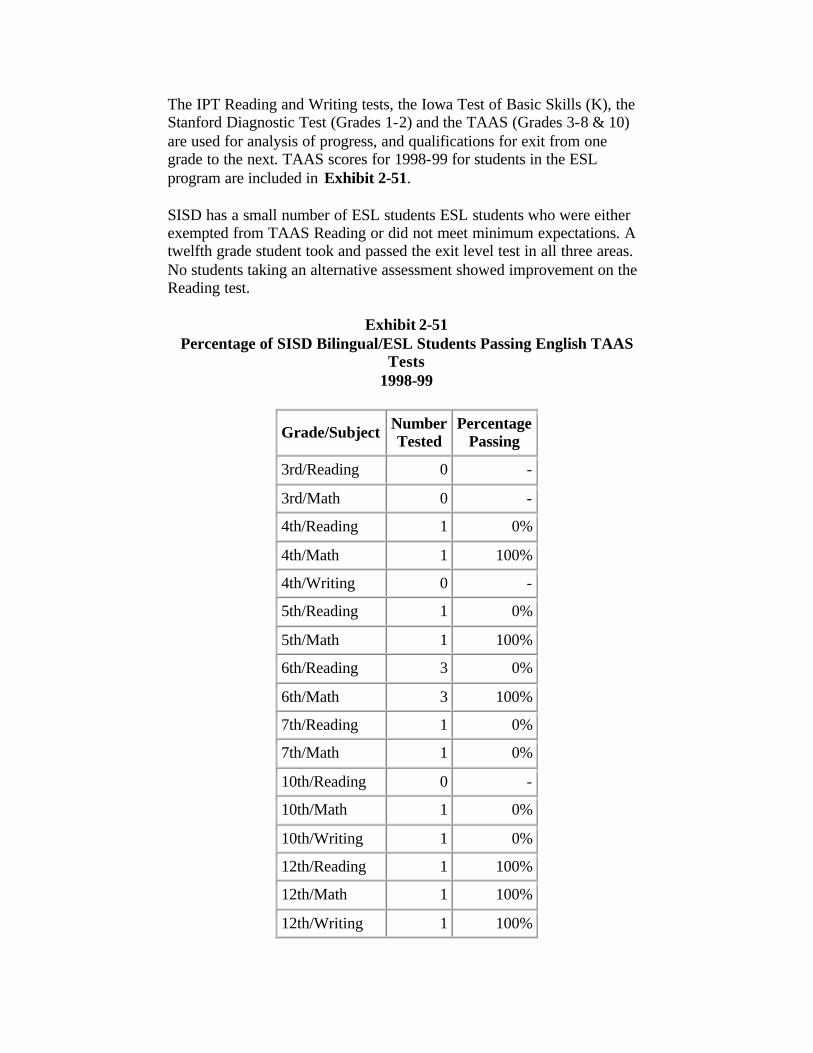
The IPT Reading and Writing tests, the Iowa Test of Basic Skills (K), the Stanford Diagnostic Test (Grades 1-2) and the TAAS (Grades 3-8 & 10) are used for analysis of progress, and qualifications for exit from one grade to the next. TAAS scores for 1998-99 for students in the ESL program are included in Exhibit 2-51.
SISD has a small number of ESL students ESL students who were either exempted from TAAS Reading or did not meet minimum expectations. A twelfth grade student took and passed the exit level test in all three areas. No students taking an alternative assessment showed improvement on the Reading test.
Exhibit 2-51 Percentage of SISD Bilingual/ESL Students Passing English TAAS
Tests 1998-99
Grade/Subject Number Tested
Percentage Passing
3rd/Reading 0 -
3rd/Math 0 -
4th/Reading 1 0%
4th/Math 1 100%
4th/Writing 0 -
5th/Reading 1 0%
5th/Math 1 100%
6th/Reading 3 0%
6th/Math 3 100%
7th/Reading 1 0%
7th/Math 1 0%
10th/Reading 0 -
10th/Math 1 0%
10th/Writing 1 0%
12th/Reading 1 100%
12th/Math 1 100%
12th/Writing 1 100%
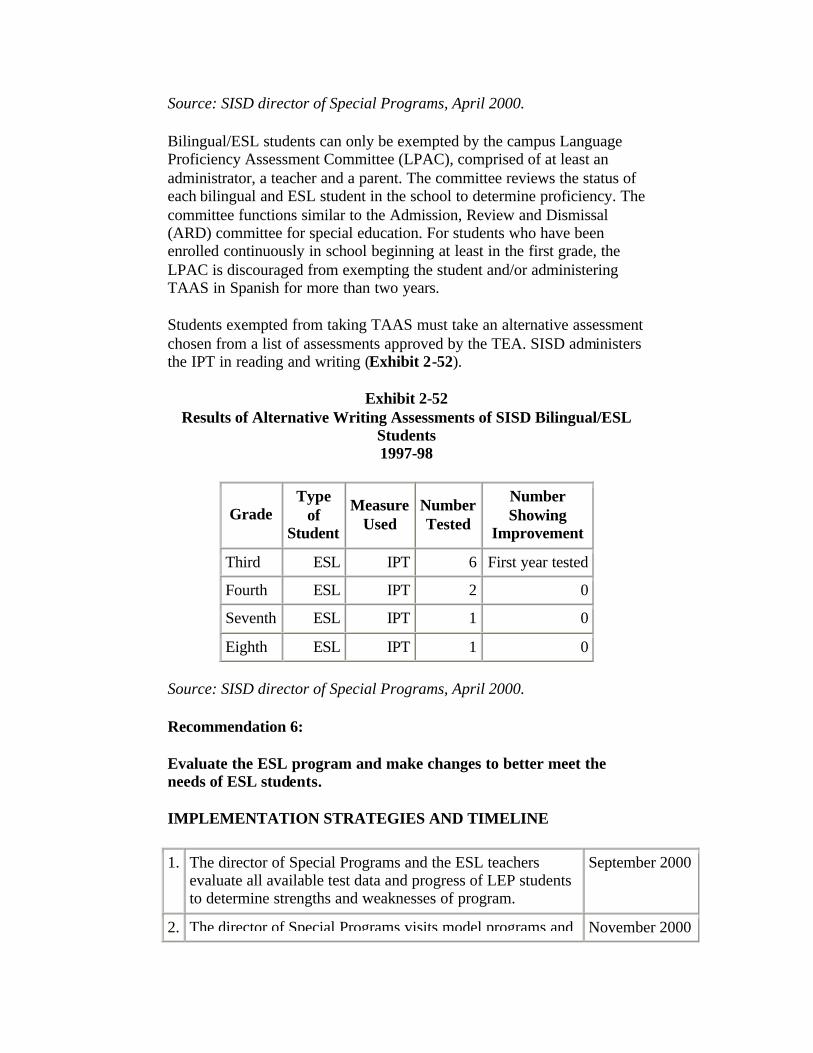
Source: SISD director of Special Programs, April 2000.
Bilingual/ESL students can only be exempted by the campus Language Proficiency Assessment Committee (LPAC), comprised of at least an administrator, a teacher and a parent. The committee reviews the status of each bilingual and ESL student in the school to determine proficiency. The committee functions similar to the Admission, Review and Dismissal (ARD) committee for special education. For students who have been enrolled continuously in school beginning at least in the first grade, the LPAC is discouraged from exempting the student and/or administering TAAS in Spanish for more than two years.
Students exempted from taking TAAS must take an alternative assessment chosen from a list of assessments approved by the TEA. SISD administers the IPT in reading and writing (Exhibit 2-52).
Exhibit 2-52 Results of Alternative Writing Assessments of SISD Bilingual/ESL
Students 1997-98
Grade Type
of Student
Measure Used
Number Tested
Number Showing
Improvement
Third ESL IPT 6 First year tested
Fourth ESL IPT 2 0
Seventh ESL IPT 1 0
Eighth ESL IPT 1 0
Source: SISD director of Special Programs, April 2000.
Recommendation 6:
Evaluate the ESL program and make changes to better meet the needs of ESL students.
IMPLEMENTATION STRATEGIES AND TIMELINE
1. The director of Special Programs and the ESL teachers evaluate all available test data and progress of LEP students to determine strengths and weaknesses of program.
September 2000
2. The director of Special Programs visits model programs and November 2000
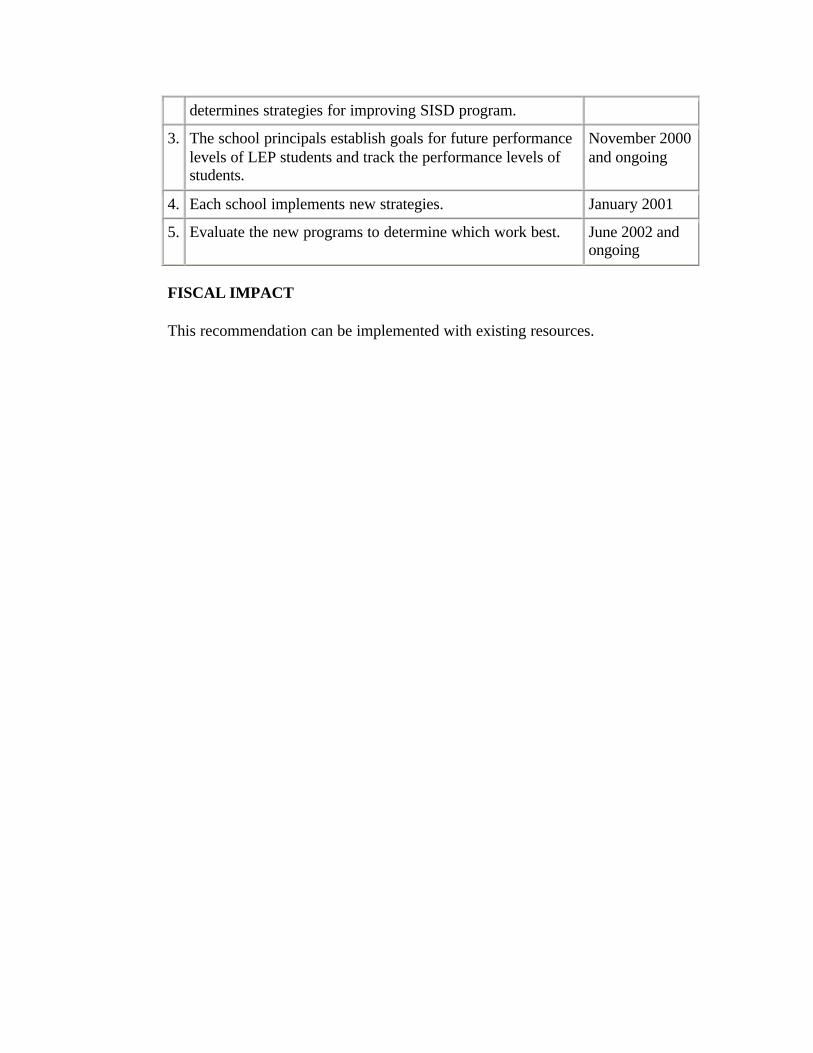
determines strategies for improving SISD program.
3. The school principals establish goals for future performance levels of LEP students and track the performance levels of students.
November 2000 and ongoing
4. Each school implements new strategies. January 2001
5. Evaluate the new programs to determine which work best. June 2002 and ongoing
FISCAL IMPACT
This recommendation can be implemented with existing resources.
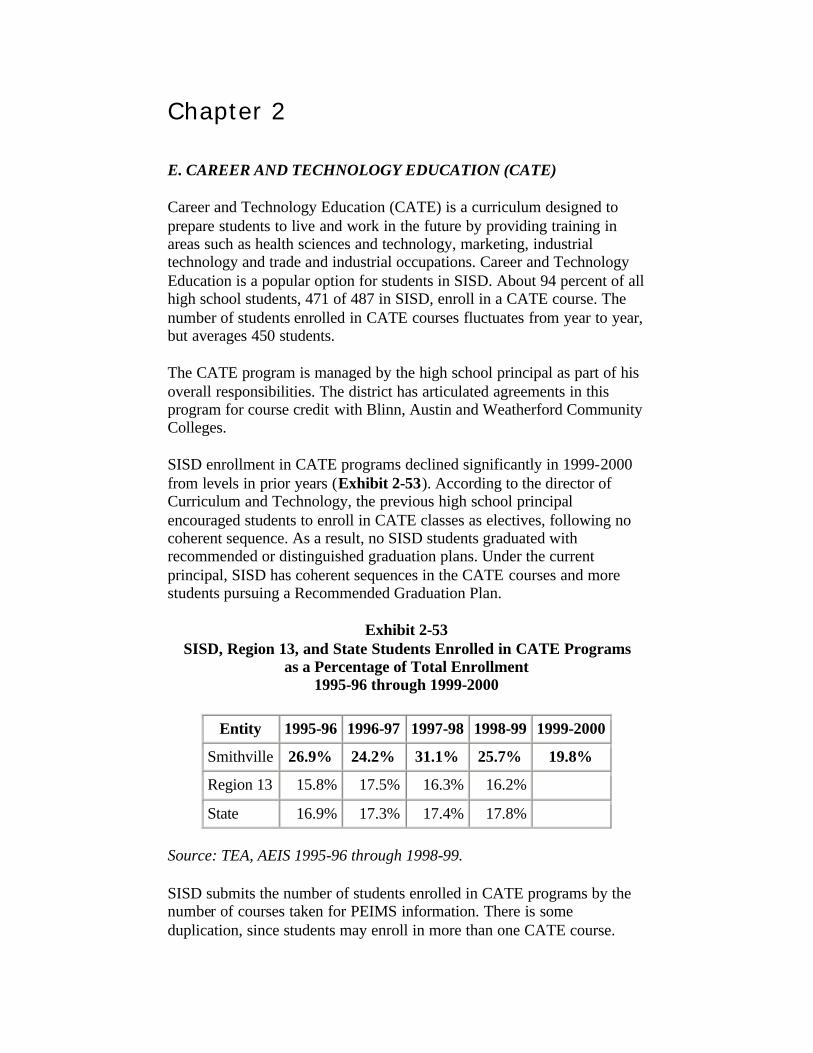
Chapter 2
E. CAREER AND TECHNOLOGY EDUCATION (CATE)
Career and Technology Education (CATE) is a curriculum designed to prepare students to live and work in the future by providing training in areas such as health sciences and technology, marketing, industrial technology and trade and industrial occupations. Career and Technology Education is a popular option for students in SISD. About 94 percent of all high school students, 471 of 487 in SISD, enroll in a CATE course. The number of students enrolled in CATE courses fluctuates from year to year, but averages 450 students.
The CATE program is managed by the high school principal as part of his overall responsibilities. The district has articulated agreements in this program for course credit with Blinn, Austin and Weatherford Community Colleges.
SISD enrollment in CATE programs declined significantly in 1999-2000 from levels in prior years (Exhibit 2-53). According to the director of Curriculum and Technology, the previous high school principal encouraged students to enroll in CATE classes as electives, following no coherent sequence. As a result, no SISD students graduated with recommended or distinguished graduation plans. Under the current principal, SISD has coherent sequences in the CATE courses and more students pursuing a Recommended Graduation Plan.
Exhibit 2-53 SISD, Region 13, and State Students Enrolled in CATE Programs
as a Percentage of Total Enrollment 1995-96 through 1999-2000
Entity 1995-96 1996-97 1997-98 1998-99 1999-2000
Smithville 26.9% 24.2% 31.1% 25.7% 19.8%
Region 13 15.8% 17.5% 16.3% 16.2%
State 16.9% 17.3% 17.4% 17.8%
Source: TEA, AEIS 1995-96 through 1998-99.
SISD submits the number of students enrolled in CATE programs by the number of courses taken for PEIMS information. There is some duplication, since students may enroll in more than one CATE course.
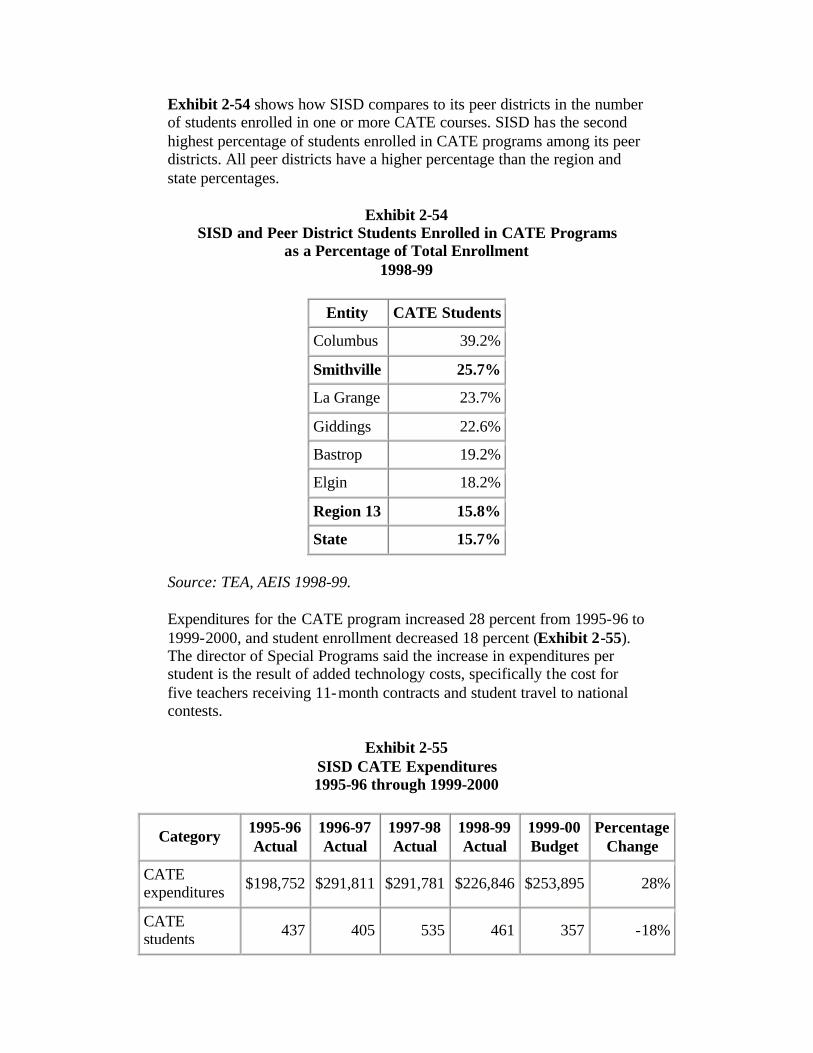
Exhibit 2-54 shows how SISD compares to its peer districts in the number of students enrolled in one or more CATE courses. SISD has the second highest percentage of students enrolled in CATE programs among its peer districts. All peer districts have a higher percentage than the region and state percentages.
Exhibit 2-54 SISD and Peer District Students Enrolled in CATE Programs
as a Percentage of Total Enrollment 1998-99
Entity CATE Students
Columbus 39.2%
Smithville 25.7%
La Grange 23.7%
Giddings 22.6%
Bastrop 19.2%
Elgin 18.2%
Region 13 15.8%
State 15.7%
Source: TEA, AEIS 1998-99.
Expenditures for the CATE program increased 28 percent from 1995-96 to 1999-2000, and student enrollment decreased 18 percent (Exhibit 2-55). The director of Special Programs said the increase in expenditures per student is the result of added technology costs, specifically the cost for five teachers receiving 11-month contracts and student travel to national contests.
Exhibit 2-55 SISD CATE Expenditures 1995-96 through 1999-2000
Category 1995-96 Actual
1996-97 Actual
1997-98 Actual
1998-99 Actual
1999-00 Budget
Percentage Change
CATE expenditures $198,752 $291,811 $291,781 $226,846 $253,895 28%
CATE students 437 405 535 461 357 -18%
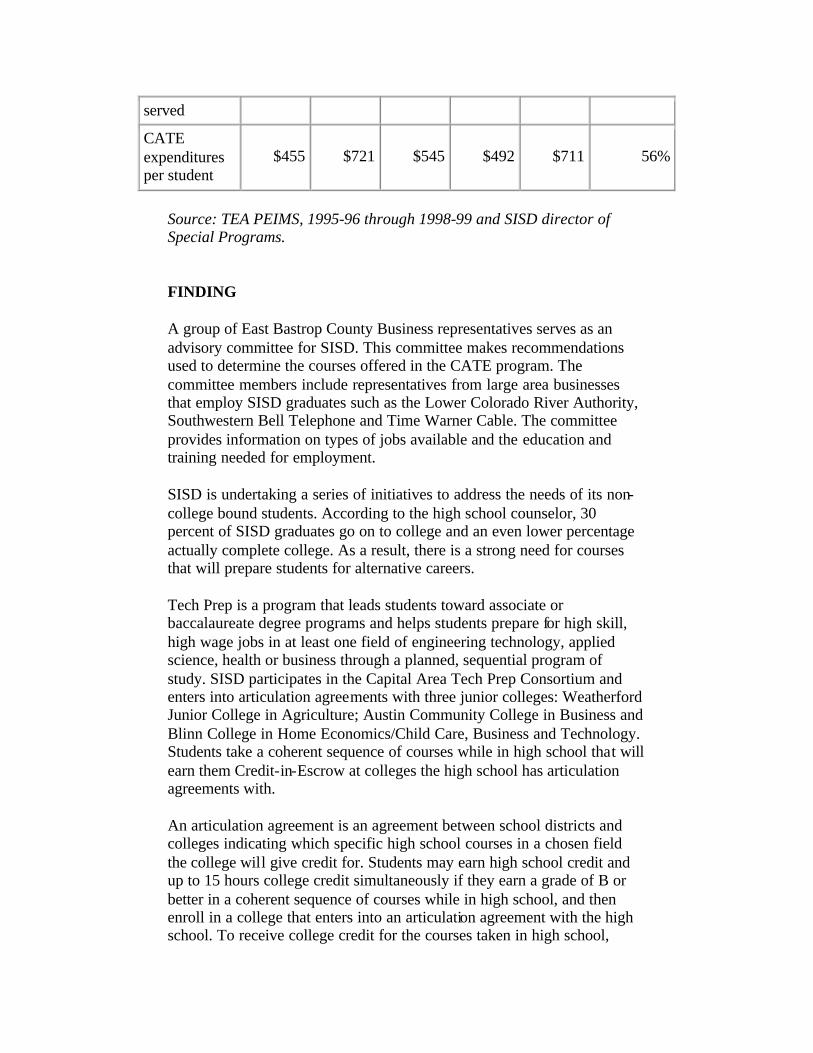
served
CATE expenditures per student
$455 $721 $545 $492 $711 56%
Source: TEA PEIMS, 1995-96 through 1998-99 and SISD director of Special Programs.
FINDING
A group of East Bastrop County Business representatives serves as an advisory committee for SISD. This committee makes recommendations used to determine the courses offered in the CATE program. The committee members include representatives from large area businesses that employ SISD graduates such as the Lower Colorado River Authority, Southwestern Bell Telephone and Time Warner Cable. The committee provides information on types of jobs available and the education and training needed for employment.
SISD is undertaking a series of initiatives to address the needs of its non-college bound students. According to the high school counselor, 30 percent of SISD graduates go on to college and an even lower percentage actually complete college. As a result, there is a strong need for courses that will prepare students for alternative careers.
Tech Prep is a program that leads students toward associate or baccalaureate degree programs and helps students prepare for high skill, high wage jobs in at least one field of engineering technology, applied science, health or business through a planned, sequential program of study. SISD participates in the Capital Area Tech Prep Consortium and enters into articulation agreements with three junior colleges: Weatherford Junior College in Agriculture; Austin Community College in Business and Blinn College in Home Economics/Child Care, Business and Technology. Students take a coherent sequence of courses while in high school that will earn them Credit-in-Escrow at colleges the high school has articulation agreements with.
An articulation agreement is an agreement between school districts and colleges indicating which specific high school courses in a chosen field the college will give credit for. Students may earn high school credit and up to 15 hours college credit simultaneously if they earn a grade of B or better in a coherent sequence of courses while in high school, and then enroll in a college that enters into an articulation agreement with the high school. To receive college credit for the courses taken in high school,

students must complete one course at Austin Community College and Weatherford Junior College. They must complete six hours at Blinn Junior College before receiving college credit for the high school courses.
The SISD course offering catalogue lists courses in a sequence or pathway for six career pathways: Horticulture, Mechanized Agriculture, Food and Fiber Production, Construction, Home Economics and Marketing. Students following a Marketing Pathway would enroll in Entrepreneurship, Principles of Marketing, Retailing, Advertising, Marketing Dynamics and Marketing Management.
SISD also offers work-based education programs in Administrative Procedures, Agriculture, Careers in Education, Home Economics, and Trades and Industry. Work-based education programs allow students to receive credit toward graduation requirements while employed. SISD pays tuition to La Grange ISD for three students enrolled in cosmetology.
SISD students may choose from about 60 CATE courses representing five different program areas, including Business and Technology Applications, Agriculture, Home Economics, Marketing and Construction Trades.
COMMENDATION
SISD solicits input from area employers and the Texas Workforce Commission to determine programs, which will lead to employment for students.
Chapter 2
F. GIFTED AND TALENTED EDUCATION PROGRAM
Since 1987, state law has required all Texas school districts to have educational programs serving the needs of gifted and talented students. The programs must be available in all districts at all grades. Gifted and talented students are characterized as having high levels of achievement, intellectual and academic ability, creativity, leadership skills and talent in the visual and performing arts.
Districts are required to have a systematic process for identifying gifted and talented students. TEA issues guidelines for the identification of gifted and talented students in an effort to ensure all of these students receive a quality education. The process must include quantitative as well as qualitative evaluation tools and instruments. Funding for the identification of gifted and talented students and programs is available through the Texas Foundation School Program. This program is intended to provide gifted and talented programs for students from various cultural, linguistic and socioeconomic backgrounds.
Students are nominated for the Talent Pool (K-2) and gifted and talented (G/T) program (3-12) by parents, community members, counselors, teachers or administrators. Students in grades 7-12 may nominate themselves. A nomination form must be completed on each student nominated.
Nominations for the G/T program are accepted during each spring semester. After students are nominated, they are screened for selection by a committee through the use of multiple and specific criteria which includes both objective and subjective measures.
All kindergarten students are assessed at the beginning of the spring semester and a selected percent of students are served in the Talent Pool. The measures used in Talent Pool screening are: 1) SAGES-P Test-Reasoning section: Aptitude, 2) Torrance Test of Creative Thinking and 3) SAGES-P-General Information section: Achievement. The selected students must demonstrate above-average ability or potential in the areas of general intellectual ability and/or creative and productive thinking. At the end of the second grade the students are screened again to determine qualifiers for the G/T program. Students are reassessed again when they move from elementary to junior high school.
The following measures are used for G/T screening:

• Achievement Test data: 96% or better ninth stanine on TAAS, ITBS;
• Student ability data: 96% or better or ninth stanine on Matrix Analogy Test, Otis-Lenon Test or other ability test selected by the district;
• Student Creativity data: 77% or better or seventh stanine on the Torrance test of Creative Thinking;
• Renzulli-Hartman behavior Characteristics of Superior Students: (teacher rating) rating of 80; and
• Renzulli-Hartman Behavior Characteristics of Superior Student: (parent rating) rating of 80.
The selection committee, composed of the principal, the counselor, G/T teacher and school coordinator, reviews the information on each student. All personnel on the selection committee must have received training in the nature and needs of gifted/talented students and program options.
To be selected for the program, students must rate at or above the designated score on the first three criteria listed above. Criteria four or five may be substituted for one of the first three criteria.
The selection committee determines if additional information is needed. Additional information may include cumulative records, additional tests or interviews with the parents. The school coordinator compiles the list of eligible students. Written permission is secured form the parents for acceptance into the program.
Transfer students who were served in Talent Pools or G/T programs in other school districts must qualify by SISD criteria for the gifted and talented program. If the student was in a gifted and talented program in his/her prior district, the selection committee reviews the student's records to determine if a Talent Pool or a G/T placement is appropriate. The committee makes the determination within 30 school days of enrollment in SISD and bases its decision on the transferred records, observation reports of SISD teachers who instruct the student, additional local testing as appropriate, and student and parent conferences. SISD immediately places students who transfer during the school year in SISD's Talent Pool or G/T programs if the selection committee determines the other school's criteria is equivalent to SISD's.
The selection committee places students who are unable to maintain satisfactory performance in the program on furlough. The purpose of a furlough is to provide the student an opportunity to attain performance goals established by the selection committee. A furlough is granted at the request of the student and/or parent. A student is furloughed for a period of time deemed appropriate by the selection committee. At the end of the

furlough, the selection committee reassesses the student's progress and the student reenters the program, is removed from the program or is placed on another furlough.
SISD's enrollment in the gifted and talented program is slightly below the state average and slightly above the regional average (Exhibit 2-56). SISD enrollment in the gifted and talented education program is higher than all of its peer districts.
Exhibit 2-56 SISD, Peer District, Region 13 and State Students in
Gifted and Talented Program as a Percentage of Total Enrollment 1998-99
Entity Gifted and Talented
State 8.4%
Smithville 8.0%
Region 13 7.7%
Giddings 6.2%
Elgin 5.6%
Bastrop 5.5%
La Grange 4.7%
Columbus 4.4%
Source: TEA, PEIMS 1998-99.
SISD expenditures for the gifted and talented program are described in Exhibit 2-57. Total and per student funding have decreased by 83 and 75 percent respectively since 1995-96. The number of students in the program also decreased by 22 percent over the same period. The dramatic decrease in expenditures is due to removing the salaries for the G/T specialists from the budgeted expenditures.
Exhibit 2-57 SISD Expenditures for the Gifted and Talented Education Program
1995-96 through 1999-2000
Category 1995-96 Actual
1996-97 Actual
1997-98
Actual
1998-99
Actual
1999-2000
Budget
Percentage Change
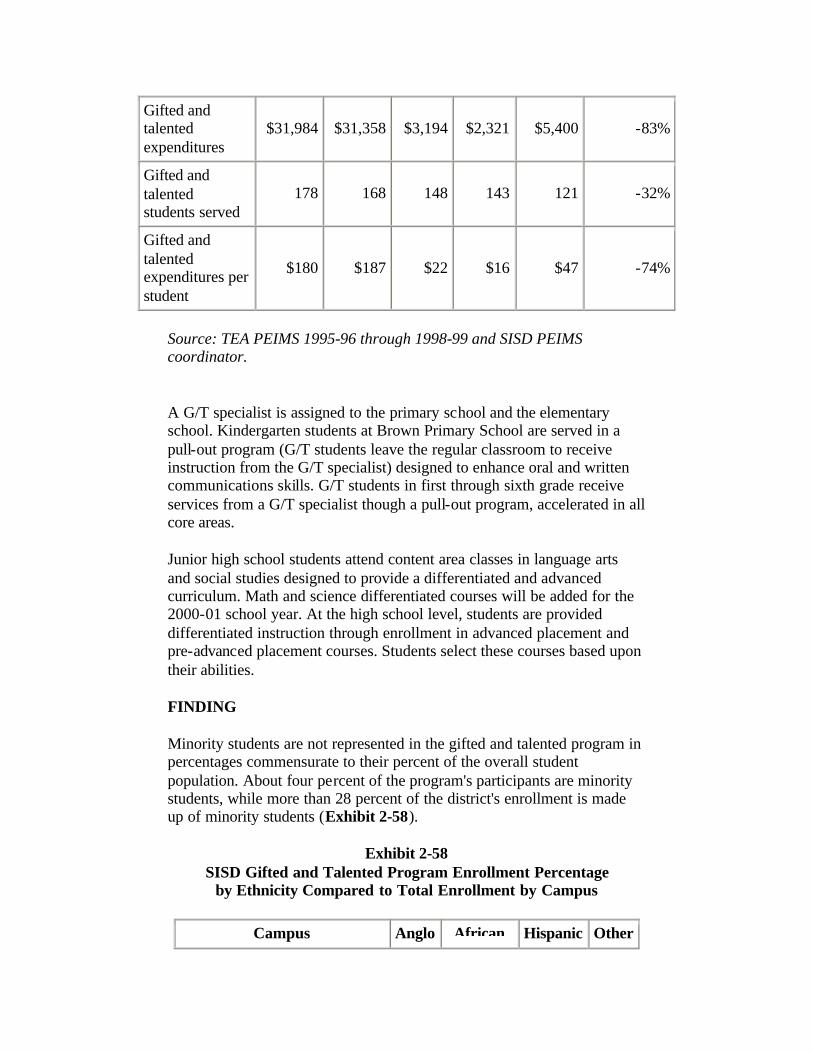
Gifted and talented expenditures
$31,984 $31,358 $3,194 $2,321 $5,400 -83%
Gifted and talented students served
178 168 148 143 121 -32%
Gifted and talented expenditures per student
$180 $187 $22 $16 $47 -74%
Source: TEA PEIMS 1995-96 through 1998-99 and SISD PEIMS coordinator.
A G/T specialist is assigned to the primary school and the elementary school. Kindergarten students at Brown Primary School are served in a pull-out program (G/T students leave the regular classroom to receive instruction from the G/T specialist) designed to enhance oral and written communications skills. G/T students in first through sixth grade receive services from a G/T specialist though a pull-out program, accelerated in all core areas.
Junior high school students attend content area classes in language arts and social studies designed to provide a differentiated and advanced curriculum. Math and science differentiated courses will be added for the 2000-01 school year. At the high school level, students are provided differentiated instruction through enrollment in advanced placement and pre-advanced placement courses. Students select these courses based upon their abilities.
FINDING
Minority students are not represented in the gifted and talented program in percentages commensurate to their percent of the overall student population. About four percent of the program's participants are minority students, while more than 28 percent of the district's enrollment is made up of minority students (Exhibit 2-58).
Exhibit 2-58 SISD Gifted and Talented Program Enrollment Percentage
by Ethnicity Compared to Total Enrollment by Campus
Campus Anglo African Hispanic Other
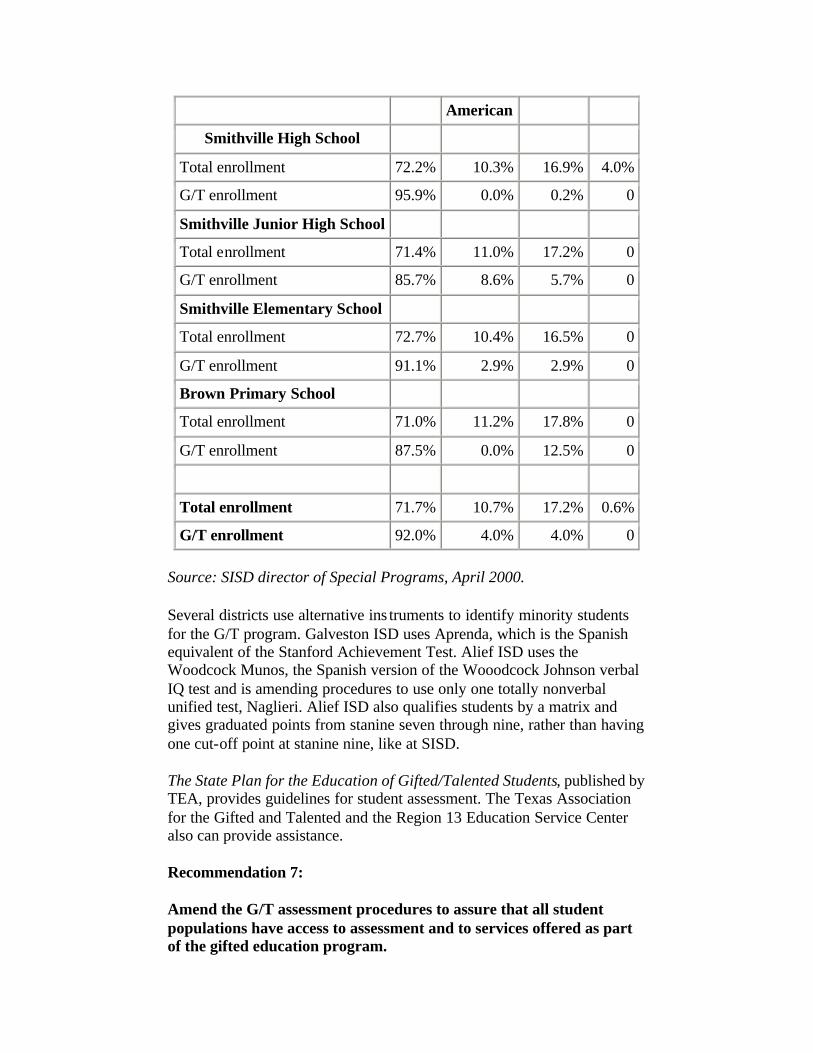
American
Smithville High School
Total enrollment 72.2% 10.3% 16.9% 4.0%
G/T enrollment 95.9% 0.0% 0.2% 0
Smithville Junior High School
Total enrollment 71.4% 11.0% 17.2% 0
G/T enrollment 85.7% 8.6% 5.7% 0
Smithville Elementary School
Total enrollment 72.7% 10.4% 16.5% 0
G/T enrollment 91.1% 2.9% 2.9% 0
Brown Primary School
Total enrollment 71.0% 11.2% 17.8% 0
G/T enrollment 87.5% 0.0% 12.5% 0
Total enrollment 71.7% 10.7% 17.2% 0.6%
G/T enrollment 92.0% 4.0% 4.0% 0
Source: SISD director of Special Programs, April 2000.
Several districts use alternative ins truments to identify minority students for the G/T program. Galveston ISD uses Aprenda, which is the Spanish equivalent of the Stanford Achievement Test. Alief ISD uses the Woodcock Munos, the Spanish version of the Wooodcock Johnson verbal IQ test and is amending procedures to use only one totally nonverbal unified test, Naglieri. Alief ISD also qualifies students by a matrix and gives graduated points from stanine seven through nine, rather than having one cut-off point at stanine nine, like at SISD.
The State Plan for the Education of Gifted/Talented Students, published by TEA, provides guidelines for student assessment. The Texas Association for the Gifted and Talented and the Region 13 Education Service Center also can provide assistance.
Recommendation 7:
Amend the G/T assessment procedures to assure that all student populations have access to assessment and to services offered as part of the gifted education program.
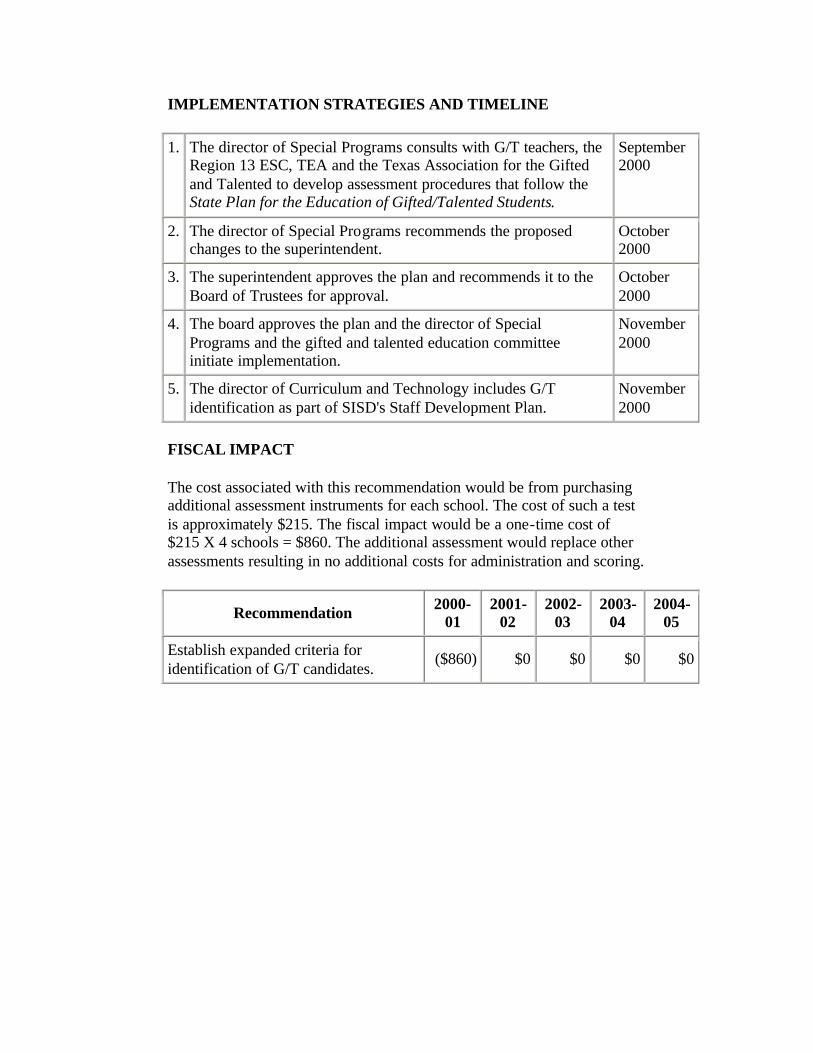
IMPLEMENTATION STRATEGIES AND TIMELINE
1. The director of Special Programs consults with G/T teachers, the Region 13 ESC, TEA and the Texas Association for the Gifted and Talented to develop assessment procedures that follow the State Plan for the Education of Gifted/Talented Students.
September 2000
2. The director of Special Programs recommends the proposed changes to the superintendent.
October 2000
3. The superintendent approves the plan and recommends it to the Board of Trustees for approval.
October 2000
4. The board approves the plan and the director of Special Programs and the gifted and talented education committee initiate implementation.
November 2000
5. The director of Curriculum and Technology includes G/T identification as part of SISD's Staff Development Plan.
November 2000
FISCAL IMPACT
The cost associated with this recommendation would be from purchasing additional assessment instruments for each school. The cost of such a test is approximately $215. The fiscal impact would be a one-time cost of $215 X 4 schools = $860. The additional assessment would replace other assessments resulting in no additional costs for administration and scoring.
Recommendation 2000-01
2001-02
2002-03
2003-04
2004-05
Establish expanded criteria for identification of G/T candidates.
($860) $0 $0 $0 $0
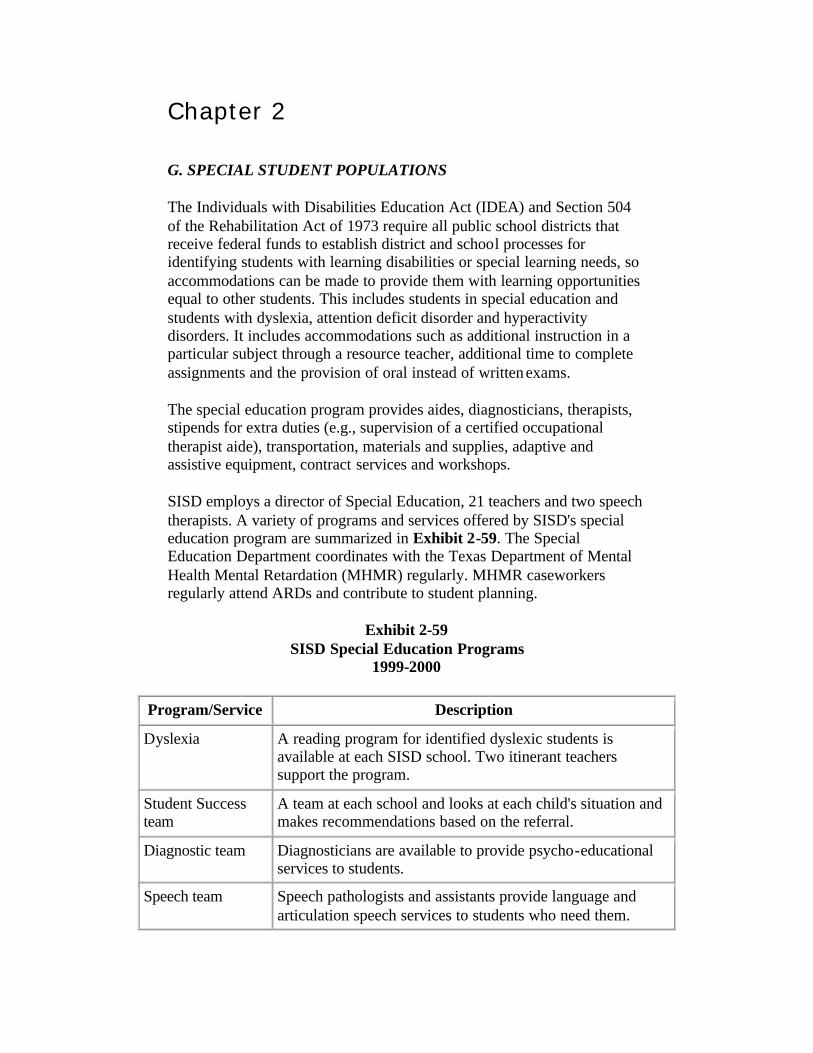
Chapter 2
G. SPECIAL STUDENT POPULATIONS
The Individuals with Disabilities Education Act (IDEA) and Section 504 of the Rehabilitation Act of 1973 require all public school districts that receive federal funds to establish district and school processes for identifying students with learning disabilities or special learning needs, so accommodations can be made to provide them with learning opportunities equal to other students. This includes students in special education and students with dyslexia, attention deficit disorder and hyperactivity disorders. It includes accommodations such as additional instruction in a particular subject through a resource teacher, additional time to complete assignments and the provision of oral instead of written exams.
The special education program provides aides, diagnosticians, therapists, stipends for extra duties (e.g., supervision of a certified occupational therapist aide), transportation, materials and supplies, adaptive and assistive equipment, contract services and workshops.
SISD employs a director of Special Education, 21 teachers and two speech therapists. A variety of programs and services offered by SISD's special education program are summarized in Exhibit 2-59. The Special Education Department coordinates with the Texas Department of Mental Health Mental Retardation (MHMR) regularly. MHMR caseworkers regularly attend ARDs and contribute to student planning.
Exhibit 2-59 SISD Special Education Programs
1999-2000
Program/Service Description
Dyslexia A reading program for identified dyslexic students is available at each SISD school. Two itinerant teachers support the program.
Student Success team
A team at each school and looks at each child's situation and makes recommendations based on the referral.
Diagnostic team Diagnosticians are available to provide psycho-educational services to students.
Speech team Speech pathologists and assistants provide language and articulation speech services to students who need them.
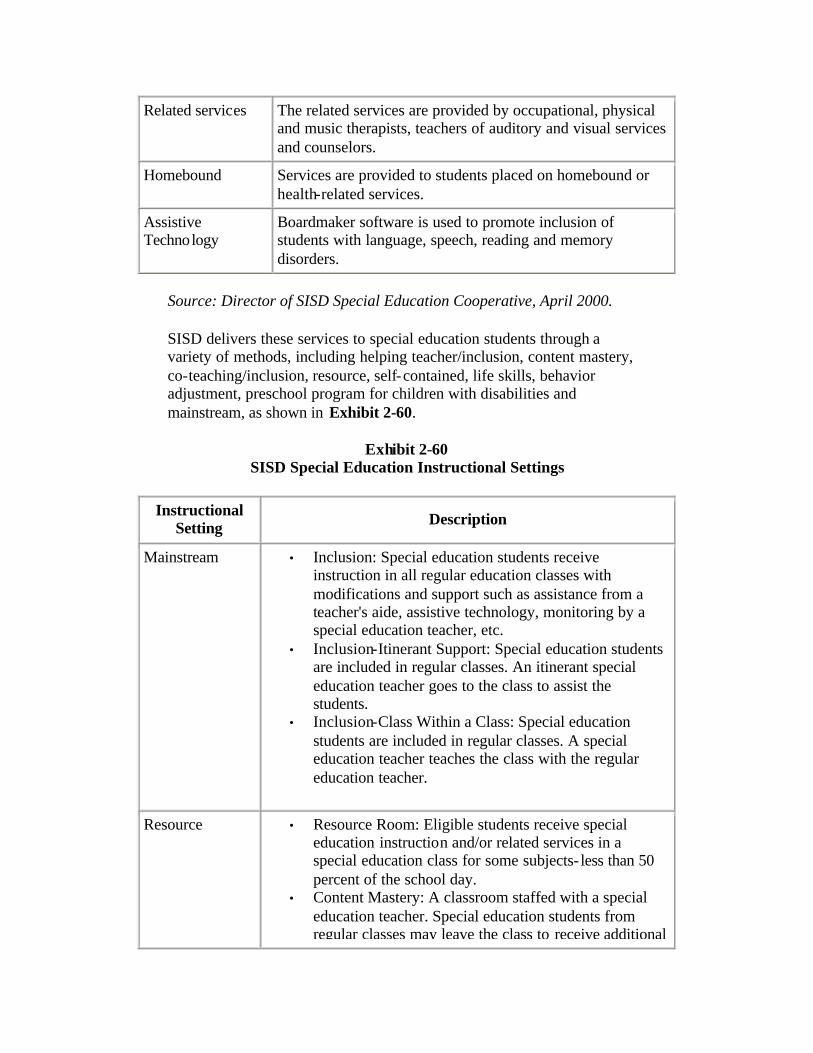
Related services The related services are provided by occupational, physical and music therapists, teachers of auditory and visual services and counselors.
Homebound Services are provided to students placed on homebound or health-related services.
Assistive Technology
Boardmaker software is used to promote inclusion of students with language, speech, reading and memory disorders.
Source: Director of SISD Special Education Cooperative, April 2000.
SISD delivers these services to special education students through a variety of methods, including helping teacher/inclusion, content mastery, co-teaching/inclusion, resource, self-contained, life skills, behavior adjustment, preschool program for children with disabilities and mainstream, as shown in Exhibit 2-60.
Exhibit 2-60 SISD Special Education Instructional Settings
Instructional Setting Description
Mainstream • Inclusion: Special education students receive instruction in all regular education classes with modifications and support such as assistance from a teacher's aide, assistive technology, monitoring by a special education teacher, etc.
• Inclusion-Itinerant Support: Special education students are included in regular classes. An itinerant special education teacher goes to the class to assist the students.
• Inclusion-Class Within a Class: Special education students are included in regular classes. A special education teacher teaches the class with the regular education teacher.
Resource • Resource Room: Eligible students receive special education instruction and/or related services in a special education class for some subjects- less than 50 percent of the school day.
• Content Mastery: A classroom staffed with a special education teacher. Special education students from regular classes may leave the class to receive additional
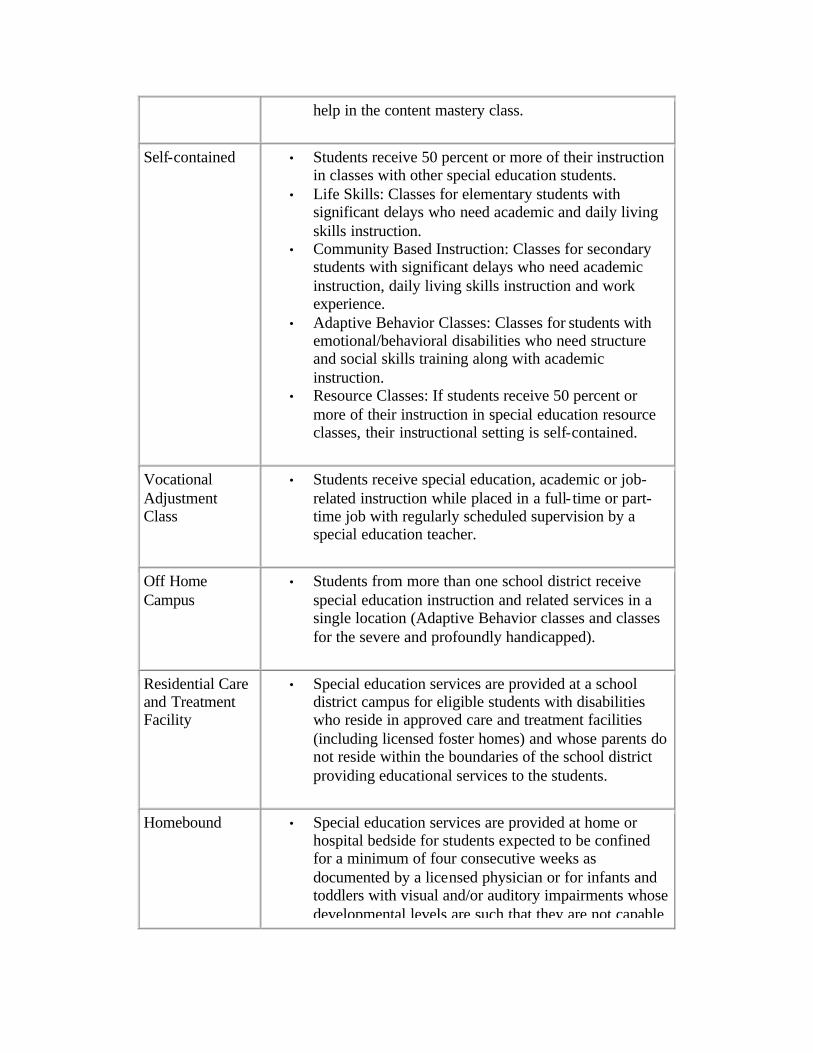
help in the content mastery class.
Self-contained • Students receive 50 percent or more of their instruction in classes with other special education students.
• Life Skills: Classes for elementary students with significant delays who need academic and daily living skills instruction.
• Community Based Instruction: Classes for secondary students with significant delays who need academic instruction, daily living skills instruction and work experience.
• Adaptive Behavior Classes: Classes for students with emotional/behavioral disabilities who need structure and social skills training along with academic instruction.
• Resource Classes: If students receive 50 percent or more of their instruction in special education resource classes, their instructional setting is self-contained.
Vocational Adjustment Class
• Students receive special education, academic or job-related instruction while placed in a full- time or part-time job with regularly scheduled supervision by a special education teacher.
Off Home Campus
• Students from more than one school district receive special education instruction and related services in a single location (Adaptive Behavior classes and classes for the severe and profoundly handicapped).
Residential Care and Treatment Facility
• Special education services are provided at a school district campus for eligible students with disabilities who reside in approved care and treatment facilities (including licensed foster homes) and whose parents do not reside within the boundaries of the school district providing educational services to the students.
Homebound • Special education services are provided at home or hospital bedside for students expected to be confined for a minimum of four consecutive weeks as documented by a licensed physician or for infants and toddlers with visual and/or auditory impairments whose developmental levels are such that they are not capable
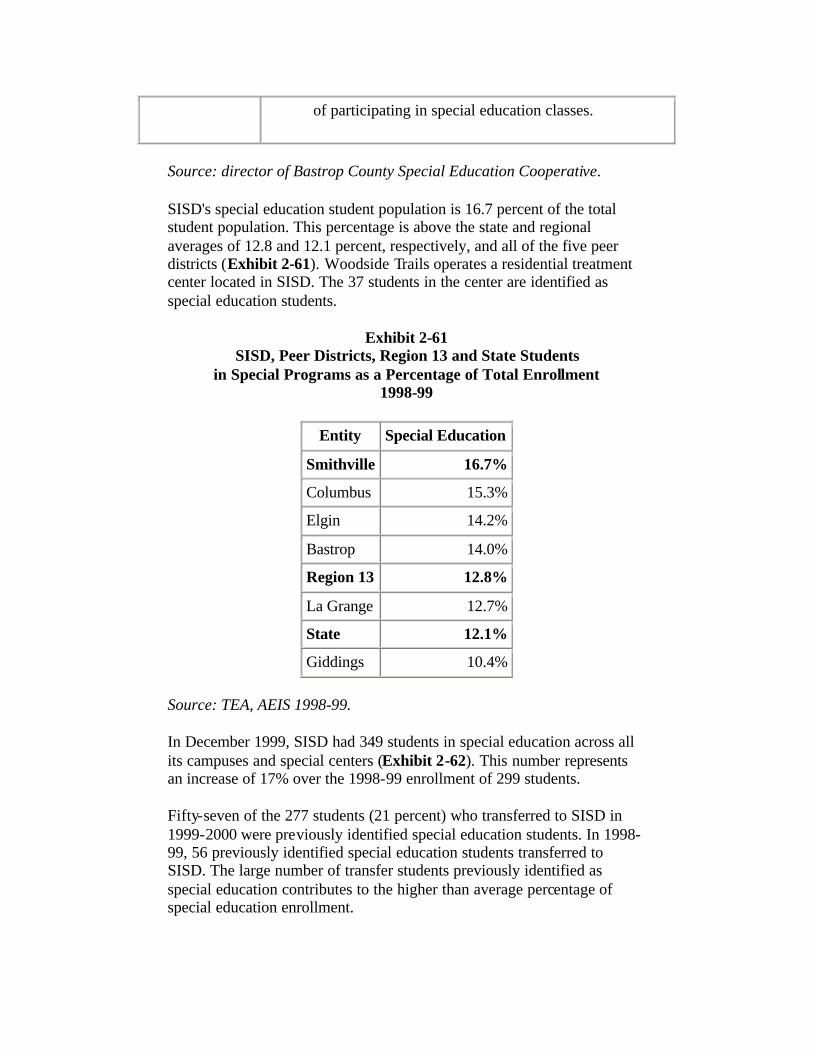
of participating in special education classes.
Source: director of Bastrop County Special Education Cooperative.
SISD's special education student population is 16.7 percent of the total student population. This percentage is above the state and regional averages of 12.8 and 12.1 percent, respectively, and all of the five peer districts (Exhibit 2-61). Woodside Trails operates a residential treatment center located in SISD. The 37 students in the center are identified as special education students.
Exhibit 2-61 SISD, Peer Districts, Region 13 and State Students
in Special Programs as a Percentage of Total Enrollment 1998-99
Entity Special Education
Smithville 16.7%
Columbus 15.3%
Elgin 14.2%
Bastrop 14.0%
Region 13 12.8%
La Grange 12.7%
State 12.1%
Giddings 10.4%
Source: TEA, AEIS 1998-99.
In December 1999, SISD had 349 students in special education across all its campuses and special centers (Exhibit 2-62). This number represents an increase of 17% over the 1998-99 enrollment of 299 students.
Fifty-seven of the 277 students (21 percent) who transferred to SISD in 1999-2000 were previously identified special education students. In 1998-99, 56 previously identified special education students transferred to SISD. The large number of transfer students previously identified as special education contributes to the higher than average percentage of special education enrollment.
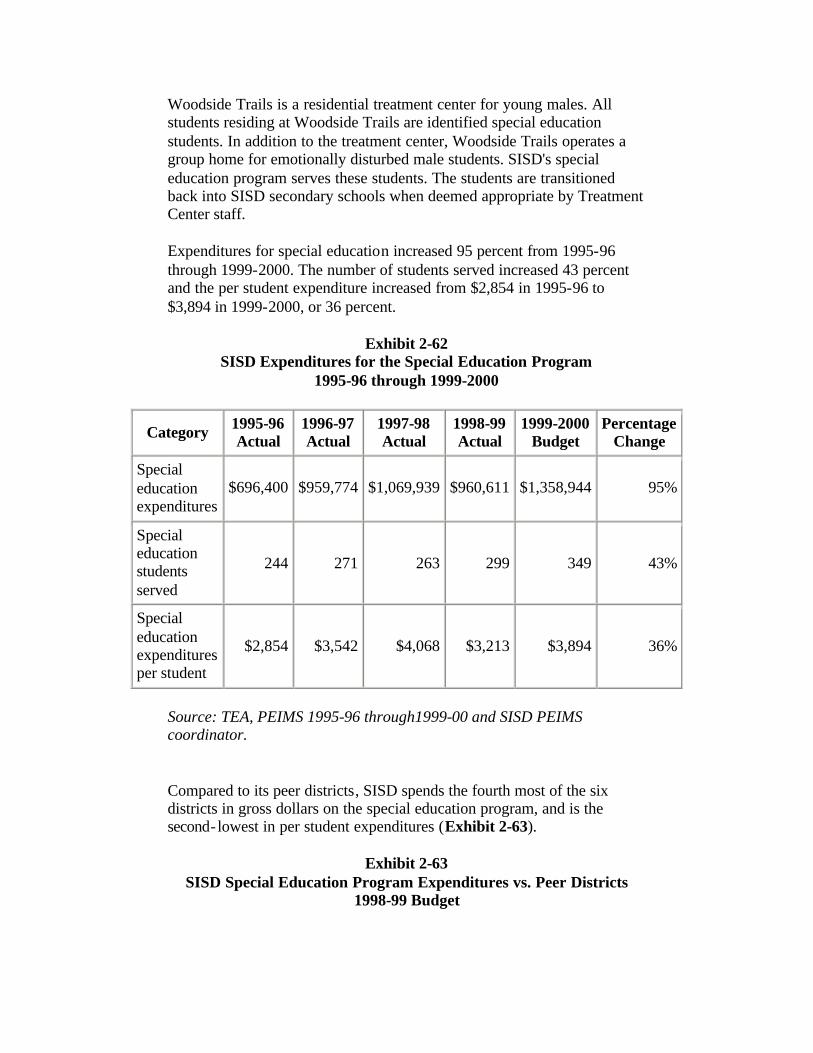
Woodside Trails is a residential treatment center for young males. All students residing at Woodside Trails are identified special education students. In addition to the treatment center, Woodside Trails operates a group home for emotionally disturbed male students. SISD's special education program serves these students. The students are transitioned back into SISD secondary schools when deemed appropriate by Treatment Center staff.
Expenditures for special education increased 95 percent from 1995-96 through 1999-2000. The number of students served increased 43 percent and the per student expenditure increased from $2,854 in 1995-96 to $3,894 in 1999-2000, or 36 percent.
Exhibit 2-62 SISD Expenditures for the Special Education Program
1995-96 through 1999-2000
Category 1995-96 Actual
1996-97 Actual
1997-98 Actual
1998-99 Actual
1999-2000 Budget
Percentage Change
Special education expenditures
$696,400 $959,774 $1,069,939 $960,611 $1,358,944 95%
Special education students served
244 271 263 299 349 43%
Special education expenditures per student
$2,854 $3,542 $4,068 $3,213 $3,894 36%
Source: TEA, PEIMS 1995-96 through1999-00 and SISD PEIMS coordinator.
Compared to its peer districts, SISD spends the fourth most of the six districts in gross dollars on the special education program, and is the second- lowest in per student expenditures (Exhibit 2-63).
Exhibit 2-63 SISD Special Education Program Expenditures vs. Peer Districts
1998-99 Budget
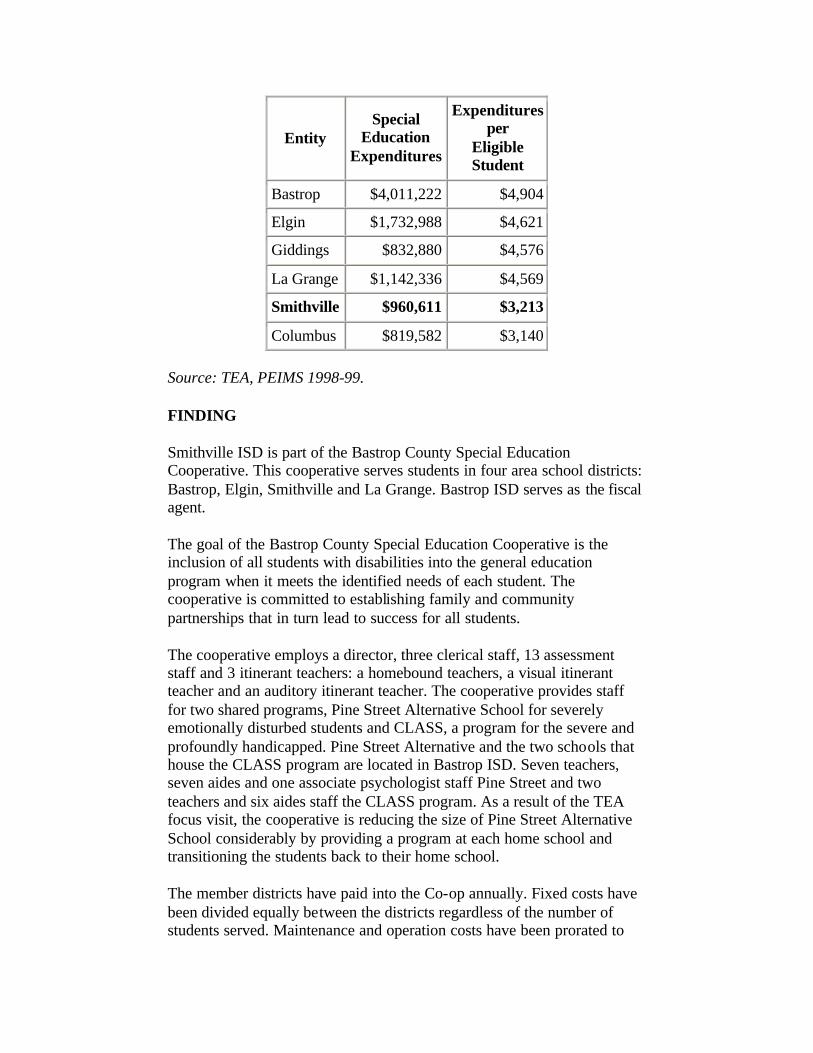
Entity Special
Education Expenditures
Expenditures per
Eligible Student
Bastrop $4,011,222 $4,904
Elgin $1,732,988 $4,621
Giddings $832,880 $4,576
La Grange $1,142,336 $4,569
Smithville $960,611 $3,213
Columbus $819,582 $3,140
Source: TEA, PEIMS 1998-99.
FINDING
Smithville ISD is part of the Bastrop County Special Education Cooperative. This cooperative serves students in four area school districts: Bastrop, Elgin, Smithville and La Grange. Bastrop ISD serves as the fiscal agent.
The goal of the Bastrop County Special Education Cooperative is the inclusion of all students with disabilities into the general education program when it meets the identified needs of each student. The cooperative is committed to establishing family and community partnerships that in turn lead to success for all students.
The cooperative employs a director, three clerical staff, 13 assessment staff and 3 itinerant teachers: a homebound teachers, a visual itinerant teacher and an auditory itinerant teacher. The cooperative provides staff for two shared programs, Pine Street Alternative School for severely emotionally disturbed students and CLASS, a program for the severe and profoundly handicapped. Pine Street Alternative and the two schools that house the CLASS program are located in Bastrop ISD. Seven teachers, seven aides and one associate psychologist staff Pine Street and two teachers and six aides staff the CLASS program. As a result of the TEA focus visit, the cooperative is reducing the size of Pine Street Alternative School considerably by providing a program at each home school and transitioning the students back to their home school.
The member districts have paid into the Co-op annually. Fixed costs have been divided equally between the districts regardless of the number of students served. Maintenance and operation costs have been prorated to
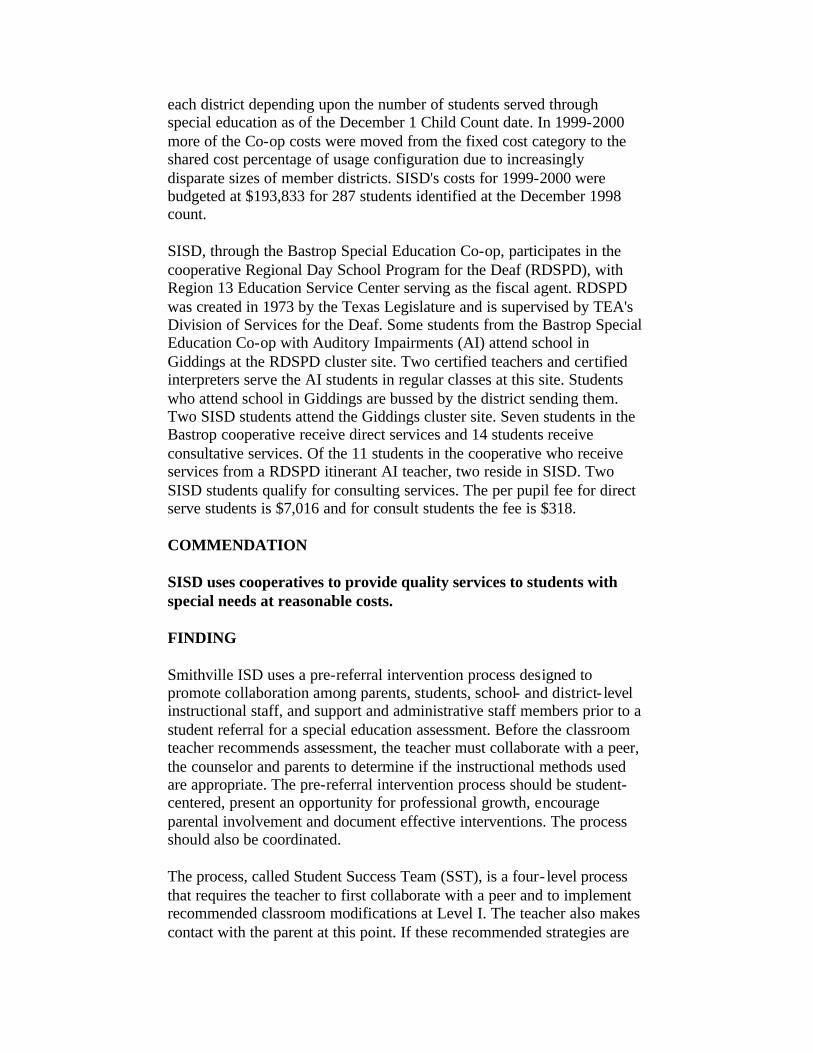
each district depending upon the number of students served through special education as of the December 1 Child Count date. In 1999-2000 more of the Co-op costs were moved from the fixed cost category to the shared cost percentage of usage configuration due to increasingly disparate sizes of member districts. SISD's costs for 1999-2000 were budgeted at $193,833 for 287 students identified at the December 1998 count.
SISD, through the Bastrop Special Education Co-op, participates in the cooperative Regional Day School Program for the Deaf (RDSPD), with Region 13 Education Service Center serving as the fiscal agent. RDSPD was created in 1973 by the Texas Legislature and is supervised by TEA's Division of Services for the Deaf. Some students from the Bastrop Special Education Co-op with Auditory Impairments (AI) attend school in Giddings at the RDSPD cluster site. Two certified teachers and certified interpreters serve the AI students in regular classes at this site. Students who attend school in Giddings are bussed by the district sending them. Two SISD students attend the Giddings cluster site. Seven students in the Bastrop cooperative receive direct services and 14 students receive consultative services. Of the 11 students in the cooperative who receive services from a RDSPD itinerant AI teacher, two reside in SISD. Two SISD students qualify for consulting services. The per pupil fee for direct serve students is $7,016 and for consult students the fee is $318.
COMMENDATION
SISD uses cooperatives to provide quality services to students with special needs at reasonable costs.
FINDING
Smithville ISD uses a pre-referral intervention process designed to promote collaboration among parents, students, school- and district- level instructional staff, and support and administrative staff members prior to a student referral for a special education assessment. Before the classroom teacher recommends assessment, the teacher must collaborate with a peer, the counselor and parents to determine if the instructional methods used are appropriate. The pre-referral intervention process should be student-centered, present an opportunity for professional growth, encourage parental involvement and document effective interventions. The process should also be coordinated.
The process, called Student Success Team (SST), is a four- level process that requires the teacher to first collaborate with a peer and to implement recommended classroom modifications at Level I. The teacher also makes contact with the parent at this point. If these recommended strategies are

unsuccessful, the teacher contacts the counselor for a Level 2 data collection. At level 2, the classroom teacher uses the information obtained at Level 1 from parents, peers and the collected SST data. Level 3 initiates the first SST meeting. The SST is a multidisciplinary group composed of school resource staff, parents and support specialists who collaboratively review the information gathered by the classroom teacher in Levels 1 and 2. Using the combined knowledge of the SST members, the SST lists strategies and supports to be used in the classroom and schedules a follow-up meeting in three to six weeks. The effectiveness of the interventions is documented during this three- to six-week period. At level 4, if the student is making sufficient progress to conclude the process, the teacher documents the successful strategies in the student's cumulative folder. Referral to Section 504, dyslexia or special education may be initiated if the student does not make sufficient progress. Parents requesting special education assessment are encouraged to participate in the SST process; however, if parents desire assessment, the referral is processed through the school counselor (Exhibit 2-64).
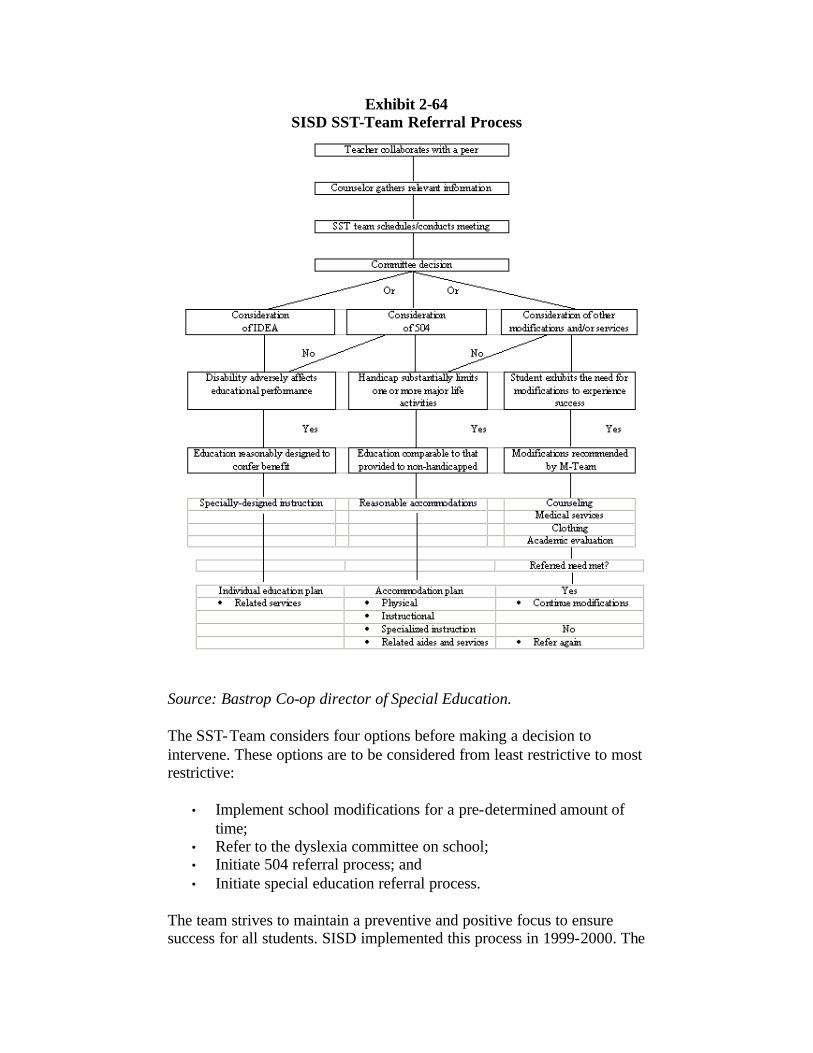
Exhibit 2-64 SISD SST-Team Referral Process
Source: Bastrop Co-op director of Special Education.
The SST-Team considers four options before making a decision to intervene. These options are to be considered from least restrictive to most restrictive:
• Implement school modifications for a pre-determined amount of time;
• Refer to the dyslexia committee on school; • Initiate 504 referral process; and • Initiate special education referral process.
The team strives to maintain a preventive and positive focus to ensure success for all students. SISD implemented this process in 1999-2000. The
number of special education referrals decreased from 78 in 1998-99 to 54 in 1999-2000, a 31 percent decrease. SISD honors all parent referrals with testing.
COMMENDATION
SISD developed a process to identify individual student needs, devise appropriate modifications and accomplish desired learning and achievement levels within the least restrictive environment.
Chapter 2
H. ALTERNATIVE EDUCATION AND DISCIPLINE MANAGEMENT
Each school district must have a district improvement plan under Section 11.252 of the Texas Education Code. This section requires a discipline management program be included as part of the plan. The district improvement plan must include strategies for improvement of student performance that includes discipline management. Chapter 37 provides additional guidelines districts can use to formulate their own local policies.
Alternative education programs (AEPs) became mandatory with the adoption of Chapter 37 in 1995. Section 37.008 of the Texas Education Code provides detailed information on the provision of such programs.
Each school district shall provide an alternative education program:
• In a setting other than a student's regular classroom; • On or off of a regular school campus; • For students who are assigned to the alternative education program
to be separated from students who are not assigned to the program; • That focuses on English language arts, mathematics, science,
history and self-discipline; • For students' educational and behavioral needs; and • That provides supervision and counseling.
An alternative education program may provide for a student's transfer to a different campus, a school-community guidance center or a community-based alternative school.
On-campus AEPs must use certified personnel, however, off-campus AEPs may use instructional personnel as they choose for students not receiving special education or bilingual education services.
An off-campus AEP is not required to comply with the school-day length provision, however, funding is based on attendance in the same manner as other programs. Off-campus programs must be conducted in a completely separate facility from all campuses serving students in the regular education program.
An AEP may not be held in the same room as an in-school suspension program or any other room that contains students not assigned to the AEP. Districts may continue to provide transportation services and allow

students to engage in activities such as eating in the same cafeteria as other students.
Districts develop local policies that explain how the district will provide for a student's educational needs and provide counseling services for students during placement in an AEP.
SISD's alternative campus is a disciplinary school During the 1999-2000 school year, it had 37 students.
FINDING
Bastrop County, the cities of Bastrop, Elgin and Smithville and the Bastrop, Elgin, McDade and Smithville Independent School Districts entered into an interlocal agreement and memorandum of understanding in 1999 to develop and participate in the Bastrop County Juvenile Boot Camp. The purpose of the boot camp is to serve as a dropout prevention program for adjudicated youth. The students in the boot camp stay on track for graduation and stay out of the legal system.
An 11 member board serves as the policy-making body and includes the district attorney, county-court-at-law judge, county judge, a representative of the Centex Regional Juvenile Services Department, the city managers of Bastrop, Elgin and Smithville and the superintendents of Bastrop, Elgin, McDade and Smithville school districts There are also five ex-officio, or non-voting members of the board: the police chiefs of Bastrop, Elgin and Smithville, the sheriff and the county auditor.
The pilot project ran from March to May 1999, and served fewer than 10 students. In 1999-2000, the program served 39 students. The student day is 10 hours long, and consists of an academic and boot camp program.
The academic program lasts five hours per day and is a self-paced computer-based program. Students can earn up to 2.5 credits a semester.
The boot camp part of the program is also five hours per day and consists of drill, physical and ceremony training.
Expenditures for 1999-2000 were $189,244 and are estimated to be $177,784 for 2000-01. A Juvenile Justice Alternative Education Program grant pays $13,654 and special education funds provide $15,000. The remaining revenues are based on a per space charge, estimated to be $5,679 per space for 20 spaces for the 2000-01 year. The participating cities divide one space equally, the county pays for 10 spaces, SISD pays for five spaces, Elgin and Bastrop ISDs pay for two spaces each and McDade ISD pays a daily fee whenever it uses the program.
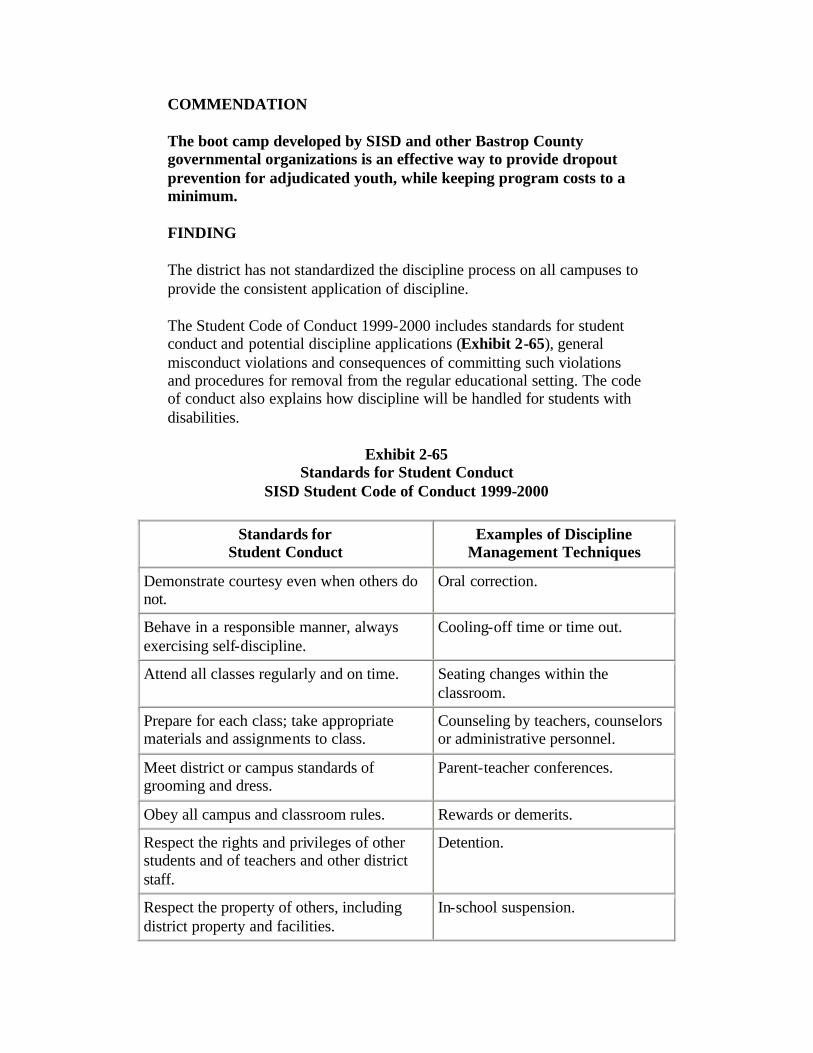
COMMENDATION
The boot camp developed by SISD and other Bastrop County governmental organizations is an effective way to provide dropout prevention for adjudicated youth, while keeping program costs to a minimum.
FINDING
The district has not standardized the discipline process on all campuses to provide the consistent application of discipline.
The Student Code of Conduct 1999-2000 includes standards for student conduct and potential discipline applications (Exhibit 2-65), general misconduct violations and consequences of committing such violations and procedures for removal from the regular educational setting. The code of conduct also explains how discipline will be handled for students with disabilities.
Exhibit 2-65 Standards for Student Conduct
SISD Student Code of Conduct 1999-2000
Standards for Student Conduct
Examples of Discipline Management Techniques
Demonstrate courtesy even when others do not.
Oral correction.
Behave in a responsible manner, always exercising self-discipline.
Cooling-off time or time out.
Attend all classes regularly and on time. Seating changes within the classroom.
Prepare for each class; take appropriate materials and assignments to class.
Counseling by teachers, counselors or administrative personnel.
Meet district or campus standards of grooming and dress.
Parent-teacher conferences.
Obey all campus and classroom rules. Rewards or demerits.
Respect the rights and privileges of other students and of teachers and other district staff.
Detention.
Respect the property of others, including district property and facilities.
In-school suspension.

Cooperate with or assist the school staff in maintaining safety, order and discipline.
Out-of-school suspension.
Avoid violations of the Student Code of Conduct.
Placement in a disciplinary alternative education program.
Assigned school duties such as scrubbing desks or picking up litter.
Withdrawal or restriction of bus privileges.
School-assessed and school-administered probation.
Corporal punishment.
Referral to an outside agency and/or legal authority.
Source: SISD Student Code of Conduct, 1999-2000.
SISD'S Student Code of Conduct lists general misconduct violations for which the discipline management techniques can be applied, including disobeying rules for conduct on school buses, cheating or copying the work of another, displaying a fire alarm, gambling, possessing a firearm, making false threats, possessing or using tobacco products, violating computer use policies and possessing pornographic material. With the exception of a section entitled "Removal from the Regular Education Setting," which describes offenses that could result in either out-of-school suspension or placement in an alternative education program, the code does not outline levels of violations and consequences for each level of offense.The Student Code of Conduct does not provide any guidance according to graduated application of the discipline management techniques.
Application is left to the individual judgment of school principals.Interviews with principals identified at least three different methods of applying discipline management (Exhibit 2-66). Only the elementary school had the steps specifically listed in writing for teachers and administrators to follow.
Exhibit 2-66 SISD Discipline Management Systems Used by Principals
System Step
1 2 3
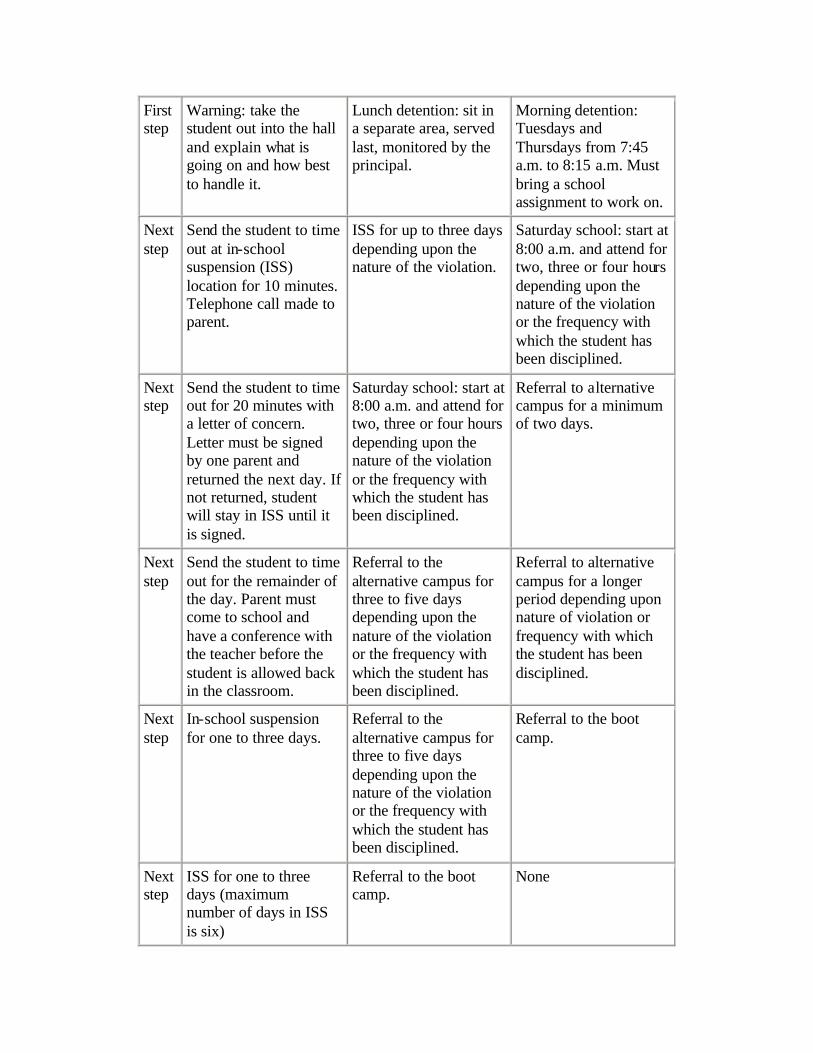
First step
Warning: take the student out into the hall and explain what is going on and how best to handle it.
Lunch detention: sit in a separate area, served last, monitored by the principal.
Morning detention: Tuesdays and Thursdays from 7:45 a.m. to 8:15 a.m. Must bring a school assignment to work on.
Next step
Send the student to time out at in-school suspension (ISS) location for 10 minutes. Telephone call made to parent.
ISS for up to three days depending upon the nature of the violation.
Saturday school: start at 8:00 a.m. and attend for two, three or four hours depending upon the nature of the violation or the frequency with which the student has been disciplined.
Next step
Send the student to time out for 20 minutes with a letter of concern. Letter must be signed by one parent and returned the next day. If not returned, student will stay in ISS until it is signed.
Saturday school: start at 8:00 a.m. and attend for two, three or four hours depending upon the nature of the violation or the frequency with which the student has been disciplined.
Referral to alternative campus for a minimum of two days.
Next step
Send the student to time out for the remainder of the day. Parent must come to school and have a conference with the teacher before the student is allowed back in the classroom.
Referral to the alternative campus for three to five days depending upon the nature of the violation or the frequency with which the student has been disciplined.
Referral to alternative campus for a longer period depending upon nature of violation or frequency with which the student has been disciplined.
Next step
In-school suspension for one to three days.
Referral to the alternative campus for three to five days depending upon the nature of the violation or the frequency with which the student has been disciplined.
Referral to the boot camp.
Next step
ISS for one to three days (maximum number of days in ISS is six)
Referral to the boot camp.
None
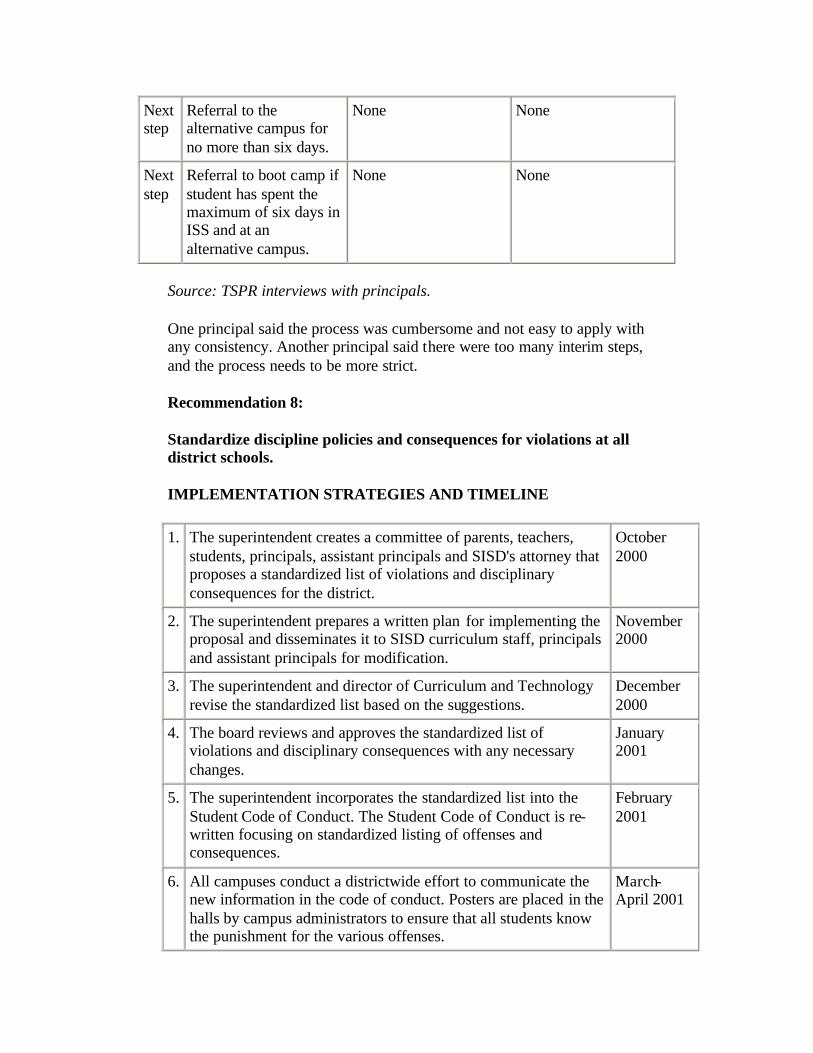
Next step
Referral to the alternative campus for no more than six days.
None None
Next step
Referral to boot camp if student has spent the maximum of six days in ISS and at an alternative campus.
None None
Source: TSPR interviews with principals.
One principal said the process was cumbersome and not easy to apply with any consistency. Another principal said there were too many interim steps, and the process needs to be more strict.
Recommendation 8:
Standardize discipline policies and consequences for violations at all district schools.
IMPLEMENTATION STRATEGIES AND TIMELINE
1. The superintendent creates a committee of parents, teachers, students, principals, assistant principals and SISD's attorney that proposes a standardized list of violations and disciplinary consequences for the district.
October 2000
2. The superintendent prepares a written plan for implementing the proposal and disseminates it to SISD curriculum staff, principals and assistant principals for modification.
November 2000
3. The superintendent and director of Curriculum and Technology revise the standardized list based on the suggestions.
December 2000
4. The board reviews and approves the standardized list of violations and disciplinary consequences with any necessary changes.
January 2001
5. The superintendent incorporates the standardized list into the Student Code of Conduct. The Student Code of Conduct is re-written focusing on standardized listing of offenses and consequences.
February 2001
6. All campuses conduct a districtwide effort to communicate the new information in the code of conduct. Posters are placed in the halls by campus administrators to ensure that all students know the punishment for the various offenses.
March-April 2001
7. An in-service for teachers is held to acquaint them with the process.
August 2001
FISCAL IMPACT
This recommendation can be implemented with existing sources.
Chapter 3
FACILITIES USE AND MANAGEMENT
This chapter reviews the facilities use and management for the Smithville Independent School District (SISD) in the following areas:
A. Facilities Planning B. Maintenance Operations C. Energy Management
A comprehensive facilities, maintenance and energy management program coordinates all the physical resources in the district. The program must effectively integrate facilities planning with all other aspects of school planning. The most effective and efficient plant operations and maintenance programs involve facilities managers in strategic planning, design and construction. Additionally, all facilities departments should operate under clearly defined policies and procedures.
Facilities use and management managers ensure that district facilities are designed and built in a way that enhances the educational process and meets other needs, including: maintaining equipment in peak operating condition; providing a clean school and working environment; ensuring that facilities comply with local, state, and federal building regulations; and minimizing the district's utility costs.
Efficient facilities operations help districts keep up with changes in enrollment and changing instructional program needs, and they are essential to building public trust and confidence in district management.
BACKGROUND
Smithville ISD is in the southeastern part of Bastrop County and covers 191 square miles and contains the City of Smithville.
According to a study completed by DeskMap Systems, Inc. in December 1999, the City of Smithville grew at a rate of 27.5 percent during 1990-1998, which is almost double the state's 15.4 percent rate of growth during that period.
Claymore Associates Architects Inc. conducted a facilities evaluation and needs assessment in 1998. The evaluation also included an estimate of student enrollment in SISD through 2002-03 (Exhibit 3-1).
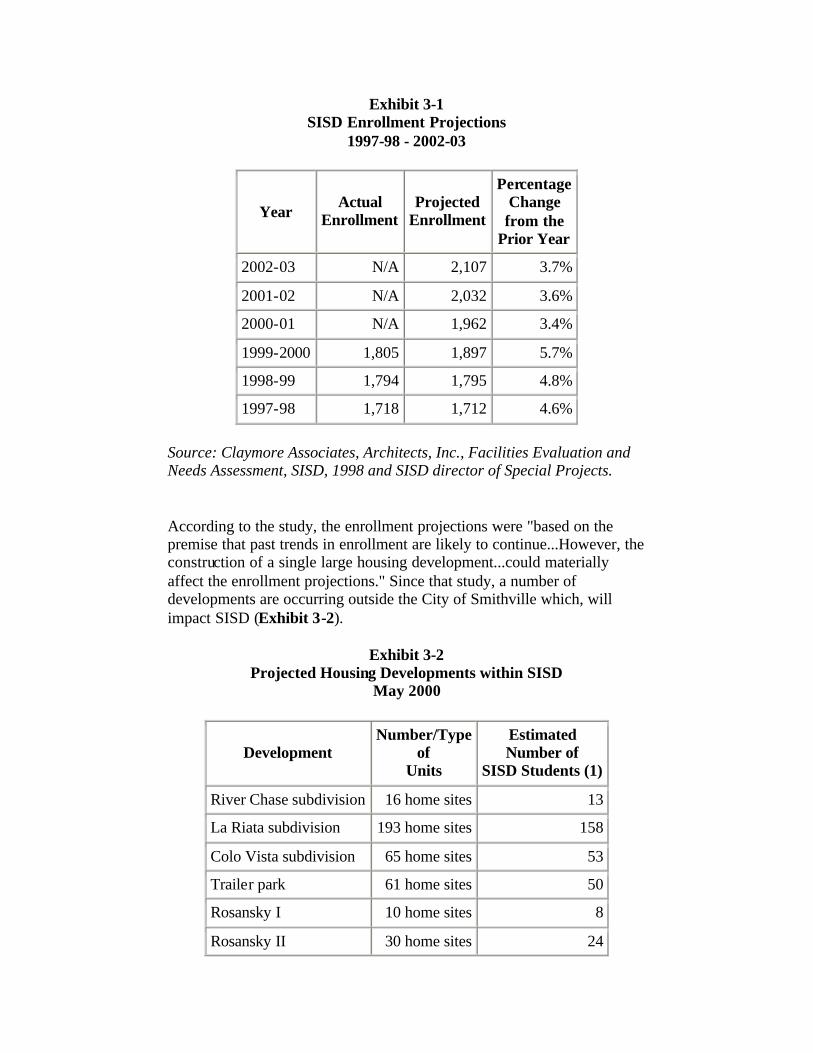
Exhibit 3-1 SISD Enrollment Projections
1997-98 - 2002-03
Year Actual
Enrollment Projected
Enrollment
Percentage Change from the
Prior Year
2002-03 N/A 2,107 3.7%
2001-02 N/A 2,032 3.6%
2000-01 N/A 1,962 3.4%
1999-2000 1,805 1,897 5.7%
1998-99 1,794 1,795 4.8%
1997-98 1,718 1,712 4.6%
Source: Claymore Associates, Architects, Inc., Facilities Evaluation and Needs Assessment, SISD, 1998 and SISD director of Special Projects.
According to the study, the enrollment projections were "based on the premise that past trends in enrollment are likely to continue...However, the construction of a single large housing development...could materially affect the enrollment projections." Since that study, a number of developments are occurring outside the City of Smithville which, will impact SISD (Exhibit 3-2).
Exhibit 3-2 Projected Housing Developments within SISD
May 2000
Development Number/Type
of Units
Estimated Number of
SISD Students (1)
River Chase subdivision 16 home sites 13
La Riata subdivision 193 home sites 158
Colo Vista subdivision 65 home sites 53
Trailer park 61 home sites 50
Rosansky I 10 home sites 8
Rosansky II 30 home sites 24
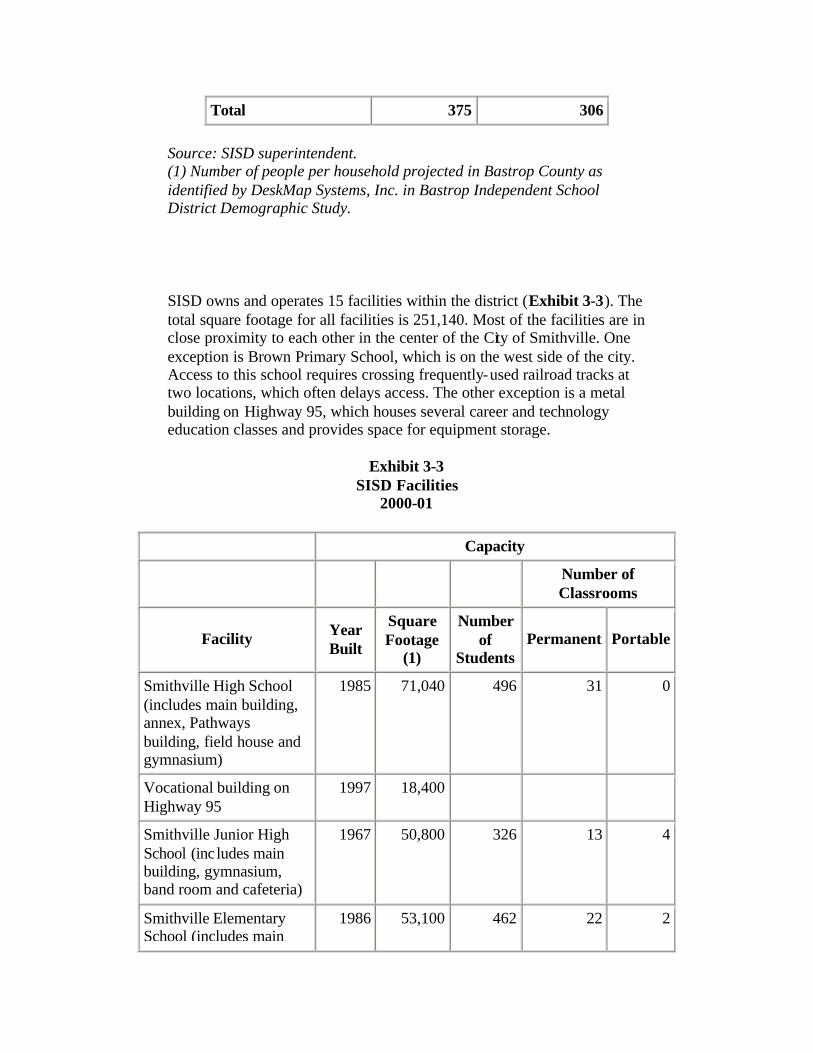
Total 375 306
Source: SISD superintendent. (1) Number of people per household projected in Bastrop County as identified by DeskMap Systems, Inc. in Bastrop Independent School District Demographic Study.
SISD owns and operates 15 facilities within the district (Exhibit 3-3). The total square footage for all facilities is 251,140. Most of the facilities are in close proximity to each other in the center of the City of Smithville. One exception is Brown Primary School, which is on the west side of the city. Access to this school requires crossing frequently-used railroad tracks at two locations, which often delays access. The other exception is a metal building on Highway 95, which houses several career and technology education classes and provides space for equipment storage.
Exhibit 3-3 SISD Facilities
2000-01
Capacity
Number of Classrooms
Facility Year Built
Square Footage
(1)
Number of
Students Permanent Portable
Smithville High School (includes main building, annex, Pathways building, field house and gymnasium)
1985 71,040 496 31 0
Vocational building on Highway 95
1997 18,400
Smithville Junior High School (includes main building, gymnasium, band room and cafeteria)
1967 50,800 326 13 4
Smithville Elementary School (includes main
1986 53,100 462 22 2
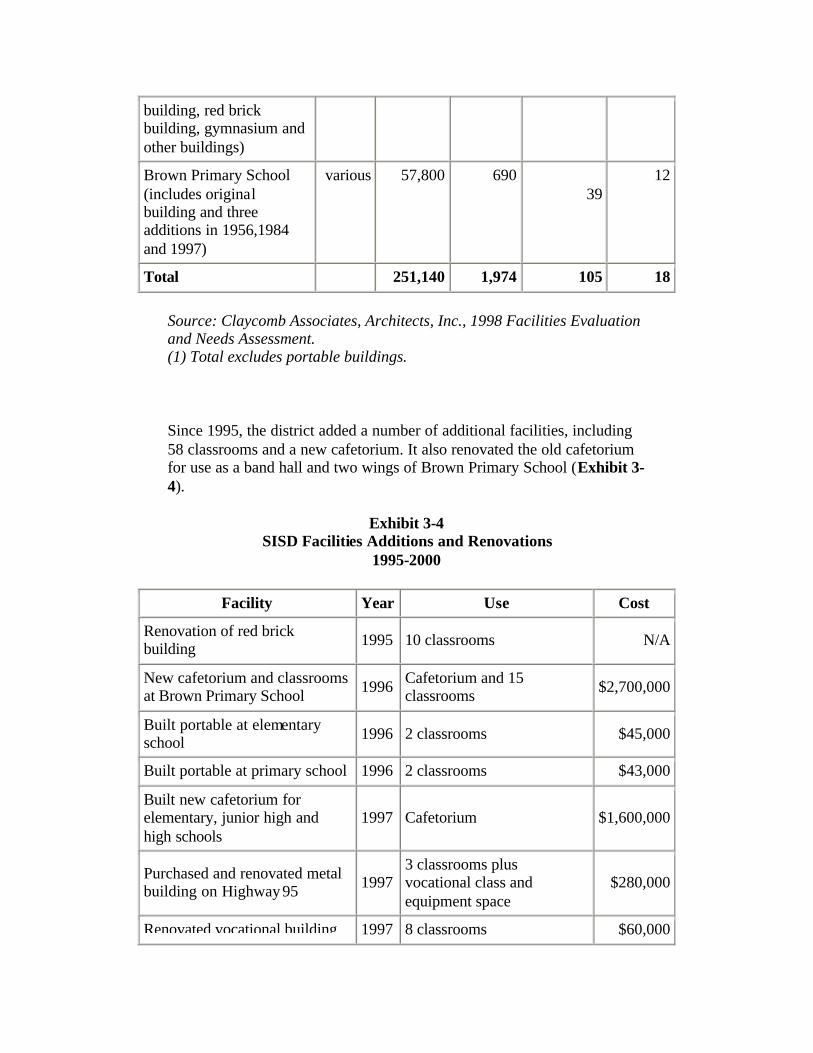
building, red brick building, gymnasium and other buildings)
Brown Primary School (includes original building and three additions in 1956,1984 and 1997)
various 57,800 690 39
12
Total 251,140 1,974 105 18
Source: Claycomb Associates, Architects, Inc., 1998 Facilities Evaluation and Needs Assessment. (1) Total excludes portable buildings.
Since 1995, the district added a number of additional facilities, including 58 classrooms and a new cafetorium. It also renovated the old cafetorium for use as a band hall and two wings of Brown Primary School (Exhibit 3-4).
Exhibit 3-4 SISD Facilities Additions and Renovations
1995-2000
Facility Year Use Cost
Renovation of red brick building 1995 10 classrooms N/A
New cafetorium and classrooms at Brown Primary School 1996 Cafetorium and 15
classrooms $2,700,000
Built portable at elementary school 1996 2 classrooms $45,000
Built portable at primary school 1996 2 classrooms $43,000
Built new cafetorium for elementary, junior high and high schools
1997 Cafetorium $1,600,000
Purchased and renovated metal building on Highway 95 1997
3 classrooms plus vocational class and equipment space
$280,000
Renovated vocational building 1997 8 classrooms $60,000
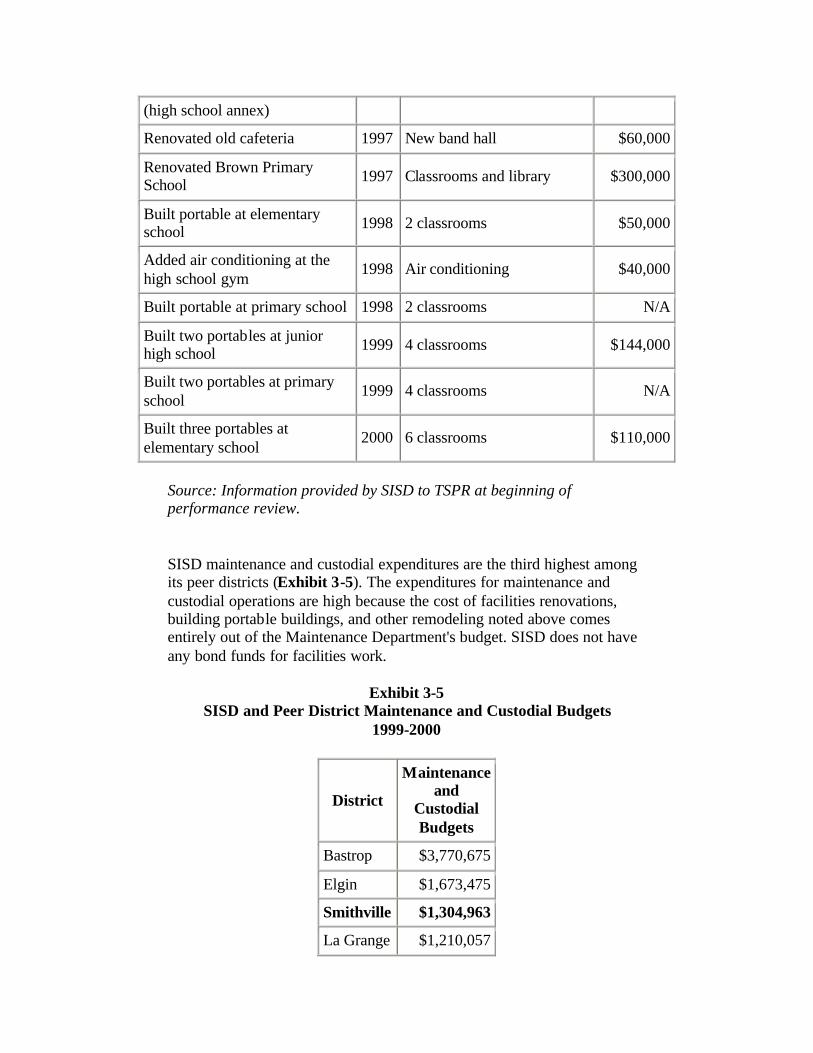
(high school annex)
Renovated old cafeteria 1997 New band hall $60,000
Renovated Brown Primary School 1997 Classrooms and library $300,000
Built portable at elementary school 1998 2 classrooms $50,000
Added air conditioning at the high school gym
1998 Air conditioning $40,000
Built portable at primary school 1998 2 classrooms N/A
Built two portables at junior high school 1999 4 classrooms $144,000
Built two portables at primary school
1999 4 classrooms N/A
Built three portables at elementary school
2000 6 classrooms $110,000
Source: Information provided by SISD to TSPR at beginning of performance review.
SISD maintenance and custodial expenditures are the third highest among its peer districts (Exhibit 3-5). The expenditures for maintenance and custodial operations are high because the cost of facilities renovations, building portable buildings, and other remodeling noted above comes entirely out of the Maintenance Department's budget. SISD does not have any bond funds for facilities work.
Exhibit 3-5 SISD and Peer District Maintenance and Custodial Budgets
1999-2000
District
Maintenance and
Custodial Budgets
Bastrop $3,770,675
Elgin $1,673,475
Smithville $1,304,963
La Grange $1,210,057
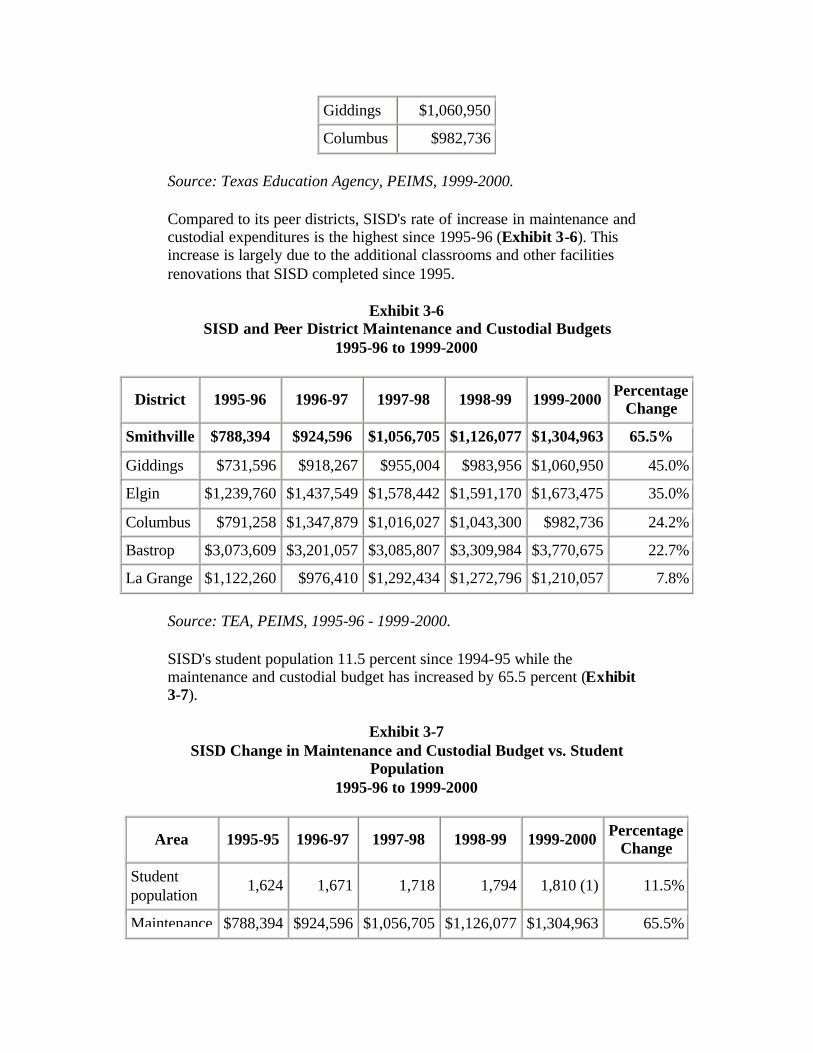
Giddings $1,060,950
Columbus $982,736
Source: Texas Education Agency, PEIMS, 1999-2000.
Compared to its peer districts, SISD's rate of increase in maintenance and custodial expenditures is the highest since 1995-96 (Exhibit 3-6). This increase is largely due to the additional classrooms and other facilities renovations that SISD completed since 1995.
Exhibit 3-6 SISD and Peer District Maintenance and Custodial Budgets
1995-96 to 1999-2000
District 1995-96 1996-97 1997-98 1998-99 1999-2000 Percentage Change
Smithville $788,394 $924,596 $1,056,705 $1,126,077 $1,304,963 65.5%
Giddings $731,596 $918,267 $955,004 $983,956 $1,060,950 45.0%
Elgin $1,239,760 $1,437,549 $1,578,442 $1,591,170 $1,673,475 35.0%
Columbus $791,258 $1,347,879 $1,016,027 $1,043,300 $982,736 24.2%
Bastrop $3,073,609 $3,201,057 $3,085,807 $3,309,984 $3,770,675 22.7%
La Grange $1,122,260 $976,410 $1,292,434 $1,272,796 $1,210,057 7.8%
Source: TEA, PEIMS, 1995-96 - 1999-2000.
SISD's student population 11.5 percent since 1994-95 while the maintenance and custodial budget has increased by 65.5 percent (Exhibit 3-7).
Exhibit 3-7 SISD Change in Maintenance and Custodial Budget vs. Student
Population 1995-96 to 1999-2000
Area 1995-95 1996-97 1997-98 1998-99 1999-2000 Percentage Change
Student population
1,624 1,671 1,718 1,794 1,810 (1) 11.5%
Maintenance $788,394 $924,596 $1,056,705 $1,126,077 $1,304,963 65.5%
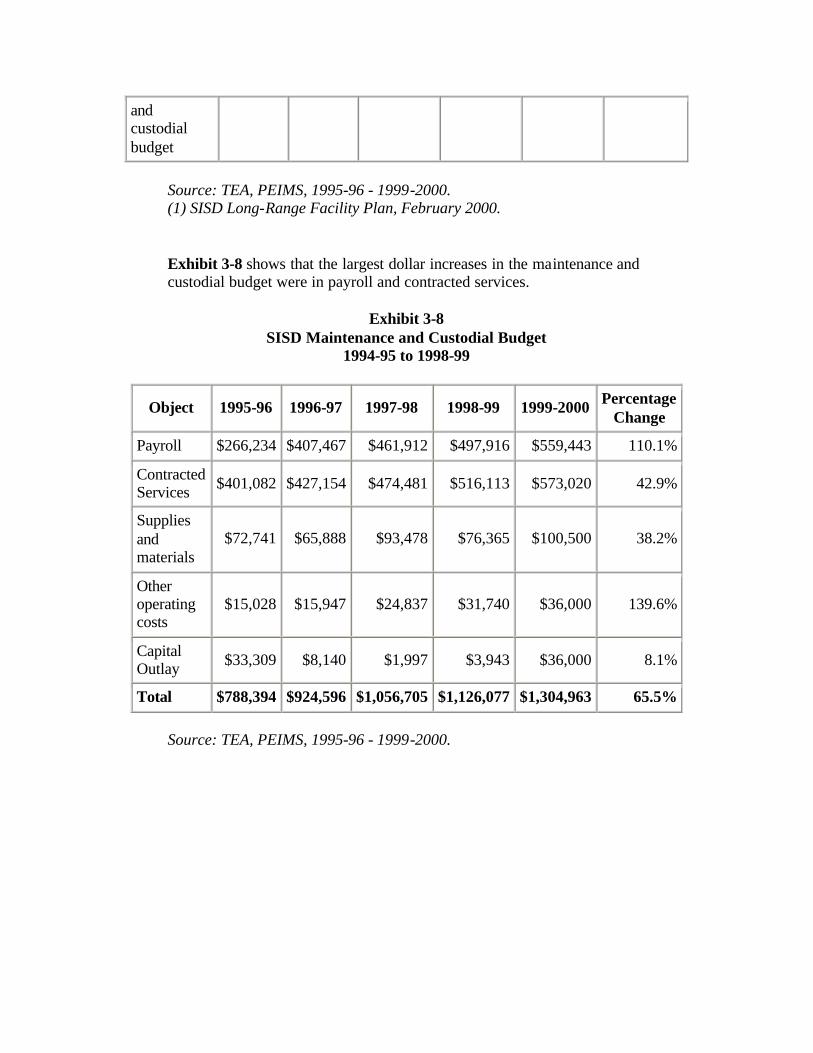
and custodial budget
Source: TEA, PEIMS, 1995-96 - 1999-2000. (1) SISD Long-Range Facility Plan, February 2000.
Exhibit 3-8 shows that the largest dollar increases in the maintenance and custodial budget were in payroll and contracted services.
Exhibit 3-8 SISD Maintenance and Custodial Budget
1994-95 to 1998-99
Object 1995-96 1996-97 1997-98 1998-99 1999-2000 Percentage Change
Payroll $266,234 $407,467 $461,912 $497,916 $559,443 110.1%
Contracted Services $401,082 $427,154 $474,481 $516,113 $573,020 42.9%
Supplies and materials
$72,741 $65,888 $93,478 $76,365 $100,500 38.2%
Other operating costs
$15,028 $15,947 $24,837 $31,740 $36,000 139.6%
Capital Outlay $33,309 $8,140 $1,997 $3,943 $36,000 8.1%
Total $788,394 $924,596 $1,056,705 $1,126,077 $1,304,963 65.5%
Source: TEA, PEIMS, 1995-96 - 1999-2000.
Chapter 3
A. FACILITES PLANNING
A school district's long-range comprehensive master plan is a compilation of district policies, information and statistical data which provides a basis for planning educational facilities to meet the changing needs of a community. The master plan becomes the district's policy statement for the allocating of resources and offers potential alternatives for facility improvement.
Effective school facilities master planning incorporates the following elements.
Facility Capacity. The capacity of each school facility should be established by setting standards that govern student/teacher ratios and the amount of square feet required per student in a classroom. These standards also should deal with the minimum size of core facilities (such as gyms, cafeterias and libraries) so that schools do not overload these facilities or overuse portable classrooms.
Facility Inventory. An accurate facility inventory is an essential tool in managing the usage of school facilities. Each school inventory should identify the use and size of each room. This enables planners to accurately set the capacity of each school. Modifications to schools should be noted in the inventory so that it can be kept up to date.
Enrollment Projections. Effective planning requires accurate enrollment projections. These projections should be made for at least five years into the future. Accurate projections require planners to examine neighborhood demographics and track new construction activity in the dis trict. Many school planners work in coordination with county and city planners to track growth patterns.
Attendance Zones. While portable classrooms can temporarily alleviate overcrowding due to fluctuations in enrollment, they can harm to the educational program if they are overused. Therefore, an effective enrollment management plan calls for adjustments in attendance zones ever necessary. While such adjustments often prove unpopular with parents and students, they are necessary if all students are to have appropriate access to school facilities.
Capital Improvement Master Plan. Effective planning requires the district to anticipate its future needs and balance these against resources. A capital master plan charts future improvements to school facilities and identifies
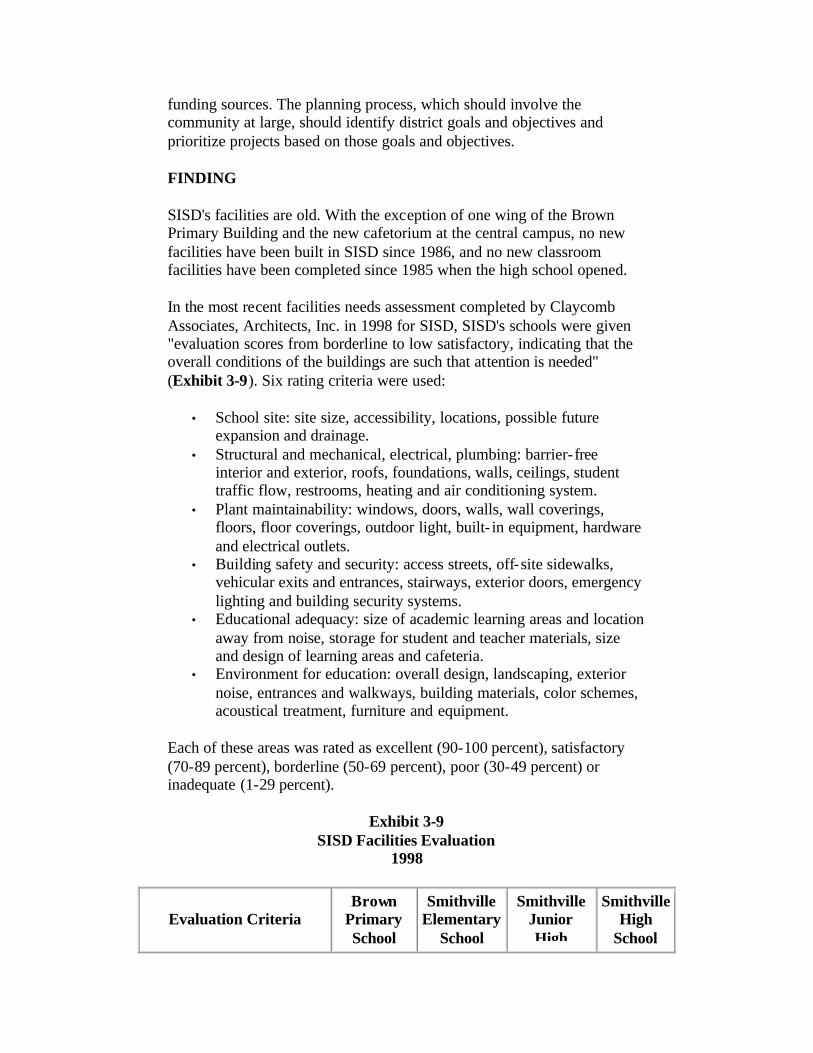
funding sources. The planning process, which should involve the community at large, should identify district goals and objectives and prioritize projects based on those goals and objectives.
FINDING
SISD's facilities are old. With the exception of one wing of the Brown Primary Building and the new cafetorium at the central campus, no new facilities have been built in SISD since 1986, and no new classroom facilities have been completed since 1985 when the high school opened.
In the most recent facilities needs assessment completed by Claycomb Associates, Architects, Inc. in 1998 for SISD, SISD's schools were given "evaluation scores from borderline to low satisfactory, indicating that the overall conditions of the buildings are such that attention is needed" (Exhibit 3-9). Six rating criteria were used:
• School site: site size, accessibility, locations, possible future expansion and drainage.
• Structural and mechanical, electrical, plumbing: barrier- free interior and exterior, roofs, foundations, walls, ceilings, student traffic flow, restrooms, heating and air conditioning system.
• Plant maintainability: windows, doors, walls, wall coverings, floors, floor coverings, outdoor light, built- in equipment, hardware and electrical outlets.
• Building safety and security: access streets, off-site sidewalks, vehicular exits and entrances, stairways, exterior doors, emergency lighting and building security systems.
• Educational adequacy: size of academic learning areas and location away from noise, storage for student and teacher materials, size and design of learning areas and cafeteria.
• Environment for education: overall design, landscaping, exterior noise, entrances and walkways, building materials, color schemes, acoustical treatment, furniture and equipment.
Each of these areas was rated as excellent (90-100 percent), satisfactory (70-89 percent), borderline (50-69 percent), poor (30-49 percent) or inadequate (1-29 percent).
Exhibit 3-9 SISD Facilities Evaluation
1998
Evaluation Criteria Brown
Primary School
Smithville Elementary
School
Smithville Junior High
Smithville High
School
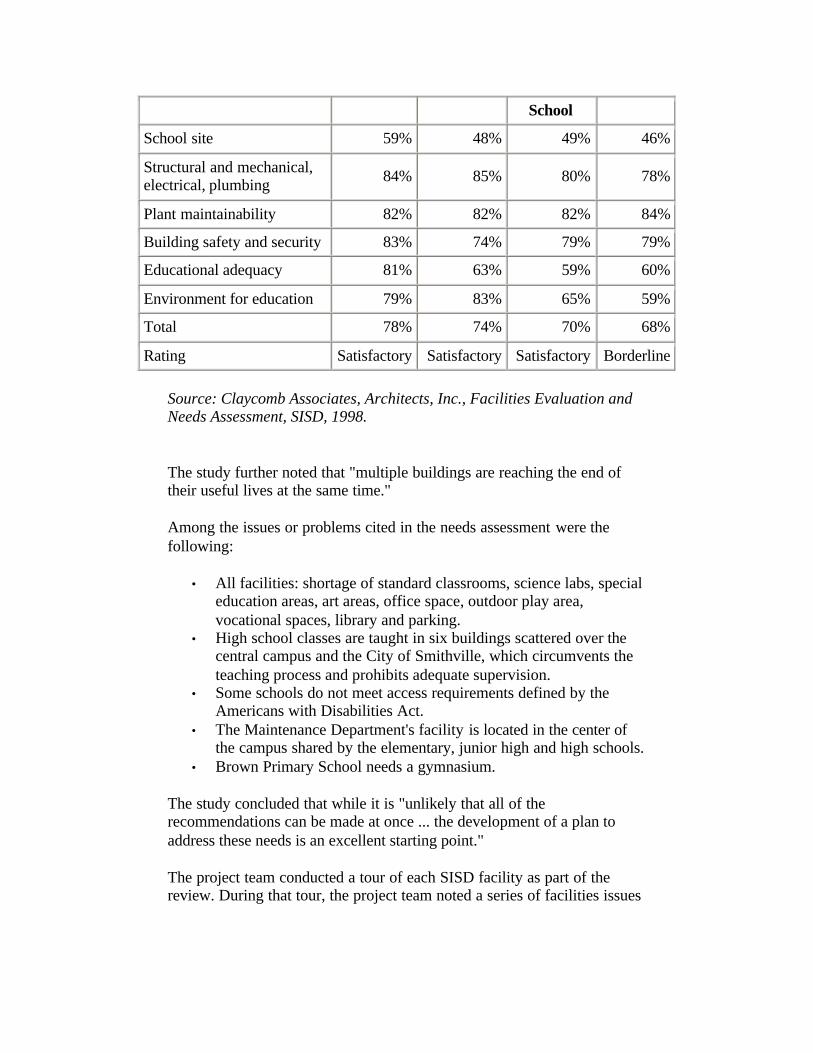
School
School site 59% 48% 49% 46%
Structural and mechanical, electrical, plumbing 84% 85% 80% 78%
Plant maintainability 82% 82% 82% 84%
Building safety and security 83% 74% 79% 79%
Educational adequacy 81% 63% 59% 60%
Environment for education 79% 83% 65% 59%
Total 78% 74% 70% 68%
Rating Satisfactory Satisfactory Satisfactory Borderline
Source: Claycomb Associates, Architects, Inc., Facilities Evaluation and Needs Assessment, SISD, 1998.
The study further noted that "multiple buildings are reaching the end of their useful lives at the same time."
Among the issues or problems cited in the needs assessment were the following:
• All facilities: shortage of standard classrooms, science labs, special education areas, art areas, office space, outdoor play area, vocational spaces, library and parking.
• High school classes are taught in six buildings scattered over the central campus and the City of Smithville, which circumvents the teaching process and prohibits adequate supervision.
• Some schools do not meet access requirements defined by the Americans with Disabilities Act.
• The Maintenance Department's facility is located in the center of the campus shared by the elementary, junior high and high schools.
• Brown Primary School needs a gymnasium.
The study concluded that while it is "unlikely that all of the recommendations can be made at once ... the development of a plan to address these needs is an excellent starting point."
The project team conducted a tour of each SISD facility as part of the review. During that tour, the project team noted a series of facilities issues
• Restroom facilities at the junior high school do not meet Texas Department of Health standards for the number and size of facilities for the student population. There is only one girls' and one boys' facility for 267 students. There should be at least six total restroom facilities for both boys and girls.
• The faculty restroom in the junior high school was created by constructing a plywood barrier between one lavatory and the remainder of the girls' restroom.
• Three portable buildings (six classrooms) being built at the elementary campus for use beginning in 2000-01 do not have restroom facilities, requiring students to walk into the main building.
• Science labs in the junior high school and high school are not up to current standards for available desk space and equipment for use in experiments.
• Storage space at all SISD facilities is extremely limited and almost non-existent at the junior high school.
• Several high school classes are in a metal building outside the high school that was converted from a vocational shop and has inadequate sound proofing and ventilation.
• Access to several classrooms at the junior high school require students to go outside the main building to get to them.
• Buses pick up students from the elementary, junior high and high school at one location in the center of the campus. Parents come to the same area in cars to pick up students. Access is extremely limited and creates safety problems.
• In several of the facilities, damaged ceiling tiles had not been replaced.
The school district had a facilities committee in 1992-93. The committee developed a master plan was to cover the years 1994-1999. The existing new Brown Primary School building and the cafetorium were projects called for in that plan. After the superintendent left the district in the summer of 1995, however, nothing else in the plan was accomplished and the committee ceased to meet. This plan is now out of date and not reflective of the needs of the district.
In 1998, the next superintendent reorganized the facilities committee. That committee conducted extensive evaluations of SISD's existing facilities and toured other school districts in formulating their findings and report to the board. The committee recommended to the board that the district needed a new high school. The board was divided but still proceeded to develop the plan for a new high school. However, there was still considerable controversy on the board and within the community.
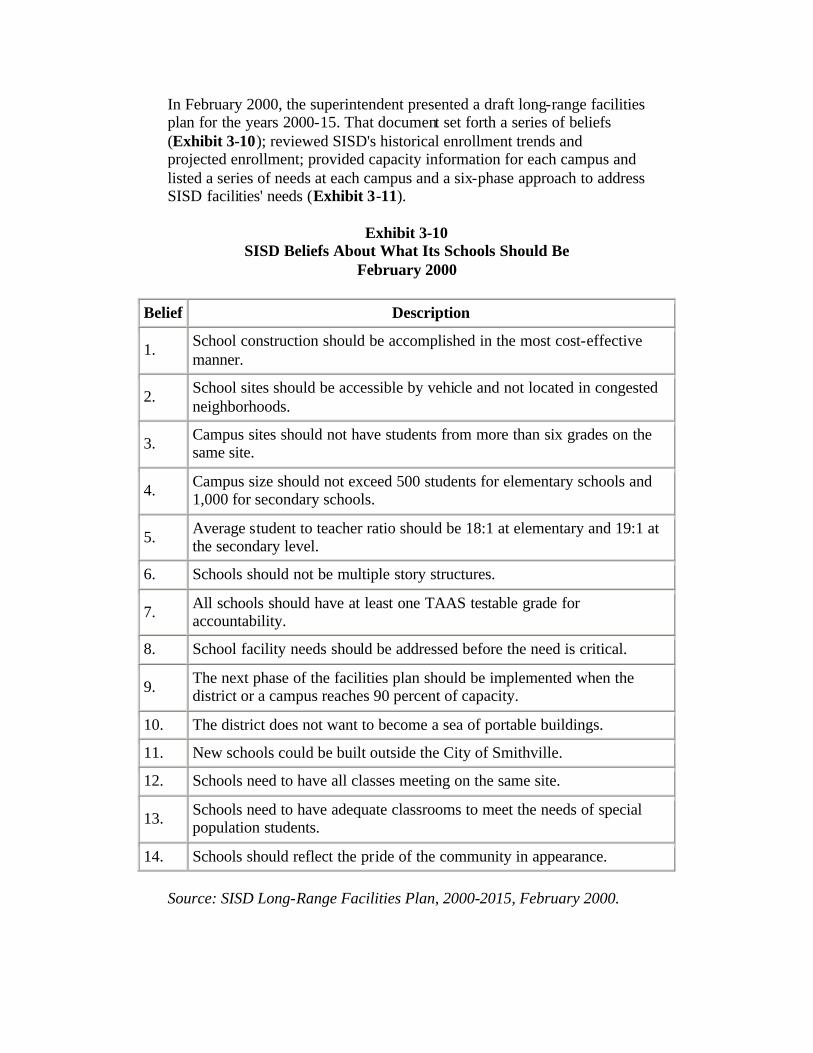
In February 2000, the superintendent presented a draft long-range facilities plan for the years 2000-15. That document set forth a series of beliefs (Exhibit 3-10); reviewed SISD's historical enrollment trends and projected enrollment; provided capacity information for each campus and listed a series of needs at each campus and a six-phase approach to address SISD facilities' needs (Exhibit 3-11).
Exhibit 3-10 SISD Beliefs About What Its Schools Should Be
February 2000
Belief Description
1. School construction should be accomplished in the most cost-effective manner.
2. School sites should be accessible by vehicle and not located in congested neighborhoods.
3. Campus sites should not have students from more than six grades on the same site.
4. Campus size should not exceed 500 students for elementary schools and 1,000 for secondary schools.
5. Average student to teacher ratio should be 18:1 at elementary and 19:1 at the secondary level.
6. Schools should not be multiple story structures.
7. All schools should have at least one TAAS testable grade for accountability.
8. School facility needs should be addressed before the need is critical.
9. The next phase of the facilities plan should be implemented when the district or a campus reaches 90 percent of capacity.
10. The district does not want to become a sea of portable buildings.
11. New schools could be built outside the City of Smithville.
12. Schools need to have all classes meeting on the same site.
13. Schools need to have adequate classrooms to meet the needs of special population students.
14. Schools should reflect the pride of the community in appearance.
Source: SISD Long-Range Facilities Plan, 2000-2015, February 2000.
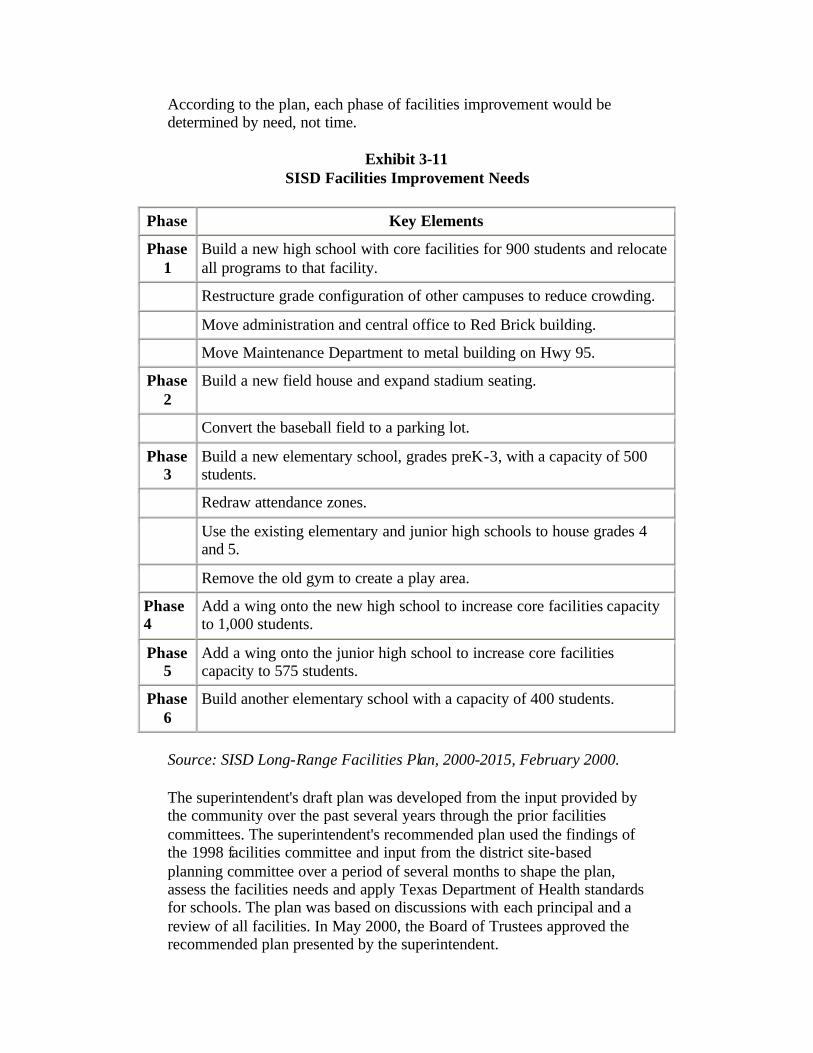
According to the plan, each phase of facilities improvement would be determined by need, not time.
Exhibit 3-11 SISD Facilities Improvement Needs
Phase Key Elements
Phase 1
Build a new high school with core facilities for 900 students and relocate all programs to that facility.
Restructure grade configuration of other campuses to reduce crowding.
Move administration and central office to Red Brick building.
Move Maintenance Department to metal building on Hwy 95.
Phase 2
Build a new field house and expand stadium seating.
Convert the baseball field to a parking lot.
Phase 3
Build a new elementary school, grades preK-3, with a capacity of 500 students.
Redraw attendance zones.
Use the existing elementary and junior high schools to house grades 4 and 5.
Remove the old gym to create a play area.
Phase 4
Add a wing onto the new high school to increase core facilities capacity to 1,000 students.
Phase 5
Add a wing onto the junior high school to increase core facilities capacity to 575 students.
Phase 6
Build another elementary school with a capacity of 400 students.
Source: SISD Long-Range Facilities Plan, 2000-2015, February 2000.
The superintendent's draft plan was developed from the input provided by the community over the past several years through the prior facilities committees. The superintendent's recommended plan used the findings of the 1998 facilities committee and input from the district site-based planning committee over a period of several months to shape the plan, assess the facilities needs and apply Texas Department of Health standards for schools. The plan was based on discussions with each principal and a review of all facilities. In May 2000, the Board of Trustees approved the recommended plan presented by the superintendent.
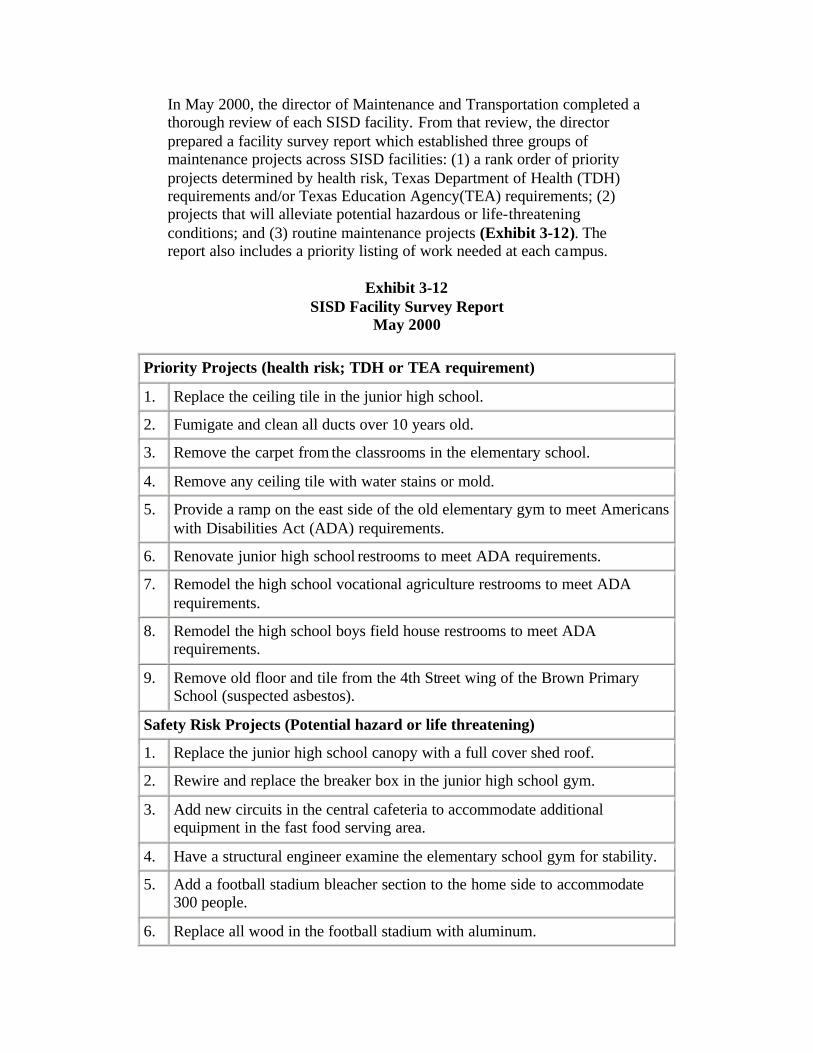
In May 2000, the director of Maintenance and Transportation completed a thorough review of each SISD facility. From that review, the director prepared a facility survey report which established three groups of maintenance projects across SISD facilities: (1) a rank order of priority projects determined by health risk, Texas Department of Health (TDH) requirements and/or Texas Education Agency(TEA) requirements; (2) projects that will alleviate potential hazardous or life-threatening conditions; and (3) routine maintenance projects (Exhibit 3-12). The report also includes a priority listing of work needed at each campus.
Exhibit 3-12 SISD Facility Survey Report
May 2000
Priority Projects (health risk; TDH or TEA requirement)
1. Replace the ceiling tile in the junior high school.
2. Fumigate and clean all ducts over 10 years old.
3. Remove the carpet from the classrooms in the elementary school.
4. Remove any ceiling tile with water stains or mold.
5. Provide a ramp on the east side of the old elementary gym to meet Americans with Disabilities Act (ADA) requirements.
6. Renovate junior high school restrooms to meet ADA requirements.
7. Remodel the high school vocational agriculture restrooms to meet ADA requirements.
8. Remodel the high school boys field house restrooms to meet ADA requirements.
9. Remove old floor and tile from the 4th Street wing of the Brown Primary School (suspected asbestos).
Safety Risk Projects (Potential hazard or life threatening)
1. Replace the junior high school canopy with a full cover shed roof.
2. Rewire and replace the breaker box in the junior high school gym.
3. Add new circuits in the central cafeteria to accommodate additional equipment in the fast food serving area.
4. Have a structural engineer examine the elementary school gym for stability.
5. Add a football stadium bleacher section to the home side to accommodate 300 people.
6. Replace all wood in the football stadium with aluminum.
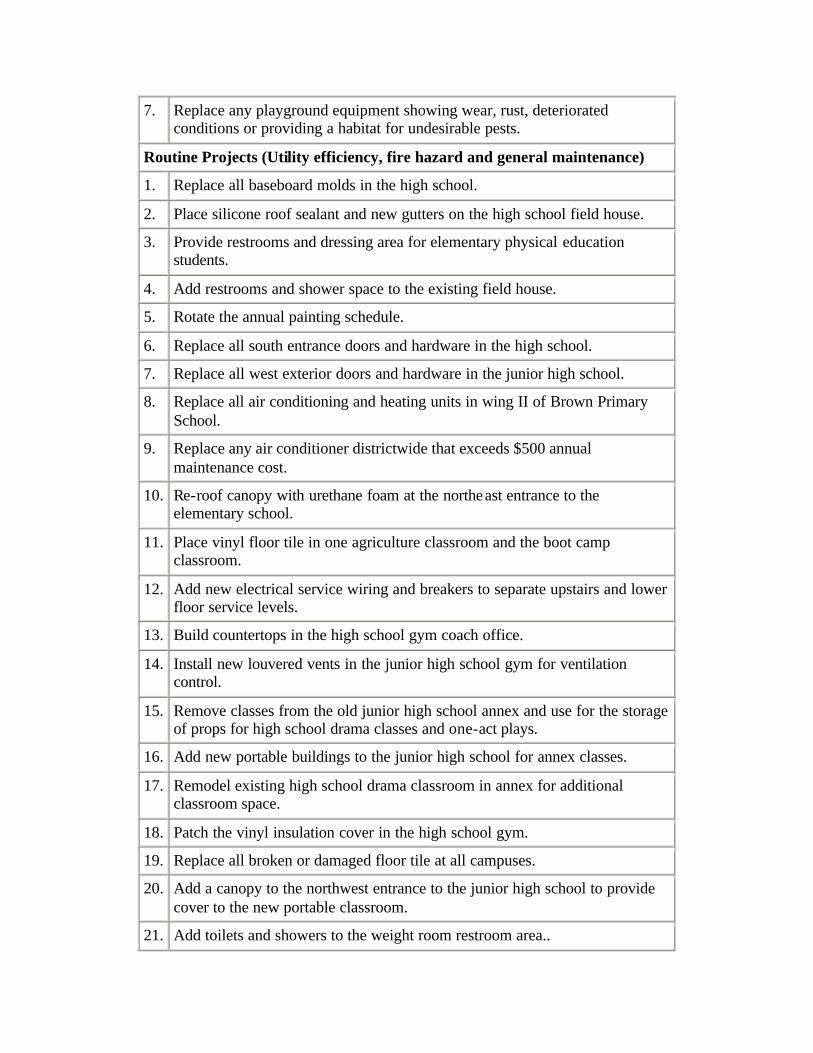
7. Replace any playground equipment showing wear, rust, deteriorated conditions or providing a habitat for undesirable pests.
Routine Projects (Utility efficiency, fire hazard and general maintenance)
1. Replace all baseboard molds in the high school.
2. Place silicone roof sealant and new gutters on the high school field house.
3. Provide restrooms and dressing area for elementary physical education students.
4. Add restrooms and shower space to the existing field house.
5. Rotate the annual painting schedule.
6. Replace all south entrance doors and hardware in the high school.
7. Replace all west exterior doors and hardware in the junior high school.
8. Replace all air conditioning and heating units in wing II of Brown Primary School.
9. Replace any air conditioner districtwide that exceeds $500 annual maintenance cost.
10. Re-roof canopy with urethane foam at the northeast entrance to the elementary school.
11. Place vinyl floor tile in one agriculture classroom and the boot camp classroom.
12. Add new electrical service wiring and breakers to separate upstairs and lower floor service levels.
13. Build countertops in the high school gym coach office.
14. Install new louvered vents in the junior high school gym for ventilation control.
15. Remove classes from the old junior high school annex and use for the storage of props for high school drama classes and one-act plays.
16. Add new portable buildings to the junior high school for annex classes.
17. Remodel existing high school drama classroom in annex for additional classroom space.
18. Patch the vinyl insulation cover in the high school gym.
19. Replace all broken or damaged floor tile at all campuses.
20. Add a canopy to the northwest entrance to the junior high school to provide cover to the new portable classroom.
21. Add toilets and showers to the weight room restroom area..
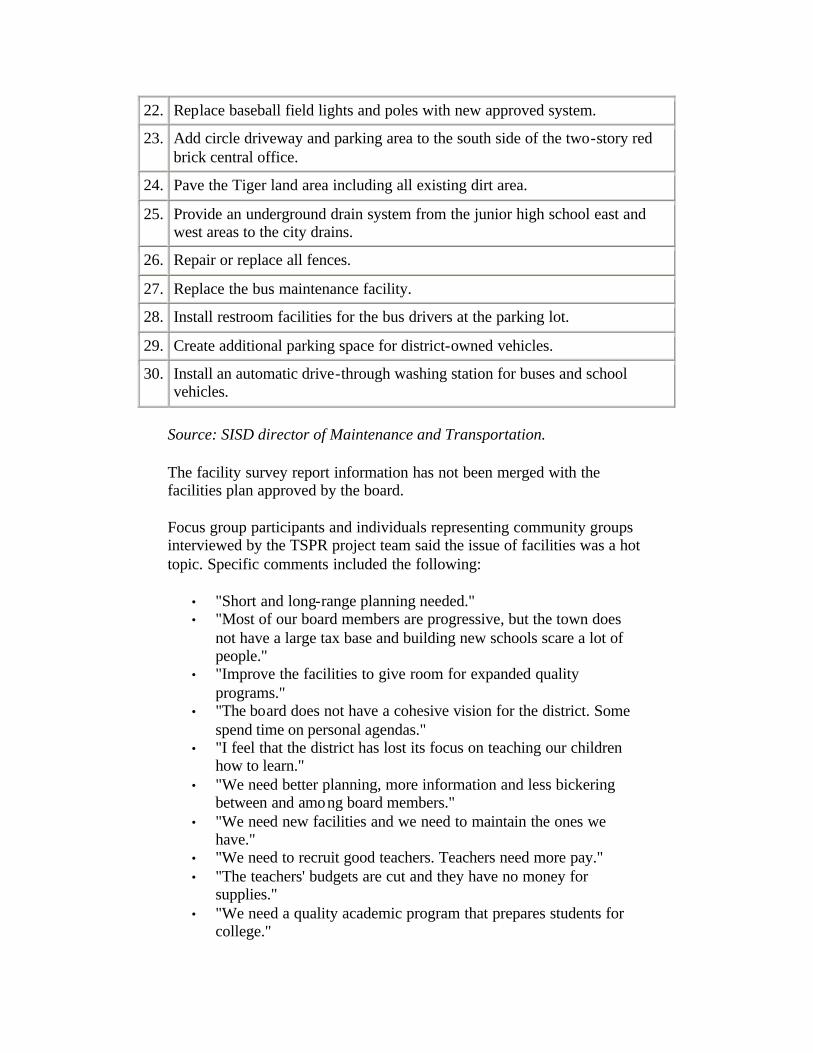
22. Replace baseball field lights and poles with new approved system.
23. Add circle driveway and parking area to the south side of the two-story red brick central office.
24. Pave the Tiger land area including all existing dirt area.
25. Provide an underground drain system from the junior high school east and west areas to the city drains.
26. Repair or replace all fences.
27. Replace the bus maintenance facility.
28. Install restroom facilities for the bus drivers at the parking lot.
29. Create additional parking space for district-owned vehicles.
30. Install an automatic drive-through washing station for buses and school vehicles.
Source: SISD director of Maintenance and Transportation.
The facility survey report information has not been merged with the facilities plan approved by the board.
Focus group participants and individuals representing community groups interviewed by the TSPR project team said the issue of facilities was a hot topic. Specific comments included the following:
• "Short and long-range planning needed." • "Most of our board members are progressive, but the town does
not have a large tax base and building new schools scare a lot of people."
• "Improve the facilities to give room for expanded quality programs."
• "The board does not have a cohesive vision for the district. Some spend time on personal agendas."
• "I feel that the district has lost its focus on teaching our children how to learn."
• "We need better planning, more information and less bickering between and among board members."
• "We need new facilities and we need to maintain the ones we have."
• "We need to recruit good teachers. Teachers need more pay." • "The teachers' budgets are cut and they have no money for
supplies." • "We need a quality academic program that prepares students for
college."
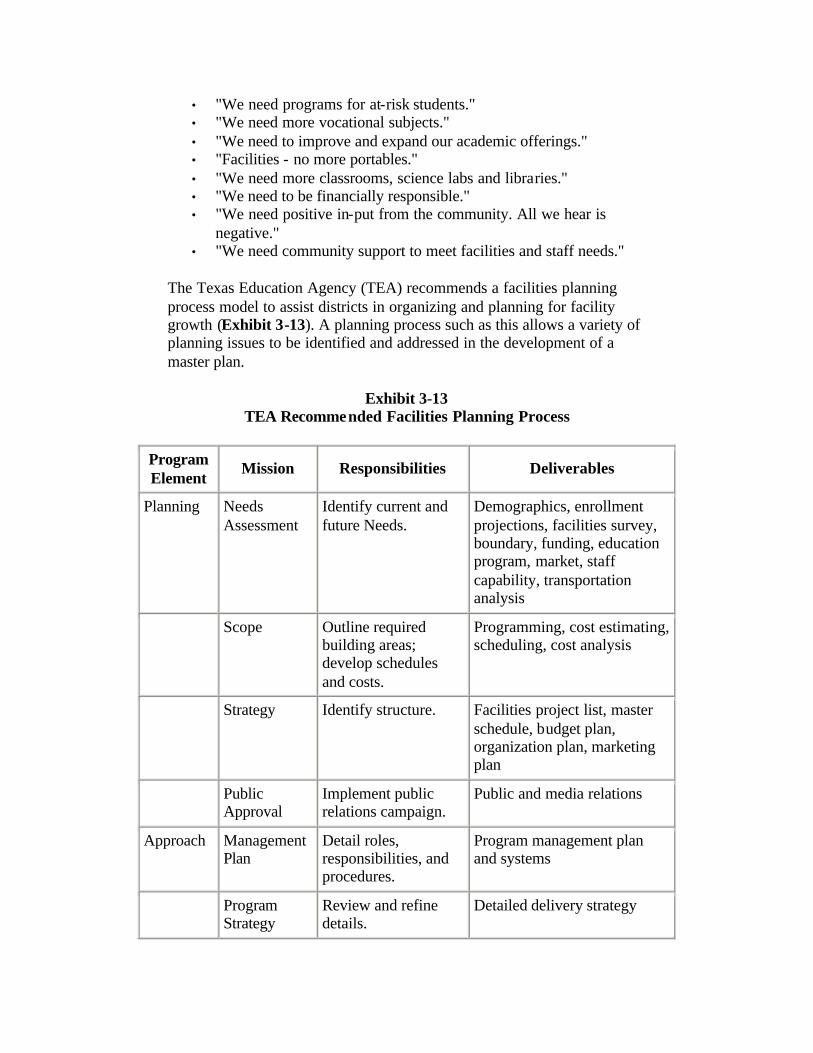
• "We need programs for at-risk students." • "We need more vocational subjects." • "We need to improve and expand our academic offerings." • "Facilities - no more portables." • "We need more classrooms, science labs and libraries." • "We need to be financially responsible." • "We need positive in-put from the community. All we hear is
negative." • "We need community support to meet facilities and staff needs."
The Texas Education Agency (TEA) recommends a facilities planning process model to assist districts in organizing and planning for facility growth (Exhibit 3-13). A planning process such as this allows a variety of planning issues to be identified and addressed in the development of a master plan.
Exhibit 3-13 TEA Recommended Facilities Planning Process
Program Element
Mission Responsibilities Deliverables
Planning Needs Assessment
Identify current and future Needs.
Demographics, enrollment projections, facilities survey, boundary, funding, education program, market, staff capability, transportation analysis
Scope Outline required building areas; develop schedules and costs.
Programming, cost estimating, scheduling, cost analysis
Strategy Identify structure. Facilities project list, master schedule, budget plan, organization plan, marketing plan
Public Approval
Implement public relations campaign.
Public and media relations
Approach Management Plan
Detail roles, responsibilities, and procedures.
Program management plan and systems
Program Strategy
Review and refine details.
Detailed delivery strategy
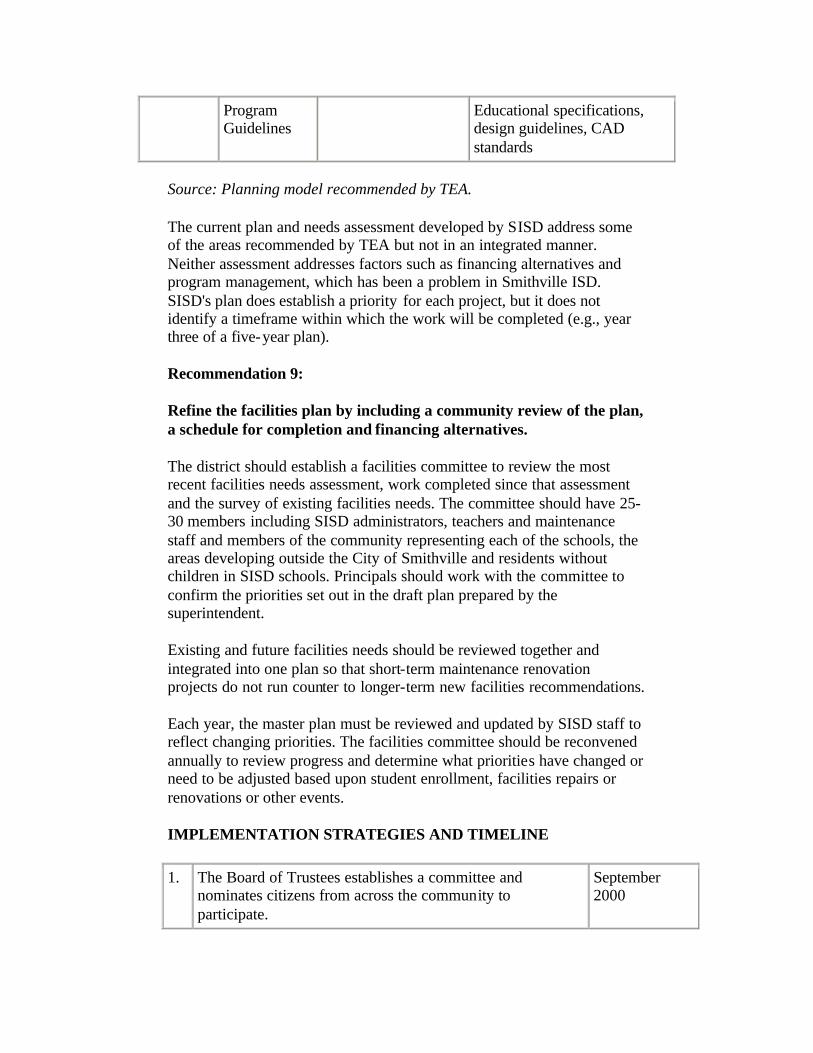
Program Guidelines
Educational specifications, design guidelines, CAD standards
Source: Planning model recommended by TEA.
The current plan and needs assessment developed by SISD address some of the areas recommended by TEA but not in an integrated manner. Neither assessment addresses factors such as financing alternatives and program management, which has been a problem in Smithville ISD. SISD's plan does establish a priority for each project, but it does not identify a timeframe within which the work will be completed (e.g., year three of a five-year plan).
Recommendation 9:
Refine the facilities plan by including a community review of the plan, a schedule for completion and financing alternatives.
The district should establish a facilities committee to review the most recent facilities needs assessment, work completed since that assessment and the survey of existing facilities needs. The committee should have 25-30 members including SISD administrators, teachers and maintenance staff and members of the community representing each of the schools, the areas developing outside the City of Smithville and residents without children in SISD schools. Principals should work with the committee to confirm the priorities set out in the draft plan prepared by the superintendent.
Existing and future facilities needs should be reviewed together and integrated into one plan so that short-term maintenance renovation projects do not run counter to longer-term new facilities recommendations.
Each year, the master plan must be reviewed and updated by SISD staff to reflect changing priorities. The facilities committee should be reconvened annually to review progress and determine what priorities have changed or need to be adjusted based upon student enrollment, facilities repairs or renovations or other events.
IMPLEMENTATION STRATEGIES AND TIMELINE
1. The Board of Trustees establishes a committee and nominates citizens from across the community to participate.
September 2000

2. The superintendent selects SISD staff to serve on the committee.
September 2000
3. The superintendent, director of Maintenance and Transportation and the director of Business serve as support to the committee and schedule the initial meeting.
September 2000
4. The committee establishes a meeting schedule, reviews the needs assessment documents, and, if necessary, conducts a tour of all facilities.
October-November 2000
5. The committee prepares a priority list of facilities needs and holds meetings at each school to gather feedback from parents and residents.
December 2000 - February 2001
6. The committee includes the community input in its recommendations and combines the priorities into a recommended master plan.
February-April 2001
7. The directors of Business and Maintenance provide cost data for each recommended item and recommend a schedule for accomplishing the plan based upon projected financial capabilities of the district.
May 2001
8. The superintendent reviews the plan and recommends approval to the board.
May 2001
9. The board reviews the plan, makes modifications, approves the overall plan and directs the superintendent to include implementation of year-one items in the budget preparation process.
June 2001
10. The superintendent annually updates the plan, reviews the cost information and presents recommendations to the board.
Ongoing
FISCAL IMPACT
This recommendation can be accomplished with existing resources.
FINDING
Previously, maintenance budgets for SISD facilities were developed using the expenditures for the prior year, as tracked by purchase orders for each facility. A principal could add items to the budget based upon the severity of the need. However, the needs at one school may be higher priority, but if the principal did not have budgeted funds, the work would not be completed.

For the first time, in 1999-2000, the director of Maintenance and Transportation conducted a detailed needs assessment for maintenance at each existing SISD facility. The director prioritized the needs at each facility in a report to the superintendent presented in May 2000 (Exhibit 3-14).
Exhibit 3-14 SISD Facilities Maintenance Needs by Location
May 2000
Facility Examples of Priority Needs
High school Replace all floor base in all halls and classrooms.
Clean and fumigate all classroom ducts in air conditioning and heating system.
Replace any air conditioning system that requires more than $500 annual service.
Replace doors and hardware on south entrance facing Tiger Lane.
Junior high school Replace all ceiling tile in classrooms.
Clean and fumigate all classroom ducts in air conditioning and heating system.
Modify boys and girls restrooms to ADA standards and expand facility.
Paint all walls and doors.
Elementary school Remove all classroom carpet and replace with vinyl tile.
Paint all halls and classrooms.
Replace soiled and broken ceiling tile.
Repair the exterior light fixture in the northeast canopy.
Primary school Replace 1980 split air conditioning and heating system with wall units.
Replace 1956 roof top air conditioning and heating system.
Replace floor tile in several rooms.
High school gym Replace all exterior doors and hardware with new material.
Patch vinyl ceiling cover with matching tape.
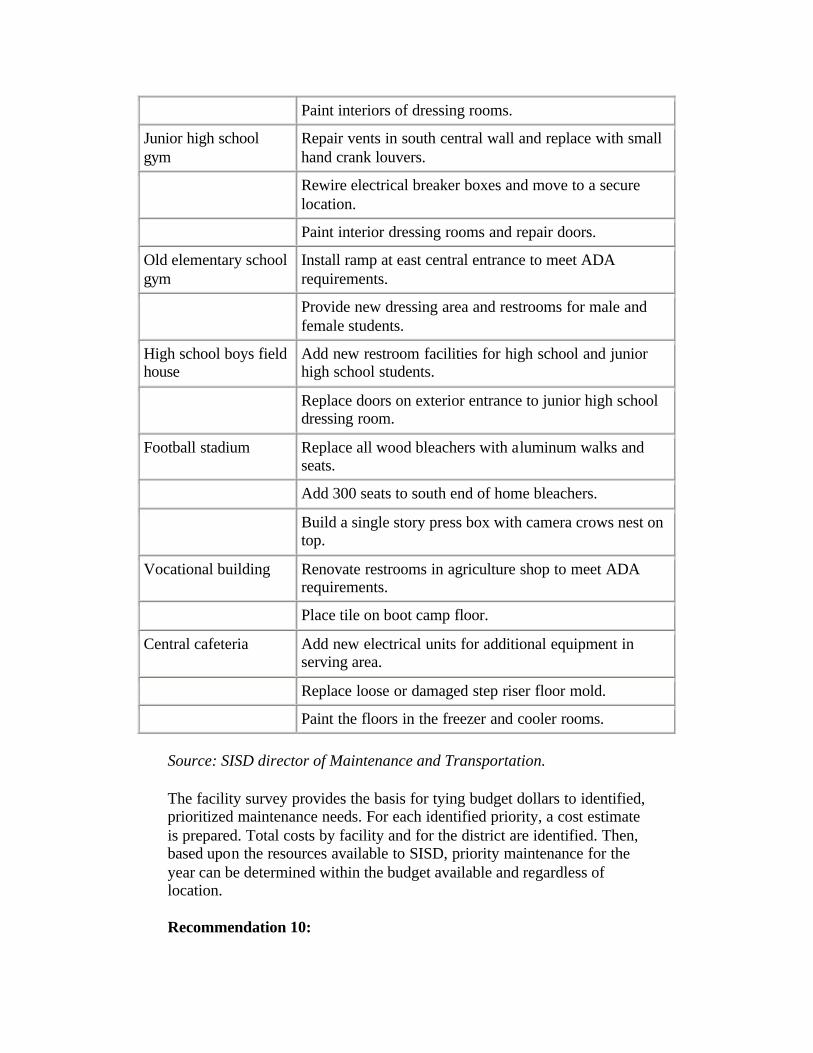
Paint interiors of dressing rooms.
Junior high school gym
Repair vents in south central wall and replace with small hand crank louvers.
Rewire electrical breaker boxes and move to a secure location.
Paint interior dressing rooms and repair doors.
Old elementary school gym
Install ramp at east central entrance to meet ADA requirements.
Provide new dressing area and restrooms for male and female students.
High school boys field house
Add new restroom facilities for high school and junior high school students.
Replace doors on exterior entrance to junior high school dressing room.
Football stadium Replace all wood bleachers with aluminum walks and seats.
Add 300 seats to south end of home bleachers.
Build a single story press box with camera crows nest on top.
Vocational building Renovate restrooms in agriculture shop to meet ADA requirements.
Place tile on boot camp floor.
Central cafeteria Add new electrical units for additional equipment in serving area.
Replace loose or damaged step riser floor mold.
Paint the floors in the freezer and cooler rooms.
Source: SISD director of Maintenance and Transportation.
The facility survey provides the basis for tying budget dollars to identified, prioritized maintenance needs. For each identified priority, a cost estimate is prepared. Total costs by facility and for the district are identified. Then, based upon the resources available to SISD, priority maintenance for the year can be determined within the budget available and regardless of location.
Recommendation 10:

Develop an ongoing process that ties maintenance needs to the budget.
The facilities master plan should be the beginning point for determining Maintenance Department priorities for the year. Work that is intended to be completed by SISD personnel should be reviewed to ensure that costs are accurate.
Principals should be surveyed and tours conducted of each facility in the spring to confirm work that is in the master plan and additional work that needs to be done. Costs should be developed for each project not already in the master plan.
The projects and cost figures should be reviewed by the director and approved or modified based upon workload. Priorities should be set and included in the budget in this manner so that decisions regarding the size of the department's budget are based upon required priorities and actual costs.
The budget and associated priorities should be presented and discussed with the superintendent and all principals and modified to reflect final district priorities. These priorities should be presented with associated costs in the budget process.
IMPLEMENTATION STRATEGIES AND TIMELINE
1. The director of Maintenance and Transportation reviews the facility master plan and the survey of existing facility needs.
January 2001
2. The director updates the facility survey for routine maintenance needs.
January 2001
3. The director uses the information provided by the plan and the facility survey update to prepare a recommended budget tied to the priority needs of the district.
January - February 2001
4. The director meets with principals to receive input. March 2001
5. The director modifies the budget, as necessary. April 2001
6. The director discusses the revised priorities and budget with the superintendent.
May 2001
7. The director includes these priorities with associated costs in the budget.
July 2001
FISCAL IMPACT
This recommendation can be accomplished with existing resources.

Chapter 3
B. MAINTENANCE OPERATIONS
The Maintenance Department maintains the facilities and performs routine repairs. The department has seven positions including a director, carpenter, carpenter's assistant and four general maintenance workers.
The director has an office in the central office. All but one of the maintenance workers are in a facility at the center of the elementary, junior high and high school campuses. The other maintenance worker stays full time at Brown Primary School.
The Maintenance Department expenditures for the period 1996-97 through 1998-99 and the budget for 1999-2000 are included in Exhibit 3-15.
Exhibit 3-15 SISD Maintenance Budget
1995-96 - 1999-2000
Operating Expense
1996-97 Actual
1997-98 Actual
1998-99 Actual
1999-2000 Budget
Percentage Change
Payroll $407,467 $461,912 $494,687 $559,443 37.3%
Contracted services (1) $98,641 $80,640 $88,931 $75,000 -24.0%
Maintenance, equipment, materials and supplies
$74,028 $94,384 $73,058 $102,500 38.5%
Total $580,136 $636,936 $656,676 $736,943 27.0%
Source: SISD budgets, 1995-96 - 1998-99. (1) Excludes utilities costs.
FINDING
The district has a manual work order system using a three-part form. There are three levels of work order priority: emergency, priority and routine. The principal determines the priority, and the director of Maintenance usually agrees with the principal's determination.
The director assigns the work order to a staff member or to a vendor on the district's approved list. The work order is given to the person responsible for doing the work. The person responsible for doing the work checks out the problem to see if any materials are required. If there are materials required, the maintenance person must come back to the director for a purchase order. For any projects for which materials costs are more than $500, the director gets verbal bids from at least three approved vendors. Once the materials costs are determined, the director completes the purchase order and gives it to the maintenance worker.
When the work is completed, the maintenance worker completes the bottom portion of the work order, explaining the work done and the number of labor hours. Any materials costs are attached to the work order copy kept by the director and reported to the director of Business. The director of Business charges the maintenance budget of the campus for materials costs only.
When the work has been completed, the director of Maintenance inspects the work to ensure that it was performed correctly. After the inspection, the director returns one copy of the work order to the principal at the campus and one copy to the originator of the work order if it is someone other than the principal.
Principals said that the Maintenance Department is responsive to their needs. According to one principal, "You send in a work order, and someone from Maintenance [Department] is usually there that day or the next at the latest. The principal at Brown Primary School said that the director of Maintenance worked with her to establish a full-time position at her school.
COMMENDATION
SISD's Maintenance Department is responsive to the needs of the schools and provides quality service.
FINDING
SISD maintains 251,140 total square footage in 15 facilities. Maintenance Department staff handle most routine repair needs of the district and contracts with various vendors for heating, ventilating and air conditioning (HVAC) work; electrical and plumbing needs; glass replacement; and pest control (Exhibit 3-16).
Exhibit 3-16 SISD Vendors Used for Contract Work
1998-99
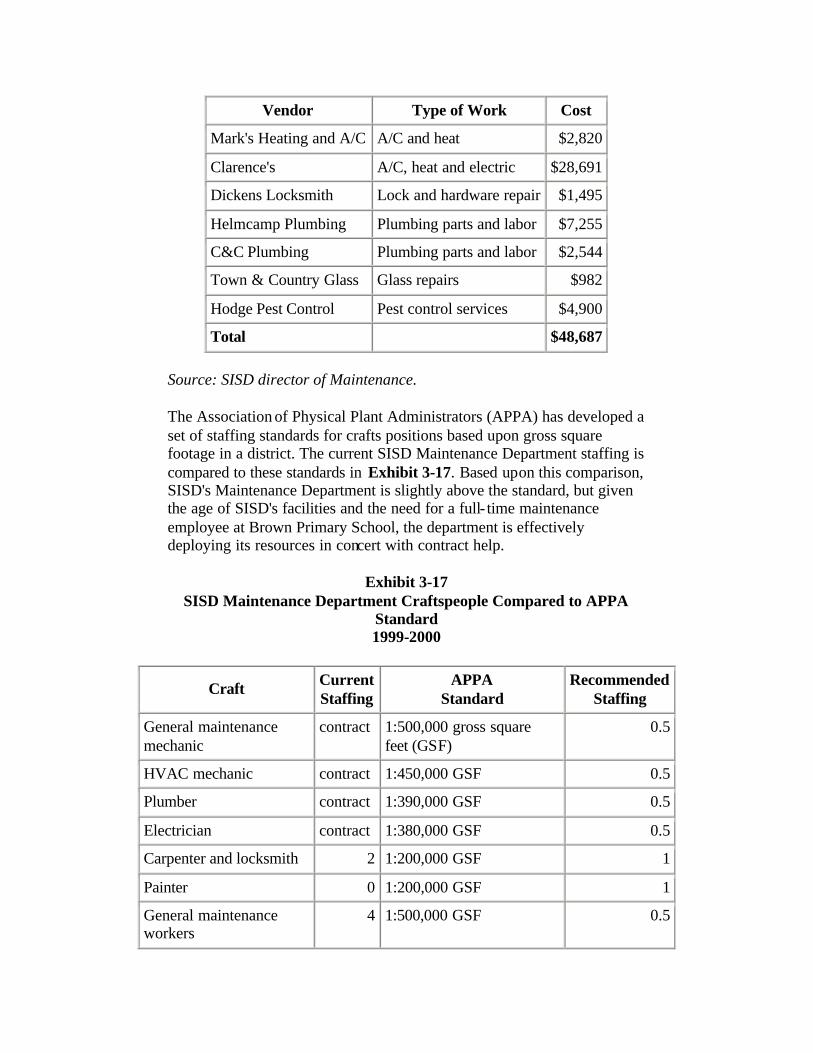
Vendor Type of Work Cost
Mark's Heating and A/C A/C and heat $2,820
Clarence's A/C, heat and electric $28,691
Dickens Locksmith Lock and hardware repair $1,495
Helmcamp Plumbing Plumbing parts and labor $7,255
C&C Plumbing Plumbing parts and labor $2,544
Town & Country Glass Glass repairs $982
Hodge Pest Control Pest control services $4,900
Total $48,687
Source: SISD director of Maintenance.
The Association of Physical Plant Administrators (APPA) has developed a set of staffing standards for crafts positions based upon gross square footage in a district. The current SISD Maintenance Department staffing is compared to these standards in Exhibit 3-17. Based upon this comparison, SISD's Maintenance Department is slightly above the standard, but given the age of SISD's facilities and the need for a full- time maintenance employee at Brown Primary School, the department is effectively deploying its resources in concert with contract help.
Exhibit 3-17 SISD Maintenance Department Craftspeople Compared to APPA
Standard 1999-2000
Craft Current Staffing
APPA Standard
Recommended Staffing
General maintenance mechanic
contract 1:500,000 gross square feet (GSF)
0.5
HVAC mechanic contract 1:450,000 GSF 0.5
Plumber contract 1:390,000 GSF 0.5
Electrician contract 1:380,000 GSF 0.5
Carpenter and locksmith 2 1:200,000 GSF 1
Painter 0 1:200,000 GSF 1
General maintenance workers
4 1:500,000 GSF 0.5
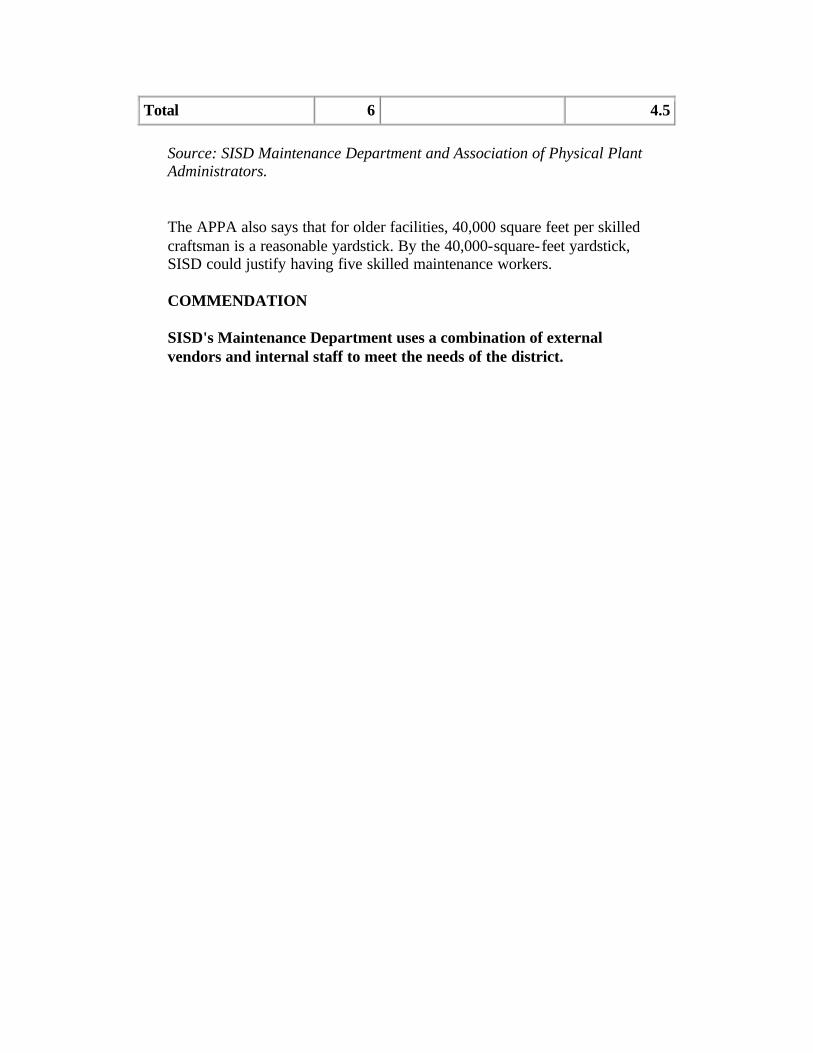
Total 6 4.5
Source: SISD Maintenance Department and Association of Physical Plant Administrators.
The APPA also says that for older facilities, 40,000 square feet per skilled craftsman is a reasonable yardstick. By the 40,000-square-feet yardstick, SISD could justify having five skilled maintenance workers.
COMMENDATION
SISD's Maintenance Department uses a combination of external vendors and internal staff to meet the needs of the district.
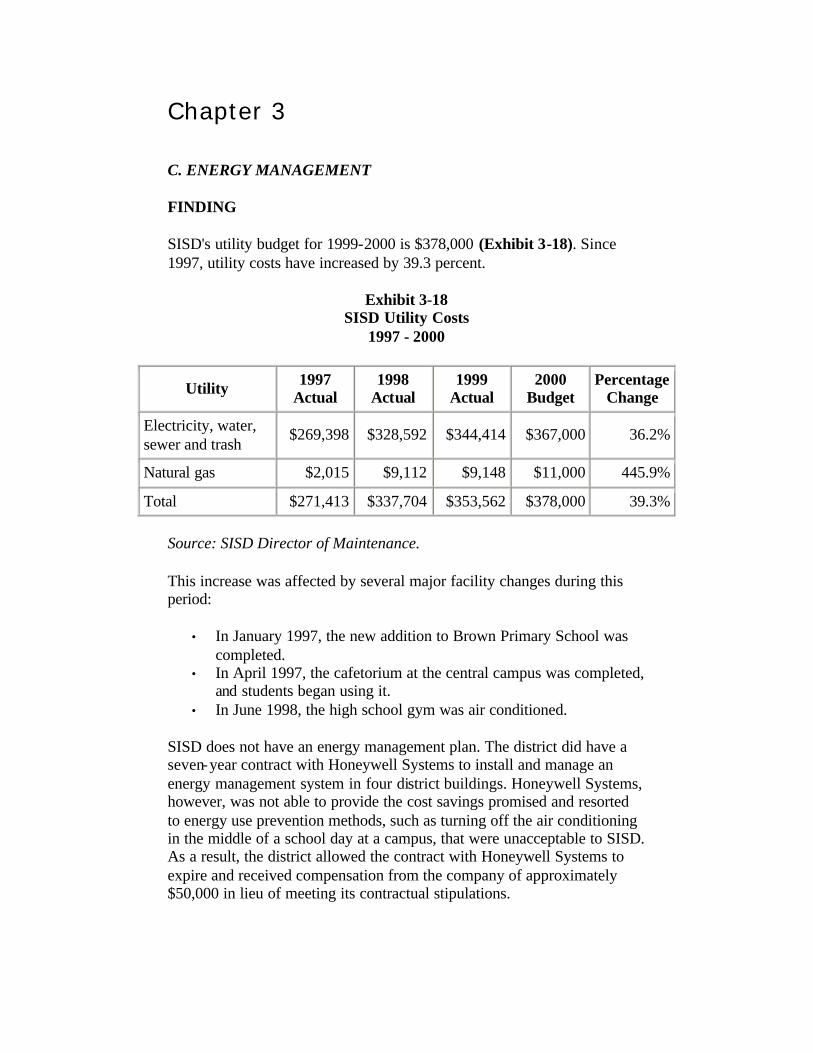
Chapter 3
C. ENERGY MANAGEMENT
FINDING
SISD's utility budget for 1999-2000 is $378,000 (Exhibit 3-18). Since 1997, utility costs have increased by 39.3 percent.
Exhibit 3-18 SISD Utility Costs
1997 - 2000
Utility 1997 Actual
1998 Actual
1999 Actual
2000 Budget
Percentage Change
Electricity, water, sewer and trash
$269,398 $328,592 $344,414 $367,000 36.2%
Natural gas $2,015 $9,112 $9,148 $11,000 445.9%
Total $271,413 $337,704 $353,562 $378,000 39.3%
Source: SISD Director of Maintenance.
This increase was affected by several major facility changes during this period:
• In January 1997, the new addition to Brown Primary School was completed.
• In April 1997, the cafetorium at the central campus was completed, and students began using it.
• In June 1998, the high school gym was air conditioned.
SISD does not have an energy management plan. The district did have a seven-year contract with Honeywell Systems to install and manage an energy management system in four district buildings. Honeywell Systems, however, was not able to provide the cost savings promised and resorted to energy use prevention methods, such as turning off the air conditioning in the middle of a school day at a campus, that were unacceptable to SISD. As a result, the district allowed the contract with Honeywell Systems to expire and received compensation from the company of approximately $50,000 in lieu of meeting its contractual stipulations.
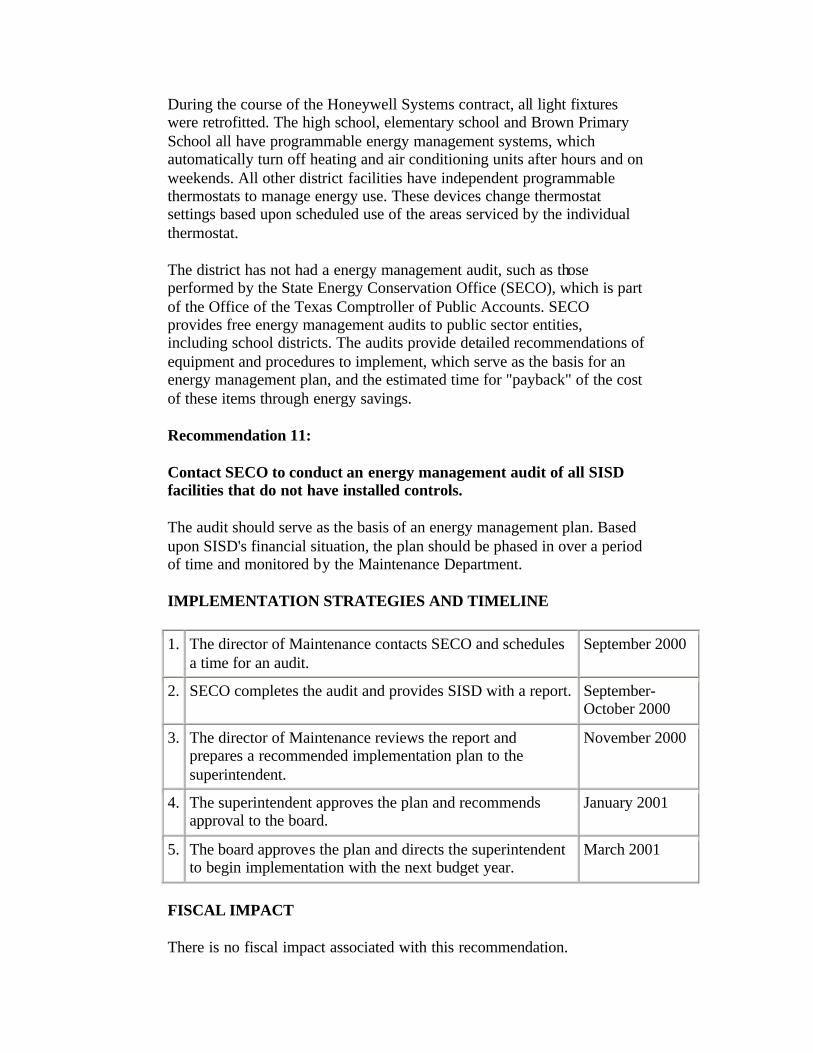
During the course of the Honeywell Systems contract, all light fixtures were retrofitted. The high school, elementary school and Brown Primary School all have programmable energy management systems, which automatically turn off heating and air conditioning units after hours and on weekends. All other district facilities have independent programmable thermostats to manage energy use. These devices change thermostat settings based upon scheduled use of the areas serviced by the individual thermostat.
The district has not had a energy management audit, such as those performed by the State Energy Conservation Office (SECO), which is part of the Office of the Texas Comptroller of Public Accounts. SECO provides free energy management audits to public sector entities, including school districts. The audits provide detailed recommendations of equipment and procedures to implement, which serve as the basis for an energy management plan, and the estimated time for "payback" of the cost of these items through energy savings.
Recommendation 11:
Contact SECO to conduct an energy management audit of all SISD facilities that do not have installed controls.
The audit should serve as the basis of an energy management plan. Based upon SISD's financial situation, the plan should be phased in over a period of time and monitored by the Maintenance Department.
IMPLEMENTATION STRATEGIES AND TIMELINE
1. The director of Maintenance contacts SECO and schedules a time for an audit.
September 2000
2. SECO completes the audit and provides SISD with a report. September-October 2000
3. The director of Maintenance reviews the report and prepares a recommended implementation plan to the superintendent.
November 2000
4. The superintendent approves the plan and recommends approval to the board.
January 2001
5. The board approves the plan and directs the superintendent to begin implementation with the next budget year.
March 2001
FISCAL IMPACT
There is no fiscal impact associated with this recommendation.

Chapter 4
FINANCIAL MANAGEMENT
This chapter reviews the financial operations of the Smithville Independent School District (SISD) in the following areas:
A. Financial Management Practices B. Financial Reporting and Budgeting C. Purchasing and Contract Management
Successful financial management operations ensure that a school district receives all available revenue from the state and federal governments; maintains a track record of sound financial decisions and adequate and equitable budget allocations; issues timely, accurate and informative reports on the district's financial position; maintains adequate internal controls; employs a skilled, well-trained staff; and maintains a consistent record of favorable reports from its external auditors.
BACKGROUND
The director of Business is responsible for major business functions, payroll, textbooks and tracking extracurricular transportation needs. Exhibit 4-1 shows the organization structure summary of SISD's Business function.
Exhibit 4-1 Organization of SISD Business Function
Source: SISD director of Business.
The director of Business reports directly to the superintendent and supervises four clerical employees. Because the district is small, the superintendent is very involved in all of the Business Office activities.
SISD maintains its accounting records on the Regional Service Center Computer Cooperative (RSCCC) software, which is supported by Regional Education Service Center XIII ("Region 13"). The district contracts with Region 13 for automated financial systems support at an annual cost of $8,190.
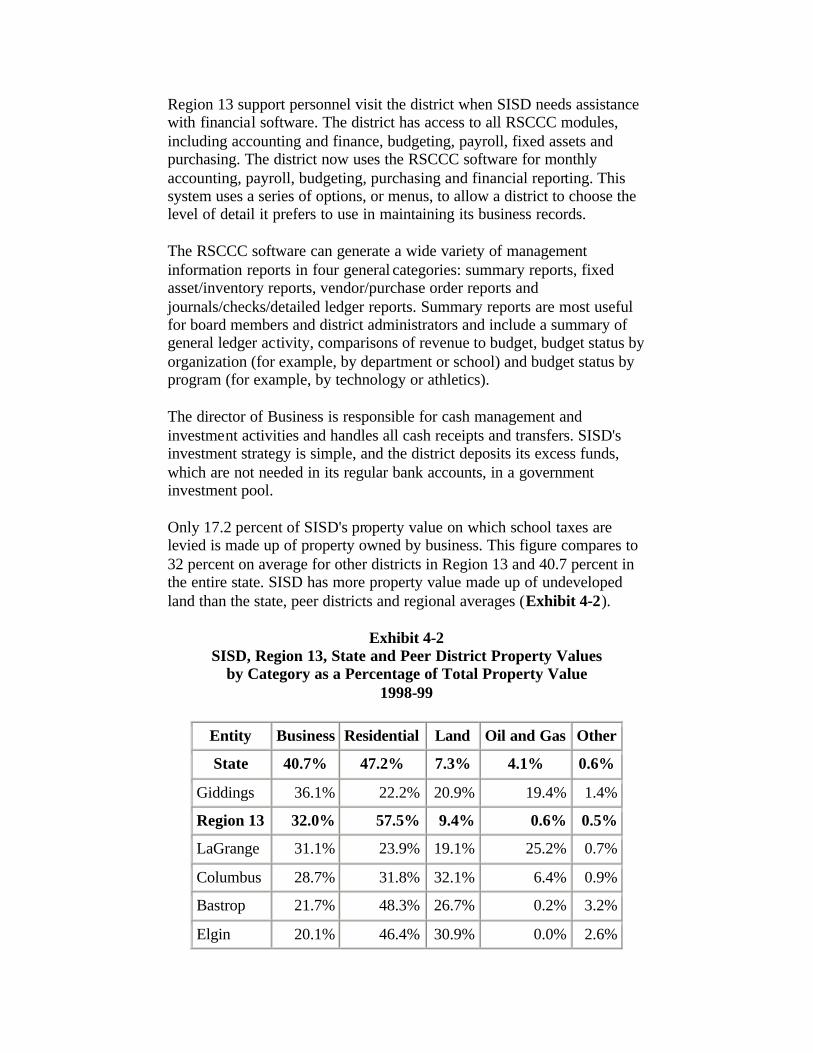
Region 13 support personnel visit the district when SISD needs assistance with financial software. The district has access to all RSCCC modules, including accounting and finance, budgeting, payroll, fixed assets and purchasing. The district now uses the RSCCC software for monthly accounting, payroll, budgeting, purchasing and financial reporting. This system uses a series of options, or menus, to allow a district to choose the level of detail it prefers to use in maintaining its business records.
The RSCCC software can generate a wide variety of management information reports in four general categories: summary reports, fixed asset/inventory reports, vendor/purchase order reports and journals/checks/detailed ledger reports. Summary reports are most useful for board members and district administrators and include a summary of general ledger activity, comparisons of revenue to budget, budget status by organization (for example, by department or school) and budget status by program (for example, by technology or athletics).
The director of Business is responsible for cash management and investment activities and handles all cash receipts and transfers. SISD's investment strategy is simple, and the district deposits its excess funds, which are not needed in its regular bank accounts, in a government investment pool.
Only 17.2 percent of SISD's property value on which school taxes are levied is made up of property owned by business. This figure compares to 32 percent on average for other districts in Region 13 and 40.7 percent in the entire state. SISD has more property value made up of undeveloped land than the state, peer districts and regional averages (Exhibit 4-2).
Exhibit 4-2 SISD, Region 13, State and Peer District Property Values
by Category as a Percentage of Total Property Value 1998-99
Entity Business Residential Land Oil and Gas Other
State 40.7% 47.2% 7.3% 4.1% 0.6%
Giddings 36.1% 22.2% 20.9% 19.4% 1.4%
Region 13 32.0% 57.5% 9.4% 0.6% 0.5%
LaGrange 31.1% 23.9% 19.1% 25.2% 0.7%
Columbus 28.7% 31.8% 32.1% 6.4% 0.9%
Bastrop 21.7% 48.3% 26.7% 0.2% 3.2%
Elgin 20.1% 46.4% 30.9% 0.0% 2.6%
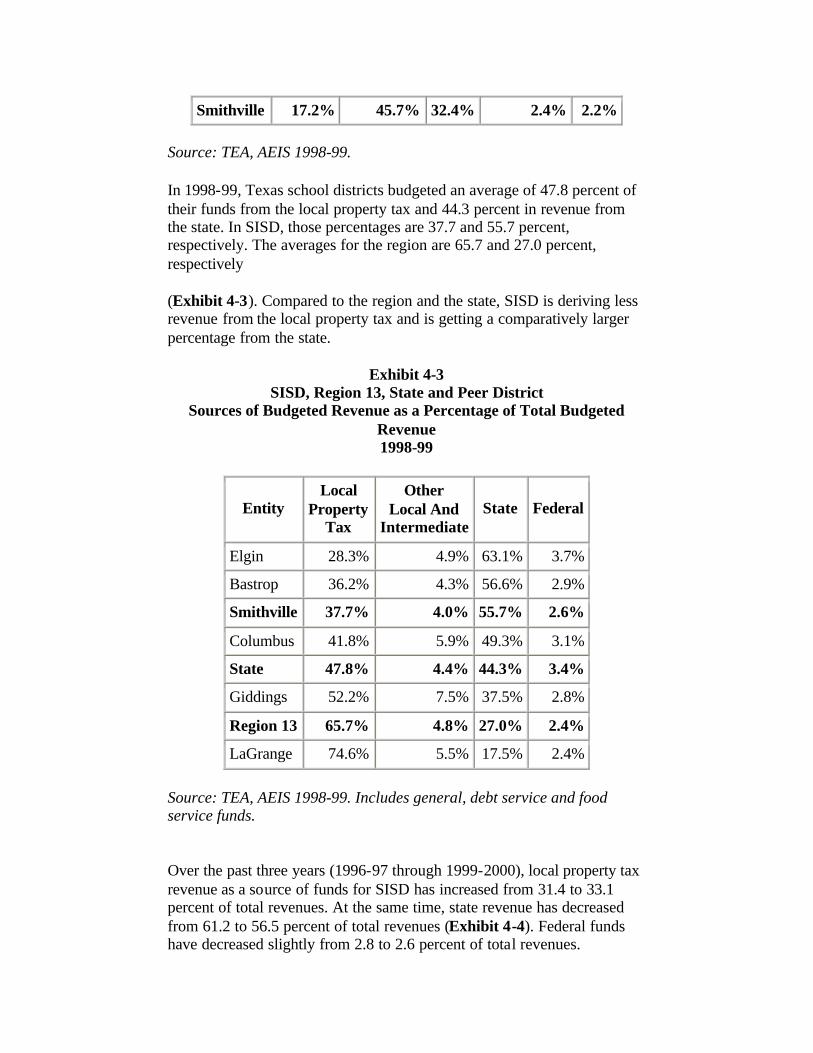
Smithville 17.2% 45.7% 32.4% 2.4% 2.2%
Source: TEA, AEIS 1998-99.
In 1998-99, Texas school districts budgeted an average of 47.8 percent of their funds from the local property tax and 44.3 percent in revenue from the state. In SISD, those percentages are 37.7 and 55.7 percent, respectively. The averages for the region are 65.7 and 27.0 percent, respectively
(Exhibit 4-3). Compared to the region and the state, SISD is deriving less revenue from the local property tax and is getting a comparatively larger percentage from the state.
Exhibit 4-3 SISD, Region 13, State and Peer District
Sources of Budgeted Revenue as a Percentage of Total Budgeted Revenue 1998-99
Entity Local
Property Tax
Other Local And
Intermediate State Federal
Elgin 28.3% 4.9% 63.1% 3.7%
Bastrop 36.2% 4.3% 56.6% 2.9%
Smithville 37.7% 4.0% 55.7% 2.6%
Columbus 41.8% 5.9% 49.3% 3.1%
State 47.8% 4.4% 44.3% 3.4%
Giddings 52.2% 7.5% 37.5% 2.8%
Region 13 65.7% 4.8% 27.0% 2.4%
LaGrange 74.6% 5.5% 17.5% 2.4%
Source: TEA, AEIS 1998-99. Includes general, debt service and food service funds.
Over the past three years (1996-97 through 1999-2000), local property tax revenue as a source of funds for SISD has increased from 31.4 to 33.1 percent of total revenues. At the same time, state revenue has decreased from 61.2 to 56.5 percent of total revenues (Exhibit 4-4). Federal funds have decreased slightly from 2.8 to 2.6 percent of total revenues.
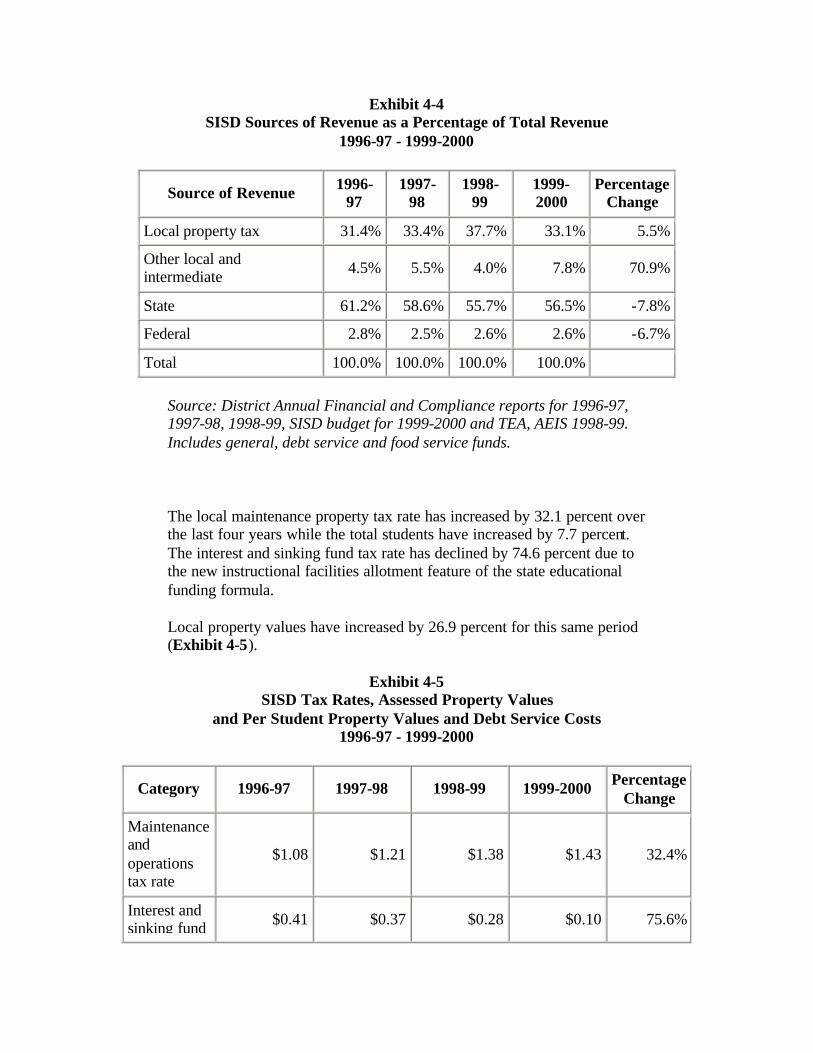
Exhibit 4-4 SISD Sources of Revenue as a Percentage of Total Revenue
1996-97 - 1999-2000
Source of Revenue 1996-97
1997-98
1998-99
1999-2000
Percentage Change
Local property tax 31.4% 33.4% 37.7% 33.1% 5.5%
Other local and intermediate 4.5% 5.5% 4.0% 7.8% 70.9%
State 61.2% 58.6% 55.7% 56.5% -7.8%
Federal 2.8% 2.5% 2.6% 2.6% -6.7%
Total 100.0% 100.0% 100.0% 100.0%
Source: District Annual Financial and Compliance reports for 1996-97, 1997-98, 1998-99, SISD budget for 1999-2000 and TEA, AEIS 1998-99. Includes general, debt service and food service funds.
The local maintenance property tax rate has increased by 32.1 percent over the last four years while the total students have increased by 7.7 percent. The interest and sinking fund tax rate has declined by 74.6 percent due to the new instructional facilities allotment feature of the state educational funding formula.
Local property values have increased by 26.9 percent for this same period (Exhibit 4-5).
Exhibit 4-5 SISD Tax Rates, Assessed Property Values
and Per Student Property Values and Debt Service Costs 1996-97 - 1999-2000
Category 1996-97 1997-98 1998-99 1999-2000 Percentage Change
Maintenance and operations tax rate
$1.08 $1.21 $1.38 $1.43 32.4%
Interest and sinking fund $0.41 $0.37 $0.28 $0.10 75.6%
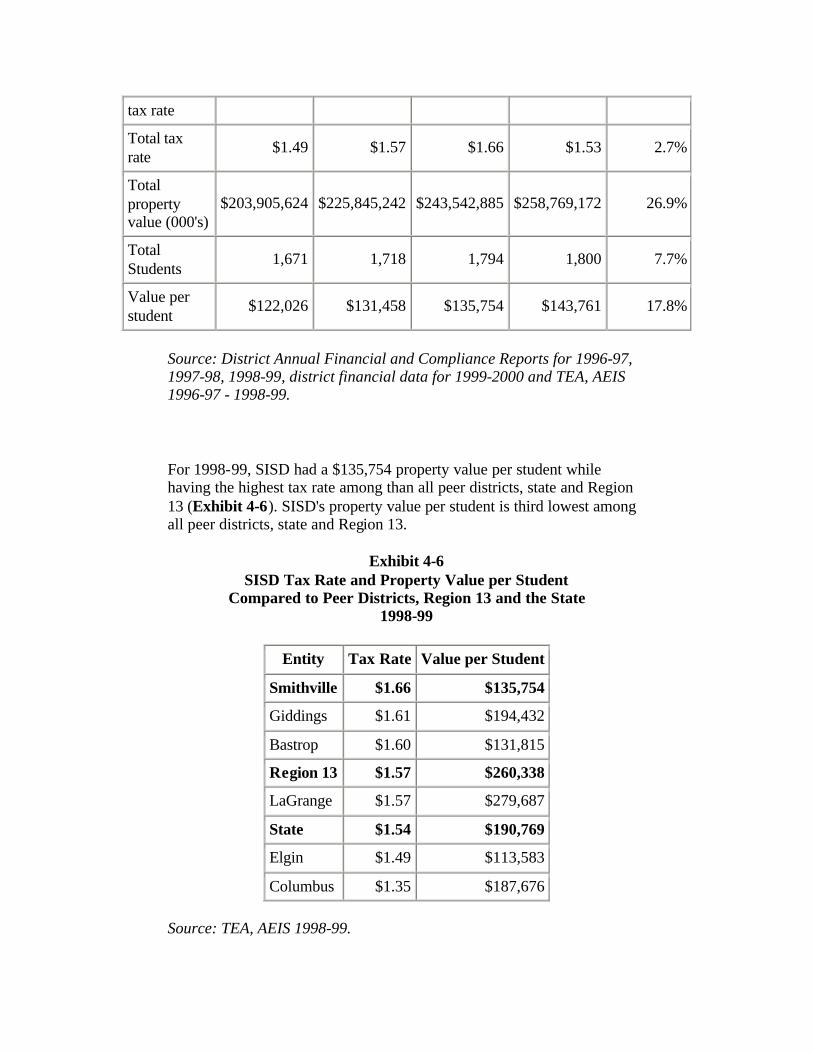
tax rate
Total tax rate
$1.49 $1.57 $1.66 $1.53 2.7%
Total property value (000's)
$203,905,624 $225,845,242 $243,542,885 $258,769,172 26.9%
Total Students
1,671 1,718 1,794 1,800 7.7%
Value per student
$122,026 $131,458 $135,754 $143,761 17.8%
Source: District Annual Financial and Compliance Reports for 1996-97, 1997-98, 1998-99, district financial data for 1999-2000 and TEA, AEIS 1996-97 - 1998-99.
For 1998-99, SISD had a $135,754 property value per student while having the highest tax rate among than all peer districts, state and Region 13 (Exhibit 4-6). SISD's property value per student is third lowest among all peer districts, state and Region 13.
Exhibit 4-6 SISD Tax Rate and Property Value per Student
Compared to Peer Districts, Region 13 and the State 1998-99
Entity Tax Rate Value per Student
Smithville $1.66 $135,754
Giddings $1.61 $194,432
Bastrop $1.60 $131,815
Region 13 $1.57 $260,338
LaGrange $1.57 $279,687
State $1.54 $190,769
Elgin $1.49 $113,583
Columbus $1.35 $187,676
Source: TEA, AEIS 1998-99.
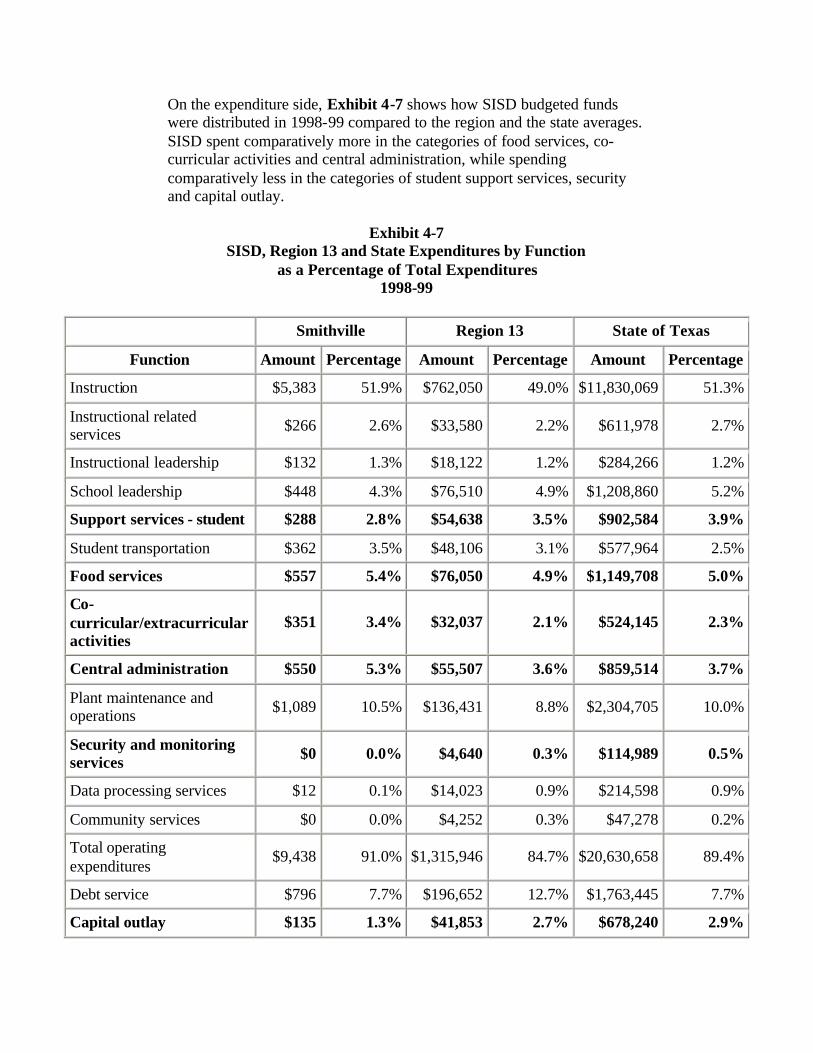
On the expenditure side, Exhibit 4-7 shows how SISD budgeted funds were distributed in 1998-99 compared to the region and the state averages. SISD spent comparatively more in the categories of food services, co-curricular activities and central administration, while spending comparatively less in the categories of student support services, security and capital outlay.
Exhibit 4-7 SISD, Region 13 and State Expenditures by Function
as a Percentage of Total Expenditures 1998-99
Smithville Region 13 State of Texas
Function Amount Percentage Amount Percentage Amount Percentage
Instruction $5,383 51.9% $762,050 49.0% $11,830,069 51.3%
Instructional related services $266 2.6% $33,580 2.2% $611,978 2.7%
Instructional leadership $132 1.3% $18,122 1.2% $284,266 1.2%
School leadership $448 4.3% $76,510 4.9% $1,208,860 5.2%
Support services - student $288 2.8% $54,638 3.5% $902,584 3.9%
Student transportation $362 3.5% $48,106 3.1% $577,964 2.5%
Food services $557 5.4% $76,050 4.9% $1,149,708 5.0%
Co-curricular/extracurricular activities
$351 3.4% $32,037 2.1% $524,145 2.3%
Central administration $550 5.3% $55,507 3.6% $859,514 3.7%
Plant maintenance and operations $1,089 10.5% $136,431 8.8% $2,304,705 10.0%
Security and monitoring services $0 0.0% $4,640 0.3% $114,989 0.5%
Data processing services $12 0.1% $14,023 0.9% $214,598 0.9%
Community services $0 0.0% $4,252 0.3% $47,278 0.2%
Total operating expenditures
$9,438 91.0% $1,315,946 84.7% $20,630,658 89.4%
Debt service $796 7.7% $196,652 12.7% $1,763,445 7.7%
Capital outlay $135 1.3% $41,853 2.7% $678,240 2.9%
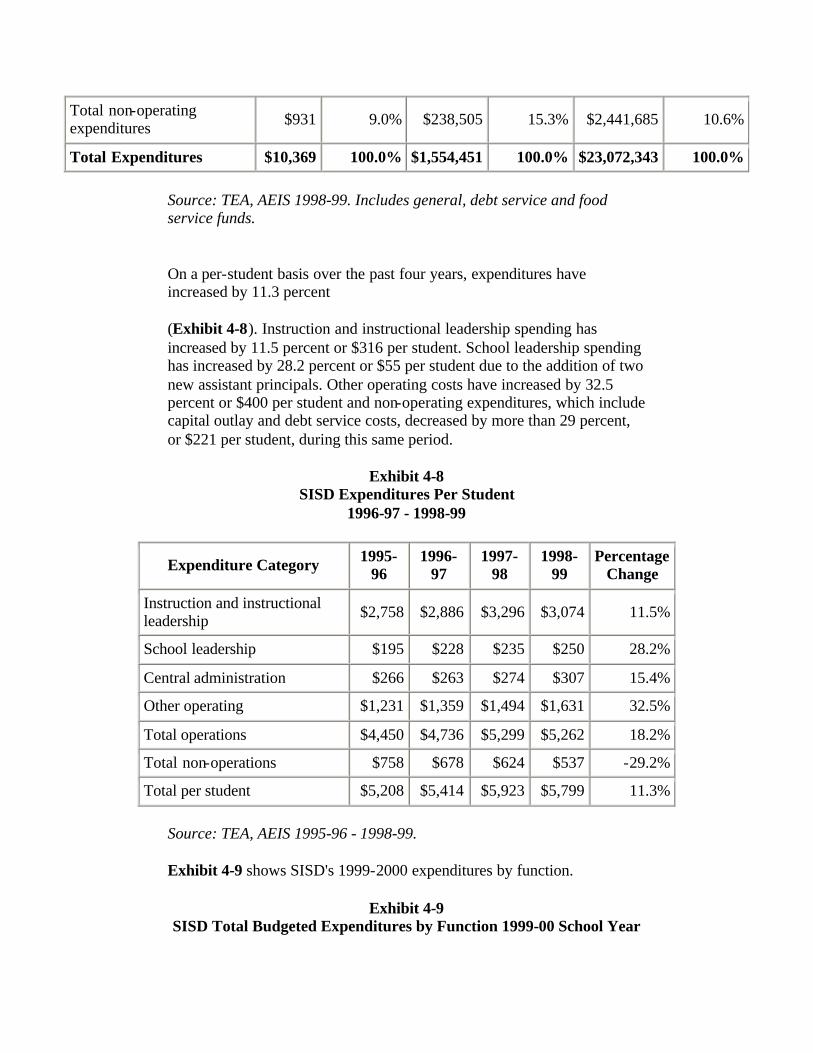
Total non-operating expenditures $931 9.0% $238,505 15.3% $2,441,685 10.6%
Total Expenditures $10,369 100.0% $1,554,451 100.0% $23,072,343 100.0%
Source: TEA, AEIS 1998-99. Includes general, debt service and food service funds.
On a per-student basis over the past four years, expenditures have increased by 11.3 percent
(Exhibit 4-8). Instruction and instructional leadership spending has increased by 11.5 percent or $316 per student. School leadership spending has increased by 28.2 percent or $55 per student due to the addition of two new assistant principals. Other operating costs have increased by 32.5 percent or $400 per student and non-operating expenditures, which include capital outlay and debt service costs, decreased by more than 29 percent, or $221 per student, during this same period.
Exhibit 4-8 SISD Expenditures Per Student
1996-97 - 1998-99
Expenditure Category 1995-96
1996-97
1997-98
1998-99
Percentage Change
Instruction and instructional leadership $2,758 $2,886 $3,296 $3,074 11.5%
School leadership $195 $228 $235 $250 28.2%
Central administration $266 $263 $274 $307 15.4%
Other operating $1,231 $1,359 $1,494 $1,631 32.5%
Total operations $4,450 $4,736 $5,299 $5,262 18.2%
Total non-operations $758 $678 $624 $537 -29.2%
Total per student $5,208 $5,414 $5,923 $5,799 11.3%
Source: TEA, AEIS 1995-96 - 1998-99.
Exhibit 4-9 shows SISD's 1999-2000 expenditures by function.
Exhibit 4-9 SISD Total Budgeted Expenditures by Function 1999-00 School Year

Function (Code) Smithville Percent of Total
Instruction (11,95) $6,169,794 51.6%
Instructional Related Services (12,13) $265,642 2.2%
Instructional Leadership (21) $143,578 1.2%
School Leadership (23) $514,521 4.3%
Support Services-Student (31,32,33) $307,423 2.6%
Student Transportation (34) $608,941 5.1%
Food Services (35) $616,653 5.2%
Cocurricular/Extracurricular Activities (36) $388,419 3.2%
Central Administration (41,92) $581,601 4.9%
Plant Maintenance and Operations (51) $1,268,963 10.6%
Security & Monitoring Services (52) $0 0.0%
Data Processing Services (53) $13,900 0.1%
Debt Service $883,947 7.4%
Capital Outlay $193,960 1.6%
Other* $0 0.0%
Total Budgeted Expenditures $11,957,342 100.0%
Source: PEIMS Data, TEA.
*Expenditure not listed above and non-operational expenditures such as community and parental involvement services.
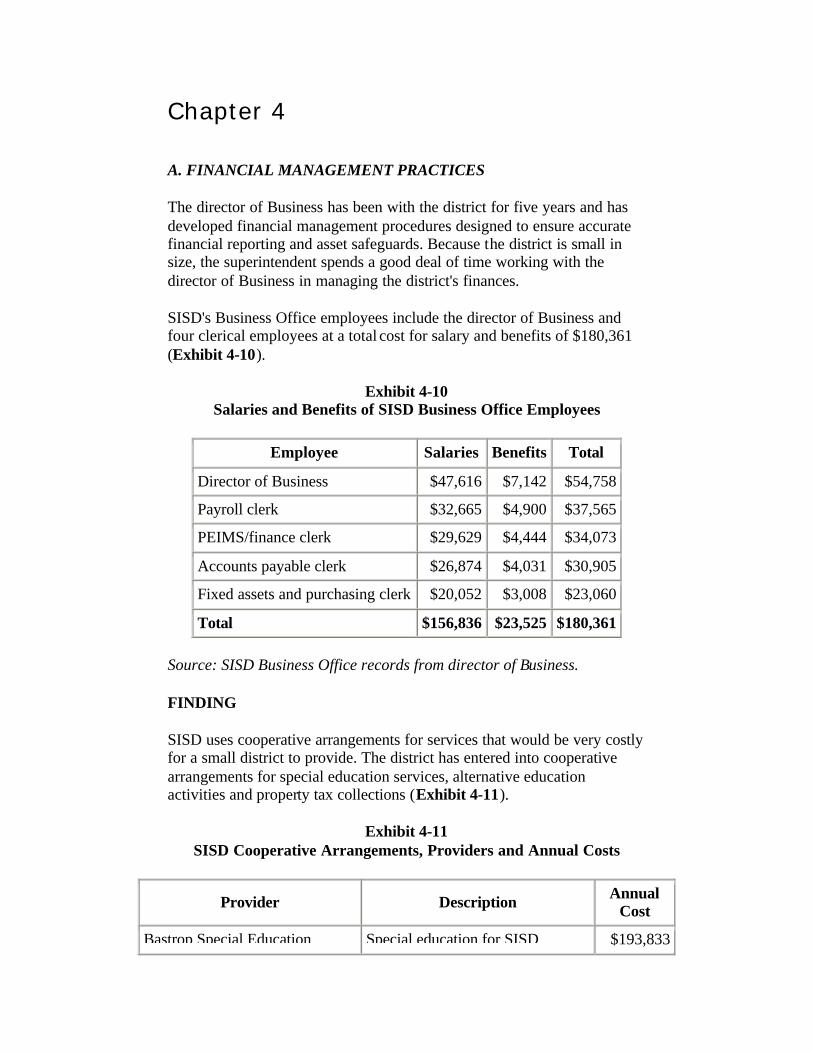
Chapter 4
A. FINANCIAL MANAGEMENT PRACTICES
The director of Business has been with the district for five years and has developed financial management procedures designed to ensure accurate financial reporting and asset safeguards. Because the district is small in size, the superintendent spends a good deal of time working with the director of Business in managing the district's finances.
SISD's Business Office employees include the director of Business and four clerical employees at a total cost for salary and benefits of $180,361 (Exhibit 4-10).
Exhibit 4-10 Salaries and Benefits of SISD Business Office Employees
Employee Salaries Benefits Total
Director of Business $47,616 $7,142 $54,758
Payroll clerk $32,665 $4,900 $37,565
PEIMS/finance clerk $29,629 $4,444 $34,073
Accounts payable clerk $26,874 $4,031 $30,905
Fixed assets and purchasing clerk $20,052 $3,008 $23,060
Total $156,836 $23,525 $180,361
Source: SISD Business Office records from director of Business.
FINDING
SISD uses cooperative arrangements for services that would be very costly for a small district to provide. The district has entered into cooperative arrangements for special education services, alternative education activities and property tax collections (Exhibit 4-11).
Exhibit 4-11 SISD Cooperative Arrangements, Providers and Annual Costs
Provider Description Annual Cost
Bastrop Special Education Special education for SISD $193,833
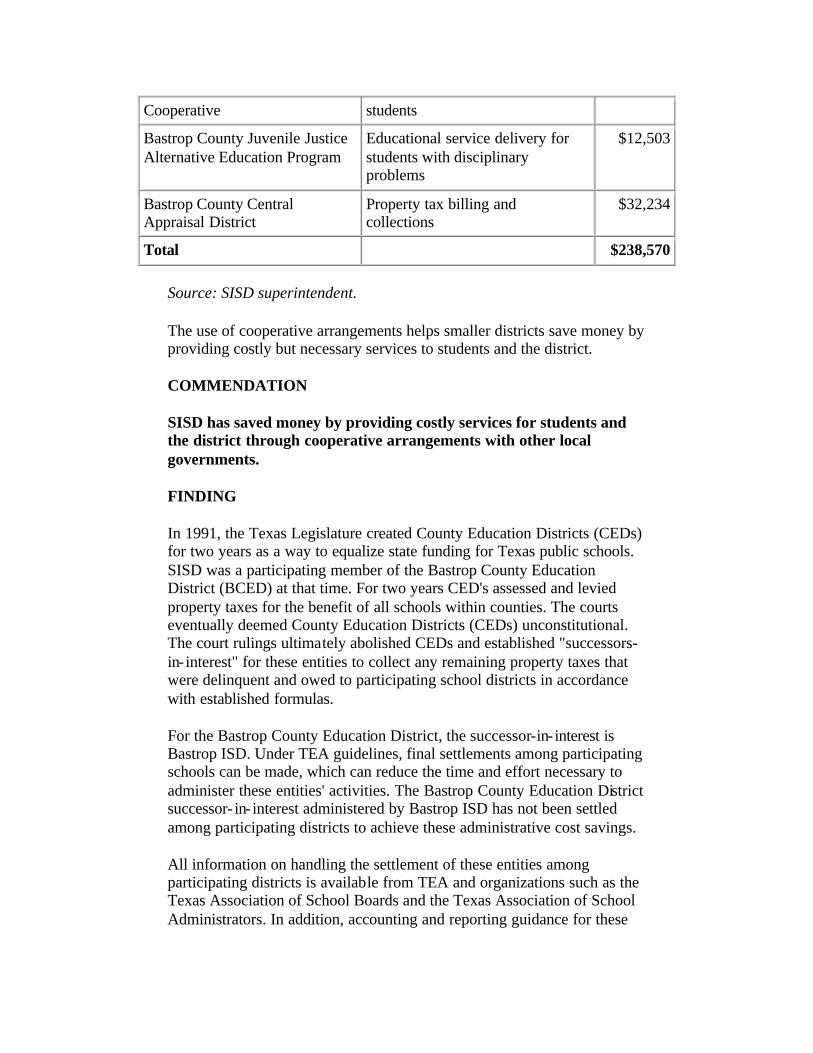
Cooperative students
Bastrop County Juvenile Justice Alternative Education Program
Educational service delivery for students with disciplinary problems
$12,503
Bastrop County Central Appraisal District
Property tax billing and collections
$32,234
Total $238,570
Source: SISD superintendent.
The use of cooperative arrangements helps smaller districts save money by providing costly but necessary services to students and the district.
COMMENDATION
SISD has saved money by providing costly services for students and the district through cooperative arrangements with other local governments.
FINDING
In 1991, the Texas Legislature created County Education Districts (CEDs) for two years as a way to equalize state funding for Texas public schools. SISD was a participating member of the Bastrop County Education District (BCED) at that time. For two years CED's assessed and levied property taxes for the benefit of all schools within counties. The courts eventually deemed County Education Districts (CEDs) unconstitutional. The court rulings ultimately abolished CEDs and established "successors-in- interest" for these entities to collect any remaining property taxes that were delinquent and owed to participating school districts in accordance with established formulas.
For the Bastrop County Education District, the successor-in- interest is Bastrop ISD. Under TEA guidelines, final settlements among participating schools can be made, which can reduce the time and effort necessary to administer these entities' activities. The Bastrop County Education District successor- in- interest administered by Bastrop ISD has not been settled among participating districts to achieve these administrative cost savings.
All information on handling the settlement of these entities among participating districts is available from TEA and organizations such as the Texas Association of School Boards and the Texas Association of School Administrators. In addition, accounting and reporting guidance for these
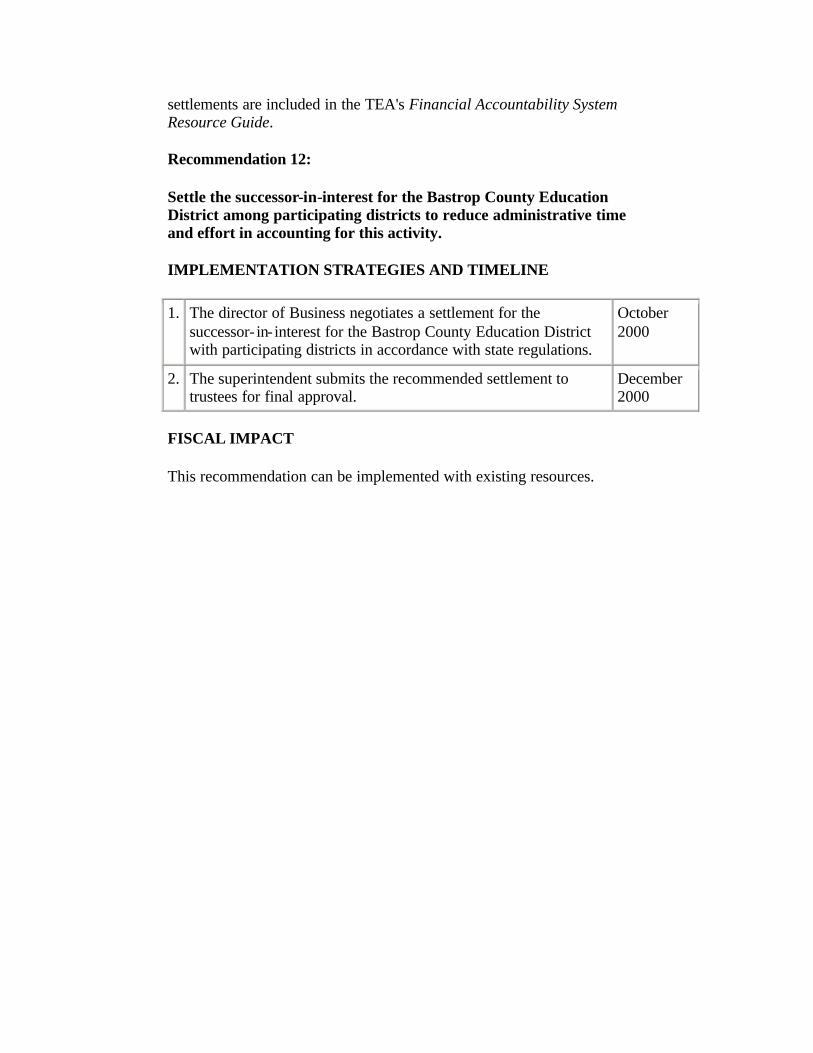
settlements are included in the TEA's Financial Accountability System Resource Guide.
Recommendation 12:
Settle the successor-in-interest for the Bastrop County Education District among participating districts to reduce administrative time and effort in accounting for this activity.
IMPLEMENTATION STRATEGIES AND TIMELINE
1. The director of Business negotiates a settlement for the successor- in- interest for the Bastrop County Education District with participating districts in accordance with state regulations.
October 2000
2. The superintendent submits the recommended settlement to trustees for final approval.
December 2000
FISCAL IMPACT
This recommendation can be implemented with existing resources.
Chapter 4
B. FINANCIAL REPORTING AND BUDGETING
Texas school districts must comply with financial reporting guidelines in the TEA's Financial Accountability System Resource Guide. The guide includes the accounting and financial reporting requirements of recognized, generally accepted accounting principles, federally mandated auditing and financial reporting requirements and specific TEA accounting and financial reporting requirements. A district's annual audited financial statements must include all necessary financial information and related disclosures as prescribed by the Financial Accountability System Resource Guide.
The link between planning and budget preparation makes school district budgets unique. Budgets in the public arena are often considered the ultimate policy document because they are the financial plan a school district uses to achieve its goals and objectives reflecting:
• Public choices about what goods and services the district will and will not produce;
• School districts' priorities among the wide range of activities in which they are involved;
• Relative weight given to the influence of various participants and interest groups in the budget development process; and
• Methods a school district uses to acquire and use its resources.
The budget itself, then, becomes a political document representing a school district administrator's accountability to the community.
The state, TEA and local districts formulate legal requirements for school district budgets. State and federal grants also may impose additional legal requirements; however, this report does not address them.
The responsibility for the preparation of district budget guidelines and the budget calendar rests primarily with district administrators and the superintendent. Because these guidelines and the calendar create a framework for the entire budget development process, their careful design is critical to an efficient and effective process.
The budget calendar lists critical dates for the preparation, submission and review of campus budgets for the school district, and it is prepared at the district level during the budget planning process. A variety of simple techniques can be used to build the district calendar. The simplest is to modify the previous year's calendar. Timing problems from the previous
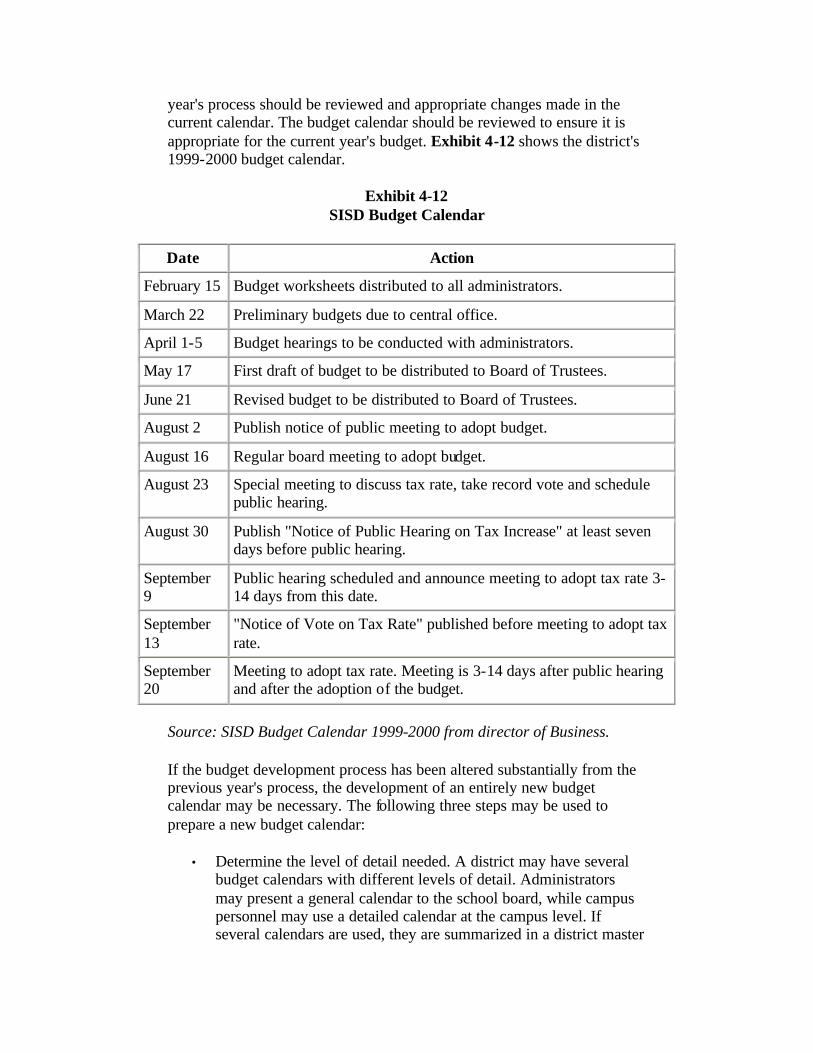
year's process should be reviewed and appropriate changes made in the current calendar. The budget calendar should be reviewed to ensure it is appropriate for the current year's budget. Exhibit 4-12 shows the district's 1999-2000 budget calendar.
Exhibit 4-12 SISD Budget Calendar
Date Action
February 15 Budget worksheets distributed to all administrators.
March 22 Preliminary budgets due to central office.
April 1-5 Budget hearings to be conducted with administrators.
May 17 First draft of budget to be distributed to Board of Trustees.
June 21 Revised budget to be distributed to Board of Trustees.
August 2 Publish notice of public meeting to adopt budget.
August 16 Regular board meeting to adopt budget.
August 23 Special meeting to discuss tax rate, take record vote and schedule public hearing.
August 30 Publish "Notice of Public Hearing on Tax Increase" at least seven days before public hearing.
September 9
Public hearing scheduled and announce meeting to adopt tax rate 3-14 days from this date.
September 13
"Notice of Vote on Tax Rate" published before meeting to adopt tax rate.
September 20
Meeting to adopt tax rate. Meeting is 3-14 days after public hearing and after the adoption of the budget.
Source: SISD Budget Calendar 1999-2000 from director of Business.
If the budget development process has been altered substantially from the previous year's process, the development of an entirely new budget calendar may be necessary. The following three steps may be used to prepare a new budget calendar:
• Determine the level of detail needed. A district may have several budget calendars with different levels of detail. Administrators may present a general calendar to the school board, while campus personnel may use a detailed calendar at the campus level. If several calendars are used, they are summarized in a district master
calendar to ensure that all activities and dates are consistent and compatible;
• Identify all activities that must be included in the calendar, and arrange them in chronological order; and
• Assign completion dates to each activity on the calendar. Completion dates are assigned working backward through the activities from August 20, the legally mandated date for presentation of the preliminary school district budget to the school board. Dates are also assigned to ensure sufficient time is allowed for completion of each activity on the calendar. Some school districts may assign only completion dates for each activity and allow budget actors/groups to determine when an activity begins. Other school districts assign suggested or mandatory start dates for activities to ensure their timely completion.
FINDING
SISD contracts with Region 13 for financial software technical support and for submitting data to TEA for its Public Education Information Management system (PEIMS). The district pays $8,190 annually for this service. The major activities covered under this contract include:
• Implementation assistance with the new RSCCC financial software;
• Assistance with PEIMS processes and submissions; and • Technical support for the RSCCC payroll module.
COMMENDATION
SISD has begun to automate its financial records through an outsourcing arrangement to ensure accuracy and ongoing efficiency in its financial operations.
FINDING
The district provides budget information to the public each month and budget reports are included in the monthly board meeting packets. The information in the board packets include variances from the amounts budgeted. Business Office personnel routinely answer detailed questions concerning budget questions at the monthly board meeting.
The district's RSCCC financial system provides budget information, and the director of Business uses the information to prepare reports using an electronic spreadsheet program. SISD maintains the financial accounting structure of the RSCCC system in accordance with the TEA's Financial Accountability System Resource Guide. The system includes the necessary
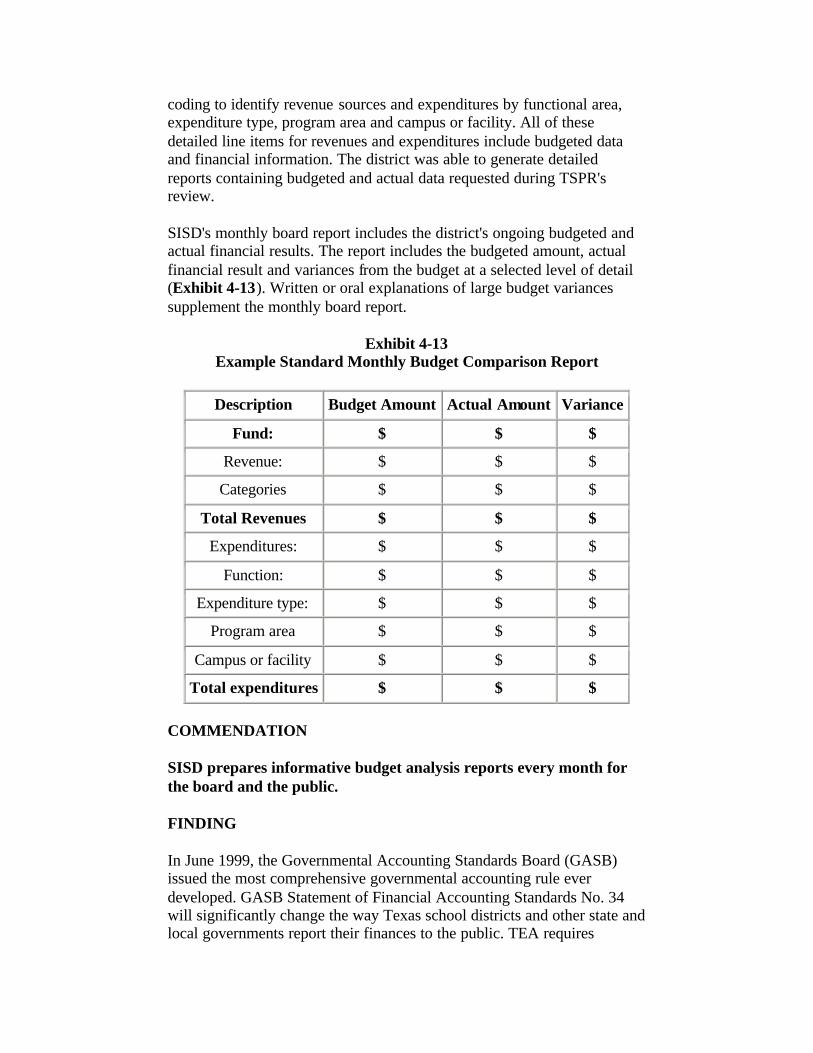
coding to identify revenue sources and expenditures by functional area, expenditure type, program area and campus or facility. All of these detailed line items for revenues and expenditures include budgeted data and financial information. The district was able to generate detailed reports containing budgeted and actual data requested during TSPR's review.
SISD's monthly board report includes the district's ongoing budgeted and actual financial results. The report includes the budgeted amount, actual financial result and variances from the budget at a selected level of detail (Exhibit 4-13). Written or oral explanations of large budget variances supplement the monthly board report.
Exhibit 4-13 Example Standard Monthly Budget Comparison Report
Description Budget Amount Actual Amount Variance
Fund: $ $ $
Revenue: $ $ $
Categories $ $ $
Total Revenues $ $ $
Expenditures: $ $ $
Function: $ $ $
Expenditure type: $ $ $
Program area $ $ $
Campus or facility $ $ $
Total expenditures $ $ $
COMMENDATION
SISD prepares informative budget analysis reports every month for the board and the public.
FINDING
In June 1999, the Governmental Accounting Standards Board (GASB) issued the most comprehensive governmental accounting rule ever developed. GASB Statement of Financial Accounting Standards No. 34 will significantly change the way Texas school districts and other state and local governments report their finances to the public. TEA requires

implementation of the new standard in the 2001-02 year. Under the new rule, anyone with an interest in school finance-citizens, the media, bond raters, creditors, legislators and others-will have more and easier-to-understand information about the school in question. For the first time, school financial reports will have information about the full cost of providing services to students and the public. An additional feature of financial reports presented under the new standard is management's narrative analysis of the school's financial performance. The new financial reporting system will give citizens a clearer picture of what a school district is doing with the taxes it collects. This includes whether current revenues are paying for current services, or if the services are the responsibility of the next generation of taxpayers. Other significant features of the new standard include calculating and recording depreciation for school facilities and equipment and disclosing the extent of net costs for all school programs that tax revenues and basic state revenues actually fund.
Currently, school financial reports focus on the funds of government, which are intended to provide some information about various activities or sources of revenue. The number of these funds can run anywhere from two to 200 or more, making it difficult at times to pull the information together and make sense out of it. Financial reports prepared under the new system will improve information provided for major funds and provide financial information from a schoolwide perspective, which is an entirely new concept. The new reporting system will affect a broad spectrum of the public. Reports prepared under the new standard will help to determine whether the school district's financial health is improving or deteriorating. The reports will provide vital information to a company planning to relocate to a particular county or region of the state. Reports prepared under the new standard will help trustees better understand the long- and short-term implications of policy decisions. Investors will better understand the financial health of school districts participating in the financial markets. The new standard will help taxpayers better assess the fiscal soundness of district management's actions.
According to SISD's director of Business, the Business Office has started an implementation strategy for GASB 34. As part of the implementation plan, the director has attended several training classes and has modified the district's fixed asset capitalization policy upward to $5,000. The increase in fixed asset capitalization levels will make required depreciation calculations less burdensome on staff.
Recommendation 13:
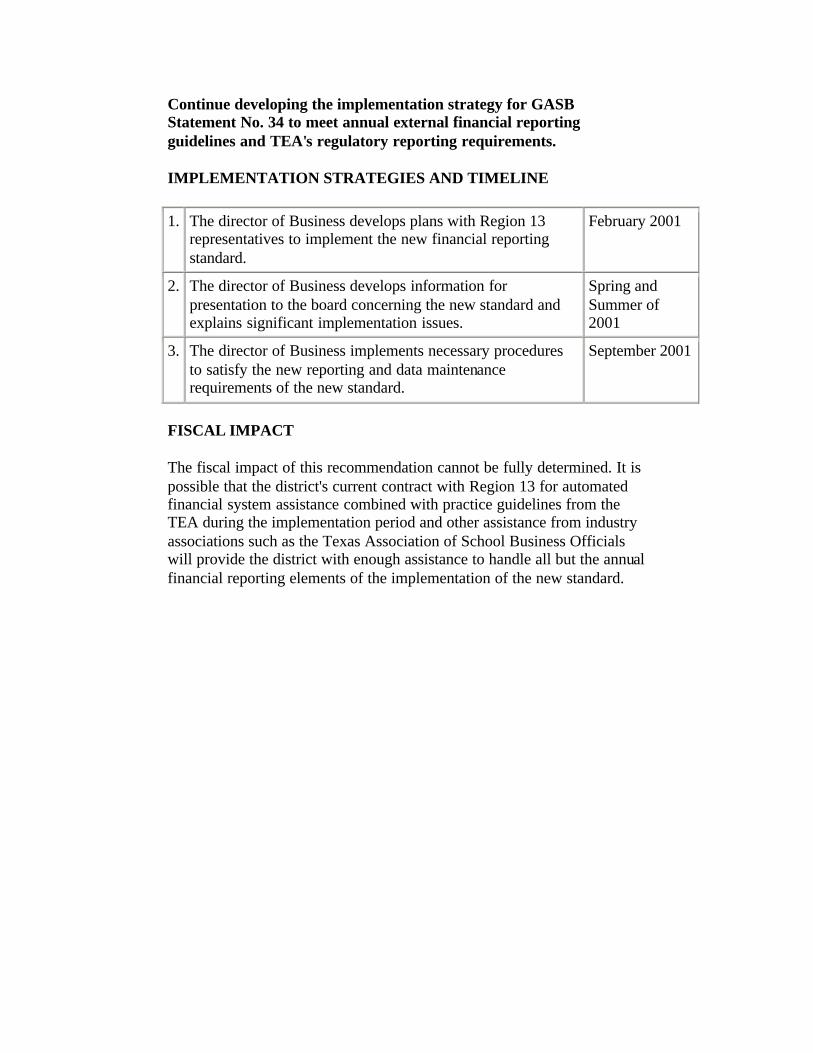
Continue developing the implementation strategy for GASB Statement No. 34 to meet annual external financial reporting guidelines and TEA's regulatory reporting requirements.
IMPLEMENTATION STRATEGIES AND TIMELINE
1. The director of Business develops plans with Region 13 representatives to implement the new financial reporting standard.
February 2001
2. The director of Business develops information for presentation to the board concerning the new standard and explains significant implementation issues.
Spring and Summer of 2001
3. The director of Business implements necessary procedures to satisfy the new reporting and data maintenance requirements of the new standard.
September 2001
FISCAL IMPACT
The fiscal impact of this recommendation cannot be fully determined. It is possible that the district's current contract with Region 13 for automated financial system assistance combined with practice guidelines from the TEA during the implementation period and other assistance from industry associations such as the Texas Association of School Business Officials will provide the district with enough assistance to handle all but the annual financial reporting elements of the implementation of the new standard.
Chapter 4
C. PURCHASING AND CONTRACT MANAGEMENT
The goal of a school district purchasing department is to purchase the best products, materials and services at the lowest practical prices within relevant statutes and policies.
An effective purchasing system requires several essential components. One of the most important is a good organization staffed with well-trained people. Roles and related responsibilities must be clearly defined and adapted to meet the unique operating environment of the district. Although purchasing organization structures may vary, most provide similar functions. An administrative role in purchasing typically:
• Approves purchase orders and service contracts, including competitive procurement specifications and tabulations;
• Assists in the development and modification of purchasing policies and procedures and is responsible for their implementation;
• Resolves purchasing problems; • Establishes and monitors good working relations with vendors; • Provides communication with vendors and approves vendor
communication with schools and departments; • Ensures that district staff is aware of relevant purchasing statutes,
regulations and board policies through formal or informal training programs; and
• Stays current on purchasing statutes, regulations and practices by attending various purchasing-related courses, seminars or workshops, and by reading current purchasing periodicals and books.
The purchasing administrator or an assistant typically prepares competitive procurement specifications, evaluates competitive procurement tabulations, maintains a vendor list, supervises the processing of purchase orders and evaluates the performance of vendors. Buyers and clerical staff typically write, review and modify specifications for competitive procurements, assist in the evaluation of competitive procurements, identify sources to obtain competitive prices and terms, assist in maintaining an updated vendor list from which purchases can be made and obtain and verify vendor price quotes.
A district must strive to maximize purchasing efficiency. As recommended by TEA, purchasing needs to be centralized within the district for maximum efficiency. Centralized and decentralized purchasing
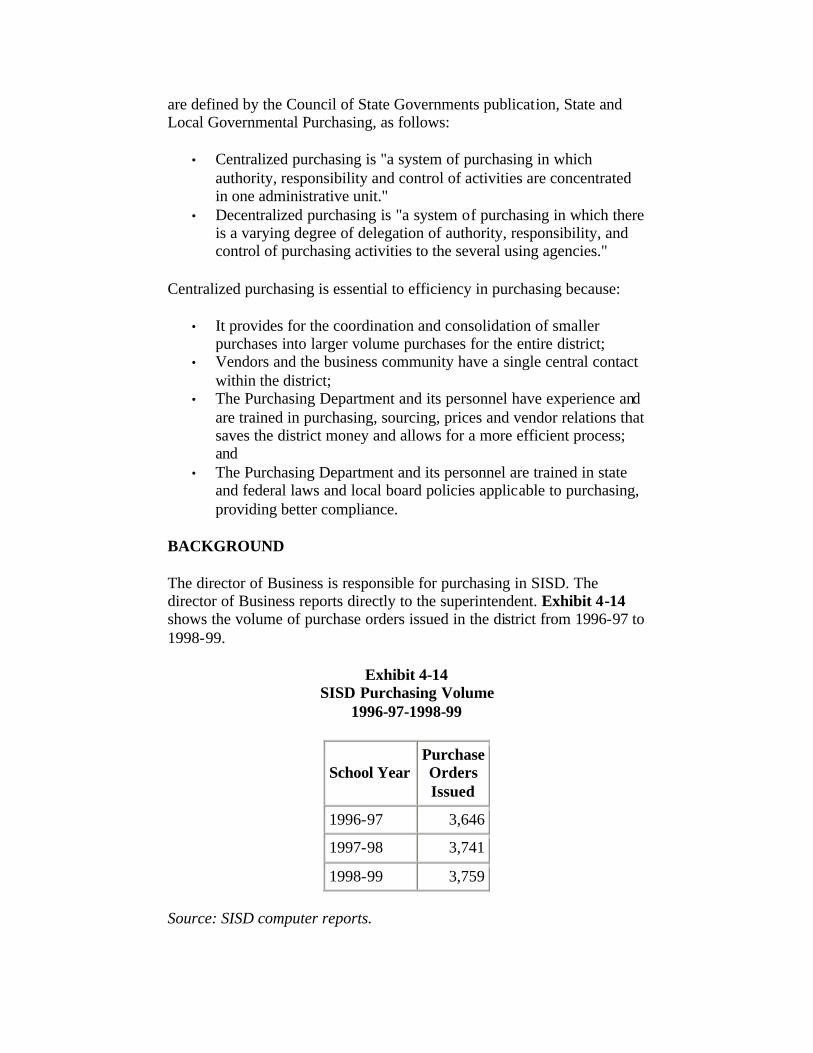
are defined by the Council of State Governments publication, State and Local Governmental Purchasing, as follows:
• Centralized purchasing is "a system of purchasing in which authority, responsibility and control of activities are concentrated in one administrative unit."
• Decentralized purchasing is "a system of purchasing in which there is a varying degree of delegation of authority, responsibility, and control of purchasing activities to the several using agencies."
Centralized purchasing is essential to efficiency in purchasing because:
• It provides for the coordination and consolidation of smaller purchases into larger volume purchases for the entire district;
• Vendors and the business community have a single central contact within the district;
• The Purchasing Department and its personnel have experience and are trained in purchasing, sourcing, prices and vendor relations that saves the district money and allows for a more efficient process; and
• The Purchasing Department and its personnel are trained in state and federal laws and local board policies applicable to purchasing, providing better compliance.
BACKGROUND
The director of Business is responsible for purchasing in SISD. The director of Business reports directly to the superintendent. Exhibit 4-14 shows the volume of purchase orders issued in the district from 1996-97 to 1998-99.
Exhibit 4-14 SISD Purchasing Volume
1996-97-1998-99
School Year Purchase Orders Issued
1996-97 3,646
1997-98 3,741
1998-99 3,759
Source: SISD computer reports.
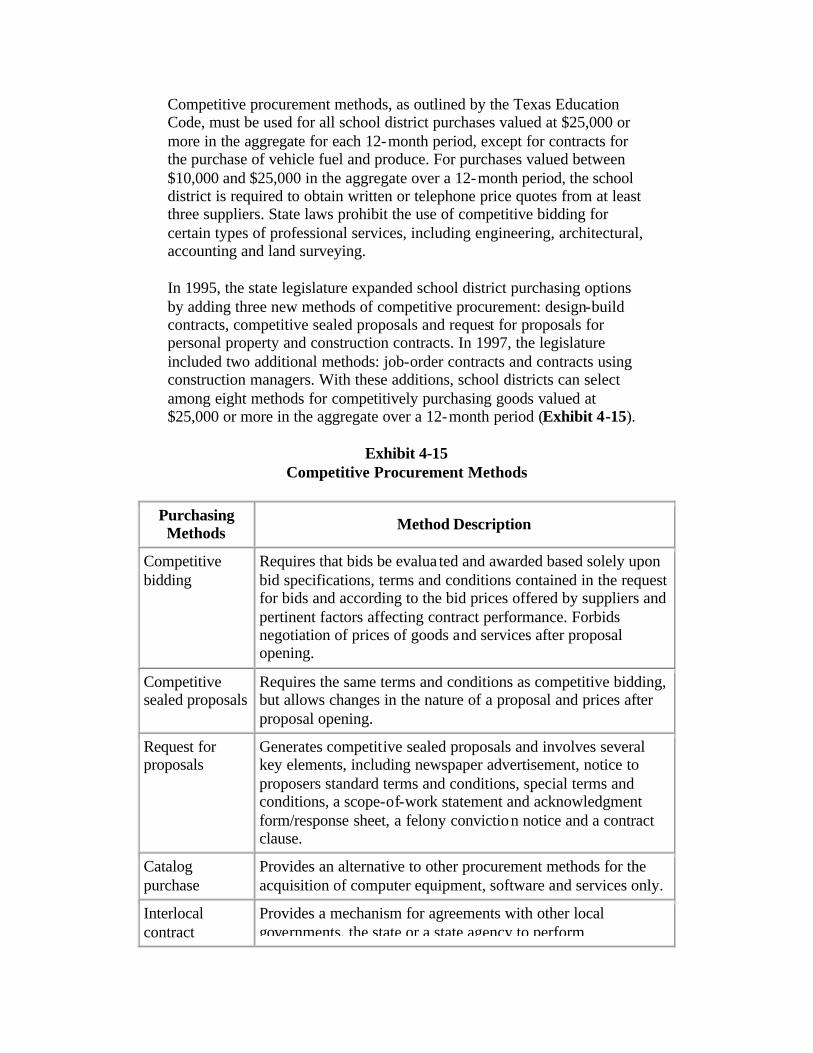
Competitive procurement methods, as outlined by the Texas Education Code, must be used for all school district purchases valued at $25,000 or more in the aggregate for each 12-month period, except for contracts for the purchase of vehicle fuel and produce. For purchases valued between $10,000 and $25,000 in the aggregate over a 12-month period, the school district is required to obtain written or telephone price quotes from at least three suppliers. State laws prohibit the use of competitive bidding for certain types of professional services, including engineering, architectural, accounting and land surveying.
In 1995, the state legislature expanded school district purchasing options by adding three new methods of competitive procurement: design-build contracts, competitive sealed proposals and request for proposals for personal property and construction contracts. In 1997, the legislature included two additional methods: job-order contracts and contracts using construction managers. With these additions, school districts can select among eight methods for competitively purchasing goods valued at $25,000 or more in the aggregate over a 12-month period (Exhibit 4-15).
Exhibit 4-15 Competitive Procurement Methods
Purchasing Methods Method Description
Competitive bidding
Requires that bids be evalua ted and awarded based solely upon bid specifications, terms and conditions contained in the request for bids and according to the bid prices offered by suppliers and pertinent factors affecting contract performance. Forbids negotiation of prices of goods and services after proposal opening.
Competitive sealed proposals
Requires the same terms and conditions as competitive bidding, but allows changes in the nature of a proposal and prices after proposal opening.
Request for proposals
Generates competitive sealed proposals and involves several key elements, including newspaper advertisement, notice to proposers standard terms and conditions, special terms and conditions, a scope-of-work statement and acknowledgment form/response sheet, a felony conviction notice and a contract clause.
Catalog purchase
Provides an alternative to other procurement methods for the acquisition of computer equipment, software and services only.
Interlocal contract
Provides a mechanism for agreements with other local governments, the state or a state agency to perform
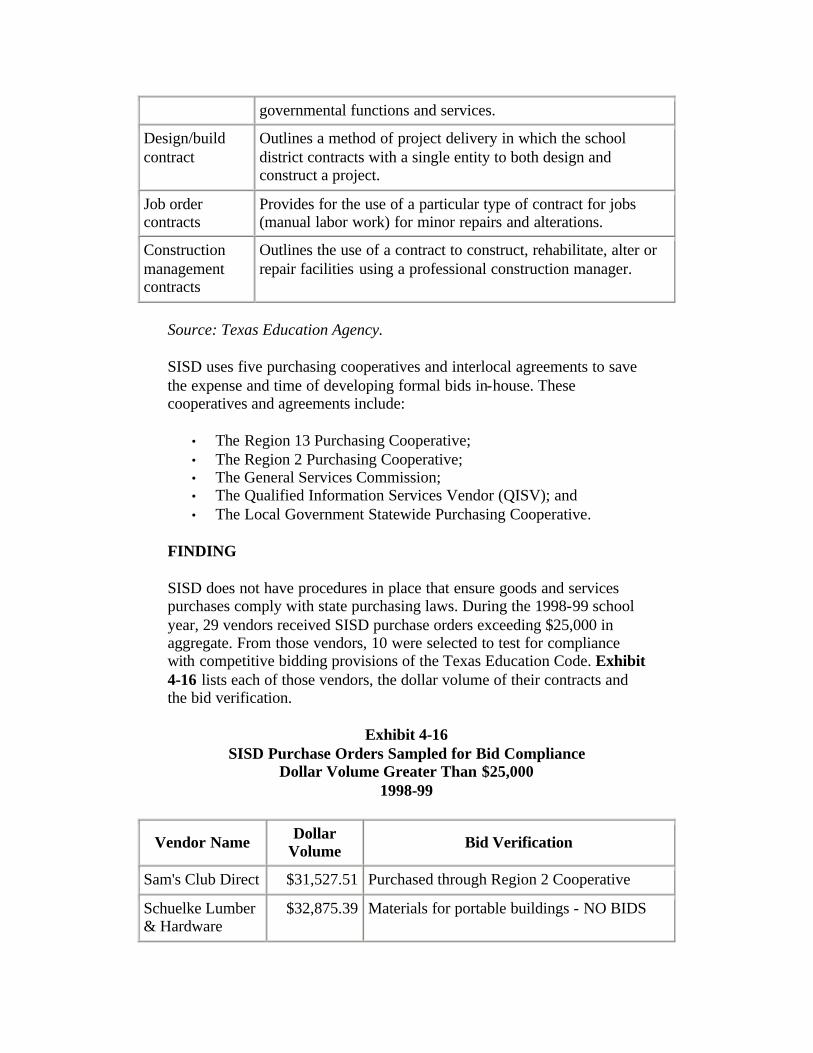
governmental functions and services.
Design/build contract
Outlines a method of project delivery in which the school district contracts with a single entity to both design and construct a project.
Job order contracts
Provides for the use of a particular type of contract for jobs (manual labor work) for minor repairs and alterations.
Construction management contracts
Outlines the use of a contract to construct, rehabilitate, alter or repair facilities using a professional construction manager.
Source: Texas Education Agency.
SISD uses five purchasing cooperatives and interlocal agreements to save the expense and time of developing formal bids in-house. These cooperatives and agreements include:
• The Region 13 Purchasing Cooperative; • The Region 2 Purchasing Cooperative; • The General Services Commission; • The Qualified Information Services Vendor (QISV); and • The Local Government Statewide Purchasing Cooperative.
FINDING
SISD does not have procedures in place that ensure goods and services purchases comply with state purchasing laws. During the 1998-99 school year, 29 vendors received SISD purchase orders exceeding $25,000 in aggregate. From those vendors, 10 were selected to test for compliance with competitive bidding provisions of the Texas Education Code. Exhibit 4-16 lists each of those vendors, the dollar volume of their contracts and the bid verification.
Exhibit 4-16 SISD Purchase Orders Sampled for Bid Compliance
Dollar Volume Greater Than $25,000 1998-99
Vendor Name Dollar Volume Bid Verification
Sam's Club Direct $31,527.51 Purchased through Region 2 Cooperative
Schuelke Lumber & Hardware
$32,875.39 Materials for portable buildings - NO BIDS
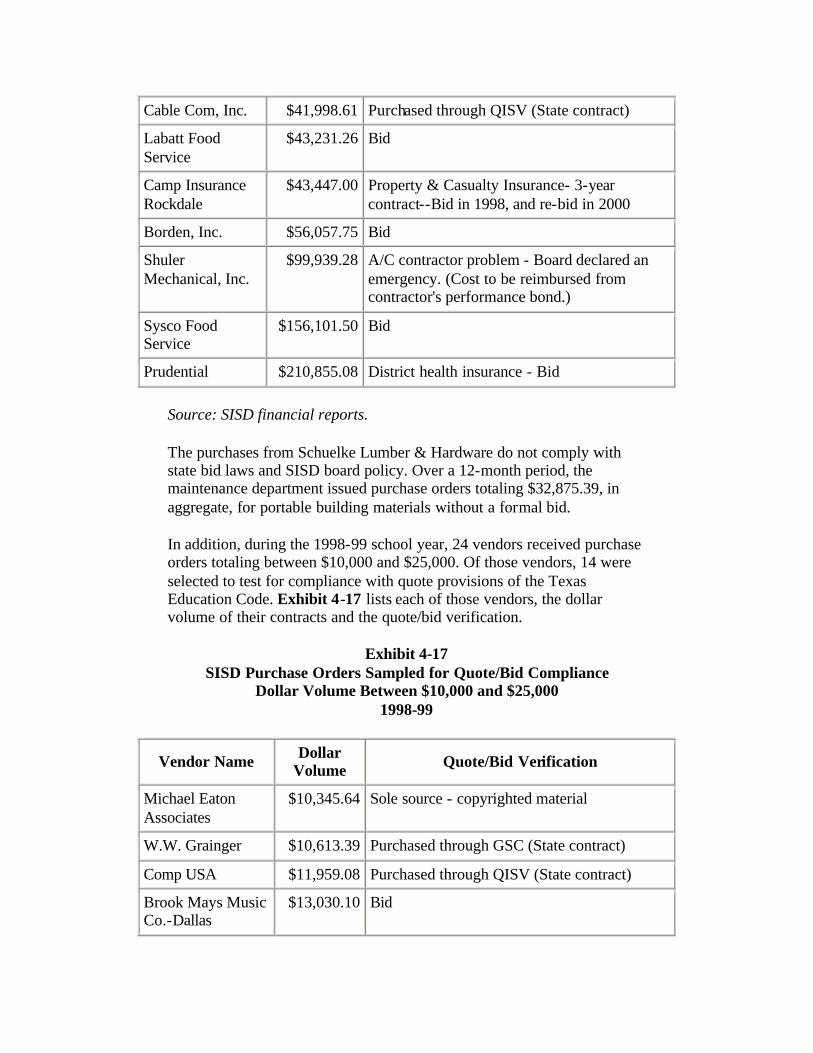
Cable Com, Inc. $41,998.61 Purchased through QISV (State contract)
Labatt Food Service
$43,231.26 Bid
Camp Insurance Rockdale
$43,447.00 Property & Casualty Insurance- 3-year contract--Bid in 1998, and re-bid in 2000
Borden, Inc. $56,057.75 Bid
Shuler Mechanical, Inc.
$99,939.28 A/C contractor problem - Board declared an emergency. (Cost to be reimbursed from contractor's performance bond.)
Sysco Food Service
$156,101.50 Bid
Prudential $210,855.08 District health insurance - Bid
Source: SISD financial reports.
The purchases from Schuelke Lumber & Hardware do not comply with state bid laws and SISD board policy. Over a 12-month period, the maintenance department issued purchase orders totaling $32,875.39, in aggregate, for portable building materials without a formal bid.
In addition, during the 1998-99 school year, 24 vendors received purchase orders totaling between $10,000 and $25,000. Of those vendors, 14 were selected to test for compliance with quote provisions of the Texas Education Code. Exhibit 4-17 lists each of those vendors, the dollar volume of their contracts and the quote/bid verification.
Exhibit 4-17 SISD Purchase Orders Sampled for Quote/Bid Compliance
Dollar Volume Between $10,000 and $25,000 1998-99
Vendor Name Dollar Volume Quote/Bid Verification
Michael Eaton Associates
$10,345.64 Sole source - copyrighted material
W.W. Grainger $10,613.39 Purchased through GSC (State contract)
Comp USA $11,959.08 Purchased through QISV (State contract)
Brook Mays Music Co.-Dallas
$13,030.10 Bid
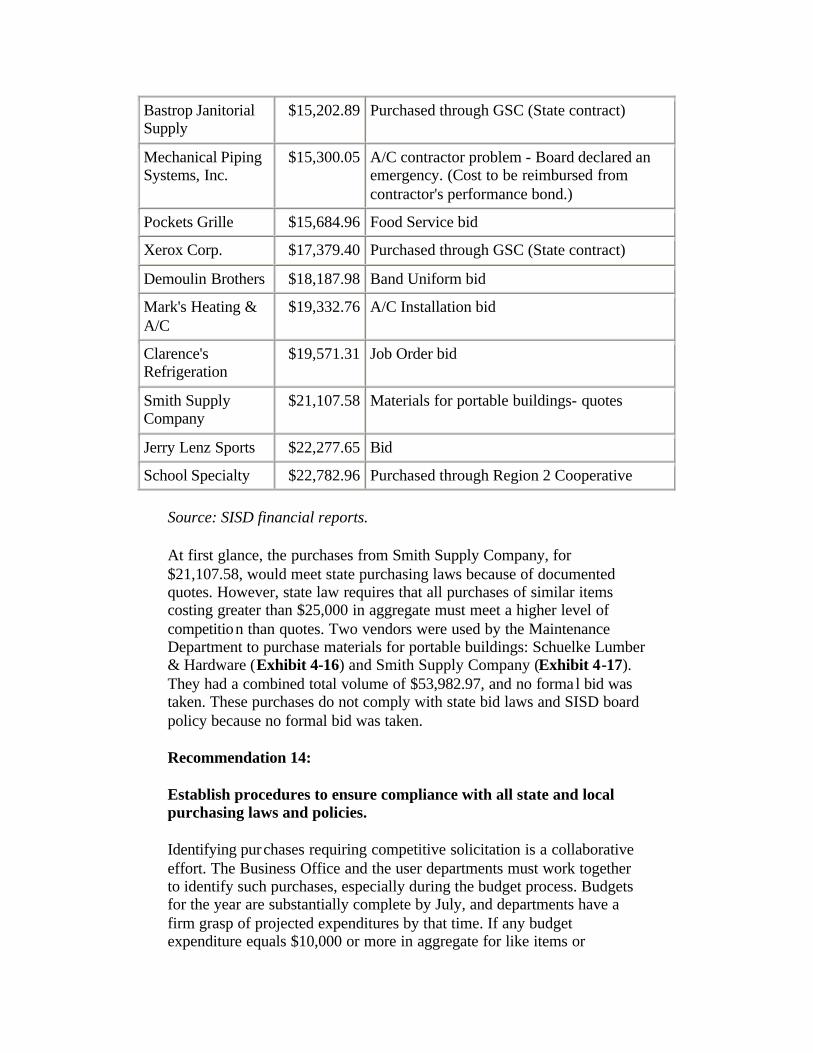
Bastrop Janitorial Supply
$15,202.89 Purchased through GSC (State contract)
Mechanical Piping Systems, Inc.
$15,300.05 A/C contractor problem - Board declared an emergency. (Cost to be reimbursed from contractor's performance bond.)
Pockets Grille $15,684.96 Food Service bid
Xerox Corp. $17,379.40 Purchased through GSC (State contract)
Demoulin Brothers $18,187.98 Band Uniform bid
Mark's Heating & A/C
$19,332.76 A/C Installation bid
Clarence's Refrigeration
$19,571.31 Job Order bid
Smith Supply Company
$21,107.58 Materials for portable buildings- quotes
Jerry Lenz Sports $22,277.65 Bid
School Specialty $22,782.96 Purchased through Region 2 Cooperative
Source: SISD financial reports.
At first glance, the purchases from Smith Supply Company, for $21,107.58, would meet state purchasing laws because of documented quotes. However, state law requires that all purchases of similar items costing greater than $25,000 in aggregate must meet a higher level of competition than quotes. Two vendors were used by the Maintenance Department to purchase materials for portable buildings: Schuelke Lumber & Hardware (Exhibit 4-16) and Smith Supply Company (Exhibit 4-17). They had a combined total volume of $53,982.97, and no formal bid was taken. These purchases do not comply with state bid laws and SISD board policy because no formal bid was taken.
Recommendation 14:
Establish procedures to ensure compliance with all state and local purchasing laws and policies.
Identifying purchases requiring competitive solicitation is a collaborative effort. The Business Office and the user departments must work together to identify such purchases, especially during the budget process. Budgets for the year are substantially complete by July, and departments have a firm grasp of projected expenditures by that time. If any budget expenditure equals $10,000 or more in aggregate for like items or
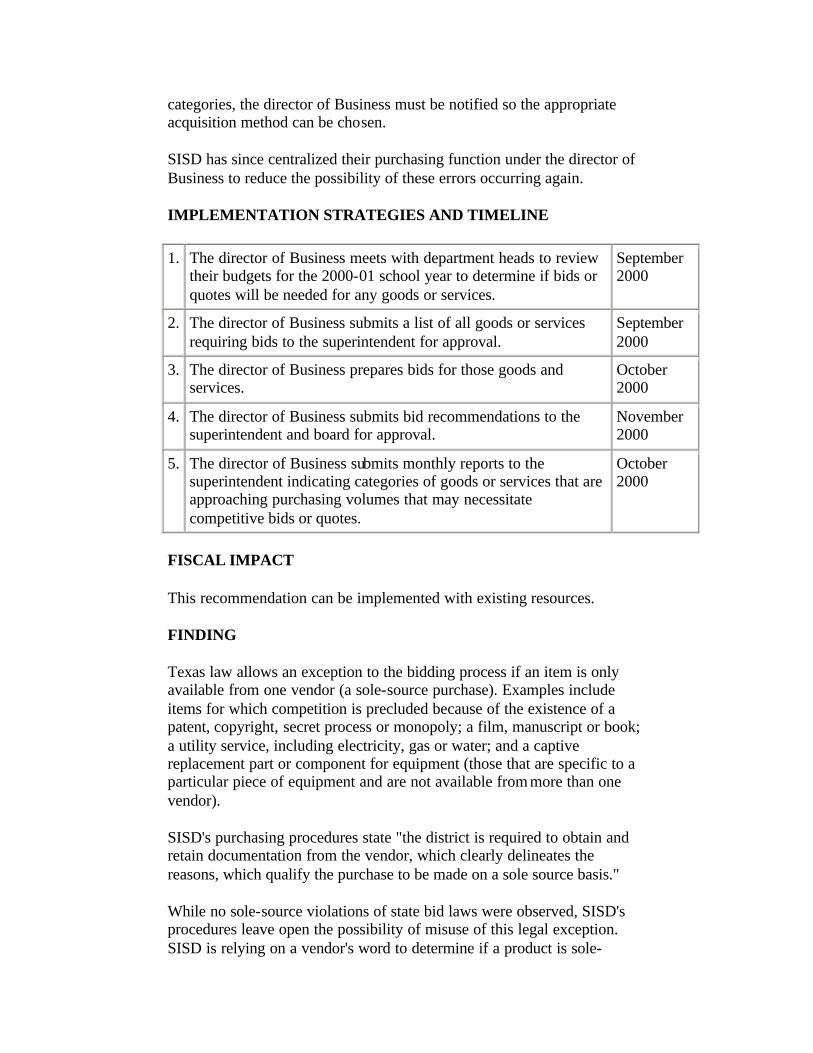
categories, the director of Business must be notified so the appropriate acquisition method can be chosen.
SISD has since centralized their purchasing function under the director of Business to reduce the possibility of these errors occurring again.
IMPLEMENTATION STRATEGIES AND TIMELINE
1. The director of Business meets with department heads to review their budgets for the 2000-01 school year to determine if bids or quotes will be needed for any goods or services.
September 2000
2. The director of Business submits a list of all goods or services requiring bids to the superintendent for approval.
September 2000
3. The director of Business prepares bids for those goods and services.
October 2000
4. The director of Business submits bid recommendations to the superintendent and board for approval.
November 2000
5. The director of Business submits monthly reports to the superintendent indicating categories of goods or services that are approaching purchasing volumes that may necessitate competitive bids or quotes.
October 2000
FISCAL IMPACT
This recommendation can be implemented with existing resources.
FINDING
Texas law allows an exception to the bidding process if an item is only available from one vendor (a sole-source purchase). Examples include items for which competition is precluded because of the existence of a patent, copyright, secret process or monopoly; a film, manuscript or book; a utility service, including electricity, gas or water; and a captive replacement part or component for equipment (those that are specific to a particular piece of equipment and are not available from more than one vendor).
SISD's purchasing procedures state "the district is required to obtain and retain documentation from the vendor, which clearly delineates the reasons, which qualify the purchase to be made on a sole source basis."
While no sole-source violations of state bid laws were observed, SISD's procedures leave open the possibility of misuse of this legal exception. SISD is relying on a vendor's word to determine if a product is sole-

source. For example, a vendor could say that his brand of weight equipment is sole-source because it is only available from one supplier in North America, and that the weights have a unique patented rubber coating on them. Under SISD procedures, that item could be purchased using the sole-source provision.
However, TEA's Financial Accountability System Resource Guide (FASRG) states:
"In order to be a bona-fide exemption to the Texas Education Code purchasing law requirements, there must be no other like items available for purchase that would serve the same purpose or function, and only one price for the product because of exclusive distribution or marketing rights. The fact that a particular item is covered by a patent or copyright is but one factor in determining if the purchase falls under the sole-source exemption."
In the example of the weight equipment, many vendors can provide weight equipment that can provide the same functionality as the rubber-coated weights. Therefore, this type of weight equipment would not meet the requirements of the sole-source provision, as defined in FASRG.
Recommendation 15:
Revise SISD purchasing procedures to include a definition of sole-source purchases that matches the definition found in TEA's Financial Accountability System Resource Guide.
IMPLEMENTATION STRATEGIES AND TIMELINE
1. The director of Business redefines sole-source in the purchasing procedures.
September 2000
2. The director of Business communicates the procedural change to SISD users.
September 2000
3. The director of Business trains the users on the new sole source procedures.
October 2000
FISCAL IMPACT
This recommendation can be implemented with existing resources.
FINDING
Like all other districts in Bastrop County, SISD uses a number of alternatives to locally bidding goods and services. The most popular
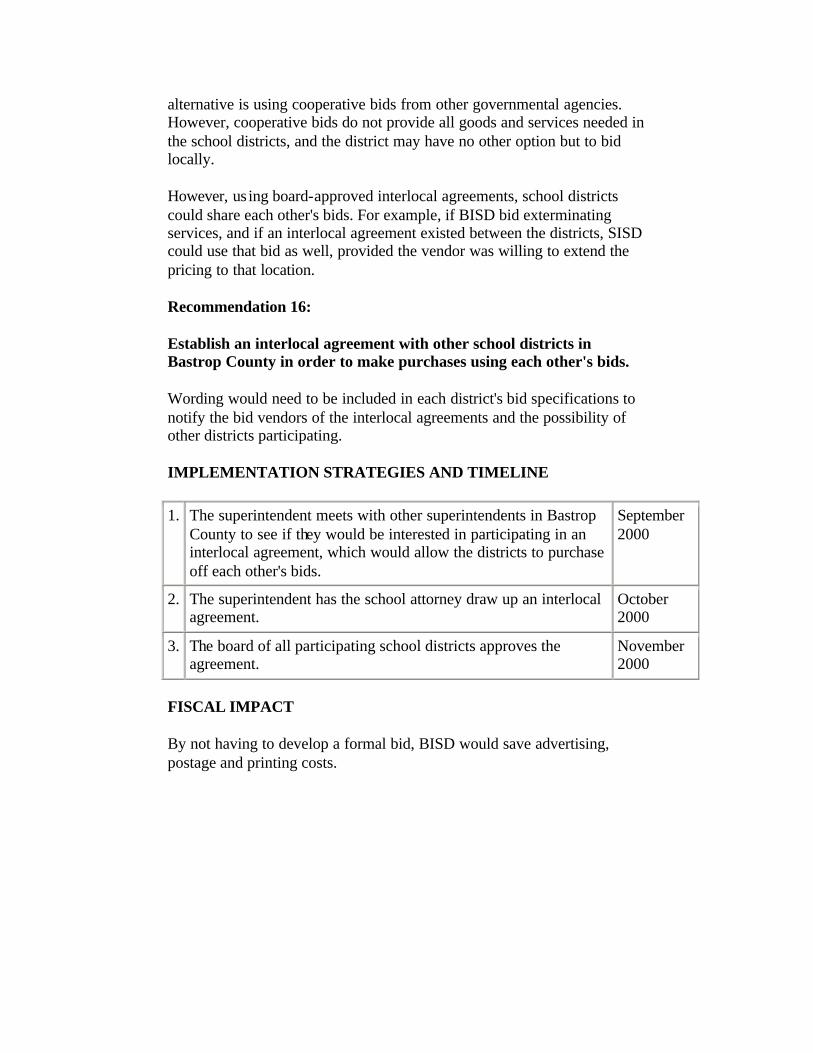
alternative is using cooperative bids from other governmental agencies. However, cooperative bids do not provide all goods and services needed in the school districts, and the district may have no other option but to bid locally.
However, us ing board-approved interlocal agreements, school districts could share each other's bids. For example, if BISD bid exterminating services, and if an interlocal agreement existed between the districts, SISD could use that bid as well, provided the vendor was willing to extend the pricing to that location.
Recommendation 16:
Establish an interlocal agreement with other school districts in Bastrop County in order to make purchases using each other's bids.
Wording would need to be included in each district's bid specifications to notify the bid vendors of the interlocal agreements and the possibility of other districts participating.
IMPLEMENTATION STRATEGIES AND TIMELINE
1. The superintendent meets with other superintendents in Bastrop County to see if they would be interested in participating in an interlocal agreement, which would allow the districts to purchase off each other's bids.
September 2000
2. The superintendent has the school attorney draw up an interlocal agreement.
October 2000
3. The board of all participating school districts approves the agreement.
November 2000
FISCAL IMPACT
By not having to develop a formal bid, BISD would save advertising, postage and printing costs.
Chapter 5
ASSET AND RISK MANAGEMENT
This chapter reviews all asset and risk management functions of the Smithville Independent School District (SISD) in the following areas:
A. Cash and Investments B. Fixed Assets C. District Insurance Coverage
Asset management involves the management of the district's cash resources and physical assets in a cost-effective and efficient manner. This includes accounting for and safeguarding these elements against theft and obsolescence. Risk management includes the identification, analysis and reduction of risk through insurance and safety programs to protect the district's assets and employees.
BACKGROUND
The director of the Business and administrative office staff is responsible for the district's asset and risk management function. This function includes cash management and investing activities, maintaining fixed assets records and managing long-term debt. The Human Resources director and the Human Resources Department are responsible for administration of the district's employee benefit programs and the worker's compensation program.
The district's investment policy is designed to ensure the safety of idle funds; the availability of operating, capital and debt service funds when needed; and a competitive return on investments. Emphasis should be placed on the safety of principal and liquidity and must address investment diversification, yield, maturity and the quality and capability of investment management. The policy allows three investment types, with restrictions, summarized as follows:
• Obligations of the U. S. Treasury, certain U.S. agencies, and the State of Texas as permitted by Government Code 2256.009;
• Certificates of deposit; and • Public funds investment pools.
The district's investment portfolio as of March 2000 consists of deposits in a public funds investment pool, TexPool.
The State of Texas uses county appraisal districts to determine the appraised and taxable values of properties within each taxing jurisdiction.
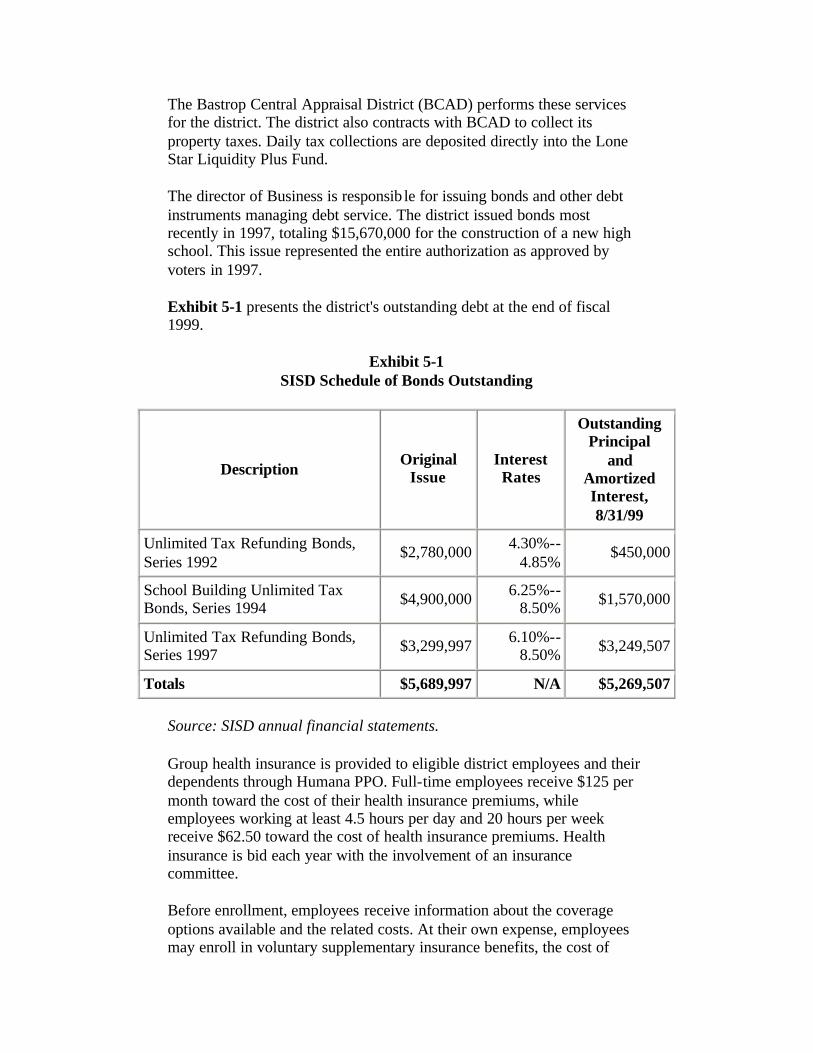
The Bastrop Central Appraisal District (BCAD) performs these services for the district. The district also contracts with BCAD to collect its property taxes. Daily tax collections are deposited directly into the Lone Star Liquidity Plus Fund.
The director of Business is responsib le for issuing bonds and other debt instruments managing debt service. The district issued bonds most recently in 1997, totaling $15,670,000 for the construction of a new high school. This issue represented the entire authorization as approved by voters in 1997.
Exhibit 5-1 presents the district's outstanding debt at the end of fiscal 1999.
Exhibit 5-1 SISD Schedule of Bonds Outstanding
Description Original
Issue Interest Rates
Outstanding Principal
and Amortized Interest, 8/31/99
Unlimited Tax Refunding Bonds, Series 1992
$2,780,000 4.30%--4.85%
$450,000
School Building Unlimited Tax Bonds, Series 1994 $4,900,000 6.25%--
8.50% $1,570,000
Unlimited Tax Refunding Bonds, Series 1997 $3,299,997 6.10%--
8.50% $3,249,507
Totals $5,689,997 N/A $5,269,507
Source: SISD annual financial statements.
Group health insurance is provided to eligible district employees and their dependents through Humana PPO. Full-time employees receive $125 per month toward the cost of their health insurance premiums, while employees working at least 4.5 hours per day and 20 hours per week receive $62.50 toward the cost of health insurance premiums. Health insurance is bid each year with the involvement of an insurance committee.
Before enrollment, employees receive information about the coverage options available and the related costs. At their own expense, employees may enroll in voluntary supplementary insurance benefits, the cost of
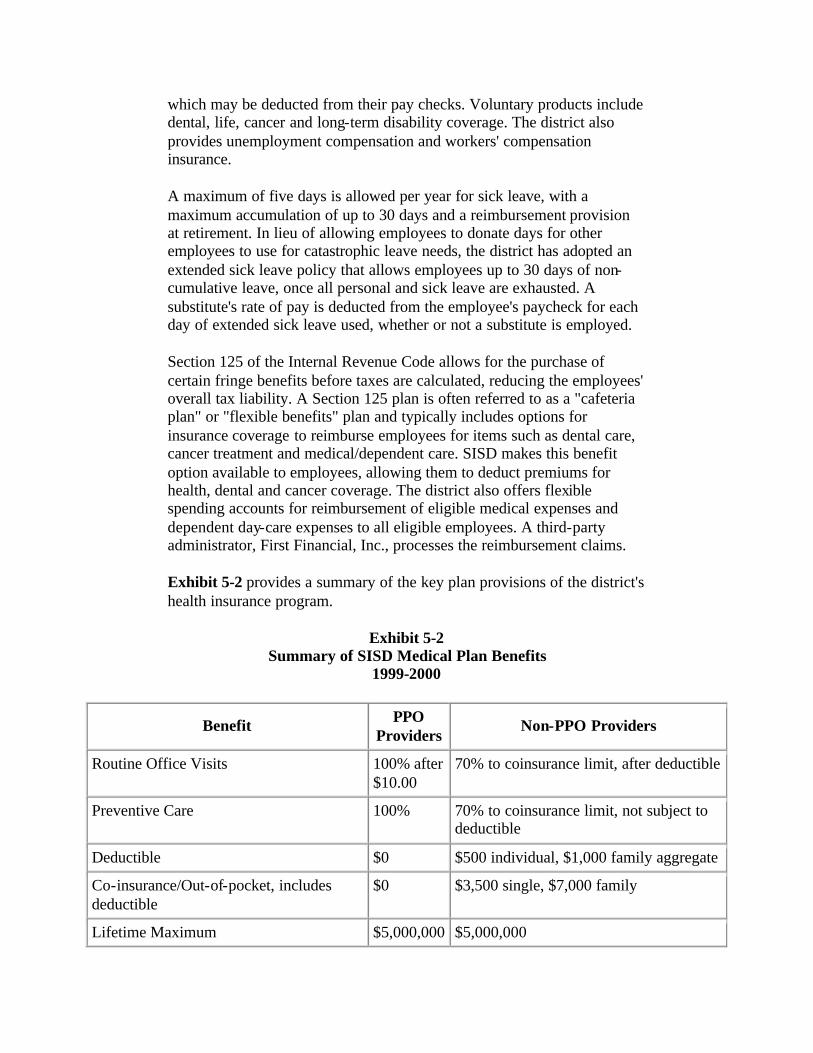
which may be deducted from their pay checks. Voluntary products include dental, life, cancer and long-term disability coverage. The district also provides unemployment compensation and workers' compensation insurance.
A maximum of five days is allowed per year for sick leave, with a maximum accumulation of up to 30 days and a reimbursement provision at retirement. In lieu of allowing employees to donate days for other employees to use for catastrophic leave needs, the district has adopted an extended sick leave policy that allows employees up to 30 days of non-cumulative leave, once all personal and sick leave are exhausted. A substitute's rate of pay is deducted from the employee's paycheck for each day of extended sick leave used, whether or not a substitute is employed.
Section 125 of the Internal Revenue Code allows for the purchase of certain fringe benefits before taxes are calculated, reducing the employees' overall tax liability. A Section 125 plan is often referred to as a "cafeteria plan" or "flexible benefits" plan and typically includes options for insurance coverage to reimburse employees for items such as dental care, cancer treatment and medical/dependent care. SISD makes this benefit option available to employees, allowing them to deduct premiums for health, dental and cancer coverage. The district also offers flexible spending accounts for reimbursement of eligible medical expenses and dependent day-care expenses to all eligible employees. A third-party administrator, First Financial, Inc., processes the reimbursement claims.
Exhibit 5-2 provides a summary of the key plan provisions of the district's health insurance program.
Exhibit 5-2 Summary of SISD Medical Plan Benefits
1999-2000
Benefit PPO Providers
Non-PPO Providers
Routine Office Visits 100% after $10.00
70% to coinsurance limit, after deductible
Preventive Care 100% 70% to coinsurance limit, not subject to deductible
Deductible $0 $500 individual, $1,000 family aggregate
Co-insurance/Out-of-pocket, includes deductible
$0 $3,500 single, $7,000 family
Lifetime Maximum $5,000,000 $5,000,000

Hospital Benefits
• Surgery • Inpatient/Outpatient • Diagnostic • Emergency Care • Home Health & Hospice • Skilled Nursing Facility • Pregnancy
100% 70% to coinsurance limit, after deductible
Prenatal Coverage $200 payable at 100%; remainder paid under pregnancy benefit
$200 payable at 100%; remainder paid under pregnancy benefit
Prescription Drug $10 generic, $20 brand-name
$10 generic, $20 brand-name
Mental Disorders-Lifetime Max, $25,000
• Inpatient - $5000 per calendar year • Outpatient
100% 50%
70% to coinsurance limit, after deductible 50% after deductible
Chemical & Alcohol Dependency 100% 70% to coinsurance limit, after deductible
Source: director of Business.
Exhibit 5-3 details employee out-of-pocket costs for premiums.
Exhibit 5-3 SISD Full-Time Employee Monthly Premiums for Medical Coverage
1999-2000
Category Premiums
Employee only $62.85
Employee + children $251.86
Employee + spouse $301.27
Employee + family $389.63
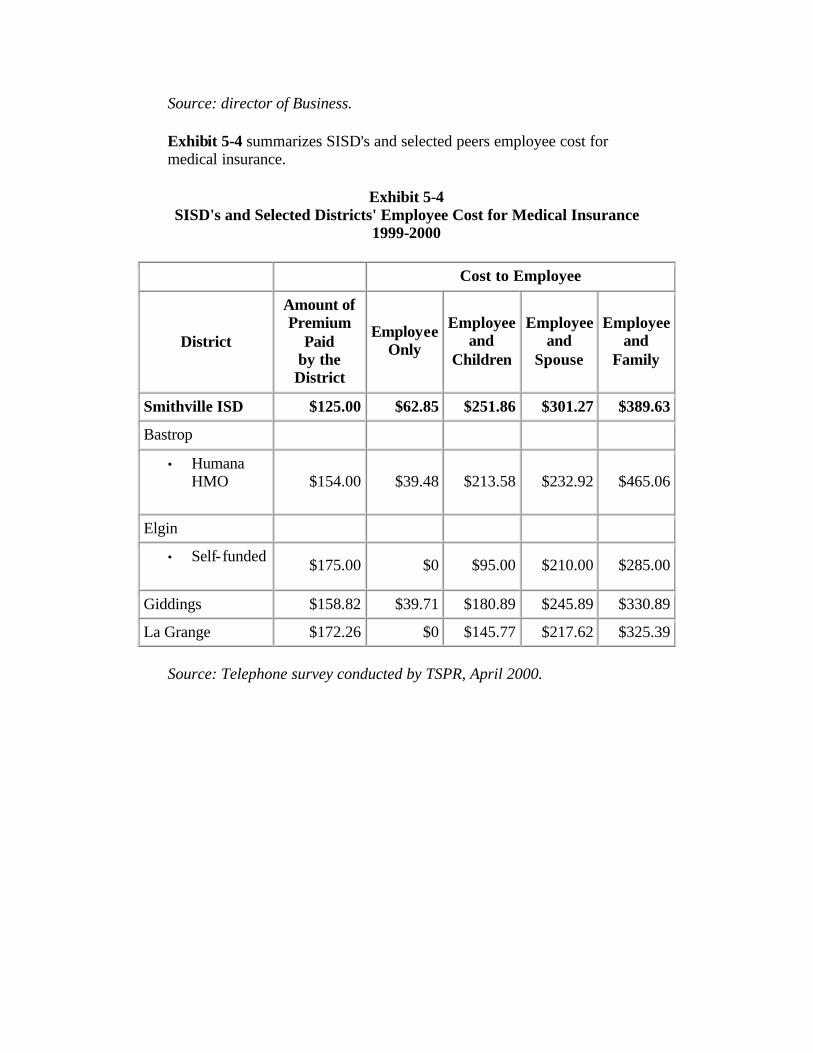
Source: director of Business.
Exhibit 5-4 summarizes SISD's and selected peers employee cost for medical insurance.
Exhibit 5-4 SISD's and Selected Districts' Employee Cost for Medical Insurance
1999-2000
Cost to Employee
District
Amount of Premium
Paid by the District
Employee Only
Employee and
Children
Employee and
Spouse
Employee and
Family
Smithville ISD $125.00 $62.85 $251.86 $301.27 $389.63
Bastrop
• Humana HMO $154.00 $39.48 $213.58 $232.92 $465.06
Elgin
• Self- funded $175.00 $0 $95.00 $210.00 $285.00
Giddings $158.82 $39.71 $180.89 $245.89 $330.89
La Grange $172.26 $0 $145.77 $217.62 $325.39
Source: Telephone survey conducted by TSPR, April 2000.
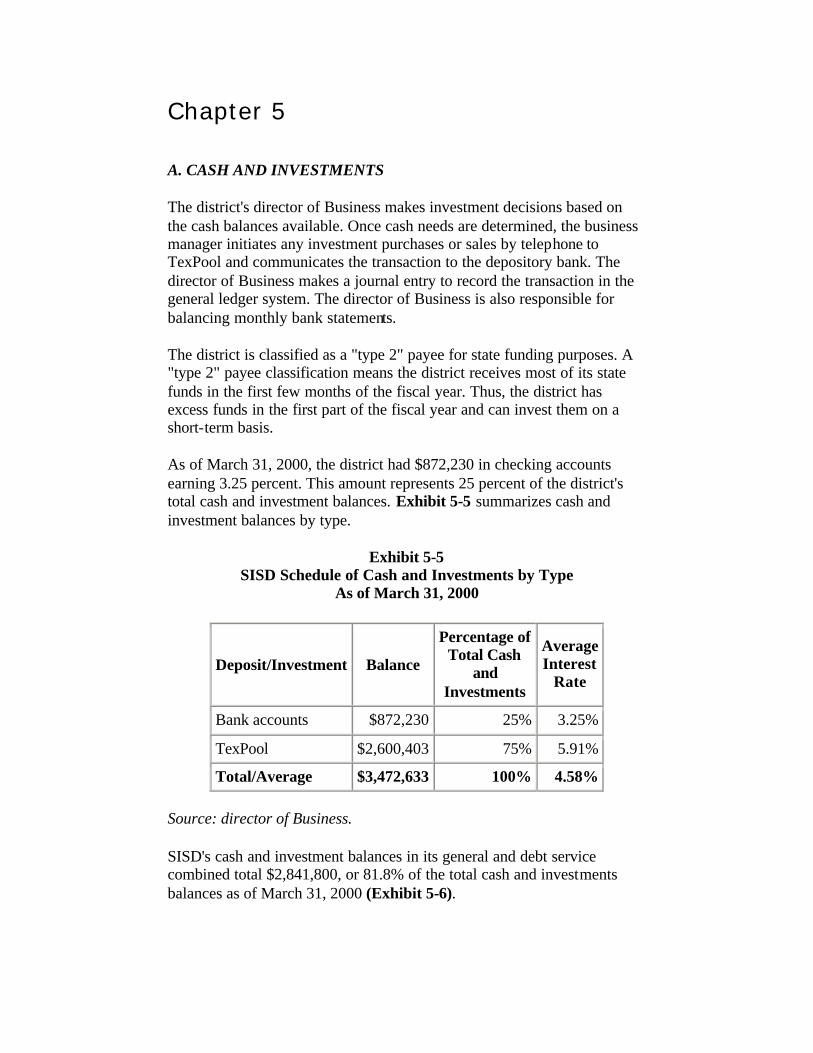
Chapter 5
A. CASH AND INVESTMENTS
The district's director of Business makes investment decisions based on the cash balances available. Once cash needs are determined, the business manager initiates any investment purchases or sales by telephone to TexPool and communicates the transaction to the depository bank. The director of Business makes a journal entry to record the transaction in the general ledger system. The director of Business is also responsible for balancing monthly bank statements.
The district is classified as a "type 2" payee for state funding purposes. A "type 2" payee classification means the district receives most of its state funds in the first few months of the fiscal year. Thus, the district has excess funds in the first part of the fiscal year and can invest them on a short-term basis.
As of March 31, 2000, the district had $872,230 in checking accounts earning 3.25 percent. This amount represents 25 percent of the district's total cash and investment balances. Exhibit 5-5 summarizes cash and investment balances by type.
Exhibit 5-5 SISD Schedule of Cash and Investments by Type
As of March 31, 2000
Deposit/Investment Balance
Percentage of Total Cash
and Investments
Average Interest
Rate
Bank accounts $872,230 25% 3.25%
TexPool $2,600,403 75% 5.91%
Total/Average $3,472,633 100% 4.58%
Source: director of Business.
SISD's cash and investment balances in its general and debt service combined total $2,841,800, or 81.8% of the total cash and investments balances as of March 31, 2000 (Exhibit 5-6).
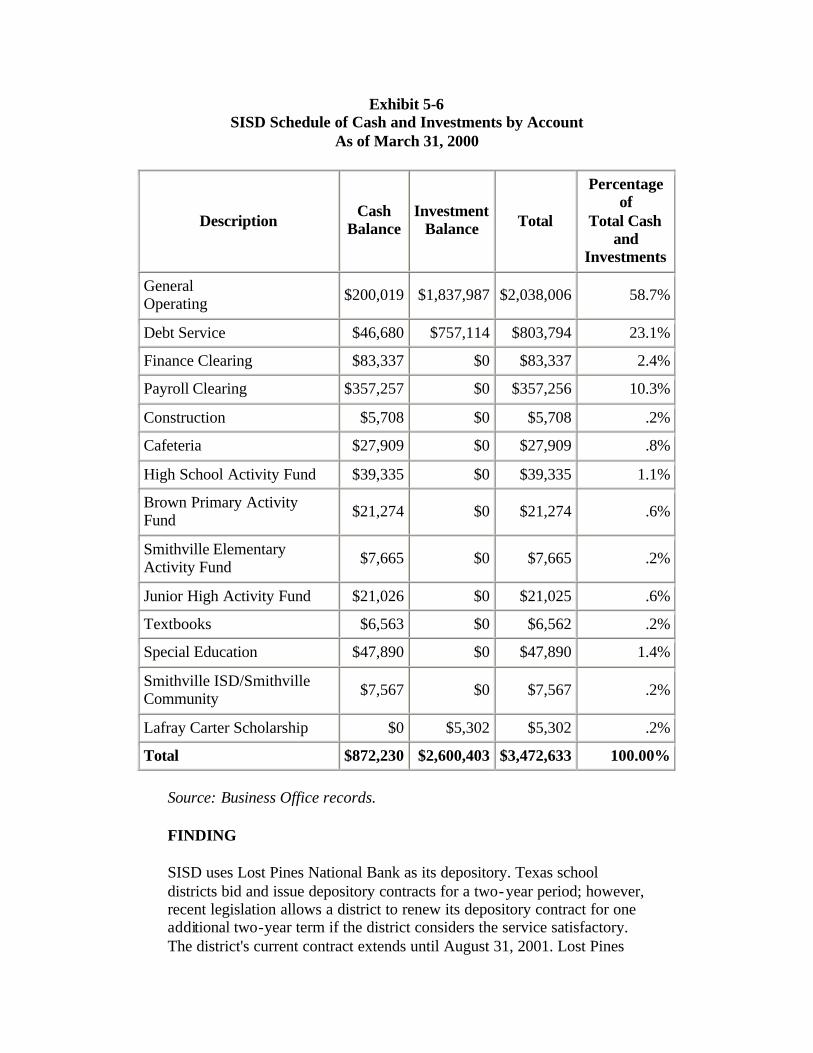
Exhibit 5-6 SISD Schedule of Cash and Investments by Account
As of March 31, 2000
Description Cash
Balance Investment
Balance Total
Percentage of
Total Cash and
Investments
General Operating $200,019 $1,837,987 $2,038,006 58.7%
Debt Service $46,680 $757,114 $803,794 23.1%
Finance Clearing $83,337 $0 $83,337 2.4%
Payroll Clearing $357,257 $0 $357,256 10.3%
Construction $5,708 $0 $5,708 .2%
Cafeteria $27,909 $0 $27,909 .8%
High School Activity Fund $39,335 $0 $39,335 1.1%
Brown Primary Activity Fund $21,274 $0 $21,274 .6%
Smithville Elementary Activity Fund $7,665 $0 $7,665 .2%
Junior High Activity Fund $21,026 $0 $21,025 .6%
Textbooks $6,563 $0 $6,562 .2%
Special Education $47,890 $0 $47,890 1.4%
Smithville ISD/Smithville Community $7,567 $0 $7,567 .2%
Lafray Carter Scholarship $0 $5,302 $5,302 .2%
Total $872,230 $2,600,403 $3,472,633 100.00%
Source: Business Office records.
FINDING
SISD uses Lost Pines National Bank as its depository. Texas school districts bid and issue depository contracts for a two-year period; however, recent legislation allows a district to renew its depository contract for one additional two-year term if the district considers the service satisfactory. The district's current contract extends until August 31, 2001. Lost Pines
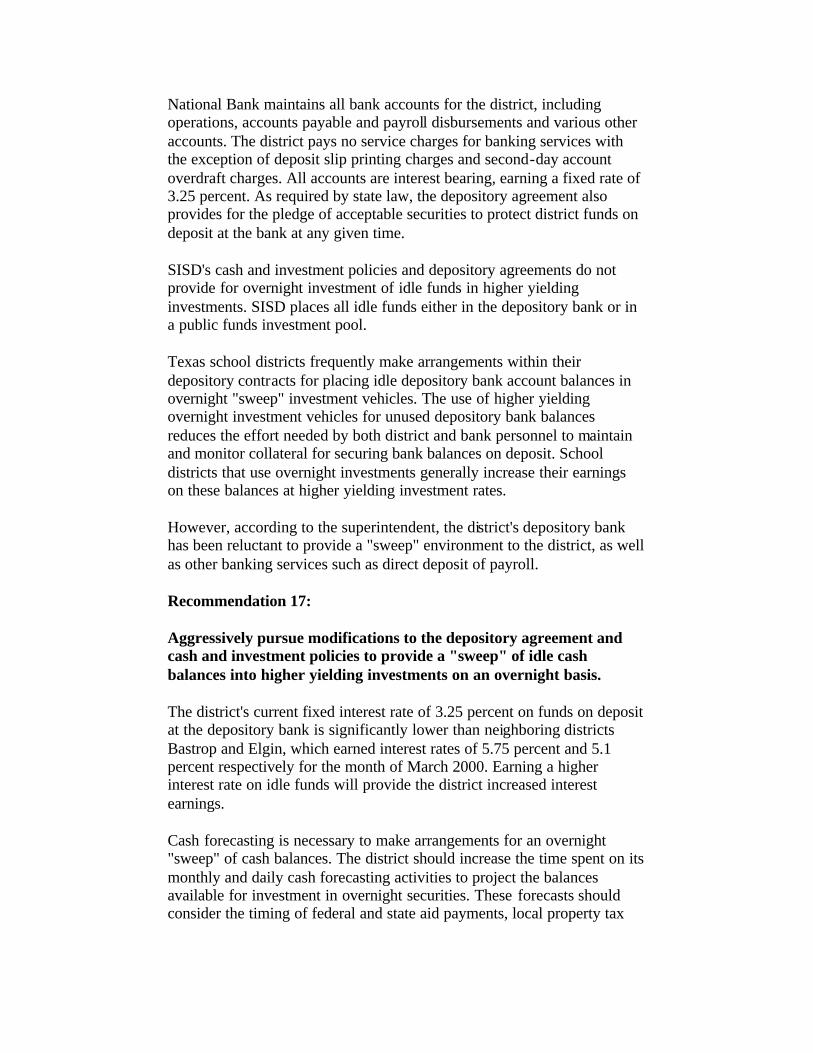
National Bank maintains all bank accounts for the district, including operations, accounts payable and payroll disbursements and various other accounts. The district pays no service charges for banking services with the exception of deposit slip printing charges and second-day account overdraft charges. All accounts are interest bearing, earning a fixed rate of 3.25 percent. As required by state law, the depository agreement also provides for the pledge of acceptable securities to protect district funds on deposit at the bank at any given time.
SISD's cash and investment policies and depository agreements do not provide for overnight investment of idle funds in higher yielding investments. SISD places all idle funds either in the depository bank or in a public funds investment pool.
Texas school districts frequently make arrangements within their depository contracts for placing idle depository bank account balances in overnight "sweep" investment vehicles. The use of higher yielding overnight investment vehicles for unused depository bank balances reduces the effort needed by both district and bank personnel to maintain and monitor collateral for securing bank balances on deposit. School districts that use overnight investments generally increase their earnings on these balances at higher yielding investment rates.
However, according to the superintendent, the district's depository bank has been reluctant to provide a "sweep" environment to the district, as well as other banking services such as direct deposit of payroll.
Recommendation 17:
Aggressively pursue modifications to the depository agreement and cash and investment policies to provide a "sweep" of idle cash balances into higher yielding investments on an overnight basis.
The district's current fixed interest rate of 3.25 percent on funds on deposit at the depository bank is significantly lower than neighboring districts Bastrop and Elgin, which earned interest rates of 5.75 percent and 5.1 percent respectively for the month of March 2000. Earning a higher interest rate on idle funds will provide the district increased interest earnings.
Cash forecasting is necessary to make arrangements for an overnight "sweep" of cash balances. The district should increase the time spent on its monthly and daily cash forecasting activities to project the balances available for investment in overnight securities. These forecasts should consider the timing of federal and state aid payments, local property tax
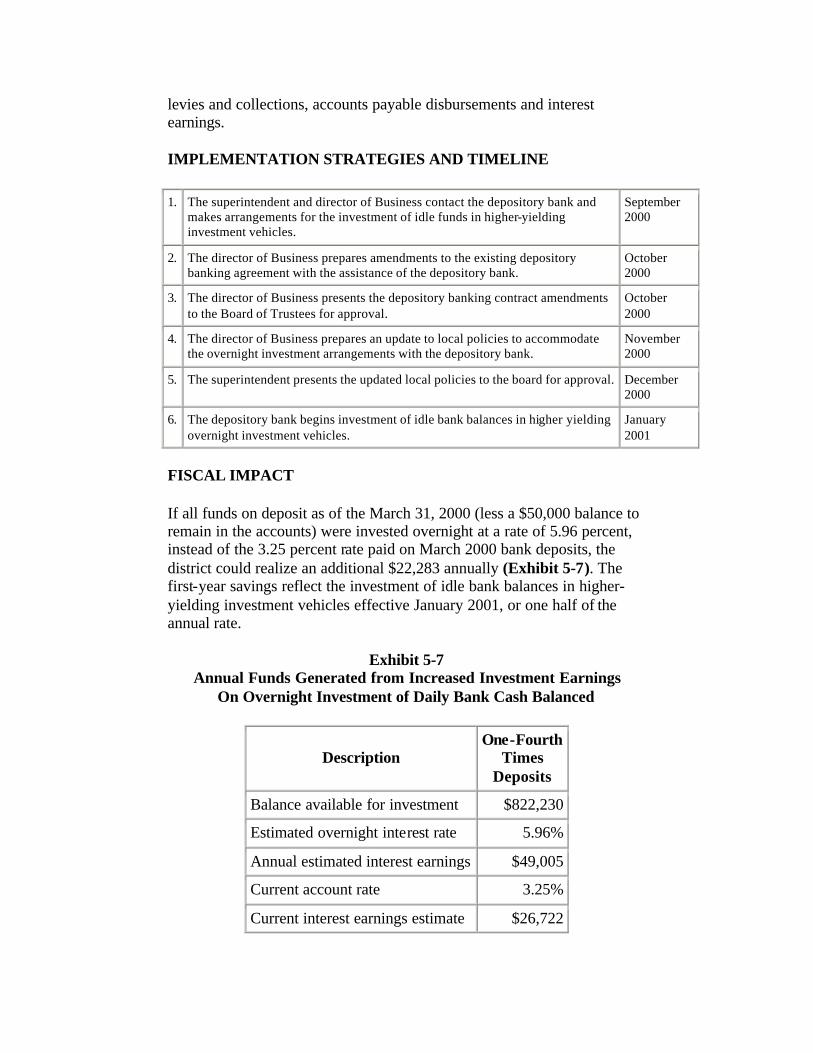
levies and collections, accounts payable disbursements and interest earnings.
IMPLEMENTATION STRATEGIES AND TIMELINE
1. The superintendent and director of Business contact the depository bank and makes arrangements for the investment of idle funds in higher-yielding investment vehicles.
September 2000
2. The director of Business prepares amendments to the existing depository banking agreement with the assistance of the depository bank.
October 2000
3. The director of Business presents the depository banking contract amendments to the Board of Trustees for approval.
October 2000
4. The director of Business prepares an update to local policies to accommodate the overnight investment arrangements with the depository bank.
November 2000
5. The superintendent presents the updated local policies to the board for approval. December 2000
6. The depository bank begins investment of idle bank balances in higher yielding overnight investment vehicles.
January 2001
FISCAL IMPACT
If all funds on deposit as of the March 31, 2000 (less a $50,000 balance to remain in the accounts) were invested overnight at a rate of 5.96 percent, instead of the 3.25 percent rate paid on March 2000 bank deposits, the district could realize an additional $22,283 annually (Exhibit 5-7). The first-year savings reflect the investment of idle bank balances in higher-yielding investment vehicles effective January 2001, or one half of the annual rate.
Exhibit 5-7 Annual Funds Generated from Increased Investment Earnings
On Overnight Investment of Daily Bank Cash Balanced
Description One-Fourth
Times Deposits
Balance available for investment $822,230
Estimated overnight interest rate 5.96%
Annual estimated interest earnings $49,005
Current account rate 3.25%
Current interest earnings estimate $26,722

Average earnings $22,283
Source: TSPR calculation.
Recommendation 2000-01
2001-02
2002-03
2003-04
2004-05
Modify the current depository agreement and cash and investment policies to provide a "sweep" of idle cash balances into higher yielding investments on an overnight basis.
$11,142 $22,283 $22,283 $22,283 $22,283
FINDING
SISD's current depository contract does not provide for controlled disbursement accounts to clear accounts payable and payroll checks. As of March 31, 2000 combined balances in the accounts payable and payroll clearing accounts totaled $440,594.
Controlled disbursement accounts are a cash management tool used by many school districts to increase the amount of time funds can remain invested. A controlled disbursement environment allows the district to know the amount of checks clearing on a daily basis prior to making investment decisions. The district will then be able to fund only the checks clearing through the accounts that day. Knowing the amount of checks that will clear on a daily basis will allow the district to invest funds for a longer term and increase overall interest earnings.
Additionally, maintaining a smaller amount of funds in the bank reduces the collateral required to be maintained by the bank.
Recommendation 18:
Modify the current depository contract to convert existing accounts to controlled disbursement accounts.
By converting the accounts payable and payroll clearing accounts to controlled disbursement accounts, the district can take advantage of increased clearing times for checks and will have the ability to fund only the checks clearing each day.
IMPLEMENTATION STRATEGIES AND TIMELINE
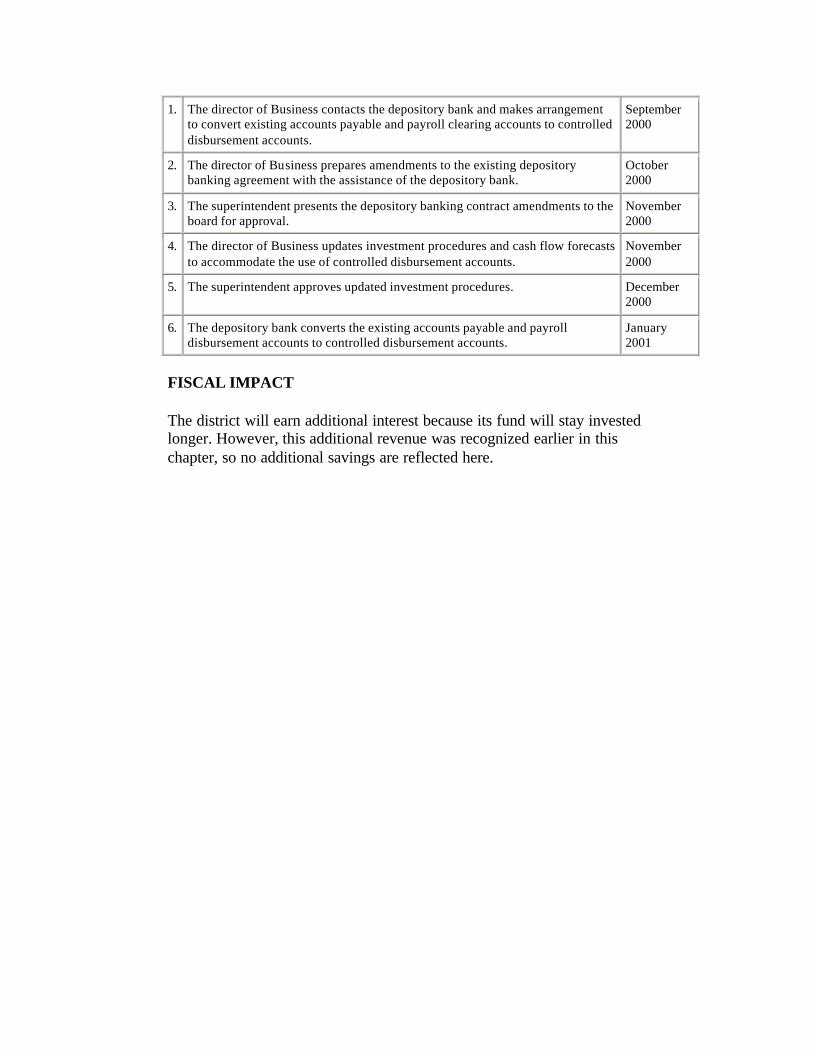
1. The director of Business contacts the depository bank and makes arrangement to convert existing accounts payable and payroll clearing accounts to controlled disbursement accounts.
September 2000
2. The director of Business prepares amendments to the existing depository banking agreement with the assistance of the depository bank.
October 2000
3. The superintendent presents the depository banking contract amendments to the board for approval.
November 2000
4. The director of Business updates investment procedures and cash flow forecasts to accommodate the use of controlled disbursement accounts.
November 2000
5. The superintendent approves updated investment procedures. December 2000
6. The depository bank converts the existing accounts payable and payroll disbursement accounts to controlled disbursement accounts.
January 2001
FISCAL IMPACT
The district will earn additional interest because its fund will stay invested longer. However, this additional revenue was recognized earlier in this chapter, so no additional savings are reflected here.

Chapter 5
B. FIXED ASSETS
In governmental fund accounting, used by school districts, fixed assets are purchased with money currently available within a given fund (for example, a general operating fund or capital projects fund). Fixed assets are tangible items that typically have significant value. Therefore, control of, and accountability over, these items is critical.
It is the responsibility of the director of Business to establish appropriate fixed assets capitalization limits, based on the unit cost as well as the useful life of the asset. Accounting for fixed assets is also the responsibility of the director of Business.
According to the Texas Education Agency's Financial Accountability System Resource Guide, the emphasis in governmental accounting for fixed assets is on control and accountability. Accordingly, a school district must accumulate a variety of data relating to fixed assets to maintain control and accountability. These data include: quantity, location, condition and life expectancy.
Fixed asset records are necessary to designate who is responsible for the custody and maintenance of individual items and to assist in estimating future requirements. School districts generally control capital transactions used for the acquisition of fixed assets by using a well-defined authorization procedure. Separate accountability for fixed assets is a specific legal requirement of many federal programs.
School districts should maintain detailed subsidiary records to maximize the control of fixed assets. These records should include the following information as a minimum:
• The item purchased; • Date of purchase; • Purchase price; • Life expectancy; • Location number; • Inventory number; • Fund from which purchased; and • Other information that may be useful for control.
The subsidiary record, regardless of its physical form, should at least provide a complete description of the item to permit positive identification, cost and purchase data and its location.
Adequate accounting procedures and records for fixed assets are essential to protecting school property. In addition to protecting property, an appropriate system:
• Designates responsibility for custody and proper use, • Provides data to manage fixed assets properly; and • Provides data for financ ial control, developing financial reports
and adequate insurance coverage.
Of paramount importance is the security of the system. Any material change in the customary recording of distribution or disposal of fixed assets is a financial matter that should be decided by the school district's administration. Management must impose discipline throughout the organization so managers maintain an appropriate level of internal control to ensure adequate protection of fixed assets.
School district policies should address the use of school district fixed assets in a location other than that assigned. The policy should also address the off site use of school district assets by employees.
Schools should inventory certain fixed assets, such as furniture and equipment, on a periodic basis. Districts should take annual fixed asset inventories at the end of the school term before the staff members leave. Schools should settle discrepancies between the fixed asset inventory list and what is on hand in a timely fashion. Districts should list missing items and write off the assets in accordance with established policy.
FINDING
The district does not have written policies and procedures regarding fixed assets accounting and the related systems to maintain a proper fixed assets inventory. Before December 1999, fixed assets inventory records were not maintained. At that time, an inventory was taken by district personnel to establish an accurate beginning inventory for each campus. Values are being assigned to these items based on historical records or estimations if necessary. The district has purchased fixed assets management software that will allow it to barcode individual assets and use a barcode reader for annual inventories. A handbook will be written to establish procedures for asset purchase, disposal and relocation.
School districts must determine an appropriate unit cost for capitalization of the item as a fixed asset. This limit triggers the tracking of the item for the fixed asset inventory system. The board is reviewing a policy that will allow the capture of assets with a unit cost of $5,000 for purposes of depreciation. However, the district does not have written procedures that
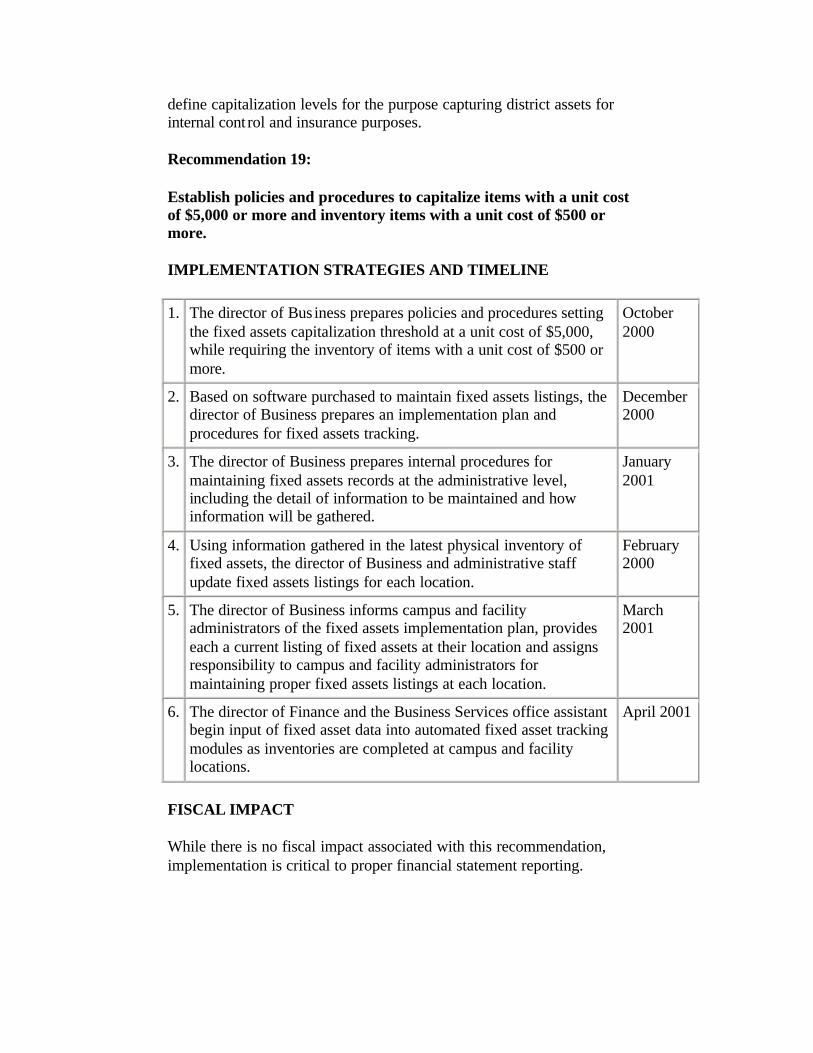
define capitalization levels for the purpose capturing district assets for internal cont rol and insurance purposes.
Recommendation 19:
Establish policies and procedures to capitalize items with a unit cost of $5,000 or more and inventory items with a unit cost of $500 or more.
IMPLEMENTATION STRATEGIES AND TIMELINE
1. The director of Bus iness prepares policies and procedures setting the fixed assets capitalization threshold at a unit cost of $5,000, while requiring the inventory of items with a unit cost of $500 or more.
October 2000
2. Based on software purchased to maintain fixed assets listings, the director of Business prepares an implementation plan and procedures for fixed assets tracking.
December 2000
3. The director of Business prepares internal procedures for maintaining fixed assets records at the administrative level, including the detail of information to be maintained and how information will be gathered.
January 2001
4. Using information gathered in the latest physical inventory of fixed assets, the director of Business and administrative staff update fixed assets listings for each location.
February 2000
5. The director of Business informs campus and facility administrators of the fixed assets implementation plan, provides each a current listing of fixed assets at their location and assigns responsibility to campus and facility administrators for maintaining proper fixed assets listings at each location.
March 2001
6. The director of Finance and the Business Services office assistant begin input of fixed asset data into automated fixed asset tracking modules as inventories are completed at campus and facility locations.
April 2001
FISCAL IMPACT
While there is no fiscal impact associated with this recommendation, implementation is critical to proper financial statement reporting.
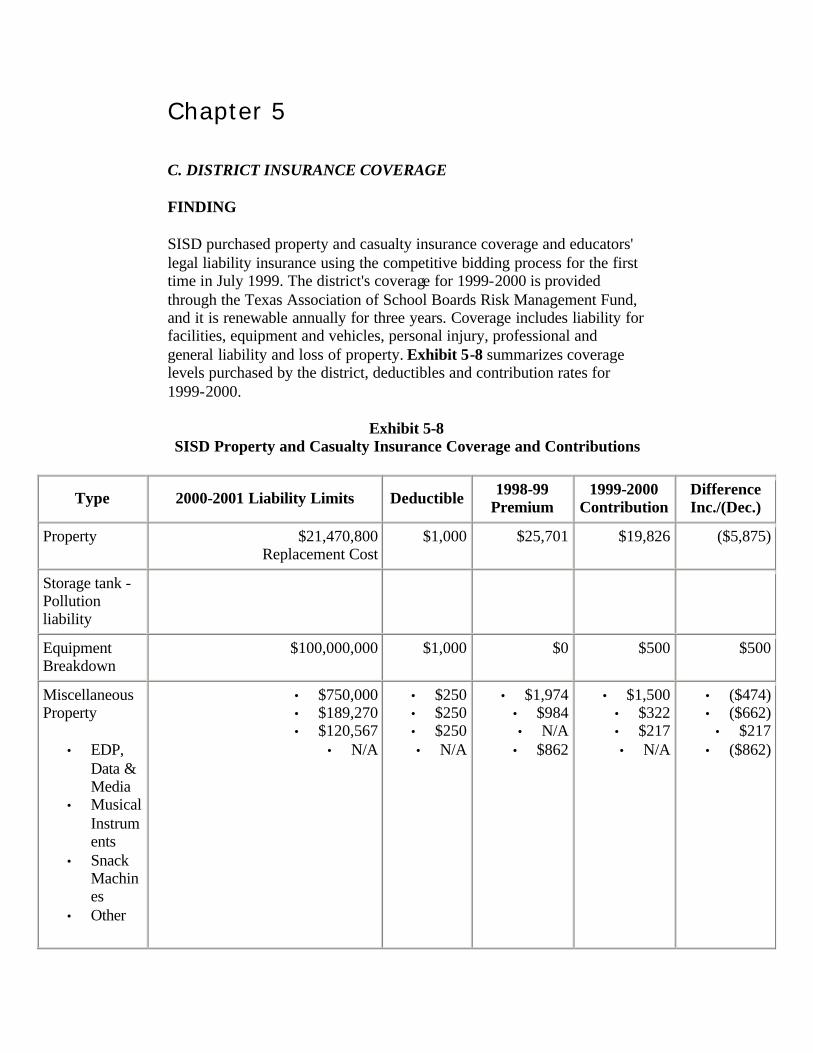
Chapter 5
C. DISTRICT INSURANCE COVERAGE
FINDING
SISD purchased property and casualty insurance coverage and educators' legal liability insurance using the competitive bidding process for the first time in July 1999. The district's coverage for 1999-2000 is provided through the Texas Association of School Boards Risk Management Fund, and it is renewable annually for three years. Coverage includes liability for facilities, equipment and vehicles, personal injury, professional and general liability and loss of property. Exhibit 5-8 summarizes coverage levels purchased by the district, deductibles and contribution rates for 1999-2000.
Exhibit 5-8 SISD Property and Casualty Insurance Coverage and Contributions
Type 2000-2001 Liability Limits Deductible 1998-99 Premium
1999-2000 Contribution
Difference Inc./(Dec.)
Property $21,470,800 Replacement Cost
$1,000 $25,701 $19,826 ($5,875)
Storage tank - Pollution liability
Equipment Breakdown
$100,000,000 $1,000 $0 $500 $500
Miscellaneous Property
• EDP, Data & Media
• Musical Instruments
• Snack Machines
• Other
• $750,000 • $189,270 • $120,567
• N/A
• $250 • $250 • $250 • N/A
• $1,974 • $984 • N/A
• $862
• $1,500 • $322 • $217 • N/A
• ($474) • ($662)
• $217 • ($862)
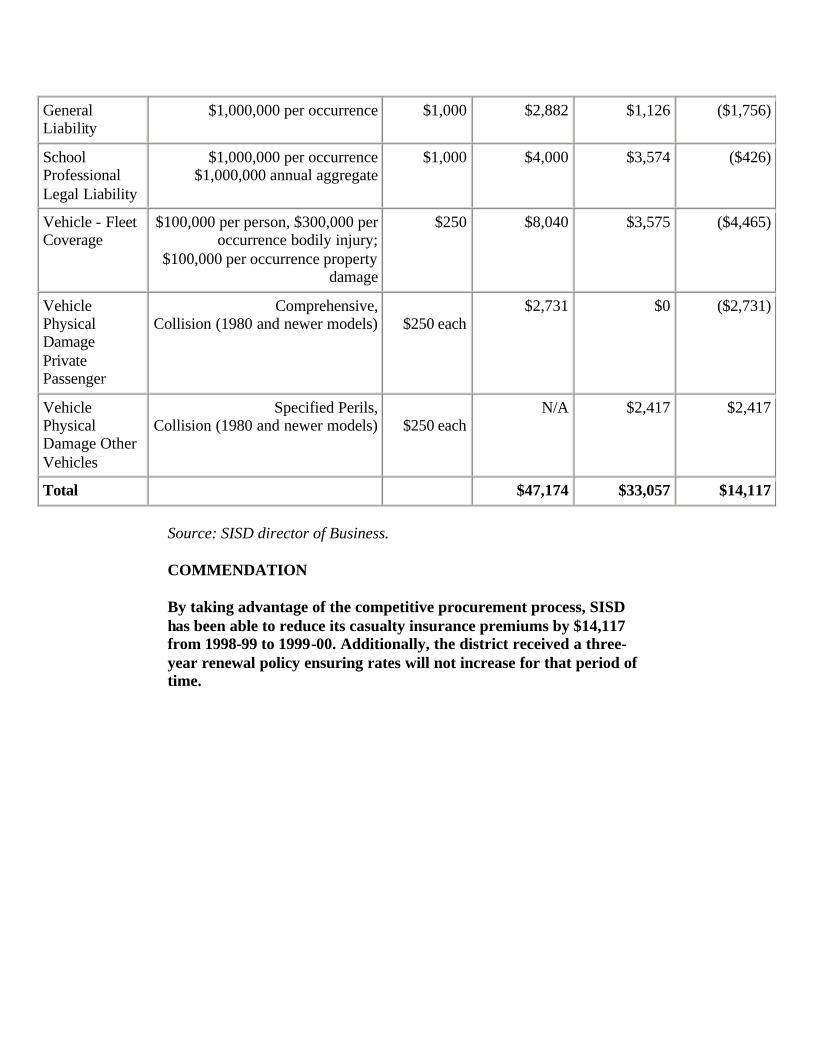
General Liability
$1,000,000 per occurrence $1,000 $2,882 $1,126 ($1,756)
School Professional Legal Liability
$1,000,000 per occurrence $1,000,000 annual aggregate
$1,000 $4,000 $3,574 ($426)
Vehicle - Fleet Coverage
$100,000 per person, $300,000 per occurrence bodily injury;
$100,000 per occurrence property damage
$250 $8,040 $3,575 ($4,465)
Vehicle Physical Damage Private Passenger
Comprehensive, Collision (1980 and newer models)
$250 each
$2,731 $0 ($2,731)
Vehicle Physical Damage Other Vehicles
Specified Perils, Collision (1980 and newer models)
$250 each
N/A $2,417 $2,417
Total $47,174 $33,057 $14,117
Source: SISD director of Business.
COMMENDATION
By taking advantage of the competitive procurement process, SISD has been able to reduce its casualty insurance premiums by $14,117 from 1998-99 to 1999-00. Additionally, the district received a three-year renewal policy ensuring rates will not increase for that period of time.
Chapter 6
OPERATIONS
This chapter examines the operations of the Smithville Independent School District (SISD) in three parts:
A. Food Services B. Computers and Technology C. Transportation
Efficient, effective school operations and quality pupil services support a school district's educational mission. For children to learn, a district must create an environment conducive to learning that takes into account the well being of a student in various aspects; the nourishment of a student, the safe transportation of that student to school. and the types of programs that are available to prepare the student with the technology of the real world.
Chapter 6
A. FOOD SERVICES
School food service operations should provide an appealing and nutritionally sound breakfast and lunch as economically as possible. Several factors are used to evaluate the efficiency and effectiveness of a school food services operation including staffing, productivity, food costs, the amount of waste, participation rates in breakfast and lunch programs, nutritional value, the variety of meals served, the wait time per student served and financial self-sufficiency.
BACKGROUND
According to Managing Child Nutrition Programs, Leadership for Excellence by Martin and Conklin, child nutrition programs are big business and present many challenges and management opportunities. In 1998, the federal budget for child nutrition programs exceeded $5 billion, and nearly 95,000 schools participated in the lunch program and 31,000 participated in the breakfast programs nationally. The child nutrition program is the largest food service business in some communities.
Child nutrition directors need to plan and manage efficient programs; organize and staff for expanded school days, after school snack programs, summer feeding programs, universal breakfast programs; incorporate the school food and nutrition program into a comprehensive health program; and make the nutrition programs integral parts of the community social services system.
The School Meals Initiative mandates that school districts meet the nutrient standards established by USDA for fat content and calories. The same initiative encourages departments to participate directly in nutrition education and team nutrition programs.
The American Dietetic Association, the Society for Nutrition Education and the American Food Service Association developed a position statement outlining the need for comprehensive school-based nutrition programs and services for all the nation's elementary and secondary students.
There is consensus that school food and nutrition programs are important to learning readiness, health promotion and disease prevention. Childhood obesity has become the third most prevalent disease of the children and adolescents in the United States. Many district view school meals as an integral part the education process and strive to ensure quality and
maintain affordability. Policy decisions are made with the goal of providing all students the skills and environment they need to adopt good eating habits.
The Texas School Food Service Association (TSFSA) has identified 10 Standards of Excellence for evaluating school Food Service programs. TSFSA states that effective programs should:
1. Identify and meet current and future needs through organization, planning, direction and control;
2. Maintain financial accountability through established procedures; 3. Meet the nutritional needs of students and promote the
development of sound nutritional practices; 4. Ensure that procurement practices meet established standards; 5. Provide appetizing, nutritious meals through effective, efficient
systems management; 6. Maintain a safe and sanitary environment; 7. Encourage student participation in food service programs; 8. Provide an environment that enhances employee productivity,
growth, development, and morale; 9. Promote a positive image to the public; and 10. Measure success in fulfilling regulatory requirements.
The Texas Education Agency (TEA) conducts reviews under the National School Lunch and Breakfast Agreement, a legal contract between TEA and SISD. The last coordinated review of SISD was in 1995. At the end of each school year, each district must complete a renewal agreement on the Child Nutrition Programs Information Management System. The Texas Department of Health also conducts sanitation inspections several times a year.
SISD serves students in one central kitchen for the elementary, junior and high schools, and one kitchen in the Brown elementary school. All district kitchens comply with Federal Food Code requirements.
Federally-approved snacks are sold in all district cafeterias, in addition to the regular breakfasts and lunches. SISD's Food Service department uses the point of sale (POS) system to track and report financial and student data. Forty-six percent of SISD students are eligible for free and reduced-price meals. SISD's 1999-2000 average daily participation (ADP) is 24 percent for breakfast and 51 percent for lunch.
SISD's Food Service Department is managed by a director and two managers. There are 31 total positions. The district contracts with Education Service Center, Region 13 for the services of a licensed
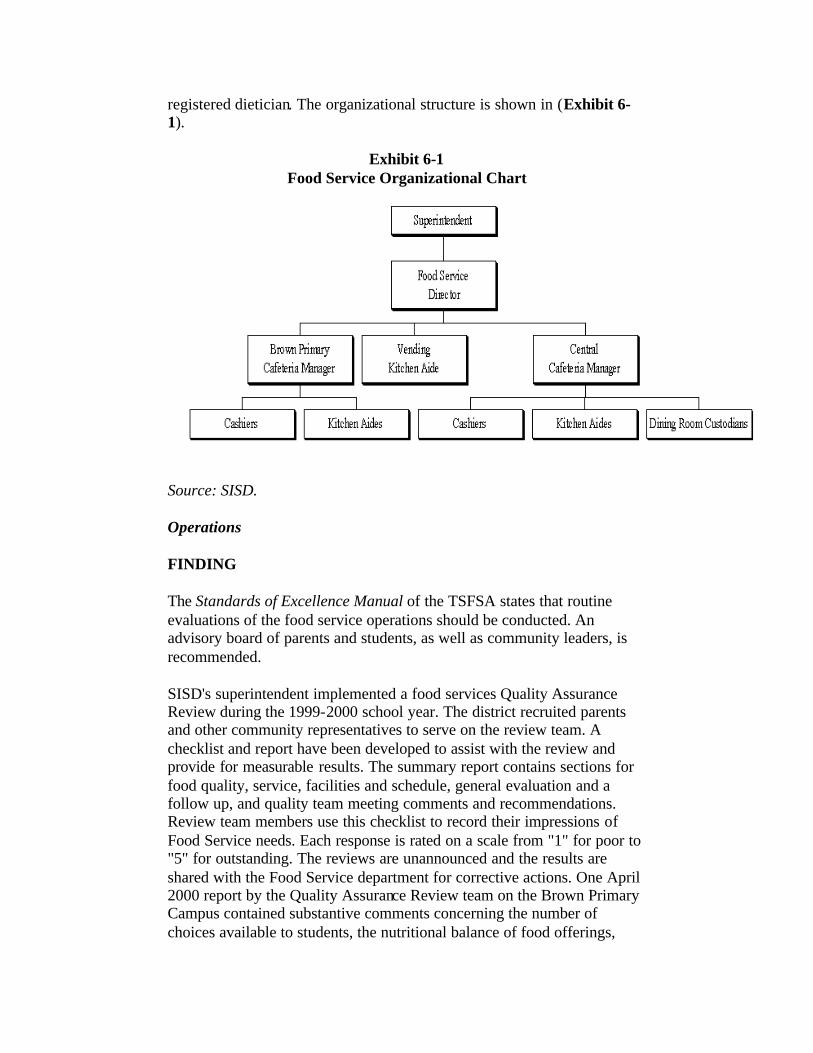
registered dietician. The organizational structure is shown in (Exhibit 6-1).
Exhibit 6-1 Food Service Organizational Chart
Source: SISD.
Operations
FINDING
The Standards of Excellence Manual of the TSFSA states that routine evaluations of the food service operations should be conducted. An advisory board of parents and students, as well as community leaders, is recommended.
SISD's superintendent implemented a food services Quality Assurance Review during the 1999-2000 school year. The district recruited parents and other community representatives to serve on the review team. A checklist and report have been developed to assist with the review and provide for measurable results. The summary report contains sections for food quality, service, facilities and schedule, general evaluation and a follow up, and quality team meeting comments and recommendations. Review team members use this checklist to record their impressions of Food Service needs. Each response is rated on a scale from "1" for poor to "5" for outstanding. The reviews are unannounced and the results are shared with the Food Service department for corrective actions. One April 2000 report by the Quality Assurance Review team on the Brown Primary Campus contained substantive comments concerning the number of choices available to students, the nutritional balance of food offerings,
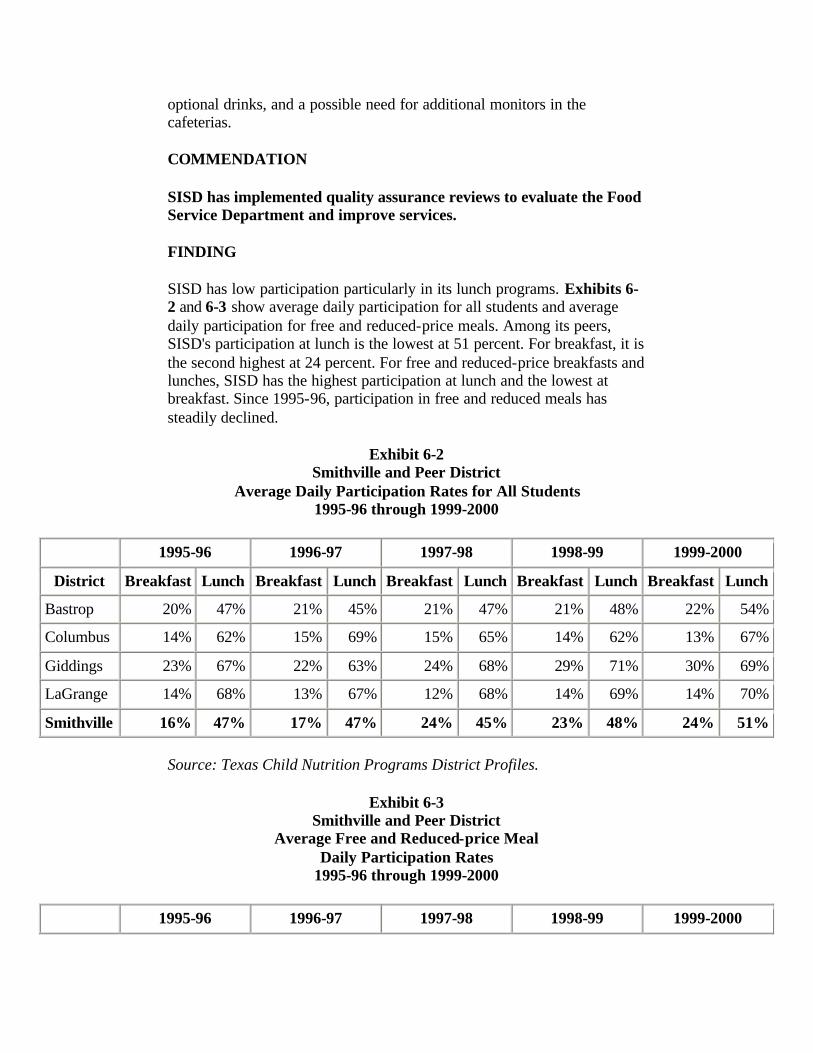
optional drinks, and a possible need for additional monitors in the cafeterias.
COMMENDATION
SISD has implemented quality assurance reviews to evaluate the Food Service Department and improve services.
FINDING
SISD has low participation particularly in its lunch programs. Exhibits 6-2 and 6-3 show average daily participation for all students and average daily participation for free and reduced-price meals. Among its peers, SISD's participation at lunch is the lowest at 51 percent. For breakfast, it is the second highest at 24 percent. For free and reduced-price breakfasts and lunches, SISD has the highest participation at lunch and the lowest at breakfast. Since 1995-96, participation in free and reduced meals has steadily declined.
Exhibit 6-2 Smithville and Peer District
Average Daily Participation Rates for All Students 1995-96 through 1999-2000
1995-96 1996-97 1997-98 1998-99 1999-2000
District Breakfast Lunch Breakfast Lunch Breakfast Lunch Breakfast Lunch Breakfast Lunch
Bastrop 20% 47% 21% 45% 21% 47% 21% 48% 22% 54%
Columbus 14% 62% 15% 69% 15% 65% 14% 62% 13% 67%
Giddings 23% 67% 22% 63% 24% 68% 29% 71% 30% 69%
LaGrange 14% 68% 13% 67% 12% 68% 14% 69% 14% 70%
Smithville 16% 47% 17% 47% 24% 45% 23% 48% 24% 51%
Source: Texas Child Nutrition Programs District Profiles.
Exhibit 6-3 Smithville and Peer District
Average Free and Reduced-price Meal Daily Participation Rates
1995-96 through 1999-2000
1995-96 1996-97 1997-98 1998-99 1999-2000
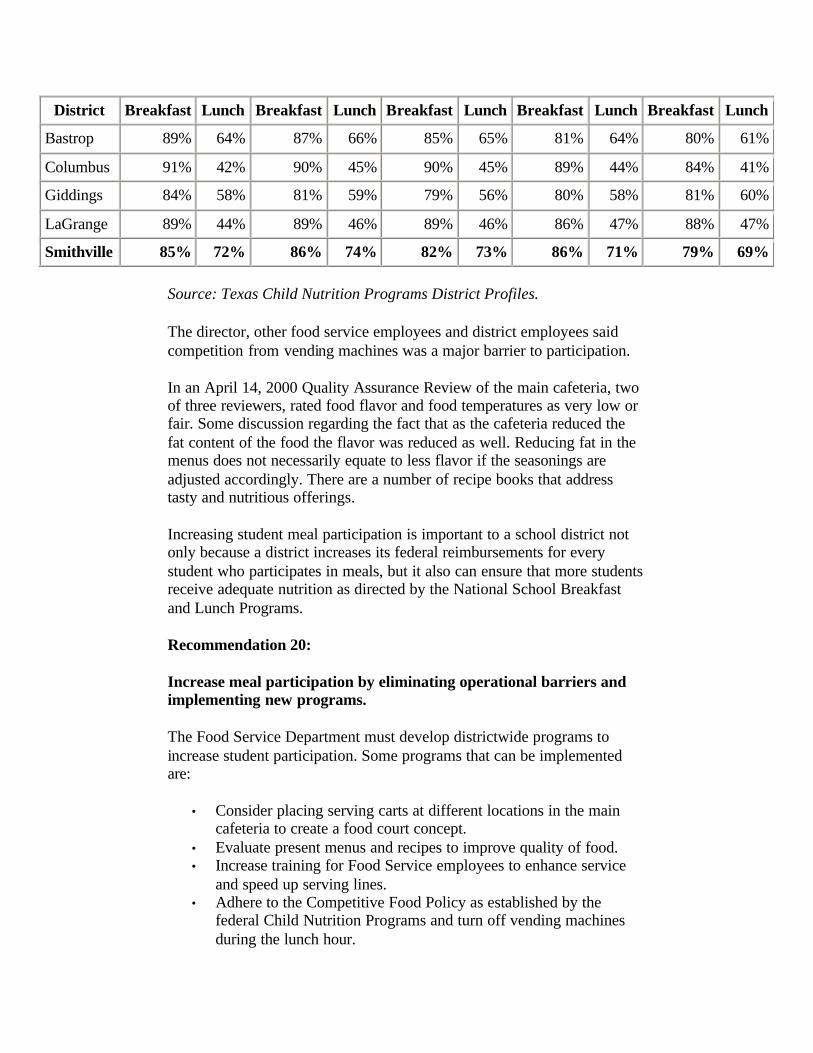
District Breakfast Lunch Breakfast Lunch Breakfast Lunch Breakfast Lunch Breakfast Lunch
Bastrop 89% 64% 87% 66% 85% 65% 81% 64% 80% 61%
Columbus 91% 42% 90% 45% 90% 45% 89% 44% 84% 41%
Giddings 84% 58% 81% 59% 79% 56% 80% 58% 81% 60%
LaGrange 89% 44% 89% 46% 89% 46% 86% 47% 88% 47%
Smithville 85% 72% 86% 74% 82% 73% 86% 71% 79% 69%
Source: Texas Child Nutrition Programs District Profiles.
The director, other food service employees and district employees said competition from vending machines was a major barrier to participation.
In an April 14, 2000 Quality Assurance Review of the main cafeteria, two of three reviewers, rated food flavor and food temperatures as very low or fair. Some discussion regarding the fact that as the cafeteria reduced the fat content of the food the flavor was reduced as well. Reducing fat in the menus does not necessarily equate to less flavor if the seasonings are adjusted accordingly. There are a number of recipe books that address tasty and nutritious offerings.
Increasing student meal participation is important to a school district not only because a district increases its federal reimbursements for every student who participates in meals, but it also can ensure that more students receive adequate nutrition as directed by the National School Breakfast and Lunch Programs.
Recommendation 20:
Increase meal participation by eliminating operational barriers and implementing new programs.
The Food Service Department must develop districtwide programs to increase student participation. Some programs that can be implemented are:
• Consider placing serving carts at different locations in the main cafeteria to create a food court concept.
• Evaluate present menus and recipes to improve quality of food. • Increase training for Food Service employees to enhance service
and speed up serving lines. • Adhere to the Competitive Food Policy as established by the
federal Child Nutrition Programs and turn off vending machines during the lunch hour.
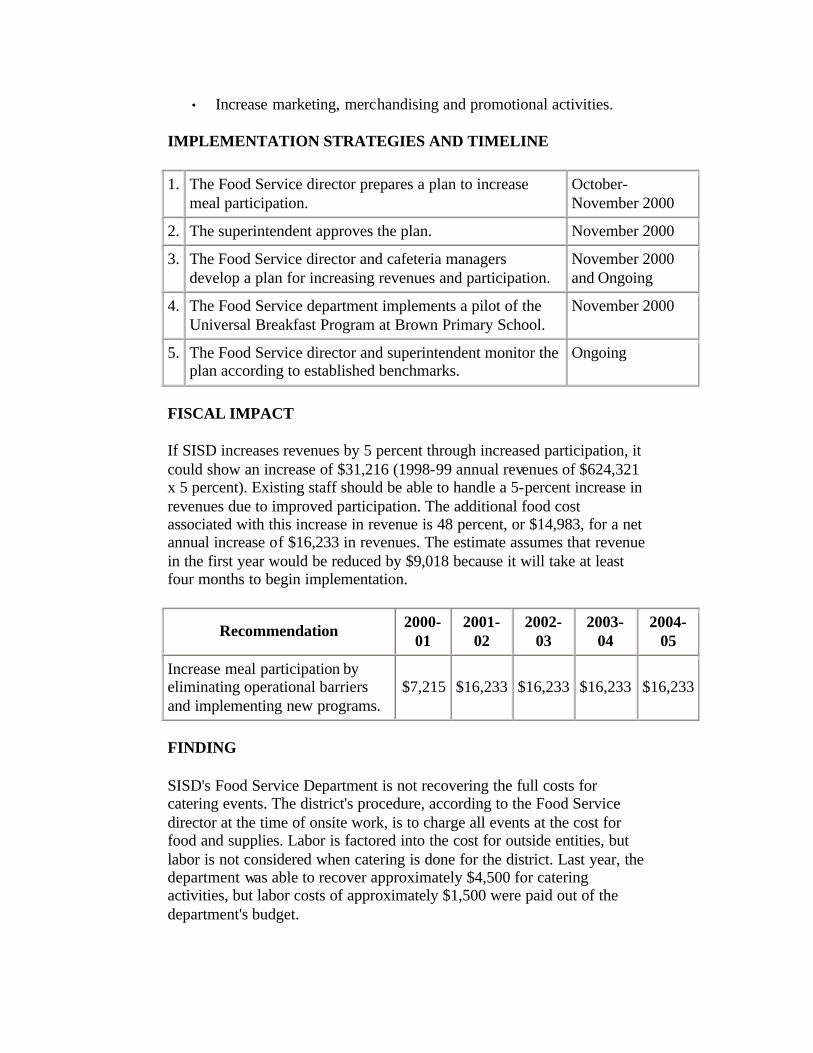
• Increase marketing, merchandising and promotional activities.
IMPLEMENTATION STRATEGIES AND TIMELINE
1. The Food Service director prepares a plan to increase meal participation.
October- November 2000
2. The superintendent approves the plan. November 2000
3. The Food Service director and cafeteria managers develop a plan for increasing revenues and participation.
November 2000 and Ongoing
4. The Food Service department implements a pilot of the Universal Breakfast Program at Brown Primary School.
November 2000
5. The Food Service director and superintendent monitor the plan according to established benchmarks.
Ongoing
FISCAL IMPACT
If SISD increases revenues by 5 percent through increased participation, it could show an increase of $31,216 (1998-99 annual revenues of $624,321 x 5 percent). Existing staff should be able to handle a 5-percent increase in revenues due to improved participation. The additional food cost associated with this increase in revenue is 48 percent, or $14,983, for a net annual increase of $16,233 in revenues. The estimate assumes that revenue in the first year would be reduced by $9,018 because it will take at least four months to begin implementation.
Recommendation 2000-01
2001-02
2002-03
2003-04
2004-05
Increase meal participation by eliminating operational barriers and implementing new programs.
$7,215 $16,233 $16,233 $16,233 $16,233
FINDING
SISD's Food Service Department is not recovering the full costs for catering events. The district's procedure, according to the Food Service director at the time of onsite work, is to charge all events at the cost for food and supplies. Labor is factored into the cost for outside entities, but labor is not considered when catering is done for the district. Last year, the department was able to recover approximately $4,500 for catering activities, but labor costs of approximately $1,500 were paid out of the department's budget.
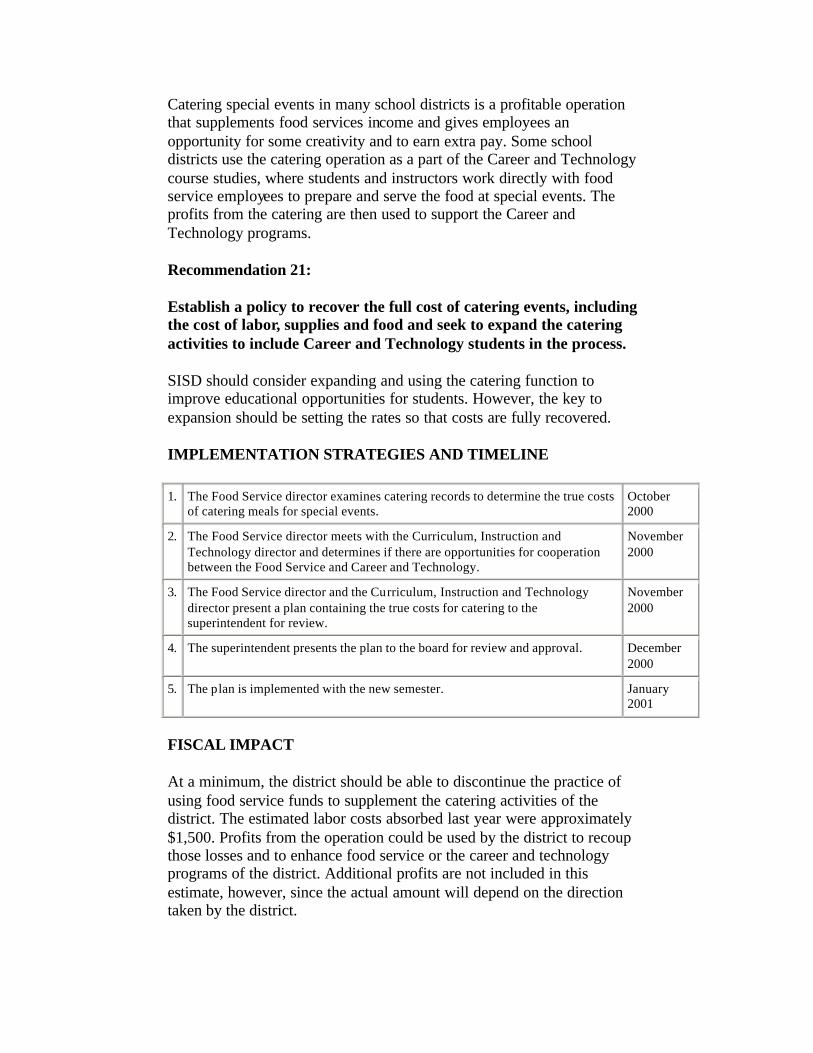
Catering special events in many school districts is a profitable operation that supplements food services income and gives employees an opportunity for some creativity and to earn extra pay. Some school districts use the catering operation as a part of the Career and Technology course studies, where students and instructors work directly with food service employees to prepare and serve the food at special events. The profits from the catering are then used to support the Career and Technology programs.
Recommendation 21:
Establish a policy to recover the full cost of catering events, including the cost of labor, supplies and food and seek to expand the catering activities to include Career and Technology students in the process.
SISD should consider expanding and using the catering function to improve educational opportunities for students. However, the key to expansion should be setting the rates so that costs are fully recovered.
IMPLEMENTATION STRATEGIES AND TIMELINE
1. The Food Service director examines catering records to determine the true costs of catering meals for special events.
October 2000
2. The Food Service director meets with the Curriculum, Instruction and Technology director and determines if there are opportunities for cooperation between the Food Service and Career and Technology.
November 2000
3. The Food Service director and the Curriculum, Instruction and Technology director present a plan containing the true costs for catering to the superintendent for review.
November 2000
4. The superintendent presents the plan to the board for review and approval. December 2000
5. The plan is implemented with the new semester. January 2001
FISCAL IMPACT
At a minimum, the district should be able to discontinue the practice of using food service funds to supplement the catering activities of the district. The estimated labor costs absorbed last year were approximately $1,500. Profits from the operation could be used by the district to recoup those losses and to enhance food service or the career and technology programs of the district. Additional profits are not included in this estimate, however, since the actual amount will depend on the direction taken by the district.
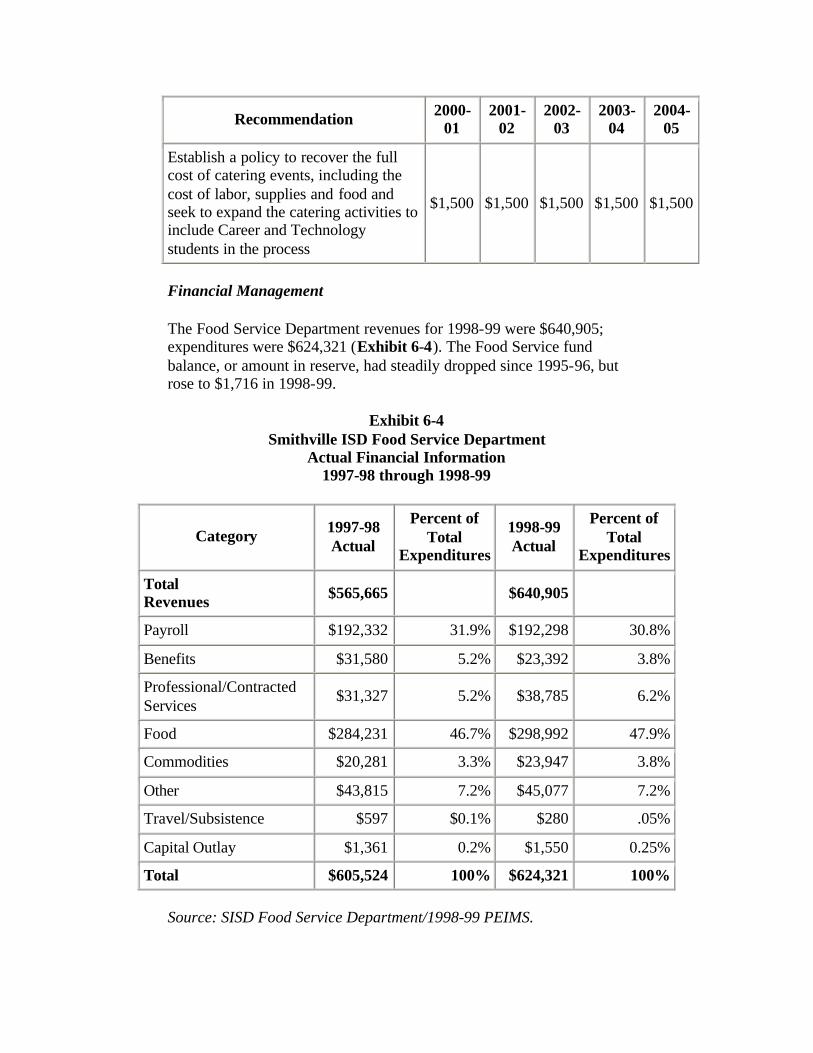
Recommendation 2000-01
2001-02
2002-03
2003-04
2004-05
Establish a policy to recover the full cost of catering events, including the cost of labor, supplies and food and seek to expand the catering activities to include Career and Technology students in the process
$1,500 $1,500 $1,500 $1,500 $1,500
Financial Management
The Food Service Department revenues for 1998-99 were $640,905; expenditures were $624,321 (Exhibit 6-4). The Food Service fund balance, or amount in reserve, had steadily dropped since 1995-96, but rose to $1,716 in 1998-99.
Exhibit 6-4 Smithville ISD Food Service Department
Actual Financial Information 1997-98 through 1998-99
Category 1997-98 Actual
Percent of Total
Expenditures
1998-99 Actual
Percent of Total
Expenditures
Total Revenues $565,665 $640,905
Payroll $192,332 31.9% $192,298 30.8%
Benefits $31,580 5.2% $23,392 3.8%
Professional/Contracted Services
$31,327 5.2% $38,785 6.2%
Food $284,231 46.7% $298,992 47.9%
Commodities $20,281 3.3% $23,947 3.8%
Other $43,815 7.2% $45,077 7.2%
Travel/Subsistence $597 $0.1% $280 .05%
Capital Outlay $1,361 0.2% $1,550 0.25%
Total $605,524 100% $624,321 100%
Source: SISD Food Service Department/1998-99 PEIMS.
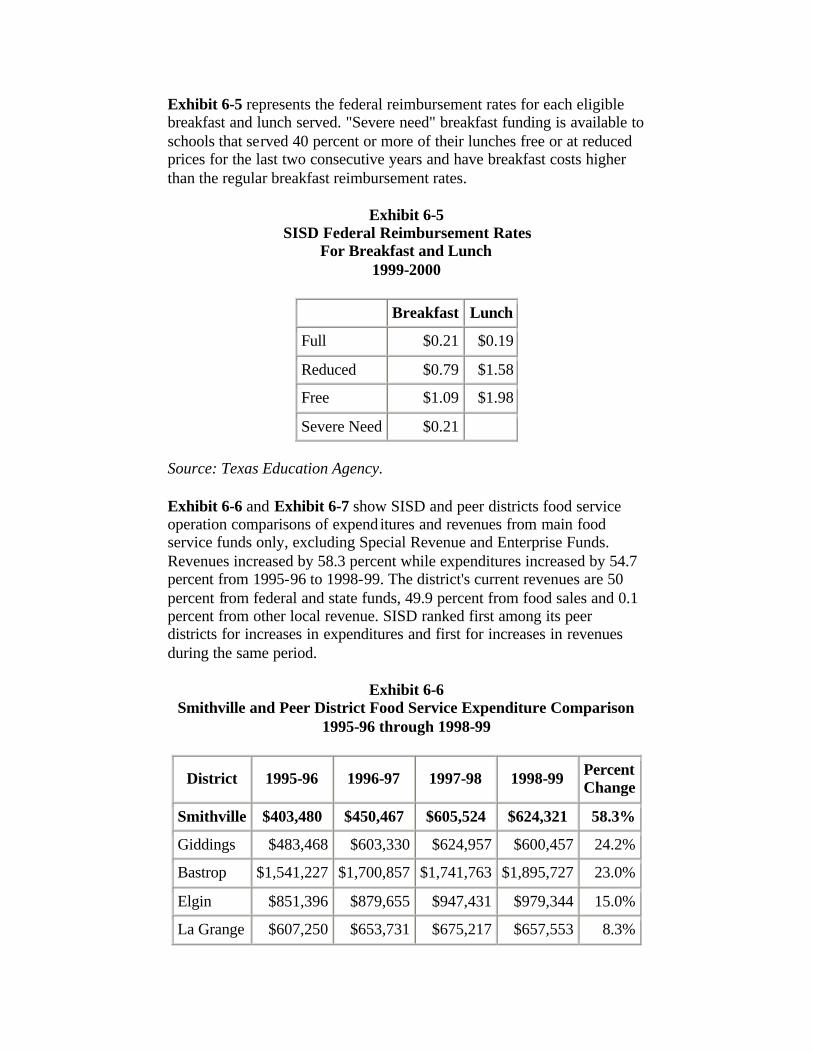
Exhibit 6-5 represents the federal reimbursement rates for each eligible breakfast and lunch served. "Severe need" breakfast funding is available to schools that served 40 percent or more of their lunches free or at reduced prices for the last two consecutive years and have breakfast costs higher than the regular breakfast reimbursement rates.
Exhibit 6-5 SISD Federal Reimbursement Rates
For Breakfast and Lunch 1999-2000
Breakfast Lunch
Full $0.21 $0.19
Reduced $0.79 $1.58
Free $1.09 $1.98
Severe Need $0.21
Source: Texas Education Agency.
Exhibit 6-6 and Exhibit 6-7 show SISD and peer districts food service operation comparisons of expend itures and revenues from main food service funds only, excluding Special Revenue and Enterprise Funds. Revenues increased by 58.3 percent while expenditures increased by 54.7 percent from 1995-96 to 1998-99. The district's current revenues are 50 percent from federal and state funds, 49.9 percent from food sales and 0.1 percent from other local revenue. SISD ranked first among its peer districts for increases in expenditures and first for increases in revenues during the same period.
Exhibit 6-6 Smithville and Peer District Food Service Expenditure Comparison
1995-96 through 1998-99
District 1995-96 1996-97 1997-98 1998-99 Percent Change
Smithville $403,480 $450,467 $605,524 $624,321 58.3%
Giddings $483,468 $603,330 $624,957 $600,457 24.2%
Bastrop $1,541,227 $1,700,857 $1,741,763 $1,895,727 23.0%
Elgin $851,396 $879,655 $947,431 $979,344 15.0%
La Grange $607,250 $653,731 $675,217 $657,553 8.3%

Columbus $426,197 $428,307 $461,859 $455,514 6.9%
Source: Texas Education Agency 1999.
Exhibit 6-7 SISD and Peer District Food Service Revenue Comparison
1995-96 through 1998-99
District 1995-96 1996-97 1997-98 1998-99 Percent Change
Smithville $404,827 $449,323 $565,685 $640,905 58.3%
Bastrop $1,477,779 $1,711,423 $1,774,098 $1,991,276 34.7%
Giddings $464,771 $505,643 $575,611 $609,105 31.1%
Elgin $840,971 $902,701 $945,001 $1,022,687 21.6%
Columbus $419,994 $455,204 $472,226 $470,859 12.1%
La Grange $623,576 $640,550 $668,361 $684,467 9.8%
Source: Texas Education Agency 1999.
As shown in Exhibits 9-6 and 9-7, revenues exceeded expenditures in 1998-99 for the first time since 1995-96. Preliminary data for 1999-2000 indicates that expenditures will exceed revenues by as much as $30,000. SISD ranked third among peer districts for expenses per student as shown in Exhibit 6-8.
Exhibit 6-8 SISD and Peer District Expenses per Student
1995-96 through 1998-99
District 1995-96 1996-97 1997-98 1998-99 Percent Change
Smithville $224.91 $251.10 $337.53 $348.01 54.7%
Bastrop $276.84 $309.82 $307.74 $340.74 23.1%
Giddings $275.79 $356.65 $380.89 $391.80 42.1%
Elgin $333.75 $343.75 $362.86 $371.67 11.4%
Columbus $251.74 $252.54 $276.68 $266.23 11.4%
Source: Texas Education Agency 1999.

SISD's 1999-2000 meal costs are presented in Exhibit 6-9.
Exhibit 6-9 SISD Food Service Department 1999-2000 Meal Costs
Meal School Level Service Price
Student Regular $0.75
Student Reduced-Price $0.30 Elementary
Adult $1.25
Student Regular $0.75
Student Reduced-Price $0.30
Breakfast
Secondary
Adult $1.25
Student Regular $1.35
Student Reduced-Price $0.40 Elementary
Adult $2.20
Student Regular $1.50
Student Reduced-Price $0.40
Lunch
Secondary
Adult $2.20
Source: SISD Food Service Department.
FINDING
The district does not develop necessary financial management information to be used in managing the food service programs at the district level and at the two cafeterias.
Exhibit 6-10 shows the components that the review team used to evaluate the district's food services financial management reporting, and explains the components' value and the extent to which the district is using the process. The director uses five of the seven reports, but only distributes one of the reports to the cafeteria managers.
Exhibit 6-10 Financial and Management Reporting Evaluation
Report/ Uses Optimal Used Distributed
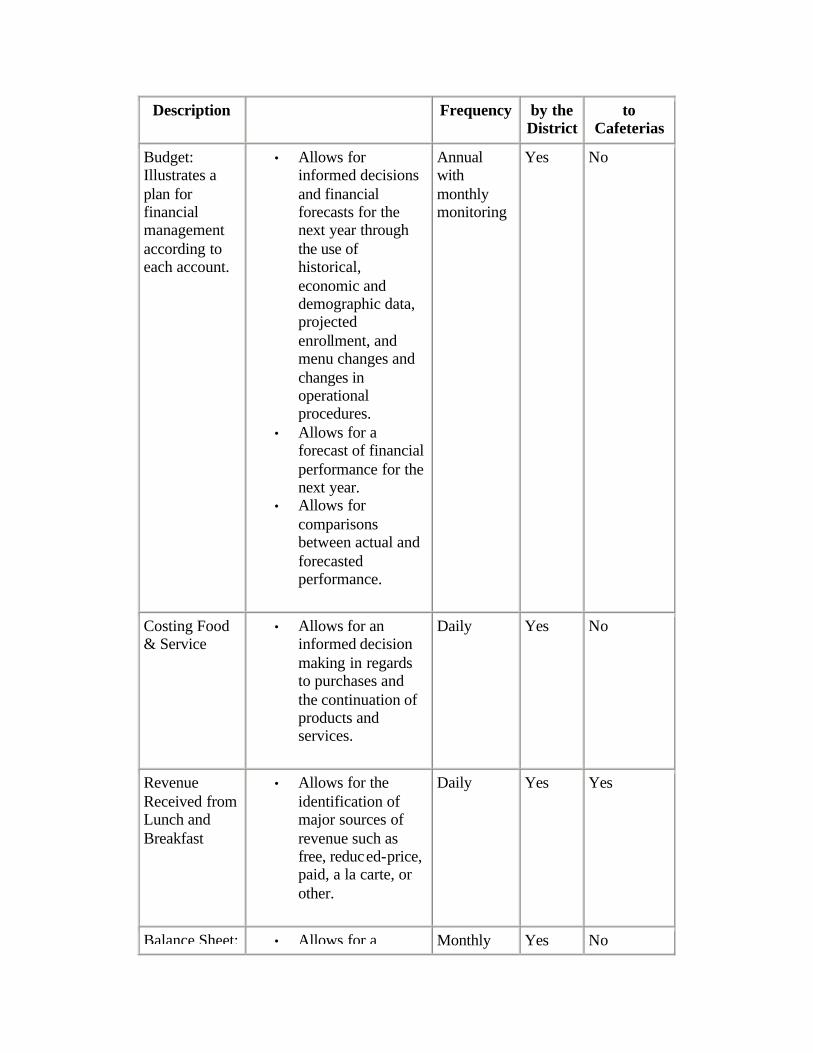
Description Frequency by the District
to Cafeterias
Budget: Illustrates a plan for financial management according to each account.
• Allows for informed decisions and financial forecasts for the next year through the use of historical, economic and demographic data, projected enrollment, and menu changes and changes in operational procedures.
• Allows for a forecast of financial performance for the next year.
• Allows for comparisons between actual and forecasted performance.
Annual with monthly monitoring
Yes No
Costing Food & Service
• Allows for an informed decision making in regards to purchases and the continuation of products and services.
Daily Yes No
Revenue Received from Lunch and Breakfast
• Allows for the identification of major sources of revenue such as free, reduced-price, paid, a la carte, or other.
Daily Yes Yes
Balance Sheet: • Allows for a Monthly Yes No
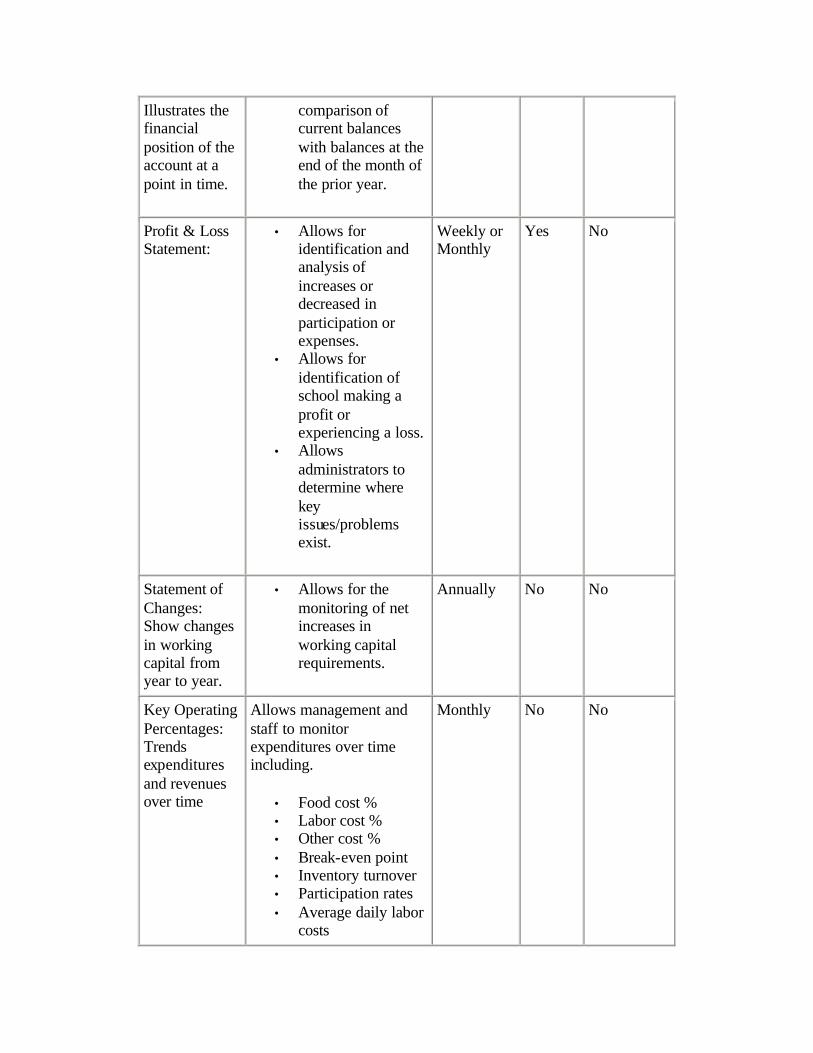
Illustrates the financial position of the account at a point in time.
comparison of current balances with balances at the end of the month of the prior year.
Profit & Loss Statement:
• Allows for identification and analysis of increases or decreased in participation or expenses.
• Allows for identification of school making a profit or experiencing a loss.
• Allows administrators to determine where key issues/problems exist.
Weekly or Monthly
Yes No
Statement of Changes: Show changes in working capital from year to year.
• Allows for the monitoring of net increases in working capital requirements.
Annually No No
Key Operating Percentages: Trends expenditures and revenues over time
Allows management and staff to monitor expenditures over time including.
• Food cost % • Labor cost % • Other cost % • Break-even point • Inventory turnover • Participation rates • Average daily labor
costs
Monthly No No
• Average hourly labor costs
Source: TSPR; SISD.
Recommendation 22:
Develop and implement accurate, detailed and timely department budgeting and financial reporting systems that integrate with, and are supported by, the district's financial management system.
Food Service should be self-supporting, and revenue and expenditure reports must be available and accurate for the director and managers to use. All available financial reports should be distributed to the managers and the managers should be trained to analyze and use the data. Food costing should be addressed immediately so that accurate pricing of menu items can be accomplished.
TSFSA's Standards and Excellence manual recommends procedures that could be used in reporting school food service financial information.
IMPLEMENTATION STRATEGIES AND TIMELINE
1. The Food Service director and the Business and Finance director develop a standardized budget format.
December 2000
2. The Food Service director uses the recommended procedures for reporting financial information as outlined in the TSFSA Standards for Excellence.
January 2001
3. The Business and Finance director generates timely and accurate reports to the Food Service director.
February 2001
4. The Food Service director trains the cafeteria managers to use the financial information and begin holding them accountable for variances.
February 2001 and Ongoing
FISCAL IMPACT
This recommendation could be implemented with existing resources.
FINDING
The Food Service director does not use a standardized measurement to evaluate productivity.
The most common measure used by a school district to evaluate its productivity for school food service operations is meals per labor hour (MPLH). The productivity rate can be calculated by dividing the number
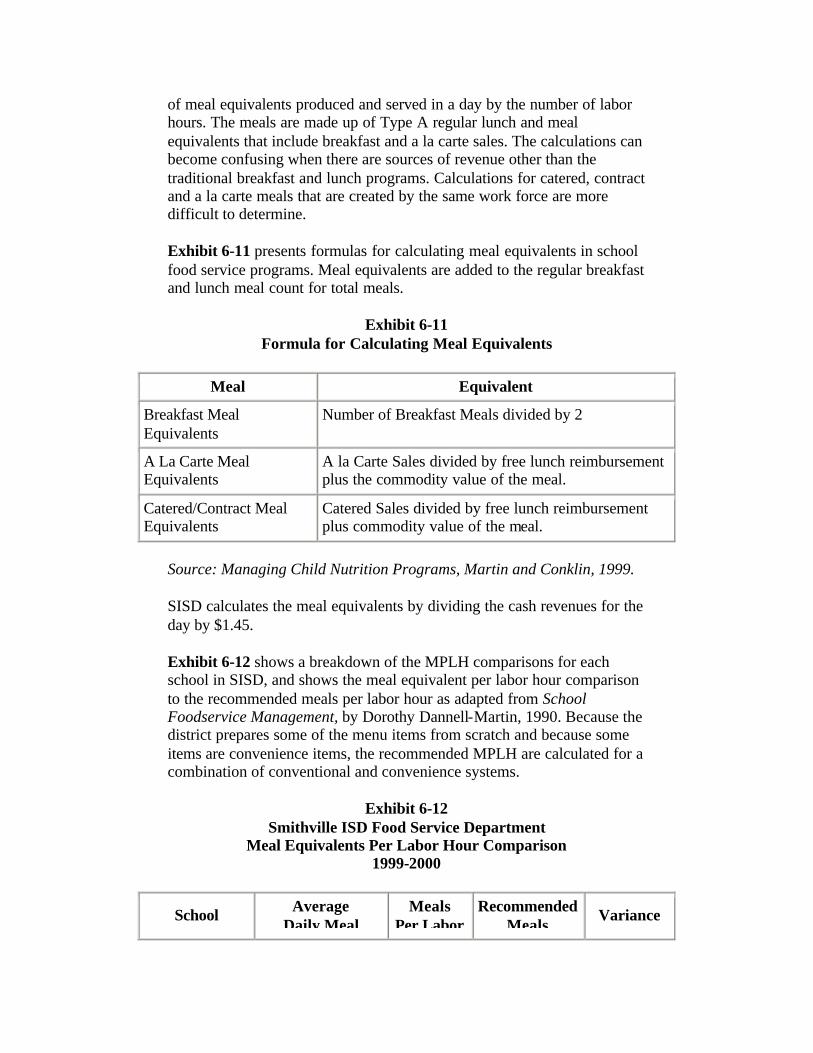
of meal equivalents produced and served in a day by the number of labor hours. The meals are made up of Type A regular lunch and meal equivalents that include breakfast and a la carte sales. The calculations can become confusing when there are sources of revenue other than the traditional breakfast and lunch programs. Calculations for catered, contract and a la carte meals that are created by the same work force are more difficult to determine.
Exhibit 6-11 presents formulas for calculating meal equivalents in school food service programs. Meal equivalents are added to the regular breakfast and lunch meal count for total meals.
Exhibit 6-11 Formula for Calculating Meal Equivalents
Meal Equivalent
Breakfast Meal Equivalents
Number of Breakfast Meals divided by 2
A La Carte Meal Equivalents
A la Carte Sales divided by free lunch reimbursement plus the commodity value of the meal.
Catered/Contract Meal Equivalents
Catered Sales divided by free lunch reimbursement plus commodity value of the meal.
Source: Managing Child Nutrition Programs, Martin and Conklin, 1999.
SISD calculates the meal equivalents by dividing the cash revenues for the day by $1.45.
Exhibit 6-12 shows a breakdown of the MPLH comparisons for each school in SISD, and shows the meal equivalent per labor hour comparison to the recommended meals per labor hour as adapted from School Foodservice Management, by Dorothy Dannell-Martin, 1990. Because the district prepares some of the menu items from scratch and because some items are convenience items, the recommended MPLH are calculated for a combination of conventional and convenience systems.
Exhibit 6-12 Smithville ISD Food Service Department
Meal Equivalents Per Labor Hour Comparison 1999-2000
School Average Daily Meal
Meals Per Labor
Recommended Meals
Variance
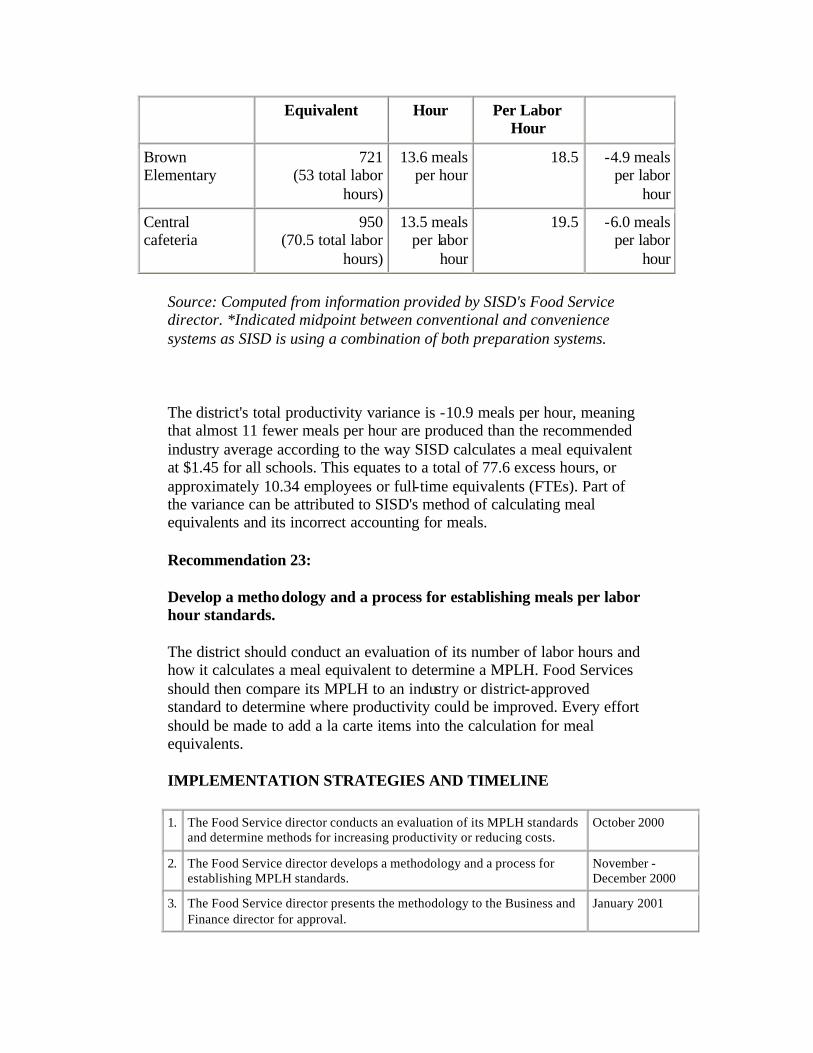
Equivalent Hour Per Labor Hour
Brown Elementary
721 (53 total labor
hours)
13.6 meals per hour
18.5 -4.9 meals per labor
hour
Central cafeteria
950 (70.5 total labor
hours)
13.5 meals per labor
hour
19.5 -6.0 meals per labor
hour
Source: Computed from information provided by SISD's Food Service director. *Indicated midpoint between conventional and convenience systems as SISD is using a combination of both preparation systems.
The district's total productivity variance is -10.9 meals per hour, meaning that almost 11 fewer meals per hour are produced than the recommended industry average according to the way SISD calculates a meal equivalent at $1.45 for all schools. This equates to a total of 77.6 excess hours, or approximately 10.34 employees or full-time equivalents (FTEs). Part of the variance can be attributed to SISD's method of calculating meal equivalents and its incorrect accounting for meals.
Recommendation 23:
Develop a methodology and a process for establishing meals per labor hour standards.
The district should conduct an evaluation of its number of labor hours and how it calculates a meal equivalent to determine a MPLH. Food Services should then compare its MPLH to an industry or district-approved standard to determine where productivity could be improved. Every effort should be made to add a la carte items into the calculation for meal equivalents.
IMPLEMENTATION STRATEGIES AND TIMELINE
1. The Food Service director conducts an evaluation of its MPLH standards and determine methods for increasing productivity or reducing costs.
October 2000
2. The Food Service director develops a methodology and a process for establishing MPLH standards.
November - December 2000
3. The Food Service director presents the methodology to the Business and Finance director for approval.
January 2001
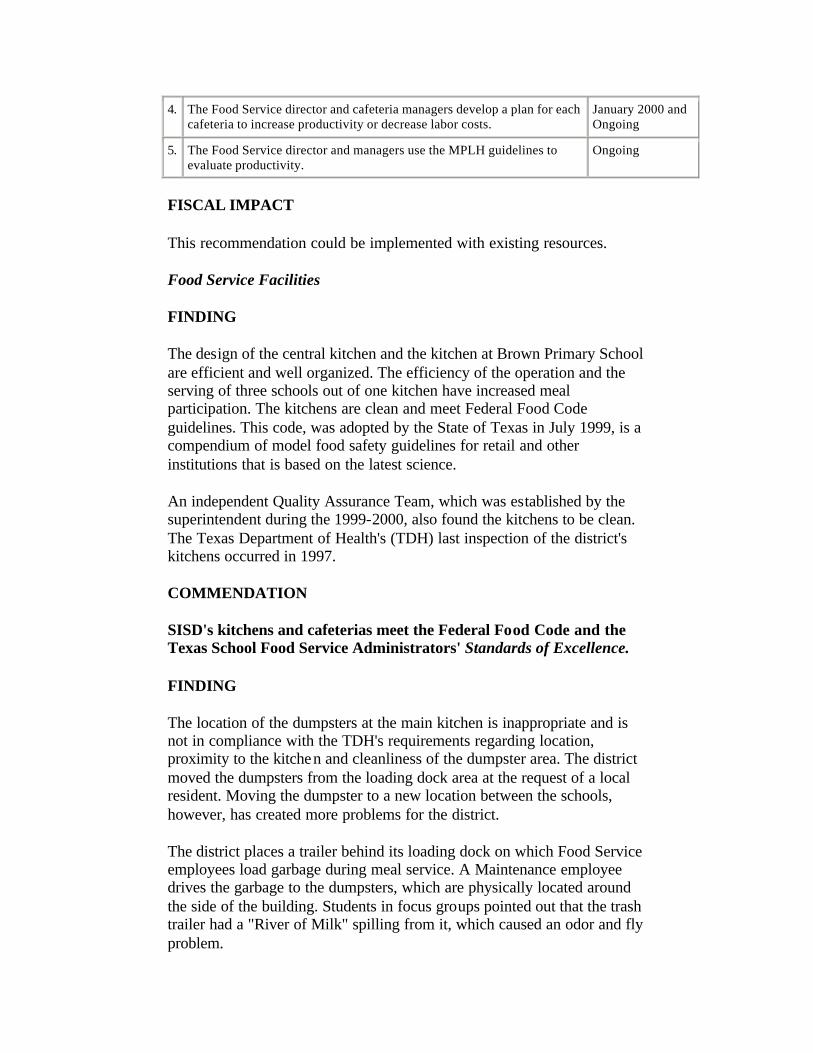
4. The Food Service director and cafeteria managers develop a plan for each cafeteria to increase productivity or decrease labor costs.
January 2000 and Ongoing
5. The Food Service director and managers use the MPLH guidelines to evaluate productivity.
Ongoing
FISCAL IMPACT
This recommendation could be implemented with existing resources.
Food Service Facilities
FINDING
The design of the central kitchen and the kitchen at Brown Primary School are efficient and well organized. The efficiency of the operation and the serving of three schools out of one kitchen have increased meal participation. The kitchens are clean and meet Federal Food Code guidelines. This code, was adopted by the State of Texas in July 1999, is a compendium of model food safety guidelines for retail and other institutions that is based on the latest science.
An independent Quality Assurance Team, which was established by the superintendent during the 1999-2000, also found the kitchens to be clean. The Texas Department of Health's (TDH) last inspection of the district's kitchens occurred in 1997.
COMMENDATION
SISD's kitchens and cafeterias meet the Federal Food Code and the Texas School Food Service Administrators' Standards of Excellence.
FINDING
The location of the dumpsters at the main kitchen is inappropriate and is not in compliance with the TDH's requirements regarding location, proximity to the kitchen and cleanliness of the dumpster area. The district moved the dumpsters from the loading dock area at the request of a local resident. Moving the dumpster to a new location between the schools, however, has created more problems for the district.
The district places a trailer behind its loading dock on which Food Service employees load garbage during meal service. A Maintenance employee drives the garbage to the dumpsters, which are physically located around the side of the building. Students in focus groups pointed out that the trash trailer had a "River of Milk" spilling from it, which caused an odor and fly problem.
Some school districts have addressed the problem of unsightly dumpsters by constructing a higher privacy fence around them so that they are not easily visible unless they are being emptied, or have arranged for the dumpster to be emptied more frequently. The district previously had a fence in front of the dumpster when it was in the loading dock area.
Recommendation 24:
Relocate the dumpsters according to health code guidelines, and eliminate unnecessary employee time in transporting and handling of garbage.
TDH has requirements about the location, type, cleanliness and proximity of the dumpsters to a kitchen facility.
IMPLEMENTATION STRATEGIES AND TIMELINES
1. The directors of Food Service and Maintenance and Transportation develop a plan for the disposal of garbage to meet all health codes and address neighborhood concerns.
September 2000
2. The superintendent approves the plan and the directors of Food Service and Maintenance and Transportation implement the plan.
October 2000 and Ongoing
FISCAL IMPACT
This recommendation could be implemented with existing resources. Should the district decide to construct a higher fence around the dumpster area, the cost of materials should not exceed $500 and the labor should be done by Maintenance personnel.
Recommendation 2000-01
2001-02
2002-03
2003-04
2004-05
Relocate the dumpsters according to health code guidelines, and eliminate unnecessary employee time in transporting and handling of garbage.
($500) $0 $0 $0 $0
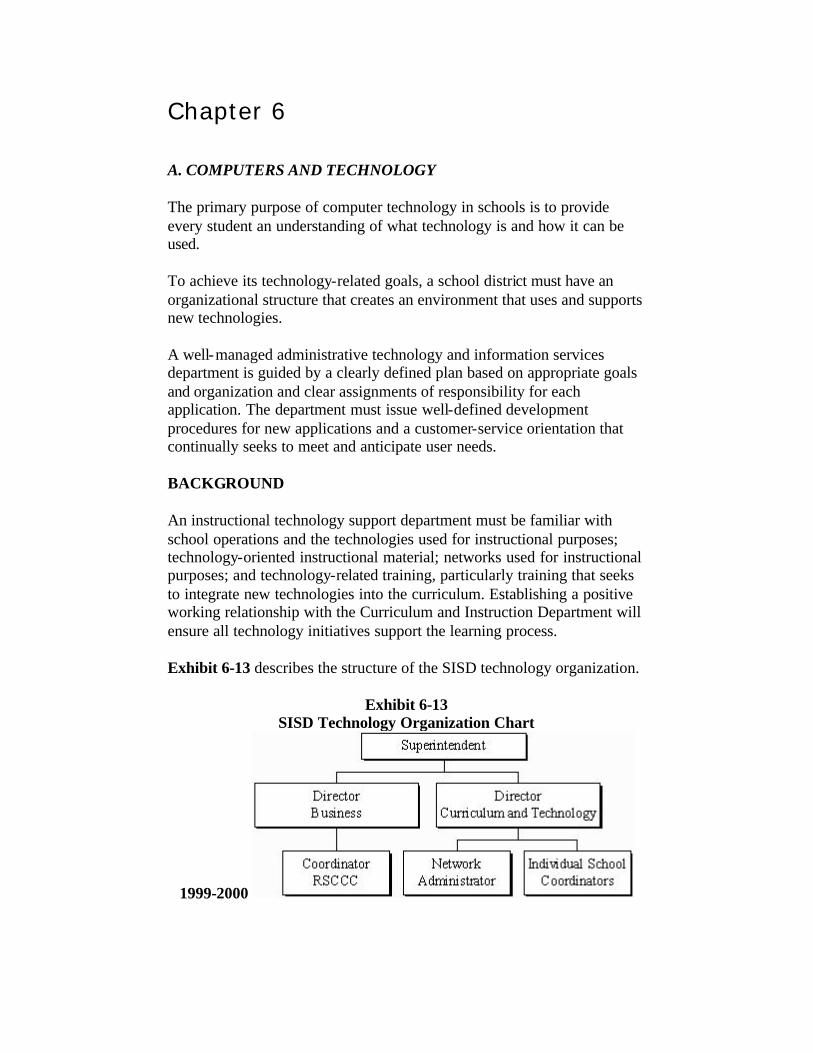
Chapter 6
A. COMPUTERS AND TECHNOLOGY
The primary purpose of computer technology in schools is to provide every student an understanding of what technology is and how it can be used.
To achieve its technology-related goals, a school district must have an organizational structure that creates an environment that uses and supports new technologies.
A well-managed administrative technology and information services department is guided by a clearly defined plan based on appropriate goals and organization and clear assignments of responsibility for each application. The department must issue well-defined development procedures for new applications and a customer-service orientation that continually seeks to meet and anticipate user needs.
BACKGROUND
An instructional technology support department must be familiar with school operations and the technologies used for instructional purposes; technology-oriented instructional material; networks used for instructional purposes; and technology-related training, particularly training that seeks to integrate new technologies into the curriculum. Establishing a positive working relationship with the Curriculum and Instruction Department will ensure all technology initiatives support the learning process.
Exhibit 6-13 describes the structure of the SISD technology organization.
Exhibit 6-13 SISD Technology Organization Chart
1999-2000

Source: SISD superintendent.
The primary responsibilities of the director of Curriculum and Technology include technology instruction, staff development and integrating technology into the classroom. The school technology coordinators work directly with teachers and staff in technology training.
Exhibit 6-14 liststhe technology expenditures for SISD.
Exhibit 6-14 SISD Technology Expenditures
1996-97 to 1999-2000
Function 1996-97 1997-98 1998-99 1999-2000
Administrative $315,988 $74,524 $53,138 $90,727
Instructional 1,815 102,135 75,283 80,571
Total $317,803 $176,659 $128,421 $171,298
Source: Interview with superintendent.
Exhibit 6-15 lists theSISD technology staffing levels and its peer districts.
Exhibit 6-15 SISD & Peers, Technology Staffing Comparisons
1999-2000
District Administrative Infrastructure and Support Instructional
Smithville Total Staff: 7
1 director of curriculum and technology
1 network administrator
3 campus technology coordinators 2 computer lab managers
Bastrop Total Staff: 10
1 director 1 network services manager 5 computer repair technicians 1 help desk/secretary
2 technology trainers
Elgin Total staff: 3
1 technology coordinator
1 network services manager
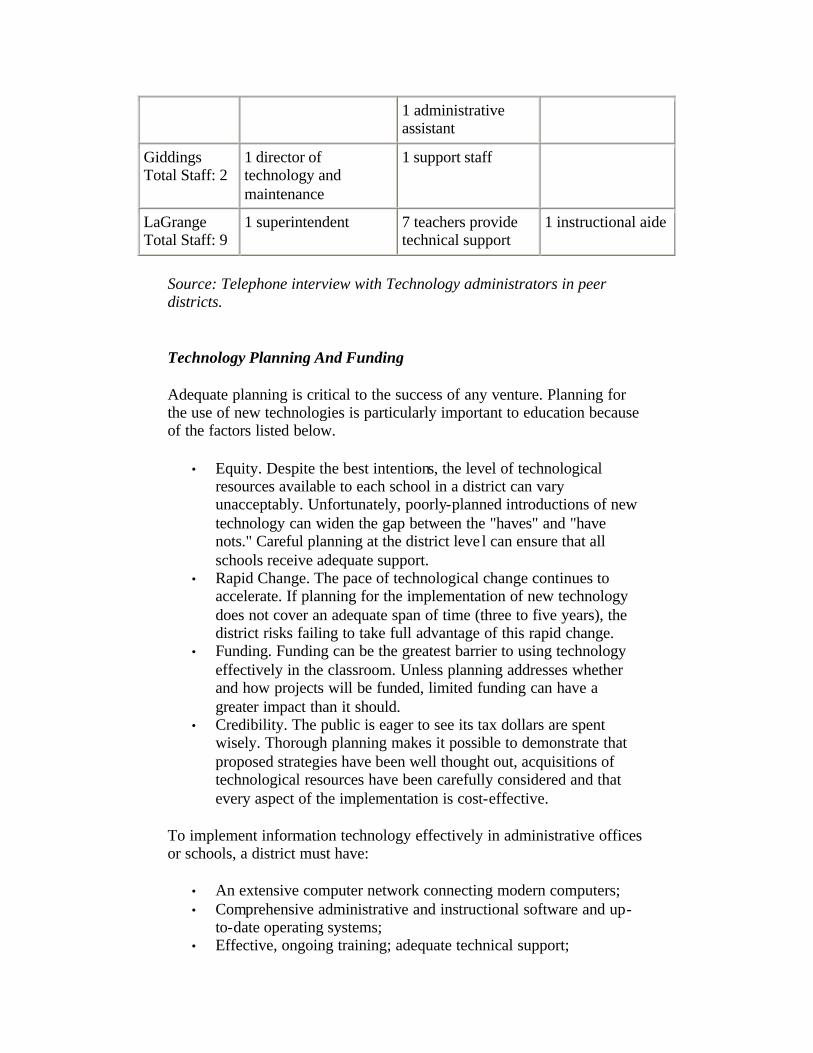
1 administrative assistant
Giddings Total Staff: 2
1 director of technology and maintenance
1 support staff
LaGrange Total Staff: 9
1 superintendent 7 teachers provide technical support
1 instructional aide
Source: Telephone interview with Technology administrators in peer districts.
Technology Planning And Funding
Adequate planning is critical to the success of any venture. Planning for the use of new technologies is particularly important to education because of the factors listed below.
• Equity. Despite the best intentions, the level of technological resources available to each school in a district can vary unacceptably. Unfortunately, poorly-planned introductions of new technology can widen the gap between the "haves" and "have nots." Careful planning at the district leve l can ensure that all schools receive adequate support.
• Rapid Change. The pace of technological change continues to accelerate. If planning for the implementation of new technology does not cover an adequate span of time (three to five years), the district risks failing to take full advantage of this rapid change.
• Funding. Funding can be the greatest barrier to using technology effectively in the classroom. Unless planning addresses whether and how projects will be funded, limited funding can have a greater impact than it should.
• Credibility. The public is eager to see its tax dollars are spent wisely. Thorough planning makes it possible to demonstrate that proposed strategies have been well thought out, acquisitions of technological resources have been carefully considered and that every aspect of the implementation is cost-effective.
To implement information technology effectively in administrative offices or schools, a district must have:
• An extensive computer network connecting modern computers; • Comprehensive administrative and instructional software and up-
to-date operating systems; • Effective, ongoing training; adequate technical support;
• A professional staff capable of implementing and administering a technology-rich environment; and
• A means to provide the community access to school information through technology.
FINDING
SISD has been working on technology planning since 1992. The district technology plan was rewritten in 1996 and 1998 and is now reviewed and revised annually. The district has also evaluated the current status of technology within the school district and identified four long-range goals:
• expanding the infrastructure, hardware and software of technology within the schools;
• developing district staff's technology skills and proficiencies; • integrating technology into teaching and learning in all areas of the
curriculum; • building community, citizen, business and parent support of
technology within the school district and addresses funding issues.
After several unsuccessful attempts to obtain grant funding to implement the long-range technology plan, the school district borrowed $400,000 in the fall of 1996 to make significant improvements in the district's technology system. The district received a $87,000 grant from the Technology Infrastructure Fund (TIF) in January 1999 and has used the funds to wire all permanent classrooms in the district and provide some additional hardware equipment (servers, firewall, data projectors and 17 new classroom computers).
SISD annually conducts a comprehensive assessment of technology services and technology integration into instructional programs to monitor the status of the district's technology initiatives. An annual report on technology is generated and made available to all stakeholders, including the SISD board. The technology report includes the current status of technology infrastructure in the district, the current status of technology curriculum in the district, the current status of integrating technology across the curriculum, progress made toward technology goals within the past year and the current status of the technology plan activities.
Exhibit 6-16 describes the goals, objectives, timelines and budget figures for SISD.
Exhibit 6-16 SISD Technology Plan 1999-2000 to 2001-02
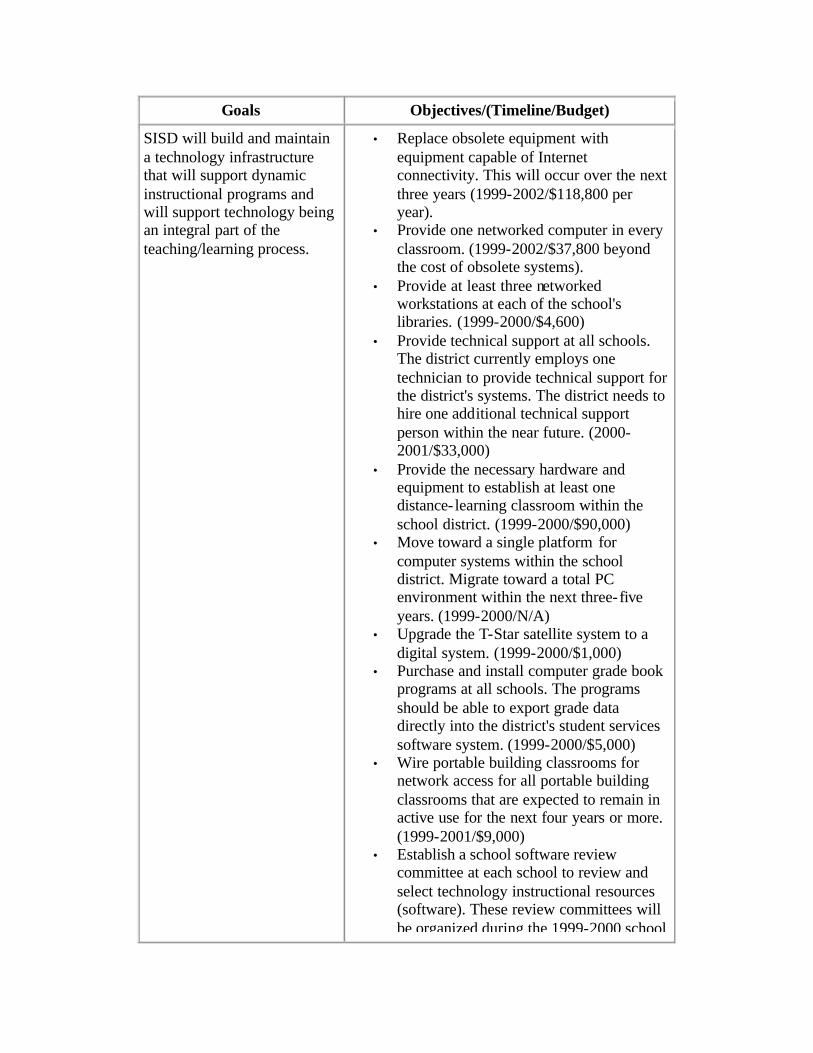
Goals Objectives/(Timeline/Budget)
SISD will build and maintain a technology infrastructure that will support dynamic instructional programs and will support technology being an integral part of the teaching/learning process.
• Replace obsolete equipment with equipment capable of Internet connectivity. This will occur over the next three years (1999-2002/$118,800 per year).
• Provide one networked computer in every classroom. (1999-2002/$37,800 beyond the cost of obsolete systems).
• Provide at least three networked workstations at each of the school's libraries. (1999-2000/$4,600)
• Provide technical support at all schools. The district currently employs one technician to provide technical support for the district's systems. The district needs to hire one additional technical support person within the near future. (2000-2001/$33,000)
• Provide the necessary hardware and equipment to establish at least one distance- learning classroom within the school district. (1999-2000/$90,000)
• Move toward a single platform for computer systems within the school district. Migrate toward a total PC environment within the next three-five years. (1999-2000/N/A)
• Upgrade the T-Star satellite system to a digital system. (1999-2000/$1,000)
• Purchase and install computer grade book programs at all schools. The programs should be able to export grade data directly into the district's student services software system. (1999-2000/$5,000)
• Wire portable building classrooms for network access for all portable building classrooms that are expected to remain in active use for the next four years or more. (1999-2001/$9,000)
• Establish a school software review committee at each school to review and select technology instructional resources (software). These review committees will be organized during the 1999-2000 school
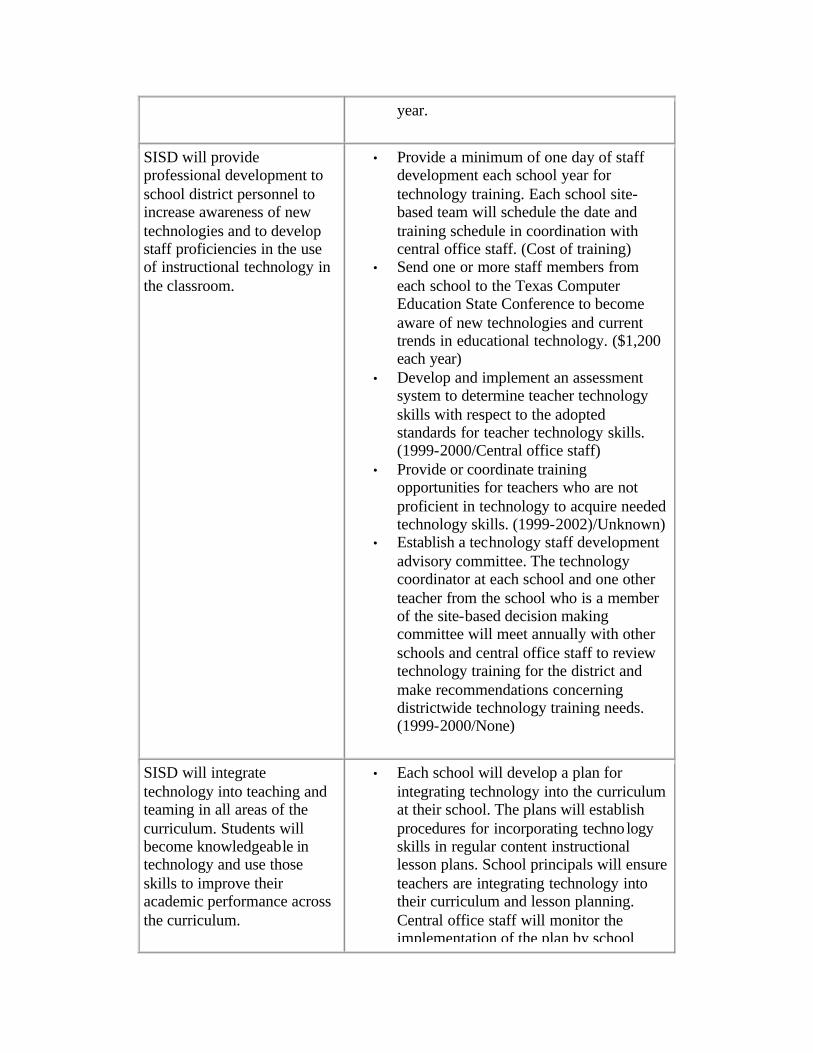
year.
SISD will provide professional development to school district personnel to increase awareness of new technologies and to develop staff proficiencies in the use of instructional technology in the classroom.
• Provide a minimum of one day of staff development each school year for technology training. Each school site-based team will schedule the date and training schedule in coordination with central office staff. (Cost of training)
• Send one or more staff members from each school to the Texas Computer Education State Conference to become aware of new technologies and current trends in educational technology. ($1,200 each year)
• Develop and implement an assessment system to determine teacher technology skills with respect to the adopted standards for teacher technology skills. (1999-2000/Central office staff)
• Provide or coordinate training opportunities for teachers who are not proficient in technology to acquire needed technology skills. (1999-2002)/Unknown)
• Establish a technology staff development advisory committee. The technology coordinator at each school and one other teacher from the school who is a member of the site-based decision making committee will meet annually with other schools and central office staff to review technology training for the district and make recommendations concerning districtwide technology training needs. (1999-2000/None)
SISD will integrate technology into teaching and teaming in all areas of the curriculum. Students will become knowledgeable in technology and use those skills to improve their academic performance across the curriculum.
• Each school will develop a plan for integrating technology into the curriculum at their school. The plans will establish procedures for incorporating techno logy skills in regular content instructional lesson plans. School principals will ensure teachers are integrating technology into their curriculum and lesson planning. Central office staff will monitor the implementation of the plan by school
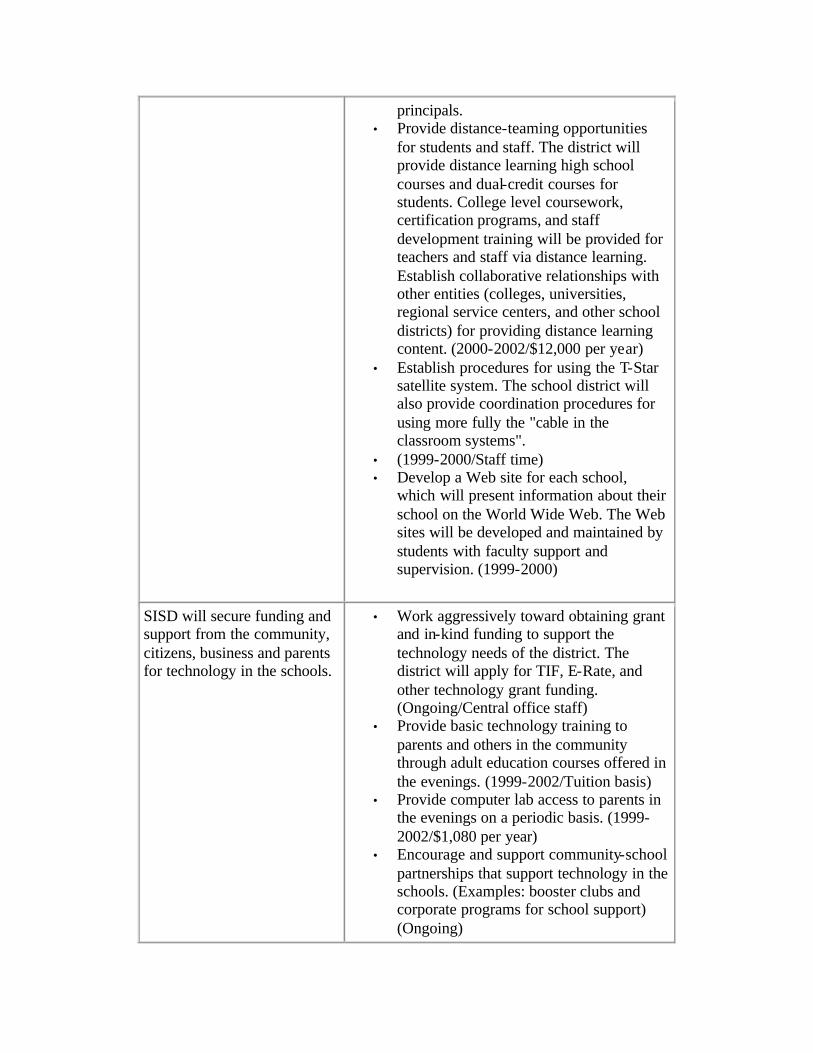
principals. • Provide distance-teaming opportunities
for students and staff. The district will provide distance learning high school courses and dual-credit courses for students. College level coursework, certification programs, and staff development training will be provided for teachers and staff via distance learning. Establish collaborative relationships with other entities (colleges, universities, regional service centers, and other school districts) for providing distance learning content. (2000-2002/$12,000 per year)
• Establish procedures for using the T-Star satellite system. The school district will also provide coordination procedures for using more fully the "cable in the classroom systems".
• (1999-2000/Staff time) • Develop a Web site for each school,
which will present information about their school on the World Wide Web. The Web sites will be developed and maintained by students with faculty support and supervision. (1999-2000)
SISD will secure funding and support from the community, citizens, business and parents for technology in the schools.
• Work aggressively toward obtaining grant and in-kind funding to support the technology needs of the district. The district will apply for TIF, E-Rate, and other technology grant funding. (Ongoing/Central office staff)
• Provide basic technology training to parents and others in the community through adult education courses offered in the evenings. (1999-2002/Tuition basis)
• Provide computer lab access to parents in the evenings on a periodic basis. (1999-2002/$1,080 per year)
• Encourage and support community-school partnerships that support technology in the schools. (Examples: booster clubs and corporate programs for school support) (Ongoing)
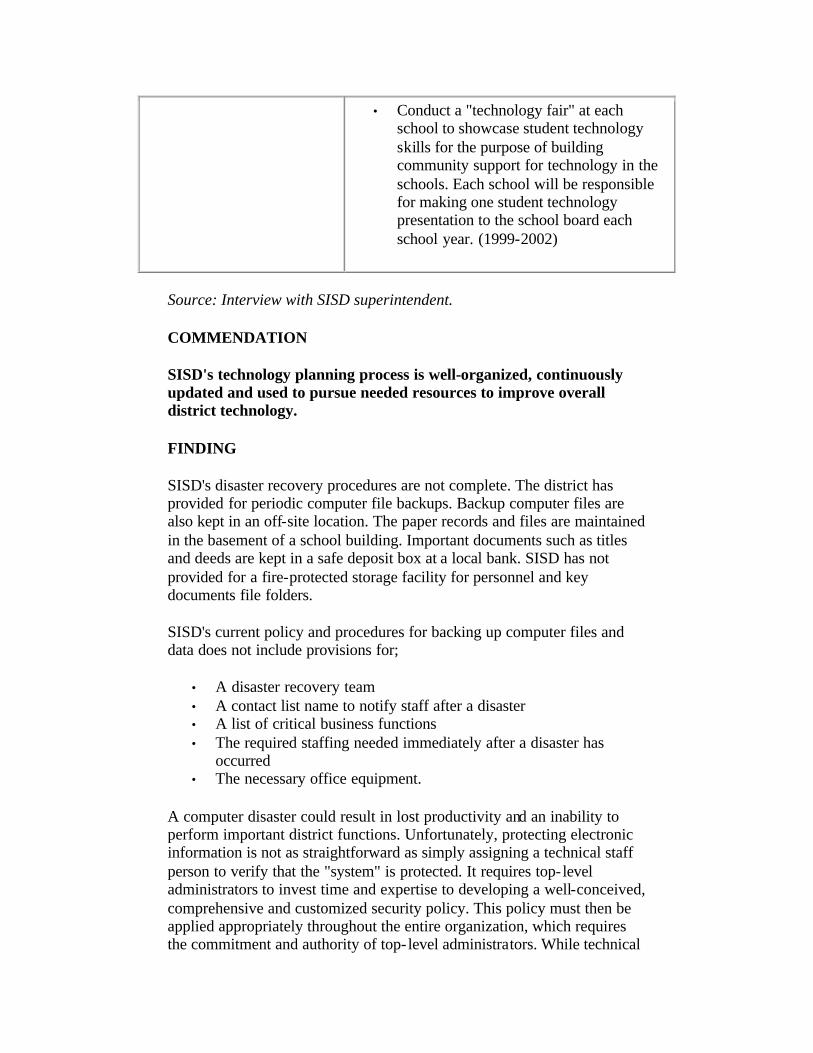
• Conduct a "technology fair" at each school to showcase student technology skills for the purpose of building community support for technology in the schools. Each school will be responsible for making one student technology presentation to the school board each school year. (1999-2002)
Source: Interview with SISD superintendent.
COMMENDATION
SISD's technology planning process is well-organized, continuously updated and used to pursue needed resources to improve overall district technology.
FINDING
SISD's disaster recovery procedures are not complete. The district has provided for periodic computer file backups. Backup computer files are also kept in an off-site location. The paper records and files are maintained in the basement of a school building. Important documents such as titles and deeds are kept in a safe deposit box at a local bank. SISD has not provided for a fire-protected storage facility for personnel and key documents file folders.
SISD's current policy and procedures for backing up computer files and data does not include provisions for;
• A disaster recovery team • A contact list name to notify staff after a disaster • A list of critical business functions • The required staffing needed immediately after a disaster has
occurred • The necessary office equipment.
A computer disaster could result in lost productivity and an inability to perform important district functions. Unfortunately, protecting electronic information is not as straightforward as simply assigning a technical staff person to verify that the "system" is protected. It requires top- level administrators to invest time and expertise to developing a well-conceived, comprehensive and customized security policy. This policy must then be applied appropriately throughout the entire organization, which requires the commitment and authority of top- level administrators. While technical
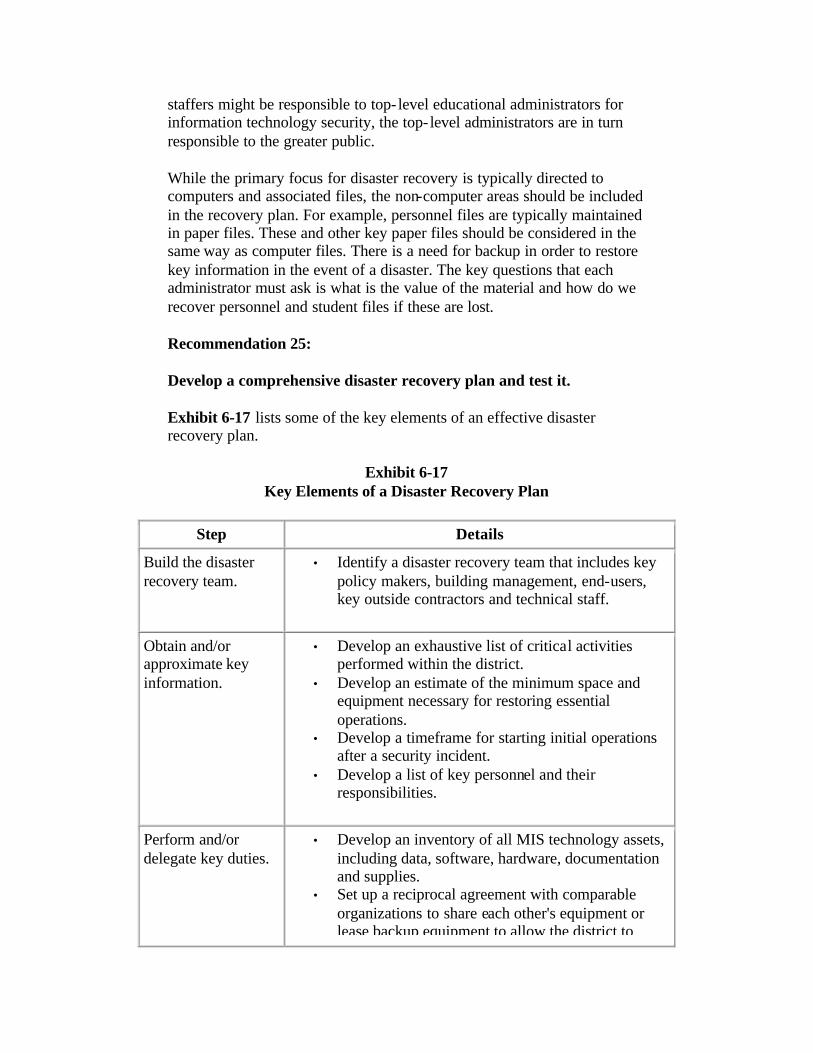
staffers might be responsible to top- level educational administrators for information technology security, the top- level administrators are in turn responsible to the greater public.
While the primary focus for disaster recovery is typically directed to computers and associated files, the non-computer areas should be included in the recovery plan. For example, personnel files are typically maintained in paper files. These and other key paper files should be considered in the same way as computer files. There is a need for backup in order to restore key information in the event of a disaster. The key questions that each administrator must ask is what is the value of the material and how do we recover personnel and student files if these are lost.
Recommendation 25:
Develop a comprehensive disaster recovery plan and test it.
Exhibit 6-17 lists some of the key elements of an effective disaster recovery plan.
Exhibit 6-17 Key Elements of a Disaster Recovery Plan
Step Details
Build the disaster recovery team.
• Identify a disaster recovery team that includes key policy makers, building management, end-users, key outside contractors and technical staff.
Obtain and/or approximate key information.
• Develop an exhaustive list of critical activities performed within the district.
• Develop an estimate of the minimum space and equipment necessary for restoring essential operations.
• Develop a timeframe for starting initial operations after a security incident.
• Develop a list of key personnel and their responsibilities.
Perform and/or delegate key duties.
• Develop an inventory of all MIS technology assets, including data, software, hardware, documentation and supplies.
• Set up a reciprocal agreement with comparable organizations to share each other's equipment or lease backup equipment to allow the district to
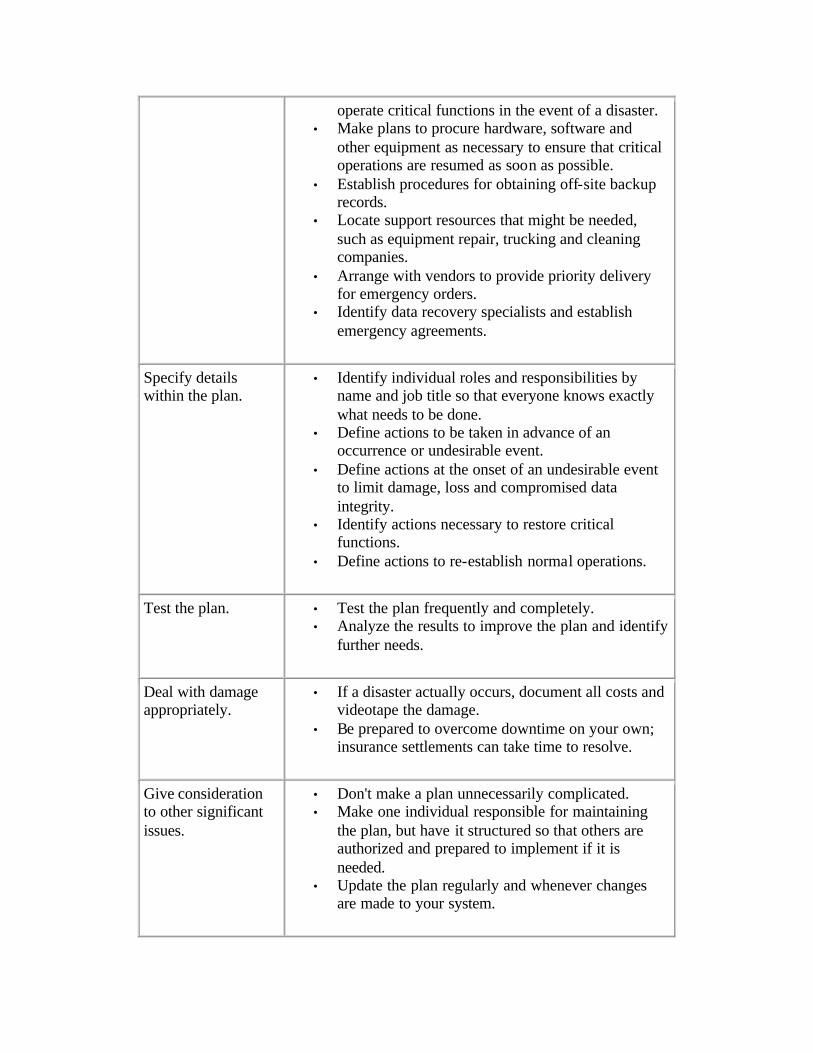
operate critical functions in the event of a disaster. • Make plans to procure hardware, software and
other equipment as necessary to ensure that critical operations are resumed as soon as possible.
• Establish procedures for obtaining off-site backup records.
• Locate support resources that might be needed, such as equipment repair, trucking and cleaning companies.
• Arrange with vendors to provide priority delivery for emergency orders.
• Identify data recovery specialists and establish emergency agreements.
Specify details within the plan.
• Identify individual roles and responsibilities by name and job title so that everyone knows exactly what needs to be done.
• Define actions to be taken in advance of an occurrence or undesirable event.
• Define actions at the onset of an undesirable event to limit damage, loss and compromised data integrity.
• Identify actions necessary to restore critical functions.
• Define actions to re-establish normal operations.
Test the plan. • Test the plan frequently and completely. • Analyze the results to improve the plan and identify
further needs.
Deal with damage appropriately.
• If a disaster actually occurs, document all costs and videotape the damage.
• Be prepared to overcome downtime on your own; insurance settlements can take time to resolve.
Give consideration to other significant issues.
• Don't make a plan unnecessarily complicated. • Make one individual responsible for maintaining
the plan, but have it structured so that others are authorized and prepared to implement if it is needed.
• Update the plan regularly and whenever changes are made to your system.
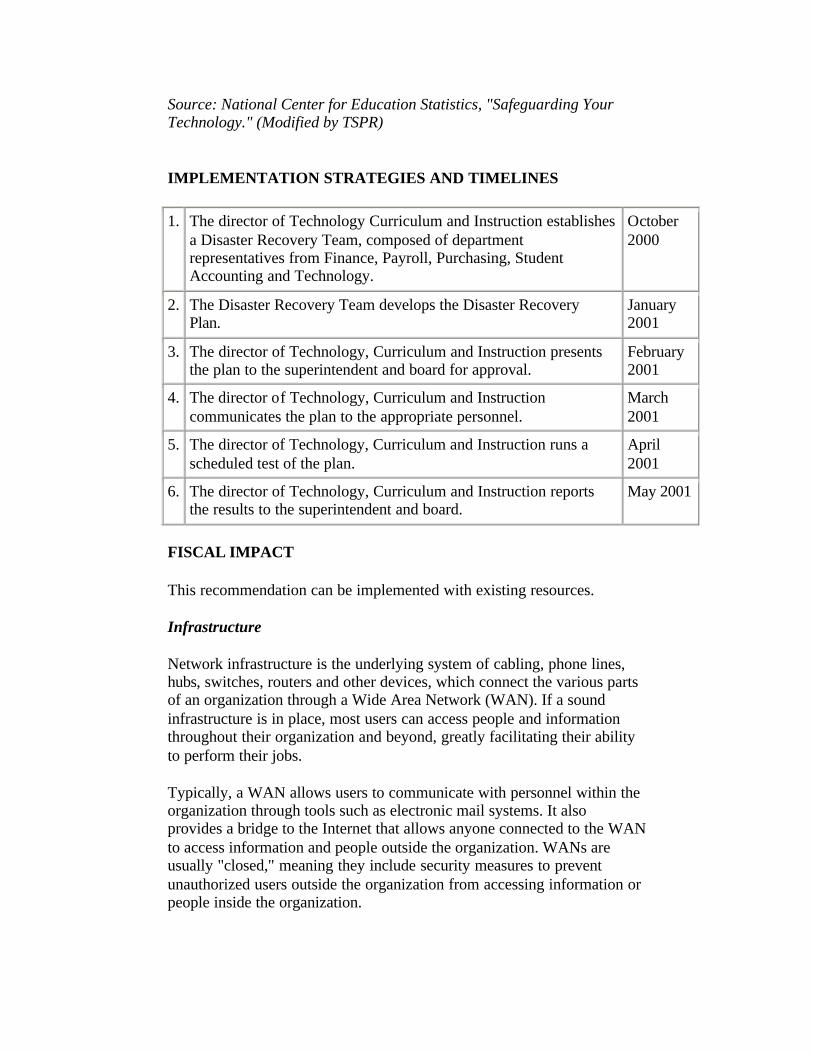
Source: National Center for Education Statistics, "Safeguarding Your Technology." (Modified by TSPR)
IMPLEMENTATION STRATEGIES AND TIMELINES
1. The director of Technology Curriculum and Instruction establishes a Disaster Recovery Team, composed of department representatives from Finance, Payroll, Purchasing, Student Accounting and Technology.
October 2000
2. The Disaster Recovery Team develops the Disaster Recovery Plan.
January 2001
3. The director of Technology, Curriculum and Instruction presents the plan to the superintendent and board for approval.
February 2001
4. The director of Technology, Curriculum and Instruction communicates the plan to the appropriate personnel.
March 2001
5. The director of Technology, Curriculum and Instruction runs a scheduled test of the plan.
April 2001
6. The director of Technology, Curriculum and Instruction reports the results to the superintendent and board.
May 2001
FISCAL IMPACT
This recommendation can be implemented with existing resources.
Infrastructure
Network infrastructure is the underlying system of cabling, phone lines, hubs, switches, routers and other devices, which connect the various parts of an organization through a Wide Area Network (WAN). If a sound infrastructure is in place, most users can access people and information throughout their organization and beyond, greatly facilitating their ability to perform their jobs.
Typically, a WAN allows users to communicate with personnel within the organization through tools such as electronic mail systems. It also provides a bridge to the Internet that allows anyone connected to the WAN to access information and people outside the organization. WANs are usually "closed," meaning they include security measures to prevent unauthorized users outside the organization from accessing information or people inside the organization.
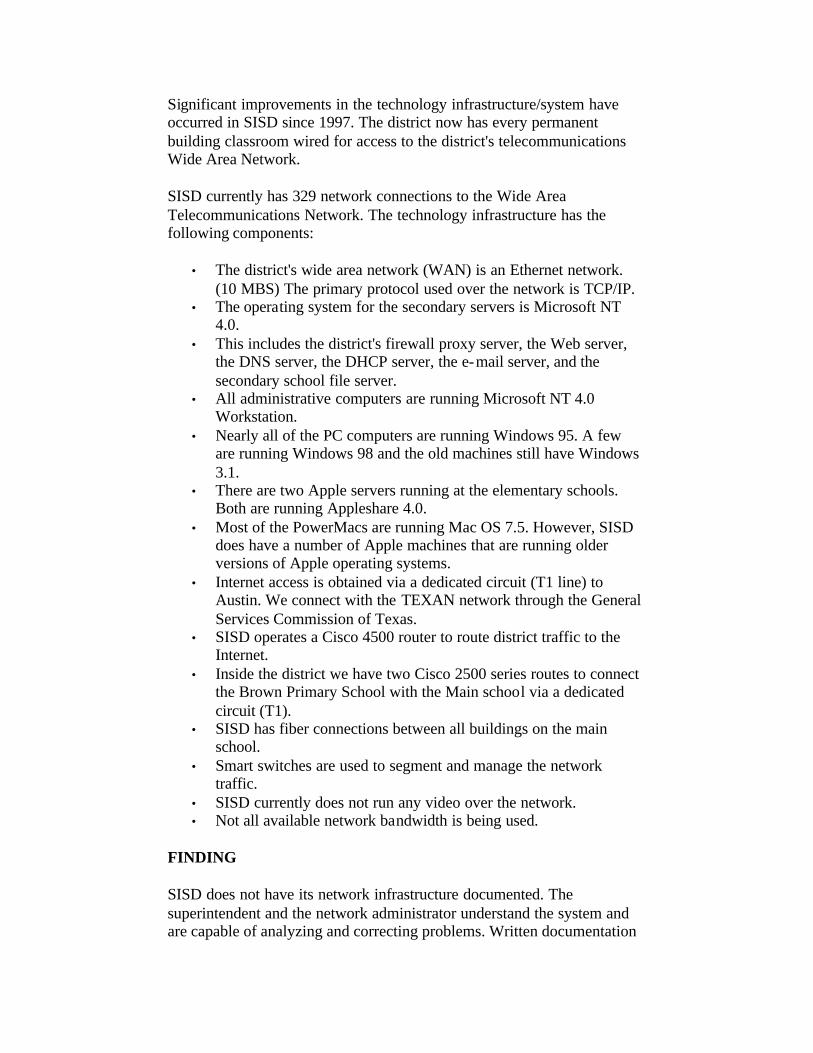
Significant improvements in the technology infrastructure/system have occurred in SISD since 1997. The district now has every permanent building classroom wired for access to the district's telecommunications Wide Area Network.
SISD currently has 329 network connections to the Wide Area Telecommunications Network. The technology infrastructure has the following components:
• The district's wide area network (WAN) is an Ethernet network. (10 MBS) The primary protocol used over the network is TCP/IP.
• The operating system for the secondary servers is Microsoft NT 4.0.
• This includes the district's firewall proxy server, the Web server, the DNS server, the DHCP server, the e-mail server, and the secondary school file server.
• All administrative computers are running Microsoft NT 4.0 Workstation.
• Nearly all of the PC computers are running Windows 95. A few are running Windows 98 and the old machines still have Windows 3.1.
• There are two Apple servers running at the elementary schools. Both are running Appleshare 4.0.
• Most of the PowerMacs are running Mac OS 7.5. However, SISD does have a number of Apple machines that are running older versions of Apple operating systems.
• Internet access is obtained via a dedicated circuit (T1 line) to Austin. We connect with the TEXAN network through the General Services Commission of Texas.
• SISD operates a Cisco 4500 router to route district traffic to the Internet.
• Inside the district we have two Cisco 2500 series routes to connect the Brown Primary School with the Main school via a dedicated circuit (T1).
• SISD has fiber connections between all buildings on the main school.
• Smart switches are used to segment and manage the network traffic.
• SISD currently does not run any video over the network. • Not all available network bandwidth is being used.
FINDING
SISD does not have its network infrastructure documented. The superintendent and the network administrator understand the system and are capable of analyzing and correcting problems. Written documentation
is essential so others maintaining the infrastructure in the future can understand the network's functions.
Recommendation 26:
Prepare network infrastructure documentation and provide backup in an off-site location.
IMPLEMENTATION STRATEGIES AND TIMELINES
1. The network administrator prepares detailed documentation for the network.
November 2000
2. The network administrator identifies an off-site location for the documentation.
December 2000
3. The network administrator transfers a copy of the network documentation to the off-site location.
January 2001
FISCAL IMPACT
This recommendation can be implemented with existing resources.
Instructional Technology And Training
The process of integrating technology into the instructional programs of the school distric t involves five steps: providing the infrastructure and technology hardware, training the staff on the technology system, establishing curriculum for technology, training staff on the curriculum standards and monitoring implementation of the curriculum.
Training is one of the most critical factors in determining whether technology is used effectively. Teachers must be comfortable with instructional technology and must know not only how to operate it, but also how to integrate it effectively into their teaching. Studies indicate that it may take three to five years for a teacher to acquire the appropriate level of expertise. Planning and support for technology-related training must take this into account.
Technology-related training must be ongoing. Teachers need continuous opportunities to expand their technological skills and to interact with other teachers so they can share new strategies and techniques. Access to electronic mail and the Internet have proven valuable for teachers to share ideas on classroom uses of technology.
Other training, moreover, is just as critical for technical support staff. Rapid technological change makes it easy for technology specialists to fall
behind. Sufficient time and funding for continuing training is essential if technical support is to remain effective.
FINDING
SISD's infrastructure improvements and training activities that have occurred since 1998 have helped teachers increase the use of technology in their instructional programs. All schools, except the junior high school, have a computer lab that is available for regular classroom teachers. The junior high school is the only school that has a networked computer in every classroom. Teachers are using the labs in their instructional activities with students.
Overall, teachers' technology skills have improved within the past two years. The district provided a full day of technology staff development training during the spring of 1999 and provided additional training opportunities during the summer of 1999. During 1998-99, the district developed and adopted standards for teacher technology skills. Teachers are expected to demonstrate proficiencies in the published technology standards by December 2000.
During the 1998-99 school year, new curriculum standards were adopted that included technology applications curriculum standards for grades K-12. More teachers are now integrating technology into their regular lesson plans and using the computer labs to conduct instructional projects with their students.
SISD is using central office curriculum staff and school principals to monitor the integration of technology into the curriculum. School principals review the staff technology skills forms to ensure that teachers are either competent or are obtaining training to demonstrate they can fulfill the basic teacher technology competency requirements.
SISD provided technology workshops at the Region 13, Educational Service Center during the summer of 2000. The major workshop categories are: Introductory Course in Technology, Integrating Technology into Your Classroom and Advanced Technology Workshops. In addition, SISD offered technology competency labs in the summer of 2000 for any employees who wish to demonstrate their ability.
COMMENDATION
SISD has established a goal and a definitive plan to ensure all faculty and staff is sufficiently trained in technology by December 2000.
FINDING
SISD uses its Web site to provide technology information and links that support teacher training.
SISD has established minimum technology standards for educators in the district. The required competencies are organized into three domains areas.
Domain 1: Basic Technology Operation - Instructional staff must be able to demonstrate the use of a multimedia computer system with related devices to run programs; to access, generate and manipulate data; and to communicate results. The subjects that are covered include operating systems and technology tools.
Domain 2: Personal/Professional Use of Technology Tools - Instructional staff will apply tools for enhancing their own professional growth and productivity. They will use technology in communicating, collaborating, conducting research and problem solving. The subjects that are covered include word processing, database, spreadsheet, presentation software, telecomputing and administrative/teacher applications.
Domain 3: Social, Ethical, and Human Issues - Instructional staff will demonstrate knowledge of equity, ethics, legal and human issues concerning the use of computers and technology.
COMMENDATION
SISD established minimal technology standards and performance requirements that provide a way for educators to demonstrate and administrators to measure technology mastery or skills.
FINDING
Technology-related best practices are not shared with other school districts in Bastrop County.
For example, Smithville ISD's technology standards may have value to other districts. The SISD superintendent has a technology background that could be useful to other districts. Bastrop ISD plans to have "frequently asked questions" maintained on its Web site to enable teachers and staff to troubleshoot computer/hardware problems. The idea is to solve the problem as close to the source as possible to minimize the number of expensive computer technician calls. Smithville ISD and Elgin ISD each have one technician and are considering hiring an additional technician to their staff. These districts have expressed interest in an alternative to hiring additional technical staff. Elgin ISD's use and experience with TEKStar software in managing lesson plans could benefit other districts.
The requirement for funds to meet the state goals for technology infrastructure has forced the managers responsible for technology in each of the Bastrop County school districts to become excessively involved with finding funds. The time spent searching for funds ranges from an estimated 20 percent to 80 percent of total available time. This need to find funds has become primary in their day-to-day activities and has taken away the time they should be spending on helping teachers integrate technology into the classroom.
Acquiring funds to support technology infrastructure requirements is of critical importance to the district. Outside assistance could be used to alleviate some of the time-consuming activities that are currently performed by technology management. For example, Texas A&M University's "Center for Community Support" (http://ppriWeb.tamu.edu/ccs) provides a free service for monitoring grant opportunities and all aspects of grant-writing support.
The practices outlined above and other techniques that have proven successful should be shared among all Bastrop County ISDs.
Recommendation 27:
Develop a technology forum for all Bastrop County school districts.
Communicating and sharing best practices among Bastrop County school districts should be accomplished with periodic meetings among appropriate technology personnel. The goal should be to identify current processes that improve efficiencies or lower costs. This information could be shared among all districts by linking Web sites.
IMPLEMENTATION STRATEGIES AND TIMELINES
1. The Business manager establishes a technology information-sharing forum with other Bastrop County school districts.
November 2000
2. The technology information-sharing forum identifies individual best practices in the district.
November 2000
3. The technology information-sharing forum assigns appropriate personnel to update Web content on their district sites.
January 2001 and Ongoing
FISCAL IMPACT
This recommendation can be implemented with existing resources.
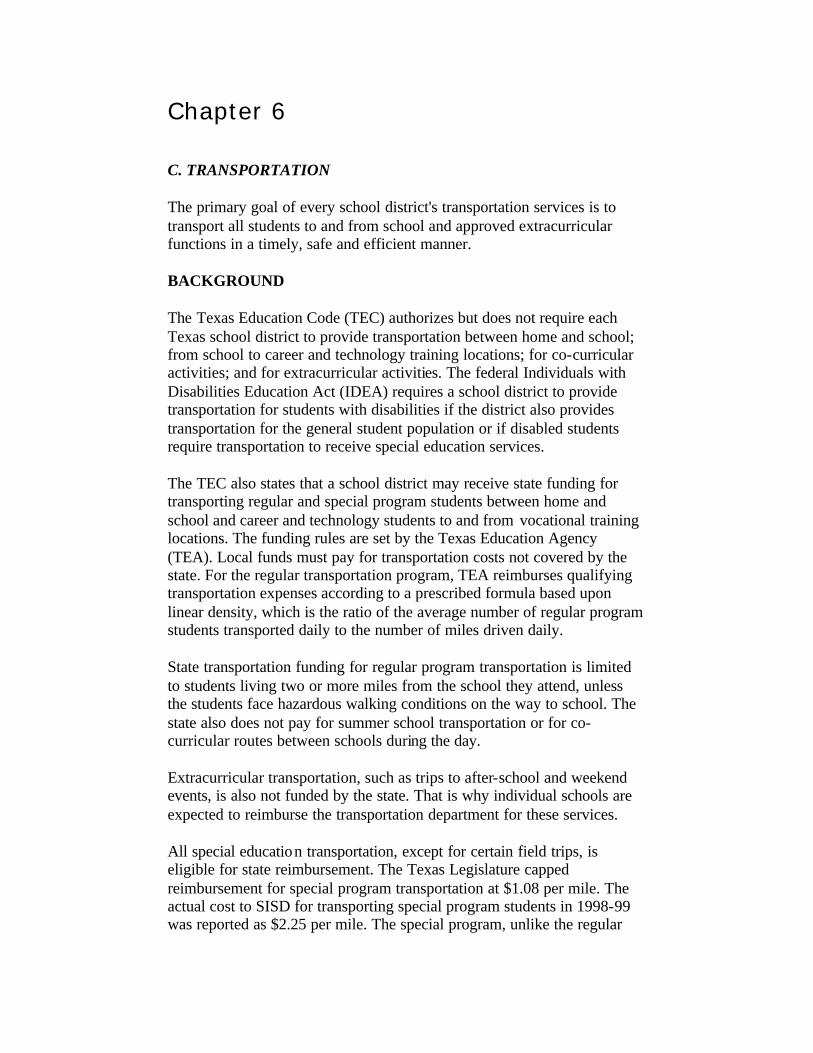
Chapter 6
C. TRANSPORTATION
The primary goal of every school district's transportation services is to transport all students to and from school and approved extracurricular functions in a timely, safe and efficient manner.
BACKGROUND
The Texas Education Code (TEC) authorizes but does not require each Texas school district to provide transportation between home and school; from school to career and technology training locations; for co-curricular activities; and for extracurricular activities. The federal Individuals with Disabilities Education Act (IDEA) requires a school district to provide transportation for students with disabilities if the district also provides transportation for the general student population or if disabled students require transportation to receive special education services.
The TEC also states that a school district may receive state funding for transporting regular and special program students between home and school and career and technology students to and from vocational training locations. The funding rules are set by the Texas Education Agency (TEA). Local funds must pay for transportation costs not covered by the state. For the regular transportation program, TEA reimburses qualifying transportation expenses according to a prescribed formula based upon linear density, which is the ratio of the average number of regular program students transported daily to the number of miles driven daily.
State transportation funding for regular program transportation is limited to students living two or more miles from the school they attend, unless the students face hazardous walking conditions on the way to school. The state also does not pay for summer school transportation or for co-curricular routes between schools during the day.
Extracurricular transportation, such as trips to after-school and weekend events, is also not funded by the state. That is why individual schools are expected to reimburse the transportation department for these services.
All special education transportation, except for certain field trips, is eligible for state reimbursement. The Texas Legislature capped reimbursement for special program transportation at $1.08 per mile. The actual cost to SISD for transporting special program students in 1998-99 was reported as $2.25 per mile. The special program, unlike the regular
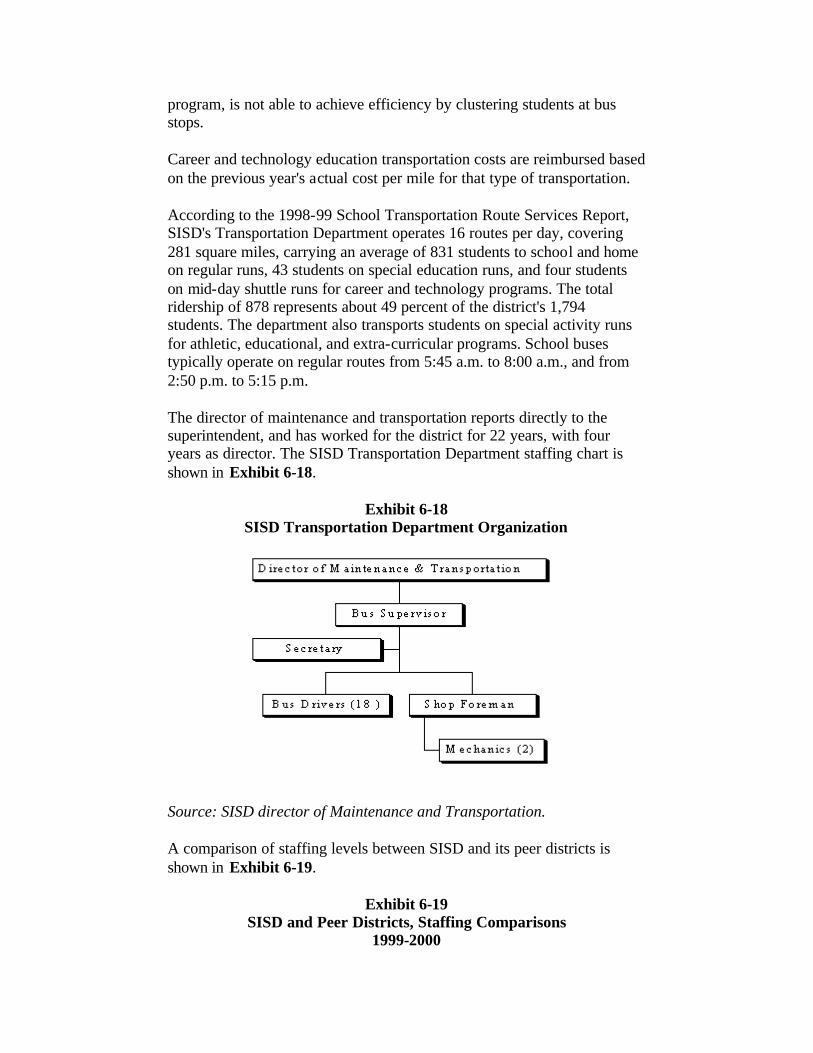
program, is not able to achieve efficiency by clustering students at bus stops.
Career and technology education transportation costs are reimbursed based on the previous year's actual cost per mile for that type of transportation.
According to the 1998-99 School Transportation Route Services Report, SISD's Transportation Department operates 16 routes per day, covering 281 square miles, carrying an average of 831 students to school and home on regular runs, 43 students on special education runs, and four students on mid-day shuttle runs for career and technology programs. The total ridership of 878 represents about 49 percent of the district's 1,794 students. The department also transports students on special activity runs for athletic, educational, and extra-curricular programs. School buses typically operate on regular routes from 5:45 a.m. to 8:00 a.m., and from 2:50 p.m. to 5:15 p.m.
The director of maintenance and transportation reports directly to the superintendent, and has worked for the district for 22 years, with four years as director. The SISD Transportation Department staffing chart is shown in Exhibit 6-18.
Exhibit 6-18 SISD Transportation Department Organization
Source: SISD director of Maintenance and Transportation.
A comparison of staffing levels between SISD and its peer districts is shown in Exhibit 6-19.
Exhibit 6-19 SISD and Peer Districts, Staffing Comparisons
1999-2000
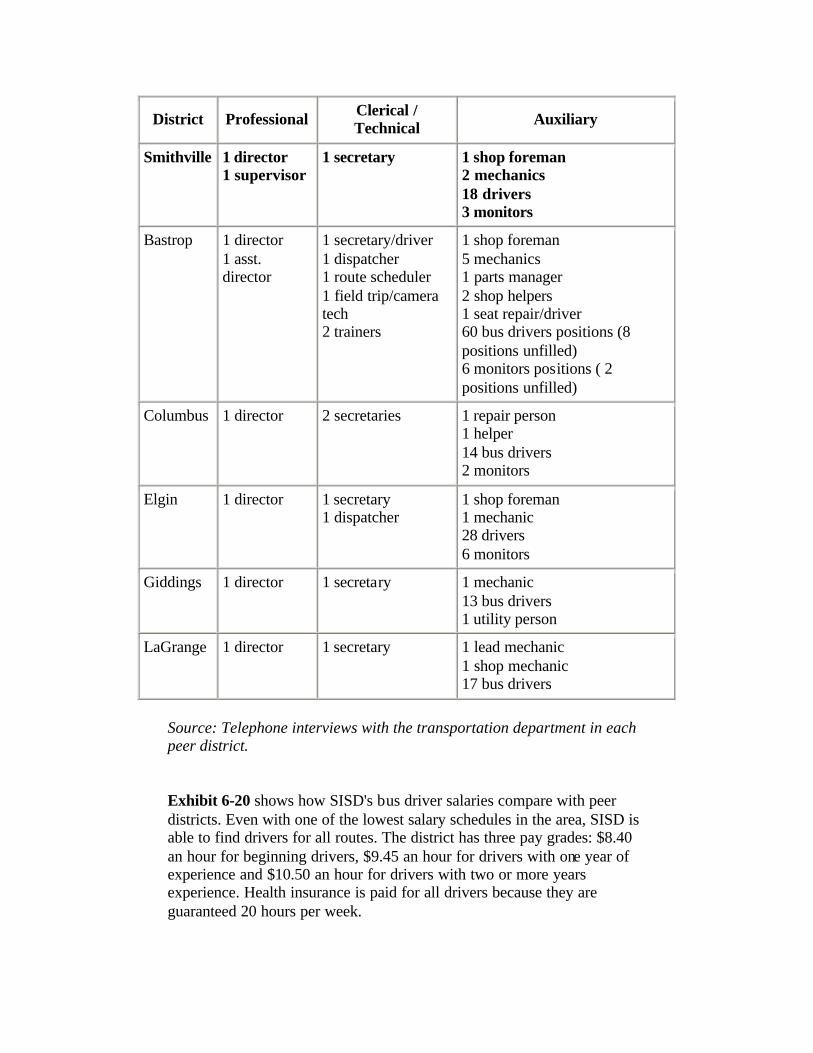
District Professional Clerical / Technical Auxiliary
Smithville 1 director 1 supervisor
1 secretary 1 shop foreman 2 mechanics 18 drivers 3 monitors
Bastrop 1 director 1 asst. director
1 secretary/driver 1 dispatcher 1 route scheduler 1 field trip/camera tech 2 trainers
1 shop foreman 5 mechanics 1 parts manager 2 shop helpers 1 seat repair/driver 60 bus drivers positions (8 positions unfilled) 6 monitors positions ( 2 positions unfilled)
Columbus 1 director 2 secretaries 1 repair person 1 helper 14 bus drivers 2 monitors
Elgin 1 director 1 secretary 1 dispatcher
1 shop foreman 1 mechanic 28 drivers 6 monitors
Giddings 1 director 1 secretary 1 mechanic 13 bus drivers 1 utility person
LaGrange 1 director 1 secretary 1 lead mechanic 1 shop mechanic 17 bus drivers
Source: Telephone interviews with the transportation department in each peer district.
Exhibit 6-20 shows how SISD's bus driver salaries compare with peer districts. Even with one of the lowest salary schedules in the area, SISD is able to find drivers for all routes. The district has three pay grades: $8.40 an hour for beginning drivers, $9.45 an hour for drivers with one year of experience and $10.50 an hour for drivers with two or more years experience. Health insurance is paid for all drivers because they are guaranteed 20 hours per week.
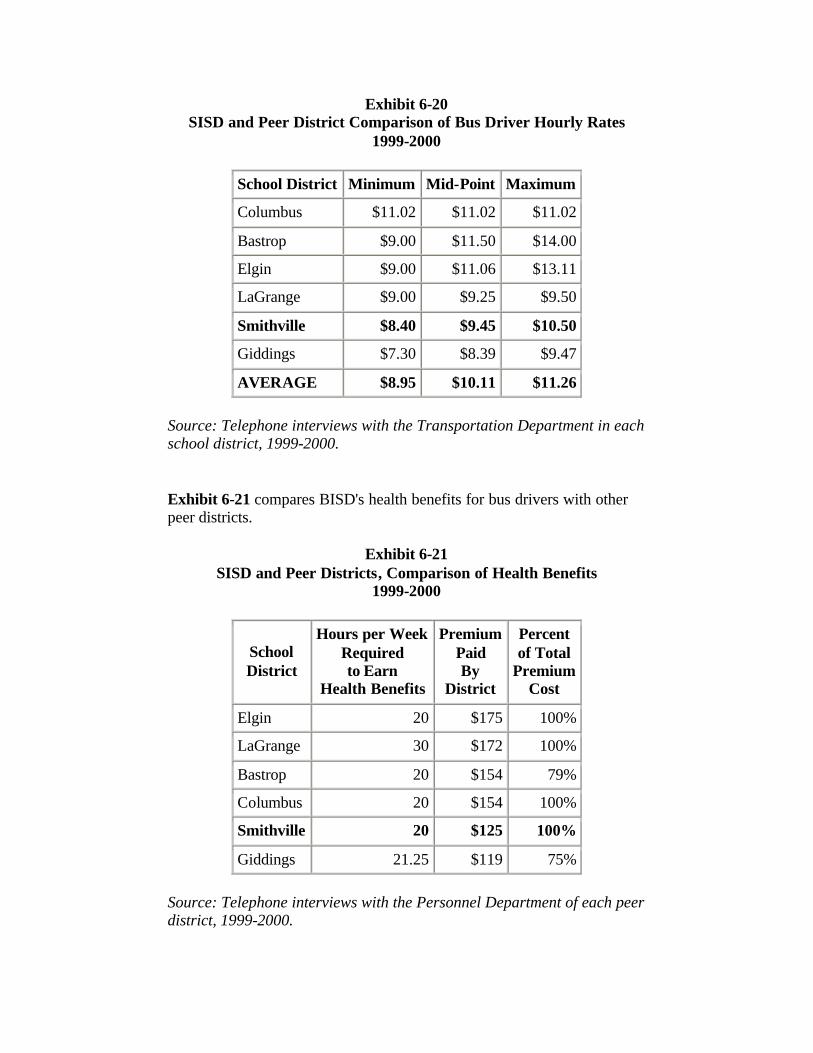
Exhibit 6-20 SISD and Peer District Comparison of Bus Driver Hourly Rates
1999-2000
School District Minimum Mid-Point Maximum
Columbus $11.02 $11.02 $11.02
Bastrop $9.00 $11.50 $14.00
Elgin $9.00 $11.06 $13.11
LaGrange $9.00 $9.25 $9.50
Smithville $8.40 $9.45 $10.50
Giddings $7.30 $8.39 $9.47
AVERAGE $8.95 $10.11 $11.26
Source: Telephone interviews with the Transportation Department in each school district, 1999-2000.
Exhibit 6-21 compares BISD's health benefits for bus drivers with other peer districts.
Exhibit 6-21 SISD and Peer Districts, Comparison of Health Benefits
1999-2000
School District
Hours per Week Required to Earn
Health Benefits
Premium Paid By
District
Percent of Total
Premium Cost
Elgin 20 $175 100%
LaGrange 30 $172 100%
Bastrop 20 $154 79%
Columbus 20 $154 100%
Smithville 20 $125 100%
Giddings 21.25 $119 75%
Source: Telephone interviews with the Personnel Department of each peer district, 1999-2000.
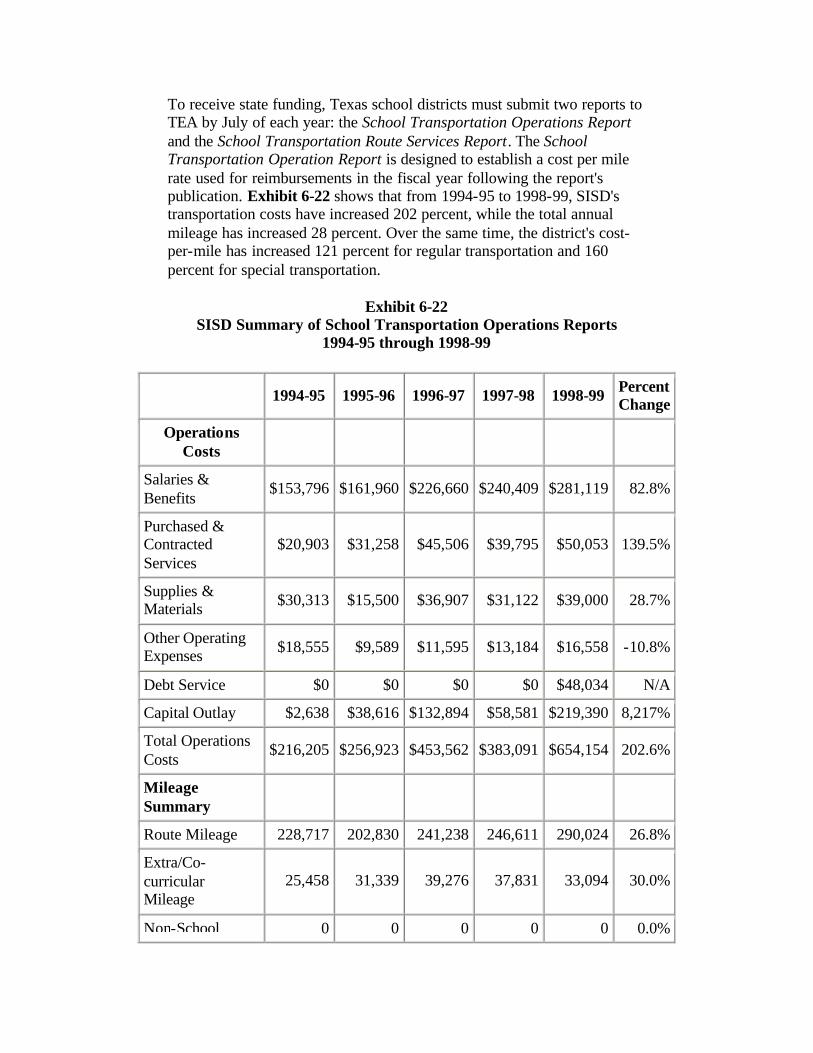
To receive state funding, Texas school districts must submit two reports to TEA by July of each year: the School Transportation Operations Report and the School Transportation Route Services Report. The School Transportation Operation Report is designed to establish a cost per mile rate used for reimbursements in the fiscal year following the report's publication. Exhibit 6-22 shows that from 1994-95 to 1998-99, SISD's transportation costs have increased 202 percent, while the total annual mileage has increased 28 percent. Over the same time, the district's cost-per-mile has increased 121 percent for regular transportation and 160 percent for special transportation.
Exhibit 6-22 SISD Summary of School Transportation Operations Reports
1994-95 through 1998-99
1994-95 1995-96 1996-97 1997-98 1998-99 Percent Change
Operations Costs
Salaries & Benefits
$153,796 $161,960 $226,660 $240,409 $281,119 82.8%
Purchased & Contracted Services
$20,903 $31,258 $45,506 $39,795 $50,053 139.5%
Supplies & Materials $30,313 $15,500 $36,907 $31,122 $39,000 28.7%
Other Operating Expenses $18,555 $9,589 $11,595 $13,184 $16,558 -10.8%
Debt Service $0 $0 $0 $0 $48,034 N/A
Capital Outlay $2,638 $38,616 $132,894 $58,581 $219,390 8,217%
Total Operations Costs
$216,205 $256,923 $453,562 $383,091 $654,154 202.6%
Mileage Summary
Route Mileage 228,717 202,830 241,238 246,611 290,024 26.8%
Extra/Co-curricular Mileage
25,458 31,339 39,276 37,831 33,094 30.0%
Non-School 0 0 0 0 0 0.0%
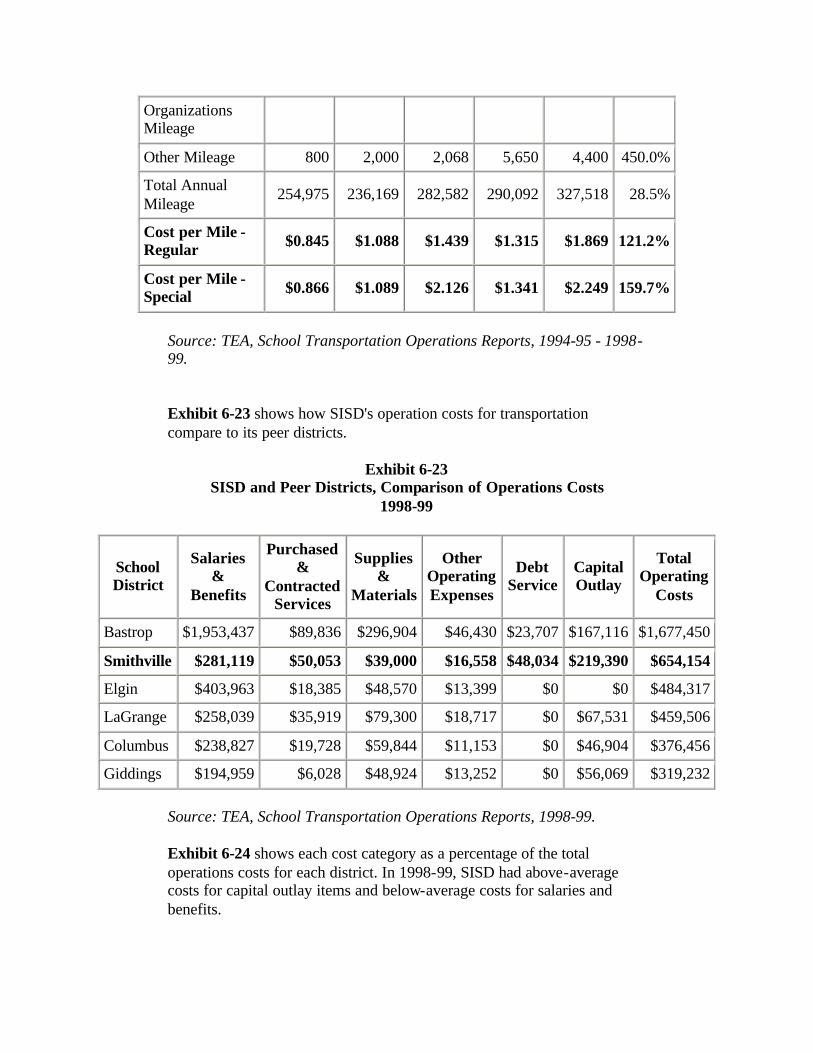
Organizations Mileage
Other Mileage 800 2,000 2,068 5,650 4,400 450.0%
Total Annual Mileage
254,975 236,169 282,582 290,092 327,518 28.5%
Cost per Mile - Regular $0.845 $1.088 $1.439 $1.315 $1.869 121.2%
Cost per Mile - Special $0.866 $1.089 $2.126 $1.341 $2.249 159.7%
Source: TEA, School Transportation Operations Reports, 1994-95 - 1998-99.
Exhibit 6-23 shows how SISD's operation costs for transportation compare to its peer districts.
Exhibit 6-23 SISD and Peer Districts, Comparison of Operations Costs
1998-99
School District
Salaries &
Benefits
Purchased &
Contracted Services
Supplies &
Materials
Other Operating Expenses
Debt Service
Capital Outlay
Total Operating
Costs
Bastrop $1,953,437 $89,836 $296,904 $46,430 $23,707 $167,116 $1,677,450
Smithville $281,119 $50,053 $39,000 $16,558 $48,034 $219,390 $654,154
Elgin $403,963 $18,385 $48,570 $13,399 $0 $0 $484,317
LaGrange $258,039 $35,919 $79,300 $18,717 $0 $67,531 $459,506
Columbus $238,827 $19,728 $59,844 $11,153 $0 $46,904 $376,456
Giddings $194,959 $6,028 $48,924 $13,252 $0 $56,069 $319,232
Source: TEA, School Transportation Operations Reports, 1998-99.
Exhibit 6-24 shows each cost category as a percentage of the total operations costs for each district. In 1998-99, SISD had above-average costs for capital outlay items and below-average costs for salaries and benefits.
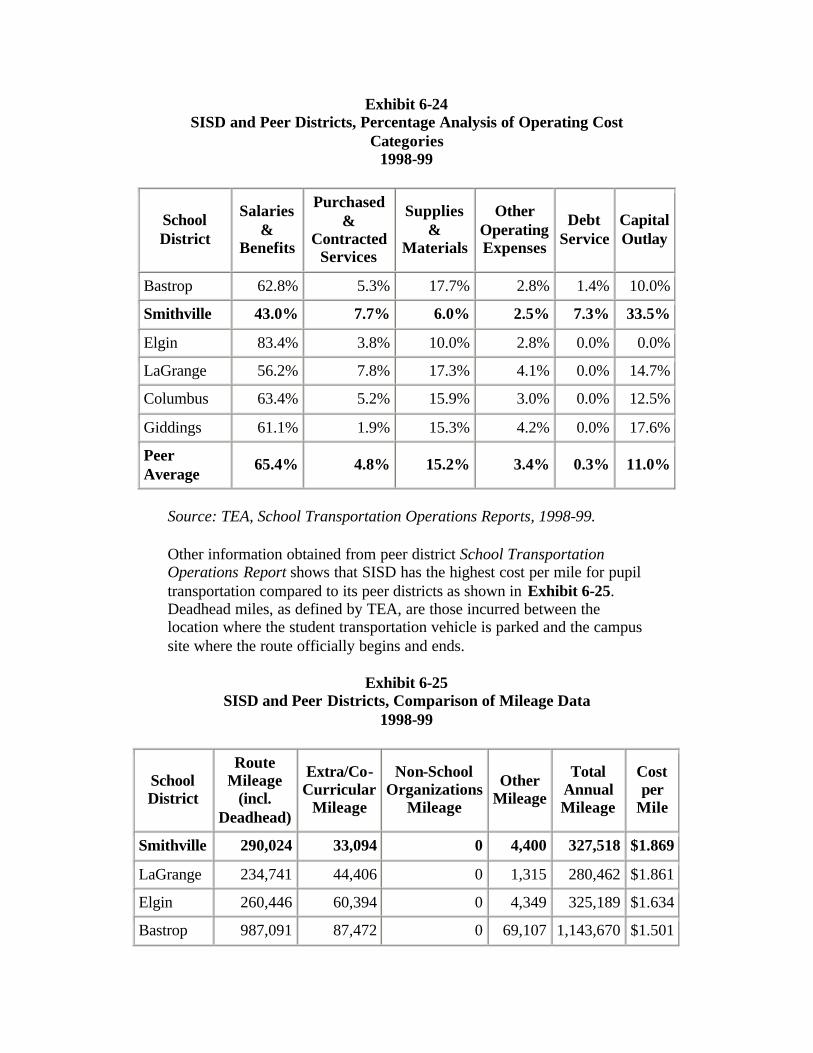
Exhibit 6-24 SISD and Peer Districts, Percentage Analysis of Operating Cost
Categories 1998-99
School District
Salaries &
Benefits
Purchased &
Contracted Services
Supplies &
Materials
Other Operating Expenses
Debt Service
Capital Outlay
Bastrop 62.8% 5.3% 17.7% 2.8% 1.4% 10.0%
Smithville 43.0% 7.7% 6.0% 2.5% 7.3% 33.5%
Elgin 83.4% 3.8% 10.0% 2.8% 0.0% 0.0%
LaGrange 56.2% 7.8% 17.3% 4.1% 0.0% 14.7%
Columbus 63.4% 5.2% 15.9% 3.0% 0.0% 12.5%
Giddings 61.1% 1.9% 15.3% 4.2% 0.0% 17.6%
Peer Average
65.4% 4.8% 15.2% 3.4% 0.3% 11.0%
Source: TEA, School Transportation Operations Reports, 1998-99.
Other information obtained from peer district School Transportation Operations Report shows that SISD has the highest cost per mile for pupil transportation compared to its peer districts as shown in Exhibit 6-25. Deadhead miles, as defined by TEA, are those incurred between the location where the student transportation vehicle is parked and the campus site where the route officially begins and ends.
Exhibit 6-25 SISD and Peer Districts, Comparison of Mileage Data
1998-99
School District
Route Mileage
(incl. Deadhead)
Extra/Co- Curricular
Mileage
Non-School Organizations
Mileage
Other Mileage
Total Annual Mileage
Cost per
Mile
Smithville 290,024 33,094 0 4,400 327,518 $1.869
LaGrange 234,741 44,406 0 1,315 280,462 $1.861
Elgin 260,446 60,394 0 4,349 325,189 $1.634
Bastrop 987,091 87,472 0 69,107 1,143,670 $1.501
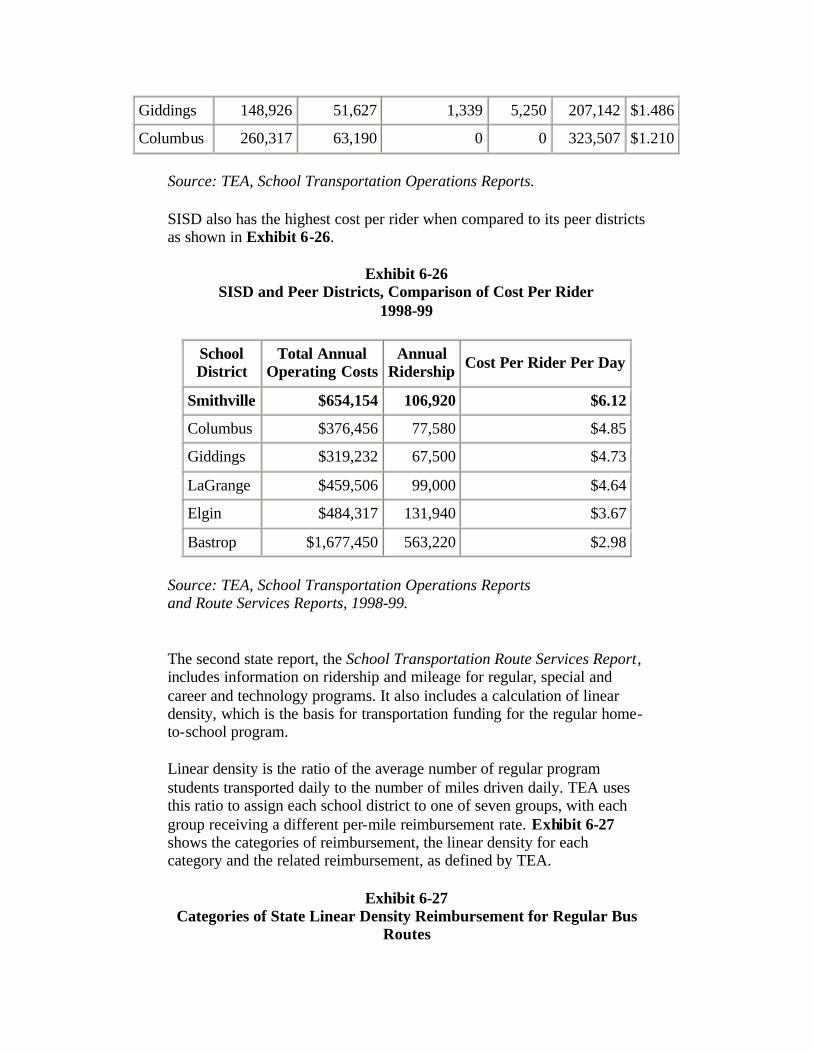
Giddings 148,926 51,627 1,339 5,250 207,142 $1.486
Columbus 260,317 63,190 0 0 323,507 $1.210
Source: TEA, School Transportation Operations Reports.
SISD also has the highest cost per rider when compared to its peer districts as shown in Exhibit 6-26.
Exhibit 6-26 SISD and Peer Districts, Comparison of Cost Per Rider
1998-99
School District
Total Annual Operating Costs
Annual Ridership Cost Per Rider Per Day
Smithville $654,154 106,920 $6.12
Columbus $376,456 77,580 $4.85
Giddings $319,232 67,500 $4.73
LaGrange $459,506 99,000 $4.64
Elgin $484,317 131,940 $3.67
Bastrop $1,677,450 563,220 $2.98
Source: TEA, School Transportation Operations Reports and Route Services Reports, 1998-99.
The second state report, the School Transportation Route Services Report, includes information on ridership and mileage for regular, special and career and technology programs. It also includes a calculation of linear density, which is the basis for transportation funding for the regular home-to-school program.
Linear density is the ratio of the average number of regular program students transported daily to the number of miles driven daily. TEA uses this ratio to assign each school district to one of seven groups, with each group receiving a different per-mile reimbursement rate. Exhibit 6-27 shows the categories of reimbursement, the linear density for each category and the related reimbursement, as defined by TEA.
Exhibit 6-27 Categories of State Linear Density Reimbursement for Regular Bus
Routes
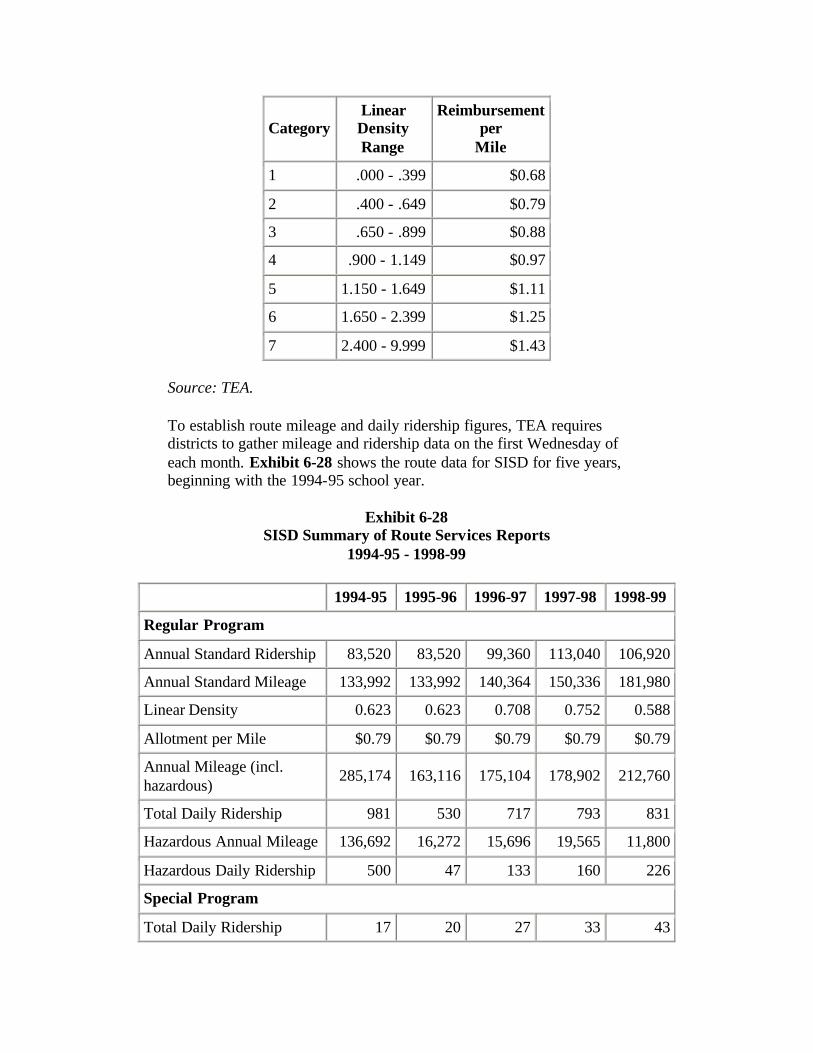
Category Linear Density Range
Reimbursement per
Mile
1 .000 - .399 $0.68
2 .400 - .649 $0.79
3 .650 - .899 $0.88
4 .900 - 1.149 $0.97
5 1.150 - 1.649 $1.11
6 1.650 - 2.399 $1.25
7 2.400 - 9.999 $1.43
Source: TEA.
To establish route mileage and daily ridership figures, TEA requires districts to gather mileage and ridership data on the first Wednesday of each month. Exhibit 6-28 shows the route data for SISD for five years, beginning with the 1994-95 school year.
Exhibit 6-28 SISD Summary of Route Services Reports
1994-95 - 1998-99
1994-95 1995-96 1996-97 1997-98 1998-99
Regular Program
Annual Standard Ridership 83,520 83,520 99,360 113,040 106,920
Annual Standard Mileage 133,992 133,992 140,364 150,336 181,980
Linear Density 0.623 0.623 0.708 0.752 0.588
Allotment per Mile $0.79 $0.79 $0.79 $0.79 $0.79
Annual Mileage (incl. hazardous)
285,174 163,116 175,104 178,902 212,760
Total Daily Ridership 981 530 717 793 831
Hazardous Annual Mileage 136,692 16,272 15,696 19,565 11,800
Hazardous Daily Ridership 500 47 133 160 226
Special Program
Total Daily Ridership 17 20 27 33 43
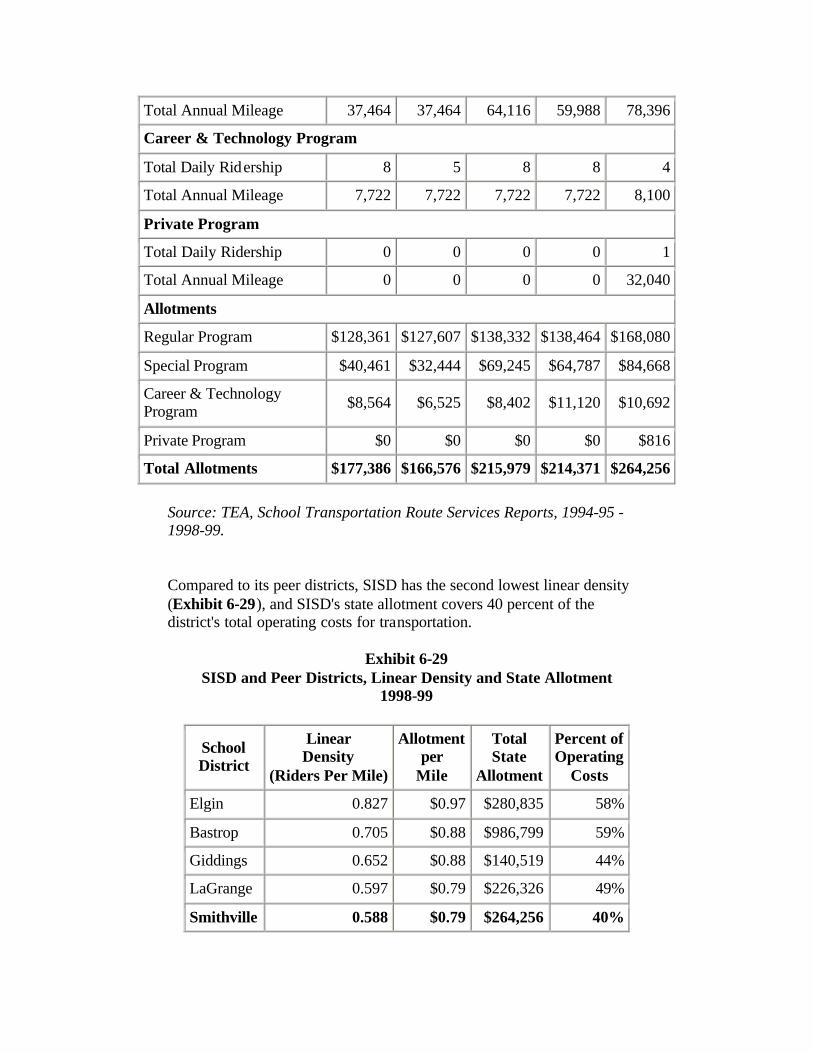
Total Annual Mileage 37,464 37,464 64,116 59,988 78,396
Career & Technology Program
Total Daily Ridership 8 5 8 8 4
Total Annual Mileage 7,722 7,722 7,722 7,722 8,100
Private Program
Total Daily Ridership 0 0 0 0 1
Total Annual Mileage 0 0 0 0 32,040
Allotments
Regular Program $128,361 $127,607 $138,332 $138,464 $168,080
Special Program $40,461 $32,444 $69,245 $64,787 $84,668
Career & Technology Program $8,564 $6,525 $8,402 $11,120 $10,692
Private Program $0 $0 $0 $0 $816
Total Allotments $177,386 $166,576 $215,979 $214,371 $264,256
Source: TEA, School Transportation Route Services Reports, 1994-95 - 1998-99.
Compared to its peer districts, SISD has the second lowest linear density (Exhibit 6-29), and SISD's state allotment covers 40 percent of the district's total operating costs for transportation.
Exhibit 6-29 SISD and Peer Districts, Linear Density and State Allotment
1998-99
School District
Linear Density
(Riders Per Mile)
Allotment per
Mile
Total State
Allotment
Percent of Operating
Costs
Elgin 0.827 $0.97 $280,835 58%
Bastrop 0.705 $0.88 $986,799 59%
Giddings 0.652 $0.88 $140,519 44%
LaGrange 0.597 $0.79 $226,326 49%
Smithville 0.588 $0.79 $264,256 40%
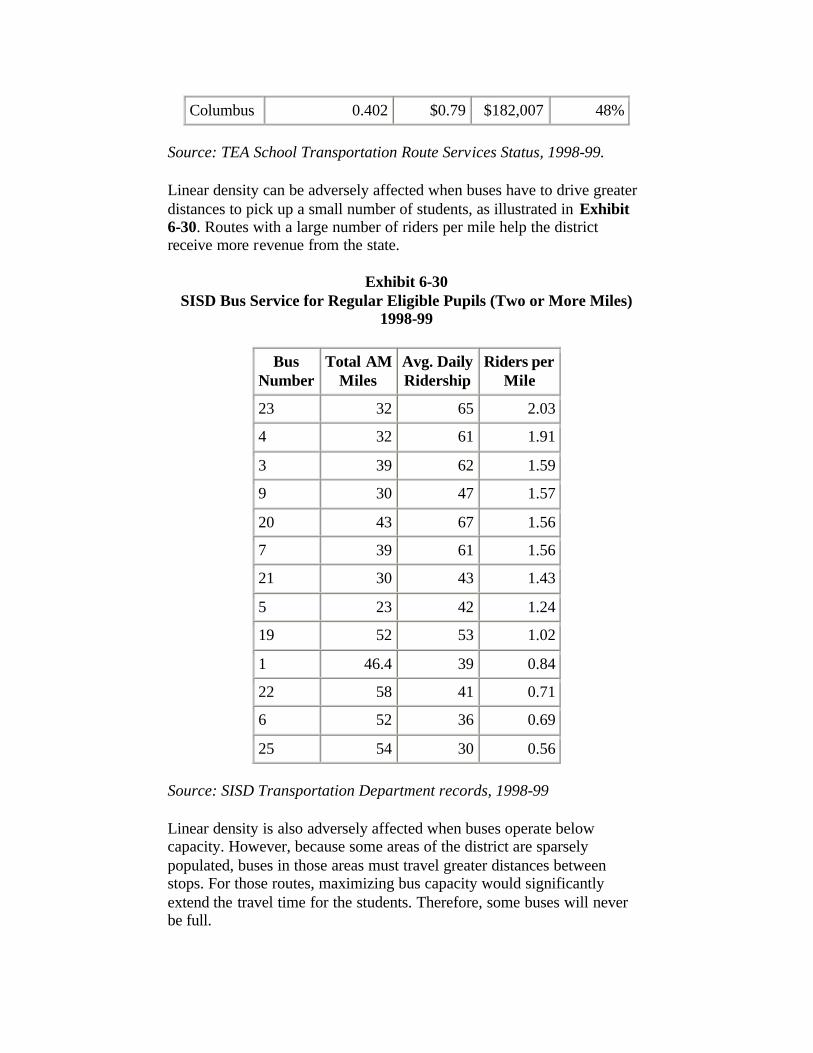
Columbus 0.402 $0.79 $182,007 48%
Source: TEA School Transportation Route Services Status, 1998-99.
Linear density can be adversely affected when buses have to drive greater distances to pick up a small number of students, as illustrated in Exhibit 6-30. Routes with a large number of riders per mile help the district receive more revenue from the state.
Exhibit 6-30 SISD Bus Service for Regular Eligible Pupils (Two or More Miles)
1998-99
Bus Number
Total AM Miles
Avg. Daily Ridership
Riders per Mile
23 32 65 2.03
4 32 61 1.91
3 39 62 1.59
9 30 47 1.57
20 43 67 1.56
7 39 61 1.56
21 30 43 1.43
5 23 42 1.24
19 52 53 1.02
1 46.4 39 0.84
22 58 41 0.71
6 52 36 0.69
25 54 30 0.56
Source: SISD Transportation Department records, 1998-99
Linear density is also adversely affected when buses operate below capacity. However, because some areas of the district are sparsely populated, buses in those areas must travel greater distances between stops. For those routes, maximizing bus capacity would significantly extend the travel time for the students. Therefore, some buses will never be full.
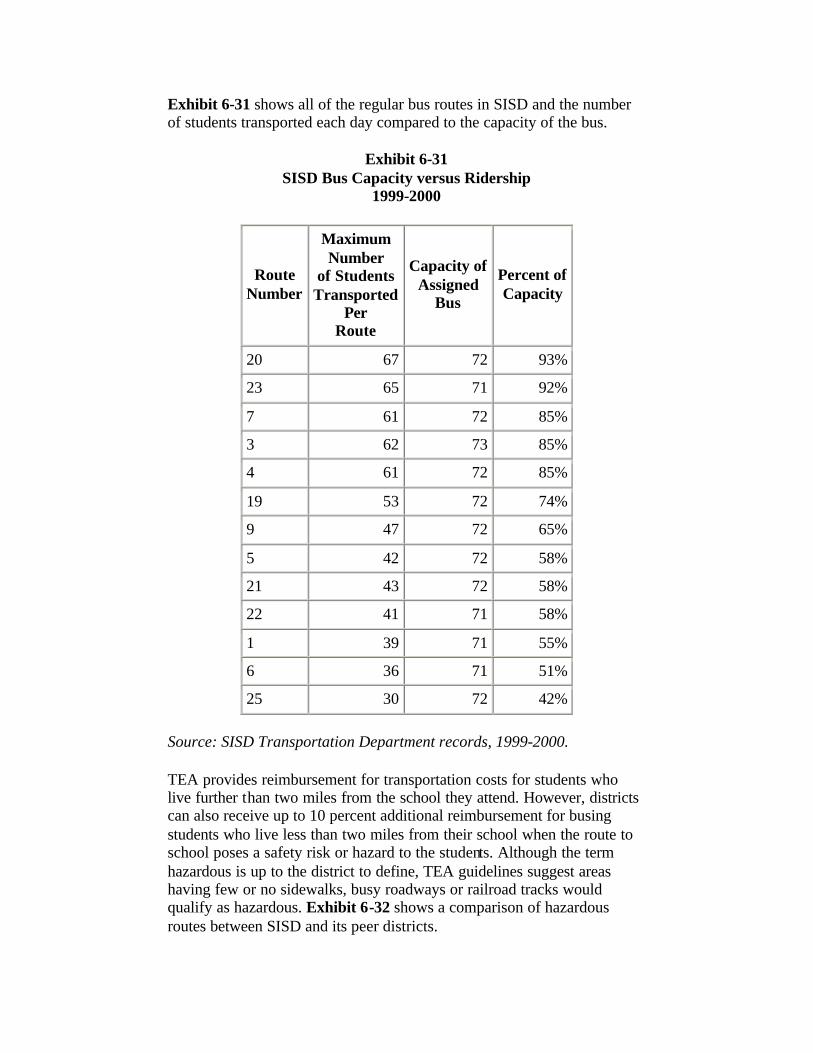
Exhibit 6-31 shows all of the regular bus routes in SISD and the number of students transported each day compared to the capacity of the bus.
Exhibit 6-31 SISD Bus Capacity versus Ridership
1999-2000
Route Number
Maximum Number
of Students Transported
Per Route
Capacity of Assigned
Bus
Percent of Capacity
20 67 72 93%
23 65 71 92%
7 61 72 85%
3 62 73 85%
4 61 72 85%
19 53 72 74%
9 47 72 65%
5 42 72 58%
21 43 72 58%
22 41 71 58%
1 39 71 55%
6 36 71 51%
25 30 72 42%
Source: SISD Transportation Department records, 1999-2000.
TEA provides reimbursement for transportation costs for students who live further than two miles from the school they attend. However, districts can also receive up to 10 percent additional reimbursement for busing students who live less than two miles from their school when the route to school poses a safety risk or hazard to the students. Although the term hazardous is up to the district to define, TEA guidelines suggest areas having few or no sidewalks, busy roadways or railroad tracks would qualify as hazardous. Exhibit 6-32 shows a comparison of hazardous routes between SISD and its peer districts.
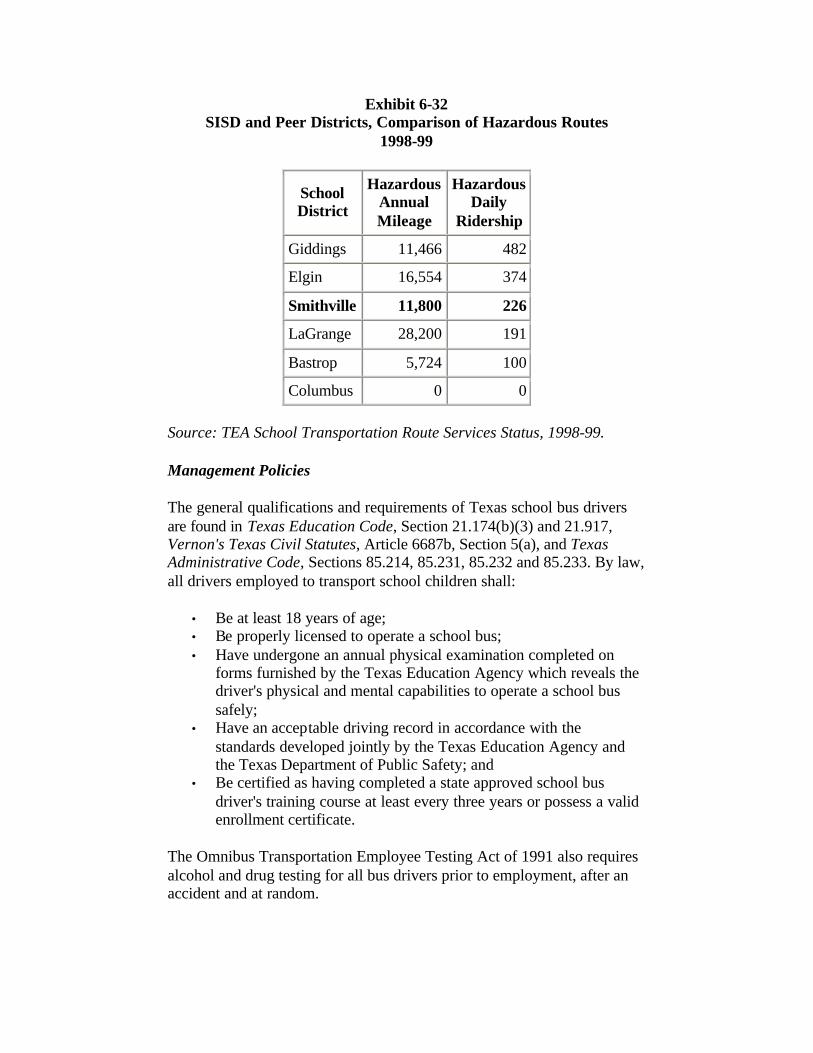
Exhibit 6-32 SISD and Peer Districts, Comparison of Hazardous Routes
1998-99
School District
Hazardous Annual Mileage
Hazardous Daily
Ridership
Giddings 11,466 482
Elgin 16,554 374
Smithville 11,800 226
LaGrange 28,200 191
Bastrop 5,724 100
Columbus 0 0
Source: TEA School Transportation Route Services Status, 1998-99.
Management Policies
The general qualifications and requirements of Texas school bus drivers are found in Texas Education Code, Section 21.174(b)(3) and 21.917, Vernon's Texas Civil Statutes, Article 6687b, Section 5(a), and Texas Administrative Code, Sections 85.214, 85.231, 85.232 and 85.233. By law, all drivers employed to transport school children shall:
• Be at least 18 years of age; • Be properly licensed to operate a school bus; • Have undergone an annual physical examination completed on
forms furnished by the Texas Education Agency which reveals the driver's physical and mental capabilities to operate a school bus safely;
• Have an acceptable driving record in accordance with the standards developed jointly by the Texas Education Agency and the Texas Department of Public Safety; and
• Be certified as having completed a state approved school bus driver's training course at least every three years or possess a valid enrollment certificate.
The Omnibus Transportation Employee Testing Act of 1991 also requires alcohol and drug testing for all bus drivers prior to employment, after an accident and at random.
Failure to keep documentation of these requirements could subject a school district to penalties and civil liabilities, especially in case of a bus accident. Documentation that would verify driver qualifications would include:
• A photocopy of the driver's Commercial Driver's License; • The results of the driver's annual physical; • Documentation of the driver's yearly motor vehicle license check; • Documentation of the driver's original 20 hour certification
training; • Documentation of the driver's road test; • Documentation of the eight-hour refresher course, required every
three years; • The driver's pre-employment drug test; and • The results of all random or other required drug testing.
Depending on district policy, transportation departments may wish to maintain other records including:
• Documentation of training related to Omnibus Drug Testing; • The driver's behind-the-wheel evaluation(s) (at least once a year); • The driver's attendance records; • A photocopy of the driver's Social Security Number; • Documentation of the driver having received special information,
like safety manuals and employee handbooks; and • A copy of the driver's employment application.
FINDING
Due to budgetary issues, in September of 1999, the district created a policy not to bus any students that live within the city limits unless the students have to cross the railroad tracks (a hazardous condition), or if the students are in the Pre-Kindergarten program. Pre-Kindergarten students are picked up an dropped off at their residence, but all other students who live along hazardous routes are picked up and dropped off at five designated zones within the city. Consequently, there have been a number of complaints about the lack of transportation services.
In public forums held with community members, some parents expressed their concerns regarding young children in the early grades having to walk almost two miles to school. A group of parents have resorted to contracting with the city bus service to transport their children to school at a cost of $15 per month but there is a waiting list of several families wanting to get service.
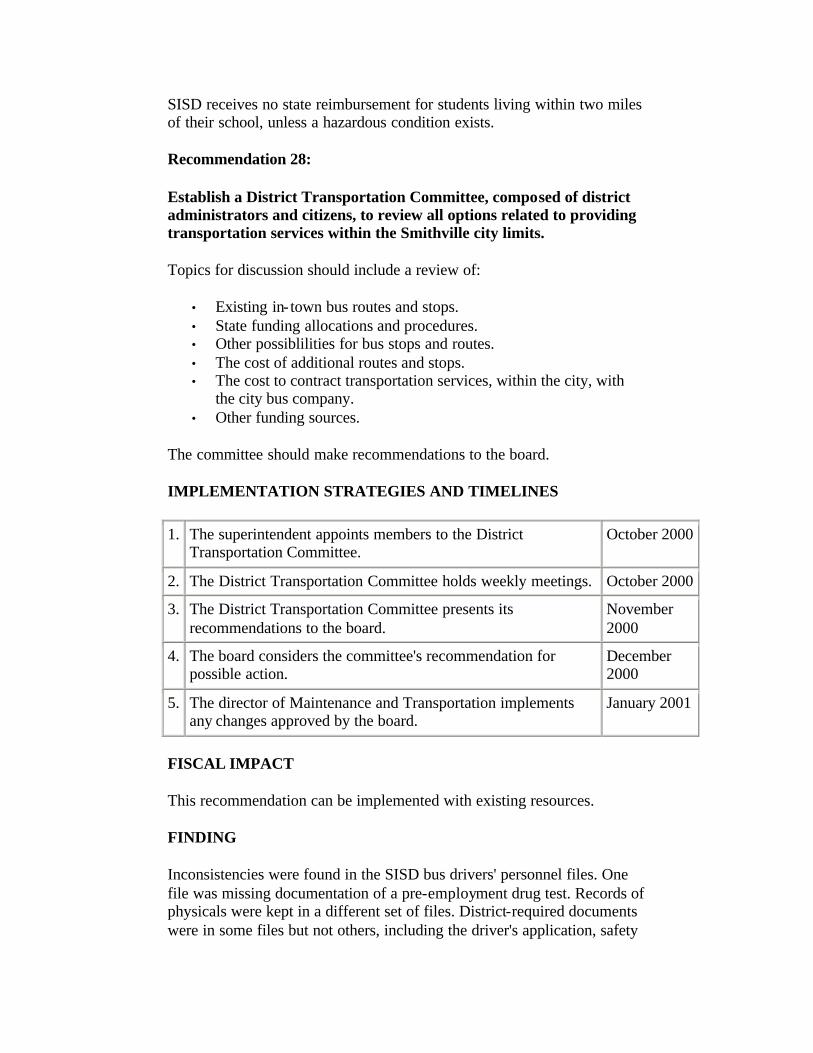
SISD receives no state reimbursement for students living within two miles of their school, unless a hazardous condition exists.
Recommendation 28:
Establish a District Transportation Committee, composed of district administrators and citizens, to review all options related to providing transportation services within the Smithville city limits.
Topics for discussion should include a review of:
• Existing in- town bus routes and stops. • State funding allocations and procedures. • Other possiblilities for bus stops and routes. • The cost of additional routes and stops. • The cost to contract transportation services, within the city, with
the city bus company. • Other funding sources.
The committee should make recommendations to the board.
IMPLEMENTATION STRATEGIES AND TIMELINES
1. The superintendent appoints members to the District Transportation Committee.
October 2000
2. The District Transportation Committee holds weekly meetings. October 2000
3. The District Transportation Committee presents its recommendations to the board.
November 2000
4. The board considers the committee's recommendation for possible action.
December 2000
5. The director of Maintenance and Transportation implements any changes approved by the board.
January 2001
FISCAL IMPACT
This recommendation can be implemented with existing resources.
FINDING
Inconsistencies were found in the SISD bus drivers' personnel files. One file was missing documentation of a pre-employment drug test. Records of physicals were kept in a different set of files. District-required documents were in some files but not others, including the driver's application, safety

manual documentation and a photocopy of the driver's Social Security Number.
Recommendation 29:
Develop a checklist of documents that should be in each bus driver's personnel folder and audit each driver's file for compliance at least once per semester.
The checklist should be attached in the personnel folder to document the dates when each item was added or updated, and who entered the data.
IMPLEMENTATION STRATEGIES AND TIMELINES
1. The director of Maintenance and Transportation meets with the director of Personnel to establish a checklist of all documents required to be maintained in bus drivers' personnel files.
October 2000
2. The director of Personnel, or designee, inspects each driver's files to ensure all required records are present.
November 2000
3. The director of Personnel develops an audit schedule to inspect driver files for record compliance at least once per semester.
December 2000
FISCAL IMPACT
This recommendation can be implemented with existing resources.
FINDING
SISD has no provisions to measure the effectiveness of a driver after they receive the initial 20-hour Texas Certification Course and some behind-the-wheel training. A driver is assumed to be doing a good job unless a parent calls to complain. There are no provisions for monitoring the driver's abilities or effectiveness after the initial training.
Recommendation 30:
Perform behind-the-wheel evaluations of all bus drivers at least once a year.
Periodic behind the wheel evaluations, especially during the first year, could help identify areas where the driver might need some additional training.
IMPLEMENTATION STRATEGIES AND TIMELINES
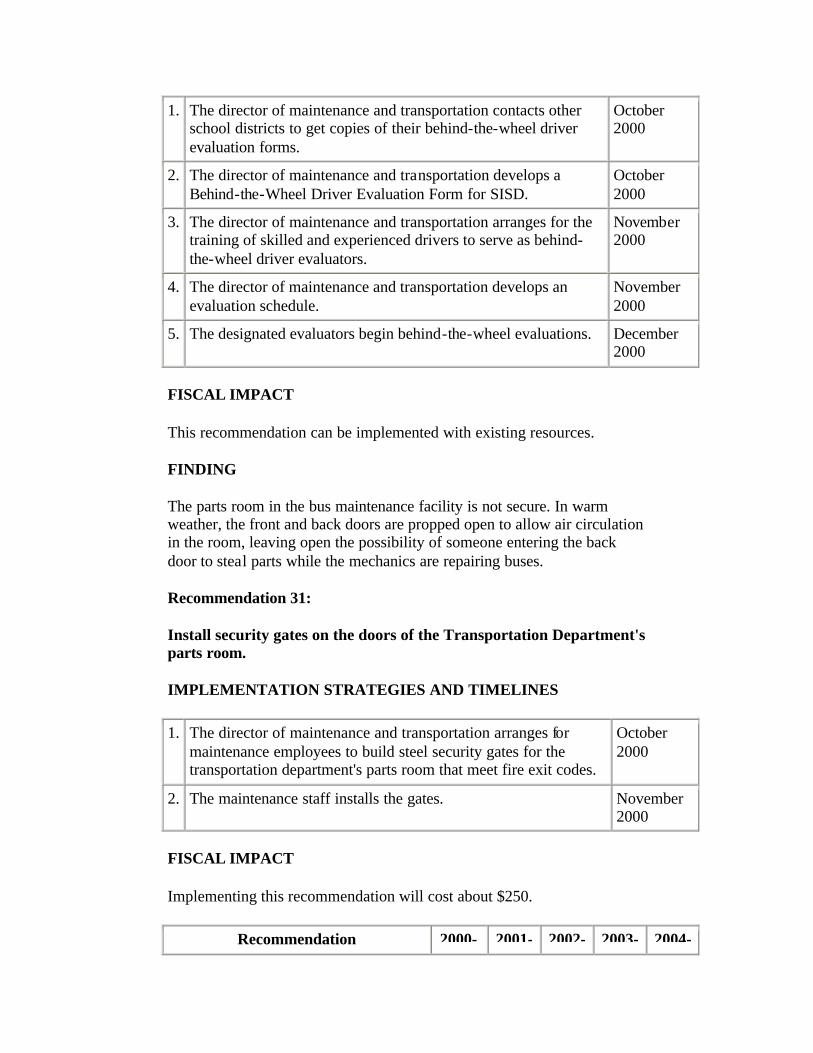
1. The director of maintenance and transportation contacts other school districts to get copies of their behind-the-wheel driver evaluation forms.
October 2000
2. The director of maintenance and transportation develops a Behind-the-Wheel Driver Evaluation Form for SISD.
October 2000
3. The director of maintenance and transportation arranges for the training of skilled and experienced drivers to serve as behind-the-wheel driver evaluators.
November 2000
4. The director of maintenance and transportation develops an evaluation schedule.
November 2000
5. The designated evaluators begin behind-the-wheel evaluations. December 2000
FISCAL IMPACT
This recommendation can be implemented with existing resources.
FINDING
The parts room in the bus maintenance facility is not secure. In warm weather, the front and back doors are propped open to allow air circulation in the room, leaving open the possibility of someone entering the back door to steal parts while the mechanics are repairing buses.
Recommendation 31:
Install security gates on the doors of the Transportation Department's parts room.
IMPLEMENTATION STRATEGIES AND TIMELINES
1. The director of maintenance and transportation arranges for maintenance employees to build steel security gates for the transportation department's parts room that meet fire exit codes.
October 2000
2. The maintenance staff installs the gates. November 2000
FISCAL IMPACT
Implementing this recommendation will cost about $250.
Recommendation 2000- 2001- 2002- 2003- 2004-
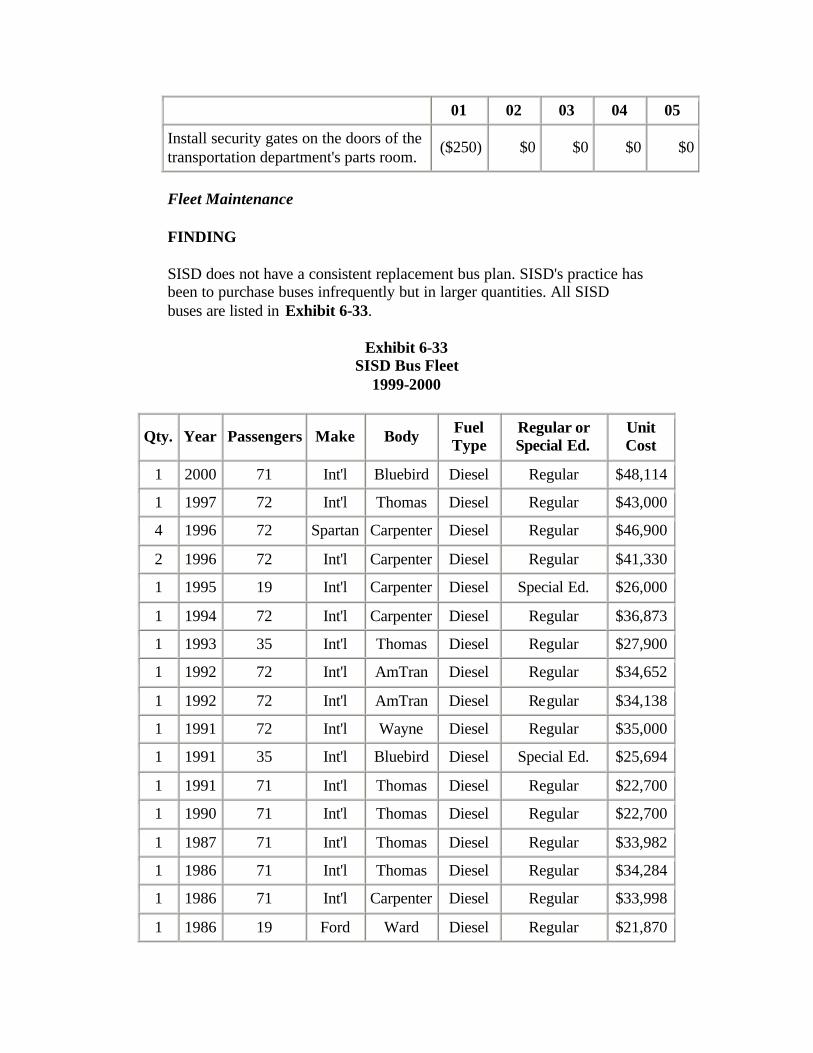
01 02 03 04 05
Install security gates on the doors of the transportation department's parts room.
($250) $0 $0 $0 $0
Fleet Maintenance
FINDING
SISD does not have a consistent replacement bus plan. SISD's practice has been to purchase buses infrequently but in larger quantities. All SISD buses are listed in Exhibit 6-33.
Exhibit 6-33 SISD Bus Fleet
1999-2000
Qty. Year Passengers Make Body Fuel Type
Regular or Special Ed.
Unit Cost
1 2000 71 Int'l Bluebird Diesel Regular $48,114
1 1997 72 Int'l Thomas Diesel Regular $43,000
4 1996 72 Spartan Carpenter Diesel Regular $46,900
2 1996 72 Int'l Carpenter Diesel Regular $41,330
1 1995 19 Int'l Carpenter Diesel Special Ed. $26,000
1 1994 72 Int'l Carpenter Diesel Regular $36,873
1 1993 35 Int'l Thomas Diesel Regular $27,900
1 1992 72 Int'l AmTran Diesel Regular $34,652
1 1992 72 Int'l AmTran Diesel Regular $34,138
1 1991 72 Int'l Wayne Diesel Regular $35,000
1 1991 35 Int'l Bluebird Diesel Special Ed. $25,694
1 1991 71 Int'l Thomas Diesel Regular $22,700
1 1990 71 Int'l Thomas Diesel Regular $22,700
1 1987 71 Int'l Thomas Diesel Regular $33,982
1 1986 71 Int'l Thomas Diesel Regular $34,284
1 1986 71 Int'l Carpenter Diesel Regular $33,998
1 1986 19 Ford Ward Diesel Regular $21,870
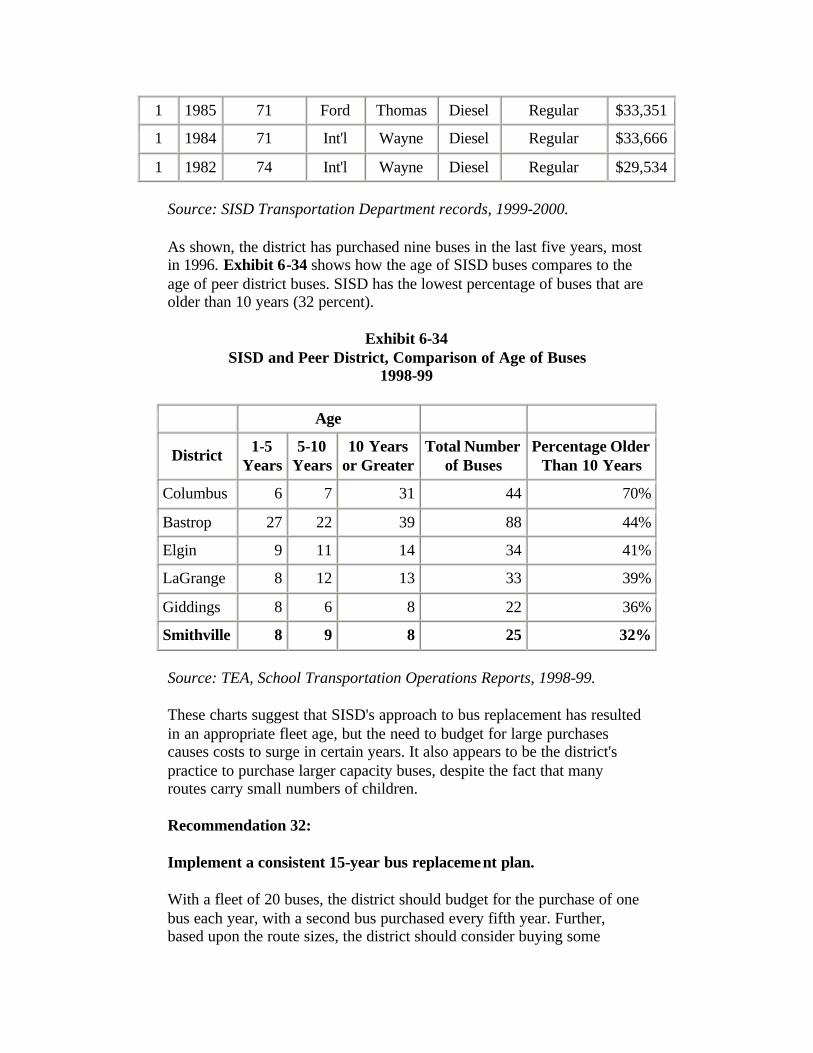
1 1985 71 Ford Thomas Diesel Regular $33,351
1 1984 71 Int'l Wayne Diesel Regular $33,666
1 1982 74 Int'l Wayne Diesel Regular $29,534
Source: SISD Transportation Department records, 1999-2000.
As shown, the district has purchased nine buses in the last five years, most in 1996. Exhibit 6-34 shows how the age of SISD buses compares to the age of peer district buses. SISD has the lowest percentage of buses that are older than 10 years (32 percent).
Exhibit 6-34 SISD and Peer District, Comparison of Age of Buses
1998-99
Age
District 1-5 Years
5-10 Years
10 Years or Greater
Total Number of Buses
Percentage Older Than 10 Years
Columbus 6 7 31 44 70%
Bastrop 27 22 39 88 44%
Elgin 9 11 14 34 41%
LaGrange 8 12 13 33 39%
Giddings 8 6 8 22 36%
Smithville 8 9 8 25 32%
Source: TEA, School Transportation Operations Reports, 1998-99.
These charts suggest that SISD's approach to bus replacement has resulted in an appropriate fleet age, but the need to budget for large purchases causes costs to surge in certain years. It also appears to be the district's practice to purchase larger capacity buses, despite the fact that many routes carry small numbers of children.
Recommendation 32:
Implement a consistent 15-year bus replacement plan.
With a fleet of 20 buses, the district should budget for the purchase of one bus each year, with a second bus purchased every fifth year. Further, based upon the route sizes, the district should consider buying some

smaller buses to handle those routes with fewer students. While operating costs are approximately the same, the initial cost for these smaller buses can be as much as $20,000 less than the larger buses.
IMPLEMENTATION STRATEGIES AND TIMELINES
1. The director of Maintenance and Transportation prepares a bus replacement plan and presents it to the board and superintendent for review.
September 2000
2. The board approves the plan with any modifications and authorizes the transportation office to begin purchasing buses on the planned schedule.
October 2000
3. The director of Maintenance and Transportation implements the plan.
November 2000
FISCAL IMPACT
According to district records, SISD has purchased nine buses in the last five years, bringing the fleet to an appropriate age. Implementing a consistent and more planned approach to purchasing will smooth out the amount of capital expenditures each year, and the purchase of some smaller buses could potentially save the district money in the long run.
FINDING
No computerized fleet maintenance system exists to notify the shop personnel of scheduled preventive maintenance. Some maintenance is not performed unless the bus is brought in for other problems. Consequently, buses may go beyond a bus manufacturer's recommended maintenance cycles. Fueling records are also kept manually, which could result in inaccurate accounting or loss of fuel inventory.
Recommendation 33:
Purchase and implement an automated fleet maintenance system.
Fleet maintenance computer systems can be used to track and schedule preventive maintenance; maintain records of work orders; track parts inventories and vendor history, warranties, fuel usage and inventory, cost per mile; maintain personnel records; and generate management reports. This would allow SISD to measure and monitor different performance measures to determine if changes need to be made in department operations.
IMPLEMENTATION STRATEGIES AND TIMELINES

1. The director of Maintenance and Transportation meets with the director of Business to develop the requirements of a fleet management system and determine an estimate of the cost of the system, including installation and training.
October 2000
2. The director of Maintenance and Transportation submits a budget amendment request to the superintendent for Board approval.
November 2000
3. The director of Maintenance and Transportation issues a purchasing requisition for the fleet management system, including installation and training.
December 2000
4. The director of Maintenance and Transportation attends a training session on how to use the software.
February 2001
5. The director of Maintenance and Transportation begins using the fleet maintenance software.
March 2001
FISCAL IMPACT
The cost of the fleet management software is $2,500 plus $400 per year for maintenance and support. Assuming a consultant needs to be hired for two days at $500 a day, training would cost a total of $1,000. The transportation Department already owns a computer that can be used to run the software.
Recommendation 2000-01 2001-02
2002-03
2003-04
2004-05
Cost of an automated fleet maintenance system. ($2,500) $0 $0 $0 $0
Annual maintenance and support for a new system. $0 ($400) ($400) ($400) ($400)
Two day training. ($1,000) $0 $0 $0 $0
Net Savings/(Costs) ($3,500) ($400) ($400) ($400) ($400)
FINDING
The efficiency of SISD's Transportation function is declining. According to information provided in Exhibit 6-22, SISD's total route mileage driven increased by 26.8 percent between 1994-95 and 1998-99, while the total operating costs increased from $216,205 to $654,154, or 203 percent during the same time period. Exhibit 6-28 shows that for the same time period the district's linear density, or the ratio of the average number of regular program students transported daily to the number of miles driven
daily, declined from .623 to .588; total daily ridership in regular programs declined from 981 to 831 students.
Some of the deficiencies found in the SISD Transportation program include:
• SISD has the highest cost per mile compared to its peer districts; • SISD has the highest cost per rider compared to its peer districts; • SISD has the second- lowest linear density of its peer districts; • Forty percent of the SISD Transportation operating expenses are
reimbursed by the state (lowest of its peer districts); • Bus driver records are incomplete; • No behind-the-wheel evaluations of bus drivers are performed; • Transportation parts inventories are not secure; • SISD has no bus washing facility and buses are washed manually
only twice a year; and • One-third of SISD buses are more than 10 years old.
Recommendation 34:
Conduct a study to determine strategies to improve efficiency including conducting a feasibility study for outsourcing transportation services.
To evaluate the feasibility of reducing student transportation costs and improving service quality by contracting with a private company, SISD should take the following steps:
• Determine the full cost of in-house services, including the cost of buses and facilities, depreciation on these assets and administrative overhead costs. Administrative overhead will include SISD costs that can be avoided if transportation services are contracted, costs that can be reallocated to another essential district functions and costs that cannot be avoided and will remain a district expense in addition to the private contract.
• Allow SISD Transportation personnel to suggest ways they believe they can improve operations and reduce costs or increase revenues from the state.
• Determine if there are other districts or vendors willing to discuss a contract for transportation services.
To save money, the district could establish a cooperative with one or more districts to provide those services, or contracting some or all of the services to a private transportation provider.
There are many advantages to using an outside contractor, including:
• Competition between private contractors can help reduce costs; • Contractors often have a broad range of experience dealing with
the challenges of providing student transportation in numerous school districts. This experience may allow a contractor to solve district student transportation problems more quickly and effectively;
• Performance clauses can be included in the contract to ensure improved quality of services. For example, a private contractor can be required to meet a standard for on-time performance;
• Incentive clauses can be incorporated in the contract to increase efficiency. For example, the district can include a clause that allows cost savings resulting from route reductions proposed by the contractor to be shared between the district and the contractor;
• A private contractor can be required to implement an appropriate cost accounting system to monitor cost-efficiency and cost-effectiveness and to better monitor and control costs by function and service categories;
• A private contractor may be more flexible in implementing personnel management practices to recruit and retain drivers. For example, a private contractor may offer a convenient payroll schedule (weekly or biweekly pay);
• A private contractor can react quickly to market conditions to set competitive wage rates and conduct a more aggressive recruitment program to fill vacant driver positions;
• A private contractor may provide better fleet management, driver safety training and automated routing and scheduling programs. A contractor may offer these services more cost-effectively due to economies of scale;
• By privatizing the ancillary function of school transportation, district administrators can re-focus attention on core educational functions; and
• If a contractor provides the district school buses, the district no longer is faced with large capital outlays to replace the school bus fleet.
There also are possible disadvantages to private sector contracting, including:
• If a contractor provides the district school buses, the cost of providing vehicles will be amortized as operating costs over the term of the contract. The annual impact of the cost of vehicles will vary by the length of the contract and the required average age of the school bus fleet;
• If competition is not adequate, the contractor's price may not reflect the cost savings targeted by the district;
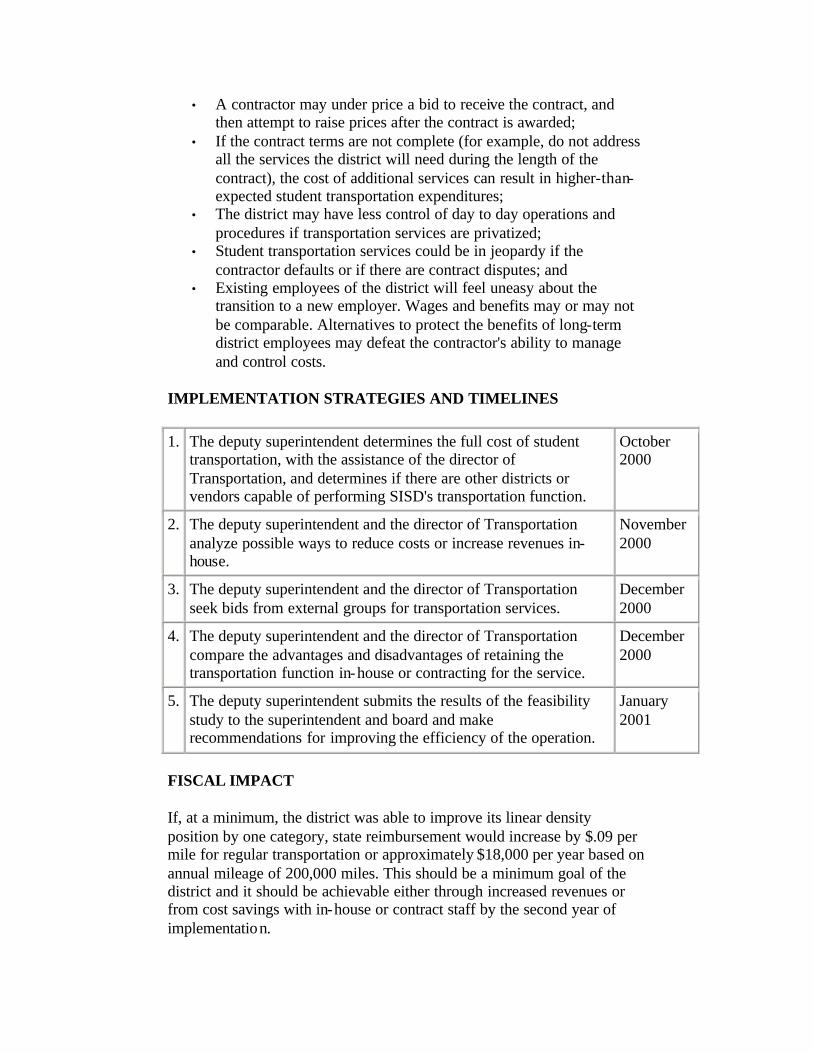
• A contractor may under price a bid to receive the contract, and then attempt to raise prices after the contract is awarded;
• If the contract terms are not complete (for example, do not address all the services the district will need during the length of the contract), the cost of additional services can result in higher-than-expected student transportation expenditures;
• The district may have less control of day to day operations and procedures if transportation services are privatized;
• Student transportation services could be in jeopardy if the contractor defaults or if there are contract disputes; and
• Existing employees of the district will feel uneasy about the transition to a new employer. Wages and benefits may or may not be comparable. Alternatives to protect the benefits of long-term district employees may defeat the contractor's ability to manage and control costs.
IMPLEMENTATION STRATEGIES AND TIMELINES
1. The deputy superintendent determines the full cost of student transportation, with the assistance of the director of Transportation, and determines if there are other districts or vendors capable of performing SISD's transportation function.
October 2000
2. The deputy superintendent and the director of Transportation analyze possible ways to reduce costs or increase revenues in-house.
November 2000
3. The deputy superintendent and the director of Transportation seek bids from external groups for transportation services.
December 2000
4. The deputy superintendent and the director of Transportation compare the advantages and disadvantages of retaining the transportation function in-house or contracting for the service.
December 2000
5. The deputy superintendent submits the results of the feasibility study to the superintendent and board and make recommendations for improving the efficiency of the operation.
January 2001
FISCAL IMPACT
If, at a minimum, the district was able to improve its linear density position by one category, state reimbursement would increase by $.09 per mile for regular transportation or approximately $18,000 per year based on annual mileage of 200,000 miles. This should be a minimum goal of the district and it should be achievable either through increased revenues or from cost savings with in-house or contract staff by the second year of implementation.

Recommendation 2000-01
2001-02
2002-03
2003-04
2004-05
Conduct a study to determine strategies to improve efficiency including conducting a feasibility study for outsourcing transportation services.
$0 $18,000 $18,000 $18,000 $18,000

Appendix A
COMMUNITY COMMENTS A. Part 1
As part of this review, a community meeting and focus group were conducted during the early stages of the review process. This appendix contains comments from a public forum held on April 4, 2000, and a series of focus groups with the Booster Club, Smithville PTA, the Lions Club, a group of Hispanic parents, a group of African American parents, the DEIC, and central and campus administrators held separately on days between April 5 and April 12, 2000 at various locations throughout Smithville and other written comments received by the Comptroller's office.
These comments, presented verbatim in most instances, help illustrate community perceptions of the Smithville Independent School District (SISD), but do not necessarily reflect the findings or opinions of the review team or the Comptroller. The following is a summary of comments received by focus area.
DISTRICT ORGANIZATION AND MANAGEMENT
• Site based duties equals more work equals no extra pay equals no one listening to you.
• Site based personnel may not understand what their duties and responsibilities are.
• School board meeting notices are not sent home. We have to find out in the paper a week later and then it's not the whole picture. (Yes, we need public at school board meetings, need advertising.).
• More public notices in more places about board meetings. Channel 10 run a taped meeting maybe?
• I dislike the decisions the high school principal makes. • The students were not given their placement, such as "Top 10",
during graduation and other events. • The district's challenge is preparing our students for the challenges
they will have to endure as they go into professional adult life. • We have so many older people who don't have children in our
schools and don't want any change for our schools. It will always be hard to grow.
• Our new superintendent is an excellent administrator and has worked in our school district in other positions for many years. He knows our problems past and present and is doing what is needed to get SISD on all fours.
• The administration is accessible when we need to discuss problems.
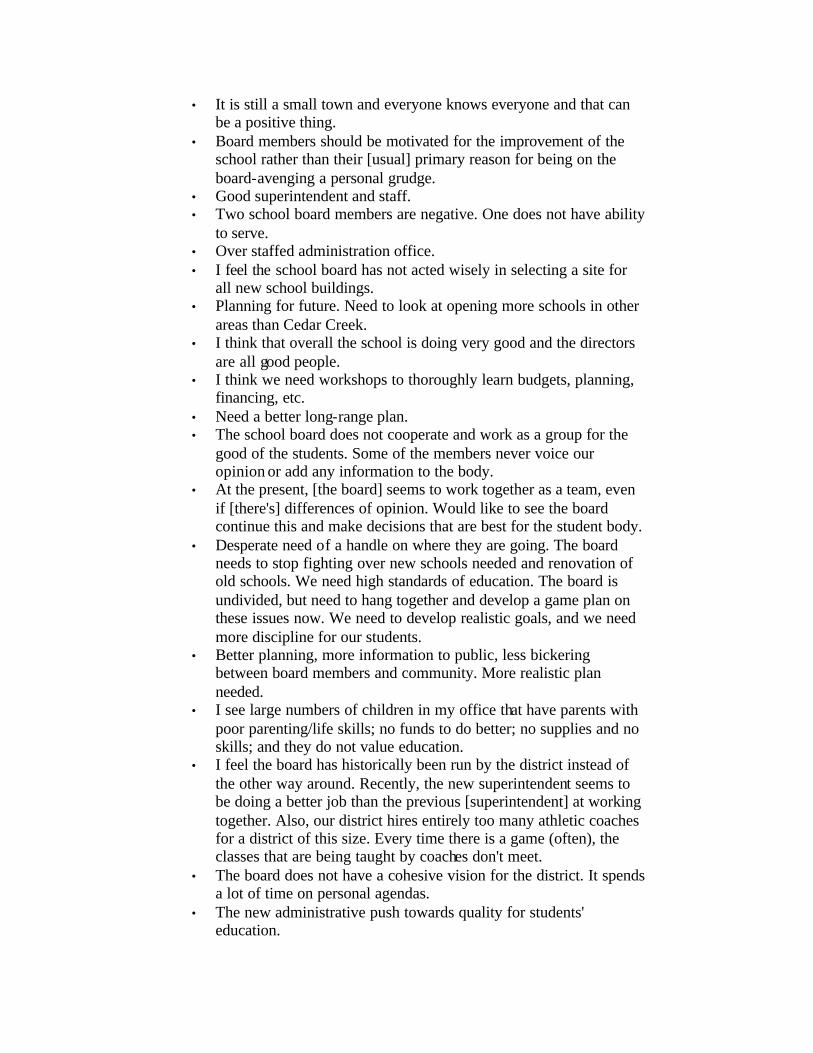
• It is still a small town and everyone knows everyone and that can be a positive thing.
• Board members should be motivated for the improvement of the school rather than their [usual] primary reason for being on the board-avenging a personal grudge.
• Good superintendent and staff. • Two school board members are negative. One does not have ability
to serve. • Over staffed administration office. • I feel the school board has not acted wisely in selecting a site for
all new school buildings. • Planning for future. Need to look at opening more schools in other
areas than Cedar Creek. • I think that overall the school is doing very good and the directors
are all good people. • I think we need workshops to thoroughly learn budgets, planning,
financing, etc. • Need a better long-range plan. • The school board does not cooperate and work as a group for the
good of the students. Some of the members never voice our opinion or add any information to the body.
• At the present, [the board] seems to work together as a team, even if [there's] differences of opinion. Would like to see the board continue this and make decisions that are best for the student body.
• Desperate need of a handle on where they are going. The board needs to stop fighting over new schools needed and renovation of old schools. We need high standards of education. The board is undivided, but need to hang together and develop a game plan on these issues now. We need to develop realistic goals, and we need more discipline for our students.
• Better planning, more information to public, less bickering between board members and community. More realistic plan needed.
• I see large numbers of children in my office that have parents with poor parenting/life skills; no funds to do better; no supplies and no skills; and they do not value education.
• I feel the board has historically been run by the district instead of the other way around. Recently, the new superintendent seems to be doing a better job than the previous [superintendent] at working together. Also, our district hires entirely too many athletic coaches for a district of this size. Every time there is a game (often), the classes that are being taught by coaches don't meet.
• The board does not have a cohesive vision for the district. It spends a lot of time on personal agendas.
• The new administrative push towards quality for students' education.
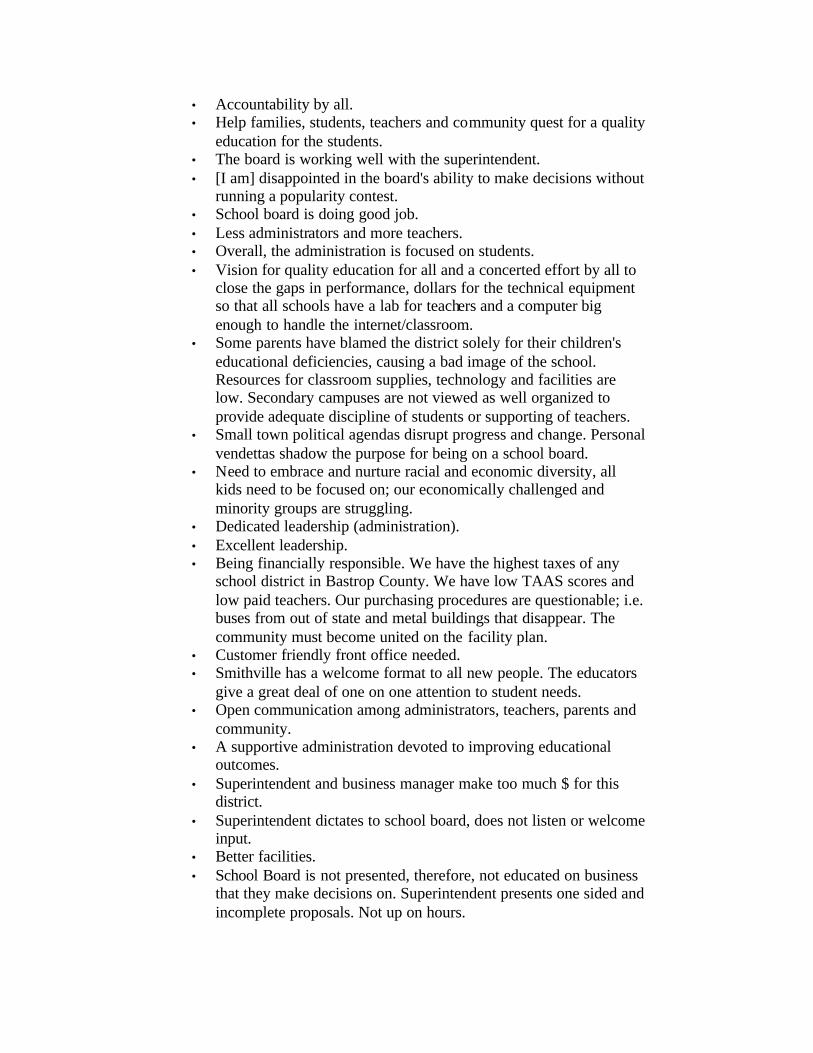
• Accountability by all. • Help families, students, teachers and community quest for a quality
education for the students. • The board is working well with the superintendent. • [I am] disappointed in the board's ability to make decisions without
running a popularity contest. • School board is doing good job. • Less administrators and more teachers. • Overall, the administration is focused on students. • Vision for quality education for all and a concerted effort by all to
close the gaps in performance, dollars for the technical equipment so that all schools have a lab for teachers and a computer big enough to handle the internet/classroom.
• Some parents have blamed the district solely for their children's educational deficiencies, causing a bad image of the school. Resources for classroom supplies, technology and facilities are low. Secondary campuses are not viewed as well organized to provide adequate discipline of students or supporting of teachers.
• Small town political agendas disrupt progress and change. Personal vendettas shadow the purpose for being on a school board.
• Need to embrace and nurture racial and economic diversity, all kids need to be focused on; our economically challenged and minority groups are struggling.
• Dedicated leadership (administration). • Excellent leadership. • Being financially responsible. We have the highest taxes of any
school district in Bastrop County. We have low TAAS scores and low paid teachers. Our purchasing procedures are questionable; i.e. buses from out of state and metal buildings that disappear. The community must become united on the facility plan.
• Customer friendly front office needed. • Smithville has a welcome format to all new people. The educators
give a great deal of one on one attention to student needs. • Open communication among administrators, teachers, parents and
community. • A supportive administration devoted to improving educational
outcomes. • Superintendent and business manager make too much $ for this
district. • Superintendent dictates to school board, does not listen or welcome
input. • Better facilities. • School Board is not presented, therefore, not educated on business
that they make decisions on. Superintendent presents one sided and incomplete proposals. Not up on hours.

• Unless full board it will fail. Overcrowded - you get criticized for poor maintenance, but poor facilities add to problem - example: bus barn.
• Decision on school board - general public doesn't understand funding.
• Due to a superintendent that is thorough, honest, and can present the facts/data, I feel the board is steadily moving in the direction of performing their elected responsibilities. I feel there are 1 or 2 that do not accept the facts and stifles the boards actions to move forward.
• The school board has not appeared to directly affect my job. I always go through my principal, he goes to the superintendent, and the superintendent decides if the school board becomes involved and if so, how. I would say that as a whole, they do what is best for Smithville ISD.
• I feel that the school board usually does the best it can collectively. They spend a lot of time working as leaders of the district. They usually work closely with the superintendent and look to him for the knowledge they need to do their jobs. There are rare occasions when you see personal agendas addressed rather than the community's concern.
EDUCATIONAL SERVICE DELIVERY AND PERFORMANCE MEASURES
• Bar has been lowered / starting to recover. • Much too much racial distinction. • Administrator spends too much time with forms - administrative
job too burdensome. • People should not be categorized. • TEA came in and told them to straighten up. • Teachers should not have to be disciplinarians. • Elementary school principal has an excellent program. • Need more options in courses taught. • Students are not getting prepared for college work or vocational. • Not enough technical courses. • I feel that, in general, the school district is doing a good job with
extracurricular activities (i.e. athletics, band, UIL competitions). • 4 R's, reading, writing, and 'rithmatic and Real World where the
original 3 R's are 3/4 of the curriculum. • Measure school effectiveness by graduate's contribution to society
not by a "test" given in school. Doesn't Smithville graduate many students that go on to become business leaders, politicians, musicians, doctors, lawyers, nurses, vets, military/civil servants, or just hard-working, tax-paying citizens?? I think we have!! No "test" can guarantee that or "make it better."
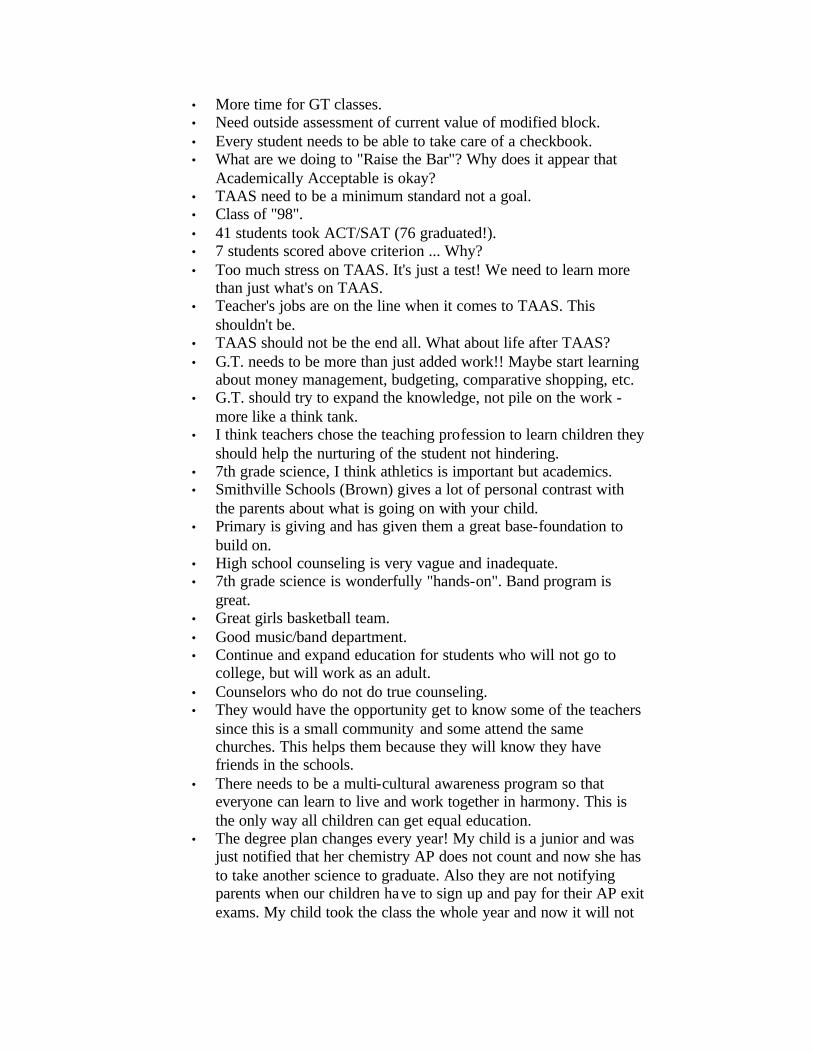
• More time for GT classes. • Need outside assessment of current value of modified block. • Every student needs to be able to take care of a checkbook. • What are we doing to "Raise the Bar"? Why does it appear that
Academically Acceptable is okay? • TAAS need to be a minimum standard not a goal. • Class of "98". • 41 students took ACT/SAT (76 graduated!). • 7 students scored above criterion ... Why? • Too much stress on TAAS. It's just a test! We need to learn more
than just what's on TAAS. • Teacher's jobs are on the line when it comes to TAAS. This
shouldn't be. • TAAS should not be the end all. What about life after TAAS? • G.T. needs to be more than just added work!! Maybe start learning
about money management, budgeting, comparative shopping, etc. • G.T. should try to expand the knowledge, not pile on the work -
more like a think tank. • I think teachers chose the teaching profession to learn children they
should help the nurturing of the student not hindering. • 7th grade science, I think athletics is important but academics. • Smithville Schools (Brown) gives a lot of personal contrast with
the parents about what is going on with your child. • Primary is giving and has given them a great base-foundation to
build on. • High school counseling is very vague and inadequate. • 7th grade science is wonderfully "hands-on". Band program is
great. • Great girls basketball team. • Good music/band department. • Continue and expand education for students who will not go to
college, but will work as an adult. • Counselors who do not do true counseling. • They would have the opportunity get to know some of the teachers
since this is a small community and some attend the same churches. This helps them because they will know they have friends in the schools.
• There needs to be a multi-cultural awareness program so that everyone can learn to live and work together in harmony. This is the only way all children can get equal education.
• The degree plan changes every year! My child is a junior and was just notified that her chemistry AP does not count and now she has to take another science to graduate. Also they are not notifying parents when our children have to sign up and pay for their AP exit exams. My child took the class the whole year and now it will not
count because I did not fill application and pay fee. But I was not notified!
• Also mentionable is the quality of counselor guidance in the curriculum/graduation area. There has not been any consistency in helping to guide our students. They have been on their own when seeking scholarships, etc., etc.
• The girls athletic program. Whether you like the Athletic Dept. or not, the girls have a tight, well-run, model program.
• Don't get me started on the boy's program in athletics. • Small town pride, mostly in relation to sports. An opportunity to be
well rounded, to succeed at more than one thing in your educational experience.
• Band program. Some individual teachers are outstanding, they typically ignore what occur with administration, etc. and simply close their classroom doors and teach.
• More "personal" care needed. District schools small enough to allow students/family to get to know principal/administrators.
• Students have much better chance to be on athletic teams (as opposed to larger districts).
• Good support at athletic programs. • Need more support at non-athletic programs. Would like to see this
financial audit. • Take a close look at basic subjects that need improvement - Math,
English. • There has been a lot of improvement in student participation i.e.
UIL, band, etc. • Things need improving: Program for at-risk kids. • Vocation subjects for the kids. • Good morals and values program. • Better programs for under-achievers. • More alternatives for at risk children. • Teachers seem to care and go extra mile to help children. It means
that they sometimes stay late to help or pay for needed items parents can't or won't supply. They support school sports here.
• I feel that the school has lost its focus on teaching our children how to learn. All the emphasis seems to be on how to pass a test (TAAS). After the TAAS test are over it seems the teaching stops.
• Individual teachers and principals show tremendous dedication to meeting needs of their students outside of expected school activities (for example: providing glasses and clothing) so the children can benefit from academics.
• Maintain closed campus. No benefit to allowing children to be off campus.
• Textbooks should be provided rather than photocopied pages from texts.
• Eliminate racial bias within classroom setting.
• Doing a good job getting their young people ready for college. • Dress code, our teachers and our young men need a clean shave
each day. Everyone has face hair. • I think the school needs to be moved from where it is and put in an
area all by itself. (did not indicate school board, just school). • Recovery of TAAS failures in 11th and 12th grade. • More emphasis on keeping new TAAS passers in 8th grade for
remediation. Repeat 8th grade math, reading, or writing until on grade level.
• Outstanding students, athletic programs, Tiger Bells, etc. • (Improved or done away with) school focuses on TAAS - seem to
lose focus on regular lessons. Some teens have problems no one pays attention to. (Being threatened by other students).
• More basic education. • Very good English and science departments. • Things that need to be improved: Ways to get more minority
parents involved. • Too much money spent on sports - high school . • TAAS camp. • Counselor needs to support students and family. • Drop out prevention. • Access to student records is given to some, for example, athletes,
and not available to other programs such as the Migrant Coordinator.
• Size, small individual attention, technology improvement, class size and efforts at improving education of children.
• Parents would be very excited with pre-k, K, 1st-3rd for the academic challenges and climate at Brown. The elementary. is focused on vocabulary and math and lots of ext ra reading encouragement. The junior high has great science and extra curriculum, high school has spots of exceptional experience, band, chemistry, social studies, English, basketball.
• Prioritizing tight resources and time for maximum instructional effort for student mastery.
• Need HS career and tech development for students. • Quality of math mastery needs to improve in most grades - grade 6
has the least distance to improve. We want Smithville graduates to be mathematically prepared for college or career.
• Our schools are the center/hub of the community. Smithville's children are #1 followed by athletic programs. Lots of extra-curricular activities for students. Fellowship of Christian athletes a big plus.
• Small class sizes. • Instruction and staff at Brown primary and elementary. • Children receive a quality education at these two campuses. There
is an ample supply of available technology to increase learning.
• Special needs children must be worked with by addressing learning styles.
• Primary school is good; diverse population and high achieving. • District is small; staff and children know each other; kids don't fall
through cracks. • Lots of extra-curricular activities; UIL, DECA, athletics, FFA,
FHA, bank, choir, Dixie, etc. • Strong curriculum focus from central office. • Mathematics curriculum needs to be improved throughout. • Academic standards need to go higher, much higher; we don't
expect enough. • Recommend for teachers: More planning time and higher
standards/expectations for their instruction and student achievement.
• Strong community support at athletic events. • TAAS scores, especially in math. • Expanding high school (need a new one). • SAT/ACT scores. • Getting more kids involved in extra curricular activities (kids need
to belong). • More counselors. • Steady improvement in TAAS scores and academic problems. • Provide more counseling services to students. • Mentoring migrant students. • Class size, students get a lot of attention. • Organized curriculum - students are held accountable for TEKS
via frequent check points. • The arts need to be addressed at the elementary level. Music,
theater, and visual arts need a place in the curriculum. • High school curriculum and delivery of curriculum need to be
improved. • The content mastery team at the high school this year is much
better than last years. Expectations are higher; students are working harder and learning.
• Growing support organizations for each campus. Pride in school because of winning athletic programs. UIL competitions are helping to strengthen pride in our community.
• Smaller class sizes and fewer pull-out programs. • Because education is vital to our community, I feel that our schools
have more control of the students (discipline) than schools in larger cities. And a good and healthy environment.
• Getting results in improving student success. • Minimize paperwork or activities that interfere with instructional
time. • Commend: SAP - Student Assistance Program. • Good, sound, basic education for motivated students.
• Wide variety of extracurricular opportunities. • Growing emphasis on utilizing technology in instruction. • U.I.L. - athletic and literary - is strong. • Library services are supported by the administration and libraries
are constantly being upgraded, but -. • Libraries need to be brought up to recommended standards. Gangs,
racial issues, discipline, staff turnover, narcotics/alcohol, utilization of technology, attracting new educators to the school system.
• Innovative programs are implemented as found successful. • Character Education Program. • 90 minutes Math and Language Arts daily. • Need Special Ed. counselors - specifically Special Ed. • Positive programs: CEI Reading labs, Looping in primary grades,
Teaming in primary grades, Saxon Phonics - K-3. • Align TAAS concepts to a mastery time line. • Hiring a wonderful curriculum director. • Cap class size in grades K-4 to 18 to 1. • Academic expectations at the high school level are rising. • Counseling services from outside agencies (Team Connection,
Family Crises) are available. • Student Assistant Program was implemented this year. • We address the needs of both the academically gifted and
challenged. • Testing, practice TAAS in all levels. • Special Ed. classes and content mastery classes to help children
with special needs. • Increase size of the library. • Have a full- time computer lab with new equipment. • Availability of reading programs for those working below level at
the primary level - smaller class sizes (17-19) at the primary level - smallness of district helps keep kids from falling through cracks - staff knows most students on their campuses - availability of all administrative staff to the rest of the staff - "caringness" of faculty.
• Improve GT programs. • Full time Special Ed counselor from the co op in district. • Academic instruction is improving; TAAS scores are going up;
good leadership is in place; expectations are being raised. • Special education programs a plus! • Sequence of instruction in various disciplines K-12. • Faculty works well together, work for the best interests of the
child. • More counseling at each campus in addition to Special Ed
counselors for those needing more than the regular counselor can give (640 to one counselor).
• Open Pre-k to everyone.
• Add a 3 year old program (now that the curriculum has higher expectations, K is doing what 1st used to do, we need intervention sooner).
• More opportunities for vocational classes on secondary level.
COMMUNITY INVOLVEMENT
• Community involvement is great. The superintendent is involved in the Chamber of Commerce and other committees. A very good superintendent.
• A lot of apathy. No PTA 'til last year. Cafetorium 4 years old. • 150 PTA members. • A core 10-15 that are doing the whole amount of work. • Parents not involved. • Possibly socio-economic - in high school, kids don't want parents
involved. • Nothing for 19 years as far as PTA. • 2 students responded or 5 or 6 adults responded. • Kids did not want it because these would not have alcohol. • Very few teachers are members. • School Board members discourage it. • Now Superintendent behind us as well as high school., middle
school, and elementary. Support PTA. • Function in 3 basic areas: Teacher advocacy, Environmental -
"Pride in School", Tiger Pride Park - picnic tables - a project that is in the plans.
• I think the notices and announcements should be sent home through the mail or told to the parents and community of our town instead of relying on the kids to get it to them. If it doesn't, then they just say, "Oh well, it's not our fault, it's theirs (the kids).
• Parental involvement? Non-existent in most instances. Why? What do we do to get parents involved? Teachers and administrators cannot do it all. No community relations. No business/school partnership. Where are the mentors and business sponsors?
• Parents need to balance the scale before we can successfully draw in the community.
• Involvement starts at home. • Thanks to the Smithville Times!! • Smithville has a vast amount of school/civic involvement for a
town our size. ISD just needs to not think of us as adversaries. • Opportunity for parent involvement to whatever degree desired
(Not taken advantage of). • Also, parental involvement is sooooo low. • Concentrate on improving academics. • The school is actively involved within the community. • Participation in community affairs.
• Working with city and police department. • Somehow - tell several citizens to "butt out" of school business -
causes unrest. • Good community involvement. • Things the school is doing well: Communication with the
community. • Warm, friendly atmosphere for students at school with community
activities to support after school free time. • Smaller district closer relationship, friendly atmosphere. Not as
many drug/gang problems. Working hard on focusing on academics.
• Newly formed positive PTA working to beautify campus and improve morale of teachers.
• Many caring, talented teachers and principals. • Safe, friendly, well-rounded education. • Strong community involvement. • Small hometown atmosphere (safe). • Involvement in community. Example: Children donating food to
Community Pantry at Christmas. Also visiting nursing homes. • Booster Club raising money for classrooms. • Team spirit in regard to responsibility of success of students. • More parental involvement in education of their children. • Positive input from community - all we hear is negative. • Community support for meeting facilities and staff needs. • Small town atmosphere allows for a more personal relationship
with teachers; community support for the schools; less influence from problems in big city; teachers, principals, administrators more accessible.
• Tremendous community support for sports teams. Boys and girls teams are supported with banners and painted store windows downtown. Families and fellow students "parade" through town, horns honking, for away games.
Appendix A
COMMUNITY COMMENTS B. Part 2
PERSONNEL MANAGEMENT
• Hire teachers that teach, not those who sit around for the pay check, they're there for a reason.
• I even have a teacher who passes out a handout or so, sits down, if we get finished early, we can go to band, if you're in it, or play.
• If we read a book that has an audio, we listen to that, those who do listen instead of reading it as a class, and if we finish a book, we watch the movie. That's fine and all, but think of what we could be learning, and think of what we'll do next year or the year after when teachers don't tolerate that and most of the kids will be lost and flunk because they were babied too long.
• Address teacher retention. • What is the ratio of teachers to teacher/coach or coach/teacher? • Aides are not always told all their duties when they are hired.
Duties also change according to the needs of the school. • There has not been one staff development this year for aides. • Why are jobs filled before they are ever published? • Aides and teachers that handle special children should be paid
more than the regular aides and teachers. • Too many coaches - need more teachers. • Subs are paid more than full time teacher aides - WHY? • Why aren't "special ed." aides paid more than the average? I think
they have a much more tedious job a lot of the time. • School aides are underpaid for the jobs they do. There should be a
salary scale equal to other schools. • Senate Bill 1 increases the state minimum salary by $300 per
month. Who is covered by this minimum? • All aides are underpaid for jobs they perform and amount of
responsibility. • Yes, aides are underpaid, but they knew going in the work would
be difficult and teachers pay! • Coaches unable to teach assigned classes (science) due to lack of
knowledge!! • Why can't schools pay overtime? Many of the paraprofessionals
work over on their own time. • All of our inservices have been about TAAS. • We have a lot of good qualified teachers who care. This year my
child has a teacher for 3rd grade and she goes out of her way to help our children. She is a great teacher.
• Mary S. teaching TAAS for 3rd grade is just great. All other teachers go to her for help and other schools call for her to come to their schools to help their teachers teach TAAS for 3rd grade.
• Improved and expanded special education department. • Need "higher level" of teachers for more advanced classes. • Too many coaches on staff who are teaching academic courses
they are not expert at. • Needs to attract better teachers. • Better educated teachers. More training. • Higher standards for student products. • More writing, improved math instruction. • Has some really great teachers in Brown and elementary school.
Superintendent doing good job. • More pay for teacher. • Need to have better teachers with more pay. Need to try to control
the drug problem. Need to have parenting classes as some parents are using the school system for a baby sitter and to raise their children.
• Teaching staff is caring, intelligent, and genuinely work to educate each child. Community involvement is strong. Administrative staff is now goal focused and actively pushing positive reforms/programs.
• SISD is a small district and our students and parents know each other. Many of our staff have students in the system. It is a caring safe atmosphere. We are striving to improve the level and quality of education.
• Relatively small size, teachers know students on a personal basis, academically focused and goal oriented.
• Teachers - need to receive positive feedback and a computer in each room.
• Enticing strong certified teachers in shortage areas (math/science). • Funding for teacher conventions, etc. Teachers need to know that
they are appreciated. PTA has helped. • Dedicated staff. • Teachers need to feel appreciated, not necessarily monetarily. • Give new teachers better support and assistance in areas needed. • Better and more equitable pay scale. • Caring staff; stress individual progress and achievement,
curriculum leadership/focus of central administration, smaller class sizes than larger school districts, due to district size, students are less likely to be lost and not have needs addressed, everyone is involved and knows most students on each campus.
• This school district needs stronger teachers that have more to offer than "Lesson 1 on page 3". Most students can only be as good as their teachers. They are, in some cases, the only role models in their lives. Need teachers that are strong, well-educated, and

compassionate. Special kids need special attention and unity with the community is important.
• Better pay and benefits. Program to keep them updated in all areas of education.
• Raise salaries to be more competitive with area schools. • Caring faculty and staff, knowledgeable. • Poor recruiting of teachers, administrators, personne l. No rewards
or incentives to keep or hire. • Failure to recognize superior achievement district wide and
campus. • Registrar for high school in order to allow more career and social
counseling of students. • Not sharing teachers with junior high. . • More support staff, i.e. - office staff, aides, counselors.
FACILITIES
• Vote for 3 new classrooms and science room. • Elementary is over crowded. • Why can't they paint the buildings? • A metal portable building was purchased, but it was found in
someone's pasture. • Looked at cost of portables being built on site instead of
purchasing them. • Lack of maintenance - can't get broken windows repaired - Why?? • Cleaning crew comes in from outside - contract out. • Money use for portables needs to be spent on a new campus or
main building! • Why displace 100+ students for the sake of 20 adults? What about
KIDS FIRST? (The lease was up and building went on market but was the best decision at the time.).
• Why do we have to leave our lights on after school? Can't the custodians flip a switch? How long is it before our lights are turned off?
• Ask for public comments about building needs. • Custodial needs should be taken care of in-house. • Our buildings are filthy now. • Cafetorium stage is always dirty. Classrooms usually clean. • In house custodians. Our building health environment has suffered
tremendously after the outside contract work was hired. They are not fully staffed to handle our campus.
• Portables - are they cost effective? Why isn't the administration in a portable with NO RESTROOM instead of children?
• We need restrooms. 120 children need a place to potty! • Is "outsourcing" ALWAYS best? Do think so.
• Don't think we'll have a "big wave" such as Bastrop. But let's not get caught in the headlights either. Let's plan ahead and when (not if) SISD gets new facilities, there should be no portables necessary for say 7 years. Do as SISD teachers, THINK.
• Do not be blinded by something to impress the traveling public down SH71. They don't go to school here!! Let our graduates make impressions. If it is cheaper to get land off of SH71 (which it is), put it into educating the children. Every town has a school. Make it a quality one and more than we dream of will come and it can only help make it the BEST.
• Convincing the community that new and better facilities are needed for children to keep up and making the right decision on priorities of facilities.
• Small class sizes at primary level. • All campuses but one located together. • Larger buildings or a new school for a new campus. • Facilities and quality teachers in core subjects - quality teachers is
most important - then we need adequate facilities. • Size/building issues vs. finances available. • Facilities - more room, need a full time librarian at Junior High. • The sites are too crowded. Kids have no place to play. The
buildings are not maintained. The teachers budgets are cut and they have no supplies when they need them. Teachers who have taught for 20 years or 30 years have their pay cut or no raise because they have too many years.
• Better facilities/more facilities. • Things that need improvement: Supervision of grounds and
building maintenance programs. • Need tax issues better explained. • Need for construction. • Put offices in trailers - kids in classrooms. • Facilities, funding, it is hard to convince people that you have to
build today for tomorrow's growth and how to pay for it. We are already close to max tax rate and need to build and open a new facility, will there be enough funds to cover increased operating costs?
• Passing a bond issue to fulfill our needs. . • SISD needs new buildings. We are going to need to make the
taxpayers understand this need but do it in a conservative manner. • Inadequate facilities due to growth, public perception of the
district, no confidence, difficulty in recruiting exceptional teachers (or even average and above, at times).
• The number 1 problem, we are outgrowing the facilities we have now and if these issues aren't resolved, we will be so far behind, we'll never catch up.
• Facilities - (No more portables) - crowded classrooms future growth issues must be addressed.
• Facilities need to be updated, especially at secondary level, but primary level too.
• Wonderful new rec. center with numerous activities. • Small campus size enables students to be recognized and treated on
an individual basis. • Lack of facilities that are adequate to keep the safe environment
here and keep pace with the educational needs of all students (regular ed. students and special needs students).
• Improve physical facilities at the Junior High (new school, etc.). • We must have improvement in maintenance of current facilities, as
well as new facilities to address the needs of our students. We need more classrooms, science labs, libraries, and athletic facilities.
• Improved facilities - more space/classrooms to meet the growing population needs. More computers are needed and the students need to use them. All of this requires money, which will require a change in attitude in Smithville.
• A larger budget to cover growing needs; more facilities, i.e., classrooms, office space, staff, etc.; providing more programs for non-college bound students, providing appropriate need for ever changing types of discipline problems at all levels.
• Challenge - facilities. • Better facilities - labs, etc. • Do something about custodial service.
FINANCIAL MANAGEMENT
• Appraisal district made every effort to even the district. • 4 years ago, building bought by school district for $80,000. That
building was asked to be reappraised. School district later bought the building for $250,000.
• 12 years ago, high school built with provision to have 8 additional rooms. Since then, there has been a support to build a new high school. Never considered adding the rooms.
• School Bond 6 years ago to build the cafetorium. Add on to existing school part of Bond completed. (Bond was changed - was done without public knowledge.).
• Almost a school built here in 1998 - Voted on a Bond issue - it failed. School board still decided they'd go buy the 40 acres across the road. From $5,000 to $6,000 an acre. School board was negotiating for that piece of ground for $20,000 an acre. Negotiating behind closed doors. (Petition was started and this was halted.).
• No financial credibility left on existing board.

• New administration wants to enter into a building project. Want new high school. 100 acres on south side of town (approved a $10,000 option to buy that land at $2,200 an acre). Want to see the appraisal of that piece of ground and FEMA Report.
• They need to put some off to the side so they have some to fall back on or for the kids' needs instead of the staff's needs. They also need to plan far ahead, not right now wants but later on needs.
• There is too much spread between "rich" school districts and "poor" ones, i.e. Smithville. More consideration needs to be taken into account for those districts receiving Federal Funds. Every student, no matter where, deserves the same opportunity to learn whether it be in technology or simply textbooks.
• Too much money spent on athletics. Can't even paint the walls in the classrooms.
• Too much emphasis is put on athletics! As a result, too much money goes in that direction! Could be better spent on up-to-date school books and computers.
• $ spent on athletics should be spent only if it benefits education in return and those participating in said athletics get a return on their extra time and investment. Where is the emphasis?
• Just be responsible. Everyone wants money for their "cause". Be open with the budget. Our primary mission is effective education - no matter what method.
• Not having the new things that bigger schools have to help teachers teach because the lack of money.
• Proper management of funds is critical. Older residents will not support bond if they feel money is being mismanaged or wasted.
• Better pay.
ASSET AND RISK MANAGEMENT
• Last year, had a shortage of books. Some teachers only had one set of books at the High School.
• Business Manager - does not have the information athletic equipment inventory (possible red flag), gone or lost a lot of this equipment.
• Not been following business management practices. Don't know if they are investing property. Who directs them?
• Health insurance should be through the State, not each district. • An increase in insurance took a good deal of our "raise". • Full compensation if injured at work. • Health benefits should be on Cafeteria Plan so employees can
purchase insurance needed. Employees who do not use insurance loose this benefit. Money should go to employee to purchase other types of insurance (i.e. Dental, cancer, life policies).
• We need State insurance and the employee's insurance is paid for. It is sad to say that you work a full time job and can't afford to pay for insurance for your family. You should not be charged a days leave because of a doctor's appointment for a work related injury. The day comes out of our sick leave. If you are injured at work, it should not be counted against you.
• Take care of the employees who teach/work with our children. Follow state laws, but help the employees get/keep the benefits they deserve.
• Again, act responsibly as these topics can have long-term effects.
PURCHASING
• No possible bids going out. • A hearing was conducted - but not by TEA, only by a friend of the
administrator. • Recommendation made that they look at internal auditor or at
auditing reports. • We need more books. My book has no spine and is 9 years old. . • Our English or History books are old enough our teachers say
"Well, don't do it like that. They changed that rule a few years ago." Or "Well, now 6 years later, we have this and that going on.".
• Why aren't there enough books in each subject for each student? • Use the text books! • Textbooks are outdated. Why? Money? • Old and not enough books. Students destroy them and don't pay for
the damage! • Why are classes short on books for all students? • The books aren't bad, it is that they are rarely used. • Why can't schools just use lowest bid instead of approved vendors?
We're poor, we need Wal-Mart pricing. • Make purchasing easier for teachers, i.e. It' s difficult to go to Wal-
Mart. • Look at server-based textbooks and only stock "paper" texts for
students without computer access.
TRANSPORTATION
• 7 buses that have been purchased in last 5 years not acquired with competitive bids (whitewashed) credibility problems in procurement.
• 12 condemned bridges in county within the school district created rerouting in district. Rerouting of buses meant they drove longer and further to cut out some city routes.
• There's only 2 things to say: WE NEED MORE NEW BUSES, and have the bus drivers treat kids with the respect most of us do.

• I dislike the choices and decisions made by staff and the high school principal. Students have been cheated out of the placements, awards recognitions, and much, much more because of the mistakes of the staff.
• Nice buses, organized schedule, clean and safe as well. Nice drivers.
• Drivers need more control. Schedule is great and well routed. • I think there's only one thing to say: NEW BUSES! • Why are school groups "renting" instead of using school-owned
buses? Is this cost effective? • Shorten bus routes. • Transportation for kids. • Need transportation. Need prayer in the school. I don't have any
children in school, I really don't know what to say about the school.
• Continue bus, to pick up children on south side. Returning call from teacher. Continue crossing guard. The need of prayer in school. expand vocational program.
• Needs school bus services, closer teachers attention, more teacher aids.
• Band, football, busing, center, we need more stores so we won't have to go so far to shop.
• Return to city busing.
FOOD SERVICES
• Children should not be allowed to charge food. • Atlanta, Georgia, 40 years ago found that by serving a nutritious
lunch, the average IQ of the whole school district was raised 15 points. The most important thing a school can do for immediate improvement is to control the nutrition. The SV menu is bad.
• Vending machines around the corner and used during lunch. • Fast food served in Cafeteria as opposed to balanced. • Closed campus. • Food is superb. • Food needs to be good, new, and a bigger variety. • Lower the prices on the food. • My child has consistently said (for 5 years in SISD lunchroom)
food is served undercooked and cold by the time he gets to it. (High school eats last.).
• Good food. • Put snack and soda machines in teacher's lounge instead of in the
hallways (for the children's use after school). Many students are late in the afternoon due to the snack machines.
• Everything is fried! The parents have no idea that their kids are eating ice cream and sodas for lunch.
• We need more people on the cleaning crew. Food is still on the floor and tables when our children come in to eat lunch.
• We teach and stress the importance of balanced meals (in the classroom). Let's reinforce this teaching in the cafeteria meals!
• The food tastes terrible. • More healthy food, vegetables (not more potatoes), FRUIT! • Better food choices. • There needs to be more food offered. • Need meat, not soy products. • Bring in foods from restaurants, such as McDonalds, Pizza Hut,
Taco Bell, etc. • More snack machines. • Healthy food - too much fried, canned, and fake food for our
money. • Food is not tasty at all! • This food probably has better nutritional value than what a lot of us
are eating at home. Please worry more about what is going into our children's minds than what is going into their mouths.
• My children complain about the food taste. • Taste is fine. It's what we get for our money that bothers me. • Change in menu every once in a while would be good!
COMPUTERS AND TECHNOLOGY
• New ones, definitely no question about it. There are computers my sister used and they were a few years old when she used them and she's in her second year of college!
• Look into grants, etc. for major IT companies to put this technology into each student's hands. It has to be HANDS-ON!! This is not a topic to be read about.
• If we cannot afford computing HW/SW, look into Internet access HW/SW for students/parents to access SISD servers holding learning materials, assignment, supplemental information.
• Be sure B/Admininstration Technology is current, easy to use, and effective to make sound decisions. Train staff intensely!
• Technology is not keyboarding!! • Old, out-dated computers in the classroom. Why was a new lab
build (PC) when it wasn't very old? Why didn't the teachers get the "old" Macs?
• Teachers should be trained just as much or more as our children are. Sometimes the teachers feel inadequate with our knowledge of computers!!
• Those of us 40+ are behind the curve. At least help us to do basic computing.
• Put textbooks on servers accessible 24 hours a day (teacher notes, assignments, etc.)
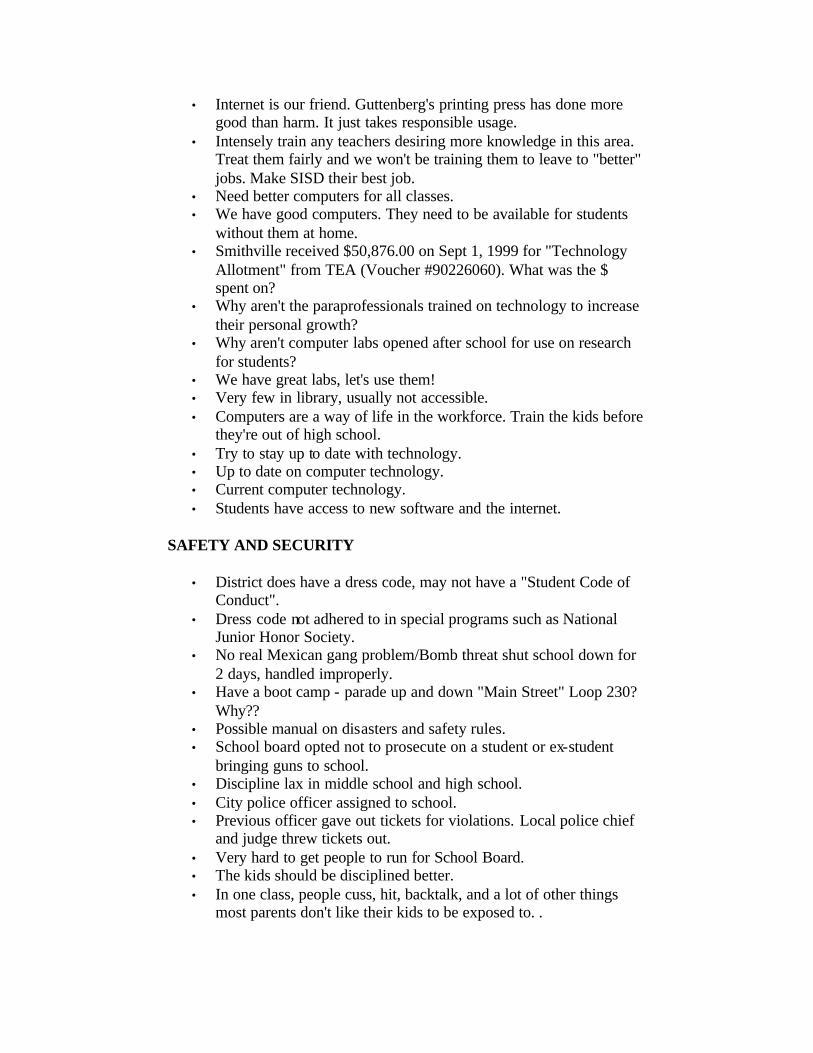
• Internet is our friend. Guttenberg's printing press has done more good than harm. It just takes responsible usage.
• Intensely train any teachers desiring more knowledge in this area. Treat them fairly and we won't be training them to leave to "better" jobs. Make SISD their best job.
• Need better computers for all classes. • We have good computers. They need to be available for students
without them at home. • Smithville received $50,876.00 on Sept 1, 1999 for "Technology
Allotment" from TEA (Voucher #90226060). What was the $ spent on?
• Why aren't the paraprofessionals trained on technology to increase their personal growth?
• Why aren't computer labs opened after school for use on research for students?
• We have great labs, let's use them! • Very few in library, usually not accessible. • Computers are a way of life in the workforce. Train the kids before
they're out of high school. • Try to stay up to date with technology. • Up to date on computer technology. • Current computer technology. • Students have access to new software and the internet.
SAFETY AND SECURITY
• District does have a dress code, may not have a "Student Code of Conduct".
• Dress code not adhered to in special programs such as National Junior Honor Society.
• No real Mexican gang problem/Bomb threat shut school down for 2 days, handled improperly.
• Have a boot camp - parade up and down "Main Street" Loop 230? Why??
• Possible manual on disasters and safety rules. • School board opted not to prosecute on a student or ex-student
bringing guns to school. • Discipline lax in middle school and high school. • City police officer assigned to school. • Previous officer gave out tickets for violations. Local police chief
and judge threw tickets out. • Very hard to get people to run for School Board. • The kids should be disciplined better. • In one class, people cuss, hit, backtalk, and a lot of other things
most parents don't like their kids to be exposed to. .
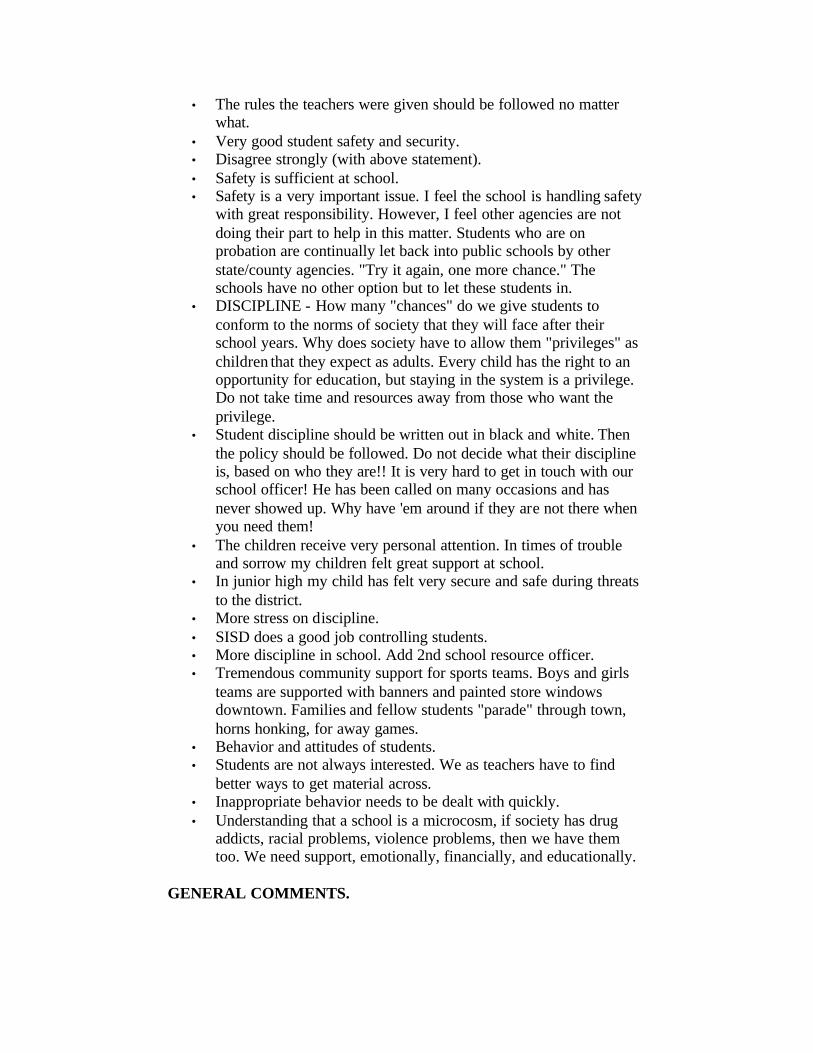
• The rules the teachers were given should be followed no matter what.
• Very good student safety and security. • Disagree strongly (with above statement). • Safety is sufficient at school. • Safety is a very important issue. I feel the school is handling safety
with great responsibility. However, I feel other agencies are not doing their part to help in this matter. Students who are on probation are continually let back into public schools by other state/county agencies. "Try it again, one more chance." The schools have no other option but to let these students in.
• DISCIPLINE - How many "chances" do we give students to conform to the norms of society that they will face after their school years. Why does society have to allow them "privileges" as children that they expect as adults. Every child has the right to an opportunity for education, but staying in the system is a privilege. Do not take time and resources away from those who want the privilege.
• Student discipline should be written out in black and white. Then the policy should be followed. Do not decide what their discipline is, based on who they are!! It is very hard to get in touch with our school officer! He has been called on many occasions and has never showed up. Why have 'em around if they are not there when you need them!
• The children receive very personal attention. In times of trouble and sorrow my children felt great support at school.
• In junior high my child has felt very secure and safe during threats to the district.
• More stress on discipline. • SISD does a good job controlling students. • More discipline in school. Add 2nd school resource officer. • Tremendous community support for sports teams. Boys and girls
teams are supported with banners and painted store windows downtown. Families and fellow students "parade" through town, horns honking, for away games.
• Behavior and attitudes of students. • Students are not always interested. We as teachers have to find
better ways to get material across. • Inappropriate behavior needs to be dealt with quickly. • Understanding that a school is a microcosm, if society has drug
addicts, racial problems, violence problems, then we have them too. We need support, emotionally, financially, and educationally.
GENERAL COMMENTS.
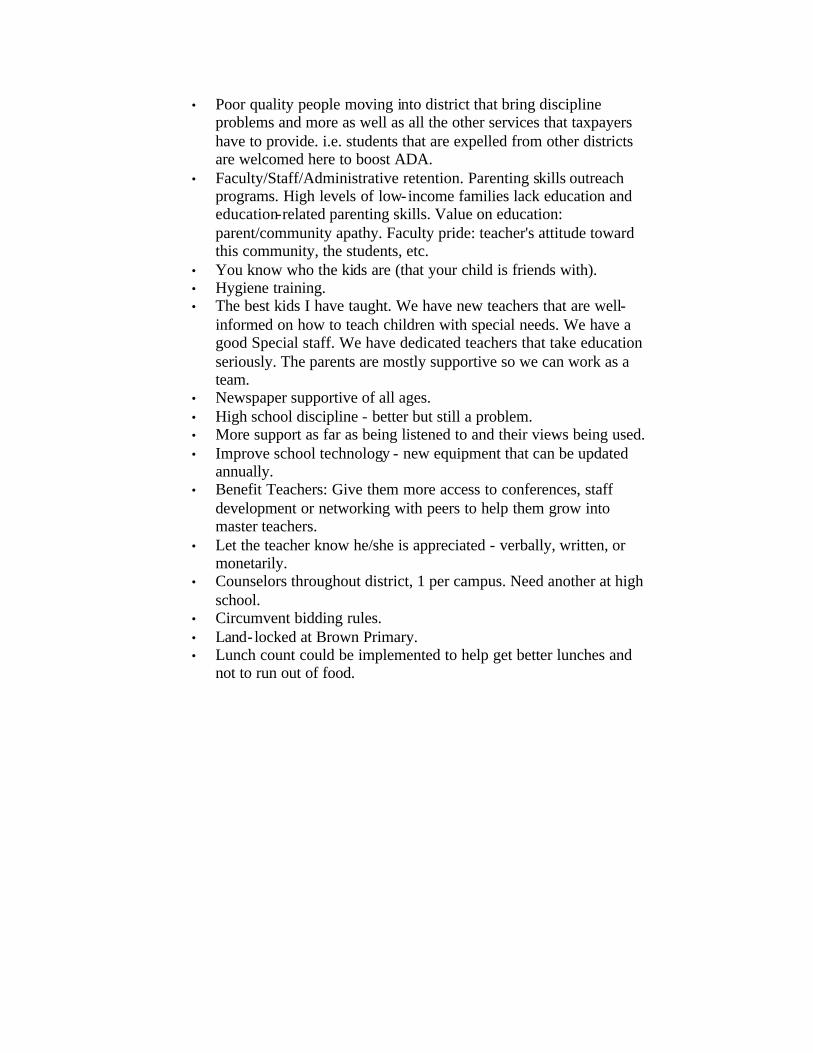
• Poor quality people moving into district that bring discipline problems and more as well as all the other services that taxpayers have to provide. i.e. students that are expelled from other districts are welcomed here to boost ADA.
• Faculty/Staff/Administrative retention. Parenting skills outreach programs. High levels of low-income families lack education and education-related parenting skills. Value on education: parent/community apathy. Faculty pride: teacher's attitude toward this community, the students, etc.
• You know who the kids are (that your child is friends with). • Hygiene training. • The best kids I have taught. We have new teachers that are well-
informed on how to teach children with special needs. We have a good Special staff. We have dedicated teachers that take education seriously. The parents are mostly supportive so we can work as a team.
• Newspaper supportive of all ages. • High school discipline - better but still a problem. • More support as far as being listened to and their views being used. • Improve school technology - new equipment that can be updated
annually. • Benefit Teachers: Give them more access to conferences, staff
development or networking with peers to help them grow into master teachers.
• Let the teacher know he/she is appreciated - verbally, written, or monetarily.
• Counselors throughout district, 1 per campus. Need another at high school.
• Circumvent bidding rules. • Land-locked at Brown Primary. • Lunch count could be implemented to help get better lunches and
not to run out of food.
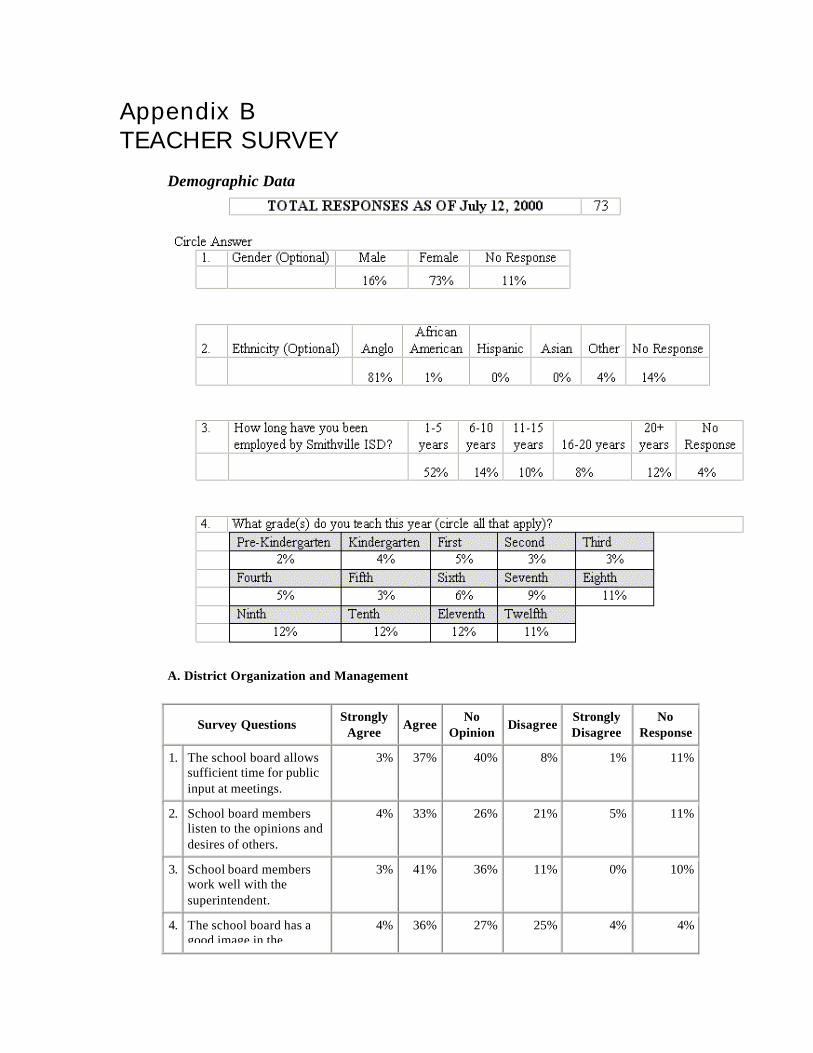
Appendix B
TEACHER SURVEY
Demographic Data
A. District Organization and Management
Survey Questions Strongly
Agree Agree
No Opinion
Disagree Strongly Disagree
No Response
1. The school board allows sufficient time for public input at meetings.
3% 37% 40% 8% 1% 11%
2. School board members listen to the opinions and desires of others.
4% 33% 26% 21% 5% 11%
3. School board members work well with the superintendent.
3% 41% 36% 11% 0% 10%
4. The school board has a good image in the
4% 36% 27% 25% 4% 4%
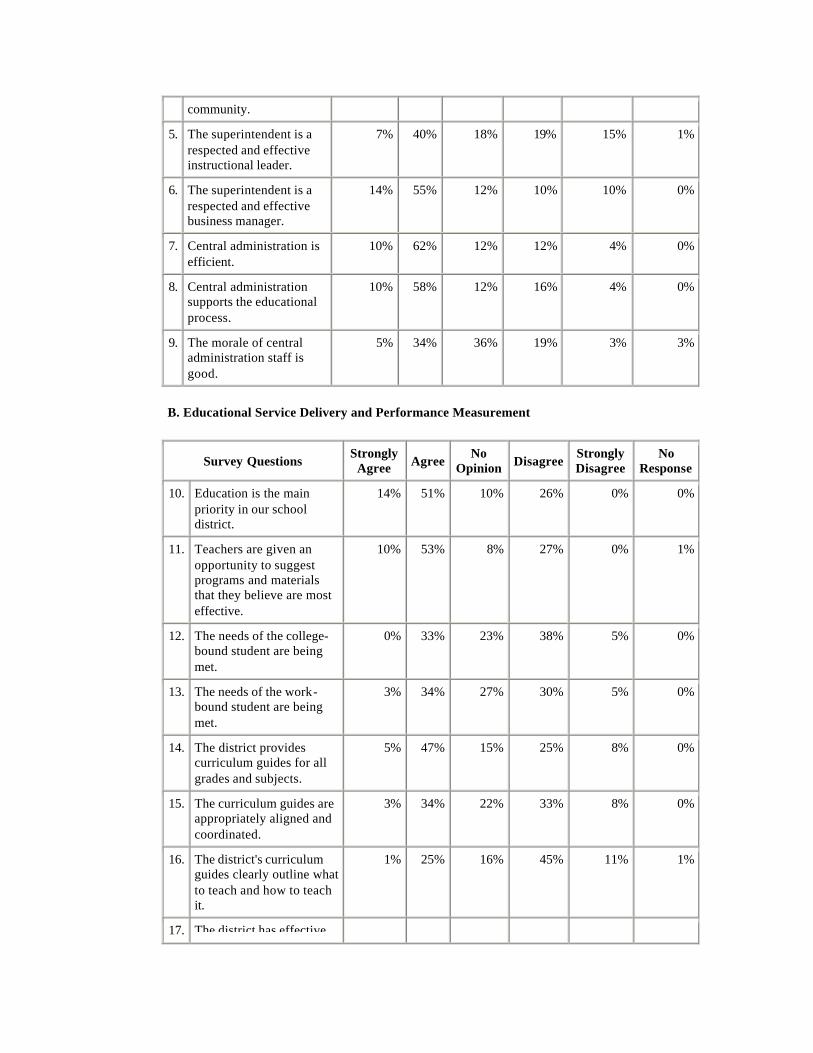
community.
5. The superintendent is a respected and effective instructional leader.
7% 40% 18% 19% 15% 1%
6. The superintendent is a respected and effective business manager.
14% 55% 12% 10% 10% 0%
7. Central administration is efficient.
10% 62% 12% 12% 4% 0%
8. Central administration supports the educational process.
10% 58% 12% 16% 4% 0%
9. The morale of central administration staff is good.
5% 34% 36% 19% 3% 3%
B. Educational Service Delivery and Performance Measurement
Survey Questions Strongly
Agree Agree No
Opinion Disagree Strongly Disagree
No Response
10. Education is the main priority in our school district.
14% 51% 10% 26% 0% 0%
11. Teachers are given an opportunity to suggest programs and materials that they believe are most effective.
10% 53% 8% 27% 0% 1%
12. The needs of the college-bound student are being met.
0% 33% 23% 38% 5% 0%
13. The needs of the work-bound student are being met.
3% 34% 27% 30% 5% 0%
14. The district provides curriculum guides for all grades and subjects.
5% 47% 15% 25% 8% 0%
15. The curriculum guides are appropriately aligned and coordinated.
3% 34% 22% 33% 8% 0%
16. The district's curriculum guides clearly outline what to teach and how to teach it.
1% 25% 16% 45% 11% 1%
17. The district has effective
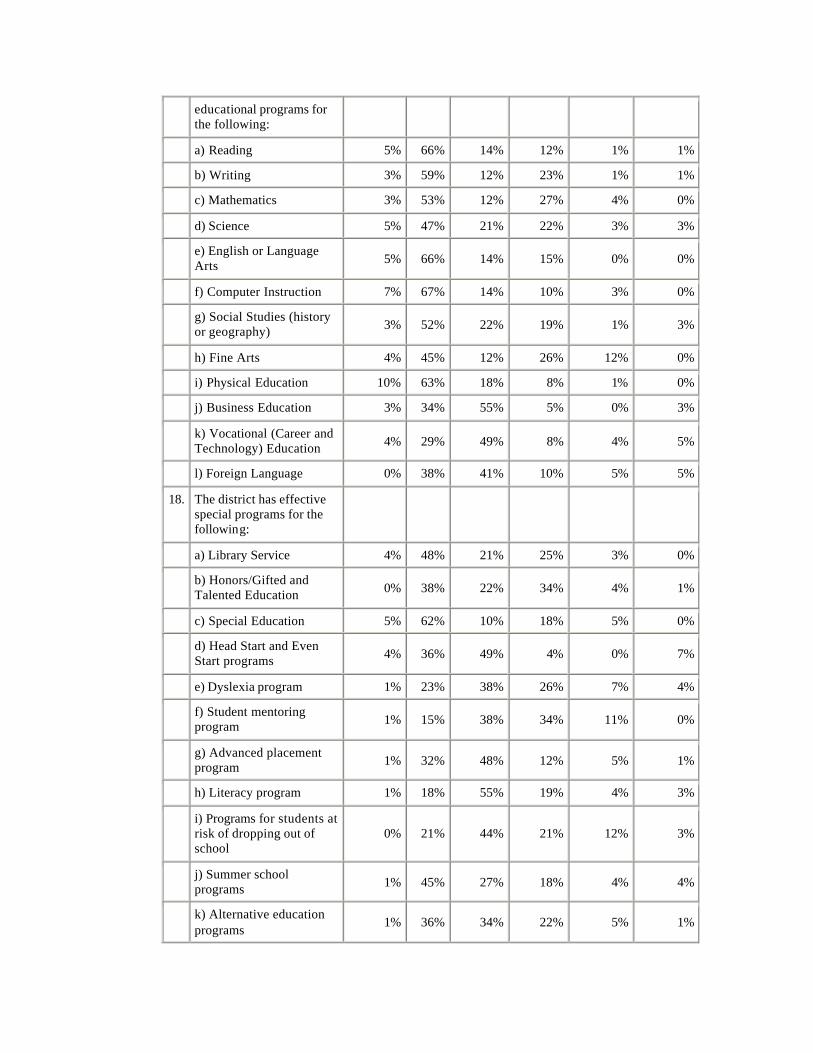
educational programs for the following:
a) Reading 5% 66% 14% 12% 1% 1%
b) Writing 3% 59% 12% 23% 1% 1%
c) Mathematics 3% 53% 12% 27% 4% 0%
d) Science 5% 47% 21% 22% 3% 3%
e) English or Language Arts 5% 66% 14% 15% 0% 0%
f) Computer Instruction 7% 67% 14% 10% 3% 0%
g) Social Studies (history or geography) 3% 52% 22% 19% 1% 3%
h) Fine Arts 4% 45% 12% 26% 12% 0%
i) Physical Education 10% 63% 18% 8% 1% 0%
j) Business Education 3% 34% 55% 5% 0% 3%
k) Vocational (Career and Technology) Education 4% 29% 49% 8% 4% 5%
l) Foreign Language 0% 38% 41% 10% 5% 5%
18. The district has effective special programs for the following:
a) Library Service 4% 48% 21% 25% 3% 0%
b) Honors/Gifted and Talented Education 0% 38% 22% 34% 4% 1%
c) Special Education 5% 62% 10% 18% 5% 0%
d) Head Start and Even Start programs 4% 36% 49% 4% 0% 7%
e) Dyslexia program 1% 23% 38% 26% 7% 4%
f) Student mentoring program 1% 15% 38% 34% 11% 0%
g) Advanced placement program 1% 32% 48% 12% 5% 1%
h) Literacy program 1% 18% 55% 19% 4% 3%
i) Programs for students at risk of dropping out of school
0% 21% 44% 21% 12% 3%
j) Summer school programs 1% 45% 27% 18% 4% 4%
k) Alternative education programs
1% 36% 34% 22% 5% 1%
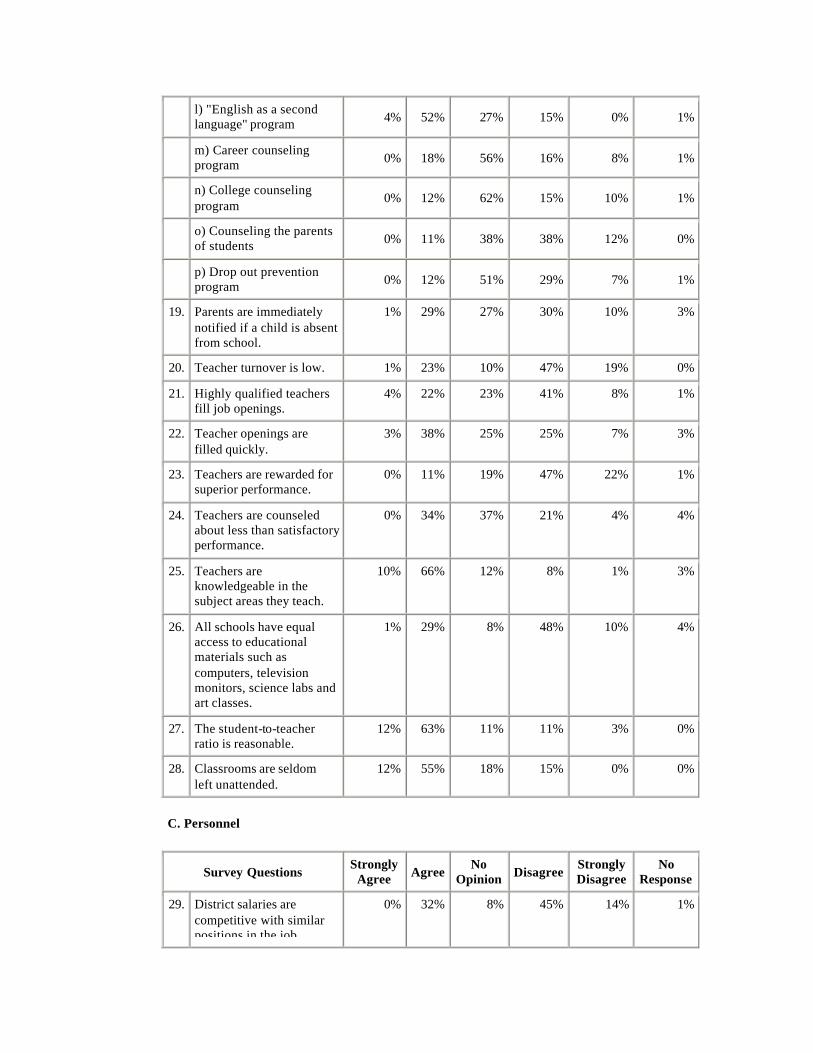
l) "English as a second language" program 4% 52% 27% 15% 0% 1%
m) Career counseling program 0% 18% 56% 16% 8% 1%
n) College counseling program
0% 12% 62% 15% 10% 1%
o) Counseling the parents of students 0% 11% 38% 38% 12% 0%
p) Drop out prevention program 0% 12% 51% 29% 7% 1%
19. Parents are immediately notified if a child is absent from school.
1% 29% 27% 30% 10% 3%
20. Teacher turnover is low. 1% 23% 10% 47% 19% 0%
21. Highly qualified teachers fill job openings.
4% 22% 23% 41% 8% 1%
22. Teacher openings are filled quickly.
3% 38% 25% 25% 7% 3%
23. Teachers are rewarded for superior performance.
0% 11% 19% 47% 22% 1%
24. Teachers are counseled about less than satisfactory performance.
0% 34% 37% 21% 4% 4%
25. Teachers are knowledgeable in the subject areas they teach.
10% 66% 12% 8% 1% 3%
26. All schools have equal access to educational materials such as computers, television monitors, science labs and art classes.
1% 29% 8% 48% 10% 4%
27. The student-to-teacher ratio is reasonable.
12% 63% 11% 11% 3% 0%
28. Classrooms are seldom left unattended.
12% 55% 18% 15% 0% 0%
C. Personnel
Survey Questions Strongly
Agree Agree No
Opinion Disagree Strongly Disagree
No Response
29. District salaries are competitive with similar positions in the job
0% 32% 8% 45% 14% 1%
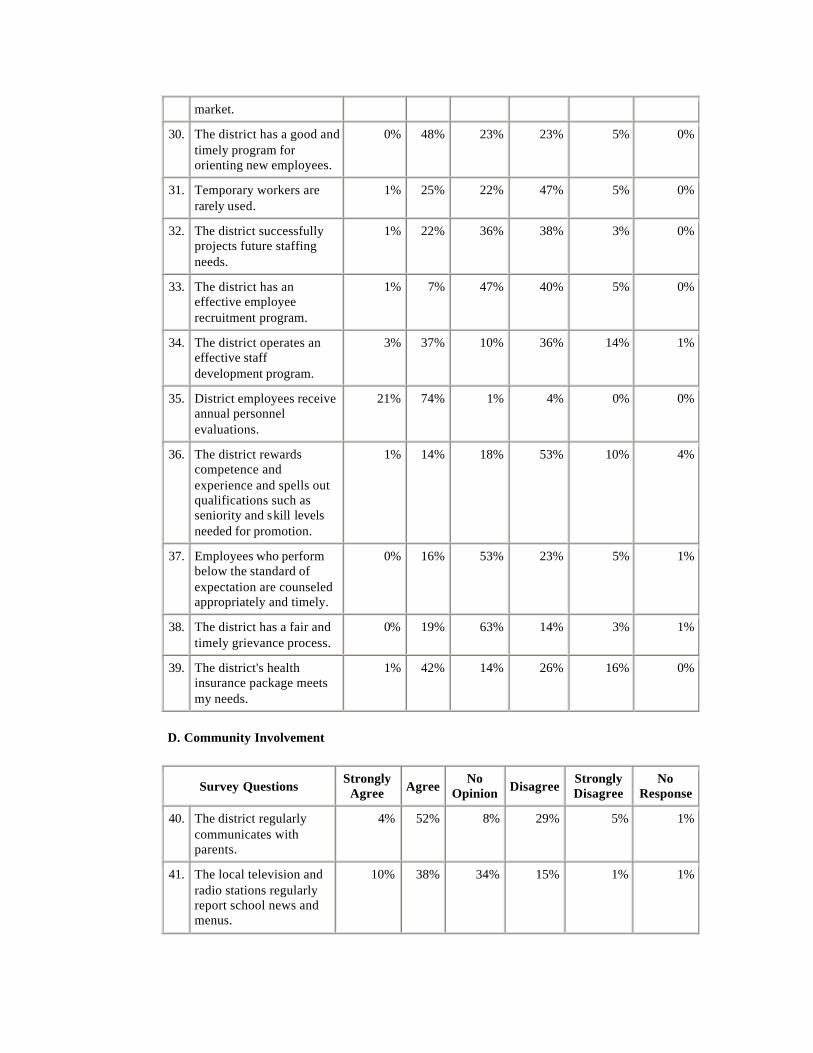
market.
30. The district has a good and timely program for orienting new employees.
0% 48% 23% 23% 5% 0%
31. Temporary workers are rarely used.
1% 25% 22% 47% 5% 0%
32. The district successfully projects future staffing needs.
1% 22% 36% 38% 3% 0%
33. The district has an effective employee recruitment program.
1% 7% 47% 40% 5% 0%
34. The district operates an effective staff development program.
3% 37% 10% 36% 14% 1%
35. District employees receive annual personnel evaluations.
21% 74% 1% 4% 0% 0%
36. The district rewards competence and experience and spells out qualifications such as seniority and skill levels needed for promotion.
1% 14% 18% 53% 10% 4%
37. Employees who perform below the standard of expectation are counseled appropriately and timely.
0% 16% 53% 23% 5% 1%
38. The district has a fair and timely grievance process.
0% 19% 63% 14% 3% 1%
39. The district's health insurance package meets my needs.
1% 42% 14% 26% 16% 0%
D. Community Involvement
Survey Questions Strongly
Agree Agree No
Opinion Disagree Strongly Disagree
No Response
40. The district regularly communicates with parents.
4% 52% 8% 29% 5% 1%
41. The local television and radio stations regularly report school news and menus.
10% 38% 34% 15% 1% 1%
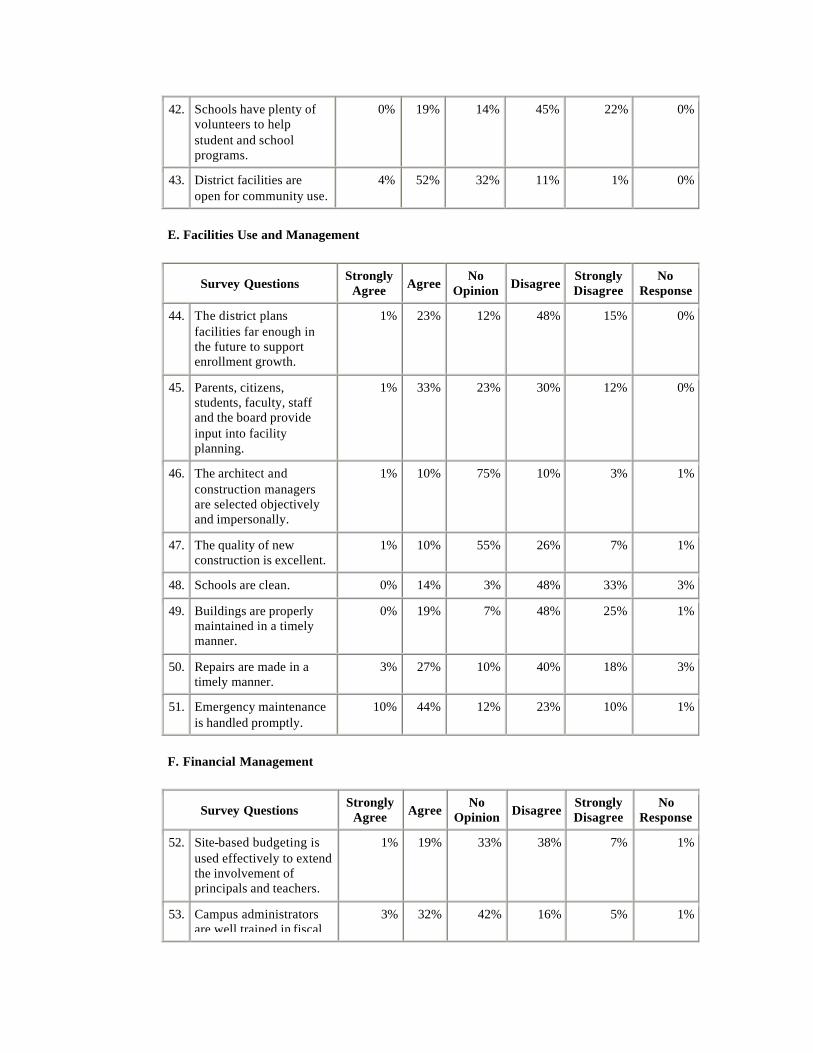
42. Schools have plenty of volunteers to help student and school programs.
0% 19% 14% 45% 22% 0%
43. District facilities are open for community use.
4% 52% 32% 11% 1% 0%
E. Facilities Use and Management
Survey Questions Strongly
Agree Agree No
Opinion Disagree Strongly Disagree
No Response
44. The district plans facilities far enough in the future to support enrollment growth.
1% 23% 12% 48% 15% 0%
45. Parents, citizens, students, faculty, staff and the board provide input into facility planning.
1% 33% 23% 30% 12% 0%
46. The architect and construction managers are selected objectively and impersonally.
1% 10% 75% 10% 3% 1%
47. The quality of new construction is excellent.
1% 10% 55% 26% 7% 1%
48. Schools are clean. 0% 14% 3% 48% 33% 3%
49. Buildings are properly maintained in a timely manner.
0% 19% 7% 48% 25% 1%
50. Repairs are made in a timely manner.
3% 27% 10% 40% 18% 3%
51. Emergency maintenance is handled promptly.
10% 44% 12% 23% 10% 1%
F. Financial Management
Survey Questions Strongly
Agree Agree No
Opinion Disagree Strongly Disagree
No Response
52. Site-based budgeting is used effectively to extend the involvement of principals and teachers.
1% 19% 33% 38% 7% 1%
53. Campus administrators are well trained in fiscal
3% 32% 42% 16% 5% 1%
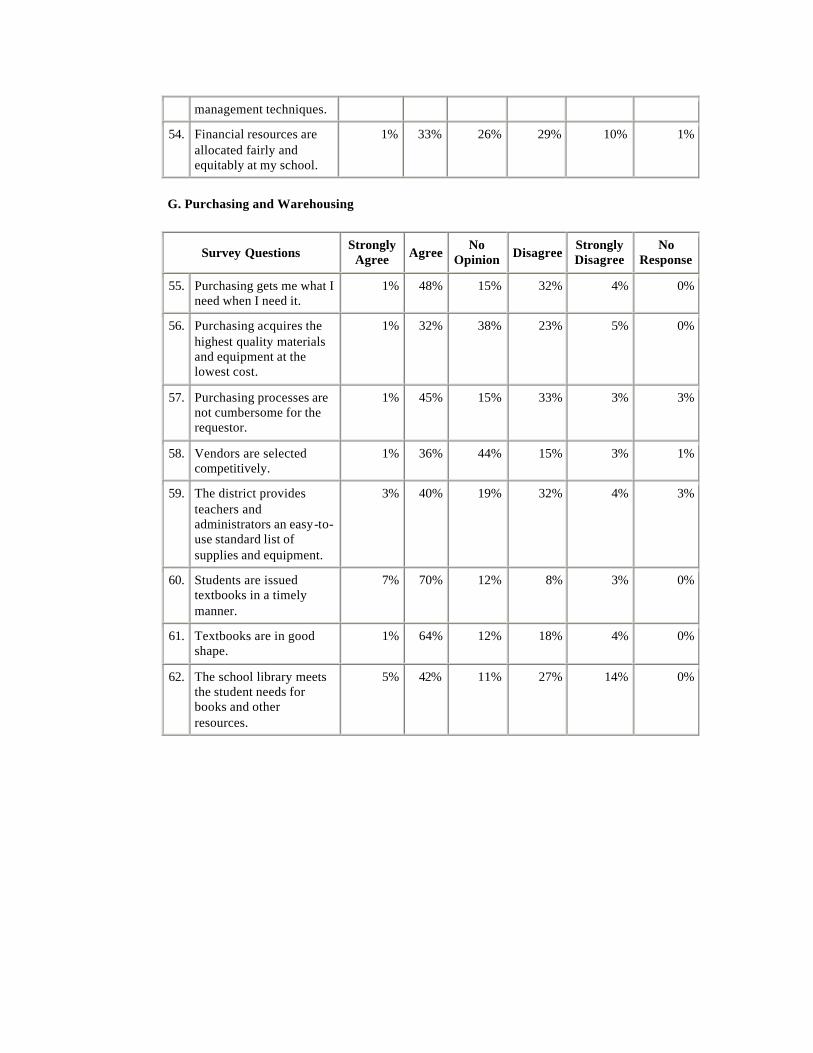
management techniques.
54. Financial resources are allocated fairly and equitably at my school.
1% 33% 26% 29% 10% 1%
G. Purchasing and Warehousing
Survey Questions Strongly
Agree Agree No
Opinion Disagree Strongly Disagree
No Response
55. Purchasing gets me what I need when I need it.
1% 48% 15% 32% 4% 0%
56. Purchasing acquires the highest quality materials and equipment at the lowest cost.
1% 32% 38% 23% 5% 0%
57. Purchasing processes are not cumbersome for the requestor.
1% 45% 15% 33% 3% 3%
58. Vendors are selected competitively.
1% 36% 44% 15% 3% 1%
59. The district provides teachers and administrators an easy-to-use standard list of supplies and equipment.
3% 40% 19% 32% 4% 3%
60. Students are issued textbooks in a timely manner.
7% 70% 12% 8% 3% 0%
61. Textbooks are in good shape.
1% 64% 12% 18% 4% 0%
62. The school library meets the student needs for books and other resources.
5% 42% 11% 27% 14% 0%
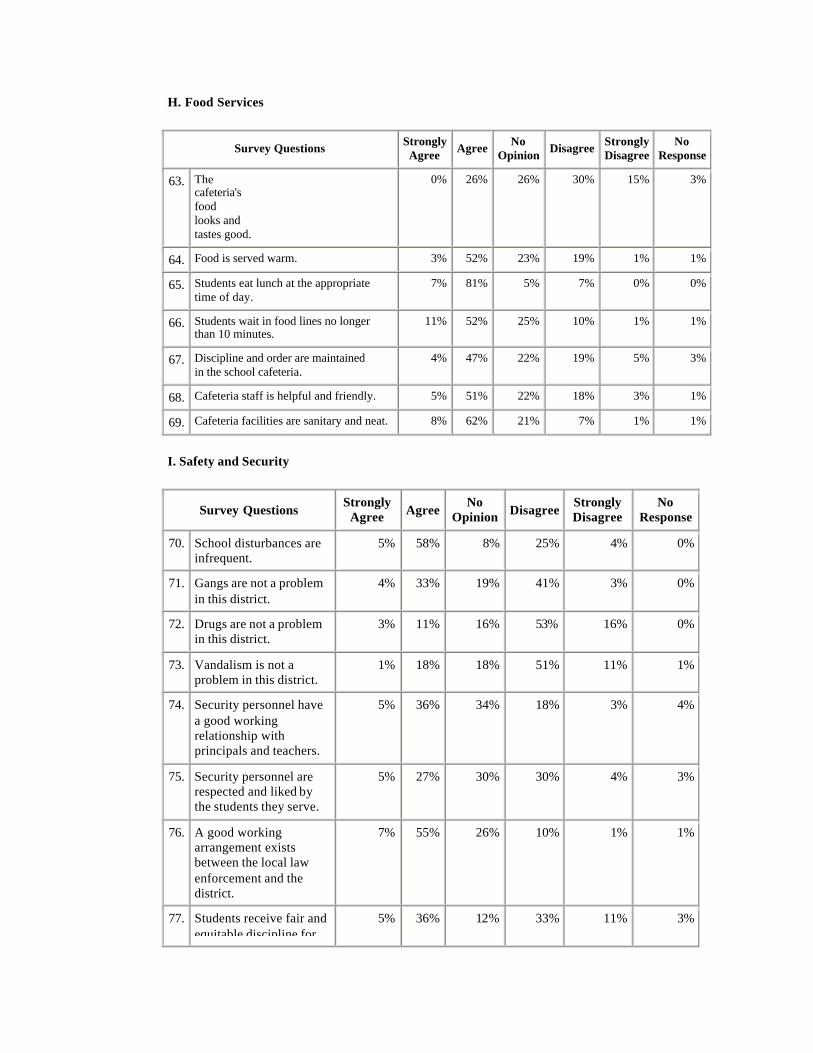
H. Food Services
Survey Questions Strongly Agree Agree No
Opinion Disagree Strongly Disagree
No Response
63. The cafeteria's food looks and tastes good.
0% 26% 26% 30% 15% 3%
64. Food is served warm. 3% 52% 23% 19% 1% 1%
65. Students eat lunch at the appropriate time of day.
7% 81% 5% 7% 0% 0%
66. Students wait in food lines no longer than 10 minutes.
11% 52% 25% 10% 1% 1%
67. Discipline and order are maintained in the school cafeteria.
4% 47% 22% 19% 5% 3%
68. Cafeteria staff is helpful and friendly. 5% 51% 22% 18% 3% 1%
69. Cafeteria facilities are sanitary and neat. 8% 62% 21% 7% 1% 1%
I. Safety and Security
Survey Questions Strongly
Agree Agree No
Opinion Disagree Strongly Disagree
No Response
70. School disturbances are infrequent.
5% 58% 8% 25% 4% 0%
71. Gangs are not a problem in this district.
4% 33% 19% 41% 3% 0%
72. Drugs are not a problem in this district.
3% 11% 16% 53% 16% 0%
73. Vandalism is not a problem in this district.
1% 18% 18% 51% 11% 1%
74. Security personnel have a good working relationship with principals and teachers.
5% 36% 34% 18% 3% 4%
75. Security personnel are respected and liked by the students they serve.
5% 27% 30% 30% 4% 3%
76. A good working arrangement exists between the local law enforcement and the district.
7% 55% 26% 10% 1% 1%
77. Students receive fair and equitable discipline for
5% 36% 12% 33% 11% 3%
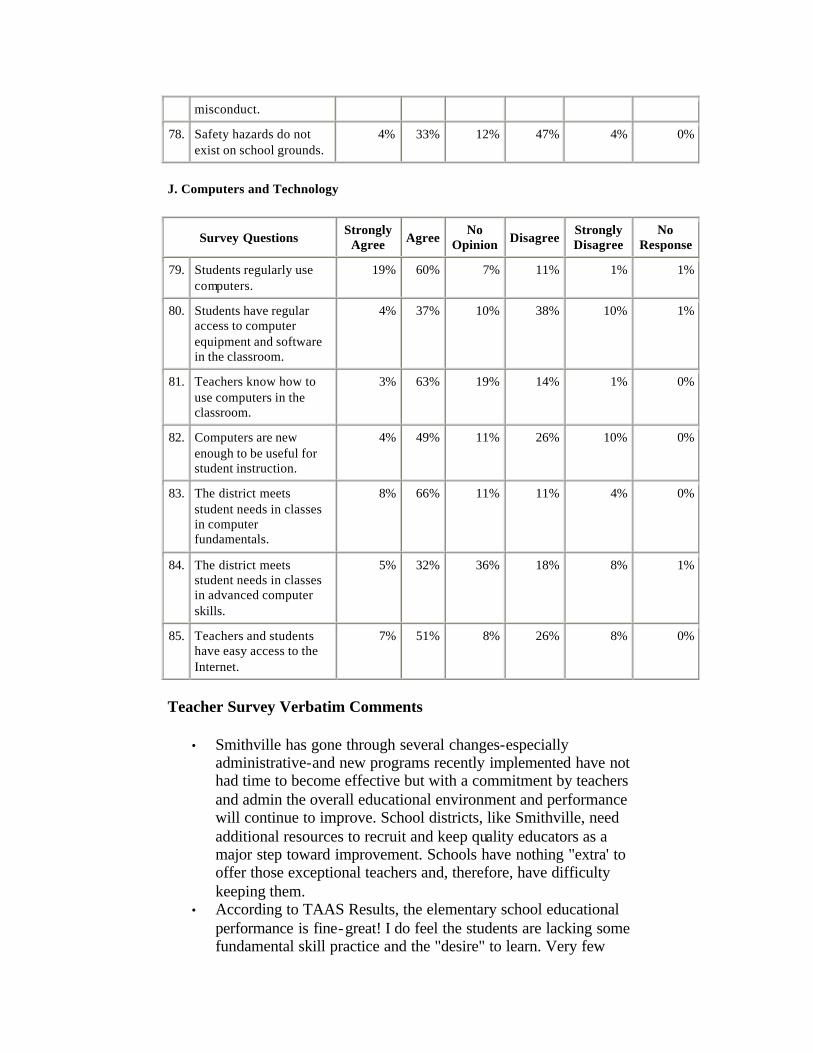
misconduct.
78. Safety hazards do not exist on school grounds.
4% 33% 12% 47% 4% 0%
J. Computers and Technology
Survey Questions Strongly
Agree Agree No
Opinion Disagree Strongly Disagree
No Response
79. Students regularly use computers.
19% 60% 7% 11% 1% 1%
80. Students have regular access to computer equipment and software in the classroom.
4% 37% 10% 38% 10% 1%
81. Teachers know how to use computers in the classroom.
3% 63% 19% 14% 1% 0%
82. Computers are new enough to be useful for student instruction.
4% 49% 11% 26% 10% 0%
83. The district meets student needs in classes in computer fundamentals.
8% 66% 11% 11% 4% 0%
84. The district meets student needs in classes in advanced computer skills.
5% 32% 36% 18% 8% 1%
85. Teachers and students have easy access to the Internet.
7% 51% 8% 26% 8% 0%
Teacher Survey Verbatim Comments
• Smithville has gone through several changes-especially administrative-and new programs recently implemented have not had time to become effective but with a commitment by teachers and admin the overall educational environment and performance will continue to improve. School districts, like Smithville, need additional resources to recruit and keep quality educators as a major step toward improvement. Schools have nothing "extra' to offer those exceptional teachers and, therefore, have difficulty keeping them.
• According to TAAS Results, the elementary school educational performance is fine-great! I do feel the students are lacking some fundamental skill practice and the "desire" to learn. Very few
gifted students needs are being met. All the teachers should be G/T trained.
• The Central Office uses a top-down leadership/management style. Decisions are made in a unilateral way. The high school administration is implementing exciting new programs that will positively impact student achievement.
• *Need to plan and approve future facilities at H.S. level. *Turn-over rate at H.S. approx. 30% every year. *Overall-Smithville is a well-run district with minor problems for a 3A school. Community/Parent involvement would be the biggest area needed for improvement.
• I think teachers need to expect more from their students, especially at the secondary level. Where some students will fail miserably, others are not being rightly challenged. Especially those intending to go to college. I am not saying that all the teachers are doing a bad job, I just think it might be too easy.
• I am happy teaching here. I would like to see more stability in staffing especially in the administration. The community does not seem to look at the school as a successful, caring place. Parents do not seem to want to take part in their students education. Most of the teachers I work with really have the students best interest in mind.
• It is clear that the community, board of trustees and superintendent make financial concerns a priority over the needs of children. They are moving 4th graders into portables with no restrooms so that the admin can move into a brick building. These 4th graders will have to share 2 restrooms each for boys and girls, with only 3 stalls in each. That's 400-450 kids in 12 stalls. On the other hand, at least in the past, they haven't been afraid to hire experienced teachers (the Bastrop ISD tries to hire only 1st year teachers!)
• The school (elem.) has a horrible ant problem. They are crawling on the students as well as on their lunches. I feel the school board have "personal" issues they are looking out for instead of the interest of our children. We have very intelligent kids with bright futures-they need to stay that way. Instead the high school classes are jokes, not teaching. The high school needs to be totally cleaned out and replaced with high quality professionals.
• I feel like the principals are doing everything that they can do. They truly are working to help kids out. I believe that our school board has a couple of members who are in the position just to benefit their child. Our superintendent needs to work on his personal skills. He seems to lack a lot of respect in the community and school because he does not know how to treat others.
• The system is top heavy with too many administrators and too much waste!
• At the Junior High we have good results on TAAS and many hard working teachers. The discipline and morale issues, however, have never been worse. We lack a strong leader and it shows.
• I feel that Smithville ISD has a lot of good teachers who work very hard. We have had trouble getting good experienced administrators and have a high turnover among teachers as well as administrator, therefore we do not have the consistency and continuity we need to be a really "grounded" district. We have great trouble with communication and too many times, teachers have had to "carry" the ball in administrative roles (decision-making). We need to focus our energy on positive planning and "stick" with something long enough to make it work. Teachers really need to be supported and helped to move forward. We need a "happy" school. (It used to be that way!) I basically like my school and my community. My sons grew up, played sports, and graduated from here, and I'm glad they did, but looking back, I see the same problems as they were involved here in years past, even in coaching situations, and I believe it affected their college years. Thank you for asking! I think they try to be supportive, but once again, we need consistency and a feeling of "being grounded". TOO MUCH ON-GOING CHANGE!!!
• First, I'd like to say, 98% of the teachers on our primary campus are extremely dedicate to the children and their jobs as teachers. We are, however, very frustrated with the lack of administration understanding of what we do, lack of backing-the-teacher, dictation of what will be done or what we can wear. Site-based meeting are not open discussion with no democracy voting-administration tells member what they have decided. There is going to be a high turn over in teachers this summer because of administration.
• I've never worked with a more dedicated group of educators. We are TAAS'ed to death and the supt. is most worried about financial issues. Teachers are not acknowledged for their efforts, nor are students. Out biggest asset: dedicated, resourceful teachers.
• Drugs and alcohol is in the school district. • Student do not receive fair and equitable discipline • Safety Hazards do exist. • A lot of teachers do not feel safe in school • Smithville ISD, like many school districts its size, is plagued with
problems that extend beyond the control of the school district. However, this district is in the process of restructuring in order to raise the academic standards. The newly hired personnel are playing an integral part in this process. Programs are being implemented in order to provide students with the structure and support they need in order to be successful.

• At the high school campus, I enjoy working with the students. Our principal is supportive and very accessible to all staff and students. At this point in time, I am very unhappy with the way our superintendent and school board are handling different situations. I believe our superintendent does not support any staff member on any campus. I have seen first hand his lack of support and am reluctant to show any loyalty whatsoever to this district.
• The school board and superintendent are out of touch with the day to day operation of the school. Supplies and equipment are delayed as much as six months before being ordered. The whole purchase order procedure is faulty. The repairs needed are often bidded out to companies with close ties to the school board. The school board listens to little if any dissent on their opinions are actions.
• I feel the move to portable buildings by the 4th grade was not putting the best interest of students first. Why didn't they build a new administration building on the land they own?
• Technology is a concern: Good computers that could be an integral part of a writing project in a classroom are in a computer lab being used to play games. Communication is a problem. Meetings are decided on and the message is spread by word of mouth. They need a school wide yearly plan and a district school plan for the year.
• District Rules of Dress Code are not enforced uniformly. Fighting is not handled consistently according to district policy. Thank you!
• Being new to the district, I don't have as much input as someone who has been here awhile. Also, I only know about Brown Primary. Pluses for Smithville ISD are as follow:
• Good teacher/student ratio at Brown Primary • High quality of teacher performance at 3rd grade level (I have spent
time in 5 out of 8 classrooms) • Minuses for Brown Primary are: • Poor communication with teachers new to the district from the
office and some classroom teachers. • I teach a support program and I feel like there is a power struggle
going on in grades K and 1. Instead of the students being ours, some teachers are feeling the LEP students are mine. (the teachers) I often have to go get students because the teacher fails to send them. That has improved the second semester, however.
• The superintendent does not project the sense of being concerned about keeping quality people or programs. The superintendent does not back his coaching staff, instead he listens only to community members and insists that there must be a problem if a parent complains. He also insists that coaches must not be doing a good job because of complaints and therefore evaluations must be short of perfect. The support from the superintendent is not apparent and he does not congratulate "winning" programs.

• There is very little community involvement at the elementary campus. There is not a districtwide attempt to get involvement. Teachers are not treated as if the administration wants them there. There is a black cloud of bad attitude that hangs over this district. It starts from the top.
• This is my first year here as school nurse and I do not have enough knowledge to answer some of the questions. The nurse's office is small and lacks a bathroom, but I have been told that we will receive better facilities next year.
• We have many students in high school who read at an elementary school level. We need a reading specialist and Special classes for students who struggle to read. Since reading is essential to all classes, this is a critical need. We need more computers and we need more career driven classes-many students here will not attend college, but they will go immediately into the work force.
• Most of our parents show little interest in the academic programs at our school and many of them do not seem to expect more than passing, grades from their students. When we have parents night, only a very small number of parents attend. Discipline should be more strict.
• The main problem with Smithville ISD is lack of money. Priority items must come first, in equipment, supplies and repairs. I feel our district does the best it can with the money available.
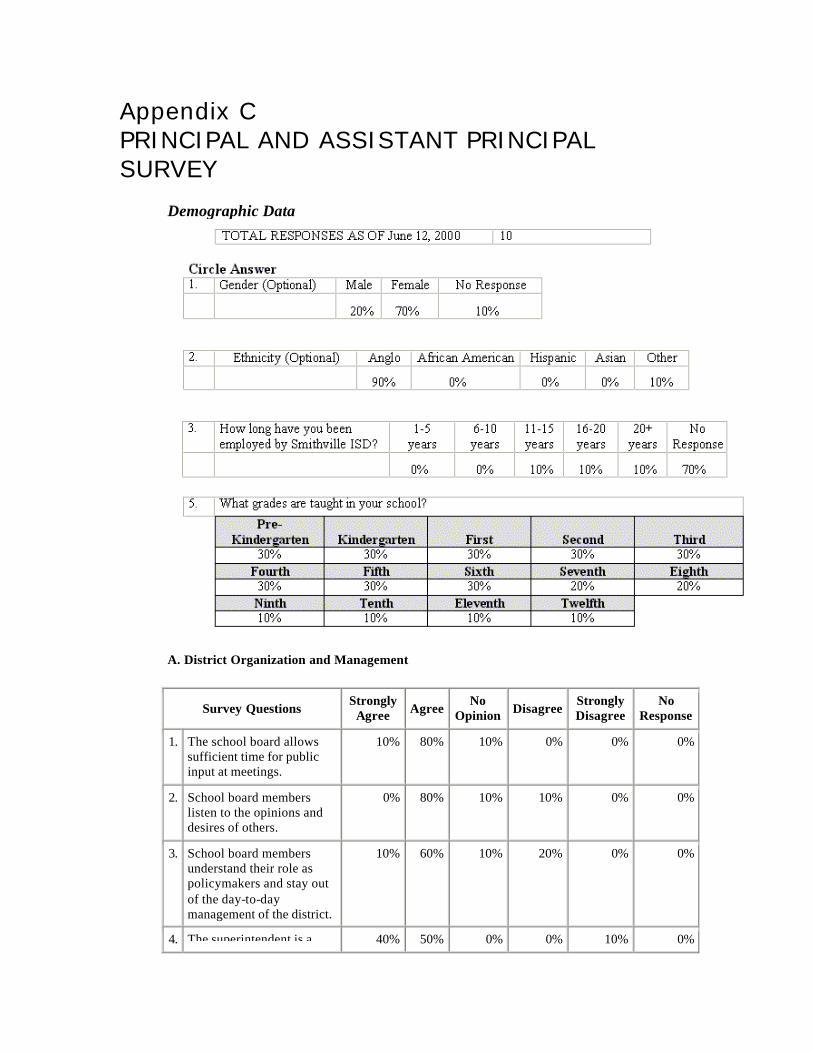
Appendix C
PRINCIPAL AND ASSISTANT PRINCIPAL SURVEY
Demographic Data
A. District Organization and Management
Survey Questions Strongly
Agree Agree No
Opinion Disagree Strongly Disagree
No Response
1. The school board allows sufficient time for public input at meetings.
10% 80% 10% 0% 0% 0%
2. School board members listen to the opinions and desires of others.
0% 80% 10% 10% 0% 0%
3. School board members understand their role as policymakers and stay out of the day-to-day management of the district.
10% 60% 10% 20% 0% 0%
4. The superintendent is a 40% 50% 0% 0% 10% 0%
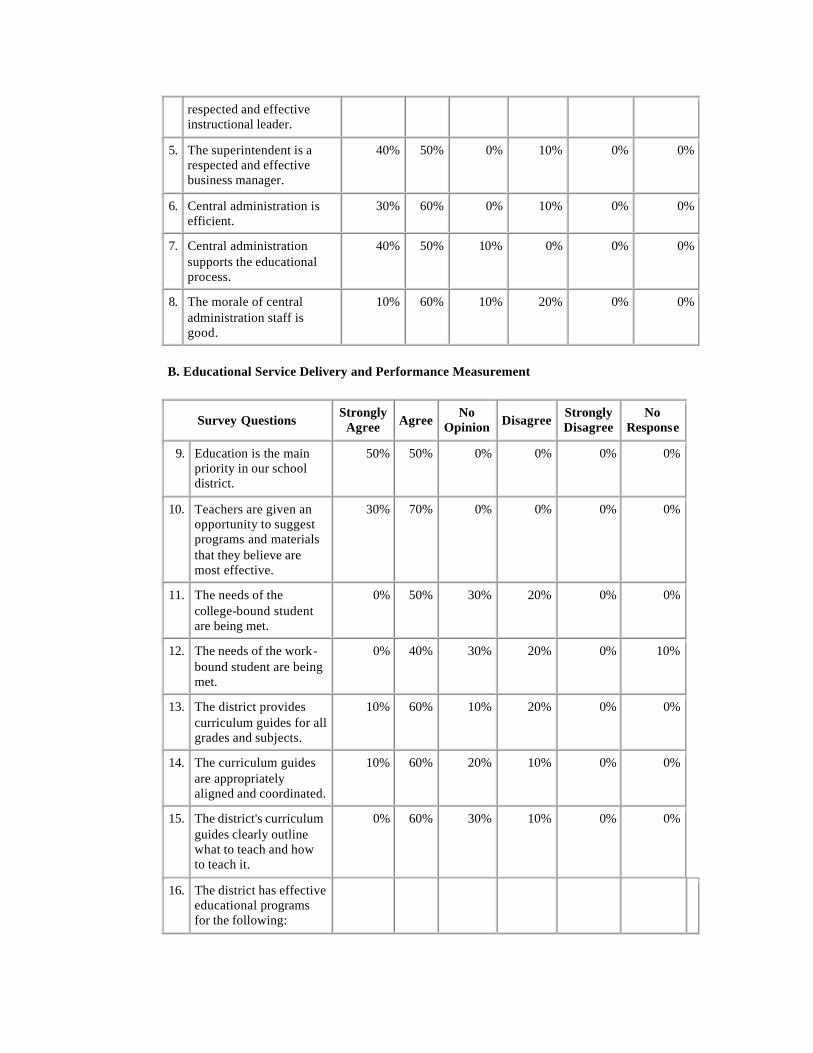
respected and effective instructional leader.
5. The superintendent is a respected and effective business manager.
40% 50% 0% 10% 0% 0%
6. Central administration is efficient.
30% 60% 0% 10% 0% 0%
7. Central administration supports the educational process.
40% 50% 10% 0% 0% 0%
8. The morale of central administration staff is good.
10% 60% 10% 20% 0% 0%
B. Educational Service Delivery and Performance Measurement
Survey Questions Strongly
Agree Agree No
Opinion Disagree Strongly Disagree
No Response
9. Education is the main priority in our school district.
50% 50% 0% 0% 0% 0%
10. Teachers are given an opportunity to suggest programs and materials that they believe are most effective.
30% 70% 0% 0% 0% 0%
11. The needs of the college-bound student are being met.
0% 50% 30% 20% 0% 0%
12. The needs of the work-bound student are being met.
0% 40% 30% 20% 0% 10%
13. The district provides curriculum guides for all grades and subjects.
10% 60% 10% 20% 0% 0%
14. The curriculum guides are appropriately aligned and coordinated.
10% 60% 20% 10% 0% 0%
15. The district's curriculum guides clearly outline what to teach and how to teach it.
0% 60% 30% 10% 0% 0%
16. The district has effective educational programs for the following:
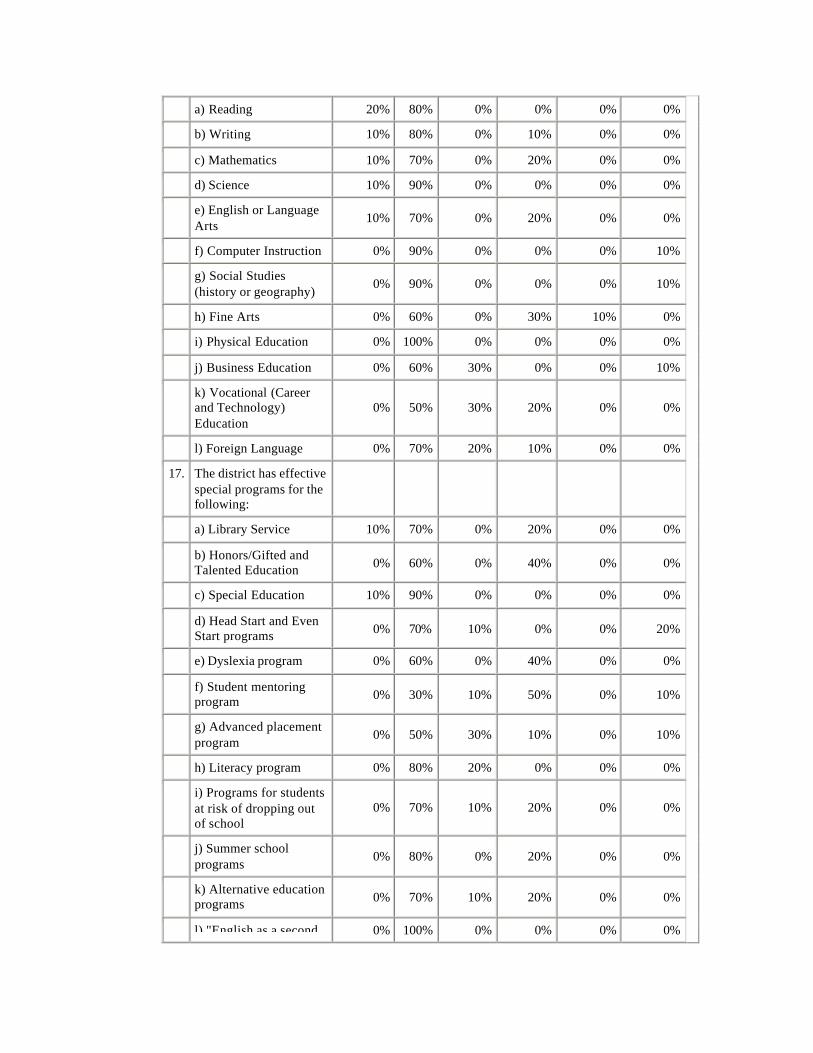
a) Reading 20% 80% 0% 0% 0% 0%
b) Writing 10% 80% 0% 10% 0% 0%
c) Mathematics 10% 70% 0% 20% 0% 0%
d) Science 10% 90% 0% 0% 0% 0%
e) English or Language Arts
10% 70% 0% 20% 0% 0%
f) Computer Instruction 0% 90% 0% 0% 0% 10%
g) Social Studies (history or geography)
0% 90% 0% 0% 0% 10%
h) Fine Arts 0% 60% 0% 30% 10% 0%
i) Physical Education 0% 100% 0% 0% 0% 0%
j) Business Education 0% 60% 30% 0% 0% 10%
k) Vocational (Career and Technology) Education
0% 50% 30% 20% 0% 0%
l) Foreign Language 0% 70% 20% 10% 0% 0%
17. The district has effective special programs for the following:
a) Library Service 10% 70% 0% 20% 0% 0%
b) Honors/Gifted and Talented Education 0% 60% 0% 40% 0% 0%
c) Special Education 10% 90% 0% 0% 0% 0%
d) Head Start and Even Start programs 0% 70% 10% 0% 0% 20%
e) Dyslexia program 0% 60% 0% 40% 0% 0%
f) Student mentoring program 0% 30% 10% 50% 0% 10%
g) Advanced placement program
0% 50% 30% 10% 0% 10%
h) Literacy program 0% 80% 20% 0% 0% 0%
i) Programs for students at risk of dropping out of school
0% 70% 10% 20% 0% 0%
j) Summer school programs
0% 80% 0% 20% 0% 0%
k) Alternative education programs 0% 70% 10% 20% 0% 0%
l) "English as a second 0% 100% 0% 0% 0% 0%
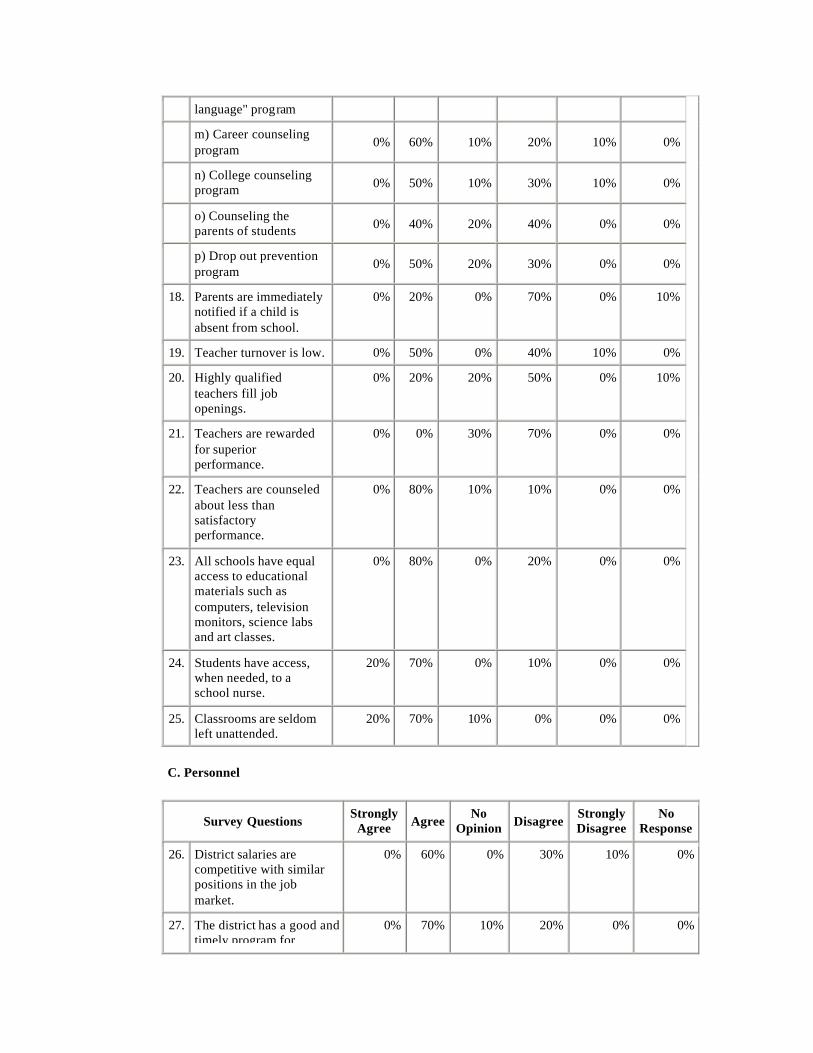
language" program
m) Career counseling program
0% 60% 10% 20% 10% 0%
n) College counseling program 0% 50% 10% 30% 10% 0%
o) Counseling the parents of students 0% 40% 20% 40% 0% 0%
p) Drop out prevention program
0% 50% 20% 30% 0% 0%
18. Parents are immediately notified if a child is absent from school.
0% 20% 0% 70% 0% 10%
19. Teacher turnover is low. 0% 50% 0% 40% 10% 0%
20. Highly qualified teachers fill job openings.
0% 20% 20% 50% 0% 10%
21. Teachers are rewarded for superior performance.
0% 0% 30% 70% 0% 0%
22. Teachers are counseled about less than satisfactory performance.
0% 80% 10% 10% 0% 0%
23. All schools have equal access to educational materials such as computers, television monitors, science labs and art classes.
0% 80% 0% 20% 0% 0%
24. Students have access, when needed, to a school nurse.
20% 70% 0% 10% 0% 0%
25. Classrooms are seldom left unattended.
20% 70% 10% 0% 0% 0%
C. Personnel
Survey Questions Strongly
Agree Agree No
Opinion Disagree Strongly Disagree
No Response
26. District salaries are competitive with similar positions in the job market.
0% 60% 0% 30% 10% 0%
27. The district has a good and timely program for
0% 70% 10% 20% 0% 0%
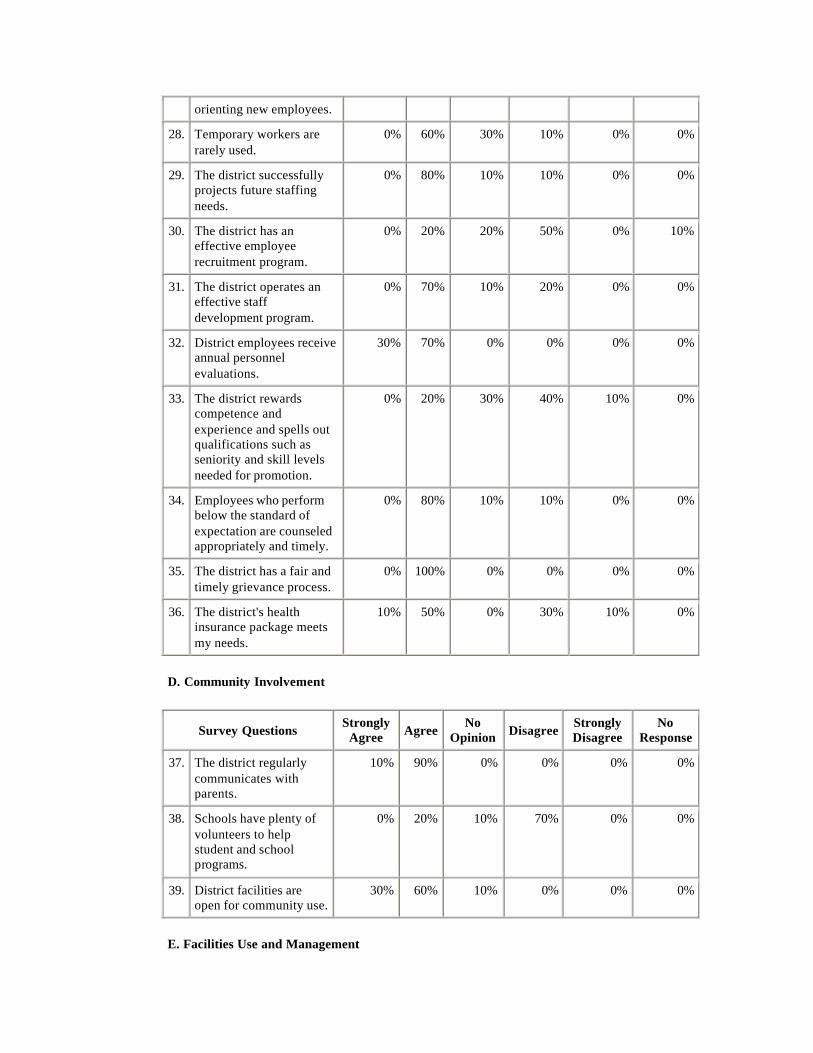
orienting new employees.
28. Temporary workers are rarely used.
0% 60% 30% 10% 0% 0%
29. The district successfully projects future staffing needs.
0% 80% 10% 10% 0% 0%
30. The district has an effective employee recruitment program.
0% 20% 20% 50% 0% 10%
31. The district operates an effective staff development program.
0% 70% 10% 20% 0% 0%
32. District employees receive annual personnel evaluations.
30% 70% 0% 0% 0% 0%
33. The district rewards competence and experience and spells out qualifications such as seniority and skill levels needed for promotion.
0% 20% 30% 40% 10% 0%
34. Employees who perform below the standard of expectation are counseled appropriately and timely.
0% 80% 10% 10% 0% 0%
35. The district has a fair and timely grievance process.
0% 100% 0% 0% 0% 0%
36. The district's health insurance package meets my needs.
10% 50% 0% 30% 10% 0%
D. Community Involvement
Survey Questions Strongly
Agree Agree No
Opinion Disagree Strongly Disagree
No Response
37. The district regularly communicates with parents.
10% 90% 0% 0% 0% 0%
38. Schools have plenty of volunteers to help student and school programs.
0% 20% 10% 70% 0% 0%
39. District facilities are open for community use.
30% 60% 10% 0% 0% 0%
E. Facilities Use and Management
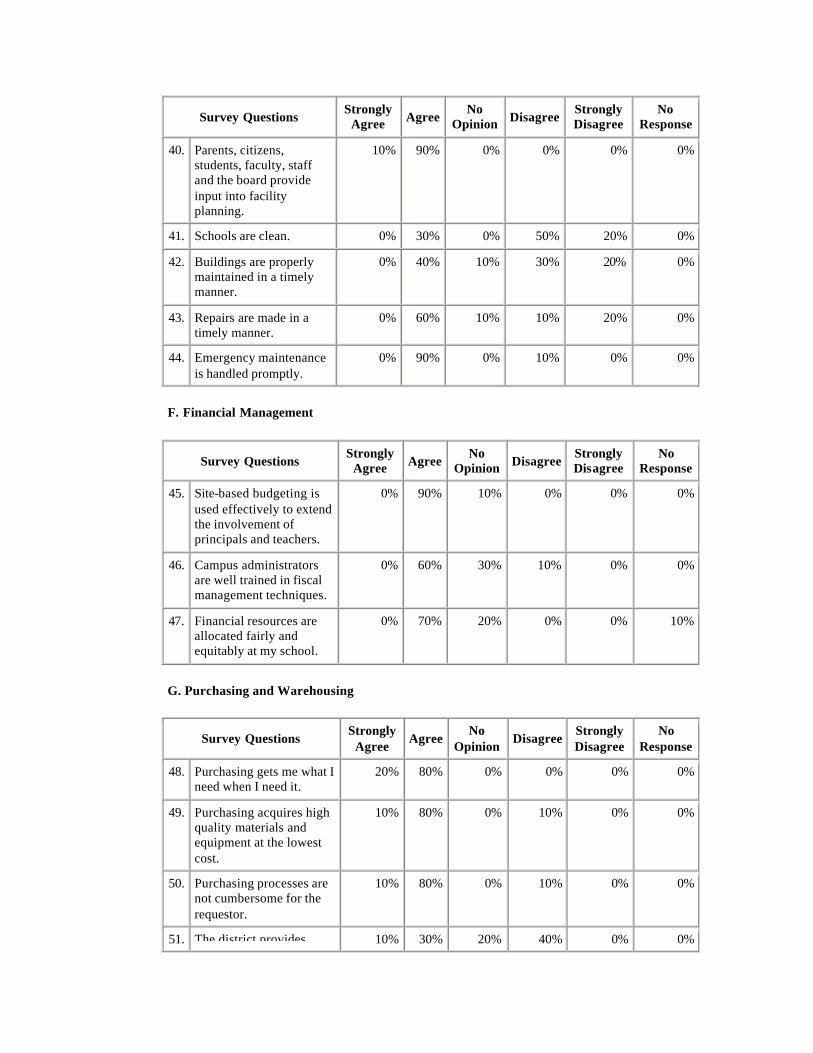
Survey Questions Strongly
Agree Agree No
Opinion Disagree Strongly Disagree
No Response
40. Parents, citizens, students, faculty, staff and the board provide input into facility planning.
10% 90% 0% 0% 0% 0%
41. Schools are clean. 0% 30% 0% 50% 20% 0%
42. Buildings are properly maintained in a timely manner.
0% 40% 10% 30% 20% 0%
43. Repairs are made in a timely manner.
0% 60% 10% 10% 20% 0%
44. Emergency maintenance is handled promptly.
0% 90% 0% 10% 0% 0%
F. Financial Management
Survey Questions Strongly
Agree Agree No
Opinion Disagree Strongly Disagree
No Response
45. Site-based budgeting is used effectively to extend the involvement of principals and teachers.
0% 90% 10% 0% 0% 0%
46. Campus administrators are well trained in fiscal management techniques.
0% 60% 30% 10% 0% 0%
47. Financial resources are allocated fairly and equitably at my school.
0% 70% 20% 0% 0% 10%
G. Purchasing and Warehousing
Survey Questions Strongly
Agree Agree
No Opinion
Disagree Strongly Disagree
No Response
48. Purchasing gets me what I need when I need it.
20% 80% 0% 0% 0% 0%
49. Purchasing acquires high quality materials and equipment at the lowest cost.
10% 80% 0% 10% 0% 0%
50. Purchasing processes are not cumbersome for the requestor.
10% 80% 0% 10% 0% 0%
51. The district provides 10% 30% 20% 40% 0% 0%
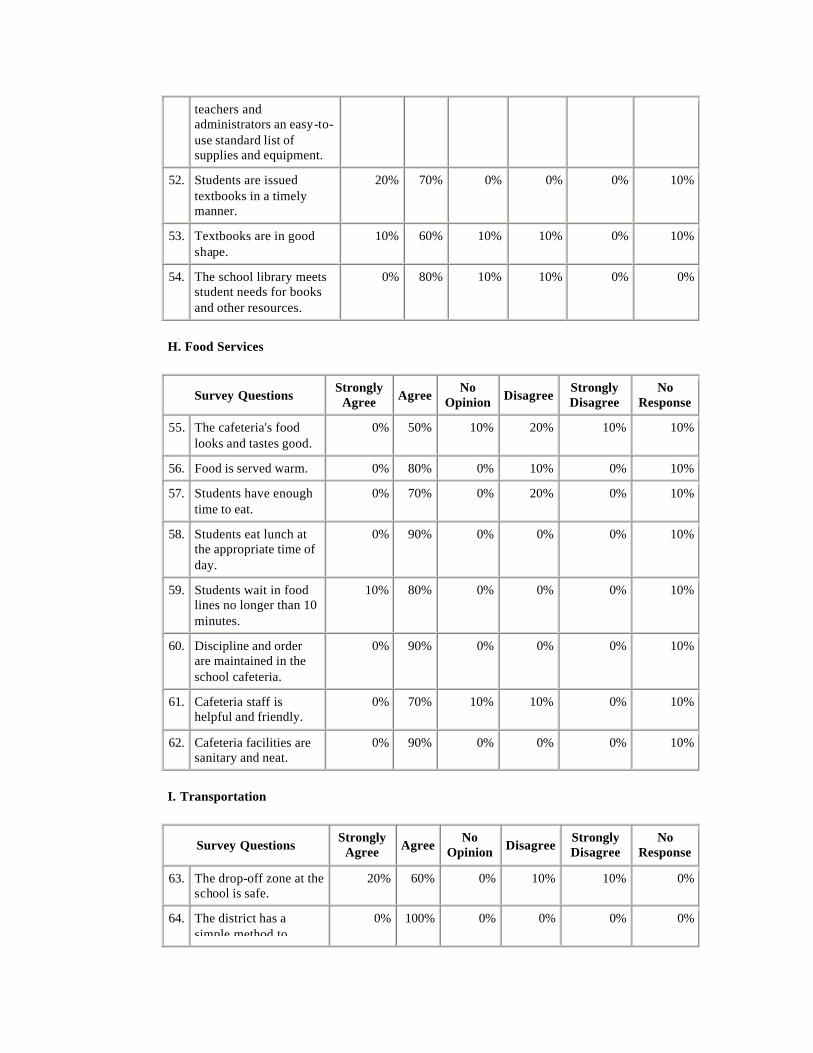
teachers and administrators an easy-to-use standard list of supplies and equipment.
52. Students are issued textbooks in a timely manner.
20% 70% 0% 0% 0% 10%
53. Textbooks are in good shape.
10% 60% 10% 10% 0% 10%
54. The school library meets student needs for books and other resources.
0% 80% 10% 10% 0% 0%
H. Food Services
Survey Questions Strongly
Agree Agree No
Opinion Disagree Strongly Disagree
No Response
55. The cafeteria's food looks and tastes good.
0% 50% 10% 20% 10% 10%
56. Food is served warm. 0% 80% 0% 10% 0% 10%
57. Students have enough time to eat.
0% 70% 0% 20% 0% 10%
58. Students eat lunch at the appropriate time of day.
0% 90% 0% 0% 0% 10%
59. Students wait in food lines no longer than 10 minutes.
10% 80% 0% 0% 0% 10%
60. Discipline and order are maintained in the school cafeteria.
0% 90% 0% 0% 0% 10%
61. Cafeteria staff is helpful and friendly.
0% 70% 10% 10% 0% 10%
62. Cafeteria facilities are sanitary and neat.
0% 90% 0% 0% 0% 10%
I. Transportation
Survey Questions Strongly
Agree Agree No
Opinion Disagree Strongly Disagree
No Response
63. The drop-off zone at the school is safe.
20% 60% 0% 10% 10% 0%
64. The district has a simple method to
0% 100% 0% 0% 0% 0%

request buses for special events.
65. Buses arrive and leave on time.
10% 80% 0% 10% 0% 0%
66. Adding or modifying a route for a student is easy to accomplish.
0% 30% 70% 0% 0% 0%
J. Safety and Security
Survey Questions Strongly
Agree Agree No
Opinion Disagree Strongly Disagree
No Response
67. Students feel safe and secure at school.
20% 80% 0% 0% 0% 0%
68. School disturbances are infrequent.
10% 90% 0% 0% 0% 0%
69. Gangs are not a problem in this district.
10% 60% 0% 30% 0% 0%
70. Drugs are not a problem in this district.
10% 60% 0% 30% 0% 0%
71. Vandalism is not a problem in this dis trict.
10% 50% 10% 30% 0% 0%
72. Security personnel have a good working relationship with principals and teachers.
0% 40% 30% 10% 20% 0%
73. Security personnel are respected and liked by the students they serve.
0% 20% 60% 0% 10% 10%
74. A good working arrangement exists between the local law enforcement and the district.
0% 70% 20% 0% 0% 10%
75. Students receive fair and equitable discipline for misconduct.
0% 70% 20% 10% 0% 0%
76. Safety hazards do not exist on school grounds.
0% 80% 0% 20% 0% 0%
K. Computers and Technology
Survey Questions Strongly
Agree Agree
No Opinion
Disagree Strongly Disagree
No Response
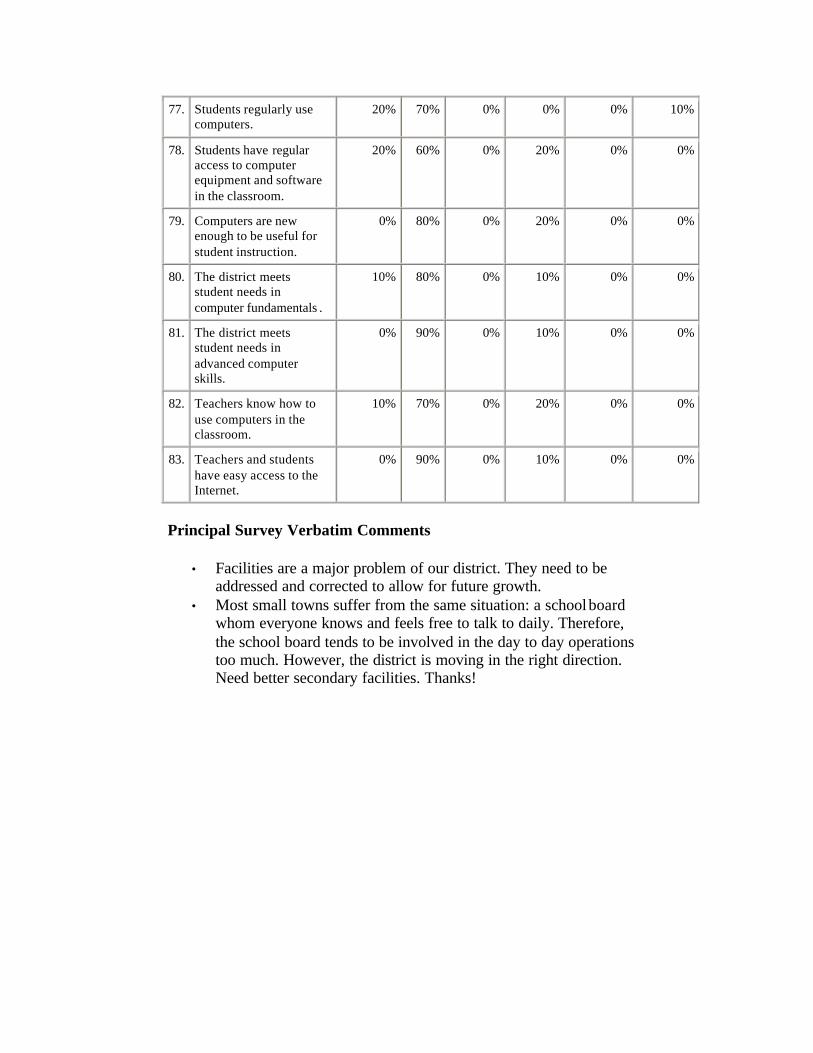
77. Students regularly use computers.
20% 70% 0% 0% 0% 10%
78. Students have regular access to computer equipment and software in the classroom.
20% 60% 0% 20% 0% 0%
79. Computers are new enough to be useful for student instruction.
0% 80% 0% 20% 0% 0%
80. The district meets student needs in computer fundamentals .
10% 80% 0% 10% 0% 0%
81. The district meets student needs in advanced computer skills.
0% 90% 0% 10% 0% 0%
82. Teachers know how to use computers in the classroom.
10% 70% 0% 20% 0% 0%
83. Teachers and students have easy access to the Internet.
0% 90% 0% 10% 0% 0%
Principal Survey Verbatim Comments
• Facilities are a major problem of our district. They need to be addressed and corrected to allow for future growth.
• Most small towns suffer from the same situation: a school board whom everyone knows and feels free to talk to daily. Therefore, the school board tends to be involved in the day to day operations too much. However, the district is moving in the right direction. Need better secondary facilities. Thanks!
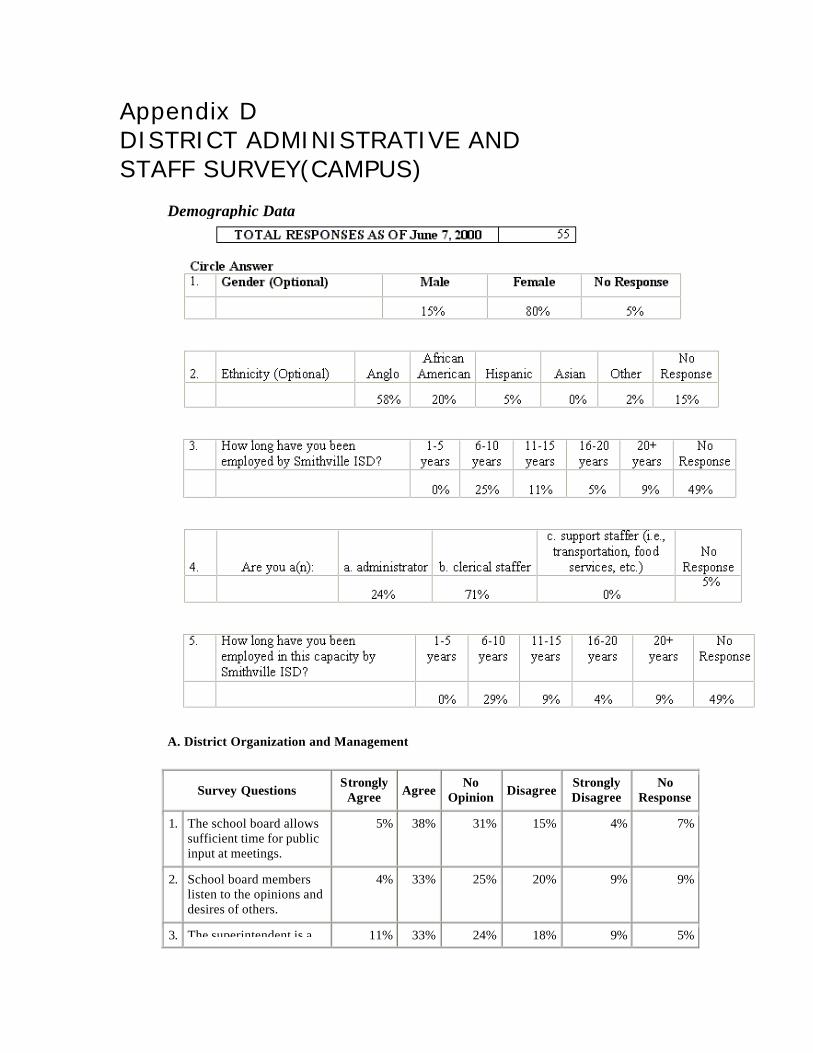
Appendix D
DISTRICT ADMINISTRATIVE AND STAFF SURVEY(CAMPUS)
Demographic Data
A. District Organization and Management
Survey Questions Strongly
Agree Agree No
Opinion Disagree Strongly Disagree
No Response
1. The school board allows sufficient time for public input at meetings.
5% 38% 31% 15% 4% 7%
2. School board members listen to the opinions and desires of others.
4% 33% 25% 20% 9% 9%
3. The superintendent is a 11% 33% 24% 18% 9% 5%

respected and effective instructional leader.
4. The superintendent is a respected and effective business manager.
7% 44% 27% 9% 9% 4%
5. Central administration is efficient.
7% 60% 16% 7% 5% 4%
6. Central administration supports the educational process.
9% 58% 18% 7% 4% 4%
7. The morale of central administration staff is good.
9% 49% 22% 7% 9% 4%
B. Educational Service Delivery and Performance Measurement
Survey Questions Strongly
Agree Agree No
Opinion Disagree Strongly Disagree
No Response
8. Education is the main priority in our school district.
25% 44% 9% 16% 4% 2%
9. Teachers are given an opportunity to suggest programs and materials that they believe are most effective.
13% 40% 22% 16% 5% 4%
10. The needs of the college-bound student are being met.
4% 24% 25% 27% 15% 5%
11. The needs of the work-bound student are being met.
2% 49% 24% 16% 5% 4%
12. The district has effective educational programs for the following:
a) Reading 7% 49% 15% 20% 5% 4%
b) Writing 7% 49% 15% 20% 5% 4%
c) Mathematics 7% 53% 16% 15% 4% 5%
d) Science 11% 51% 20% 9% 2% 7%
e) English or Language Arts 11% 49% 22% 11% 0% 7%
f) Computer Instruction 13% 53% 16% 9% 2% 7%
g) Social Studies (history 5% 56% 18% 11% 2% 7%
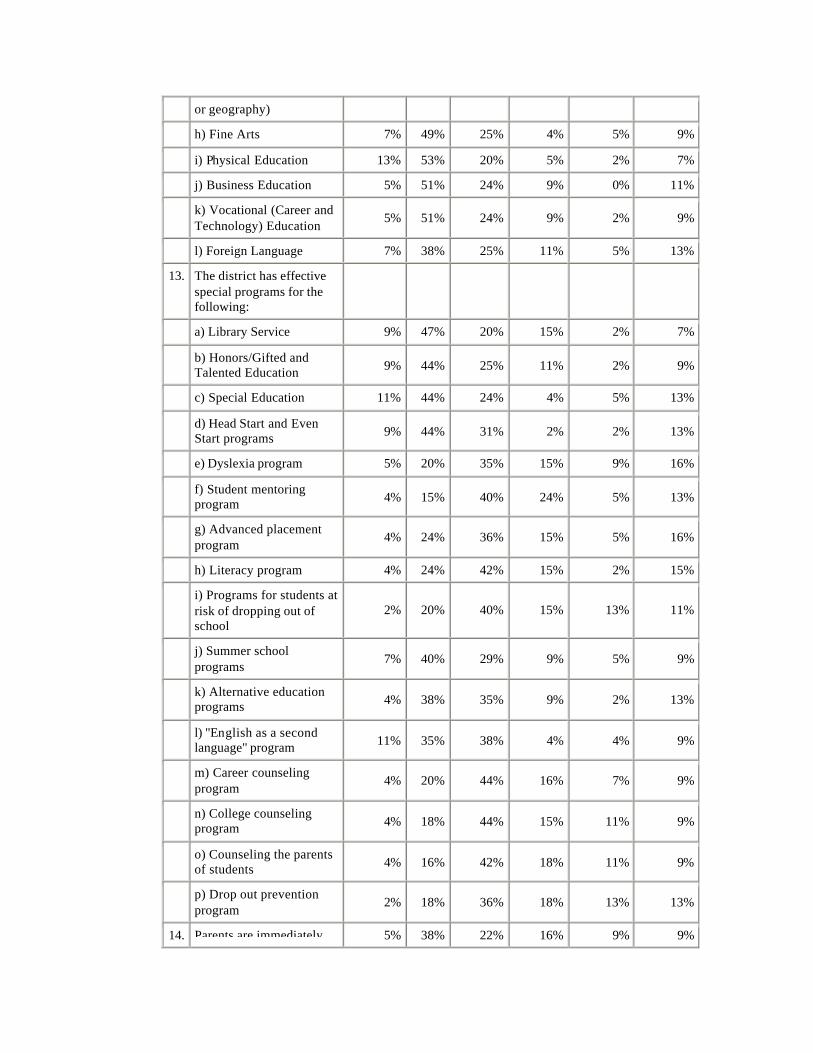
or geography)
h) Fine Arts 7% 49% 25% 4% 5% 9%
i) Physical Education 13% 53% 20% 5% 2% 7%
j) Business Education 5% 51% 24% 9% 0% 11%
k) Vocational (Career and Technology) Education
5% 51% 24% 9% 2% 9%
l) Foreign Language 7% 38% 25% 11% 5% 13%
13. The district has effective special programs for the following:
a) Library Service 9% 47% 20% 15% 2% 7%
b) Honors/Gifted and Talented Education 9% 44% 25% 11% 2% 9%
c) Special Education 11% 44% 24% 4% 5% 13%
d) Head Start and Even Start programs 9% 44% 31% 2% 2% 13%
e) Dyslexia program 5% 20% 35% 15% 9% 16%
f) Student mentoring program 4% 15% 40% 24% 5% 13%
g) Advanced placement program
4% 24% 36% 15% 5% 16%
h) Literacy program 4% 24% 42% 15% 2% 15%
i) Programs for students at risk of dropping out of school
2% 20% 40% 15% 13% 11%
j) Summer school programs
7% 40% 29% 9% 5% 9%
k) Alternative education programs 4% 38% 35% 9% 2% 13%
l) "English as a second language" program 11% 35% 38% 4% 4% 9%
m) Career counseling program
4% 20% 44% 16% 7% 9%
n) College counseling program 4% 18% 44% 15% 11% 9%
o) Counseling the parents of students 4% 16% 42% 18% 11% 9%
p) Drop out prevention program
2% 18% 36% 18% 13% 13%
14. Parents are immediately 5% 38% 22% 16% 9% 9%

notified if a child is absent from school.
15. Teacher turnover is low. 2% 15% 16% 45% 16% 5%
16. Highly qualified teachers fill job openings.
0% 16% 27% 29% 20% 7%
17. Teacher openings are filled quickly.
2% 36% 22% 24% 11% 5%
18. Teachers are rewarded for superior performance.
2% 18% 33% 25% 15% 7%
19. Teachers are counseled about less than satisfactory performance.
2% 18% 49% 15% 9% 7%
20. All schools have equal access to educational materials such as computers, television monitors, science labs and art classes.
4% 38% 27% 16% 9% 5%
21. The student-to-teacher ratio is reasonable.
0% 62% 13% 13% 7% 5%
22. Students have access, when needed, to a school nurse.
16% 64% 5% 9% 0% 5%
23. Classrooms are seldom left unattended.
9% 49% 20% 13% 5% 4%
C. Personnel
Survey Questions Strongly
Agree Agree No
Opinion Disagree Strongly Disagree
No Response
24. District salaries are competitive with similar positions in the job market.
2% 13% 15% 35% 31% 5%
25. The district has a good and timely program for orienting new employees.
0% 44% 16% 20% 16% 4%
26. Temporary workers are rarely used.
4% 35% 22% 24% 9% 7%
27. The district successfully projects future staffing needs.
0% 22% 33% 20% 16% 9%
28. The district has an effective employee recruitment program.
0% 16% 38% 18% 20% 7%
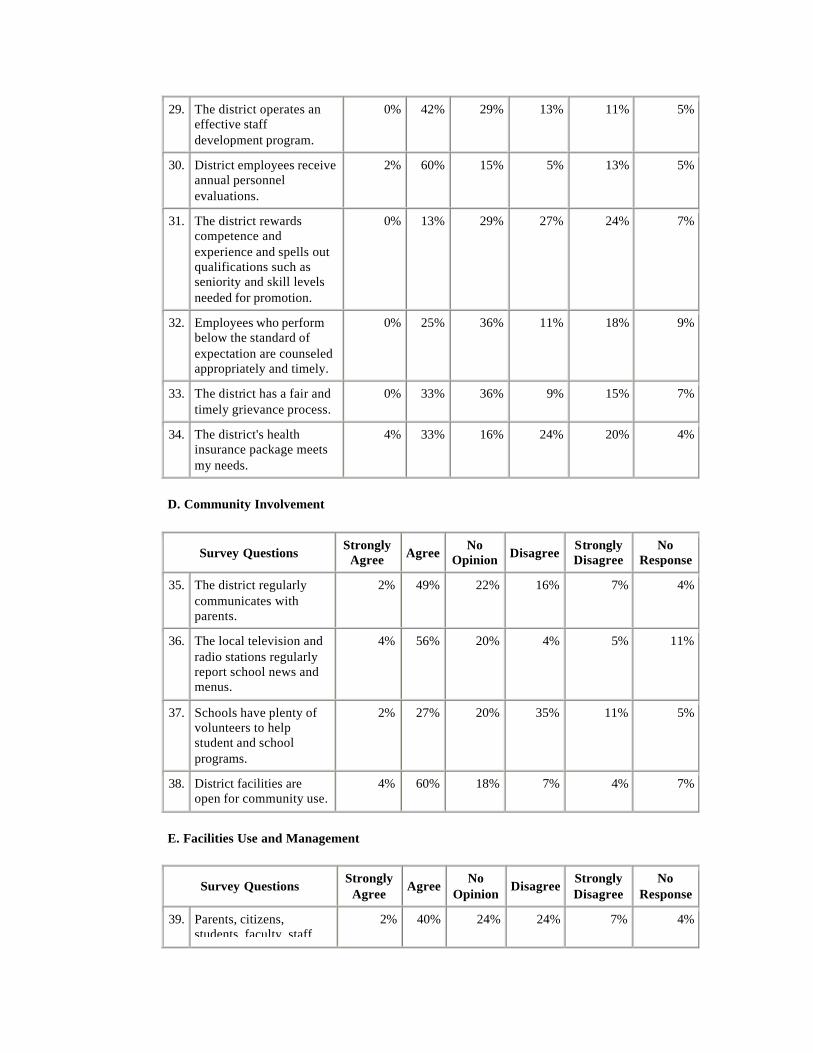
29. The district operates an effective staff development program.
0% 42% 29% 13% 11% 5%
30. District employees receive annual personnel evaluations.
2% 60% 15% 5% 13% 5%
31. The district rewards competence and experience and spells out qualifications such as seniority and skill levels needed for promotion.
0% 13% 29% 27% 24% 7%
32. Employees who perform below the standard of expectation are counseled appropriately and timely.
0% 25% 36% 11% 18% 9%
33. The district has a fair and timely grievance process.
0% 33% 36% 9% 15% 7%
34. The district's health insurance package meets my needs.
4% 33% 16% 24% 20% 4%
D. Community Involvement
Survey Questions Strongly
Agree Agree No
Opinion Disagree Strongly Disagree
No Response
35. The district regularly communicates with parents.
2% 49% 22% 16% 7% 4%
36. The local television and radio stations regularly report school news and menus.
4% 56% 20% 4% 5% 11%
37. Schools have plenty of volunteers to help student and school programs.
2% 27% 20% 35% 11% 5%
38. District facilities are open for community use.
4% 60% 18% 7% 4% 7%
E. Facilities Use and Management
Survey Questions Strongly
Agree Agree
No Opinion
Disagree Strongly Disagree
No Response
39. Parents, citizens, students, faculty, staff
2% 40% 24% 24% 7% 4%
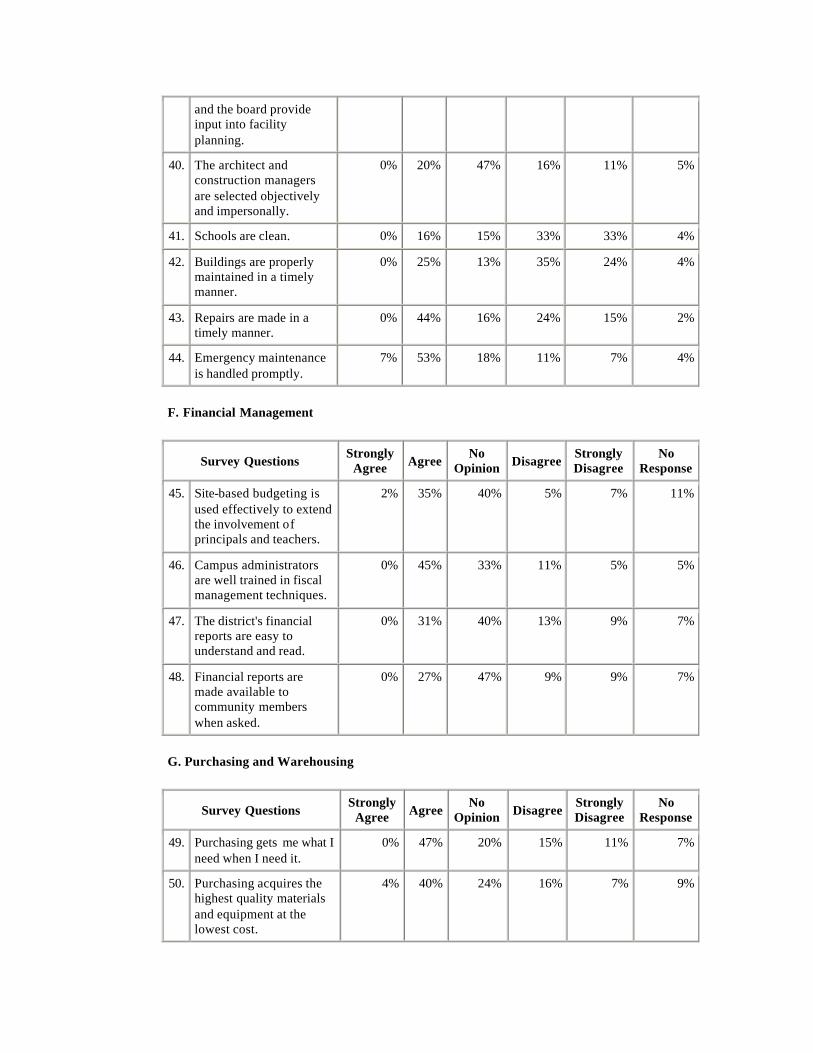
and the board provide input into facility planning.
40. The architect and construction managers are selected objectively and impersonally.
0% 20% 47% 16% 11% 5%
41. Schools are clean. 0% 16% 15% 33% 33% 4%
42. Buildings are properly maintained in a timely manner.
0% 25% 13% 35% 24% 4%
43. Repairs are made in a timely manner.
0% 44% 16% 24% 15% 2%
44. Emergency maintenance is handled promptly.
7% 53% 18% 11% 7% 4%
F. Financial Management
Survey Questions Strongly
Agree Agree No
Opinion Disagree Strongly Disagree
No Response
45. Site-based budgeting is used effectively to extend the involvement of principals and teachers.
2% 35% 40% 5% 7% 11%
46. Campus administrators are well trained in fiscal management techniques.
0% 45% 33% 11% 5% 5%
47. The district's financial reports are easy to understand and read.
0% 31% 40% 13% 9% 7%
48. Financial reports are made available to community members when asked.
0% 27% 47% 9% 9% 7%
G. Purchasing and Warehousing
Survey Questions Strongly
Agree Agree No
Opinion Disagree Strongly Disagree
No Response
49. Purchasing gets me what I need when I need it.
0% 47% 20% 15% 11% 7%
50. Purchasing acquires the highest quality materials and equipment at the lowest cost.
4% 40% 24% 16% 7% 9%
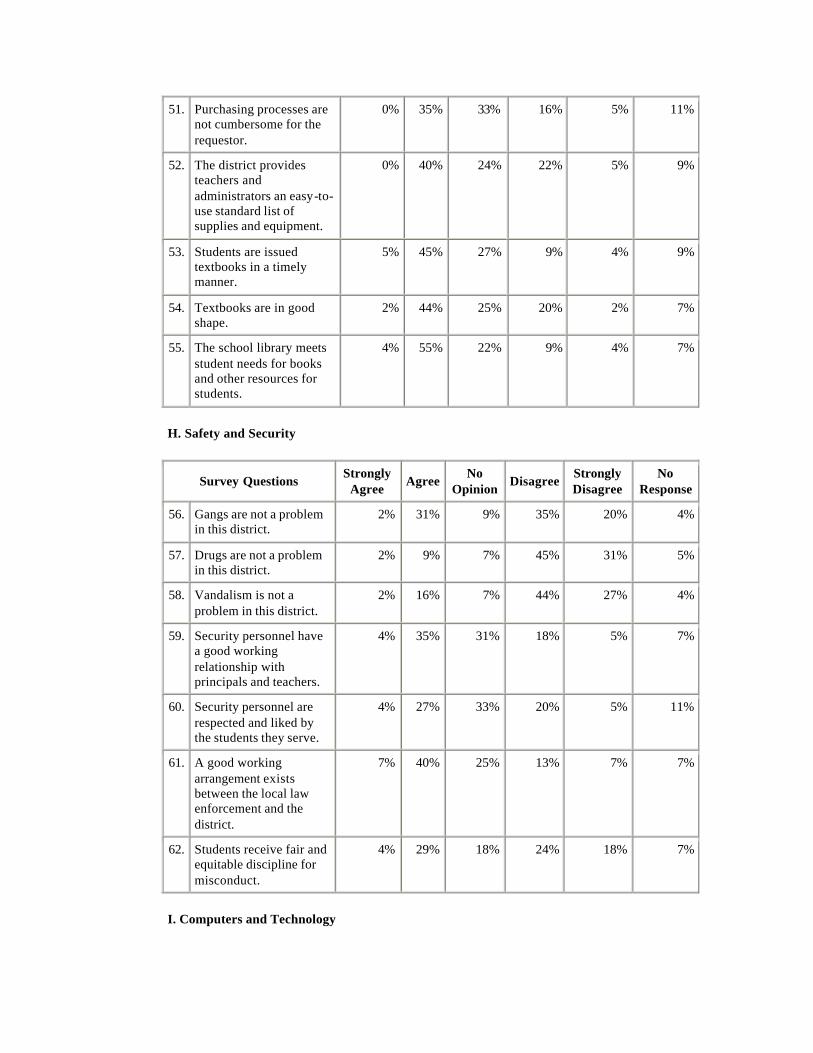
51. Purchasing processes are not cumbersome for the requestor.
0% 35% 33% 16% 5% 11%
52. The district provides teachers and administrators an easy-to-use standard list of supplies and equipment.
0% 40% 24% 22% 5% 9%
53. Students are issued textbooks in a timely manner.
5% 45% 27% 9% 4% 9%
54. Textbooks are in good shape.
2% 44% 25% 20% 2% 7%
55. The school library meets student needs for books and other resources for students.
4% 55% 22% 9% 4% 7%
H. Safety and Security
Survey Questions Strongly
Agree Agree
No Opinion
Disagree Strongly Disagree
No Response
56. Gangs are not a problem in this district.
2% 31% 9% 35% 20% 4%
57. Drugs are not a problem in this district.
2% 9% 7% 45% 31% 5%
58. Vandalism is not a problem in this district.
2% 16% 7% 44% 27% 4%
59. Security personnel have a good working relationship with principals and teachers.
4% 35% 31% 18% 5% 7%
60. Security personnel are respected and liked by the students they serve.
4% 27% 33% 20% 5% 11%
61. A good working arrangement exists between the local law enforcement and the district.
7% 40% 25% 13% 7% 7%
62. Students receive fair and equitable discipline for misconduct.
4% 29% 18% 24% 18% 7%
I. Computers and Technology
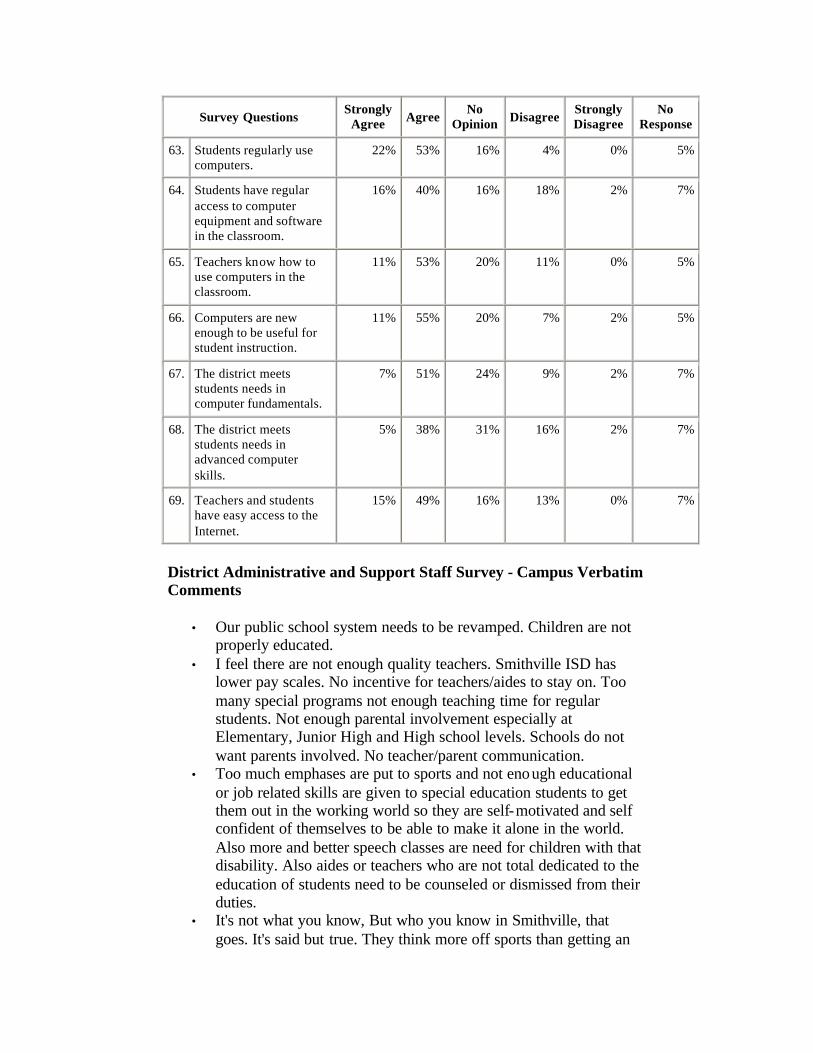
Survey Questions Strongly
Agree Agree No
Opinion Disagree Strongly Disagree
No Response
63. Students regularly use computers.
22% 53% 16% 4% 0% 5%
64. Students have regular access to computer equipment and software in the classroom.
16% 40% 16% 18% 2% 7%
65. Teachers know how to use computers in the classroom.
11% 53% 20% 11% 0% 5%
66. Computers are new enough to be useful for student instruction.
11% 55% 20% 7% 2% 5%
67. The district meets students needs in computer fundamentals.
7% 51% 24% 9% 2% 7%
68. The district meets students needs in advanced computer skills.
5% 38% 31% 16% 2% 7%
69. Teachers and students have easy access to the Internet.
15% 49% 16% 13% 0% 7%
District Administrative and Support Staff Survey - Campus Verbatim Comments
• Our public school system needs to be revamped. Children are not properly educated.
• I feel there are not enough quality teachers. Smithville ISD has lower pay scales. No incentive for teachers/aides to stay on. Too many special programs not enough teaching time for regular students. Not enough parental involvement especially at Elementary, Junior High and High school levels. Schools do not want parents involved. No teacher/parent communication.
• Too much emphases are put to sports and not enough educational or job related skills are given to special education students to get them out in the working world so they are self-motivated and self confident of themselves to be able to make it alone in the world. Also more and better speech classes are need for children with that disability. Also aides or teachers who are not total dedicated to the education of students need to be counseled or dismissed from their duties.
• It's not what you know, But who you know in Smithville, that goes. It's said but true. They think more off sports than getting an
education. They all so show favoritism. It shows they make rules and then don't follow threw with them, School Board kids can do any thing. We only get rejects from other schools Teach kids to respect people and schools. Not to cheat or steal,
• I feel that the children are being taught the TAAS test and they need so much more than that. In our district we have much more needs than this we need to nurture the student-Parents do very little with the child-we are having to teach them basic life skills for survival. Too much emphasis is put on TAAS testing.
• Just want to say that Special Education at Smithville ISD leaves a lot to be desired. There are some excellent, dedicated teachers but most are non professionals, ill equipped to teach this very needy group of children. P.S. In special Ed, where does the money go? I don't see that much entering the classroom.
• Did not receive questionnaire until 5/17/2000, That should give you some idea. Cafeteria serves decent food-although kids would rather have Burgers and Buritos. Kitchen is cleanest I have worked in however enough time is not given to do it properly. Have been short handed 3-4 people since January and have not had subs-workers haven't been comp. for extra work and must get all done by regular closing time. O.T. is mostly offered to favorites or ones of low hourly wages. Ones with higher wages are seldom offered O.T. Higher wages supposedly to come at beginning of next year -but I wouldn't bet on it. We are expecting our usual 21-25c hourly raise, not the one to bring us up to par with other schools. Have never rec. evaluation until this year we were given self evaluation form to fill out-comments only. Don't really know how to fill mine out because have never been told if I'm doing good job or even correctly. Although working with 10-12 women-it could be worse.
• As a parent of two teenagers, I feel this school is not the best. One has dropped out and I would like to see a GED program in effect. The other can not even pass TAAS testing. I think the school should sit down and look at some of their programs. I think Mrs. Doss is a very good counselor, but could use help. I find it real disgusting to get my one teen up, to start school each day.
• I highly dislike the district telling incoming 9th graders that they have to take Spanish as no other language is offered! Or, that they have to take World History in 9th grade instead of continuing their Am.Hist-"Civil War to present" after studying "N.Am up to Civil War" in 8th grade!
• I'm not involved with teaching part of education so don't have opinions about a lot of this-Involved with the cafeteria part-which is a great environment.
• We need male janitor to clean main cafeteria kitchen floor. Thanks you.
• I have one comment about the TAAS. I think it's not right you have to pass the TAAS before you can graduate. I feel if you pass all your classes and have your credit then you are ready to graduate. So I think the TAAS needs to be eliminated.
• Smithville seems to cater to the Special Ed and GT students. There in not enough presented to top performing students with a 95 average. There also seems to be a lack of communication regarding curriculum alignment in the campuses. Brown's reading and math programs for 2nd and 3rd need help. Programs are too simplified. They need to cater to excelling students not low performing. I want students who go to college and excel not ditch diggers.
• I think more vocational course and better equipment for such courses needs attention Building and Trades and Automotive, Welding also drafting. So students that wont be going to college can be skilled enough to get a good job after they graduate. We have some of theses courses now but our equipment and machinery are lacking to teach a student adequately. Also I would love to see state wide insurance for teachers, like all state employees have.
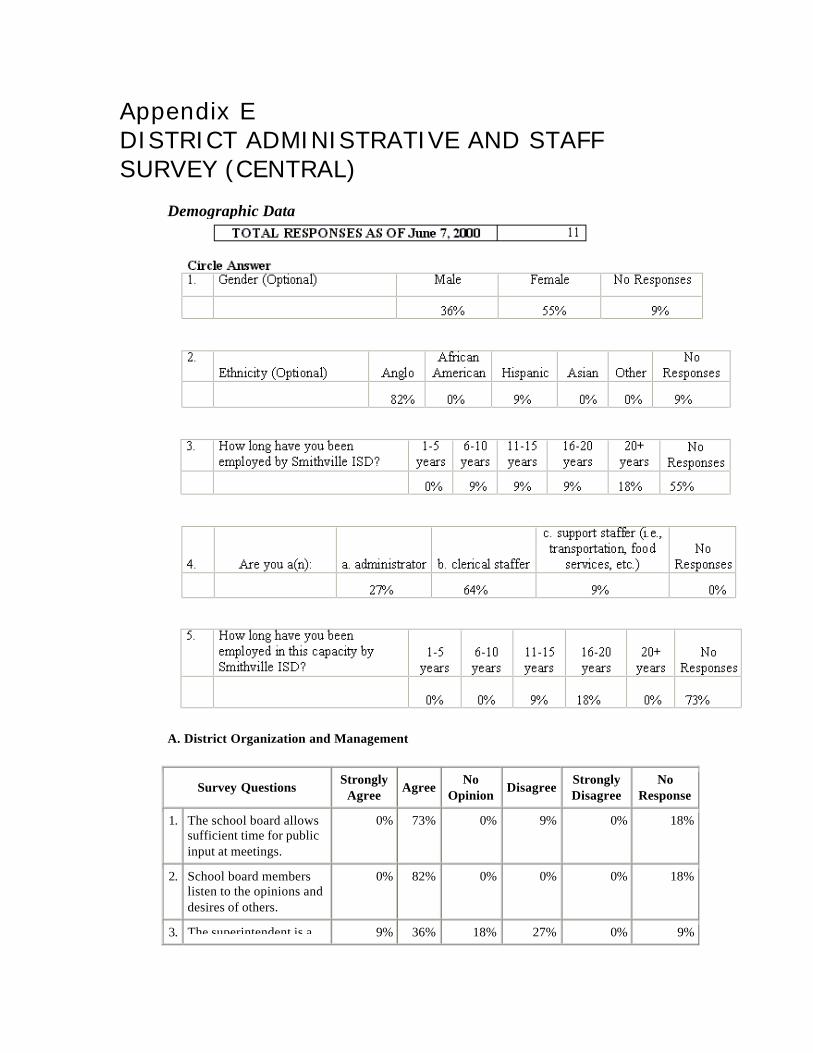
Appendix E
DISTRICT ADMINISTRATIVE AND STAFF SURVEY (CENTRAL)
Demographic Data
A. District Organization and Management
Survey Questions Strongly
Agree Agree
No Opinion
Disagree Strongly Disagree
No Response
1. The school board allows sufficient time for public input at meetings.
0% 73% 0% 9% 0% 18%
2. School board members listen to the opinions and desires of others.
0% 82% 0% 0% 0% 18%
3. The superintendent is a 9% 36% 18% 27% 0% 9%
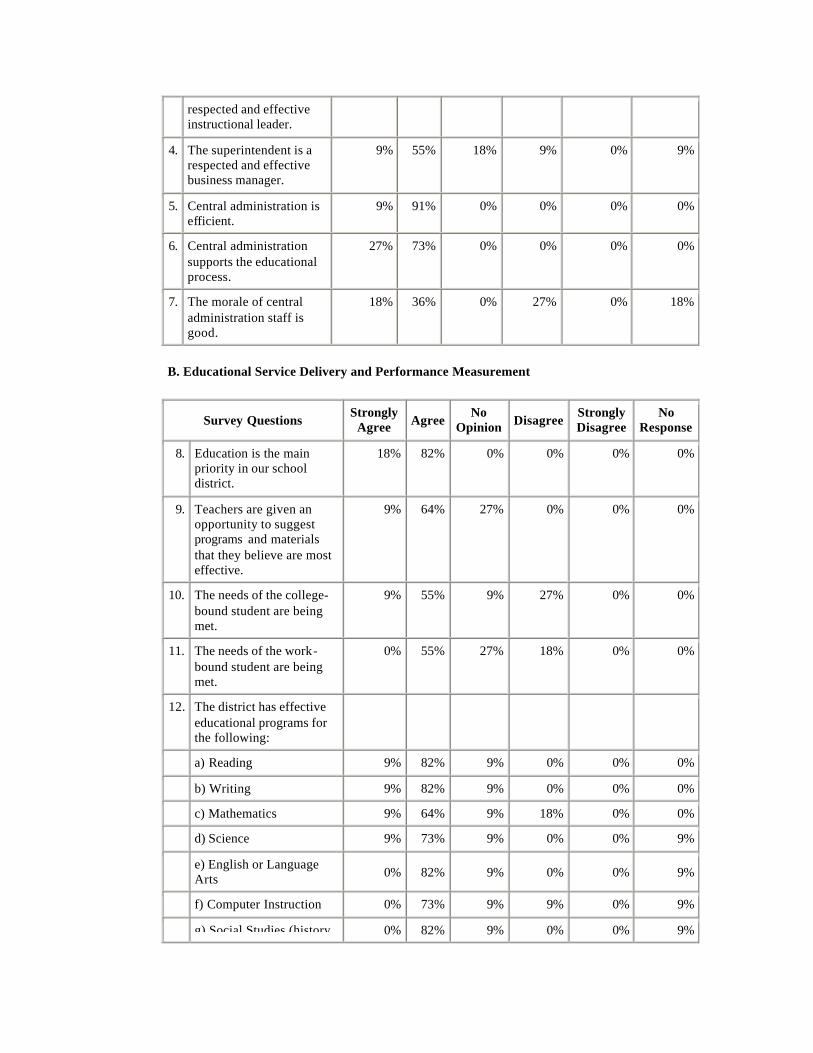
respected and effective instructional leader.
4. The superintendent is a respected and effective business manager.
9% 55% 18% 9% 0% 9%
5. Central administration is efficient.
9% 91% 0% 0% 0% 0%
6. Central administration supports the educational process.
27% 73% 0% 0% 0% 0%
7. The morale of central administration staff is good.
18% 36% 0% 27% 0% 18%
B. Educational Service Delivery and Performance Measurement
Survey Questions Strongly
Agree Agree No
Opinion Disagree Strongly Disagree
No Response
8. Education is the main priority in our school district.
18% 82% 0% 0% 0% 0%
9. Teachers are given an opportunity to suggest programs and materials that they believe are most effective.
9% 64% 27% 0% 0% 0%
10. The needs of the college-bound student are being met.
9% 55% 9% 27% 0% 0%
11. The needs of the work-bound student are being met.
0% 55% 27% 18% 0% 0%
12. The district has effective educational programs for the following:
a) Reading 9% 82% 9% 0% 0% 0%
b) Writing 9% 82% 9% 0% 0% 0%
c) Mathematics 9% 64% 9% 18% 0% 0%
d) Science 9% 73% 9% 0% 0% 9%
e) English or Language Arts 0% 82% 9% 0% 0% 9%
f) Computer Instruction 0% 73% 9% 9% 0% 9%
g) Social Studies (history 0% 82% 9% 0% 0% 9%
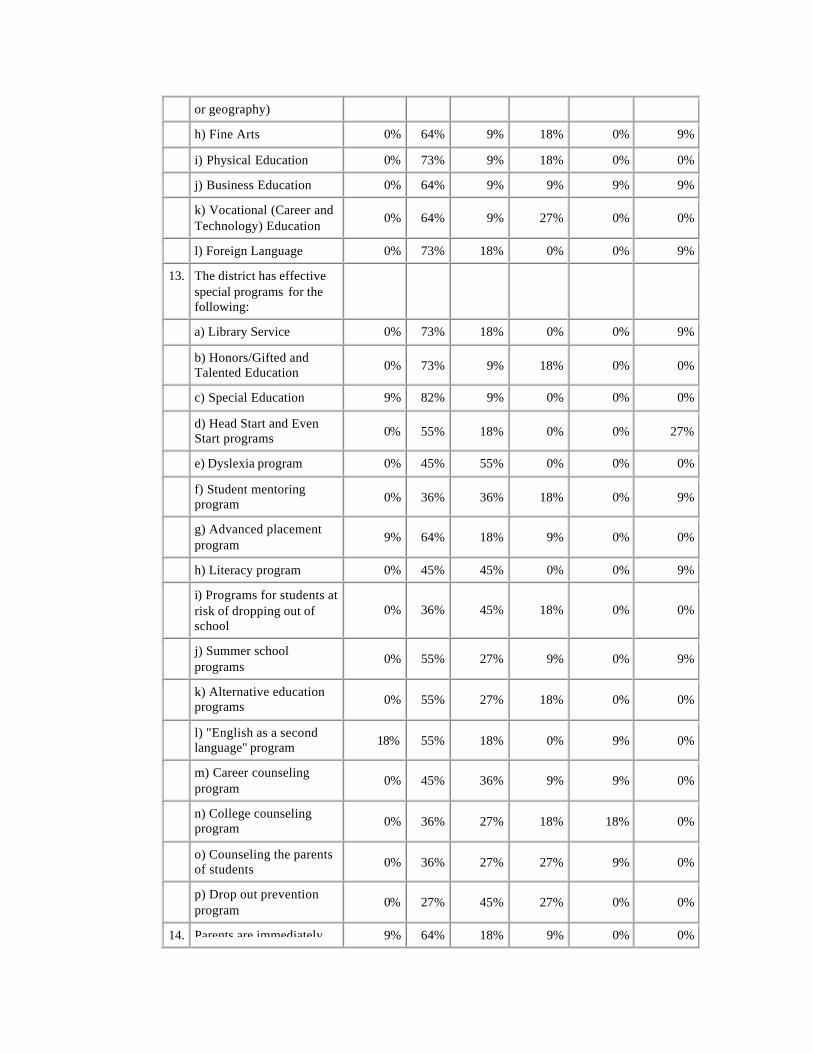
or geography)
h) Fine Arts 0% 64% 9% 18% 0% 9%
i) Physical Education 0% 73% 9% 18% 0% 0%
j) Business Education 0% 64% 9% 9% 9% 9%
k) Vocational (Career and Technology) Education
0% 64% 9% 27% 0% 0%
l) Foreign Language 0% 73% 18% 0% 0% 9%
13. The district has effective special programs for the following:
a) Library Service 0% 73% 18% 0% 0% 9%
b) Honors/Gifted and Talented Education 0% 73% 9% 18% 0% 0%
c) Special Education 9% 82% 9% 0% 0% 0%
d) Head Start and Even Start programs 0% 55% 18% 0% 0% 27%
e) Dyslexia program 0% 45% 55% 0% 0% 0%
f) Student mentoring program 0% 36% 36% 18% 0% 9%
g) Advanced placement program
9% 64% 18% 9% 0% 0%
h) Literacy program 0% 45% 45% 0% 0% 9%
i) Programs for students at risk of dropping out of school
0% 36% 45% 18% 0% 0%
j) Summer school programs
0% 55% 27% 9% 0% 9%
k) Alternative education programs 0% 55% 27% 18% 0% 0%
l) "English as a second language" program 18% 55% 18% 0% 9% 0%
m) Career counseling program
0% 45% 36% 9% 9% 0%
n) College counseling program 0% 36% 27% 18% 18% 0%
o) Counseling the parents of students 0% 36% 27% 27% 9% 0%
p) Drop out prevention program
0% 27% 45% 27% 0% 0%
14. Parents are immediately 9% 64% 18% 9% 0% 0%
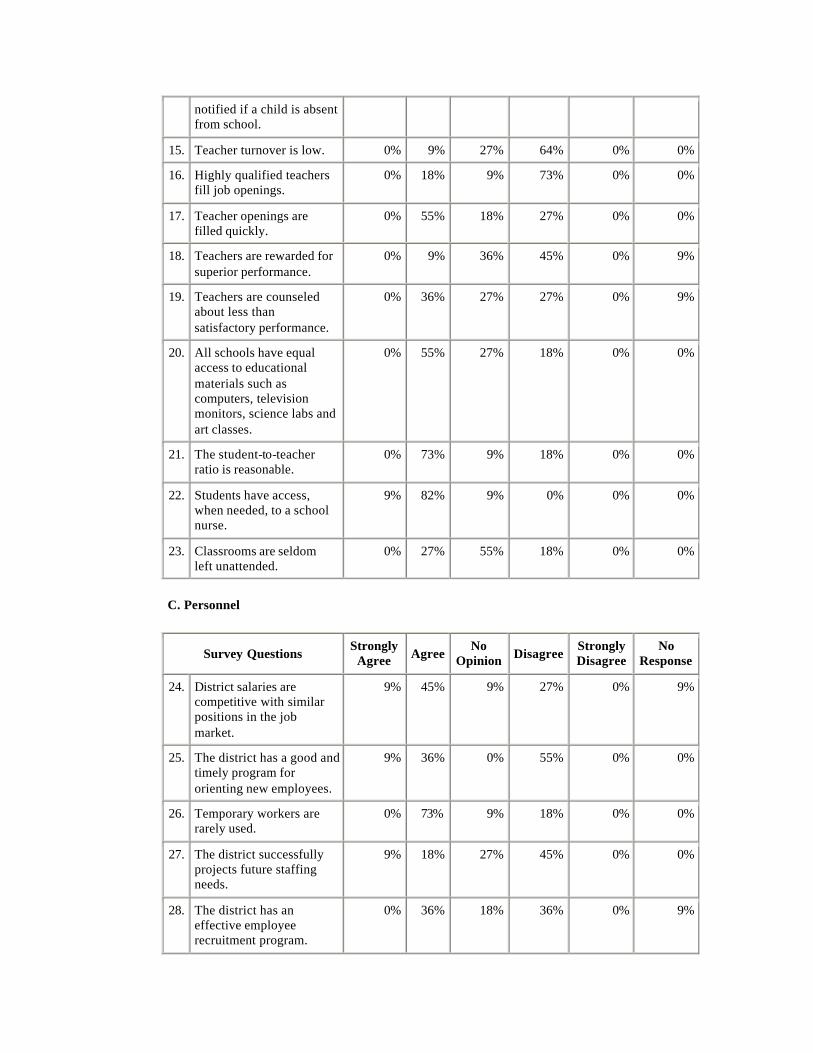
notified if a child is absent from school.
15. Teacher turnover is low. 0% 9% 27% 64% 0% 0%
16. Highly qualified teachers fill job openings.
0% 18% 9% 73% 0% 0%
17. Teacher openings are filled quickly.
0% 55% 18% 27% 0% 0%
18. Teachers are rewarded for superior performance.
0% 9% 36% 45% 0% 9%
19. Teachers are counseled about less than satisfactory performance.
0% 36% 27% 27% 0% 9%
20. All schools have equal access to educational materials such as computers, television monitors, science labs and art classes.
0% 55% 27% 18% 0% 0%
21. The student-to-teacher ratio is reasonable.
0% 73% 9% 18% 0% 0%
22. Students have access, when needed, to a school nurse.
9% 82% 9% 0% 0% 0%
23. Classrooms are seldom left unattended.
0% 27% 55% 18% 0% 0%
C. Personnel
Survey Questions Strongly
Agree Agree No
Opinion Disagree Strongly Disagree
No Response
24. District salaries are competitive with similar positions in the job market.
9% 45% 9% 27% 0% 9%
25. The district has a good and timely program for orienting new employees.
9% 36% 0% 55% 0% 0%
26. Temporary workers are rarely used.
0% 73% 9% 18% 0% 0%
27. The district successfully projects future staffing needs.
9% 18% 27% 45% 0% 0%
28. The district has an effective employee recruitment program.
0% 36% 18% 36% 0% 9%
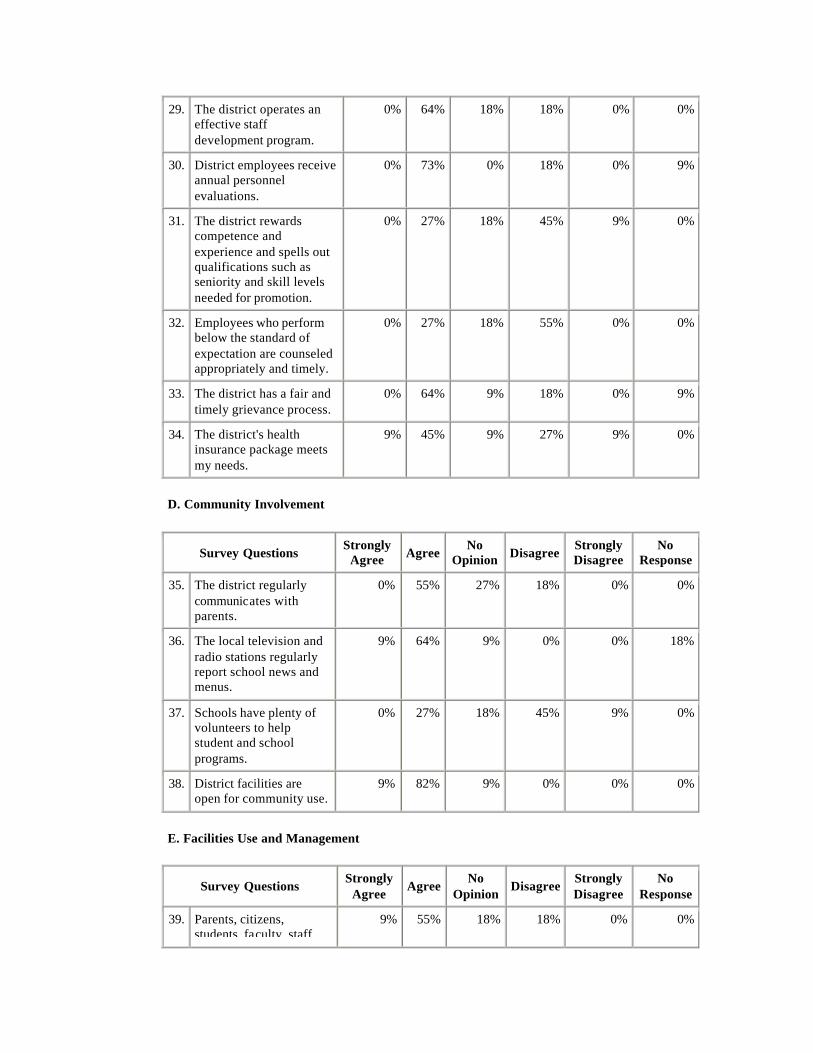
29. The district operates an effective staff development program.
0% 64% 18% 18% 0% 0%
30. District employees receive annual personnel evaluations.
0% 73% 0% 18% 0% 9%
31. The district rewards competence and experience and spells out qualifications such as seniority and skill levels needed for promotion.
0% 27% 18% 45% 9% 0%
32. Employees who perform below the standard of expectation are counseled appropriately and timely.
0% 27% 18% 55% 0% 0%
33. The district has a fair and timely grievance process.
0% 64% 9% 18% 0% 9%
34. The district's health insurance package meets my needs.
9% 45% 9% 27% 9% 0%
D. Community Involvement
Survey Questions Strongly
Agree Agree No
Opinion Disagree Strongly Disagree
No Response
35. The district regularly communicates with parents.
0% 55% 27% 18% 0% 0%
36. The local television and radio stations regularly report school news and menus.
9% 64% 9% 0% 0% 18%
37. Schools have plenty of volunteers to help student and school programs.
0% 27% 18% 45% 9% 0%
38. District facilities are open for community use.
9% 82% 9% 0% 0% 0%
E. Facilities Use and Management
Survey Questions Strongly
Agree Agree
No Opinion
Disagree Strongly Disagree
No Response
39. Parents, citizens, students, faculty, staff
9% 55% 18% 18% 0% 0%

and the board provide input into facility planning.
40. The architect and construction managers are selected objectively and impersonally.
9% 55% 36% 0% 0% 0%
41. Schools are clean. 0% 18% 0% 82% 0% 0%
42. Buildings are properly maintained in a timely manner.
0% 73% 0% 27% 0% 0%
43. Repairs are made in a timely manner.
0% 73% 0% 27% 0% 0%
44. Emergency maintenance is handled promptly.
9% 91% 0% 0% 0% 0%
F. Financial Management
Survey Questions Strongly
Agree Agree No
Opinion Disagree Strongly Disagree
No Response
45. Site-based budgeting is used effectively to extend the involvement of principals and teachers.
0% 55% 36% 9% 0% 0%
46. Campus administrators are well trained in fiscal management techniques.
0% 27% 55% 18% 0% 0%
47. The district's financial reports are easy to understand and read.
0% 18% 45% 27% 0% 9%
48. Financial reports are made available to community members when asked.
9% 82% 9% 0% 0% 0%
G. Purchasing and Warehousing
Survey Questions Strongly
Agree Agree No
Opinion Disagree Strongly Disagree
No Response
49. Purchasing gets me what I need when I need it.
0% 91% 0% 0% 0% 9%
50. Purchasing acquires the highest quality materials and equipment at the lowest cost.
0% 100% 0% 0% 0% 0%
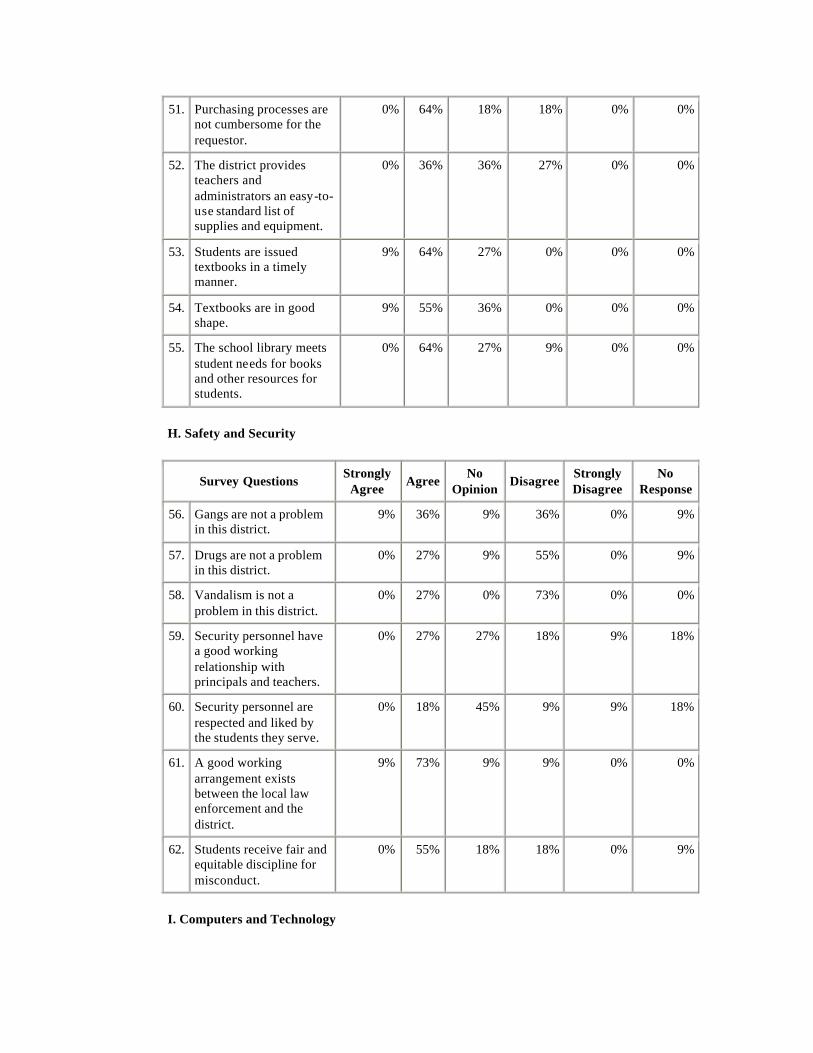
51. Purchasing processes are not cumbersome for the requestor.
0% 64% 18% 18% 0% 0%
52. The district provides teachers and administrators an easy-to-use standard list of supplies and equipment.
0% 36% 36% 27% 0% 0%
53. Students are issued textbooks in a timely manner.
9% 64% 27% 0% 0% 0%
54. Textbooks are in good shape.
9% 55% 36% 0% 0% 0%
55. The school library meets student needs for books and other resources for students.
0% 64% 27% 9% 0% 0%
H. Safety and Security
Survey Questions Strongly
Agree Agree
No Opinion
Disagree Strongly Disagree
No Response
56. Gangs are not a problem in this district.
9% 36% 9% 36% 0% 9%
57. Drugs are not a problem in this district.
0% 27% 9% 55% 0% 9%
58. Vandalism is not a problem in this district.
0% 27% 0% 73% 0% 0%
59. Security personnel have a good working relationship with principals and teachers.
0% 27% 27% 18% 9% 18%
60. Security personnel are respected and liked by the students they serve.
0% 18% 45% 9% 9% 18%
61. A good working arrangement exists between the local law enforcement and the district.
9% 73% 9% 9% 0% 0%
62. Students receive fair and equitable discipline for misconduct.
0% 55% 18% 18% 0% 9%
I. Computers and Technology
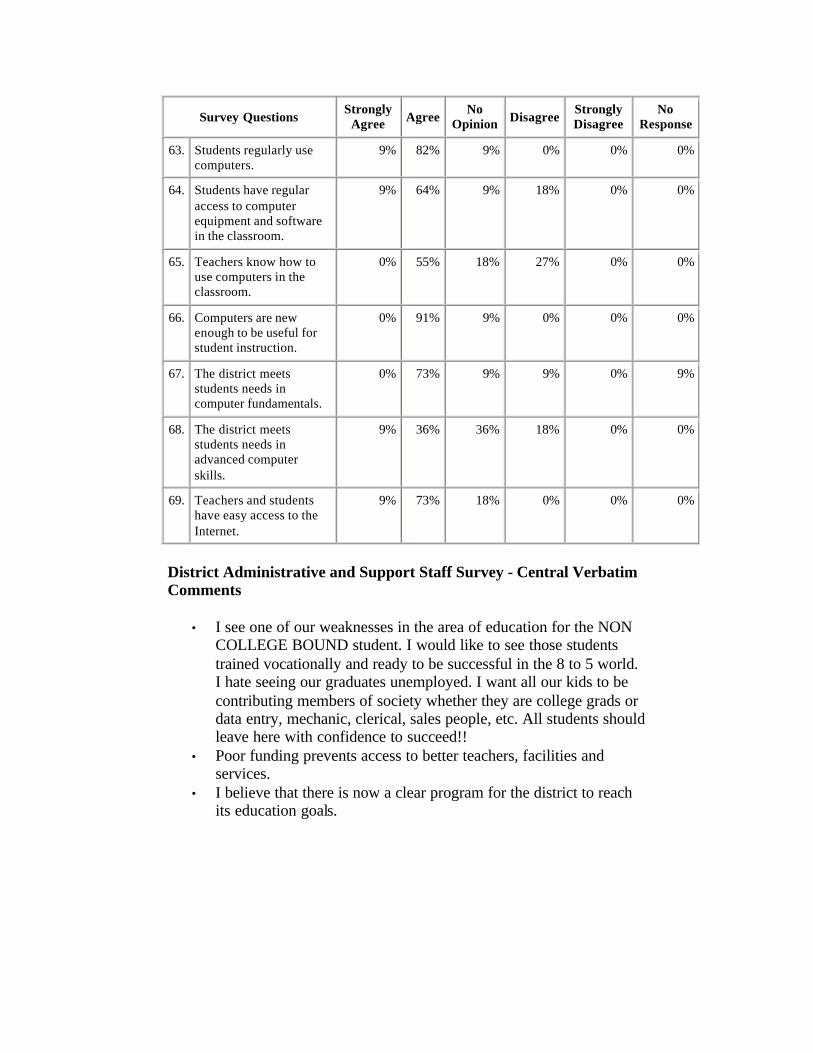
Survey Questions Strongly
Agree Agree No
Opinion Disagree Strongly Disagree
No Response
63. Students regularly use computers.
9% 82% 9% 0% 0% 0%
64. Students have regular access to computer equipment and software in the classroom.
9% 64% 9% 18% 0% 0%
65. Teachers know how to use computers in the classroom.
0% 55% 18% 27% 0% 0%
66. Computers are new enough to be useful for student instruction.
0% 91% 9% 0% 0% 0%
67. The district meets students needs in computer fundamentals.
0% 73% 9% 9% 0% 9%
68. The district meets students needs in advanced computer skills.
9% 36% 36% 18% 0% 0%
69. Teachers and students have easy access to the Internet.
9% 73% 18% 0% 0% 0%
District Administrative and Support Staff Survey - Central Verbatim Comments
• I see one of our weaknesses in the area of education for the NON COLLEGE BOUND student. I would like to see those students trained vocationally and ready to be successful in the 8 to 5 world. I hate seeing our graduates unemployed. I want all our kids to be contributing members of society whether they are college grads or data entry, mechanic, clerical, sales people, etc. All students should leave here with confidence to succeed!!
• Poor funding prevents access to better teachers, facilities and services.
• I believe that there is now a clear program for the district to reach its education goals.
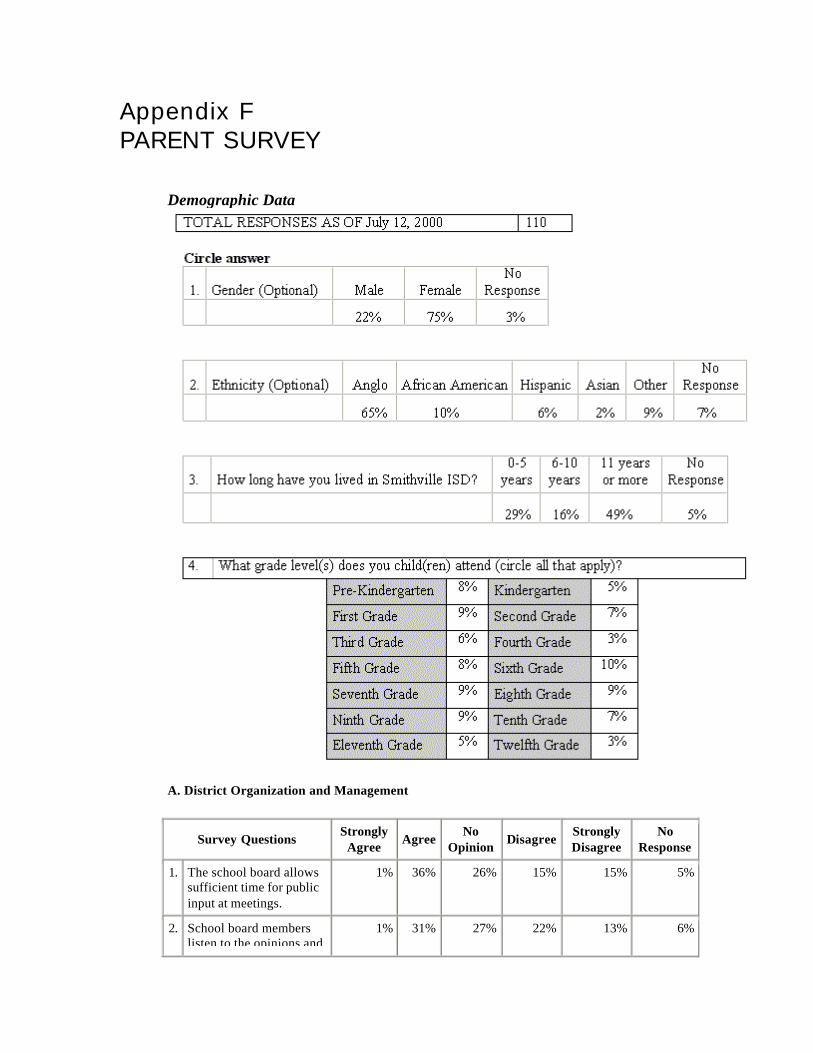
Appendix F
PARENT SURVEY
Demographic Data
A. District Organization and Management
Survey Questions Strongly
Agree Agree
No Opinion
Disagree Strongly Disagree
No Response
1. The school board allows sufficient time for public input at meetings.
1% 36% 26% 15% 15% 5%
2. School board members listen to the opinions and
1% 31% 27% 22% 13% 6%
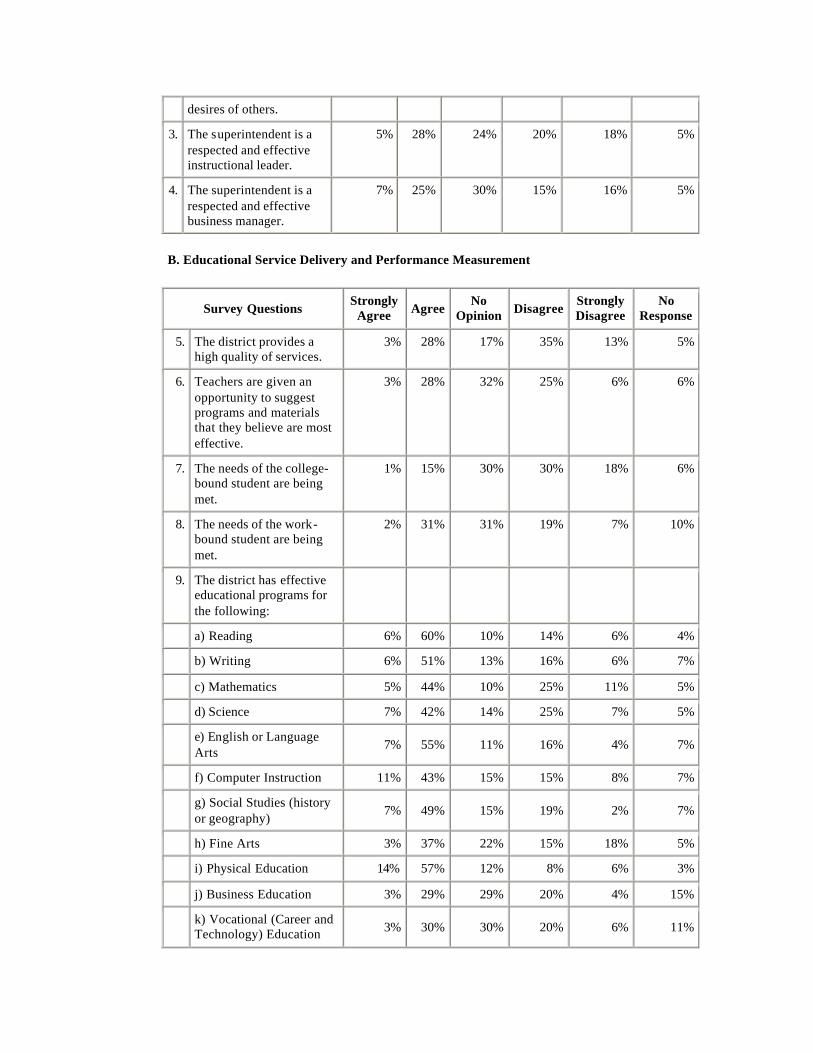
desires of others.
3. The superintendent is a respected and effective instructional leader.
5% 28% 24% 20% 18% 5%
4. The superintendent is a respected and effective business manager.
7% 25% 30% 15% 16% 5%
B. Educational Service Delivery and Performance Measurement
Survey Questions Strongly
Agree Agree No
Opinion Disagree Strongly Disagree
No Response
5. The district provides a high quality of services.
3% 28% 17% 35% 13% 5%
6. Teachers are given an opportunity to suggest programs and materials that they believe are most effective.
3% 28% 32% 25% 6% 6%
7. The needs of the college-bound student are being met.
1% 15% 30% 30% 18% 6%
8. The needs of the work-bound student are being met.
2% 31% 31% 19% 7% 10%
9. The district has effective educational programs for the following:
a) Reading 6% 60% 10% 14% 6% 4%
b) Writing 6% 51% 13% 16% 6% 7%
c) Mathematics 5% 44% 10% 25% 11% 5%
d) Science 7% 42% 14% 25% 7% 5%
e) English or Language Arts
7% 55% 11% 16% 4% 7%
f) Computer Instruction 11% 43% 15% 15% 8% 7%
g) Social Studies (history or geography)
7% 49% 15% 19% 2% 7%
h) Fine Arts 3% 37% 22% 15% 18% 5%
i) Physical Education 14% 57% 12% 8% 6% 3%
j) Business Education 3% 29% 29% 20% 4% 15%
k) Vocational (Career and Technology) Education 3% 30% 30% 20% 6% 11%
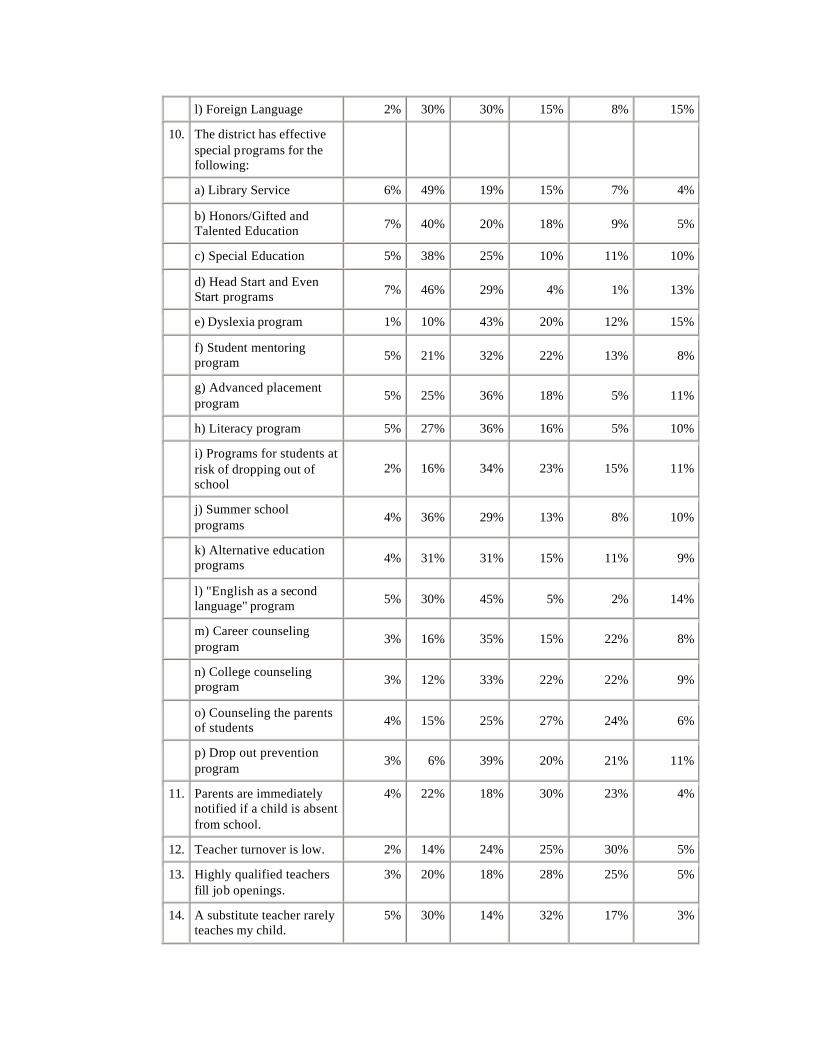
l) Foreign Language 2% 30% 30% 15% 8% 15%
10. The district has effective special programs for the following:
a) Library Service 6% 49% 19% 15% 7% 4%
b) Honors/Gifted and Talented Education 7% 40% 20% 18% 9% 5%
c) Special Education 5% 38% 25% 10% 11% 10%
d) Head Start and Even Start programs 7% 46% 29% 4% 1% 13%
e) Dyslexia program 1% 10% 43% 20% 12% 15%
f) Student mentoring program 5% 21% 32% 22% 13% 8%
g) Advanced placement program
5% 25% 36% 18% 5% 11%
h) Literacy program 5% 27% 36% 16% 5% 10%
i) Programs for students at risk of dropping out of school
2% 16% 34% 23% 15% 11%
j) Summer school programs
4% 36% 29% 13% 8% 10%
k) Alternative education programs 4% 31% 31% 15% 11% 9%
l) "English as a second language" program 5% 30% 45% 5% 2% 14%
m) Career counseling program
3% 16% 35% 15% 22% 8%
n) College counseling program 3% 12% 33% 22% 22% 9%
o) Counseling the parents of students 4% 15% 25% 27% 24% 6%
p) Drop out prevention program
3% 6% 39% 20% 21% 11%
11. Parents are immediately notified if a child is absent from school.
4% 22% 18% 30% 23% 4%
12. Teacher turnover is low. 2% 14% 24% 25% 30% 5%
13. Highly qualified teachers fill job openings.
3% 20% 18% 28% 25% 5%
14. A substitute teacher rarely teaches my child.
5% 30% 14% 32% 17% 3%
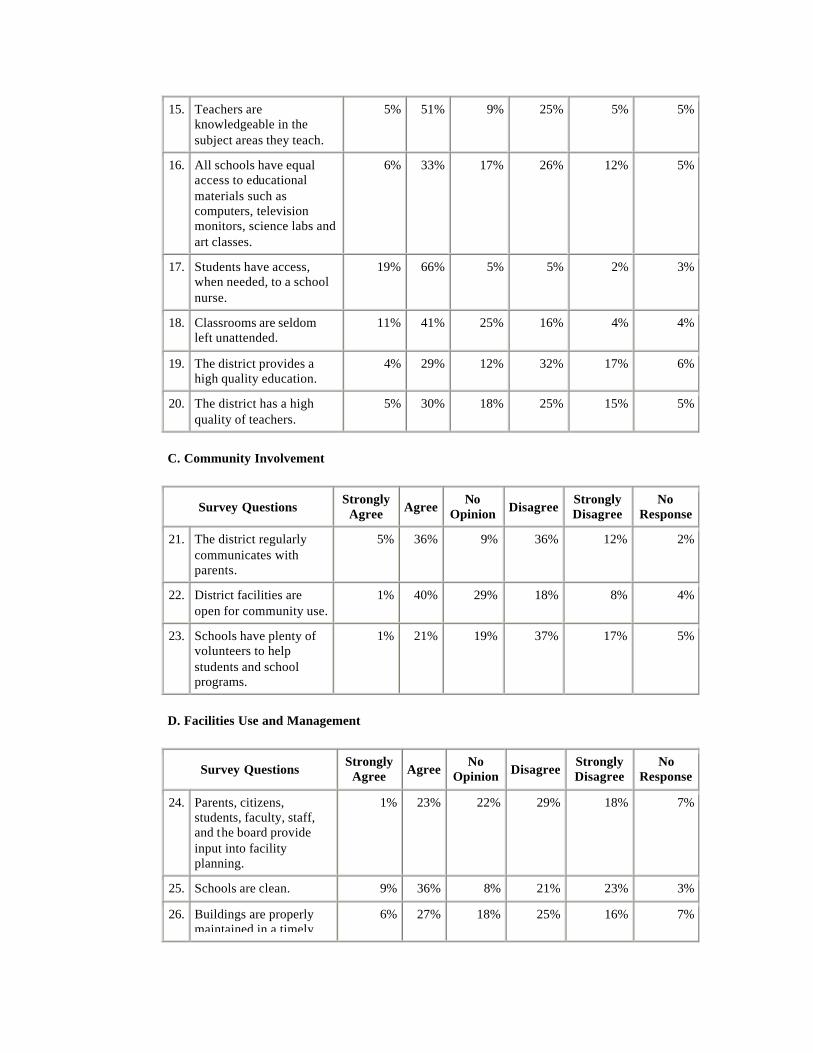
15. Teachers are knowledgeable in the subject areas they teach.
5% 51% 9% 25% 5% 5%
16. All schools have equal access to educational materials such as computers, television monitors, science labs and art classes.
6% 33% 17% 26% 12% 5%
17. Students have access, when needed, to a school nurse.
19% 66% 5% 5% 2% 3%
18. Classrooms are seldom left unattended.
11% 41% 25% 16% 4% 4%
19. The district provides a high quality education.
4% 29% 12% 32% 17% 6%
20. The district has a high quality of teachers.
5% 30% 18% 25% 15% 5%
C. Community Involvement
Survey Questions Strongly
Agree Agree No
Opinion Disagree Strongly Disagree
No Response
21. The district regularly communicates with parents.
5% 36% 9% 36% 12% 2%
22. District facilities are open for community use.
1% 40% 29% 18% 8% 4%
23. Schools have plenty of volunteers to help students and school programs.
1% 21% 19% 37% 17% 5%
D. Facilities Use and Management
Survey Questions Strongly
Agree Agree No
Opinion Disagree Strongly Disagree
No Response
24. Parents, citizens, students, faculty, staff, and the board provide input into facility planning.
1% 23% 22% 29% 18% 7%
25. Schools are clean. 9% 36% 8% 21% 23% 3%
26. Buildings are properly maintained in a timely
6% 27% 18% 25% 16% 7%
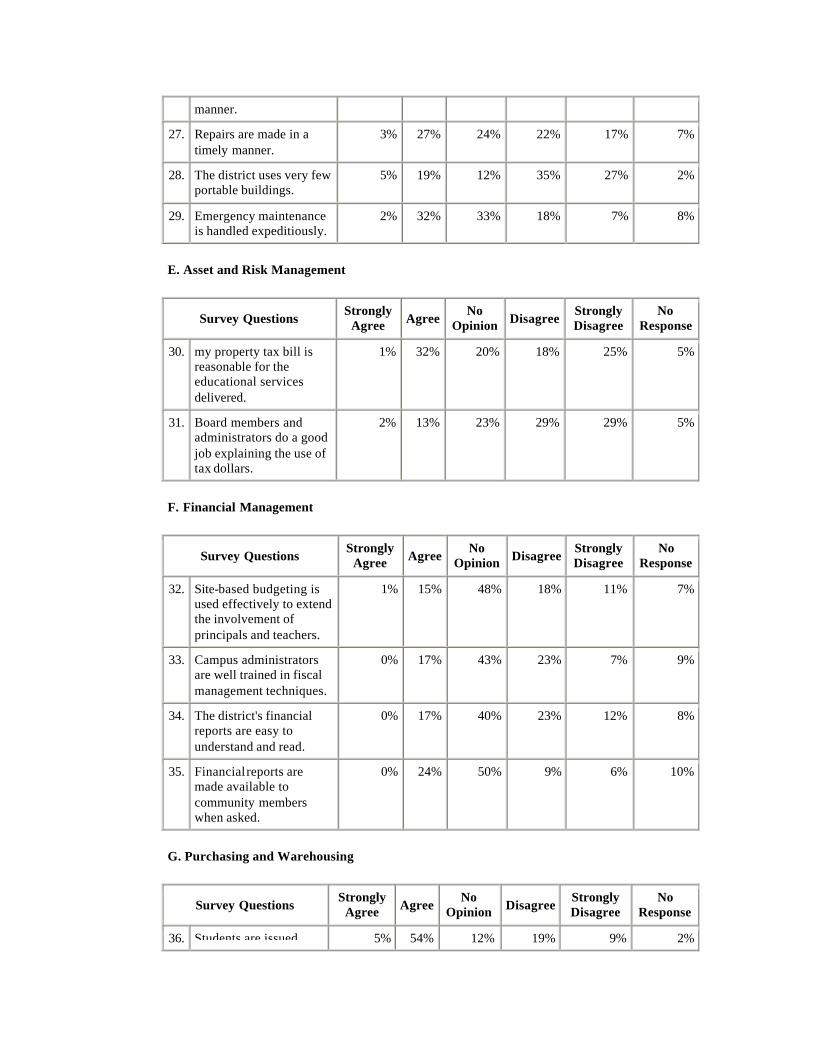
manner.
27. Repairs are made in a timely manner.
3% 27% 24% 22% 17% 7%
28. The district uses very few portable buildings.
5% 19% 12% 35% 27% 2%
29. Emergency maintenance is handled expeditiously.
2% 32% 33% 18% 7% 8%
E. Asset and Risk Management
Survey Questions Strongly
Agree Agree No
Opinion Disagree Strongly Disagree
No Response
30. my property tax bill is reasonable for the educational services delivered.
1% 32% 20% 18% 25% 5%
31. Board members and administrators do a good job explaining the use of tax dollars.
2% 13% 23% 29% 29% 5%
F. Financial Management
Survey Questions Strongly
Agree Agree No
Opinion Disagree Strongly Disagree
No Response
32. Site-based budgeting is used effectively to extend the involvement of principals and teachers.
1% 15% 48% 18% 11% 7%
33. Campus administrators are well trained in fiscal management techniques.
0% 17% 43% 23% 7% 9%
34. The district's financial reports are easy to understand and read.
0% 17% 40% 23% 12% 8%
35. Financial reports are made available to community members when asked.
0% 24% 50% 9% 6% 10%
G. Purchasing and Warehousing
Survey Questions Strongly
Agree Agree No
Opinion Disagree Strongly Disagree
No Response
36. Students are issued 5% 54% 12% 19% 9% 2%
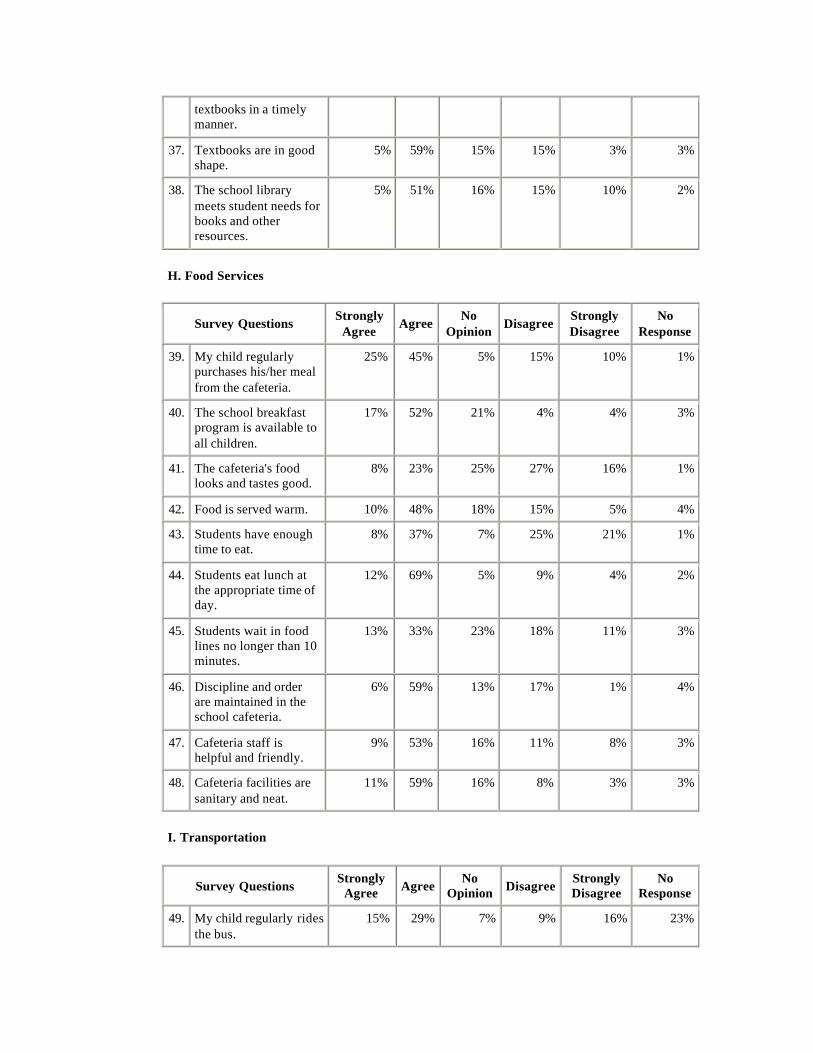
textbooks in a timely manner.
37. Textbooks are in good shape.
5% 59% 15% 15% 3% 3%
38. The school library meets student needs for books and other resources.
5% 51% 16% 15% 10% 2%
H. Food Services
Survey Questions Strongly
Agree Agree
No Opinion
Disagree Strongly Disagree
No Response
39. My child regularly purchases his/her meal from the cafeteria.
25% 45% 5% 15% 10% 1%
40. The school breakfast program is available to all children.
17% 52% 21% 4% 4% 3%
41. The cafeteria's food looks and tastes good.
8% 23% 25% 27% 16% 1%
42. Food is served warm. 10% 48% 18% 15% 5% 4%
43. Students have enough time to eat.
8% 37% 7% 25% 21% 1%
44. Students eat lunch at the appropriate time of day.
12% 69% 5% 9% 4% 2%
45. Students wait in food lines no longer than 10 minutes.
13% 33% 23% 18% 11% 3%
46. Discipline and order are maintained in the school cafeteria.
6% 59% 13% 17% 1% 4%
47. Cafeteria staff is helpful and friendly.
9% 53% 16% 11% 8% 3%
48. Cafeteria facilities are sanitary and neat.
11% 59% 16% 8% 3% 3%
I. Transportation
Survey Questions Strongly
Agree Agree No
Opinion Disagree Strongly Disagree
No Response
49. My child regularly rides the bus.
15% 29% 7% 9% 16% 23%
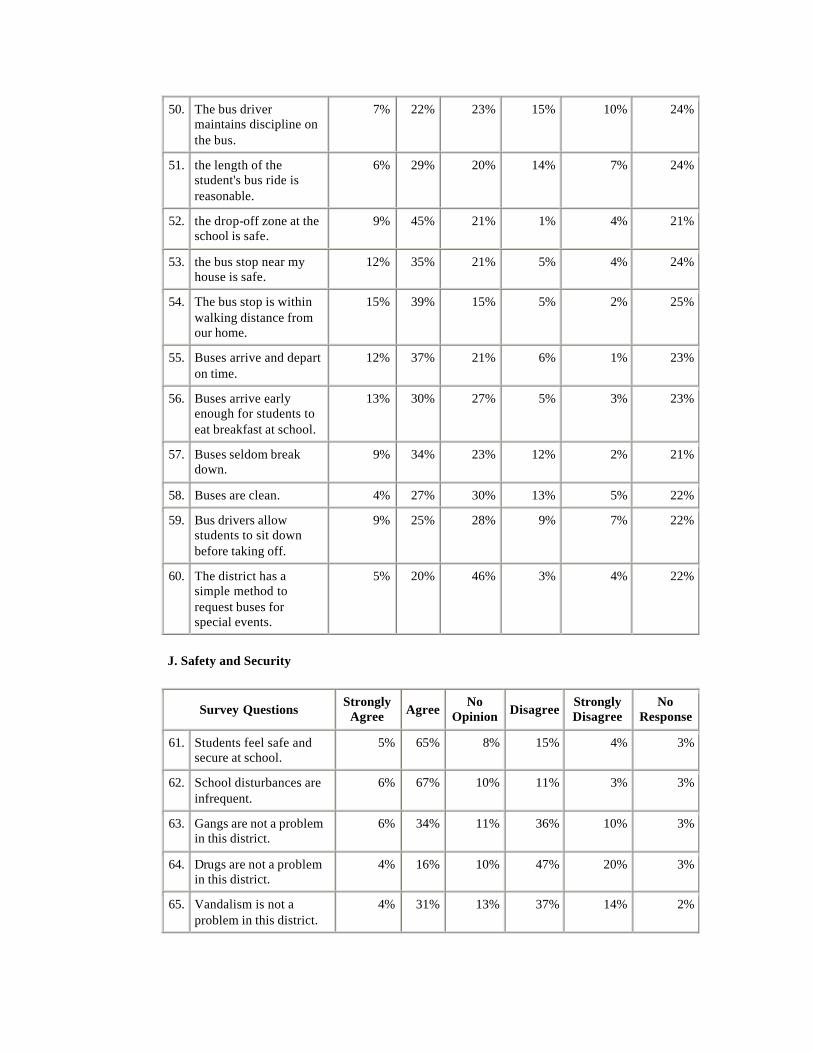
50. The bus driver maintains discipline on the bus.
7% 22% 23% 15% 10% 24%
51. the length of the student's bus ride is reasonable.
6% 29% 20% 14% 7% 24%
52. the drop-off zone at the school is safe.
9% 45% 21% 1% 4% 21%
53. the bus stop near my house is safe.
12% 35% 21% 5% 4% 24%
54. The bus stop is within walking distance from our home.
15% 39% 15% 5% 2% 25%
55. Buses arrive and depart on time.
12% 37% 21% 6% 1% 23%
56. Buses arrive early enough for students to eat breakfast at school.
13% 30% 27% 5% 3% 23%
57. Buses seldom break down.
9% 34% 23% 12% 2% 21%
58. Buses are clean. 4% 27% 30% 13% 5% 22%
59. Bus drivers allow students to sit down before taking off.
9% 25% 28% 9% 7% 22%
60. The district has a simple method to request buses for special events.
5% 20% 46% 3% 4% 22%
J. Safety and Security
Survey Questions Strongly
Agree Agree No
Opinion Disagree Strongly Disagree
No Response
61. Students feel safe and secure at school.
5% 65% 8% 15% 4% 3%
62. School disturbances are infrequent.
6% 67% 10% 11% 3% 3%
63. Gangs are not a problem in this district.
6% 34% 11% 36% 10% 3%
64. Drugs are not a problem in this district.
4% 16% 10% 47% 20% 3%
65. Vandalism is not a problem in this district.
4% 31% 13% 37% 14% 2%
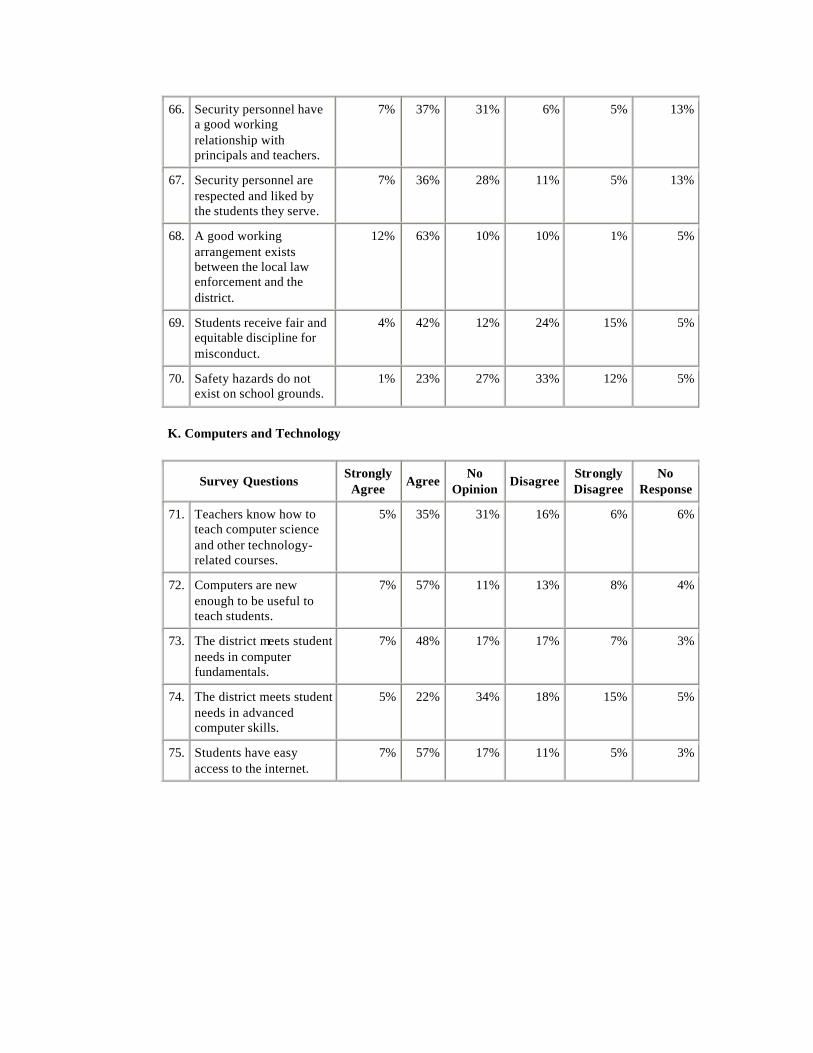
66. Security personnel have a good working relationship with principals and teachers.
7% 37% 31% 6% 5% 13%
67. Security personnel are respected and liked by the students they serve.
7% 36% 28% 11% 5% 13%
68. A good working arrangement exists between the local law enforcement and the district.
12% 63% 10% 10% 1% 5%
69. Students receive fair and equitable discipline for misconduct.
4% 42% 12% 24% 15% 5%
70. Safety hazards do not exist on school grounds.
1% 23% 27% 33% 12% 5%
K. Computers and Technology
Survey Questions Strongly
Agree Agree
No Opinion
Disagree Strongly Disagree
No Response
71. Teachers know how to teach computer science and other technology-related courses.
5% 35% 31% 16% 6% 6%
72. Computers are new enough to be useful to teach students.
7% 57% 11% 13% 8% 4%
73. The district meets student needs in computer fundamentals.
7% 48% 17% 17% 7% 3%
74. The district meets student needs in advanced computer skills.
5% 22% 34% 18% 15% 5%
75. Students have easy access to the internet.
7% 57% 17% 11% 5% 3%
Appendix F
PARENT SURVEY
Parent Survey Verbatim Responses
• SISD needs an overhaul from the top down. There is little respect for the school or district. Teachers for the most part are a joke. Inequities abound. We have been asking for help fo r many years. Please listen. There are grade changes, GPA's are altered, the board acts as a dictatorship rather than working w/the parents. Policy ion a general sense is not followed - and is left to interpretation.
• My oldest child graduated last year and was totally unprepared for SAT, ACT, or TASP exams. She had DECA her last 1/2 of the day and has NO idea where to begin filling income tax papers of any kind. High School discipline is a joke. Teachers cannot control classes if kids want to misbehave. My son was injured in PE and later we accidentally found out that the activity was not supervised by a teacher. It is widely known that a child will be chosen for GT or UIL or any extra curricular event if a parent works at the school, regardless of that child's lack of ability.
• I do not feel I should have to pay for my two children to ride the community transit bus to their day care center after school, because this district doesn't have enough school buses to provide in- town bus service. I have a problem with certain coaches who also teach a class at the jr. high school - they do not have the interest in teaching science and it shows.
• Students are not expected to reach the highest goals. Students are not required to give high respect to teachers and other students. Quite different from other areas we have lived - California and Missouri
• The Computers are ancient at Brown Primary! • I have been very pleased with the Pre-K program. However, in
other grades too much emphasis is placed on the TAAS test. Teachers even admit they "teach TAAS" and afterwards (MAY) they try to teach education. I know the district receives $ for the students doing well on this but it is a terrible injustice to the kids! A well rounded education is what ever child deserves and should have a right to. This frustrates parents and teachers. This practice does not provide students with the tools and knowledge needed for higher education. In turn, kids feel inadequate and lacking in self confidence. Look at the % rate of high school graduates who go on to attend college. It is alarmingly low. I fear losing my child to this as well as short changing him/his life. We are seriously looking into private school for our child. More and more are opening in this area because the demand is there. This area has a lot of home-
school students as well as private school students. There are a lot of wonderful and talented teachers @ Smithville ISD, if they were allowed to just teach. Thank you -
• Teachers do not have enough training in needs of Special Ed. Kids. • It's fairly consistent. But it's very obvious who the "good" teachers
are. You just need to walk into a classroom and it says it all. They are vibrant and busy places - full of projects that look like fun and the others are stale and old and void of any interest. I really hate it when my child gets a teacher who isn't good in that field of teaching. My child says that in most of his classes they get no instruction. He thinks if they could be given their assignments at the beginning of the day, they could finish them by 10 AM and go home. (He exaggerates but only a little)
• Superintendent gave 3 day notice on canceling in town bus rides, gave parents one reason - gave the newspaper another reason and Fox 7 News a 3 reason - all along there are 4-5 buses still at the bus yard.
• Parental involvement is discouraged in grades 5 and above No communication w/teachers Way too much time spent by teachers on discipline problems in class taking away from classroom teaching. This takes away from the kids that want to learn - all they have is classroom time Discipline problems, learning problems Special Ed, Minorities, Poverty all have plenty or special resources. All the others have only class time. Too much emphasis on TAAS!
• I would like the coaching staff ratio to students served looked into. • The use of outside maintenance is not working! It's a waste of
money • Use textbooks- Not expensive bought programs like Michael Eaton
math. • The use of portables for the students instead of a permanent admin.
Building being built on land owned by the school across from the baseball field is a waste of money.
• School system is 30 years behind the times - teachers are the bottom of the barrel and lack motivate skills themselves.
• I would like to start by saying that I have lived in the district quite a while and it is hard to get help when needed. Second is the biggest problem is at the beginning of the year they suspended in town busing. Parents learned this about 3 days before school started. It was suspended for children of all ages. When the superintendent was asked he gave three different answers. The school board was not much help either. Thanks.
• Smithville is a small school with a limited number of teachers. This last year my child was unable to take two courses because they were not offered at all (Physics) or, there was a conflict with another required course at the same time. This is frustrating.
Improper grammar is used by most students and some teachers - double negatives/improper pronoun usage - making a lasting impression on the students that is not overcome by any "teaching" of grammar. Rude behavior/taking back to teachers, students, substitutes and guests also exists. Smithville does a great job on it's athletic program. Any student willing to put forth effort is accepted as a teammate and strengthened in this program. Additionally, the teachers who have taught many years are in general, knowledgeable and dedicated teachers. A strong sense of community is also apparent.
• Too many teachers of the Basic "R's" are also coaches with poor teaching skills and/or different priorities. The well motivated students do well but the less motivated students are just passed over. Teacher make minimal or no attempt to coordinate learning and family. Even when family initiates the coordination it is difficult to get call backs or appointments that are mutually acceptable. Emphasis is not on academics - IE. Holidays are declared for excellence in sports or for attendance community "fairs" - But I have never known of a program of academic skill that has such a positive reinforcement. Our Education system at a K-12 level needs a lot of work. Perhaps we should look at some other countries which seem to have systems which do better than ours. (even states - we are still low on the ranking).
• I think we have good teachers for the low salaries that are offered. I feel we need new schools (particularly High School) instead of Portable Buildings which just depreciate in value. My children are embarrassed by the # of portables at the schools. I feel most members of the School board do an effective job very professionally.
• Please check into the program availability for special education students. We continually ask for a good reading program for learning disabled students and are told that none are available. One of our sons has made NO progress in the last 4 years in his basic reading skills. The school board says they do not deal with special education needs. The superintendent tells us he cannot be bothered with what goes on in a classroom. The principals say there is no funding. This school has a higher than avg. number of students in special Ed. Where is the money? Ask to see the actual program. Too many SISD students can not read.
• I am not happy with the SISD on the fact that they give so much homework. I would like to know what they do in class all day. Also, the safety of our children are at risk after school. (Grades K-3.) I pick my child up everyday and everyday after school the students are standing outside by themselves with NO adult around. During this time, children are getting into cars and leaving. The teachers don't even know their gone. It is very easy for anyone to
pick up a child and take them. I have seen children dismissed 5 minutes early and standing outside with NO adults around. Also, they expect the children to learn everything the first time. If the child doesn't understand they keep on going and send notes home for the parents to work with their child. I don't have a problem with doing this at home but at the same time the child should be learning at school. That is the teachers job. That is what is teacher is suppose to be there for, to teach. If I have to keep teaching him at home I may as well take him out of public school and home school him.
• SISD places too much emphasis on physical ed and sports. This is fine - but - what about the basic - reading, writing, and arithmetic. I'm a professional and have a lot of ex-students of SISD applying for positions. They cannot even complete a job application - spelling is terrib le. The teachers are rude and some to the point of being arrogant when parents try to talk to them. Hear people express daily the need for private church schools in the Smithville area. Parents should have a choice when a school district is operated like SISD is.
• I am a single man and work a lot, so I am not as knowledgeable about a lot of the questions as I would like to be. I do take my son to school, he takes the bus home. I can tell you that our schools are limited in the styles of teaching, the more advanced students suffer because of this. The only class we have for advanced students is gifted and talented. This is not working. We need above grade level classes as Spring ISD has. The higher level children are being held back. Please help!
• I think as far as conduct or discipline given towards students who are constantly going to this so called Boot-Camp, is not enough because of course you see them running, exercising, saluting our flag, or what not, well I really don't think that's hard enough punishment because be sometimes 2:00 p.m. I see them out in the streets. They should make them do some type of community work and keep them till later in the afternoon, like the way they like getting in trouble. I see them taking this as a joke. This is why they probably like going there.
• As you can tell - overall I have lost faith in this school system. • We are concerned about the use of portables for students. Why
isn't administration ever housed in portables? Why are classes being moved out of the red brick building that has nice classrooms, restrooms, and a teacher workroom - in order for admin. Offices to take over? It doesn't seem right or fair. Also, we need art and music to be taught at the primary level.
• I feel that SISD needs a great deal of improvement. We took our son out of this school and know of at least a dozen more kids who have chosen alternative forms of education. Our school system
seems more interested in building "monuments" than educating our students. It's a shame to pay thousands of dollars in school taxes and still have to pay someone else for alternative education. This school system worries more about whether a child is late to class, than whether the child learns anything once he gets there.
• The teachers spend to much time teaching the children how to pass the TAAS test and the children
• are not getting a good education. We need to teach the children correct and forget about this TAAS business.
• There are pros and cons to a small school district - the pros are that everyone knows your children. The disadvantage is that there are no special opportunities - funding is low - teacher par is poor. Minorities are not encouraged - college is not encouraged to anyone in this district! Parent organizations were just started within the last 2 years after 19 yrs of not having organizations. Because of the small town mentality, teachers and students are favored depending on what their name is or what their race is. No one looks at what is going on or does anything about the personnel problems.
• Our school is in desperate need of repairs. It also seems to be were building seas of portables and that is concerning to us. Our numbers (student wise) are going up and there are no future plans for new schools or even a new school to be built. We need help in that area.
• I think the Primary and Elementary schools are pretty good. I'm sure they could be improved. It would most likely require higher taxes which we would have to accept. I don't know much about the Jr and Hi School. I hope they are improving. I have heard complaints about college readiness, especially independent study skills. Thank you for asking for input.
• Teachers need to take courses to better educate the students. District needs to obtain teachers that meet higher standards in the courses that they are meant to teach. The faculty has to be more careful and responsible w/ documents such as TAAS because my daughter Patricia Rivera never received her results when she took it this year.
• Smithville ISD spends entirely too much time preparing for TAAS testing. Precious time is spent working with all classes on TAAS - when only some students need help. I suggest they take TAAS tests at the beginning of the semester, and then work with those students who don't pass, while other students go on. Also, it was my understanding that the lottery was to help fund public schools. Small school districts such as ours with small tax revenues continue to suffer. The library at the Smithville Junior High is terrible. The gifted program is very limited. My child had been in the program until the 7th grade. At the time they greatly reduced the
number of students they considered eligible for the program. He is not given the same opportunities as those few students who remain in the gifted program. Students are not challenged. They are bored. Teacher turnover is high. Football is the only sport given sufficient funding. There in only 1 art teacher, and many students are turned down for the art program every year.
• The district has yet to make teacher pay scale public. I have NEVER been contacted when any of my children have been absent from school (question #11). Thank you
• My kids ride a bus frequently. However we never know when or from which direction the bus will come. Most of the time it comes from the north in the mornings and from the south in the afternoons. But sometimes it comes from the opposite. The time of arrival varies as much as 25-30 minutes. And this bus picks up and drops off kids all over town even though there is a district policy that this is not to happen. Kids are dropped off just blocks from school while my kids are on the bus an hour and we are 3 miles from school.
• My younger child was recommended for speech therapy by her teacher in September. I requested screening and she was observed in October. Finally, after months of calling and leaving messages I got a call from the speech therapist telling me that she could not do a screening until the principal okayed it. I went to the school office several times before I finally got the principal to tell me that she had to have signed documents from me, which had never been sent. Documents were finally sent home with my child - not mailed, not handed to me while I was in the office. I sent all papers back immediately and one document was lost in the office for a week. The ARD was finally held April 3 and my child was in speech therapy two days later. (This child was in speech therapy form age 2-3 with the ECI-PRIDE program and was recommended for Head start and Pre-K but never got in even though we filled out all documents and were on the waiting lists for 2 yrs. Her older brother started speech therapy at age 3 and was in for 7 yrs.)
• Teachers and students alike seem to have a low moral at Smithville Schools. Communication with the public has stopped, no effort is made to include parents in a positive way, (only for discipline problems), and the employees are obviously unhappy. This school district needs a facelift beginning at the top.
• The bus lot for transportation is not up to date, pot holes, no shelter or bathroom's. Not a nice place for driver's to visit wash their bus or sit and eat together in comfortable conditions. Bastrop Transportation has all requirements for drivers and maintenance employees.
• I believe Brown Primary is an excellent campus! The elementary is too crowded, along with the Jr Hi! I'm all for a bond issue for new
facilities. We also must be competitive in teacher salaries. I'm conservative in that I want our tax dollars spent wisely, but I do want to see improvement. I don't agree with low bid procurement, as you often get what you pay for! We need improvement in overall performance. Many parents commute 1 hour to work for the opportunity to raise our children in a small community. I hope the trade-off is not a sacrifice in education.
• No. 69 - There is a need for stronger discipline in Jr. High. If you could send someone to review our system we would be grateful.
• I strongly wish I would have sent my two children to a private school in the area, but my husband and I believed in the public school system. If I had it to do all over again, they would be in a private or home school. My oldest daughter is a very talented musician and artist also in drama, but there is never enough money in these areas. I've bought all my children's instruments, but our income is limited also. My daughter usually doesn't win band competitions because other school districts provide quality instruments for band students.
• Need better people in the administration such as Supt., High School Principal, and get off the idea of a new high school.
• Most teachers are not teaching in Smithville High. The few good teachers leave because of the politics at this school. My child and others who have graduated stress that there are teachers who do not teach the curriculum and then tests are given over matter that has never been taught. Tests have no relationship to anything taught.
• Cafeteria food is a joke. Kids eat "gradu" provided by snack bar. Like tater tots w/ cheez whiz on top. Why can't the schools provide young growing kids with real food not processed garbage? These kids are starving! How can we let our kids live on cokes and cheez whiz 5 days a week and expect them to excel at school? Dogs are treated better. You reap what you sow - were're sowing junk.
• Cafeteria is overcrowded because it is shared by all Jr. High and High School. Anything edible is sold out by the time high school students are allowed to go to lunch.
• Bus service is not available this year to my child (apparently stemming from bridge issues). When it was available, I did not utilize it because it was unsafe - kids were standing in aisles because of overcrowding many times. The kids who did ride the bus were from rough neighborhoods and yelled, cussed, fought, on the bus. The bus driver yelled back at them ... not an idyllic setting for young minds! Smithville Schools are run by the good old boy clique - new ideas and forward thinking individuals are squeezed out. The few good teachers fight the system a couple of years and then leave. The school is left with no really good teachers.
• I feel that the school teaches solely TAAS and does not allow creativity and diversified education. I think they also need to work

over and over spelling. Many young adults cannot spell. I've always requested the teachers to insure a good quality education.
• It's great so far. Thanks. • In this community it's who you are and how much money that
speaks and benefits the best and most of the best!!! I'll be very happy when my child is out of this school once and for all. I am very dissatisfied with the High School.
• We live far from school building. It takes 1 hours to get to school. They catch the bus at 6:30 AM. My children have attended Smithville for 2 years. They both absolutely love it. The curriculum is far better than the last school.
• We have enjoyed living in Smithville. The children love their school and teachers . So far our experiences have been good here.
• Parent/Teacher (Booster Club) meetings are not at a time where working parents can participate. I used to be on the Site-Based Decision Making Team. It wasn't a "team" it was a "sounding board" for the principal who did whatever she decided, not what the team decided.
• Majority of Board of Trustees as well as Administration focus too much time on High School Bond Package which will never pass voters because it is not needed. - Should be addressed by building elementary buildings. Existing facilities are NOT properly maintained.
• Discipline is the reason for poor ed. performance. Teachers can't teach because of the disruptive students. Principals don't seem to be effective disciplinarians. We could benefit from ability grouping on accelerated courses for all levels of children - K-12. Existing facilities can be expanded; no need for building until current facilities are used. Money management seems to be improving w/current admin. I didn't receive this survey until April 27th!
• More effort needs to be made at preparing high school students for college, especially math and science. Gifted students need more opportunities. Facilities are crowded.
• Overall, I feel that our school district does not meet the needs of our children. We have children already in portables moving up to the elementary grades going straight into portables. The reason for portables - because our Admin needs the office space. Mind you that these portables are NOT equipped with restrooms. Teachers come and go. Good ones don't stay because of the pay, lack of support from Admin and community. We have the highest tax in Texas and where is the money going? SISD did away with in town busing because it wasn't feasible. Substitute teaching is not competitive either. We don't keep the good subs. Even sadder note - substitutes get paid more than the aides in our district. Many of the aides either have a degree from college or they are working on
one. What a slap in the face when they do just about the same amount of work as do their teachers!
• I think they study to much on TAAS and don't teach enough English, math, science. My oldest daughter is in the 10th grade this year and in English II she had done two reports not long ones and I feel she is not ready enough for college. But she has pass all her TAAS and I think teachers think that what important then seeing what the kids know. And when you have a conference that all they talk about is TAAS.
• This district is bad in that due to lack of funds they always have to use teachers that are not certified in the fields that they are teaching so the students are not receiving the proper instruction. Also we have teachers that leave the classroom and students alone. We had one teacher that would leave her students alone, she was constantly in the office. She was not teaching in the classroom. But the district would not fire her. I feel they just didn't care because she taught "Special Ed" kids. Districts should not have to pay teachers' salaries if the teacher is not doing her job. It is heart breaking to see students waste the whole year and learn nothing. Smithville has too many teachers that just make packets of worksheets and have the students do them without even teaching the material first. The kids don't know how to do the assignments. We also have teachers that don't give reviews before the finals, then the students fail. All of this is setting our students up for failure that's why there are so many drop-outs who become dysfunctional citizens.
• Smithville provides the barest minimum of the requirements. They provide only what will just get them by without TEA intervention. I as a parent supplement the schools' instruction with a computer w/ internet access at home along with a tutor 2 times a week to verify understanding and clarify any difficulties with the work my child may have. This is an EXPENSE I should NOT have to provide for, if the district was doing their job properly.
• More parent involvement • Cleaner facilities • More college bound courses • Smithville ISD has made improvements in the last year. We are
striving to close all gaps and to make our schools better. • In reference to the security section - these doors are always open
for ease of entrance for staff; however, the street and sidewalk off the street are less than 15 paces away and anyone could easily take control of the entire building. Teachers are in class and would not even be aware of entrance of an intruder. Locking these doors may not be convenient but keeping them unlocked is totally unsafe - $ needs to be allocated to fence in this area! - I would gladly donate to this safety cause.
• School Board makes agreements to secure land in wet flood area and pays owner $10K escrow that is non-refundable - not very fiscally conservative - there are other tracts of land for the district to explore -
• As a rule, I feel discipline is lacking and favor is given to select groups. Whether it is because of fear or the way laws are written it leaves the students unsure and unruly and the teachers frustrated. Also, get rid of "movements" and put money into "fine arts".
• I feel that the special ed and at-risk kids needs are being met and addressed in relation to a real life setting in the world of work.
• The amount of interest based clubs and extra curricular activities (ie. Science Club) is low due to funding.
• I am overall happy w/the school district - however my 3 children are not receiving the quality of education as in the previous school district. I am very unhappy w/ the staff (ie. Teachers, librarian and definitely the cafeteria help)
• When I taught college no teacher had a classroom they had a small closet called an office. It appears to me that the same concept would free up a lot of classrooms in Junior High and High School. I used to sub quite a bit and there was always a lot of classrooms not in use, the teachers didn't stay in there unless they had a class.
• I have a five year old daughter that attends Brown Primary that has to walk almost 2 miles to school because she can not ride the bus due to the fact that we live within the city limits. If my house was located one block over, we would be out of the city limits. I had to miss at least 10 or more days of work due to bad weather, in order to take my daughter to school to keep her from walking. Is there anyway you can help me with this problem? If so, please let me know at Shanlandra Smith 1606 Old Lake Rd. Smithville, TX 78957
• I do feel that the teachers are doing a great job, yet my concern is with the kids having NO transportation to get to school.
• The public was not told that there would not be in town bus service until apprx 2-3 weeks before school started (8-1999). I work 12 hour shifts and on days that I work I have such a hard time getting my kids to school. PLEASE HELP!!!
• School district tries hard, but teacher quality is variable. Solution: fewer teachers at higher salary with larger classes and more discipline. Also, parent involvement is very poor. Parents often treat schools as free day care. Also don't need bus service. Just spend money on education and cut down on non-education things.
• We feel like the state needs to come in and take control over many areas of the school district.
• Special Education is very poor. The administration you have to fight for every little thing that the student needs. It has taken 4 years for this district to meet and comply w/ our special needs
teenage daughter. No adaptive PE. No transition out of high school.
• The overall situation is good, with the problem of not enough books to go round. Safety on the buses should be monitored better - both students and driver.
• Smithville ISD needs to overhaul its food service program. They barely meet the needs of the children. On TAAS days when your children are to eat a healthy breakfast, they chose doughnuts. No protein at all. I believe they should have been fired for that one. That is just one example of how bad it really is.
• I believe the school district is trying to make a in a positive way. The cafeteria need a lot of help. Most children eat what is available because that is all that they know. We need more home cooked meals and less fast food type meals. The meat they put in chili is not good. Everything is prepackage food. Most of the time breakfast has no protein. The amount of food for the money you pay is unreasonable. The workers in line are rude to everyone. Overall the cafeteria is the worst thing about the school district.
• Major concern is with the bus service and safety of the school. • I think our district employees need to be more professional and
should be there for all of the students, not just their own or their friends. When a parent requests that student info be kept confidential and have followed the procedure for such, I feel that request should be honored (this has been violated 3 times in 2 years). I feel the budget for sports (particularly football) is way out of line and all sports or UIL activities - whether male or female - should be treated the same (ex. Paying for meals/providing equipment). I also feel classtime should be used for teaching and not babysitting. Many times my children (high school andjr high) have said they watched movies during class - most always have had nothing to do w/ subject matter being taught. No wonder our students are falling behind! I have had to address administration so many times that I am now considered a "problem" parent. My experiences w/ this district over the last 3-4 years have not been favorable. When designated times have been set for registration, school personnel have been several hours late. Also teachers are usually late in sending out notices re: trips/competitions/etc. and many times it is the same week of the activity that we get notice. Twice this year we have had to rearrange Sat. activities because we were not aware of a trip until the Mon. before - one of these we had plans to go out of state.
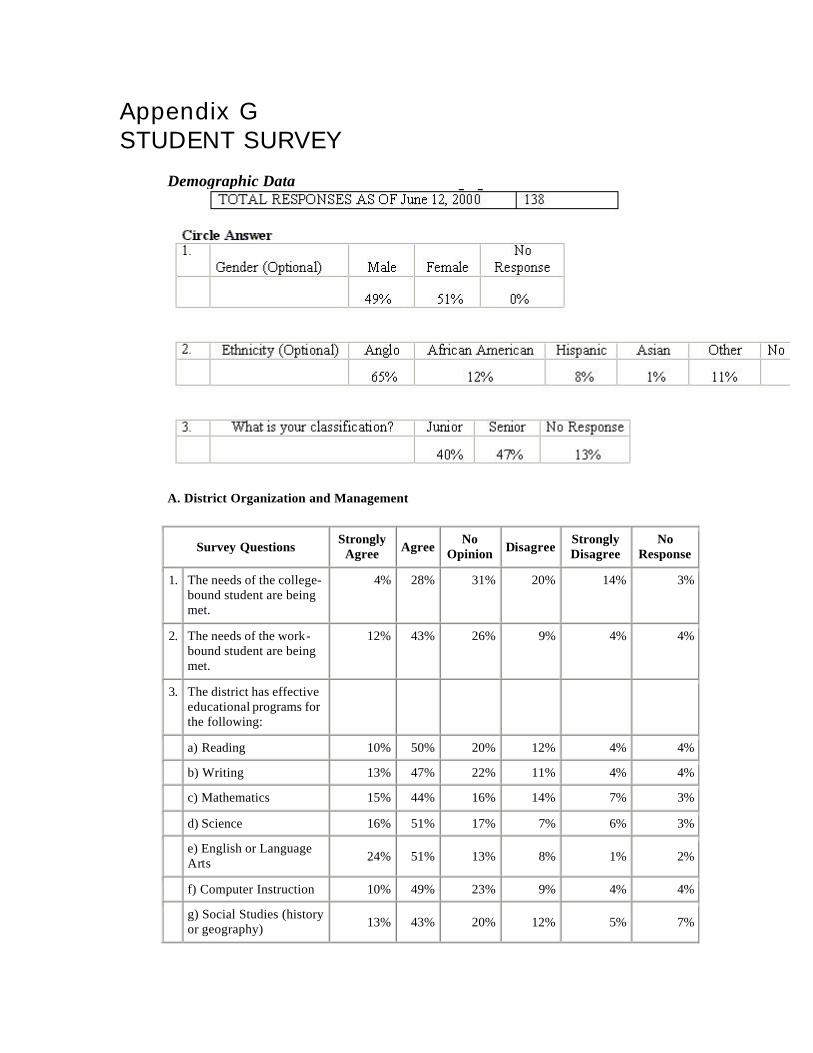
Appendix G
STUDENT SURVEY
Demographic Data
A. District Organization and Management
Survey Questions Strongly
Agree Agree No
Opinion Disagree Strongly Disagree
No Response
1. The needs of the college-bound student are being met.
4% 28% 31% 20% 14% 3%
2. The needs of the work-bound student are being met.
12% 43% 26% 9% 4% 4%
3. The district has effective educational programs for the following:
a) Reading 10% 50% 20% 12% 4% 4%
b) Writing 13% 47% 22% 11% 4% 4%
c) Mathematics 15% 44% 16% 14% 7% 3%
d) Science 16% 51% 17% 7% 6% 3%
e) English or Language Arts 24% 51% 13% 8% 1% 2%
f) Computer Instruction 10% 49% 23% 9% 4% 4%
g) Social Studies (history or geography) 13% 43% 20% 12% 5% 7%
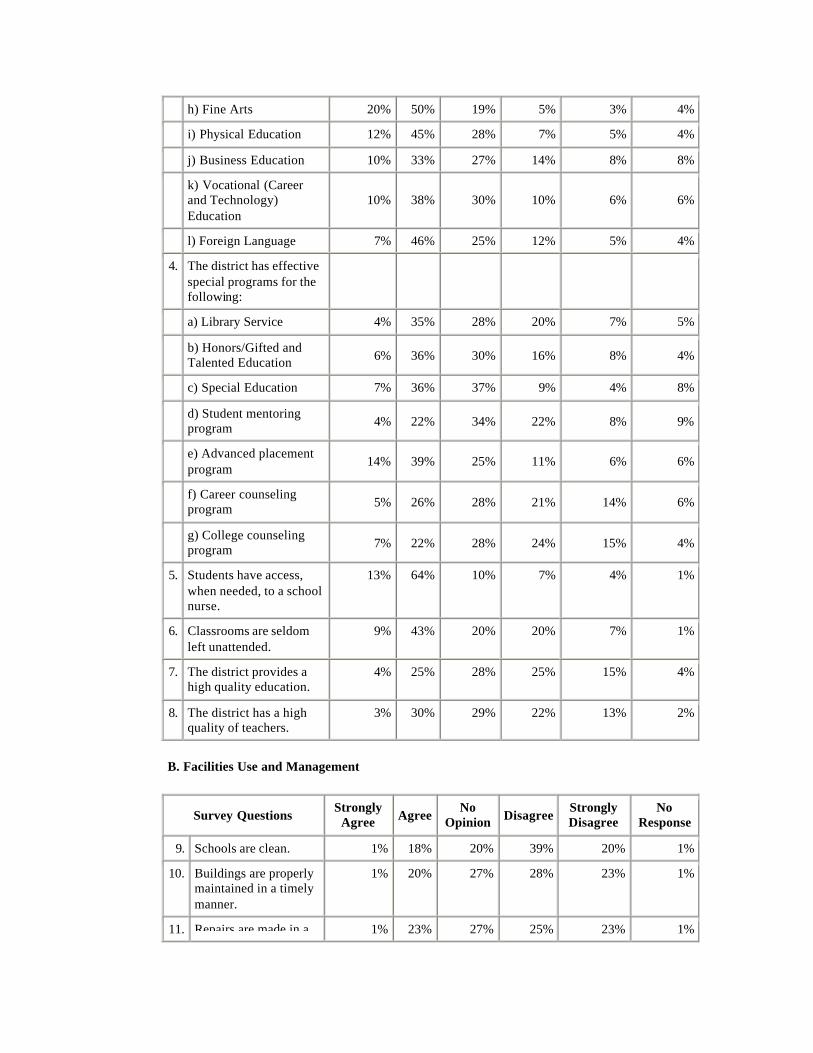
h) Fine Arts 20% 50% 19% 5% 3% 4%
i) Physical Education 12% 45% 28% 7% 5% 4%
j) Business Education 10% 33% 27% 14% 8% 8%
k) Vocational (Career and Technology) Education
10% 38% 30% 10% 6% 6%
l) Foreign Language 7% 46% 25% 12% 5% 4%
4. The district has effective special programs for the following:
a) Library Service 4% 35% 28% 20% 7% 5%
b) Honors/Gifted and Talented Education 6% 36% 30% 16% 8% 4%
c) Special Education 7% 36% 37% 9% 4% 8%
d) Student mentoring program 4% 22% 34% 22% 8% 9%
e) Advanced placement program
14% 39% 25% 11% 6% 6%
f) Career counseling program 5% 26% 28% 21% 14% 6%
g) College counseling program 7% 22% 28% 24% 15% 4%
5. Students have access, when needed, to a school nurse.
13% 64% 10% 7% 4% 1%
6. Classrooms are seldom left unattended.
9% 43% 20% 20% 7% 1%
7. The district provides a high quality education.
4% 25% 28% 25% 15% 4%
8. The district has a high quality of teachers.
3% 30% 29% 22% 13% 2%
B. Facilities Use and Management
Survey Questions Strongly
Agree Agree No
Opinion Disagree Strongly Disagree
No Response
9. Schools are clean. 1% 18% 20% 39% 20% 1%
10. Buildings are properly maintained in a timely manner.
1% 20% 27% 28% 23% 1%
11. Repairs are made in a 1% 23% 27% 25% 23% 1%
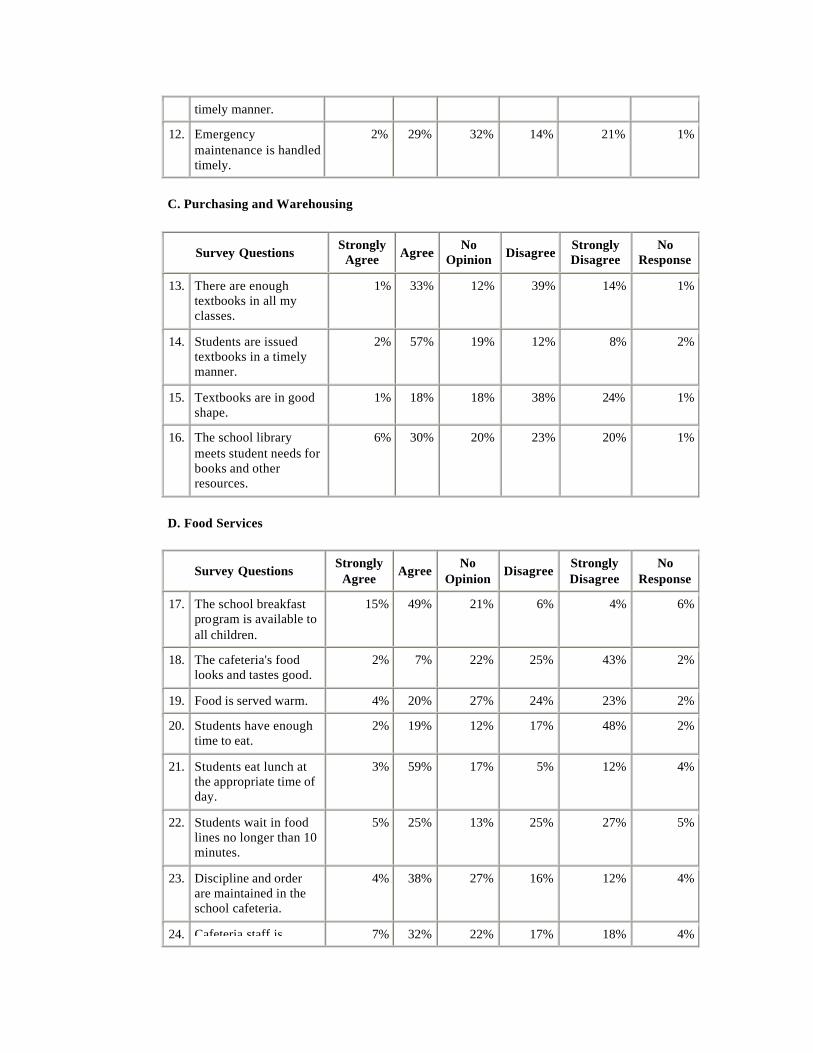
timely manner.
12. Emergency maintenance is handled timely.
2% 29% 32% 14% 21% 1%
C. Purchasing and Warehousing
Survey Questions Strongly
Agree Agree No
Opinion Disagree Strongly Disagree
No Response
13. There are enough textbooks in all my classes.
1% 33% 12% 39% 14% 1%
14. Students are issued textbooks in a timely manner.
2% 57% 19% 12% 8% 2%
15. Textbooks are in good shape.
1% 18% 18% 38% 24% 1%
16. The school library meets student needs for books and other resources.
6% 30% 20% 23% 20% 1%
D. Food Services
Survey Questions Strongly
Agree Agree
No Opinion
Disagree Strongly Disagree
No Response
17. The school breakfast program is available to all children.
15% 49% 21% 6% 4% 6%
18. The cafeteria's food looks and tastes good.
2% 7% 22% 25% 43% 2%
19. Food is served warm. 4% 20% 27% 24% 23% 2%
20. Students have enough time to eat.
2% 19% 12% 17% 48% 2%
21. Students eat lunch at the appropriate time of day.
3% 59% 17% 5% 12% 4%
22. Students wait in food lines no longer than 10 minutes.
5% 25% 13% 25% 27% 5%
23. Discipline and order are maintained in the school cafeteria.
4% 38% 27% 16% 12% 4%
24. Cafeteria staff is 7% 32% 22% 17% 18% 4%
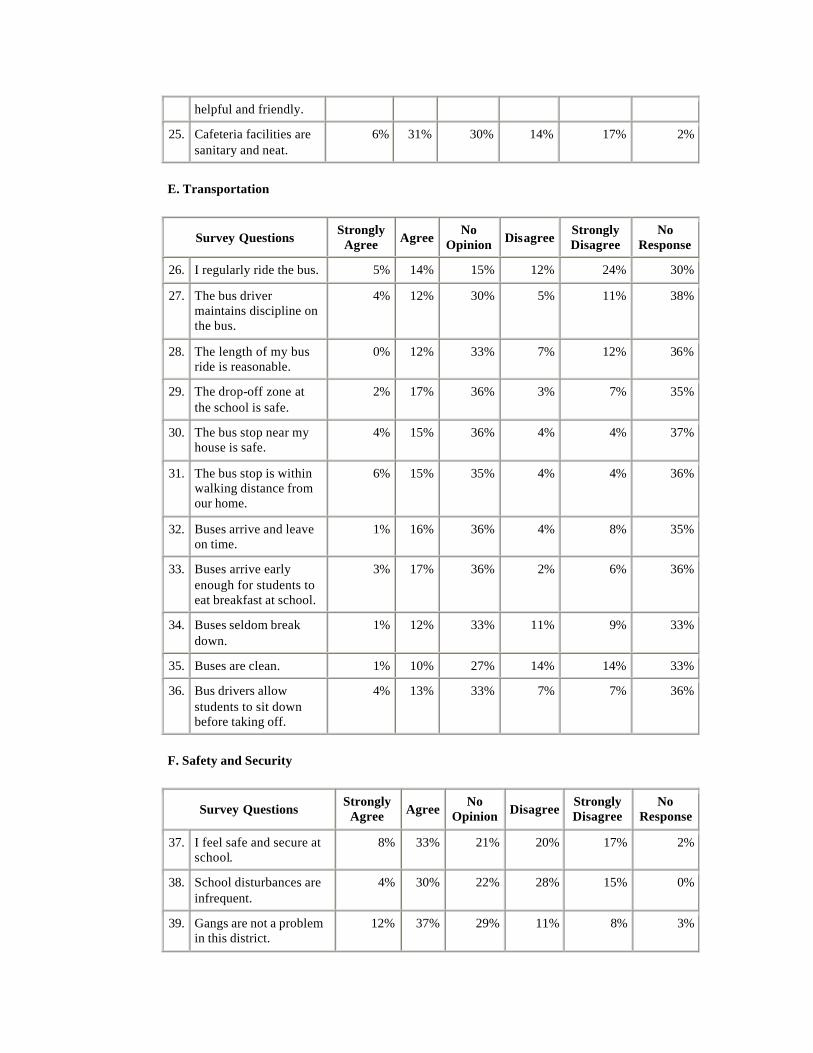
helpful and friendly.
25. Cafeteria facilities are sanitary and neat.
6% 31% 30% 14% 17% 2%
E. Transportation
Survey Questions Strongly
Agree Agree No
Opinion Disagree Strongly Disagree
No Response
26. I regularly ride the bus. 5% 14% 15% 12% 24% 30%
27. The bus driver maintains discipline on the bus.
4% 12% 30% 5% 11% 38%
28. The length of my bus ride is reasonable.
0% 12% 33% 7% 12% 36%
29. The drop-off zone at the school is safe.
2% 17% 36% 3% 7% 35%
30. The bus stop near my house is safe.
4% 15% 36% 4% 4% 37%
31. The bus stop is within walking distance from our home.
6% 15% 35% 4% 4% 36%
32. Buses arrive and leave on time.
1% 16% 36% 4% 8% 35%
33. Buses arrive early enough for students to eat breakfast at school.
3% 17% 36% 2% 6% 36%
34. Buses seldom break down.
1% 12% 33% 11% 9% 33%
35. Buses are clean. 1% 10% 27% 14% 14% 33%
36. Bus drivers allow students to sit down before taking off.
4% 13% 33% 7% 7% 36%
F. Safety and Security
Survey Questions Strongly
Agree Agree No
Opinion Disagree Strongly Disagree
No Response
37. I feel safe and secure at school.
8% 33% 21% 20% 17% 2%
38. School disturbances are infrequent.
4% 30% 22% 28% 15% 0%
39. Gangs are not a problem in this district.
12% 37% 29% 11% 8% 3%
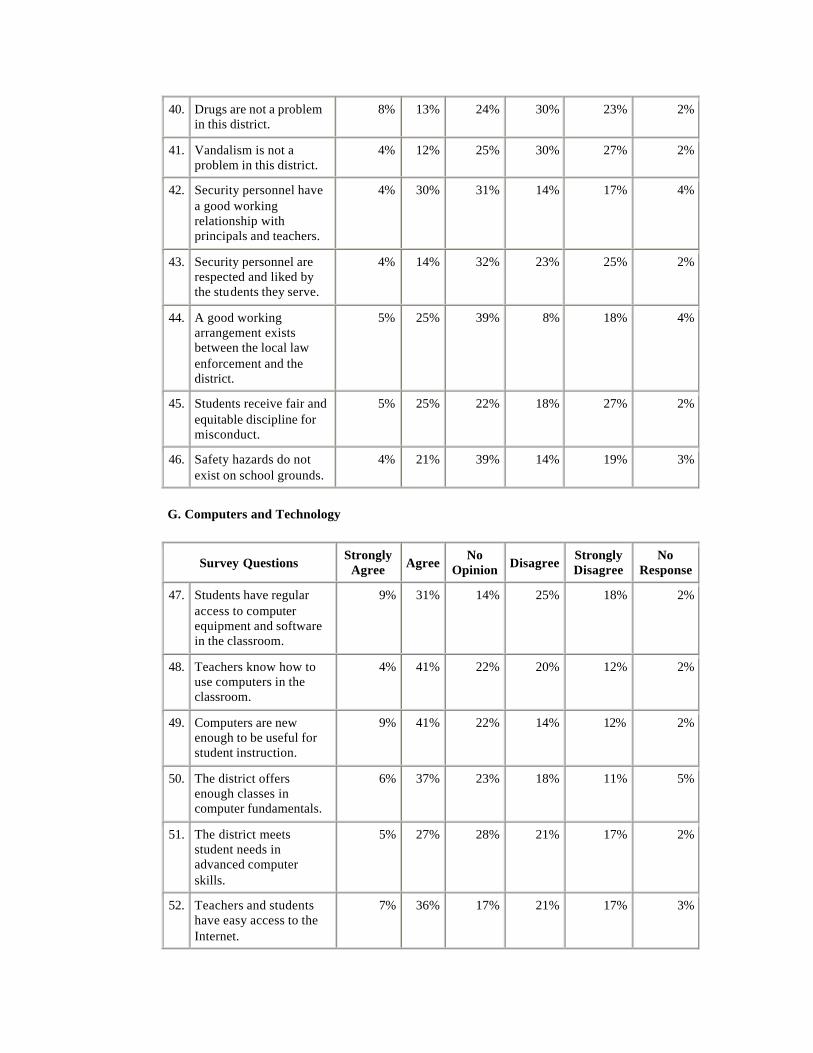
40. Drugs are not a problem in this district.
8% 13% 24% 30% 23% 2%
41. Vandalism is not a problem in this district.
4% 12% 25% 30% 27% 2%
42. Security personnel have a good working relationship with principals and teachers.
4% 30% 31% 14% 17% 4%
43. Security personnel are respected and liked by the students they serve.
4% 14% 32% 23% 25% 2%
44. A good working arrangement exists between the local law enforcement and the district.
5% 25% 39% 8% 18% 4%
45. Students receive fair and equitable discipline for misconduct.
5% 25% 22% 18% 27% 2%
46. Safety hazards do not exist on school grounds.
4% 21% 39% 14% 19% 3%
G. Computers and Technology
Survey Questions Strongly
Agree Agree No
Opinion Disagree Strongly Disagree
No Response
47. Students have regular access to computer equipment and software in the classroom.
9% 31% 14% 25% 18% 2%
48. Teachers know how to use computers in the classroom.
4% 41% 22% 20% 12% 2%
49. Computers are new enough to be useful for student instruction.
9% 41% 22% 14% 12% 2%
50. The district offers enough classes in computer fundamentals.
6% 37% 23% 18% 11% 5%
51. The district meets student needs in advanced computer skills.
5% 27% 28% 21% 17% 2%
52. Teachers and students have easy access to the Internet.
7% 36% 17% 21% 17% 3%
Student Survey Verbatim Comments
• I think some teacher don't know how to teach. We need open-campus for seniors, need better bug and pest control.
• I have not had a very good year here and I am not impressed with the organization of the school system. Things are always changing and no one is informed.
• This district need to make the High School Building Bigger Really BAD
• They are letting me graduate so I guess I can't say to much bad about them.
• Our school is not properly funded or the money is going to the wrong things. Library computers don't work, teachers always need paper, books are falling apart, as are lockers, busses break down quit often and they are very dirty. The bathrooms stink like urine and the floors are sticky from the urine. (The bathrooms are really bad).
• NEED A NEW SCHOOL!!! • This school is a waste of time for every student in here because the
teachers can't teach and we don't learn anything • They need to let the children decide on what takes place in school. • Smithville's educational performance could be better if some
teachers don't think that giving USA education is a joke. • make food better • Our school isn't big enough. We also need a soccer and hockey
team! • The firewall on the internet is horrible. We need new computers
half of them don't work. • There are several areas in our school that need to be fixed or
helped. But most departments are satisfactory. • I think there should be more room in buildings (get rid of annex)
by finally adding onto the high school. I think there should be less punishment for petty misconduct and more emphasis on the more harsh actions. A lot of students get treated differently by getting away with more or less-The computer labs are ok, but the stupidest stuff is blocked by surfwatch. You can still get into pornographic sites, but not into hotmail? The school needs to be more level all around Oh! And, being a junior I have not once been called into the counselor's to talk about my future plans. (and neither have most upper-classmen I've talked to) We definitely need more guidance through these things, especially college/job/(vocational) prep.
• I feel that discipline and security is a major problem here at Smithville High School. I also feel teachers and law officials do not work together to make this situation over.
• I believe that the focus has been shifted to TAAS Performance and only TAAS Performance. I think it would be better if we maintained focus on what the students actually retain for life by making the curriculum more user friendly. A more hands on learning system is better! "I hear it and I remember, I see it I learn, I do it I understand!" That should be our focus and the test performance would come along with it. I have participated in UIL and studied school systems extensively and I believe this would be the best course of action, although I claim to be no expert.
• Our school needs money! We do not have a regulation Track, the boys athletic field house is falling apart and are computers are so slow and out dated. Austin spends so much money on their schools who don't they send some over here. Pay more attention to boys athletics in Smithville help our school, please!
• Smithville is a great school. It does have problem but what school doesn't? The problem that needs to be addressed immediately is the lack of space at the High School New High School. ASAP!
• This school needs lots of improvement • I believe that there are a good number of teachers that are
compassionate, intelligent, and helpful, but we do have our problems. Our cafeteria staff is good. Our bus routes tend to last long. Our new custodial staff has not improved our school. They have caused it to become dirty and I believe they need to be replaced. Thank you for your consideration.
• It's ok. • I have got a good education in Smithville High School. • This is dumb, you don't listen to our opinions, anyhow. Our school
has many positive aspects but also LOTS of negative! • Our opinions don't matter, they don't care what we think! • Smithville has so many problems. The cafeteria is always dirty.
The school officer (police) is not respected and treats no one fair. Student trying to go to college don't get any help. I'm in the top 20% and my counselor barely knows my name. The administration doesn't have any clue what the real needs of our school are. All our principle worries about is trash on the ground. There were kids smoking weed on the bus and nothing was done.
• Personally my opinion of this school's facilities for college students have been negative. I have found that the counselor has been little help. If not for my English teacher I'd never have help. Also I find that the school losing my sat scores and AP Test results and myself having to get the copies to the school in order just to have an complete transcript for college. Here it is 8 day till graduation and I still don't have one.
• In recent years, this district's administration seemed determined to keep students from getting an education. With a new administration, our district is still not where it wants to be, but it's
getting there and progression is fast. I feel certain that any funding this district is given will be used properly.
• I don't feel that the advanced classes offered are as strong as they should be, and our discipline system is satisfactory, but there is often special treatment to some students.
• I'm glad it's over for me. • I wish that the Superintendent wouldn't take away internet
privileges. • SISD is pretty worthless. • The cafeteria food is very sorry to have round piece's of bone in
my food and there is way too many people in the cafeteria. I think it needs to be open campus.
• We need more time for lunch, open campus. don't worry about the dress code. Don't worry about face hair. I would like to have more time between class get out at 3:10
• The education here may not be the best, but it is getting better. The teachers that know and like what they teach are great and I actually learn things in those classes. Also when they fully explain and make sure we all understand before moving on, it helps greatly.
• I believe that we should get open campus or @ least seniors should it would lighten the cafeteria load. But if someone abuses that privilege they should have the privileges taken away.
• I really feel that there needs to be a closer eye on vandalism b/c my seeing glasses were stolen and that's just plane out wrong and disrespectful
• I think the lunch time is not that good. I think we should have more time! Also I think senior's should have more privileges at lunch! I think we should be able to have off campus lunch, just senior's. It would make more time and less room in the cafeteria! Also it shouldn't be signing out with parents, we should be able to leave for lunch b/c we are seniors and signing out but without are parents having to call up and tell you. It should be a privilege.
• The internet should be easy to surf on but surf watch is too restrictive. The teachers are rude and the campus cops are being fair. Every teacher plays favorites. The campus cop plays favorites.
• I don't like it Because when I was little It was hard for me to learn to Read because I had a problem but the school didn't help now I hate to Read.
• The athletics is great! Agriculture class are great too! • This school is pathetic. The teachers are bad and sometimes I
believe the students know more than the teachers. • Smithville is a good school that needs much help about teaching
and so on. The cafeteria is also a big nasty problem. • First of meny that I don't have the space for but off campus lunch
students have to have some kind of freedom. 2nd Saturday school Yes, but should not be assigned for every little problem. 3rd make
the classes equal in length with the way your schedule goes you don't go to 1st period but 2 times in a week sometimes.
• Well first of all open campus should be given to all upper classman. Money shouldn't be all spent on the Lady Tigers!
• I feel that we should have longer and better lunches. I also feel that senior's should have the privilege to leave for lunch (without sign out or parents permission)
• I think the teachers here don't stay long enough, these here late leave at lunch and leave when the bell rings in a cloud of dust. And for the ones that stay, were locked out so you can forget lunch time tutoring.
• I wish we had more help on applying for college and given knowledge about. I have no idea when to begin. I can't get any help from the school.
• We have two computer labs but yet when you have free time and would like to type out your work, the computer teacher wont let you. There will be 15 computers open and she won't let you on.
• I feel my educational needs have been meet. There could have been more options or a variety of classes to choose from over the years but other than that, my time in the Smithville school system has be great and changed by life.
• I think the staff and School Board should care more about if the students are learning. They focus so much on the TAAS when you move up or Graduate you don't really learn anything other than TAAS.
• Stop wasting time on people who have a lot of trades, and give them eight hours of Saturday school.
• Smithville ISD as some major problems no doubt. • I believe that school should be more fun. And not have to worry
about if someone is going to come in and change things.