s.larssen: eionet-ws-may-01.ppt slide 1 euroairnet *goal-european network with sufficient spatial...
TRANSCRIPT
S.Larssen: EIONET-WS-May-01.ppt Slide 1
EUROAIRNET
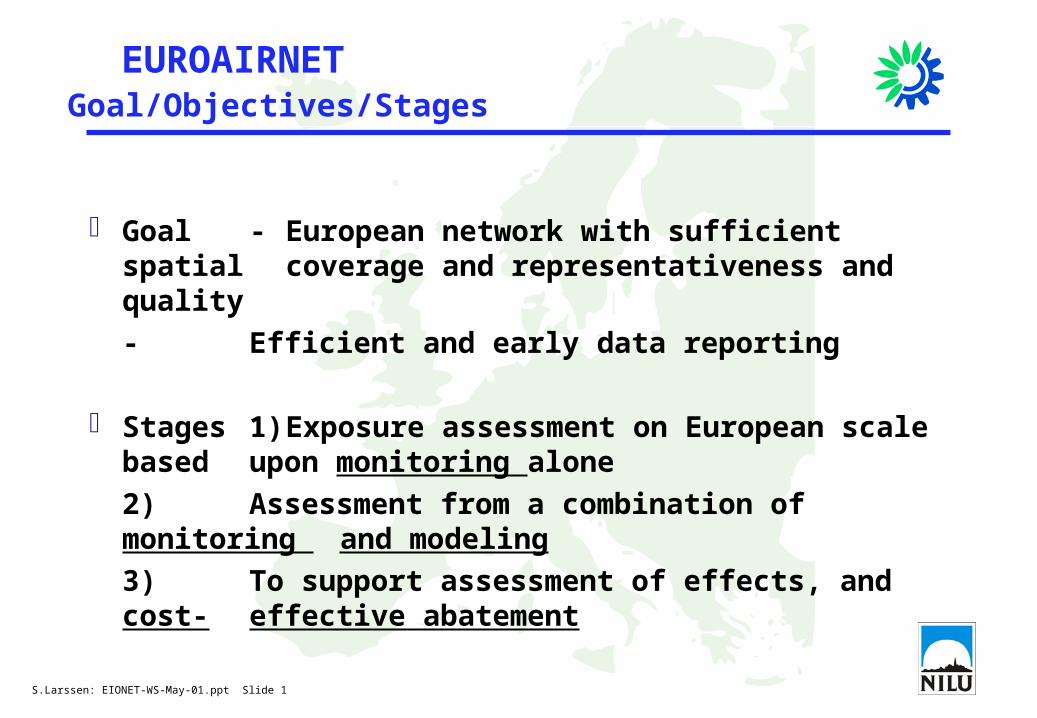
Goal - European network with sufficient spatial coverage and representativeness and quality
- Efficient and early data reporting
Stages 1) Exposure assessment on European scale based upon monitoring alone
2) Assessment from a combination of monitoring and modeling
3) To support assessment of effects, and cost-effective abatement
Goal/Objectives/Stages
S.Larssen: EIONET-WS-May-01.ppt Slide 2
EUROAIRNETGoal/Objectives/Stages
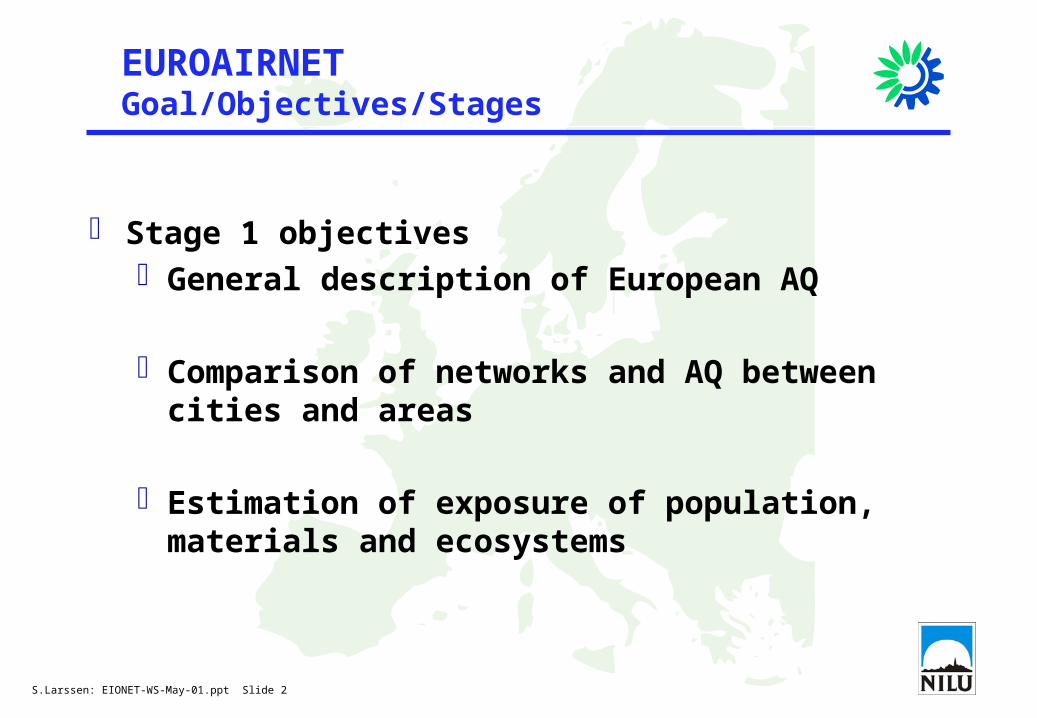
Stage 1 objectives General description of European AQ
Comparison of networks and AQ between cities and areas
Estimation of exposure of population, materials and ecosystems
S.Larssen: EIONET-WS-May-01.ppt Slide 3
EUROAIRNETDevelopment and Implementation 1996 - 2001
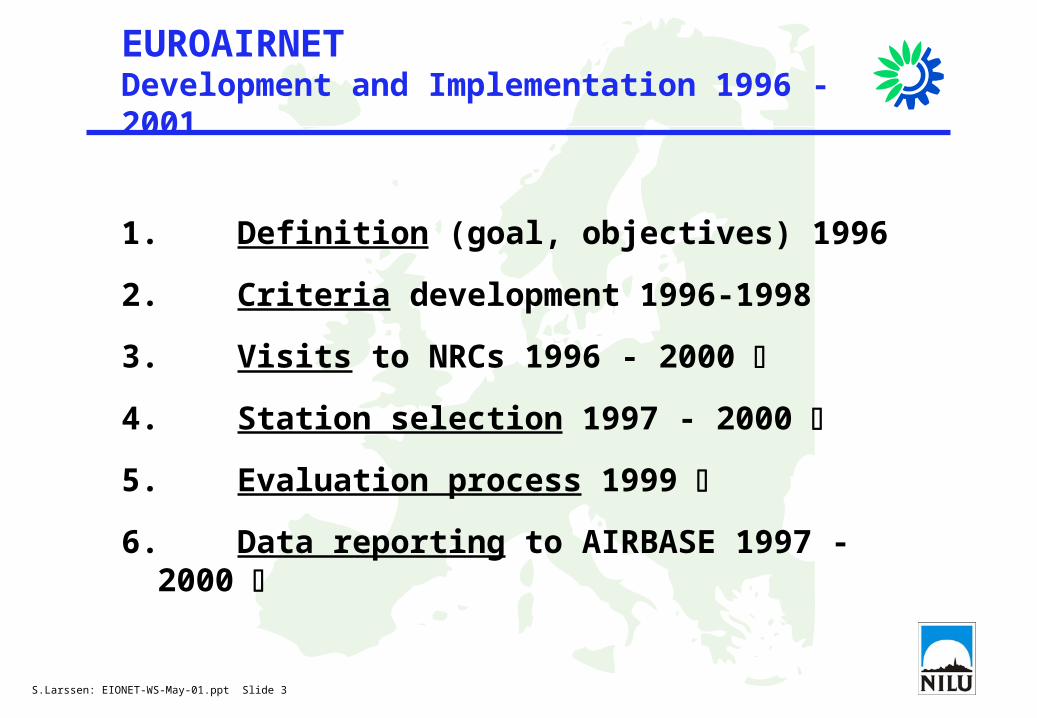
1. Definition (goal, objectives) 1996
2. Criteria development 1996-1998
3. Visits to NRCs 1996 - 2000
4. Station selection 1997 - 2000
5. Evaluation process 1999
6. Data reporting to AIRBASE 1997 - 2000
S.Larssen: EIONET-WS-May-01.ppt Slide 4
Criteria for design of EUROAIRNET
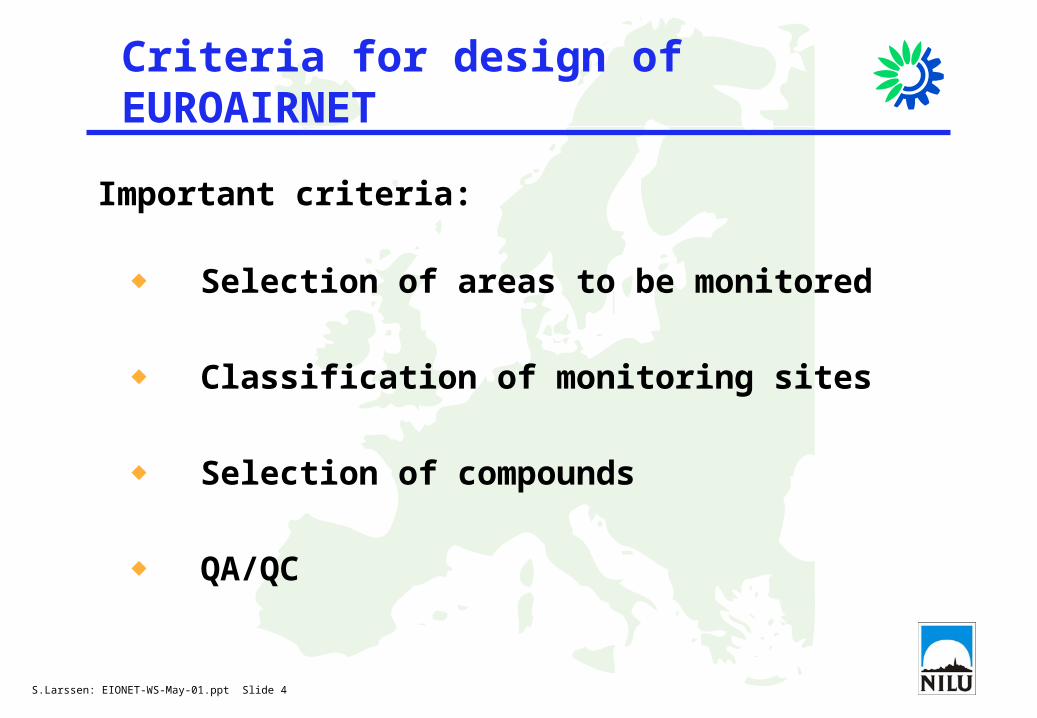
Important criteria:
Selection of areas to be monitored
Classification of monitoring sites
Selection of compounds
QA/QC
S.Larssen: EIONET-WS-May-01.ppt Slide 5
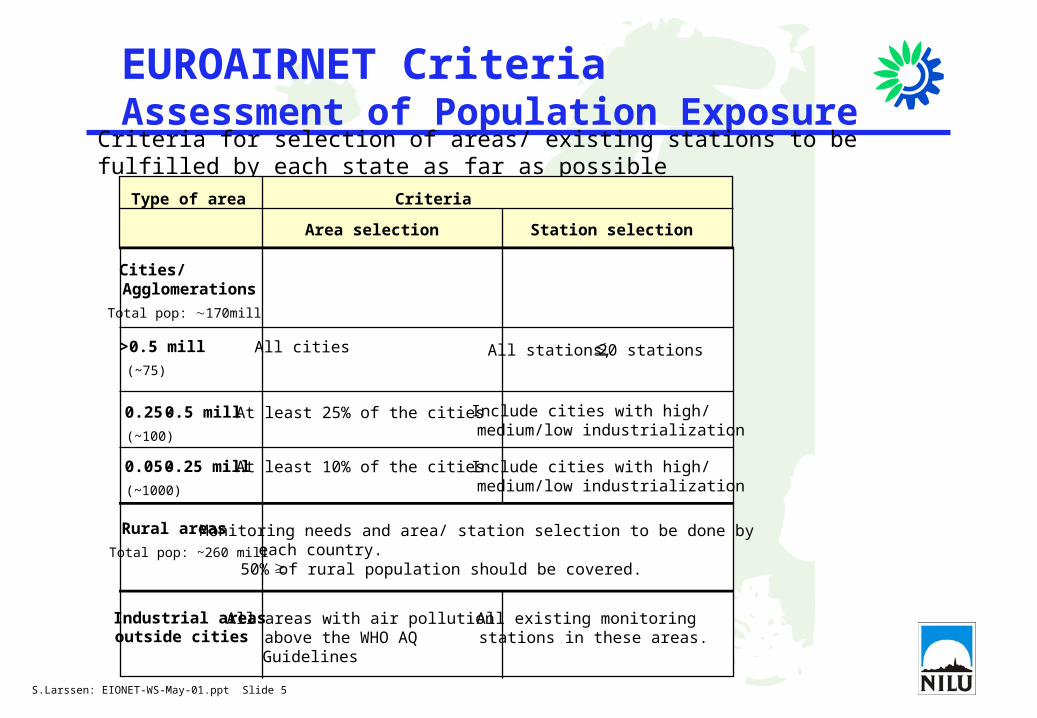
EUROAIRNET CriteriaAssessment of Population Exposure
Criteria for selection of areas/ existing stations to be fulfilled by each state as far as possible
Type of area Criteria
Area selection Station selection
Cities/Agglomerations
Total pop: 170mill
>0.5 mill
(~75)
All cities
0.25 - 0.5 mill
(~100)
At least 25% of the cities
0.05 - 0.25 mill
(~1000)
At least 10% of the cities
Rural areas
Total pop: ~260 mill
Industrial areasoutside cities
All areas with air pollution above the WHO AQ Guidelines
All existing monitoring stations in these areas.
All stations, 20 stations
Include cities with high/ medium/low industrialization
Monitoring needs and area/ station selection to be done by each country.50% of rural population should be covered.
Include cities with high/ medium/low industrialization
S.Larssen: EIONET-WS-May-01.ppt Slide 6
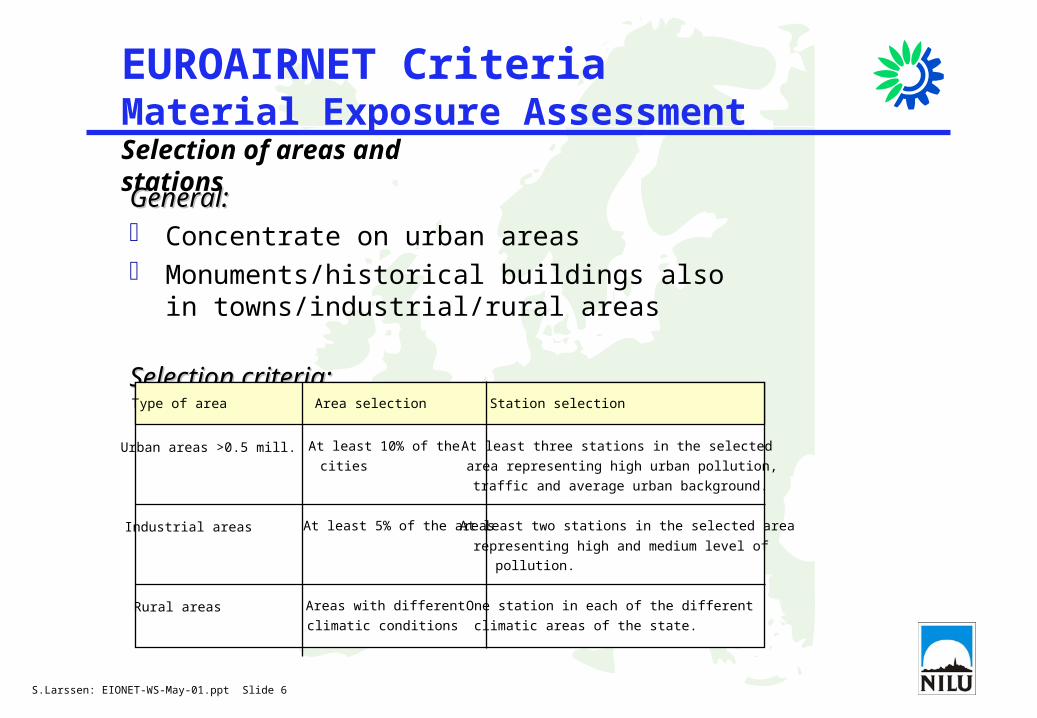
EUROAIRNET CriteriaMaterial Exposure AssessmentSelection of areas and stations
General:General: Concentrate on urban areas Monuments/historical buildings also in
towns/industrial/rural areas
Selection criteria:Selection criteria:Type of area Area selection Station selection
Urban areas >0.5 mill. At least 10% of the
cities
At least three stations in the selected
area representing high urban pollution,
traffic and average urban background.
Industrial areas At least 5% of the areas At least two stations in the selected area
representing high and medium level of
pollution.
Rural areas Areas with different
climatic conditions
One station in each of the different
climatic areas of the state.
S.Larssen: EIONET-WS-May-01.ppt Slide 7
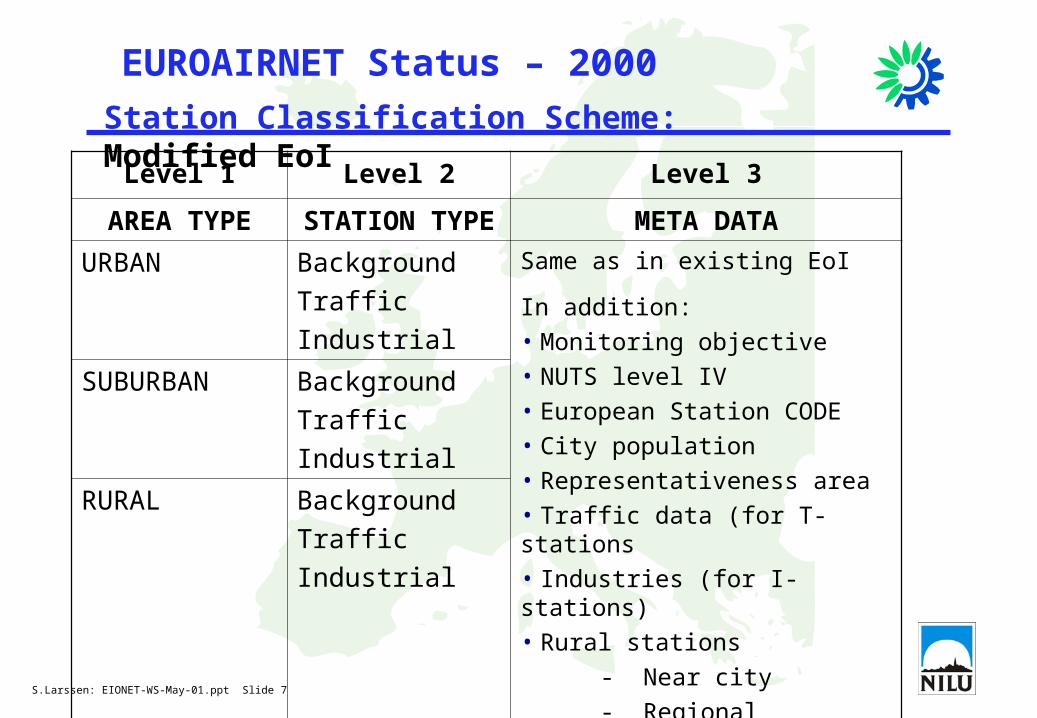
EUROAIRNET Status – 2000
Station Classification Scheme: Modified EoI
Level 1 Level 2 Level 3
AREA TYPE STATION TYPE META DATA
URBAN Background
Traffic
Industrial
Same as in existing EoI
In addition:
• Monitoring objective
• NUTS level IV
• European Station CODE
• City population
• Representativeness area
• Traffic data (for T-stations
• Industries (for I-stations)
• Rural stations
- Near city
- Regional
- Remote
SUBURBAN Background
Traffic
Industrial
RURAL Background
Traffic
Industrial
S.Larssen: EIONET-WS-May-01.ppt Slide 8
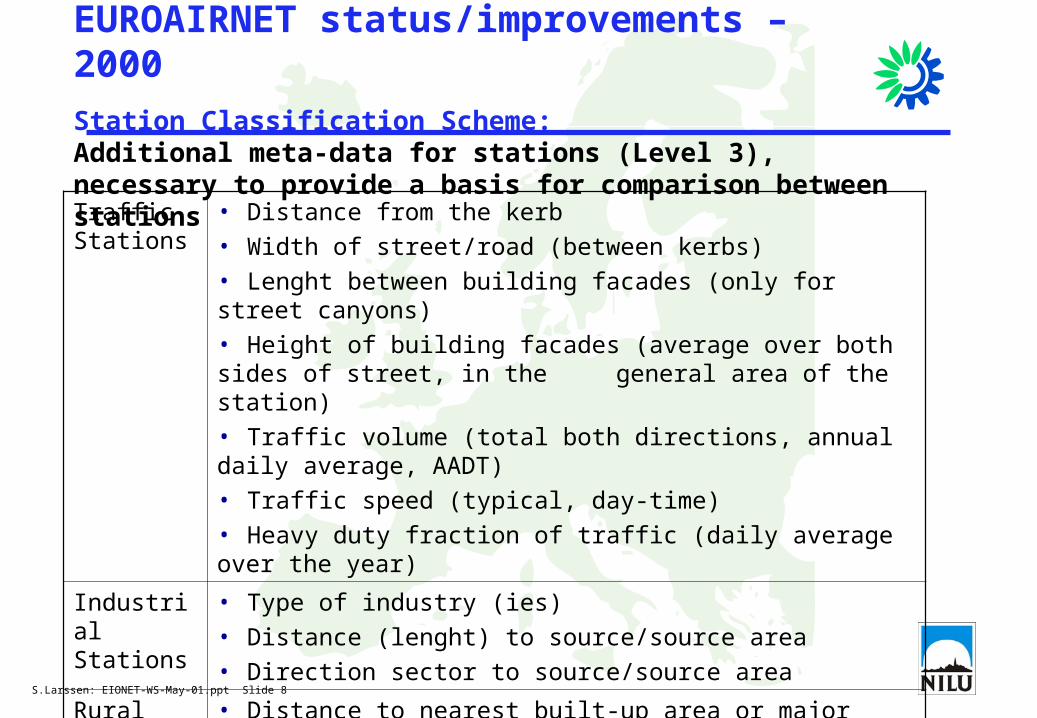
EUROAIRNET status/improvements – 2000
Station Classification Scheme:Additional meta-data for stations (Level 3), necessary to provide a basis for comparison between stationsTraffic Stations
• Distance from the kerb
• Width of street/road (between kerbs)
• Lenght between building facades (only for street canyons)
• Height of building facades (average over both sides of street, in the general area of the station)
• Traffic volume (total both directions, annual daily average, AADT)
• Traffic speed (typical, day-time)
• Heavy duty fraction of traffic (daily average over the year)
Industrial Stations
• Type of industry (ies)
• Distance (lenght) to source/source area
• Direction sector to source/source area
Rural Background Stations
• Distance to nearest built-up area or major source area
S.Larssen: EIONET-WS-May-01.ppt Slide 9
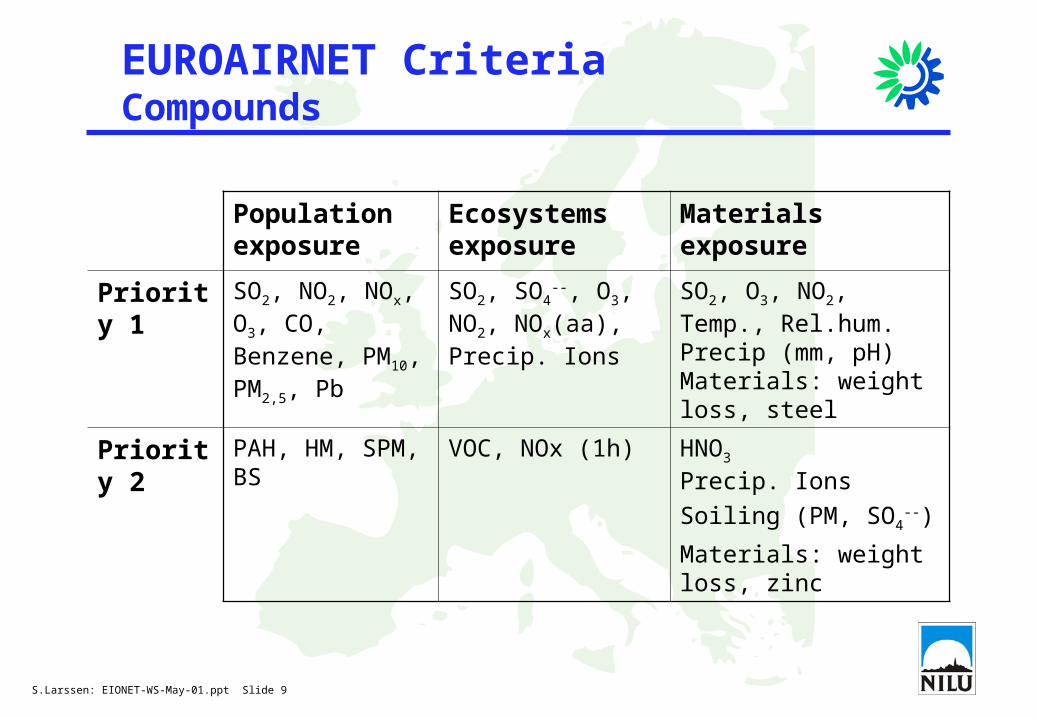
EUROAIRNET CriteriaCompounds
Population exposure
Ecosystems exposure
Materials exposure
Priority 1 SO2, NO2, NOx, O3, CO, Benzene, PM10, PM2,5, Pb
SO2, SO4--, O3, NO2,
NOx(aa), Precip. IonsSO2, O3, NO2, Temp., Rel.hum. Precip (mm, pH)Materials: weight loss, steel
Priority 2 PAH, HM, SPM, BS
VOC, NOx (1h) HNO3
Precip. Ions
Soiling (PM, SO4--)
Materials: weight loss, zinc
S.Larssen: EIONET-WS-May-01.ppt Slide 10
EUROAIRNET - QA/QC Criteria
Classification of QA/QC procedures
Data Quality Objectives (DQO)
Methods
Documented QA/QC plans
S.Larssen: EIONET-WS-May-01.ppt Slide 11
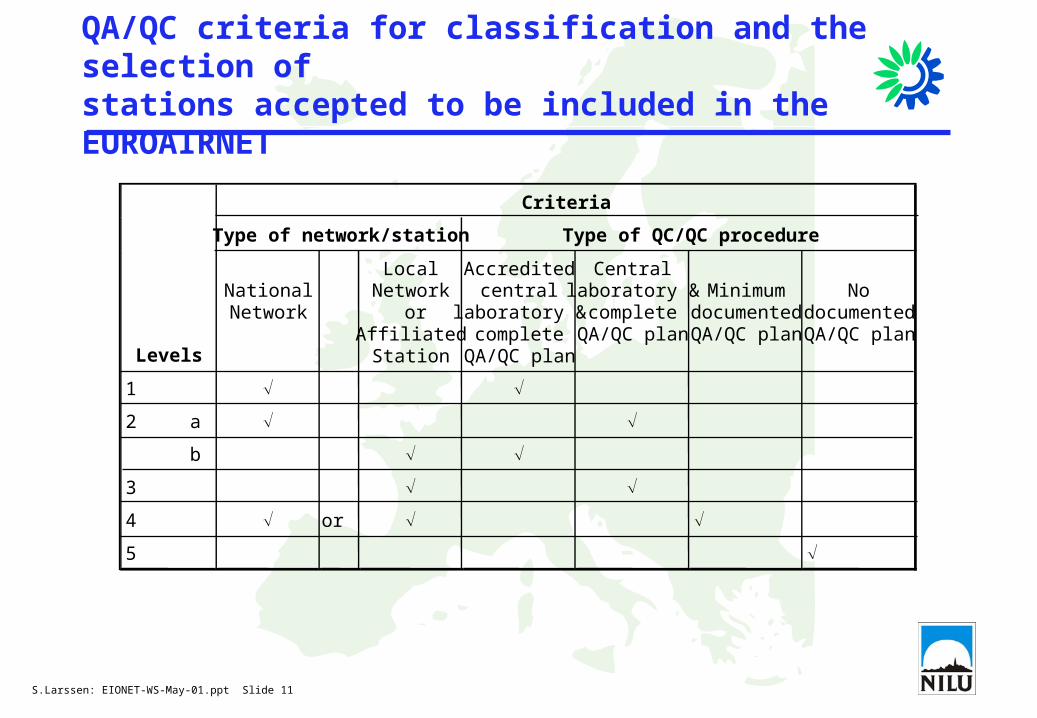
QA/QC criteria for classification and the selection ofstations accepted to be included in the EUROAIRNET
Criteria
Type of network/station Type of QC/QC procedure
Levels
NationalNetwork
LocalNetwork
orAffiliatedStation
Accreditedcentral
laboratory &complete
QA/QC plan
Centrallaboratory &
completeQA/QC plan
MinimumdocumentedQA/QC plan
NodocumentedQA/QC plan
1
2 a
b
3
4 or
5
S.Larssen: EIONET-WS-May-01.ppt Slide 12
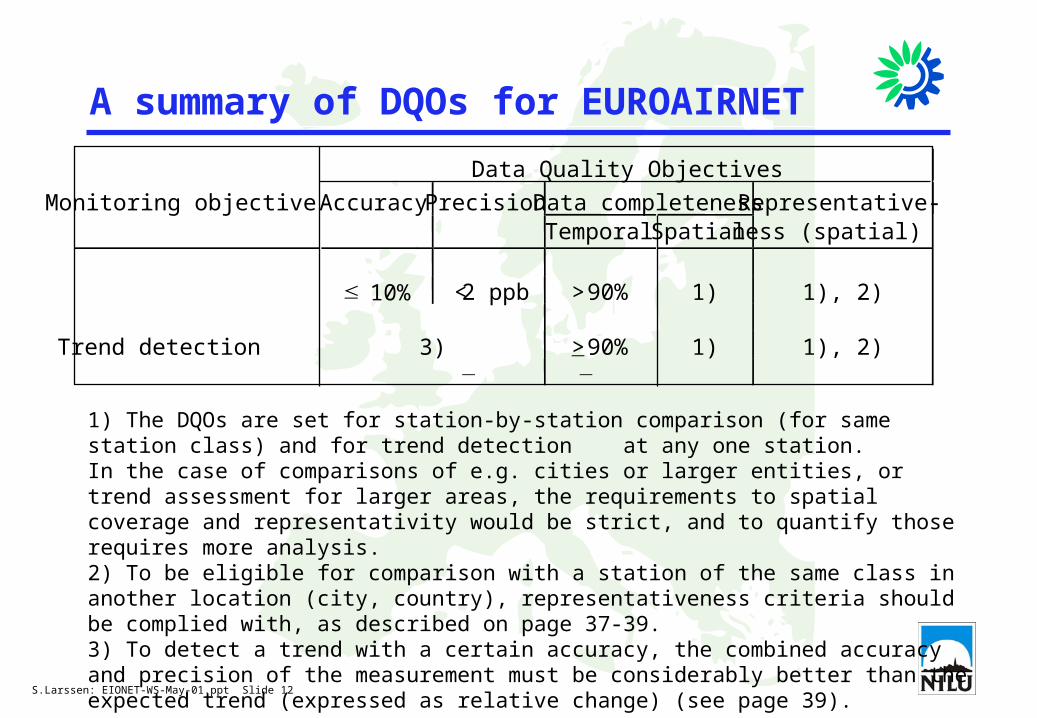
A summary of DQOs for EUROAIRNET
Data Quality Objectives
Monitoring objective Accuracy Precision Data completeness Representative-Temporal Spatial ness (spatial)
10% <2 ppb >90% 1) 1), 2)
Trend detection 3) >90% 1) 1), 2)
1) The DQOs are set for station-by-station comparison (for same station class) and for trend detection at any one station.In the case of comparisons of e.g. cities or larger entities, or trend assessment for larger areas, the requirements to spatial coverage and representativity would be strict, and to quantify those requires more analysis.2) To be eligible for comparison with a station of the same class in another location (city, country), representativeness criteria should be complied with, as described on page 37-39.3) To detect a trend with a certain accuracy, the combined accuracy and precision of the measurement must be considerably better than the expected trend (expressed as relative change) (see page 39).
S.Larssen: EIONET-WS-May-01.ppt Slide 13
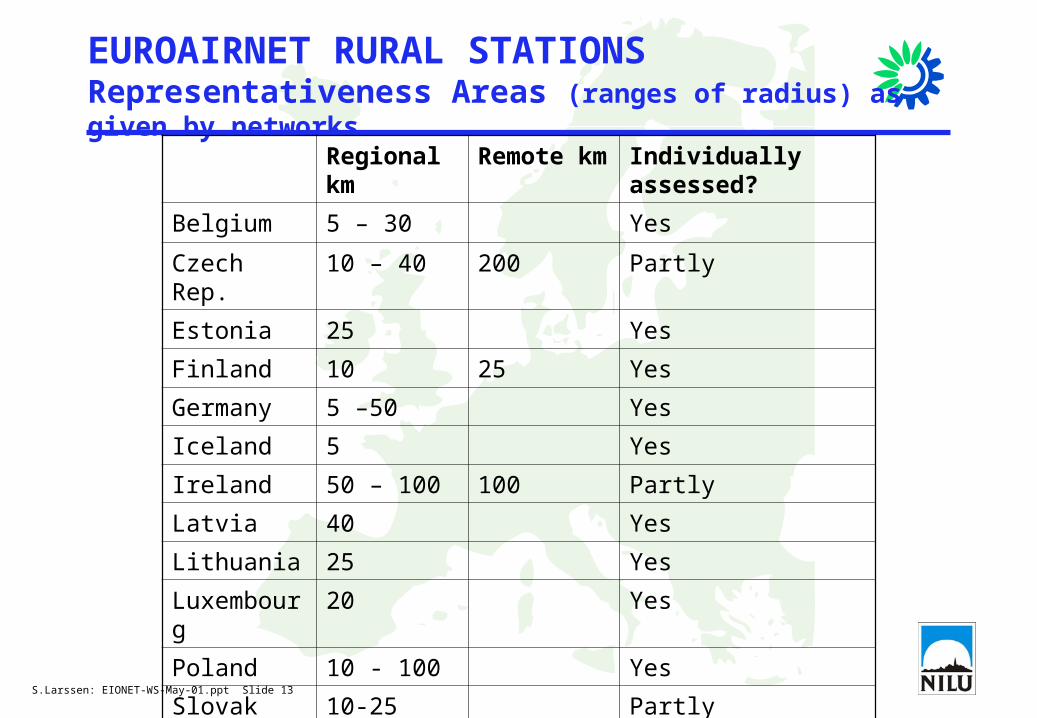
EUROAIRNET RURAL STATIONSRepresentativeness Areas (ranges of radius) as given by networks
Regional km Remote km Individually assessed?
Belgium 5 – 30 Yes
Czech Rep. 10 – 40 200 Partly
Estonia 25 Yes
Finland 10 25 Yes
Germany 5 –50 Yes
Iceland 5 Yes
Ireland 50 – 100 100 Partly
Latvia 40 Yes
Lithuania 25 Yes
Luxembourg 20 Yes
Poland 10 - 100 Yes
Slovak Rep. 10-25 Partly
Spain 25 - 150 200 – 500 Mostly
S.Larssen: EIONET-WS-May-01.ppt Slide 14
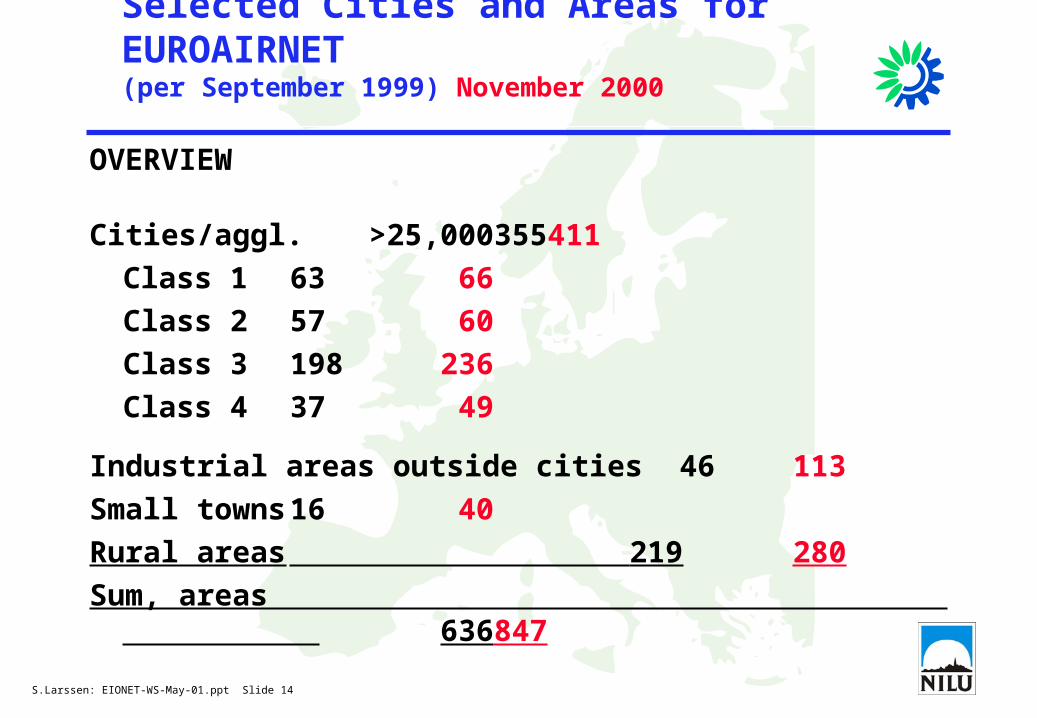
Selected Cities and Areas for EUROAIRNET(per September 1999) November 2000
OVERVIEW
Cities/aggl. >25,000 355 411
Class 1 63 66
Class 2 57 60
Class 3 198 236
Class 4 37 49
Industrial areas outside cities 46 113
Small towns 16 40
Rural areas 219 280
Sum, areas 636 847

S.Larssen: EIONET-WS-May-01.ppt Slide 15
EUROAIRNET Status – November 2000
Per Dec. 1999 Per Nov. 2000
Cities/agglomerations 915 945
Small towns 28 40
Industrial areas 96 216
Rural areas 231 296______
1275 1497______
Overview of selected stations
S.Larssen: EIONET-WS-May-01.ppt Slide 16
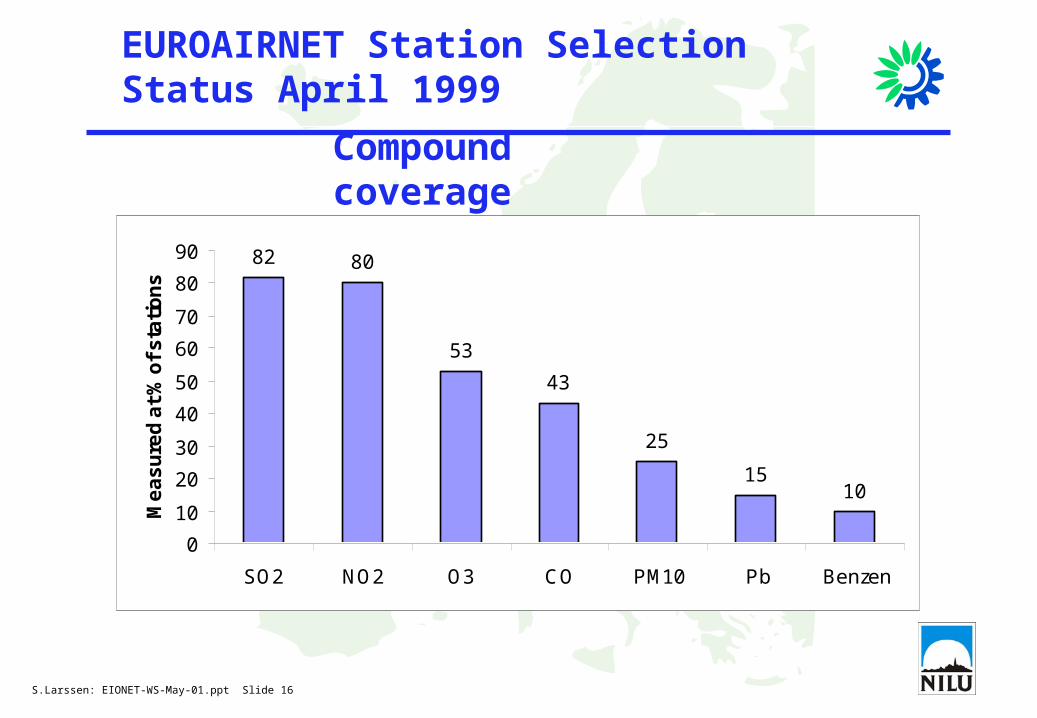
EUROAIRNET Station SelectionStatus April 1999
Compound coverage
82 80
53
43
25
1510
0
10
20
30
40
50
60
70
80
90
SO2 NO2 O3 CO PM10 Pb Benzen
Me
as
ure
d a
t %
of
sta
tio
ns
S.Larssen: EIONET-WS-May-01.ppt Slide 17
MAPS, EUROAIRNET Stations
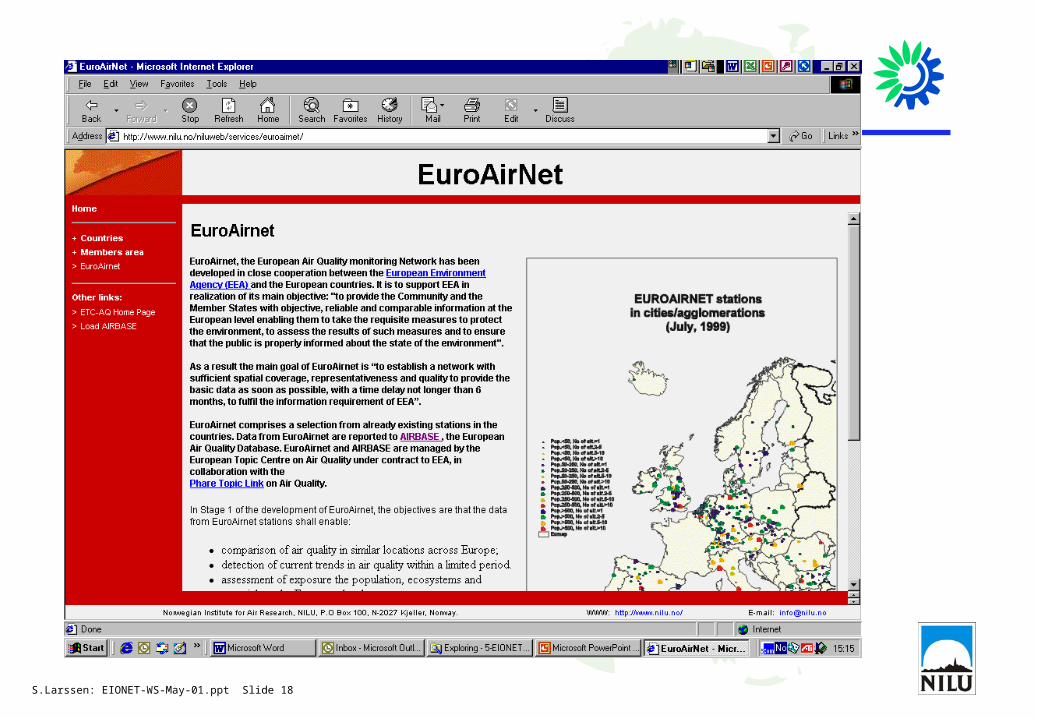
S.Larssen: EIONET-WS-May-01.ppt Slide 18
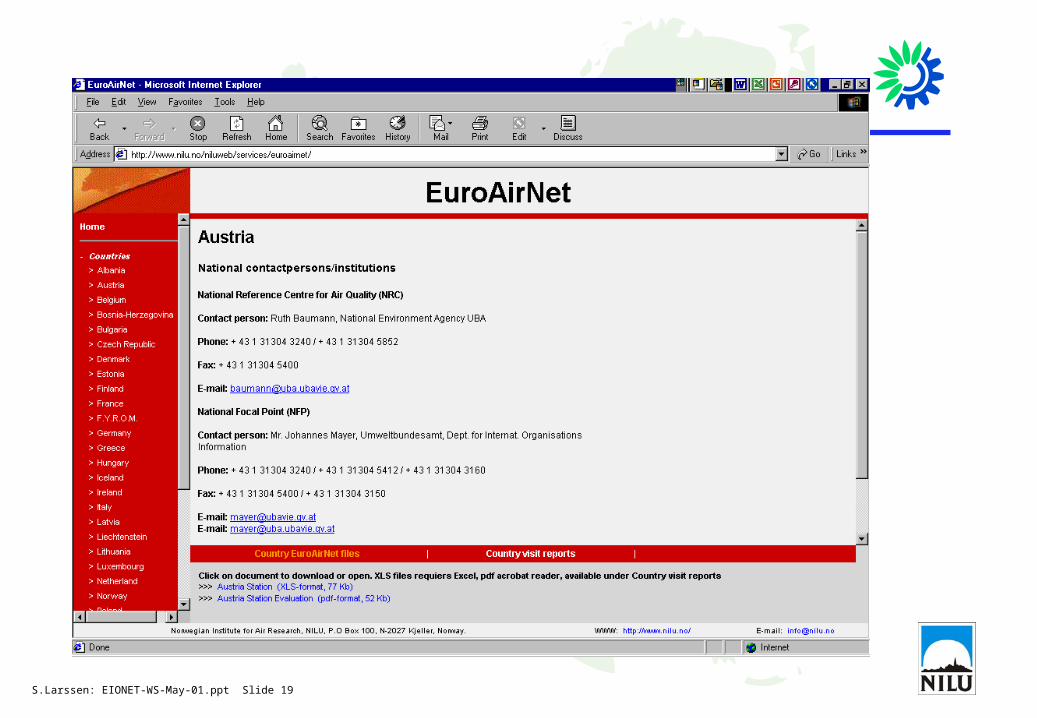
S.Larssen: EIONET-WS-May-01.ppt Slide 19
S.Larssen: EIONET-WS-May-01.ppt Slide 20
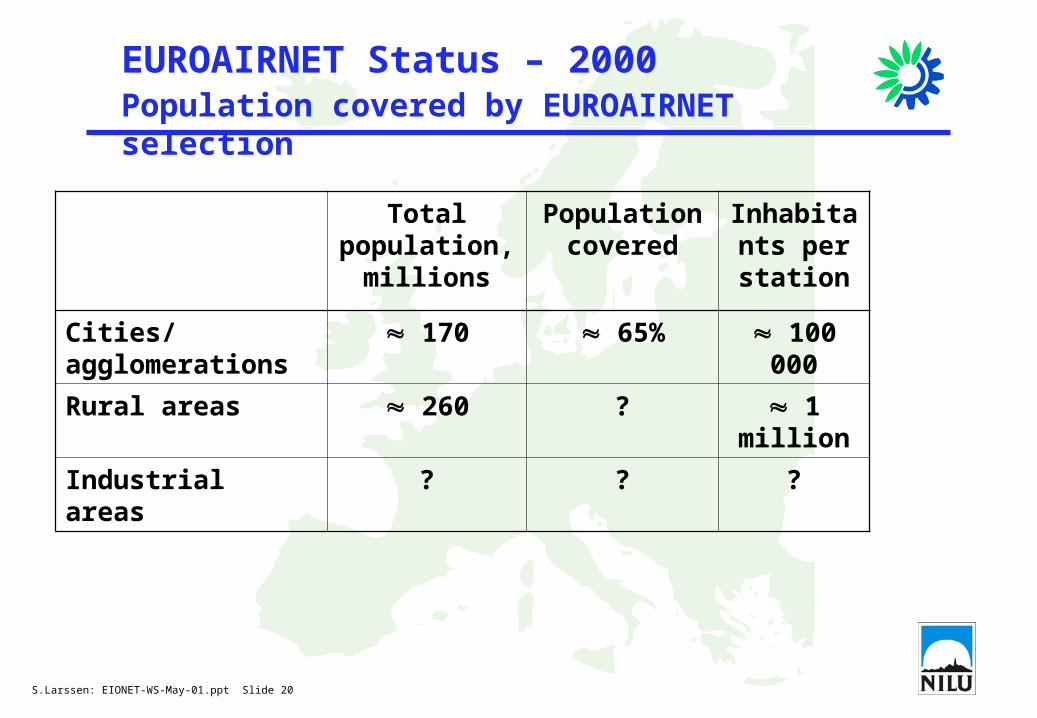
EUROAIRNET Status – 2000 Population covered by EUROAIRNET selection
Total population,
millions
Population covered
Inhabitants per station
Cities/agglomerations 170 65% 100 000
Rural areas 260 ? 1 million
Industrial areas ? ? ?
S.Larssen: EIONET-WS-May-01.ppt Slide 21
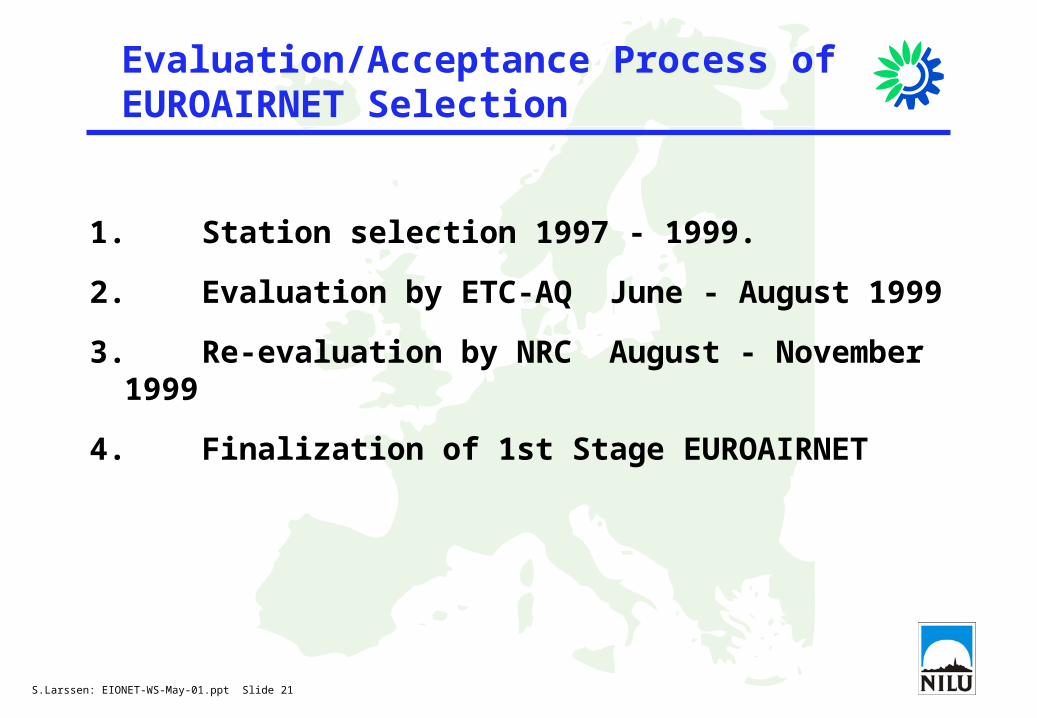
Evaluation/Acceptance Process of EUROAIRNET Selection
1. Station selection 1997 - 1999.
2. Evaluation by ETC-AQ June - August 1999
3. Re-evaluation by NRC August - November 1999
4. Finalization of 1st Stage EUROAIRNET
S.Larssen: EIONET-WS-May-01.ppt Slide 22
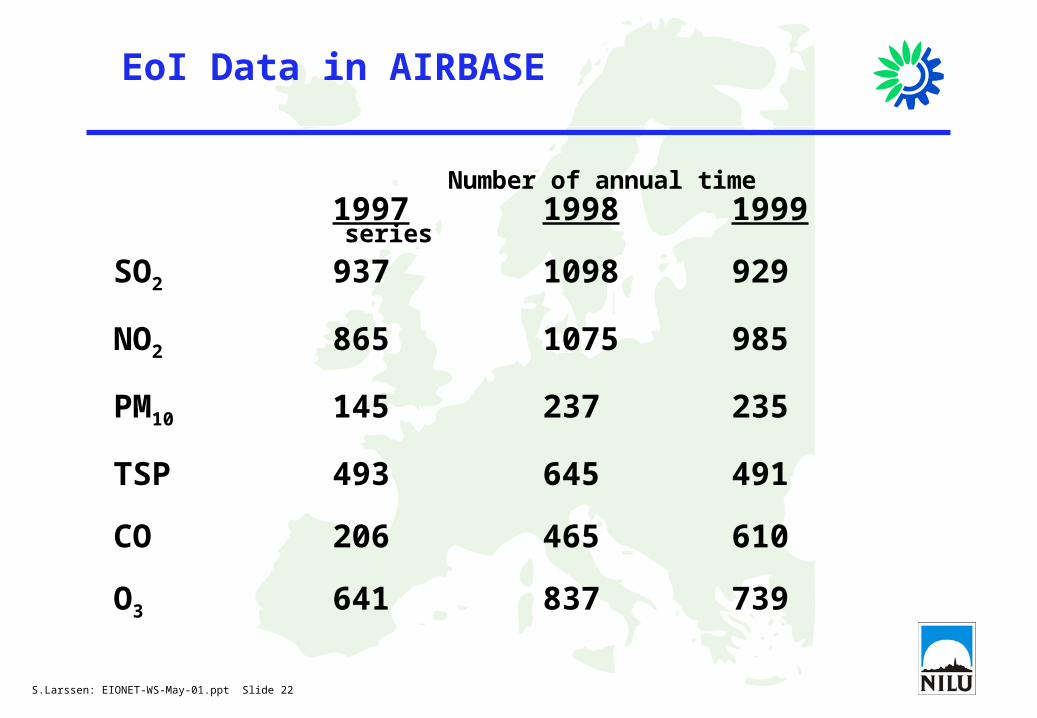
EoI Data in AIRBASE
1997 1998 1999
SO2 937 1098 929
NO2 865 1075 985
PM10 145 237 235
TSP 493 645 491
CO 206 465 610
O3 641 837 739
Number of annual time series
S.Larssen: EIONET-WS-May-01.ppt Slide 23
MAPS, EoI Data
S.Larssen: EIONET-WS-May-01.ppt Slide 24
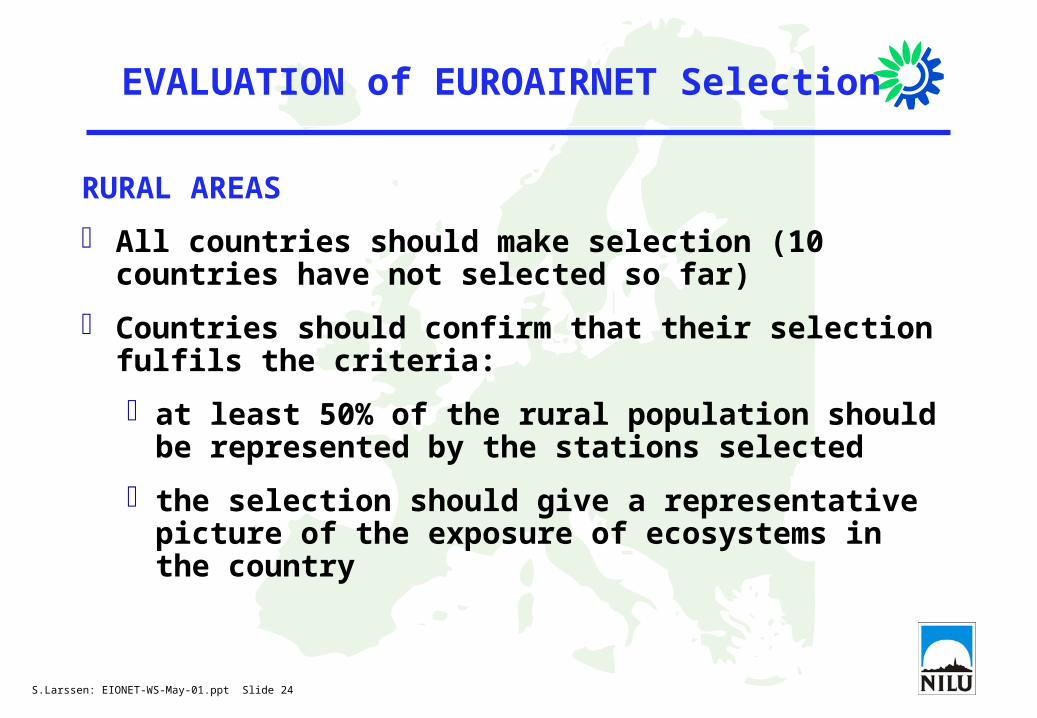
EVALUATION of EUROAIRNET Selection
RURAL AREAS
All countries should make selection (10 countries have not selected so far)
Countries should confirm that their selection fulfils the criteria:
at least 50% of the rural population should be represented by the stations selected
the selection should give a representative picture of the exposure of ecosystems in the country
S.Larssen: EIONET-WS-May-01.ppt Slide 25
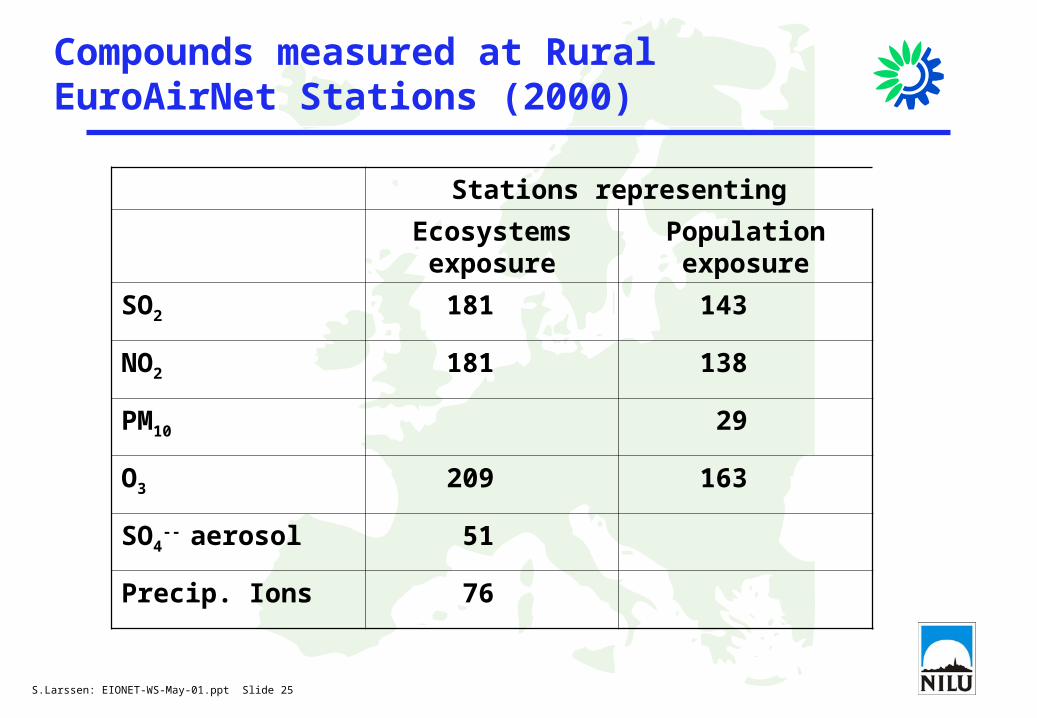
Compounds measured at Rural EuroAirNet Stations (2000)
Stations representing
Ecosystems exposure
Population exposure
SO2 181 143
NO2 181 138
PM10 29
O3 209 163
SO4-- aerosol 51
Precip. Ions 76
S.Larssen: EIONET-WS-May-01.ppt Slide 26
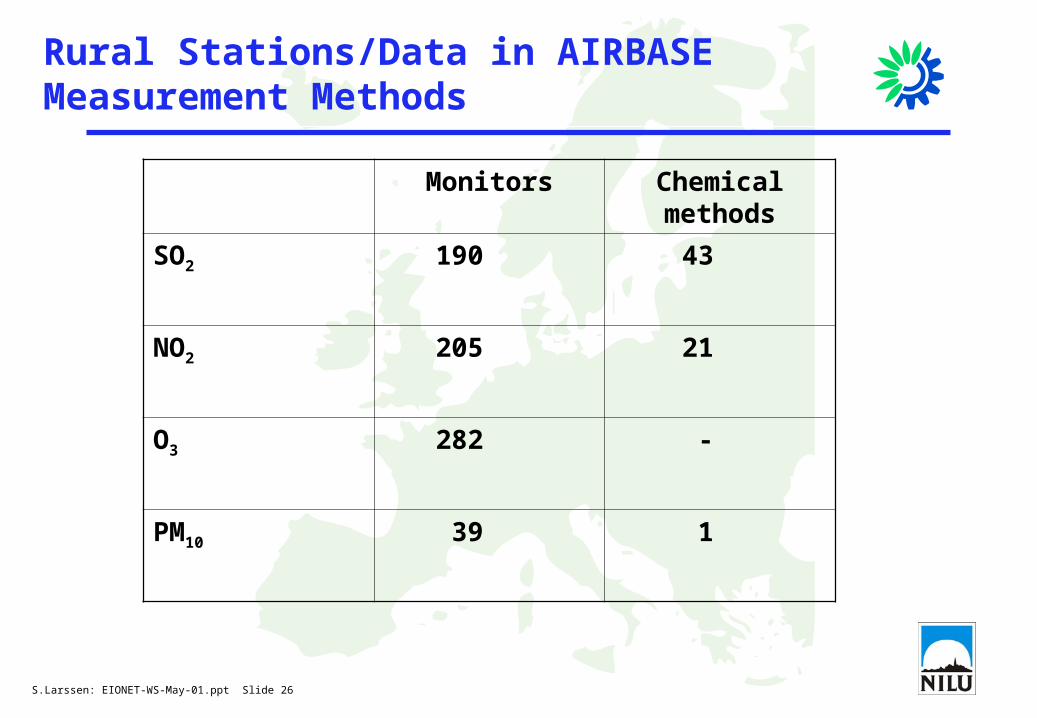
Rural Stations/Data in AIRBASEMeasurement Methods
Monitors Chemical methods
SO2 190 43
NO2 205 21
O3 282 -
PM10 39 1
S.Larssen: EIONET-WS-May-01.ppt Slide 27
Rural maps