sketch-based modeling of vascular systems: a first step ...sketch-based modeling of vascular...
TRANSCRIPT

EUROGRAPHICS Symposium on Sketch-Based Interfaces and Modeling (2010), pp. 1–8M. Alexa and E. Do (Editors)
Sketch-Based Modeling of Vascular Systems:a First Step Towards Interactive Teaching of Anatomy
Adeline Pihuit1, Marie-Paule Cani1 and Olivier Palombi1,2
1Grenoble Universities & CNRS, Jean Kuntzmann Lab, INRIA Grenoble Rhône-Alpes, France2Laboratory of Anatomy of Grenoble Universities, France
AbstractWe present a sketch-based modeling system, inspired from anatomical drawing, which constructs plausible 3Dmodels of branching vessels from a single sketch. The input drawing typically includes non-flat silhouettes andoccluded parts. We exploit the sketching conventions used in anatomical drawings to infer depth and curvaturefrom contour and skeleton curves extracted from the sketch. We then model the set of branching vessels as aconvolution surface generated by a graph of skeleton curves: while these curves are set to fit the sketch in the frontplane, non-uniform B-spline interpolation is used to give them smoothly varying depth values that meet the set ofconstraints. The final model is displayed using an expressive rendering method that imitates the aspect of chalkdrawing. We discuss the future use of this system as a step towards the interactive teaching of anatomy.
Categories and Subject Descriptors (according to ACM CCS): I.3.5 [Computer Graphics]: Computational Geometryand Object Modeling—
1. Introduction
Neither learning nor teaching anatomy is an easy task. Onone hand, students not only have to memorize hundredsscientific words but also to understand and remember ap-proximate shapes and spatial relationships of tens of humananatomical structures, which are presented to them through
Figure 1: A professor sketching the vascular system of the thy-roid, from different viewpoints. Three colors are used for the arterialblood vessels: dark-red, light-red and white.
2D sketches. On the other hand, professors try to make thesecomplex structures easy to understand and remind throughan incremental presentation, by progressively sketching sim-plified shapes on a blackboard with color chalks. In additionto the skills required to draw 2D views of complex inter-linked structures such as vessels, several sketches at differ-ent resolution or from different viewpoints can be neededto fully represent an organ and show its placement rela-tive to neighboring structures. Due to the use of blackboardand chalks, each of these sketches needs to be done fromscratch, and insuring an acceptable degree of coherence be-tween them requires a lot of training (Fig. 1).
Anatomy professors are attached to the pedagogy of thisinteractive, step by step approach: while sketching, they ex-plain the function of the organs, enhance relationships withothers, and annotate them with technical terms. Meanwhile,students are trained to reproduce the sketches on their ownsheet of paper, which helps them memorize. Therefore, vi-sualizing 3D models of the organs instead of sketching themwould not be a solution.
Sketch-based modeling would be a promising tool forteaching anatomy: it would provide an interactive virtualblackboard where the professor would sketch as usual, but
submitted to EUROGRAPHICS Symposium on Sketch-Based Interfaces and Modeling(2010)

2 A. Pihuit & M-P. Cani & 0. Palombi / Sketch-Based Modeling of Vascular Systems
which would infer some plausible 3D geometry from thesketches, using sketching conventions taught to students.This virtual blackboard would enable the professor not onlyto display the resulting anatomical structures from differentviewpoints and zoom factors, but also to sketch neighboringorgans from other viewpoints; this would greatly ease theunderstanding of 3D geometry.
This paper describes a first step towards this goal: todemonstrate the feasibility of the approach, we focus on in-ferring the 3D geometry of vascular structures from a singlesketch. This is a particularly challenging problem since ves-sels form networks of smoothly branching, self-occludingtubular shapes. This leads to complex sketches with non-planar silhouettes and multiple T-junctions on contours, asituation scarcely covered by previous sketch-based model-ing systems. How can we retrieve the spatial relationship be-tween vessels? How can we infer a plausible solution fortheir smoothly curved geometry? Our solution relies on sim-ple a priori knowledge such as the tubular nature of vesselsand on some specific sketching conventions used for teach-ing anatomy.
1.1. Previous Work
Modeling 3D shapes from 2D sketches has attracted a lot ofattention for the last ten years. Two classes of problems werestudied: sketch-based methods for modeling general free-form shapes on one hand, and specialized sketching systemswhich rely on some a priori knowledge on the object beingsketched to the other hand.
Since they have little knowledge on the model beingsketched, the first class of approaches [IMT99, TZF04,SWSJ05, BPCB08] tend to infer the simplest possible shapethat fits a user-sketched 2D contour. The latter is usually in-terpreted as a flat silhouette, which restricts the set of re-sulting shapes. To cover complex 3D models, these interac-tive systems enable users to progressively fill out them, byadding simple components sketched from arbitrary viewingangle and zoom factors, or deforming control curves that de-fine the surface [NISA07]. Sketching vascular systems us-ing these systems would be very tedious, since lots of dif-ferent viewpoints would be needed to model interlinked andself-occluding non-planar structures. Keeping in mind theapplication to the teaching of anatomy, the sketching strat-egy would also be too different from the standard approachwith blackboard and chalks to result in sketches that couldbe reproduced and learned by students.
Other sketching systems have tackled very specific ap-plications such as sketching clothing [TWB∗07], flow-ers [APS08, IYKI08] or trees [IOI06, WBCG09]. To handlesuch complex cases, some a priori knowledge on the struc-ture of the object being sketched is taken into account to in-fer the third dimension, which generally makes objects mod-eling easier: the user can do most of the work with a single
Figure 2: Real sketches on blackboard with chalk, illustrating theanatomical sketching conventions. Left: the aortic arch. Right: abranching situation where the right vessel is slightly behind theother one.
sketch rather than needing to sketch small parts of the modelfrom lots of different viewpoints. Our sketching system in-spires from these previous object-specific methods: it alsorelies on some a priory knowledge of the structures -here,vascular systems- being sketched. Meanwhile, our methodis the first one, to our knowledge, to tackle the case of anetwork of smooth, branching tubes. Thanks to our use ofsketching conventions in anatomy, we are able to reconstructthese complex structures from a single sketch.
The only previous work that tackles the case of sketcheswith non-planar silhouettes and self-occlusions is the excel-lent work from Karpenko and Hughes [KH06]. Cups andT-junctions on contours are classified and grouped to re-construct the occluded contours. Then, a simple physically-based system is used to infer some plausible depth. Similarlyto this method, we identify and classify T-junctions, but wecome out with a quite different solution for inferring depth:indeed, the specific nature of vessels enables us to directlywork on a graph of smooth, skeleton curves; moreover, weexploit the specific sketching conventions used to express3D in anatomical drawings, such as the use of hatchings toindicate highly curved regions.
1.2. Contributions
We present a sketch-based modeling system, inspired fromanatomical drawing, which constructs plausible 3D modelsof branching vessels from a single sketch.
The first challenge is to extract depth-clues from thesketch. This is done by studying contour-strokes, hatch-ing, T-junctions and colors. We interpret these clues usinganatomical sketching conventions to build a semantic forthe sketch, which is then converted into a set of depth con-straints.
The second contribution is a method for construct-ing a plausible 3D geometry for the sketched vessels.We rely on skeletal implicit surfaces (namely, convolu-tion surfaces) to model each vessel. However, in contrastwith previous convolution-based sketching-systems [TZF04,BPCB08], computing 2D skeletons is not sufficient to in-fer appropriate depth to each vessel. We therefore use depthconstraints to create a graph of smooth, 3D curves for the
submitted to EUROGRAPHICS Symposium on Sketch-Based Interfaces and Modeling (2010)
A. Pihuit & M-P. Cani & 0. Palombi / Sketch-Based Modeling of Vascular Systems 3
vessel skeletons. To do so, we exploit the smoothness ofBsplines for inferring depth while keeping an exact fit withthe sketch in the other dimensions.
Finally, the resulting graph of 3D skeletons is used to gen-erate an implicit representation of the vascular system. Wedisplay the latter in a way that imitates chalk drawing.
The remainder of this paper is organized as follows. Sec-tion 2 reviews the sketching conventions used by anatomists,with a focus on those that may bring depth clues in the caseof vessels; it also derives some extra rules expressing the factthat the sketch represents a graph of branching tubes. Wepresent our method for processing the contours and extract-ing depth constraints in section 3. Our method for computing3D skeletons and reconstructing the vessels geometry is de-tailed in section 4. Section 5 presents our results. We thendiscuss directions for future work.
2. Anatomical sketching conventions for blood vessels
Anatomical sketches comply with several conventions aimedat ensuring that every one imagines the same structure in3D. Since this project is the result of a collaborative ap-proach with an anatomist, we started by analyzing real casesof anatomical lectures performed on a blackboard. We ob-served that arterial blood vessels are usually sketched withthree colors (Fig 1 and 2): dark-red for contour strokes,light-red for filling the surface, and white chalk for annotat-ing the cross-section (ie. representing the hole in the vessel).
Since blood flows through vessels, anatomists try to con-form with the Kirchhoff rule, stating that the sum of area ofthe sections of outgoing vessels at a branching point is equalto the area of the incoming vessel’s section at this point.Even if only approximated in practice, this clue is very use-ful to understand the relationship between vessels at branch-ing points, as will be detailed in section 3.3.
In addition, the knowledge that vessels are tube-shapedstructures can be used to infer their orientation at endpoints.While the cross-section of a tube is a circle when seen infront, it becomes an ellipse due to perspective from any otherviewpoint. Thus, we can infer the orientation of a vessel bydetecting the form of the sketched section: the more circledthe section, the more orthogonal to the drawing plane.
We can also observe that the orientation of a vessel ata branching point can be approximately inferred from theshape of the junction (see Fig. 2, right, and Sec. 3.3).
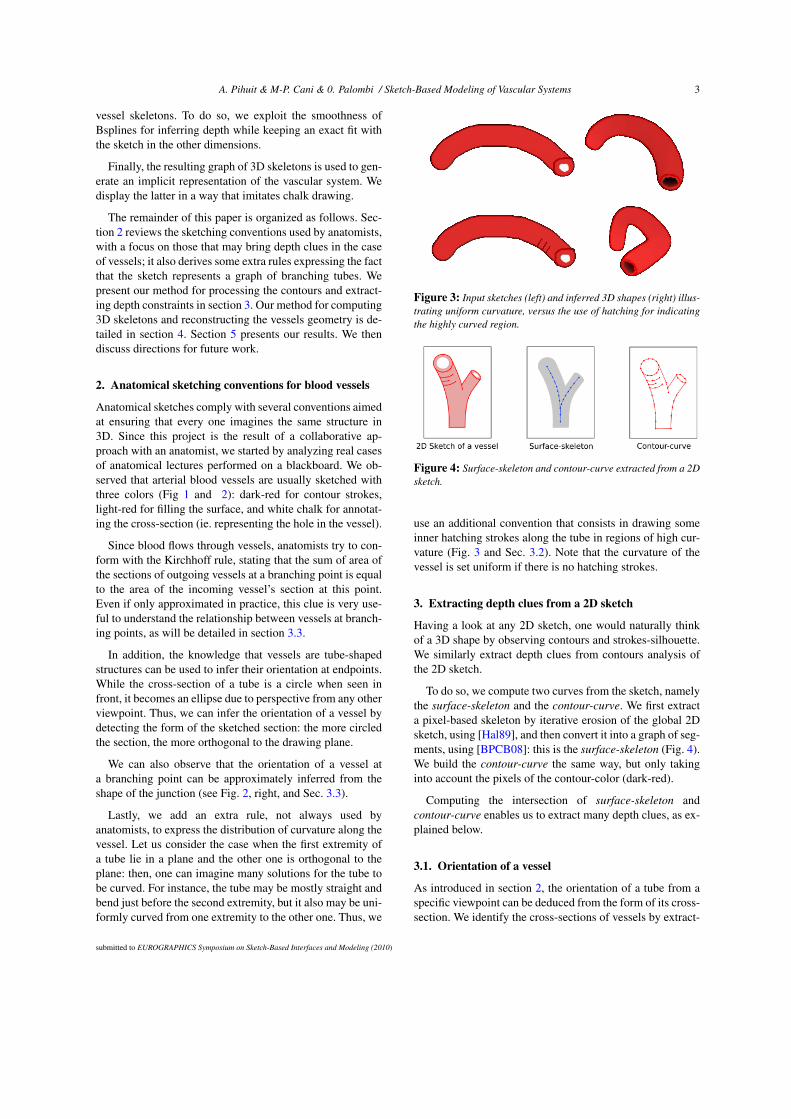
Lastly, we add an extra rule, not always used byanatomists, to express the distribution of curvature along thevessel. Let us consider the case when the first extremity ofa tube lie in a plane and the other one is orthogonal to theplane: then, one can imagine many solutions for the tube tobe curved. For instance, the tube may be mostly straight andbend just before the second extremity, but it also may be uni-formly curved from one extremity to the other one. Thus, we
Figure 3: Input sketches (left) and inferred 3D shapes (right) illus-trating uniform curvature, versus the use of hatching for indicatingthe highly curved region.
Figure 4: Surface-skeleton and contour-curve extracted from a 2Dsketch.
use an additional convention that consists in drawing someinner hatching strokes along the tube in regions of high cur-vature (Fig. 3 and Sec. 3.2). Note that the curvature of thevessel is set uniform if there is no hatching strokes.
3. Extracting depth clues from a 2D sketch
Having a look at any 2D sketch, one would naturally thinkof a 3D shape by observing contours and strokes-silhouette.We similarly extract depth clues from contours analysis ofthe 2D sketch.
To do so, we compute two curves from the sketch, namelythe surface-skeleton and the contour-curve. We first extracta pixel-based skeleton by iterative erosion of the global 2Dsketch, using [Hal89], and then convert it into a graph of seg-ments, using [BPCB08]: this is the surface-skeleton (Fig. 4).We build the contour-curve the same way, but only takinginto account the pixels of the contour-color (dark-red).
Computing the intersection of surface-skeleton andcontour-curve enables us to extract many depth clues, as ex-plained below.
3.1. Orientation of a vessel
As introduced in section 2, the orientation of a tube from aspecific viewpoint can be deduced from the form of its cross-section. We identify the cross-sections of vessels by extract-
submitted to EUROGRAPHICS Symposium on Sketch-Based Interfaces and Modeling (2010)
4 A. Pihuit & M-P. Cani & 0. Palombi / Sketch-Based Modeling of Vascular Systems
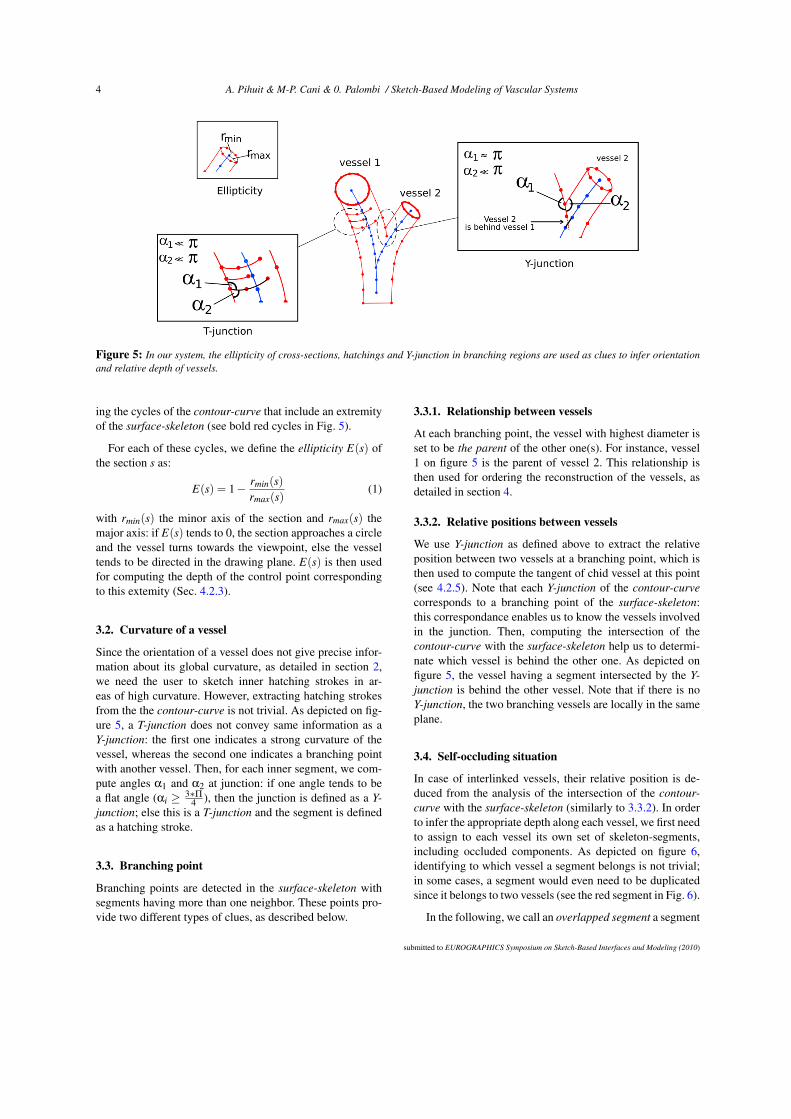
Figure 5: In our system, the ellipticity of cross-sections, hatchings and Y-junction in branching regions are used as clues to infer orientationand relative depth of vessels.
ing the cycles of the contour-curve that include an extremityof the surface-skeleton (see bold red cycles in Fig. 5).
For each of these cycles, we define the ellipticity E(s) ofthe section s as:
E(s) = 1− rmin(s)rmax(s)
(1)
with rmin(s) the minor axis of the section and rmax(s) themajor axis: if E(s) tends to 0, the section approaches a circleand the vessel turns towards the viewpoint, else the vesseltends to be directed in the drawing plane. E(s) is then usedfor computing the depth of the control point correspondingto this extemity (Sec. 4.2.3).
3.2. Curvature of a vessel
Since the orientation of a vessel does not give precise infor-mation about its global curvature, as detailed in section 2,we need the user to sketch inner hatching strokes in ar-eas of high curvature. However, extracting hatching strokesfrom the the contour-curve is not trivial. As depicted on fig-ure 5, a T-junction does not convey same information as aY-junction: the first one indicates a strong curvature of thevessel, whereas the second one indicates a branching pointwith another vessel. Then, for each inner segment, we com-pute angles α1 and α2 at junction: if one angle tends to bea flat angle (αi ≥ 3∗Π
4 ), then the junction is defined as a Y-junction; else this is a T-junction and the segment is definedas a hatching stroke.
3.3. Branching point
Branching points are detected in the surface-skeleton withsegments having more than one neighbor. These points pro-vide two different types of clues, as described below.
3.3.1. Relationship between vessels
At each branching point, the vessel with highest diameter isset to be the parent of the other one(s). For instance, vessel1 on figure 5 is the parent of vessel 2. This relationship isthen used for ordering the reconstruction of the vessels, asdetailed in section 4.
3.3.2. Relative positions between vessels
We use Y-junction as defined above to extract the relativeposition between two vessels at a branching point, which isthen used to compute the tangent of chid vessel at this point(see 4.2.5). Note that each Y-junction of the contour-curvecorresponds to a branching point of the surface-skeleton:this correspondance enables us to know the vessels involvedin the junction. Then, computing the intersection of thecontour-curve with the surface-skeleton help us to determi-nate which vessel is behind the other one. As depicted onfigure 5, the vessel having a segment intersected by the Y-junction is behind the other vessel. Note that if there is noY-junction, the two branching vessels are locally in the sameplane.
3.4. Self-occluding situation
In case of interlinked vessels, their relative position is de-duced from the analysis of the intersection of the contour-curve with the surface-skeleton (similarly to 3.3.2). In orderto infer the appropriate depth along each vessel, we first needto assign to each vessel its own set of skeleton-segments,including occluded components. As depicted on figure 6,identifying to which vessel a segment belongs is not trivial;in some cases, a segment would even need to be duplicatedsince it belongs to two vessels (see the red segment in Fig. 6).
In the following, we call an overlapped segment a segment
submitted to EUROGRAPHICS Symposium on Sketch-Based Interfaces and Modeling (2010)

A. Pihuit & M-P. Cani & 0. Palombi / Sketch-Based Modeling of Vascular Systems 5
Figure 6: Example of possible paths between section 2 and the extremity. The best path is path 3.
of the surface-skeleton that is intersected by the contour-curve (see the yellow segments in Fig. 6).
To solve the problem of segments assignment, we firstcompute all the paths between each pair of endpoints in thesurface-skeleton. We then evaluate each path according tosome criteria that define a more plausible path, and keep thefirst combination of best paths. Note that if this combinationdoes not allow to go through all segments of the skeleton-surface, we keep the second combination, and so on, up toensure to use all segments.
3.4.1. Defining a more plausible path
We consider as more plausible paths the paths with a pairof overlapped segments located close to each other -sincethey are more likely to correspond to the endpoints of anoccluded part (path 3 on Fig. 6)-, against paths with a singleoverlapped segment (path 1) or with overlapped segmentslocated far from each other (path 2). In addition, we includea segment twice along a path if and only if it is connectedto a cycle (red segment on Fig. 6); in that case, the segmentis duplicated with distinct depths to model distinct parts ofvessels.
3.4.2. Extracting depth relationship
Once each vessel has been assigned its own skeleton, find-ing out the depth relationship between the vessels is thenstraightforward: the vessel with overlapped segments is be-hind the other one. The local thickness of the vessels givesus the relative depth constraint insuring that the vessels willnot intersect. Note that, for each overlapping situation, westore the pair of involved segments; they will be used laterfor inferring the respective depth to each vessel (Sec. 4.2).
Figure 7: Input sketch (left) and 3D model for two branching ves-sels: the child vessel springs back from the parent vessel due to Y-junction drawn in the sketch (see profile view on the right)
4. Inferring the depth of vessels
4.1. Model for the skeleton-curves in 3D space
Splines are good candidates for modeling the skeleton-curves of vessels in 3D space, since we are looking forsmooth curves that interpolate between points with depthor orientation constraints. One could think of using inter-polation splines, such as Hermite or Cardinal splines, to en-sure that the vessels exactly fulfill constraints at each controlpoint. However, preventing a vessel from intersecting withanother one would be difficult, since such spline curves donot remain in the convex hull of their control points. In ad-dition, this spline model requires a regular sampling of con-trol points, which is quite restrictive, else the tension of thespline will be uneven. In our case, the constraints from thesketch are not necessarily well distributed along the curve.
In contrast, approximation splines such as cubic Bsplinesretain the curve in the convex hull of control points, which
submitted to EUROGRAPHICS Symposium on Sketch-Based Interfaces and Modeling (2010)

6 A. Pihuit & M-P. Cani & 0. Palombi / Sketch-Based Modeling of Vascular Systems
will ease preventing intersection between vessels. In addi-tion, using Non-Uniform Bsplines allows to deal with non-equidistant control points while still generating a natural-looking shape. Moreover, the use of approximation is nota problem in our case since most of the constraints from thesketch are depth range constraints (with an infinity of validpositions) rather than exact position constraints (and the lat-ter case, aligning 4 control points solves the problem).
In practice, we use Non-Uniform Bsplines to only infer aplausible depth to each point of the surface-skeleton, whilekeeping the other coordinates of the surface-skeleton equalto those read on the sketch.
4.2. Computing depth constraints
While setting up depth constraints onto each vessel is nottrivial since constraints often depend on each other - espe-cially in case of overlapping vessels -, using the relationshipbetween vessels, as detailed in 3.3, is very helpful: whileinferring depth of a parent vessel, we assign some depthsvalues for the children on the fly.
Regarding one vessel, we now detail how control pointsare computed, in the following order.
4.2.1. First control point
The depth of the first control point of a vessel depends onthe depth of its parent at the branching point. If the vesselhas no parent, then its initial depth is equal to the depth ofthe drawing plane. This point is duplicated three times to beinterpolated.
4.2.2. Control points with absolute depth constraints
For each control point arising from crossing vessels above orbelow this one, we compute an absolute depth constraint forthis point p, depending on the depth of the correspondingpoint p′ onto the other vessel involved V ′ (3.4). To ensurethis vessel V will not intersect V ′, the depth Z(p) of thispoint is set equal to:
Z(p) = Z(p′)+ pos∗ th∗ (rp′ + rp) (2)
with Z(p′) the depth of p′ and rp (resp. rp′ ) the radius of thesection of p (resp. p′). pos expresses the position of V rela-tive to V ′ (pos = 1 (resp. pos = −1) if V is above V ′ (resp.below)), and th is a threshold (th > 1) that allows to adjustthe distance between vessels. In practice, we set th = 1.2 toensure the vessels to be close but without blending (sincehuman structures tend to be as close as possible for optimiz-ing the space). To make the vessel interpolating this specificdepth, we create three additional control points, around thisone, with the same depth: doing so, we ensure to keep the C2
continuity of the vessel (note that this would not be the caseif we duplicated the point three times).
Figure 8: Self-occluding vascular system: input sketch (left) and3D model (right). Note the fact that the two vessels do not intersectbut are very close.
Figure 9: A more complex situation of two interlinked vessels: notethat these vessels do not intersect.
4.2.3. Last control point
The depth of this point p depends on the orientation of thevessel: the more the vessel towards the viewpoint, the higherthe variation of depth with previous control point pprev. Tocompute its depth, we assume that the vessel remains in abounding box defined by its length, and whose depth dmaxis set equal to a third of its length (this experimental valuerelies on the fact that vessels tend to optimize the space andcan not be curved so much). Then, the depth at this point isequal to:
Z(p) = max(dmax,Z(pprev)+(1−E(s))∗dmax) (3)
with E(s) the ellipticity of the section as defined in sec-tion 3.1. This control point is duplicated three times to beinterpolated.
4.2.4. Control points with relative depth constraints
We now deal with intermediate control points due to hatch-ing (3.2). To enforce the curvature to be sharpened at a spe-cific point, we set the depth of this point equal to the depthof the previous one. For instance, regarding a vessel withonly hatching constraints and its section towards the view-point (see Fig 3), clamping the depth of hatching point equalto the depth of the first point produces the same effect asstretching out the tangent.
submitted to EUROGRAPHICS Symposium on Sketch-Based Interfaces and Modeling (2010)

A. Pihuit & M-P. Cani & 0. Palombi / Sketch-Based Modeling of Vascular Systems 7
4.2.5. Tangent at the first point
The direction of the tangent of a vessel at a branching pointis deduced from the Y-junction, as detailed in 3.3.2. To in-fer the right direction, we insert a control point with a depthsmaller or higher than the first point, according to the re-quired direction. In the case where there is no Y-junction,the two vessels are branched in the same plane: we assign tothis control point the same depth as the branching point.
4.2.6. Tangent at the last point
Similarly to the tangent at first point, this tangent may haveseveral directions. In case of elliptic section, we insert a con-trol point with a depth equal to the depth of the last point.On the contrary, to bend the vessel towards the viewpoint,we insert a control point close to the last point with muchsmaller depth, to make the last segment of the 3D skeletonorthogonal to the drawing plane.
Finally, once all 3D control points are set onto the 2Dskeleton, we compute the depth of each segment of the skele-ton, and then use it to produce an implicit surface. We useconvolution so that a skeleton curve can be used with nobulges at joint between segments [TZF04]. Thanks to thismodel, a smooth branching of the tubular shapes is seam-lessly generated where skeletons joint.
This implicit surface is then displayed through expressiverendering, as detailed in next section.
5. Visualization and results
5.1. Expressive rendering
While some previous work focused on making the visu-alization of vascular structures easy to understand [OP05,JQD∗08], none of them, to our knowledge, intended to im-itate the aspect of chalk sketches done on a blackboard. Inthis light, we apply on final models an expressive render-ing, computed on GPU. We first store the grid of implicitfield values generated by 3D skeletons as a 3D texture onthe GPU. Within this representation, the surface of the shapeis represented by a given isovalue. This grid is then renderedusing a slice-based volume rendering technique [EHK∗04].In addition to the rendered color buffer, a depth map is alsogenerated by this process.
While light-red is used for displaying the surface, wecompute silhouettes according high variations of depth be-tween neighbor pixels, and render them with dark-red, as im-posed by the conventions of anatomy. Then, we render cross-sections using cut-planes at vessels extremities. However, in-stead of displaying the inside surface in white as in the initialsketch, we use transparency to imitate empty tubes. Finally,we compute shading using normals to the surface (estimatedby the gradient of field values), to ease the understanding ofthe depth and volumes in the scene.
5.2. Performances
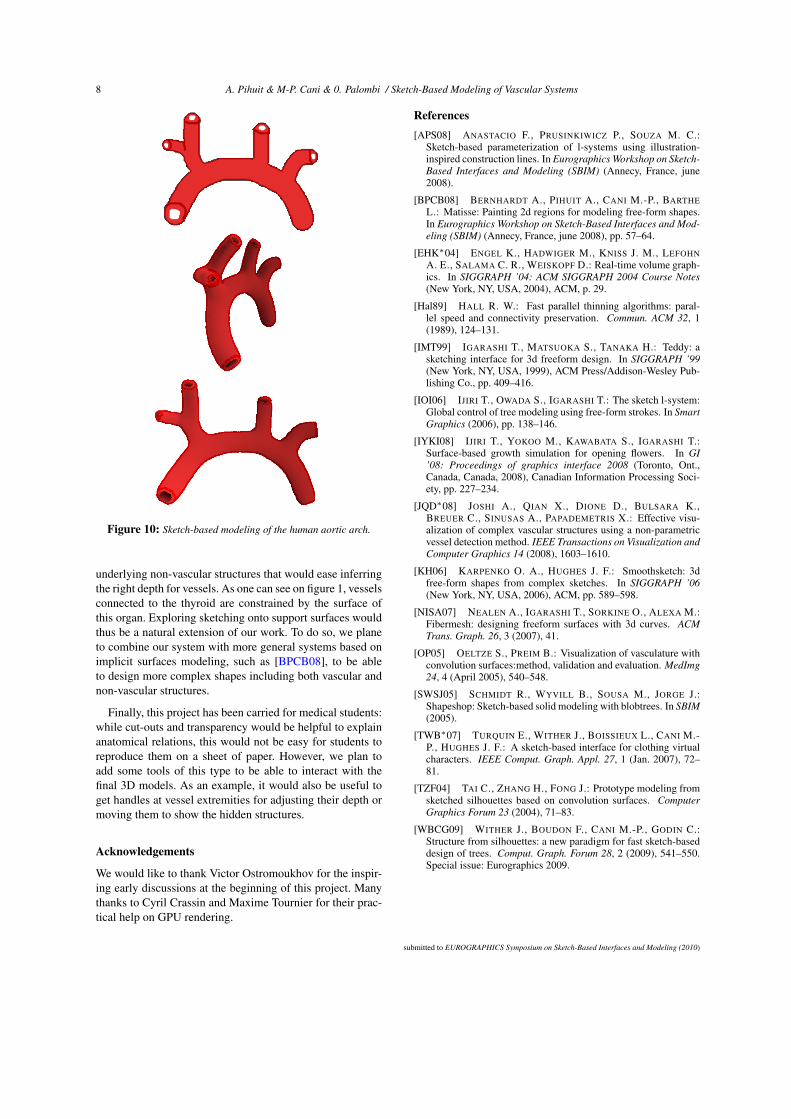
Some performances have been measured on a 2.13Ghz dualcore computer with a GeForce 9800 GTX, for the aorticarch model (Fig. 10). While computing 3D skeletons takesless than 400ms, the evaluation of the field function requiresmore time (6s), which is too much for setting up a fullyinteractive system. However, while these steps are done onCPU, we have experimented the use of the OpenMP API forthe field function evaluation: times have been divided by 2.Then, since this latter step can be parallelized on GPU (thefield at each voxel of the grid does not depend on the othervoxels), we can expect to get a real-time system doing so.Regarding the rendering of the models, the display is fullyinteractive (34fps).
5.3. Results
Our system enables to reconstruct the geometry of some sim-ple vessels configurations. Figures 7 to 10, as well as the at-tached video, depict our results regarding basic examples wementioned in section 3. This is a first step towards sketchingvascular systems with higher complexity. Even though noformal user study took place yet, each step has been eval-uated by the professional of anatomical teaching we workwith; and the results, displayed in a way that imitates theaspect of chalk drawing, looked impressive to him.
6. Discussion and future work
An interactive sketch-based modeling system would be ofa great help for teaching anatomy, since it would enable todisplay different views of the organs while keeping a step bystep, simplified presentation of their geometry through 2Dsketching. We have studied the feasibility of this approachfor one of the most intricate anatomical structures: a vascu-lar system. Our method computes 3D models of these self-occluding, branching structures from a single sketch. Convo-lution surfaces and non-uniform Bsplines are used to modelthe 3D geometry and to infer a plausible depth variationwhile taking constraints into account.
Even though this system could be generalized to thesketching of any tubes network, we used some a prioryknowledge from the sketching conventions used in anatomyto build the semantic of the sketch. Since our system usesthese conventions as constraints on the 3D geometry, a pro-fessor is able to interactively draw 3D vessels in a 2D view,exactly as he would do on a blackboard with chalks.
However, dealing with complex vascular systems withseveral close, independant structures is still a challenge; in-ferring the right depth for each vessel is not trivial since theproblem is under-constrained: on figure 9, one can imaginemany other plausible solutions for the curvature of each ves-sel. Thus, for elaborating a relevant anatomical lecture andplanning a practical test, we have to extend this system to
submitted to EUROGRAPHICS Symposium on Sketch-Based Interfaces and Modeling (2010)
8 A. Pihuit & M-P. Cani & 0. Palombi / Sketch-Based Modeling of Vascular Systems
Figure 10: Sketch-based modeling of the human aortic arch.
underlying non-vascular structures that would ease inferringthe right depth for vessels. As one can see on figure 1, vesselsconnected to the thyroid are constrained by the surface ofthis organ. Exploring sketching onto support surfaces wouldthus be a natural extension of our work. To do so, we planeto combine our system with more general systems based onimplicit surfaces modeling, such as [BPCB08], to be ableto design more complex shapes including both vascular andnon-vascular structures.
Finally, this project has been carried for medical students:while cut-outs and transparency would be helpful to explainanatomical relations, this would not be easy for students toreproduce them on a sheet of paper. However, we plan toadd some tools of this type to be able to interact with thefinal 3D models. As an example, it would also be useful toget handles at vessel extremities for adjusting their depth ormoving them to show the hidden structures.
Acknowledgements
We would like to thank Victor Ostromoukhov for the inspir-ing early discussions at the beginning of this project. Manythanks to Cyril Crassin and Maxime Tournier for their prac-tical help on GPU rendering.
References[APS08] ANASTACIO F., PRUSINKIWICZ P., SOUZA M. C.:
Sketch-based parameterization of l-systems using illustration-inspired construction lines. In Eurographics Workshop on Sketch-Based Interfaces and Modeling (SBIM) (Annecy, France, june2008).
[BPCB08] BERNHARDT A., PIHUIT A., CANI M.-P., BARTHEL.: Matisse: Painting 2d regions for modeling free-form shapes.In Eurographics Workshop on Sketch-Based Interfaces and Mod-eling (SBIM) (Annecy, France, june 2008), pp. 57–64.
[EHK∗04] ENGEL K., HADWIGER M., KNISS J. M., LEFOHNA. E., SALAMA C. R., WEISKOPF D.: Real-time volume graph-ics. In SIGGRAPH ’04: ACM SIGGRAPH 2004 Course Notes(New York, NY, USA, 2004), ACM, p. 29.
[Hal89] HALL R. W.: Fast parallel thinning algorithms: paral-lel speed and connectivity preservation. Commun. ACM 32, 1(1989), 124–131.
[IMT99] IGARASHI T., MATSUOKA S., TANAKA H.: Teddy: asketching interface for 3d freeform design. In SIGGRAPH ’99(New York, NY, USA, 1999), ACM Press/Addison-Wesley Pub-lishing Co., pp. 409–416.
[IOI06] IJIRI T., OWADA S., IGARASHI T.: The sketch l-system:Global control of tree modeling using free-form strokes. In SmartGraphics (2006), pp. 138–146.
[IYKI08] IJIRI T., YOKOO M., KAWABATA S., IGARASHI T.:Surface-based growth simulation for opening flowers. In GI’08: Proceedings of graphics interface 2008 (Toronto, Ont.,Canada, Canada, 2008), Canadian Information Processing Soci-ety, pp. 227–234.
[JQD∗08] JOSHI A., QIAN X., DIONE D., BULSARA K.,BREUER C., SINUSAS A., PAPADEMETRIS X.: Effective visu-alization of complex vascular structures using a non-parametricvessel detection method. IEEE Transactions on Visualization andComputer Graphics 14 (2008), 1603–1610.
[KH06] KARPENKO O. A., HUGHES J. F.: Smoothsketch: 3dfree-form shapes from complex sketches. In SIGGRAPH ’06(New York, NY, USA, 2006), ACM, pp. 589–598.
[NISA07] NEALEN A., IGARASHI T., SORKINE O., ALEXA M.:Fibermesh: designing freeform surfaces with 3d curves. ACMTrans. Graph. 26, 3 (2007), 41.
[OP05] OELTZE S., PREIM B.: Visualization of vasculature withconvolution surfaces:method, validation and evaluation. MedImg24, 4 (April 2005), 540–548.
[SWSJ05] SCHMIDT R., WYVILL B., SOUSA M., JORGE J.:Shapeshop: Sketch-based solid modeling with blobtrees. In SBIM(2005).
[TWB∗07] TURQUIN E., WITHER J., BOISSIEUX L., CANI M.-P., HUGHES J. F.: A sketch-based interface for clothing virtualcharacters. IEEE Comput. Graph. Appl. 27, 1 (Jan. 2007), 72–81.
[TZF04] TAI C., ZHANG H., FONG J.: Prototype modeling fromsketched silhouettes based on convolution surfaces. ComputerGraphics Forum 23 (2004), 71–83.
[WBCG09] WITHER J., BOUDON F., CANI M.-P., GODIN C.:Structure from silhouettes: a new paradigm for fast sketch-baseddesign of trees. Comput. Graph. Forum 28, 2 (2009), 541–550.Special issue: Eurographics 2009.
submitted to EUROGRAPHICS Symposium on Sketch-Based Interfaces and Modeling (2010)