skanska - jefferies · airport achieved −first phases of ... ppp model: airline and retail...
TRANSCRIPT

Skanska LaGuardia Airport, New York, U.S.

2
− Skanska is one of the world’s leading project development and construction groups
− Operations in selected home markets in Europe and North America
− Revenue of USD 18 bn in 2015 − No of employees 43,000 − Listed on Nasdaq OMX − Market Cap SEK 69 bn
87%
8%
5%
Revenue EBIT
49%
15%
25%
11%
Construction
Residential Development
Commercial Property Development
Infrastructure Development
Facts in brief
Our four business streams
Revenue, operating income (EBIT), FY 2015
Our home markets
USA Sweden Finland
Denmark
United Kingdom
Poland Slovakia
Hungary
Czech Republic
Romania
Norway
Commercial Property Development
Residential Development
Infrastructure Development
Construction
February 2016 Skanska Investment Story
USA Nordic countries Other European countries
Construction
Residential Development
Commercial Property Development
Infrastructure Development
3
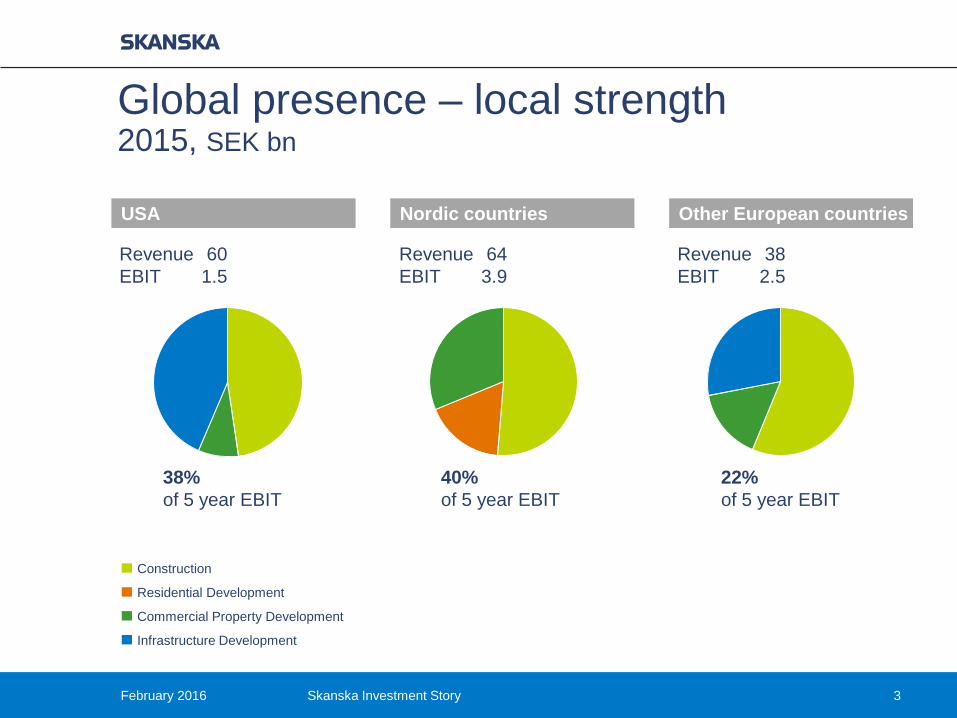
Global presence – local strength 2015, SEK bn
Revenue 64 EBIT 3.9
Revenue 60 EBIT 1.5
Revenue 38 EBIT 2.5
40% of 5 year EBIT
22% of 5 year EBIT
38% of 5 year EBIT
February 2016 Skanska Investment Story

February 2016 4
Skanska’s business model
Free working capital
Operating margin ≥3.5%
Investment opportunities
Internal contracts
Skanska Investment Story
Construction Revenue with associated contract profits
Revenue clients Project Development Development gains are generated and are realized upon divestment
Operating margin 2.6%
Rolling 12 months
Return on capital employed ≥10%
Return on capital employed 15.9%
Return on equity ≥18%
Dividend 40-70% of profit
Return on equity 26.7%
Dividend 63% of profit
Financial targets

ROE Dividend Total Shareholder Return compared to indices (5y)
A history of competitive returns
*SBI, Strategic Benchmark Index consist of companies that, taken together, reflects Skanska´s operations
5
0
5
10
15
20
25
30
35
40
45
2006
2007
2008
2009
2010
2011
2012
2013
2014
2015
4%
7% 6%
1%
6%
4% 4%
2%
0%
2%
4%
6%
8%
10%
12%
Skanska B SIXPortfolio
Index
SBI DJ TitansCon & Mat
Price return Dividend yield
0%
1%
2%
3%
4%
5%
6%
7%
8%
9%
10%
0.00
2.00
4.00
6.00
8.00
10.00
12.00
14.00
2005
2006
2007
2008
2009
2010
2011
2012
2013
2014
2015
Dividend – additional, SEK Dividend, SEKDividend yield %
February 2016 Skanska Investment Story

Our key actions 2016–2020
Controlled growth in Construction − Home market strategy − Enhanced Risk management − Higher level of early involvement − Continued focus on working
capital
Stable Residential Development − Increase capital efficiency − Grow BoKlok − Establish Residential Development
Europe − Design to cost
Expand Commercial Property Development − Increase investments − Drive cost efficiency − Consider expansion in the U.S. /
CEE − Landbank focus to backfill
pipeline
Leverage Infrastructure Development business model − Grow presence in USA − Establish presence in Norway − Enhance values in portfolio and
divest mature projects
6 February 2016 Skanska Investment Story

− Flat revenue in local currency
− Significant increase in operating income SEK 3.6 bn (2.5) – Strong performance in Commercial
and Residential Development – Decreased profitability in
Construction
− Continued good ROCE in Project Development 15.9% (15.3)
− Considerable increase in earnings per share SEK 6.89 (4.22)
− Strong order bookings SEK 84.2 bn (58.3)
JW Marriott Hotel, Nashville, U.S.
July 22, 2016 Skanska Six month report 2016 7
Six month report 2016

− Revenue SEK 64.2 bn (66.9)
− Order bookings SEK 84.2 bn (58.3) – Norway, USA Civil and USA Building
strong – Book-to-build: 107% R-12 – No visible impact of Brexit
− Operating income SEK 1,340 M (1,687) – USA Civil still challenging – Polish market shifting – Strong Nordic and USA Building
operations
D.C. Water headquarters, Washington, D.C., U.S.
July 22, 2016 Skanska Six month report 2016 8
Construction

July 22, 2016 Skanska Six month report 2016 9
Construction Order bookings
SEK bn
Jan–Jun 2016
Jan–Jun 2015
Book- to-build, R-12, %
Months of production
Sweden 16.2 16.2 105 13 Norway 6.7 5.5 130 13 Finland 2.8 3.2 101 11 Poland 4.5 4.1 106 9 Czech Republic 1.7 3.1 85 11 UK 7.4 13.8 65 15 USA Building 29.6 5.5 131 16 USA Civil 15.1 6.8 107 27 Total 84.2 58.3 107 15

Construction Income statement
10
Operating income, SEK M Operating margin, % Jan–Jun
2016 Jan–Jun
2015 Jan–Jun
2016 Jan–Jun
2015
Sweden 454 538 3.1 3.7 Norway 177 182 3.1 2.8 Finland 119 95 3.6 3.3 Poland -90 94 neg 3.0 Czech Republic -18 17 neg 0.8 UK 198 205 2.0 2.4 USA Building 233 101 1.3 0.5 USA Civil 267 455 3.1 4.4 Total 1,340 1,687 2.1 2.5
July 22, 2016 Skanska Six month report 2016

− Revenue SEK 6.1 bn (6.6) – 2,181 (2,157) homes sold – 2,143 (1,876) homes started
− Operating income SEK 675 M (631) – Operating margin 11% (9.5%)
− ROCE 14.3% (10.8)
− Completed unsold homes decreasing
− Amortization regulations reduce speculation
BoKlok Älvdansen, Älvängen Ale, Sweden
July 22, 2016 Skanska Six month report 2016 11
Residential Development

Residential Development Homes in production
July 22, 2016 Skanska Six month report 2016 12
0
1,000
2,000
3,000
4,000
5,000
6,000
7,000
Q3 Q4 Q12012
Q2 Q3 Q4 Q12013
Q2 Q3 Q4 Q12014
Q2 Q3 Q4 Q12015
Q2 Q3 Q4 Q12016
Q2
Homes
Unsoldcompleted
Unsold underconstruction
Sold underconstruction
Homes in production Of which sold, % Unsold
completed homes Jun 30, 2016 Jun 30, 2015 Jun 30, 2016 Jun 30, 2015 Jun 30, 2016 Jun 30, 2015
6,424 4,896 78 78 190 358

− Operating income SEK 1,812 M (567)
− Divestments of SEK 5.9 bn (2.4) – Gain SEK 2.0 bn (0.9)
− ROCE 16.6% (15.5) − 47 ongoing projects
– SEK 19.3 bn in investment value – 42% pre-leasing rate – 44% completion rate – 12 projects started
− 395,000 sq m leased R-12
Klipporna, Malmö, Sweden
July 22, 2016 Skanska Six month report 2016 13
Commercial Property Development

Skanska Three Month Report 2016
Commercial Property Development
Capital employed SEK 17 bn
Grand total 47 ongoing projects Investment SEK 19 bn
U.S. 5 ongoing projects
Rest of Europe 14 ongoing projects
Nordics 28 ongoing projects
U.S. 27%
Nordics 40%
Europe 33%
14

− Operating income SEK 217 M (252)
− Project portfolio’s net present value SEK 5.2 bn, SEK 0.4 bn in underlying increase year-to-date
− ROCE 16.3% (26.7)
− Financial close of LaGuardia Airport achieved
− First phases of NKS delivered
Interstate 4, Orlando, Florida, U.S.
July 22, 2016 Skanska Six month report 2016 15
Infrastructure Development

July 22, 2016 Skanska Six month report 2016 16
Skanska: USD 70 M equity investment USD 2.8 billion construction contract
Term: 2016–2022 Construction 2016–2050 Operations
PPP model: Airline and retail revenue, limited market risk
Financing: Debt, equity and milestone payments by PANYNJ
Scope: New Central Terminal, Central Hall, West Parking garage, supporting infrastructure
LaGuardia Central Terminal Building B New York, U.S.

July 22, 2016 Skanska Six month report 2016 17
Skanska ID U.S. Potential Skanska Pipeline 2016–2020
OH
CA CO
NY
VA
MA
RI NJ
DE
States with PPP legislation
NM
WA
OR
CA
NV
UT
AZ
CO
WY
ID
MT ND
SD
NE
TX
OK
KS
IA
MN
WI MI
IL
MO
IN
KY
TN
AR
LA
OH PA
NY
VT NH
ME
WV VA
NC
SC
MS AL GA
FL
MD
CT
Pipeline
High Desert Corridor California
North South Corridor Arizona I-11 Corridor Project Phase 1 Arizona
LAX APM / CONRAC LA Streetcar California Sepulveda Pass Corridor California I-710 Corridor Project California
Cape Cod Crossing Massachusetts Newark Terminal A New Jersey Brent Spence Bridge Kentucky / Ohio
West Dade Waste Water Treatment Plant Florida
I-10 Mobile River Bridge Alabama
I-66 Virginia
I-70 Colorado

General − Challenge to acquire land in all home
markets except for Finland
Nordic countries − Sweden very strong. A more balanced
market with amortization regulations − Norway mixed, Oslo and Bergen good − Finland stable
Central Europe − Volumes and prices continue to
increase
BoKlok Lingonriset, Huddinge, Sweden
July 22, 2016 Skanska Six month report 2016 18
Market outlook Residential Development

General − Tenants and investors: Strong demand,
vacancy rates low − Brexit potentially positive impact
Nordic countries − High interest from investors and low
vacancy rates in Sweden especially
Central Europe − High demand in Poland and improving
in other parts of Central Europe
North America − Strong investor appetite and good
tenant demand Spark, Warsaw, Poland
July 22, 2016 Skanska Six month report 2016 19
Market outlook Commercial Property Development

Increased uncertainty impacts outlook
Nordic countries − Strong building market in Sweden,
stable in Norway, mixed in Finland − Strong civil market with fierce competition
in Norway and Sweden, Finland weak
Other European countries − UK building market likely to be impacted
by Brexit − Poland civil and building market impacted
by delays in EU funded projects
North America − The U.S. continues to be a good market,
but with fierce competition
July 22, 2016 Skanska Six month report 2016
Market outlook Construction
Orkla City, Oslo, Norway
20

All countries − Strong market for PPPs in the U.S.,
but competition is considerable − Norwegian market improving − Thin pipeline in the other markets
New Karolinska Solna, Stockholm, Sweden
July 22, 2016 Skanska Six month report 2016 21
Market outlook Infrastructure Development

July 22, 2016 Skanska Six month report 2016 22