cee investment report by skanska
TRANSCRIPT

Adrian KarczewiczTransaction DirectorSkanska Commercial Development [email protected]+48 797 229 782
CEEInvestmentReport
2015Rising Stars
CEE cities as the Rising Starsof the European office investment transaction market
www.propertyeu.info
Tomasz Puch National Director, Capital Markets
[email protected]+48 22 318 0000
Media partner
Paweł PanczyjManaging Director
[email protected]+48 600 904 877
Damian HarringtonRegional Director of ResearchEastern [email protected]+358400907972

About
Nicklas LindbergPresident of Skanska Commercial Development Europe
What if we gave global investors a "blind test"? How would they judge two office buildings, one located in western Europe and one located in central and eastern Europe (CEE), if those locations were concealed? Investors would have other data about each building, including a list of tenants, a description of the quality of construction, the major facts about the city in which it is located and where the building is located in it. Investors would also get forecasts about the local market and tenant behavior and the outlook for the building’s profitability. It is not a given that investors would all pick the western European building. Investments in CEE can be just as attractive or even more attractive to global investors, but they may be not so well known. This is a good moment to take a closer look at office buildings in CEE and the cities in which they are located to assess their potential. That is what our report is about. Read it to learn more about office building product in CEE.
We would like to thank Colliers International, JLL and sector organisation ABSL for helping us prepare this report. All of us and many independent experts contributed to it. Thanks to our partners’ experience and passion we have amassed the knowledge on this topic and identified an opportunity. It awaits investors in central and eastern European cities.
Skanska, JLL, Colliers International and the Association of Business Service Leaders (ABSL) together present this guide on the most attractive office investment locations in central and eastern Europe (CEE). The author-partners each brought their expert pedigree to the joint effort of preparing the report titled Rising Stars 2015. Skanska, one of the leading construction and development companies in the world, is the top builder and vendor of office buildings in CEE. JLL and Colliers International are the world’s two leading real estate consulting firms. ABSL is the biggest organisation in the region associating investors from the business services sector. Its member companies are the largest and most significant tenants of modern office space in CEE.
Rising Stars 2015 is a multi-dimensional analysis of the region’s potential, broken down by individual locations. These specific locations are the rising stars on the map of office building investments in Europe. The report also contains a set of recommendations on how best to create an investment product in the most absorbent markets within CEE. It says where one should invest and how. Warsaw, Prague, Cracow, or Bucharest? We hope you will enjoy our effort. 01 CEE on the global
investment transaction map
Introduction
Economic dataRegional transaction data in 2014Important trends
78
10
5
02 Rising Stars – cities attracting investmentScale of the market - investment volumes in the CEE regionCEE capitalsRegional cities in Poland
13
1419
03 Good investment product in CEEIntroduction: what investors wantKey conditionsCase studies
272834
Table of contents
Introduction - CEE Investment Report
2 2015 Rising Stars. CEE Investment Report
04 Business services: the growth engine of the CEE investment sales marketBusiness services centres are important to developers and investorsGrowth outlook for business services in CEE
39
41
4242
SummarySources
3

Figure 1Source: Colliers International, 2015
Europe CEE*
*Including Russia and Turkey
IntroductionEuropeaninvestment volumes
“There is money to be spent.” That is what anyone who attended a real estate market conference or tradeshow, such as EXPO or MIPIM in the second half of 2014 and early 2015 was saying. “Investors are looking for new opportunities.”They have not been this active since 2007, according to Skanska, the leader when it comes to divestment of quality office building in central and eastern Europe. The developer is getting a rapidly increasing number of queries about potential deals in the region from investors from Europe, the United States, the Middle East and Asia.
The value of total transactions on the global market is expected to rise by 5% to 10% in 2015, according to JLL, a global real estate advisory firm. That is compared to 2014, a high base. Total investment transactions could reach $740 billion to $760 billion. Investors are becoming more active thanks to the global economic recovery.1 There is a lot of capital on the market because of the robust recovery of the U.S. economy, low oil prices, and quantitative easing conducted by the U.S. Federal Reserve (although there is talk of interest-rate increases in the U.S.), the European Central Bank and the Bank of Japan. There is also a lot of capital because of the years of economic growth in India and China.2 Low interest rates make real estate one of the most attractive ways to grow one’s money. Global funds, with about $32 billion in assets under management, are visibly increasing their investment allocations in favour of real estate, according to Colliers International, a global commercial real estate consultancy. This, combined with the greater accessibility of credit and new investments by developers is extending the current bull market.3 The number of available, attractive investment products in the countries that top investors’ lists is limited. Prime investment products are now over-valued, according to 61% of respondents who answered a survey conducted by PwC and the Urban Land Institute.4 Investing in the West is becoming less and less profitable, forcing companies to consider allocating capital elsewhere, in less obvious but still stable places. According to these criteria, central and eastern Europe is attractive, especially Poland, the Czech Republic and Romania. This is a region benefiting from the safety that the European Union provides. It is stable and its people share western values. For many global investors, Bucharest, Budapest, Wroclaw and Poznan are relatively small points on a map. But investment products in these types of cities often yield a higher return, guaranteeing steady and long-term rental income. Prime yields in 2015 are a case in point as they could average 5.75-6% in Warsaw, 7.5% in Bucharest, 5.75-6% in Prague and 7% in Poznan, according to Skanska. Many cities in CEE are left out of global rankings because of their low transaction volumes. The experiences of those who have already entered markets in this part of the world show the multiplicity of opportunities for safe and profitable capital allocation. It is worth taking a closer look.
1 Global Market Perspective Q1 2015, JLL, 20152 Emerging Trends in Real Estate, A balancing act, Europe 2015, PwC, Urban Land Institute (ULI), 20153 How long will this property bull market last? EMEA, Investment Q1 2015, Colliers International, 20154 Emerging Trends in Real Estate, A balancing act, Europe 2015, PwC, Urban Land Institute (ULI), 2015
2015 Rising Stars. CEE Investment Report
Introduction - CEE Investment Report
4 5
2007 2008 2009 2010 2011 2012 2013 2014
300 EUR billion
200
100%
Euro
pe
100
0
Investmentvolumes
Est. officespace
GDP
CEE*
7%
CEE*
20%
CEE*
35%
For Skanska CDE, which operates in central and easternEurope, 2014 was an exceptionally successful year in termsof transactions. We sold a record-breaking nine officebuildings, giving Skanska CDE a leading position in theregion and accounting for over 50% of Skanska’s officetransactions worldwide. In 2015, our portfolio in the regionwill again grow with seven new projects.Adrian Karczewicz
Transaction Director at Skanska CDE

01CEE on the global investment transaction map
The economies of central and eastern Europe are expected to grow moderately, but in a stable manner inthe coming years. The European Commission forecasts that the gross domestic product (GDP) of the CzechRepublic will rise 2.5% this year, with economic growth in Hungary, Romania and Poland expected at 2.4%,2.7% and 3.2% respectively.5 In contrast, growth in Germany, France and Italy is forecast by the EuropeanCommission at 1.5%, 1% and 0.6% respectively. Emerging economies, including those in CEE, will play anexpanding role in the global economy, according to PwC.6 Meanwhile, McKinsey forecasts that by 2025,average economic growth in this region may rise to 4.6%, making CEE one of the growth engines of Europe asa whole.7
Economic stabilityIn most CEE countries since 2004, the ratio of public debt to GDP is less than 60%, local currencies are stable over the long term, with fluctuations in a maximum range of 15% versus the euro.7
Until 2020, CEE will be the recipient of a huge inflow of funds from the European Union. From 2016 to 2020, Poland alone will receive and spend more than EUR100 billion in structural funds.
Growing transparencyCEE countries are becoming more transparent, according to a global index that measures data disclosure in real estate. Romania, Serbia and Hungary were the leaders in transparency growth in Europe.8
5 European Economic Forecast, Winter 2015, European Economy 1/2015, European Commission, 20156 Global Annual Review, PwC, 20137 A new dawn: Reigniting growth in Central and Eastern Europe, McKinsey Global Institute, 20148 Real Estate Raises the Bar, Data Disclosure and Technology Lift Transparency Levels, Global Real Estate Transparency Index, JLL, 20149 2020 - Trends and perspectives for the next decade, Study, Roland Berger Strategy Consultants, 201010 CEE Special Report, Fixed Income, Erste Group Research, 2014
Economic data
The advantages of CEE include:Strategic locationThe people who live in CEE understand and share the culture of western Europe and western values in general. Most of the countries in the region are members of the European Union, which creates a broadly defined framework of stability and a secure environment for conducting business. The great powers of the world, especially the United States, Russia and China, are vying for influence over the region through capital flow.
Strong internal marketIn CEE, GDP per capita is currently 65% of the average of the EU-15 (Germany, France, Italy, the Netherlands, Belgium, Luxembourg, Denmark, Ireland, United Kingdom, Greece, Spain, Portugal, Austria, Finland and Sweden).10 Intra-CEE trade is increasing.9
Low costsThe average hourly wage in CEE is 75% lower than in the EU-15. In Bulgaria and Romania, it is a whopping 90% lower (Eurostat, 2015). Tax rates in CEE also tend to be lower, 18% on average versus 26% in the EU-15 and 22% in Asia. Foreign firms who invest in and establish businesses in CEE can expect tax breaks or other types of state support.7
A
»
»
»
Huge supply of high-quality labour The total population of CEE is more than 100 million* and 24% of workers in the region have university degrees. The high proportion of CEE residents who speak foreign languages, including English, German and Russian, is a competitive advantage of the entire region.9
»
»
»
»
2015 Rising Stars. CEE Investment Report
01 - CEE on the global investment transaction map
6 7
*excluding Russia and Turkey

Tomas Picha
The investment sales market in central and eastern Europe has been growing systematically for a few years. In 2014, the value of all investment transactions in the region hit EUR7.8 billion, according to JLL.11 That is about 25% higher than the total of EUR6.2 billion a year earlier. As in previous years, in terms of volumes, Poland and the Czech Republic were the leaders of a market that shows no signs of overheating, according to Colliers.12 In 2014, the values of markets in Romania, Bulgaria, the Czech Republic, Hungary and Latvia jumped by more than 50% versus 2013, according to the adviser.
Investment in real estate volumes growth, 2013 vs 2014
11 CEE Investment Market Pulse 2014, JLL, 201512 Opportunity Knocks for CEE?, Research & Forecast Report, Eastern Europe, Investment, Q1 2015, Colliers International, 2015
Regional transaction data in 2014
B
270% 160% 77% 71% 68% 61% 31% 2% 0%Romania Bulgaria Czech
RepublicSlovakia Hungary Latvia Lithuania Estonia Poland
Figure 2Source: Research & Forecast Report, Eastern Europe Investment, Q1 2015, Colliers International, 2015
The largest property acquisitions occurred in the office real estate segment. In 2014, investors acquired office buildings in CEE for a total of EUR3.2 billion, 40% of total real estate transactions in the region, according to JLL. Skanska was responsible for as much as 10% of all transactions in central and eastern Europe. In 2014, the developer sold nine office buildings for a deal value of more than EUR330 million. For Skanska, CEE accounts for more than 50% of all its global office market transactions. The company sees this region as one of the most promising.
Selected countries of the region– share of investment volumes 2014
41%
Figure 3Source: CEE Investment Market Pulse 2014, JLL, 2015
Poland7%Hungary
3%SEE
26%Czech Republic
15%Romania
8%Slovakia
01 - CEE on the global investment transaction map
2015 Rising Stars. CEE Investment Report8 9
Director, CEE Transactions at Invesco Real Estate.
We are seeing significant appetite for good quality assets, leased to strong tenants in CEE, especially in Poland and the Czech Republic.

CEE generates 20% of European GDP and contains 35% of the modern office space on the continent, according to analyses conducted by Colliers International. However, the region attracts only 7% of the total value of investment in Europe. Even taking into account the difference in the value of a square metre, which is 50% lower on average, and even lower compared with the average price of a square metre in the United Kingdom, Germany and France, the difference in volume is still significantly lower than can be expected. That’s because the CEE market is not well-known among investors, who often unfairly perceive this part of Europe as more risky than the West, according to Colliers.13 As funds become more open to pursuing ‘non-core’ strategies, this situation could change quickly. The investors who are already present in CEE are the best ambassadors for the region.
An underinvested region»
»
»»
CEE benefits from the growing interest of investors in second-choice locations as a way to diversify risk. This is visible in Poland, where regional metropolitan centres such as Cracow, Wroclaw, Katowice, Lodz, Poznan and Tricity (the Gdansk-Gdynia-Sopot agglomeration), are becoming increasingly attractive.14 In CEE countries other than Poland, investments in office buildings in major agglomerations outside capital cities are individual cases. This could change soon, according to market experts. Developers like Skanska, who always plan to sell the buildings they construct, are actively searching for new land acquisitions in these cities. The Warsaw and Prague markets are becoming similar to those in Madrid, Berlin, Amsterdam and Manchester in terms of size and scale, according to Colliers. Bucharest, Bratislava, Budapest and Sofia are located slightly higher on the risk curve, while Belgrade, Zagreb, Riga and Vilnius are still destinations reserved for opportunistic investors.15
Second–choice locationsThe conflict in Ukraine is having relatively little effect on the region. It is not stigmatising the rest of CEE at the moment. The potential exists for the conflict to escalate, for instance into the Baltics, posing a significant risk for investors over the next five years, though most experts agree this scenario is highly unlikely. In the mid-term, 10 to 20 years, CEE countries will face challenges which include educating and retaining highly-qualified workers and increasing innovation. These factors are all crucial in maintaining the region’s competitiveness. The long-term, 30 years into the future, is overshadowed by adverse demography. Populations in CEE, as in the rest of Europe, are forecast to age, adversely affecting the quality of the market, thus hindering the development of the market for office space. However, the countries in the region should be able to overcome all these obstacles if they take the appropriate action.20
Risks
German and Austrian funds are the most active in the region. However, investors from the U.S., the Middle East and Asia are allocating capital in CEE with increasing frequency.16 Noteworthy is the arrival of Chinese capital. Central and eastern Europe is a part of China’s new “Silk Road” policy, meaning the country considers it of strategic business importance.17 This is reflected in the Chinese construction of a new rail link between Belgrade and Budapest, for example, highlighting the appetite for Chinese investors in large infrastructure projects, in addition to taking a long-term position in their acquisition of real estate assets which can protect and grow value. The role of local funds is growing too.
Investing in office buildings in CEE cities is not the exclusive domain of opportunistic funds.18 For example, Skanska sold the Riverview office building in Prague to Invesco Real Estate and Dominikanski complex in Wroclaw to Union Investment. CEE is a good destination for investors planning long-term allocations, but an increasing number of entities focused on short-term investments are also appearing in the market. Funds that were present in the region and left in the wake of the financial crisis are returning to CEE.19
New investors
16 CEE Investment Market Pulse 2014, JLL, 201517 China’s New Silk Road Diplomacy, Policy Paper, PISM, 201318 Central and Eastern European Real Estate Market, Preqin, 201419 Research & Forecast Report, Eastern Europe Investment, Q1 2015, Colliers International, 201520 CEE Special Report, Fixed Income, Erste Group Research, 2014
13 Research & Forecast Report, Eastern Europe Investment, Q1 2015, Colliers International, 201514 CEE Investment Market Pulse 2014, JLL, 201515 Research & Forecast Report, Eastern Europe Investment, Q1 2015, Colliers International, 2015
Important trendsC
01 - CEE on the global investment transaction map
10 2015 Rising Stars. CEE Investment Report 11

– investment volumes in the CEE region02Rising Stars – cities attractinginvestment
Scale of the marketA
02 - Rising Stars – cities gaining investment in the CEE
Figure 4Source: JLL ,2015
Warsaw5 030 402 8801 640 466
Cracow347 608 370170 992
Katowice36 433 31617 343
Wroclaw282 926 000115 887
Prague*2 602 237 7841 168 972
Budapest893 710 167537 997
Tricity101 925 00062 462
Bucharest783 529 250394 664
Poznan12 650 0007 330
Lodz80 100 00043 500
12 2015 Rising Stars. CEE Investment Report 13
Office investment volume since 2010 (EUR)
*Including PPF office portfolio in different cities
Number of sq mtraded since 2010

Warsaw is the largest office market in the CEE region, with a total stock of 4.4 million sq m. It is also considered to be a major financial hub in this part of Europe and the busiest market in terms of investor activity.
The volume in 2014 was a record (since the peak in 2006) for office investment deals in Poland: EUR1.8 billion, of which EUR1.359 billion came from the Warsaw market. Last year saw two very important office deals: the acquisition by DeAWM of both Rondo 1 (66,000 sq m) and Metropolitan (38,000 sq m), which are considered to be the best prime office assets in Warsaw; and the purchase of Plac Unii (56,800 sq m, including retail) by Invesco. It is worth mentioning that 75% of the office investment volume in 2014 was spread across six office projects and the remaining 25% across 15 projects. Core and value-add transactions dominated, accounting for 70% and 22% of the investment structure respectively.
The volume of opportunistic transactions in Warsaw, with a market share of 9%, increased by 75% when compared with the previous year.
It is important to notice that last year a number of transactions slipped into 2015, or were initiated late in 2014, meaning that 2015 is expected to deliver strong results, benefiting from landmark deals across all sectors.
Due to the scale and the maturity of the market, high transparency, the presence of internationaltenants and the wide choice of assets available for sale, Warsaw will retain its leading position in terms of investor activity across CEE. We estimate that prime office yields will remain stable, at around 6.00–6.25%, with possible compression for unique assets (5.75%).
The overall investment volume for the Czech Republic in 2014 totaled more than EUR2 billion. Office investments in 2014 stood at just over EUR650 million, all of which was accounted for by Prague assets.
Demand for office projects in Prague has been very stable over the past few years, with the prime end of the market remaining the main focus of international institutions and capital. Non-core properties have started to become the domain of an increasing amount of domestic capital. In 2014, office investment activity was proportionally lower than historic levels, due to constrained supply and larger deals elsewhere.
Notable transactions included Praha City Centre, Florenc Office Centre (aka the KPMG building), Qubix Building and River Gardens I. The substantial pipeline carried into 2015 demonstrates that healthy competition for prime assets across all lot sizes is set to continue. Additionally, non-core and opportunistic activity registered significant increases, as the pricing delta to compressed prime yields improved the relative value of those assets.
CEE capitalsB
»
»
Gross take-up in Q1 2015 alone in Warsaw exceeded 168,000 sq m (against 612,400 sq m in the whole of 2014), continuing the strong performance seen in recent years. The positive sentiment in the leasing market is expected to continue for the rest of 2015.
Q1 saw a pause in the upward trend in Warsaw’s vacancy rate, which stabilised at 13.0% (15.5% in the CBD, 13.9% in the city centre fringe and 12.4% in non-central locations). However, we expect the rate will start to grow again as a result of the new office completions planned for delivery in Q2–Q4 2015 and 2016.
»
»
Prime headline rents in Warsaw city centre range between EUR22 and EUR24 / sq m / month. Non-central locations lease at EUR11 to EUR18.5 / sq m / month.
With a large amount of new office supply coming to the market and tenant demand expected to hold firm, rents are anticipated to come under downward pressure as 2015 progresses, especially in older, lower-quality offices.
»
»
Since 2000, office stock in Prague has tripled and by the end of 2014, it exceeded the 3 million sq m mark. Newly-built projects account for approximately 75% of the total stock, with 68% being found in A-class buildings.
In 2014, we saw an overall recovery in the Prague office market, from developers and tenants. The 2014 office supply of 145,000 sq m was the strongest since 2009 and gross take-up of more than 330,000 sq m represented the highest volume ever recorded in the Prague market.
»
»
Due to strong, mainly speculative, supply, the vacancy rate has increased significantly over the last 12 months, to the current level of 17.1%. Vacancy is expected to increase further throughout 2015, but mainly in older projects, as several large tenants will be relocating into newly-built premises.
Rental levels in Prague are some of the most stable in CEE, with only mild drops in prime headline rents found in the city centre in 2013 and 2014. With the increasing vacancy and very strong competition, rental conditions are becoming more attractive to tenants, who are able to negotiate more favourable incentives and contributions.
Peter HeckelsmüllerInvestment Manager,Deka Immobilien GmbH
Our transactions with Skanska, Atrium 1 in Warsaw and the City Green Court office building in Prague, are examples of successful investments in CEE.
Prague
Warsaw
02 - Rising Stars – cities gaining investment in the CEE
14 2015 Rising Stars. CEE Investment Report 15
– the most mature market

We expect another strong year in 2015, with several key office buildings in Bucharest currently under offer. The total potential for office volumes should remain close to the 2014 figures, with early expectations at around EUR320 to EUR350 million. Yields for prime office buildings have recently decreased by 25 bps to 7.75%. However, there is still a major pricing gap between Bucharest and the main CEE markets, with prime yield levels averaging more than 150 basis points higher than prime yields in Prague and Warsaw. With those markets heating up, more investors are starting to look further east and Bucharest, the largest city in CEE and one with very solid economic fundamentals, stands out as a key destination.
The property investment volume in Romania in 2014 was estimated to be EUR1.12 billion, the second highest annual figure ever recorded (after 2007) and representing an increase of 336% compared with 2013. The main drivers were retail (with approximately 46% of the total transactional activity) and offices (with 36.5%). Bucharest accounted for ca. 65% of the total investment volume in the country.Close to 60% of the total investment activity in the capital city was focused on office transactions, with Globalworth being the most active buyer on the market, accounting for more than 84% of the total office volume. The London Stock Exchange-listed investment fund purchased the BOB and BOC office buildings in the north of the city for EUR 152 million and Tower Center International, an office tower in the Bucharest CBD, for EUR58 million. Additionally in Q4, the fund announced the acquisition of Green Court Building A (the first office development by Skanska in Romania), Nusco Tower and the Unicredit HQ for a combined total of more than EUR130 million.
» The history of the Romanian office market started in the early 1990s and over the last 25 years, slightly more than 2.23 million sq m of office space has been completed in Bucharest.
» Annual supply in the last few years has been of 120,000 sq m, and the same amount of space is expected to be delivered in 2015.
» Take-up reached record levels (290,000 sq m to 300,000 sq m) in both 2013 and 2014, and net take-up is expected to improve on its current figure of almost half of all leasing activity, has spawned a new wave of confidence, with developers announcing an impressive number of new projects which will be delivered by the end 2016 (around 450,000 sq m).
» Demand is generated mainly by IT&C companies, BPOs & SSCs, which have aggressively expanded during the last three to four years, a trend which is expected to continue.
» At the end of 2014, the vacancy rate reached 13.3%, the lowest level in the last six years.
» Prime rental levels have been stable at EUR18.5 / sq m / month for the last two-and-a-half years and we do not expect any significant movements in the next 12 months.
Bucharest
02 - Rising Stars – cities gaining investment in the CEE
16 2015 Rising Stars. CEE Investment Report 17
Warsaw
Cracow
Wroclaw
Tricity
Katowice
Poznan
Lodz
Budapest
Prague
Bucharest
Office stock (000 sq m)
Gross take-up in 2014 (000 sq m)
Vacancy rate
Office space under construction (000sq m)
Prime headline rents in EUR / 000 sq m / month
Prime yields and forecast - end 2015
4,450
676
597
518
377
371
289
3,230
3,058
2,231
612
145
95
67
48
19
46
465
332
295
755
157
179
140
40
43
50
115
204
405
6%
6.25%
6.25%
7%
7.50%
7.25%
7.50%
7.25%
6%
7.75%
13.0%
6.2%
8.7%
10.1%
13.3%
23.3%
7.9%
15.7%
17.1%
13.4%
22-24 central 11.00 -18.50
non-central
13.90-14.50
14-14.50
12.75-13.50
12.50-13.75
14.00-15.00
11.50-12.50
20
19.50
18.50
Table 1Source: JLL, 2015
f 7.00%
f 5.75%

Focus on office sector in Poland
»
»
»
Regional cities in Poland
C
02 - Rising Stars – cities gaining investment in the CEE
2014 delivered the very strong result of EUR3.2 billion across all asset categories and just 8% below the exceptionally strong 2013 figure (which totaled EUR3.4 billion). The most important deals of 2014 included: the acquisitions by DeAWM of Rondo 1 and Metropolitan, both in Warsaw; Poznan City Center being bought by a consortium of Resolution and ECE Fund; the acquisition of Plac Unii by Invesco; a Ghelamco portfolio and Quattro Business Park being acquired by the Starwood Group; the Atrium 1 deal concluded by Deka; the acquisition of the AEW warehouse portfolio by PZU AM; the purchase of Focus Mall Bydgoszcz by Atrium European Real Estate; the Tristan/AEW Portfolio deal closed by SEGRO; and the acquisition by Blackstone/Logicor of Standard Life’s Polish logistics portfolio. All of those transactions were at or above the EUR100 million mark, proving the increased liquidity available for large-scale deals.
In the office sector, regional cities played a significant role, delivering more than EUR440 million of transactions. This was a record level and higher than the total volumes for the last five years combined in regional cities. The most outstanding regional city was Cracow, which saw transactions totalling EUR260 million, almost 60% of the entire regional office investment volume and more than the combined office deals in Cracow for the last seven years (EUR186 million). The second tier of regional cities, including Lodz, Poznan and Katowice, are quickly catching up with the front runners i.e. Cracow, Wroclaw and Tricity expected to remain the clear leaders.
18 2015 Rising Stars. CEE Investment Report 19
Hungary is experiencing a revival in its economic performance and real estate investment activity, which follows several years of poor performance amid the wider European and global financial climate.
Since 2013, the country’s major macro-economic indicators have improved notably and this has started to translate into real estate investment activity. Since the 2008 collapse of the investment market, the second highest annual investment volume was recorded in 2014, and the substantial pipeline of deals set to close in 2015 is a testament to the changing landscape.
In 2014, the total investment volume in the country reached EUR580 million, of which income producing assets represented around EUR450 million. Investor appetite for Hungarian assets has increased, due to improving market conditions and the attractive prices compared with Poland or the Czech Republic, making prime assets particularly attractive.
The first quarter of 2015 was especially active: the quarterly transaction volume reached EUR110 million. This is the highest first quarterly volume for the past four years.
Office assets were especially attractive to investors, accounting for approximately 43% of the quarterly total transaction volume. The most notable transactions in this sector included the sale of Vision Towers South to ERSTE Real Estate Open Ended Fund by Futureal.
As a result of improving general market sentiment and market fundamentals, yield compression is seen in the office sector. Based on the latest transactional evidence and market sentiment, the prime office yield stands at 7.25% and further compression is forecast for the upcoming quarters.
A modern stock of Class A and Class B buildings currently totals 2,587,000 sq m of speculatively built office space and a further 642,000 sq m of owner-occupied premises. With this volume, Budapest is the second largest office market in CEE, behind Warsaw.
Occupier activity had managed to gain in strength by 2014 and a record high annual gross take-up volume of 465,600 sq m was registered.
»» Developers remained cautious, and Budapest therefore has a very low-key office pipeline of only 115,000 sq m for the 2015–16 period.
» The vacancy rate stands at 15.7% in Q1 2015 and is on a rapidly declining path.
»» Since vacant modern office stock is now quickly absorbed in Budapest, rental conditions are getting less favourable for tenants and potential rental increases in Class A buildings are not impossible.
Budapest
Tomasz PuchHead of Office and Industrial Investment, JLL
Although it is naturally Warsaw that leads Poland's office investment market with the most spectacular deals, we have observed growing interest in regional cities. So far, the clear front-runners in terms of investment volumes were Cracow, Wroclaw and Tricity. We expect these locations to attract the most capital, with yields compressing across all of them. At the same time, other regional cities (Poznan, Lodz and Katowice), where tenant demand continues to grow, are expected to catch up very quickly with investors trying to benefit from more relaxed yield profiles.

Kirsten Felden
»
»
»
Prime headline rents are stable, after a 5% fall during 2014, and range from EUR14 to EUR14.5 / sq m / month.
» At present, almost 180,000 sq m of new office space is under active construction in Wroclaw (35% of which is secured by pre-let agreements). We expect that this year more than 90,000 sq m will be delivered to the market, including developments such as Dominikański (35,700 sq m) and West Gate (16,000 sq m), among others.
Wroclaw has continued to strengthen its position on Poland’s office map, hitting record-breaking levels of letting activity, which reached 95,400 sq m leased in 2014 (driven predominantly by BPO/SSC, which generated 81.5% of the demand).
» The current amount of modern office stock in Wroclaw is estimated at 597,000 sq m. The vacancy rate stands at 8.7%.
Senior Investment Manager Acquisitions & Sales CEE, Union Investment Real Estate
The potential of Polish regional cities is becoming increasingly recognised among international investors. Outside of Warsaw, Union Investment is already holding assets in Katowice, Cracow and Lodz, totalling some EUR600 million.
02 - Rising Stars – cities gaining investment in the CEE
20 2015 Rising Stars. CEE Investment Report 21
» The city has become the largest regional office market in Poland outside of Warsaw (stock of around 676,000 sq m).
» It stands out due to it having the combination of Poland's lowest nationwide vacancy rate (6.2%) for the eleventh consecutive quarter and the highest take-up volumes among regional cities (145,000 sq m in 2014), as well as strong construction activity (157,000 sq m, which is nearly a quarter of existing office stock).
» Cracow continues to establish its reputation as the leading Polish and European location for the global shoring and outsourcing services sector (almost 70% of demand in 2014 came from BPO/SSC companies).
» Prime headline rents range from EUR13.90 to EUR14.50 / sq m / month, still at a similar level to those in Wroclaw and non-central locations in Warsaw.
transactions reported in the last 18 months, including the disposal of Green Day and Dominikanski by Skanska and Aquarius Business House by Echo Investment. Prime office yields in Wroclaw are quoted at the level of 6.25%, with further compression possible for truly unique products offering an income profile with a WAULT in excess of 10 years.
The overall investment transaction volume for Wroclaw (almost EUR600 million) places the city second among the regional cities on the investment map of Poland. The market is considered to be very liquid and historically has drawn attention from key international and domestic investors, including DAWM, Deka, GLL, Union Investment, Octava FIZAN, PZU and Arka Fund. The investment activity here commenced in 2005 with the acquisition of Quattro Forum by Arka Fund from Archicom Group and has successfully continued over the years, with some spectacular
Wroclaw
more than all trades in the city over the seven previous years. The sale of Quattro Business Park is the largest office transaction ever finalised ina Polish regional city. Prime office yields in Cracow stand at the 6.25% mark, with an outlook of further compression for exceptional assets.
With a total investment volume of EUR635 million reported to date, Cracow is ranked number one among the Polish regional cities. Over the last 12 years, this key regional market has reported an impressive number of investment transactions (20) and has become the first entry point to regional Polish cities for many international players, including Invesco, Pramerica, Starwood Capital andAzora. Last year, an investment peak was reached in Cracow, with six office investment transactions being concluded there, which together totaled
Cracow

» Increased interest in the city from multinational corporations such as Accenture, Bosch, Infosys, Unicredit and Fujitsu has enabled Lodz to become one of the major office markets in Poland.
» In Q1 2015, modern office stock in Lodz amounted to almost 290,000 sq m, with a further 49,500 sq m under construction including Univeristy Business Park II (19,000 sq m) by GTC. Targowa 35 phase II (8,500 sq m) and Symetris Business Park I (8,600 sq m) by Echo Investment.
» 2014 was a record-breaking year for the city in terms of demand, with an outstanding 45,800 sq m of office space being leased throughout the year, due in large part to a 21,000 sq m deal by Infosys in Green Horizon.
» There has been a lot of improvement in terms of vacancy in Lodz: the rate fell from 19.1% in Q4 2011 to 7.9% in Q1 2015. That was partially a result of the limited new supply entering the market, however, the sound investment climate and increasing demand for office space also contributed to such a good result.
» Lodz is a competitive market in terms of prime headline rents, which range between EUR11.5 and EUR12.5 / sqm / month, the lowest figure for any major office market in Poland.
» Formerly a major centre for the Polish mining industry, it is now the fifth-ranked regional office market in Poland, offering around 377,000 sq m of modern office space for lease (of which 46% has been added to the market in the last five years).
» The vacancy rate in Katowice amounts to 13.3%, which is a result of recent extensive office development (around 75,000 sq m of office space has been completed over 2014-Q1 2015).
» The medium-term outlook remains tenant-favorable, with around 40,000 sq m under construction and a further 20,000 sq m to 30,000 sq m planned for delivery by the end of 2016.
» Prime headline rents in Katowice hold firm and as of the end of Q1 2015 varied from EUR12.50 to EUR13.75 / sq m / month.
» Between 2010 and today, letting activity has mostly come from global shoring and outsourcing services firms. Alongside newcomers to the city, such as, most recently, IBM, Sii and PERFORM, existing tenants are also looking to expand, demonstrating that demand continues to outstrip availability.
»
02 - Rising Stars – cities gaining investment in the CEE
22 2015 Rising Stars. CEE Investment Report 23
liquidity is to come to Lodz throughout 2015 and the market will pick up in terms of not only volumes, but also the number of deals. As a result of recent investment activity, prime office yields in Lodz changed to 7.50% from the 8.00% reported at the beginning of 2014.
Lodz saw its highest investment activity in 2006–08, with eight office schemes being acquired by MR2, Arka Fund, Catalyst Capital and SEB. Since 2009, the city has been largely overlooked by active investors, with Cracow, Wroclaw and Tricity catching wider audiences of investors. However, investment activity in Lodz has been picking up again since 2014, with two office schemes (Red Tower and Green Horizon) being acquired by institutional investors (Octava FIZAN and Griffin Group respectively). It is further expected that more
Lodz
Akron, Aviva and Starwood Capital have already noticed the competitive advantages of this market. It is expected that other investors will follow their example in the near future. Prime office yields here amount to 7.50%, which offers a premium not only compared with Warsaw, but also with other regional markets.
Katowice has so far been characterised by relatively small investment volumes. With almost EUR75 million invested in the last ten years, it ranks as sixth amongst Poland’s regional cities. However, the city has significant potential to catch up with the leading regional markets, mostly thanks to the quality of recently supplied office developments (such as Green Park, Silesia Business Park, GPP Business Park and A4 Business Park) and increasing take-up from the BPO/SSC companies, which open Katowice to a wider audience of investors.
Katowice
»
02 - Rising Stars – cities gaining investment in the CEE
24 2015 Rising Stars. CEE Investment Report 25
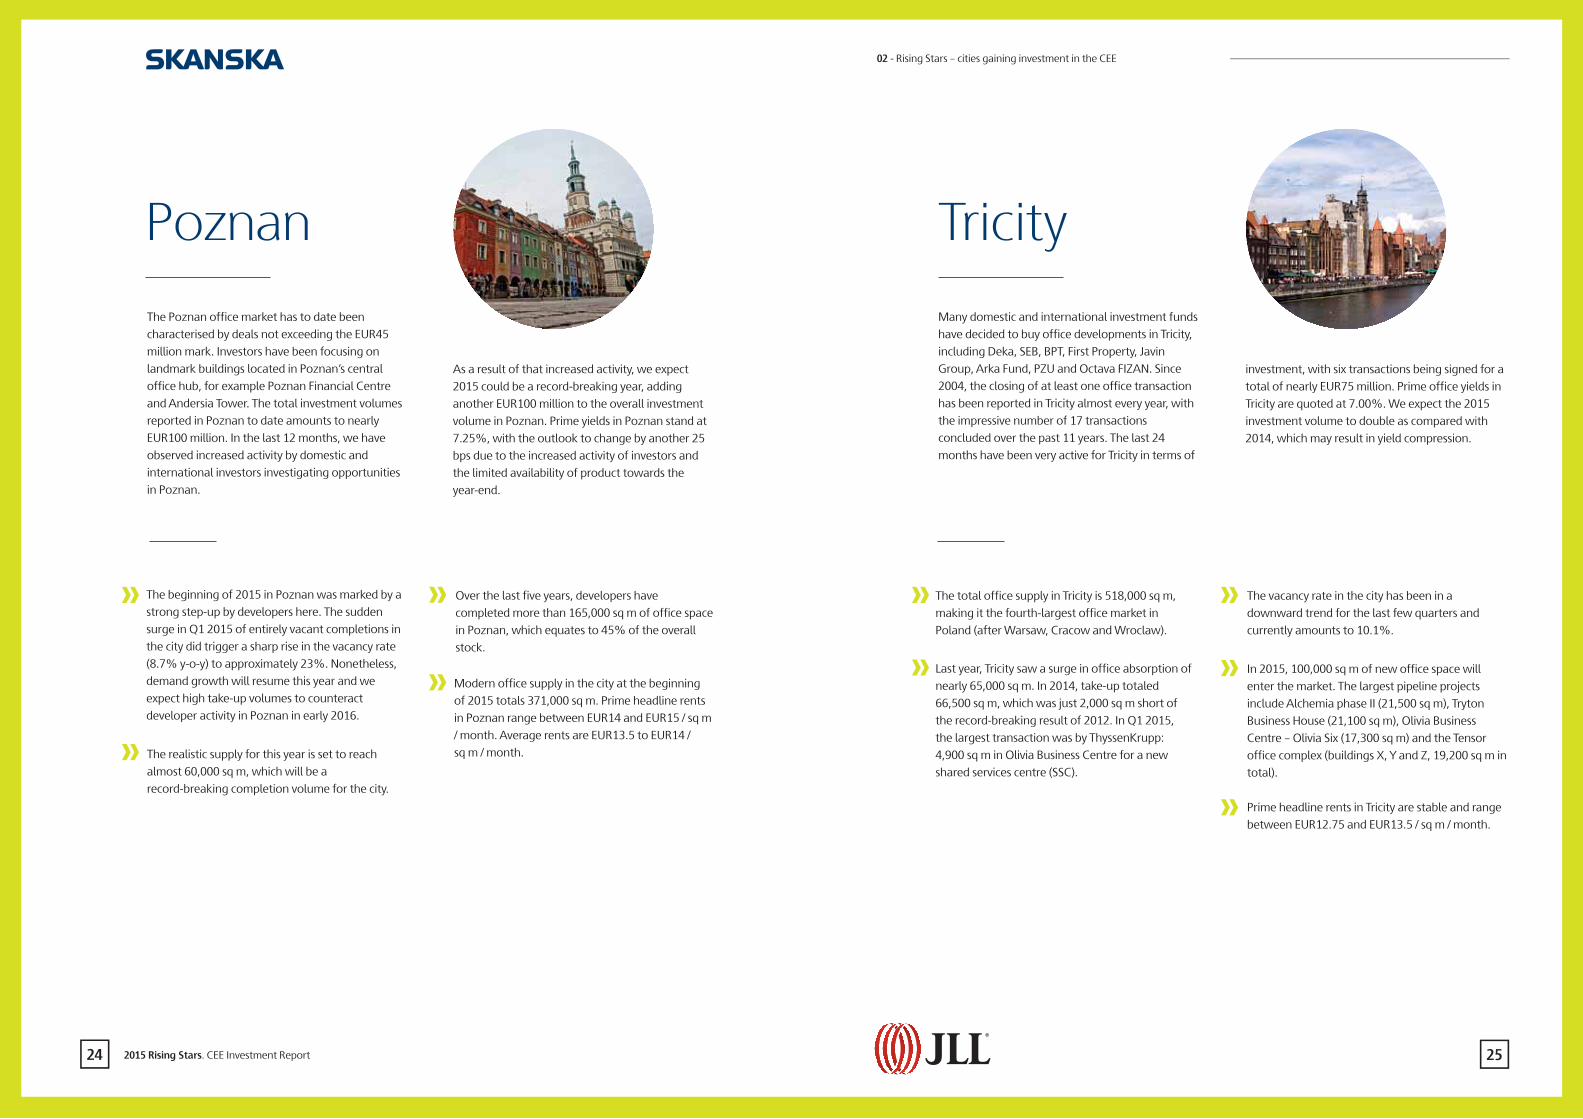
» The beginning of 2015 in Poznan was marked by a strong step-up by developers here. The sudden surge in Q1 2015 of entirely vacant completions in the city did trigger a sharp rise in the vacancy rate (8.7% y-o-y) to approximately 23%. Nonetheless, demand growth will resume this year and we expect high take-up volumes to counteract developer activity in Poznan in early 2016.
» The realistic supply for this year is set to reach almost 60,000 sq m, which will be a record-breaking completion volume for the city.
» Over the last five years, developers have completed more than 165,000 sq m of office space in Poznan, which equates to 45% of the overall stock.
» Modern office supply in the city at the beginning of 2015 totals 371,000 sq m. Prime headline rents in Poznan range between EUR14 and EUR15 / sq m / month. Average rents are EUR13.5 to EUR14 /sq m / month.
» The total office supply in Tricity is 518,000 sq m, making it the fourth-largest office market in Poland (after Warsaw, Cracow and Wroclaw).
» Last year, Tricity saw a surge in office absorption of nearly 65,000 sq m. In 2014, take-up totaled 66,500 sq m, which was just 2,000 sq m short of the record-breaking result of 2012. In Q1 2015, the largest transaction was by ThyssenKrupp: 4,900 sq m in Olivia Business Centre for a new shared services centre (SSC).
» The vacancy rate in the city has been in a downward trend for the last few quarters and currently amounts to 10.1%.
» Prime headline rents in Tricity are stable and range between EUR12.75 and EUR13.5 / sq m / month.
» In 2015, 100,000 sq m of new office space will enter the market. The largest pipeline projects include Alchemia phase II (21,500 sq m), Tryton Business House (21,100 sq m), Olivia Business Centre – Olivia Six (17,300 sq m) and the Tensor office complex (buildings X, Y and Z, 19,200 sq m in total).
investment, with six transactions being signed for a total of nearly EUR75 million. Prime office yields in Tricity are quoted at 7.00%. We expect the 2015 investment volume to double as compared with 2014, which may result in yield compression.
Many domestic and international investment funds have decided to buy office developments in Tricity, including Deka, SEB, BPT, First Property, Javin Group, Arka Fund, PZU and Octava FIZAN. Since 2004, the closing of at least one office transaction has been reported in Tricity almost every year, with the impressive number of 17 transactions concluded over the past 11 years. The last 24 months have been very active for Tricity in terms of
Tricity
As a result of that increased activity, we expect 2015 could be a record-breaking year, adding another EUR100 million to the overall investment volume in Poznan. Prime yields in Poznan stand at 7.25%, with the outlook to change by another 25 bps due to the increased activity of investors and the limited availability of product towards the year-end.
The Poznan office market has to date been characterised by deals not exceeding the EUR45 million mark. Investors have been focusing on landmark buildings located in Poznan’s central office hub, for example Poznan Financial Centre and Andersia Tower. The total investment volumes reported in Poznan to date amounts to nearly EUR100 million. In the last 12 months, we have observed increased activity by domestic and international investors investigating opportunities in Poznan.
Poznan

27
03Good investment product in CEE
What core investors want is typically a reflection of what core tenants/occupiers want. If occupiers are happy - occupying a building, renewing leases and paying rent - their landlord, unsurprisingly, will be happy too. So when an investor reviews opportunities, they look to satisfy a range of conditions which suits them and their clients. For the purposes of this chapter, we will touch on a few key areas to demonstrate how CEE markets operate to fulfil these critical conditions.
Introduction: what investors want
A
Key conditions
Market liquidity
Location
Institutional lease agreements
Building completed withoccupancy permit
Investment scale (EUR30 mln+)
Quality of tenants
Appropriate technical specification
Vendor condition
Market rents
Fully reconciled service charged
Fully leased building
Weighted Average Lease Term(WALT)
1
2
3
4
5
6
7
8
9
10
11
12
Importance ranking
Market Location OwnerBuildingspecific
Tenantrelated
03 - Good investment product in the CEE
26 2015 Rising Stars. CEE Investment Report
Table 2Source: Colliers International, 2015
pre-2000
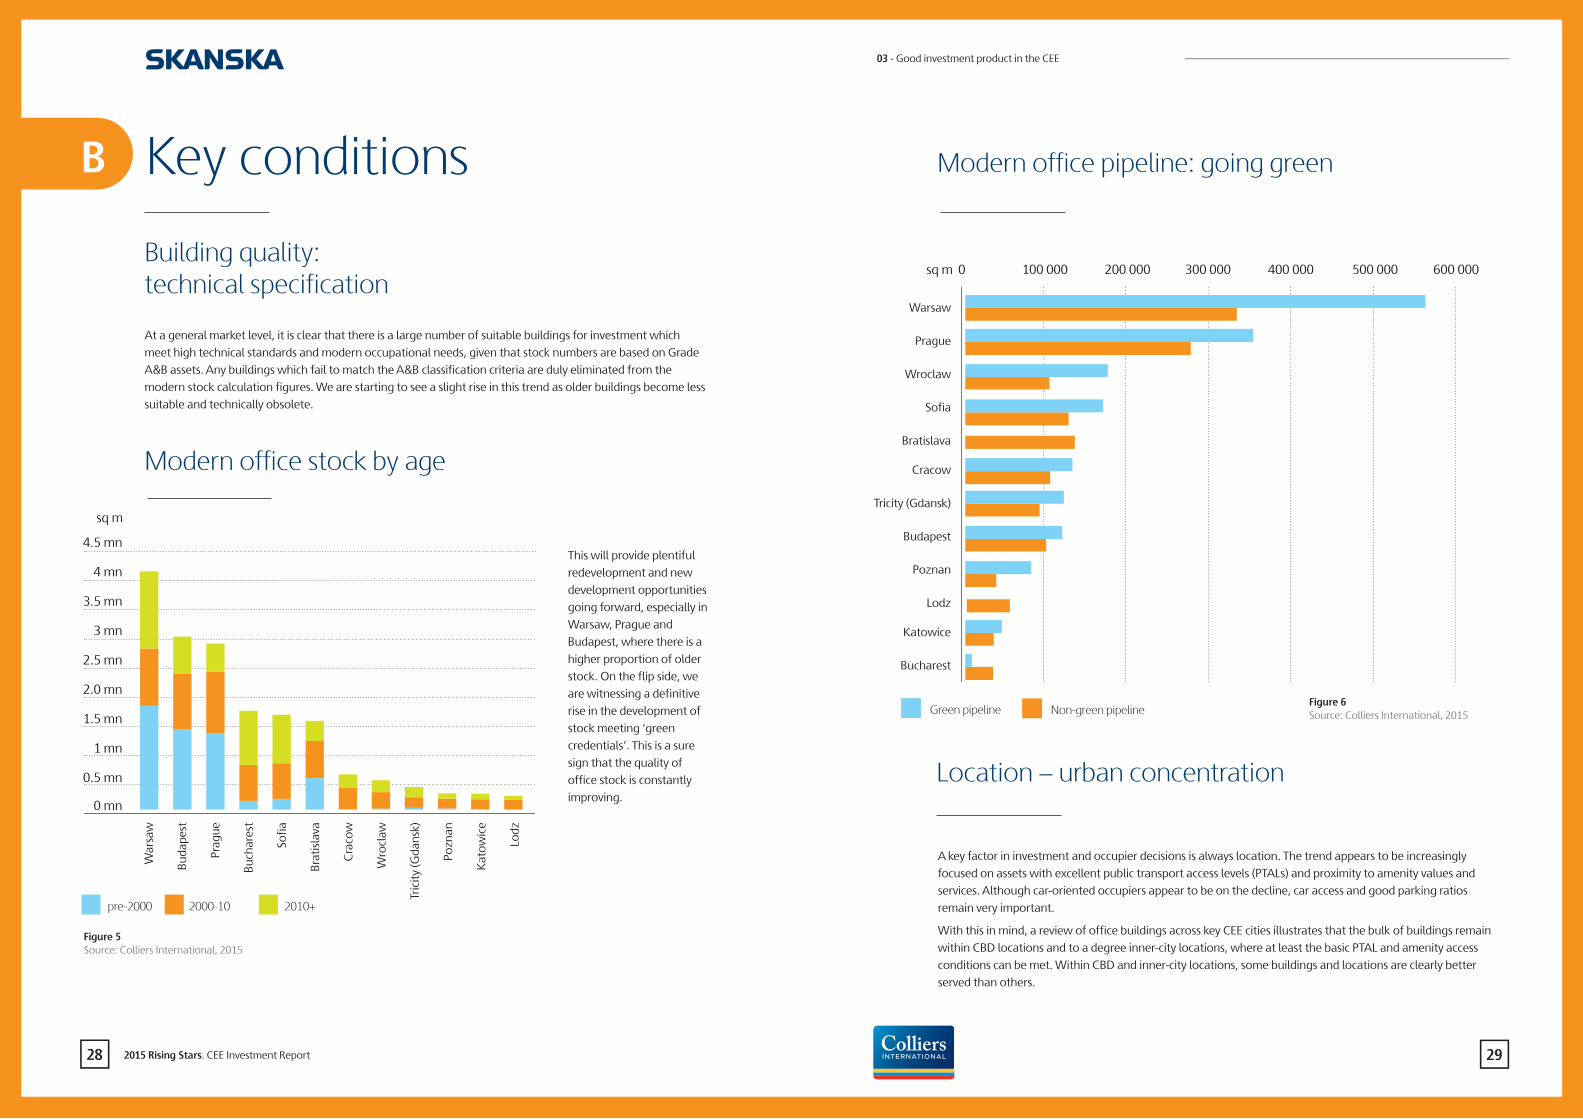
At a general market level, it is clear that there is a large number of suitable buildings for investment which meet high technical standards and modern occupational needs, given that stock numbers are based on Grade A&B assets. Any buildings which fail to match the A&B classification criteria are duly eliminated from the modern stock calculation figures. We are starting to see a slight rise in this trend as older buildings become less suitable and technically obsolete.
Modern office pipeline: going green
A key factor in investment and occupier decisions is always location. The trend appears to be increasingly focused on assets with excellent public transport access levels (PTALs) and proximity to amenity values and services. Although car-oriented occupiers appear to be on the decline, car access and good parking ratios remain very important.
With this in mind, a review of office buildings across key CEE cities illustrates that the bulk of buildings remain within CBD locations and to a degree inner-city locations, where at least the basic PTAL and amenity access conditions can be met. Within CBD and inner-city locations, some buildings and locations are clearly better served than others.
Location – urban concentration
0 sq m 100 000 200 000 300 000 400 000 500 000 600 000
Warsaw
Prague
Wroclaw
Sofia
Bratislava
Cracow
Tricity (Gdansk)
Budapest
Poznan
Lodz
Katowice
Bucharest
Green pipeline Non-green pipelineFigure 6Source: Colliers International, 2015
Key conditions
Building quality:technical specification
Modern office stock by age
This will provide plentiful redevelopment and new development opportunities going forward, especially in Warsaw, Prague and Budapest, where there is a higher proportion of older stock. On the flip side, we are witnessing a definitive rise in the development of stock meeting ‘green credentials’. This is a sure sign that the quality of office stock is constantly improving.
4.5 mn
4 mn
3.5 mn
3 mn
2.5 mn
2.0 mn
1.5 mn
1 mn
0.5 mn
0 mn
sq m
War
saw
Buda
pest
Prag
ue
Buch
ares
t
Sofia
Brat
isla
va
Cra
cow
Wro
claw
Tric
ity (G
dans
k)
Pozn
an
Kat
owic
e
Lodz
2010+2000-10
B
Figure 5Source: Colliers International, 2015
03 - Good investment product in the CEE
2928 2015 Rising Stars. CEE Investment Report
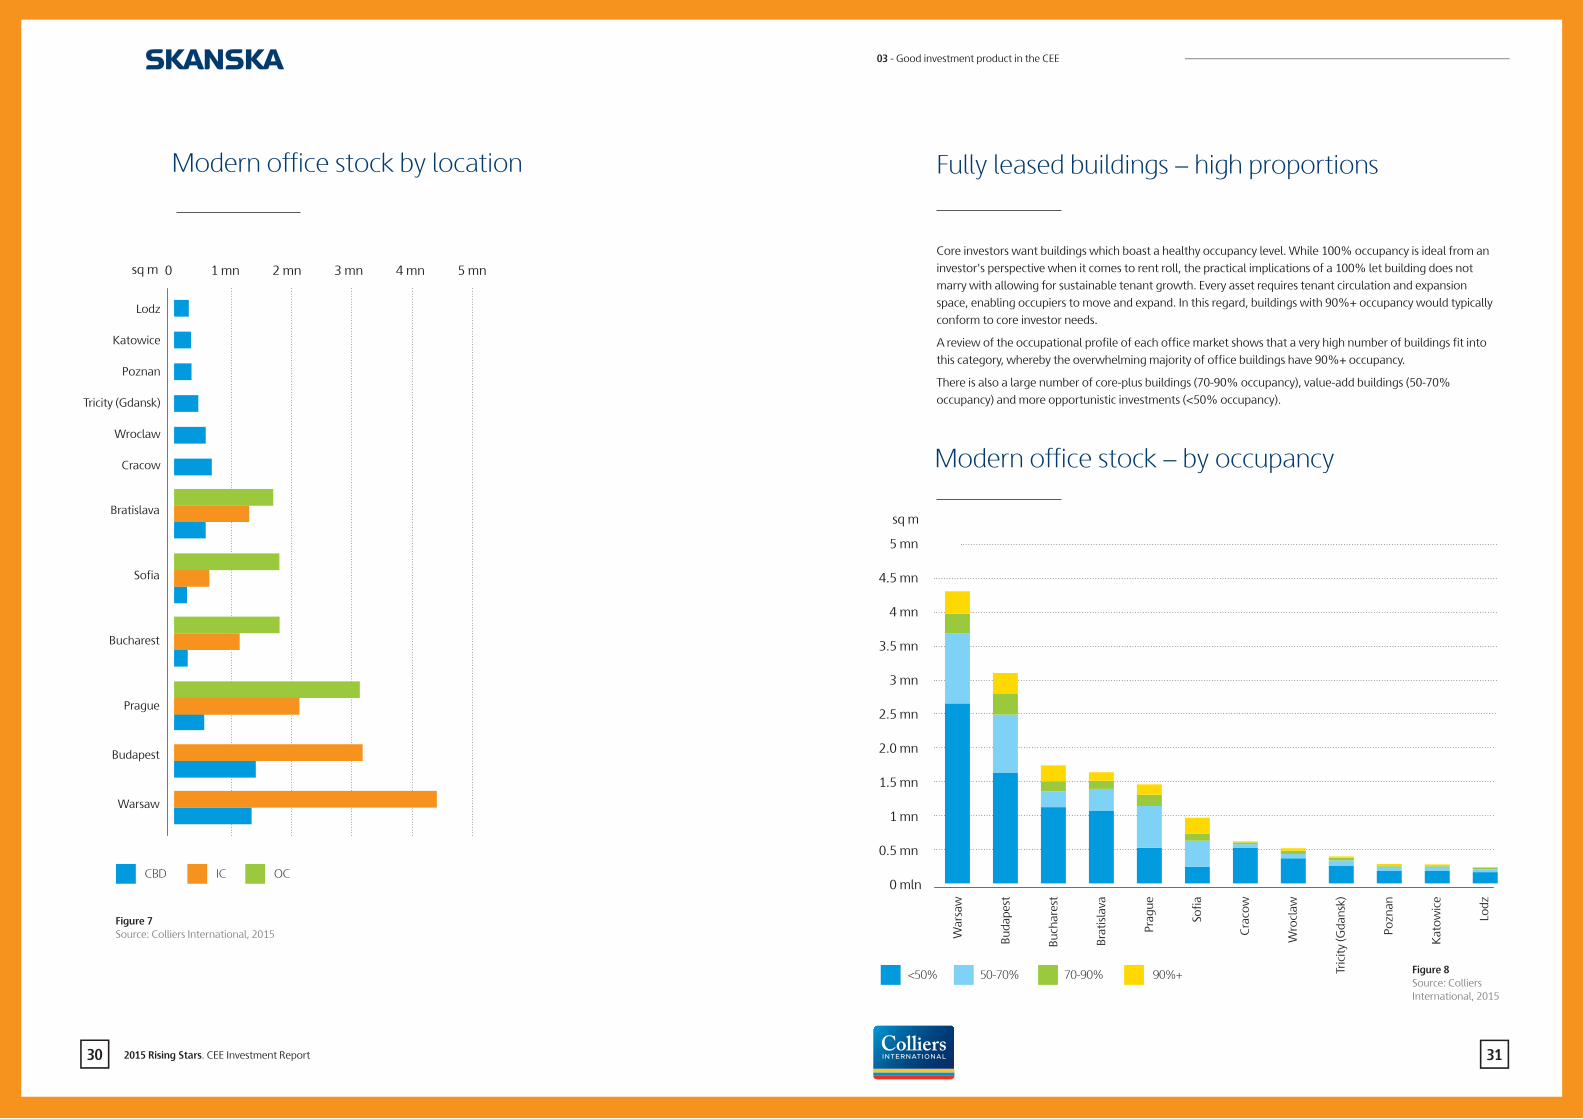
Modern office stock by location
sq m
03 - Good investment product in the CEE
3130 2015 Rising Stars. CEE Investment Report
0 1 mn 2 mn 3 mn 4 mn 5 mn
Figure 7Source: Colliers International, 2015
ICCBD OC
Bratislava
Sofia
Bucharest
Prague
Budapest
Warsaw
Lodz
Katowice
Poznan
Tricity (Gdansk)
Wroclaw
Cracow Modern office stock – by occupancy
Core investors want buildings which boast a healthy occupancy level. While 100% occupancy is ideal from an investor's perspective when it comes to rent roll, the practical implications of a 100% let building does not marry with allowing for sustainable tenant growth. Every asset requires tenant circulation and expansion space, enabling occupiers to move and expand. In this regard, buildings with 90%+ occupancy would typically conform to core investor needs.
A review of the occupational profile of each office market shows that a very high number of buildings fit into this category, whereby the overwhelming majority of office buildings have 90%+ occupancy.
There is also a large number of core-plus buildings (70-90% occupancy), value-add buildings (50-70% occupancy) and more opportunistic investments (<50% occupancy).
Fully leased buildings – high proportions
4.5 mn
5 mn
4 mn
3.5 mn
3 mn
2.5 mn
2.0 mn
1.5 mn
1 mn
0.5 mn
0 mln
War
saw
Buda
pest
Buch
ares
t
Brat
isla
va
Prag
ue
Sofia
Cra
cow
Wro
claw
Tric
ity (G
dans
k)
Pozn
an
Kat
owic
e
Lodz
70-90%50-70%<50% 90%+ Figure 8Source: Colliers International, 2015
sq m

Market liquidity – solid turnover
From a market liquidity perspective, CEE functions differently from many western European markets in terms of the range of international and local investors engaged in the market. Liquidity, however, is improving and in proportional terms is no different from other, more mature markets.
Market liquidity levels represented by Figures 9 and 10 are a measure of office investment volumes(in millions of euro), as a proportion of the capitalised value of the modern office stock in each city. If liquidity across Germany was around 6% in 2014, how do CEE cities compare?
Well, is the answer. In fact, the major capital CEE cities are trading at similar or even higher liquidity levels in the case of Warsaw, Prague and Bratislava. Bucharest, Budapest and Sofia are not far behind.
Results are less reliable/skewed in the smaller Polish regional cities, as one-off deals can distort market figures, but recent investment trading does underpin the growing popularity of Wroclaw, Cracow and Katowice in particular.
In Summary, CEE cities have a lot of the required fundamentals in place to drive continued investment and development activity. Demand for office space continues to grow, supporting this dynamic, especially from the offshoring and outsourcing requirements.
The product is often there, as the next set of case studies will show. The key, of course, is finding willing sellers.
Investment volumes
Sofia
Budapest
Bucharest
Bratislava
Prague
Warsaw
0% 2% 4% 6% 8% 10%
Annual turnover
Poznan
Lodz
Tricity (Gdansk)
Wroclaw
Cracow
Katowice
0% 20% 40% 60% 80% 100%
Figure 9Source: Colliers International, 2015
Figure 10Source: Colliers International, 2015
03 - Good investment product in the CEE
3332 2015 Rising Stars. CEE Investment Report
Damian HarringtonRegional Director of Research for Colliers International, Eastern Europe
The core CEE markets increasingly provide high-quality product to fit investor needs, on a par with product availability in the more mature EMEA markets. Although CEE may not compete at the highest level on lease length, it can certainly compete on risk adjusted pricing. Additionally, the robustness of economic growth is helping to drive office occupancy and core office product demand.

Case studies
Atrium 1
In order to provide strong examples of excellent core office product, we have produced a few case studies detailing the key features that make these assets desirable. It also highlights the level of quality available in CEE markets, a trend which is likely to rise as the office markets continue to evolve and mature.
C
Warsaw - Skanska
Risk Profile
Location
Visibility/Branding
Public Transport
Car Access
Technical Specification
Green Certification
Tenants
Leasing Status
Unexpired Lease Term
Cash Flow Currency
Lease Agreement Charges
Rent Sustainability
Asset Management Requirements
Investment Volume
Low
Core CBD
Excellent visibility for passing traffic, prominent corner
Situated on top of the metro station
Intersection of the most important traffic arteries of the city, ample underground parking
Grade A, tailored to a wide range of corporate occupiers
LEED Platinum
BZ WBK Bank (Banco Santander), Pramerica, Skanska, Bravura Solutions
100% leased
In excess of 8 years (as of the closing date)
EUR
Institutional-quality with full indexation, collateral and reconciliation of service charges
Passing rents at market level
Low
EUR94 million
Criteria Atrium 1 Position
03 - Good investment product in the CEE
3534 2015 Rising Stars. CEE Investment Report

Green DayWroclaw - Skanska
Risk Profile
Location
Visibility/Branding
Public Transport
Car Access
Technical Specification
Green Certification
Tenants
Leasing Status
Unexpired Lease Term
Cash Flow Currency
Lease Agreement Charges
Rent Sustainability
Asset Management Requirements
Investment Volume
Low
Core CBD
Great visibility for passing traffic, prominent corner emphasising the distinctive design of the building
Many options, including 2 tram lines and 8 bus lines with stops located infront of the building; central train station 2.3km from the building
Proximity to innercity ring road, with ample underground and surface parking
Grade A, tailored to a wide range of corporate occupiers
LEED Gold
Credit Suisse (single tenant), canteen
100% leased
10+ years
EUR
Institutional-quality with full indexation, collateral and reconciliation of service charges
Passing rents at market level
Low
EUR43 million (optimal for a regional city)
Criteria Green Day Position
3736 2015 Rising Stars. CEE Investment Report
03 - Good investment product in the CEE

04Business services: the growth engine of the CEE investment sales market
The business services industry’s fast pace of growth in central and eastern Europe has driven growth in other sectors over the last five years in the region. Markets that have benefited include office space leasing and commercial property investment sales. The outsourcing industry in this part of Europe has grown significantly compared to 2008-09, increasing their office space leasing volumes by 80%.21 These businesses are office-space hungry, driving growth of the modern office building market in CEE capitals, cities like Prague, Bucharest and Warsaw. But markets in regional cities have also benefited. These include Cracow, Brno, Liberec, Debrecen, Wroclaw and the Tricity agglomeration. Many of the office buildings that investors acquire in central and eastern Europe are nearly fully leased, and sometimes completely occupied, by business services centres. This type of business is expected to continue taking up new office space in the region in the coming years.
Eastern Europe is the best region in the world in terms of investment climate that is beneficial to investors, according to the World Bank’s "Doing Business 2013” report.22 PwC, the consultancy, confirms the World Bank’s findings. The cost of doing business in the region is similar to that in emerging markets in Asia, according to the adviser.23 The regulatory environment in CEE is transparent and governments support investors. Taken together, the result is that business services firms keep opening up centres in new cities in the region. From 2010 to 2014, 68% of outsourcing and offshoring companies (O&O) present in the region have opened locations in one new city, according to Colliers International. Over the same period, 19% of O&Os opened locations in two new cities and 15% opened locations in three additional cities.24 The market is getting mature and is highly absorbent.
Poland is still the first choice of most investors (30% of respondents) who want to locate businesses in CEE, according to a 2014 E&Y report.25 The Polish market is the place where, over the last few years, foreign investors in the business services sector have been most active. Till now, more than 500 centres have opened up in Poland, owned by global brands such as P&G, IBM, Carlsberg, HP, Accenture, Arla, Shell, Capgemini, Credit Suisse, UBS, Citi, Philips and IKEA. Foreign-owned business services centres now employ 150,000 people in Poland.26 As various sources indicate in Romania, the Czech Republic and Hungary, that figure is around 60,000, 55,000 and 25,000 respectively. In terms of square metres of office space leased by O&O companies in the region, nine Polish cities rank in the top 10.27
21 Outsourcing and Offshoring in CEE: A Rapidly Changing Landscape, White Paper, Q2 2014, Eastern Europe, Colliers International, 201422 Doing Business 2013, Smarter regulations for Small and Medium-Size Enterprises, The World Bank, 201323 Central and Eastern Europe Economic Scorecard, A sustainable future in a great region, PwC, 201324 Outsourcing and Offshoring in CEE: A Rapidly Changing Landscape, White Paper, Q2 2014, Eastern Europe, Colliers International, 201425 Back in the game, EY’s Attractiveness Survey, Europe 2014, EY, 201426 ABSL data27 Outsourcing and Offshoring in CEE: A Rapidly Changing Landscape, White Paper, Q2 2014, Eastern Europe, Colliers International, 2014
Business services centresare important to developers and investors
A
04 - Business services: the growth engine of the CEE investment sales market
3938 2015 Rising Stars. CEE Investment Report

The sector is fostering growth in smaller metropolitan areas
Investors want to know how much longer the business services sector will expand in CEE. Analysts say the sector is expected to experience stable growth over the next 10 years, adding that the market is becoming more mature. The already mature locations, Poland and the Czech Republic, will continue to stabilise and provide ever-more sophisticated services, making it harder to move a given service to a new, cheaper location. Centre locations are now more frequently determined by geographic distribution of human capital, the expert knowledge of local workers rather than simply low wages. Yet countries like Bulgaria and Romania are still emerging, which makes them more absorbent. They welcome new investors and are expected to grow for many years, fueled by low costs. In the region’s favour: physical proximity to western Europe, including a shared time zone, cultural similarity, the high proportion of the local population with knowledge of foreign languages and technology, and the lower cost of doing business. The sector is migrating an increasing number of business processes to CEE from western Europe, rather than moving them to e.g. culturally-foreign China.
In CEE, outsourcing companies often open centres in a country's second- and third-ranked cities, not just the capitals. The presence of business service centres in a given city in central and eastern Europe is a good indicator of the attractiveness of commercial property in that location. That is why Poznan, Wroclaw, or Brno may look like points on the map, but investments in these cities could be as attractive as in many western cities. This trend will accelerate. Over the next five years, business services centres located in regional cities rather than in central Europe’s capitals may become more important. In Poland, these will include the most mature locations e.g. Cracow and Tricity, but also smaller cities such as Bydgoszcz, Lublin and Radom. In the Czech Republic, the mature locations are Brno and Ostrava, but Liberec and Olomouc are now in contention for new centres. Smaller cities in Hungary include Székesfehervar and Pécs. In Slovakia, Romania and Bulgaria, these cities are Kosice, Timișoara and Varna respectively.
Over the next few years, the business services sector will grow faster than any other sector in Poland. Employment in the sector is forecast to increase by 15,000 to 20,000 people per year. In 2020, the sector could employ 250,000 people in the country, according to ABSL. But the figure could be even higher. If a more optimistic scenario occurrs and the government pushes through legislation beneficial to investors, it will enable them to provide services to international financial firms, including insurers and banks (BIFS). The second-fastest growth market for business services will be Romania. The Romanian business services sector is expected to employ 150,000 to 200,000 people by 2020. The Czech Republic is also expected to see growth, about 16% per year.
Growth outlook for business servicesin CEE
B
04 - Business services: the growth engine of the CEE investment sales market
4140 2015 Rising Stars. CEE Investment Report
Occupied stock - share of O&O business
Cracow
Lodz
Wroclaw
Szczecin
Katowice
Tricity
Poznan
Olsztyn
Lublin
Brno
Bucharest
Warsaw
Budapest
Bydgoszcz
Sofia
Prague
Bratislava
Vilnius
Riga
Belgrade
Kyiv
Tallinn
74%
67%
49%
43%
42%
38%
26%
26%
25%
23%
22%
18%
17%
16%
15%
14%
13%
12%
9%
8%
5%
4%Figure 11Source: Colliers International, 2015
Jacek LevernesPresident of ABSL
Thanks to cooperation between investors, authorities and educational institutions, in a few years Poland might join the group of the world's 20 most powerful economies. As Poland becomes bigger, it will be important for us to change our value position and attract more advanced business services. I do not think Poland will be able or should compete only on costs in the long run. We should compete on providing the best value. We have to be better, quicker and more innovative.

Summary
SourcesABSL, Business Services Sector in Poland, 2014Colliers International, How long will this property bull market last?, EMEA, Investment Q1 2015, 2015Colliers International, Outsourcing and Offshoring in CEE: A Rapidly Changing Landscape, White Paper, Q2 2014, Eastern Europe, 2014Colliers International, Opportunity Knocks for CEE?, Research & Forecast Report, Eastern Europe, Investment, Q1 2015, 2015Erste Group Research, 25 years after Communism, does CEE still hold key to growth? CEE Special Report, Fixed Income, CEE, 2014European Commission, European Economic Forecast, Winter 2015, EUROPEAN ECONOMY 1/2015, 2015EY, Back in the game, EY’s Attractiveness Survey, Europe 2014, 2014JLL, CEE Investment Market Pulse 2014, 2015JLL, Global Market Perspective Q1 2015, 2015JLL, Real Estate Raises the Bar, Data Disclosure and Technology Lift Transparency Levels, Global Real Estate Transparency Index, 2014McKinsey Global Institute, A new dawn: Reigniting growth in Central and Eastern Europe, 2014The Polish Institute of International Affairs (PISM), China’s New Silk Road Diplomacy, Justyna Szczudlik-Tatar, Policy Paper, 2013Preqin, Central and Eastern European Real Estate Market, 2014PwC, Central and Eastern Europe Economic Scorecard, A sustainable future in a great region, 2013PwC, Global Annual Review, 2013PwC, Urban Land Institute (ULI), Emerging Trends in Real Estate, A balancing act, Europe 2015, 2015Roland Berger Strategy Consultants, 2020 - Trends and perspectives for the next decade, Study, 2010The World Bank, Doing Business 2013, Smarter regulations for Small and Medium-Size Enterprises, 2013
In the first quarter of 2015, the value of investment transactions completed in the CEE commercial real estate market reached nearly EUR1.44 billion, according to JLL’s estimates. Analysis conducted by Colliers International confirms that this is one of the most promising regions in terms of flows of foreign direct investment and the value of investment transactions in the office building segment. Especially attractive is the Czech Republic, with its capital Prague, which can be considered to be a mature market at this point. Poland, on the other hand, has more so-called "second choice" cities in addition to stable and secure Warsaw. These secondary cities are particularly absorbent. Developers like Skanska are building what they consider to be secure alternatives outside the Polish capital, in places like Katowice, Lodz and Poznan.
Romania, and mainly its capital Bucharest, is also in play. In 2014, the value of investments in Romania jumped 270% from a year earlier, according to data from Colliers International. Investments in Hungary, including its capital Budapest, rose 68%. Romania especially has a chance to see a fast pace of growth and increased attractiveness to investors, thanks to the expected flow of billions of euro worth of European Union structural funds that the country is expected to receive from the European Commission’s 2014-20 budget, which are to help poorer countries catch up with older EU member states. Regardless of whichever country in the region will enjoy the largest increase in transaction value, there is no doubt that CEE will become the beneficiary of investor attention in the coming years. Investors agree that this corner of the world has some of the best business fundamentals worldwide. It is worth taking the time to look for good investment products there, products that guarantee high returns on investment and an optimal tenant structure.
1.2.3.
4.
5.
6.7.8.9.
10.
11.12.
13.14.15.16.17.18.
4342 2015 Rising Stars. CEE Investment Report
2015 Rising Stars. CEE Investment Report