size effect in the shear–coupled migration of tilt
TRANSCRIPT

SIZE EFFECT IN THE SHEAR–COUPLED MIGRATION OF TILT BOUNDARIES WITH INTERGRANULAR NANOCRACKS
A. Irastorza, A. Luque, J. Aldazabal, J.M. Martínez–Esnaola, J. Gil Sevillano
CEIT and TECNUN (University of Navarra). Paseo Manuel de Lardizábal 15, 20018 San Sebastián. Spain.
E–mail: [email protected]. Phone: +34 943212800. Fax: +34 943213076.
ABSTRACT In this work, we present molecular dynamics simulations of the shear–coupled migration behaviour of symmetrical tilt boundaries Σ17(530) perturbed by the presence of nanocracks lying on the grain boundary. The simulations were performed for copper bicrystals at 300 K. The focus has been on the study of crack size effects. The simulations were carried out using the embedded atom method with temperature control. Systems of constant width, X, and different crack sizes, 2a, were generated at 0 K. The ratio 2a/X characterizes the system. Periodic boundary conditions were set along the direction of application of the load and the tilt axis. After relaxation, the virtual shear of the bicrystals was carried out at a constant rate of 108 s–1. The response of the cracked specimens can be divided into: (i) shear–coupled migration of the grain boundary with increasing applied shear stress, (ii) intergranular propagation of the crack and (iii) emission of dislocations and closing of the grain boundary dislocation loop. KEY WORDS: Copper, molecular dynamics, shear–coupled migration, nanocracks, mode II loading.
1. INTRODUCTION Shear–coupled migration (SCM) [1–10] has been recognized as a particular plastic strain mechanism that can complement or compete with other plastic mechanisms available to polycrystals: dislocation–mediated slips, grain boundary (GB) sliding, twinning… Conservative SCM of pure tilt boundaries is diffusionless and occurs by collective atomic motion without recourse to long–range diffusion. The process is thermally activated but can take place at low temperatures. In fact, at these temperatures, it can be the dominant shear–driven GB migration mechanism. The SCM phenomenon implies that, as a consequence of the applied shear stress, τ, the GB shows two types of motions, which are depicted in Figure 1. The first one is the sliding of the GB, a movement parallel to the plane containing the boundary and characterized by the GB sliding velocity, v//. The second one is the migration of the GB, a movement perpendicular to the plane that contains the boundary and characterized by the GB migration velocity, vn.
vn v//
τ
GB
GB
(b) (a) Figure 1. SCM phenomenon in a planar boundary of a free bicrystal: (a) initial configuration and (b) after the application of a shear stress. The dotted fiducial lines permit following the response of the bicrystal [6]. The effectiveness of the applied shear stress in the SCM phenomenon can be characterized in terms of the shear
coupling factor, β, defined as
n
//
vv
=β (1)
Some authors [6] have proposed a geometrical model based on the dislocation content of the symmetrical tilt boundary which permits obtaining β in terms of the GB misorientation, ϕ, as
⎟⎠⎞
⎜⎝⎛ ϕ
=β2
tan2 (2.a)
⎟⎠⎞
⎜⎝⎛ ϕ
−π
−=β24
tan2 (2.b)
Equation 2.a applies to low misorientations (ϕ < 35º–40º) and produces a “positive” coupling between the applied shear stress and the GB migration (GB moving upwards when τ is applied to the right). Equation 2.b applies to high misorientations and produces a “negative” coupling, this is, the GB migration occurs in the opposite sense compared to “positive” coupling. The current burst of interest on SCM is due to its active role in the mechanical behaviour of nanograined materials and in the structural changes taking place in such materials when subjected to stress at low temperatures. Some examples of this are load around crack tips, grain growth during nanoindentation and fatigue [11]. SCM requires high resolved shear stresses that cannot be reached in polycrystals with conventional grain size. Therefore, a good understanding and mastering of SCM in nanostructured materials is essential to warrant their structural stability. In this work, we present molecular dynamics (MD) simulations of the SCM behaviour of the symmetrical

tilt boundary Σ17(530) perturbed by the presence of nanocracks lying on the GB. The simulations have been performed for copper bicrystals at 300 K. We have compared the behaviour of a perfect boundary with the behaviour of a GB presenting nanocracks and the crack size effect on this kind of systems. 2. SIMULATION CHARACTERISTICS 2.1. Molecular dynamics technique The MD technique used for these atomistic simulations was the embedded atom method (EAM) [12,13]. The potentials that we have used in this EAM approach correspond to copper [14]. Further details of both this MD technique and these potentials can be found elsewhere [15,16]. It is particularly important to mention that the cut–off radius, rcut, of the atomic interactions is 0.55 nm. For the numerical integration of the motion equations, the time increment, ∆t, equals 2.5×10⁻¹⁵ s. The Nosé–Hoover thermostat [17,18] was implemented to control the system temperature, T, which, in this case, equals 300 K. 2.2. The Σ17(530) tilt boundary In this work, the generated bicrystals present a symmetrical tilt boundary Σ17(530)/[001]. Σ is the relationship between the number of lattice points in a unit cell of the generating lattice and the number of lattice points in a unit cell of the coincidence site lattice (CSL). The first Miller indices after Σ17, namely (530), indicate the plane where the GB lies and correspond to the y axis. The following Miller indices, namely [001], are the tilt axis and correspond to the –z direction. In these simulations, the crack is contained in the plane (530) and the crack tip lies on the [001] direction. The symmetrical tilt boundary Σ17(530) corresponds to a high–angle misorientation of ϕ = 61.9º. According to Equation 2.b, this misorientation yields a shear coupling factor of β = –0.5 for the case of a planar free GB. 2.3. Specimen generation and test features
[001]
Crack GB
2a
X
[530]
[350]
Y
Figure 2. Initial configuration of the cracked copper bicrystals presenting a symmetrical tilt boundary Σ17(530). The case of 2a/X = 1/3 is shown.
The uncracked and cracked bicrystals were constructed at 0 K. For both types of samples, the number of specimens is three. For the uncracked samples, the X dimension is 4.2 nm, 10.6 nm or 14.9 nm. The Y dimension is 8.4 nm, 21.1 nm or 29.2 nm. In all cases, the Z dimension is 2.2 nm. In the case of the cracked specimens, sample dimensions are 10.6 nm × 2.2 nm × 21.1 nm. Nanocracks were formed by removing the atoms located in a band of 0.55 nm of thickness, centred in the GB, along 1/2, 1/3 and 1/4 of the specimen size along the x axis. Thus, 2a/X equals 1/2, 1/3 and 1/4 (see Figure 2). After generation of the bicrystals, the samples were relaxed to let the GB acquire a metastable configuration. The relaxation process proceeded at 0 K during 5 ps. Then, the temperature was increased linearly up to 300 K during 7.5 ps. Finally, the samples were kept at 300 K for 12.5 ps. Surface tension lead to some global and local geometrical distortion of the initial shape (particularly, at the crack tip). After relaxation, two rigid zones of 0.55 nm of thickness were set in the upper and lower layers of the sample. During the simulations, carried out under displacement control, the lower layer remained fixed, whereas the upper rigid zone was displaced along the x axis at constant speed of v// ≈ 2.1 m s–1. This corresponds to a shear strain rate, γ& , of 108 s–1. The rest of the atoms of the system can freely move. Periodic boundary conditions were set along the x and z axes. Thus, the specimens are in fact periodically cracked samples, as shown in Figure 2. The imposed shear displacement and the resulting required force were stored during the simulations, in order to compute the shear stress vs. shear strain τ–γ curves. Atomic positions were also periodically stored to analyze any structural changes (GB migration and slip, dislocation nucleation and emission, crack propagation) [19]. 3. RESULTS AND DISCUSSION Before presenting the results of these simulations, we will briefly explain the method used for the calculation of the applied stress. The applied (global) stress tensor, σ∞, can be computed through the virial expression [20]:
∑ ∑= ≠
∞ ⎟⎟⎠
⎞⎜⎜⎝
⎛⊗−⊗=
N
i ijijijiim
V 1 211 frvvσ (3)
where V is the system volume, m is the atomic mass, vi is the velocity of atom i, rij is the distance vector between atoms i and j and fij is the force between these two atoms. The result of the tensor product a ⊗ b is a matrix C such that Cαβ = aα·bβ (α, β = x, y, z). Thus, the applied shear stress τ corresponds to the term τxy of the

stress tensor σ∞. The virial theorem is generally applied to each atom to get a local stress tensor. However, some authors have developed a more accurate way of representing local stresses [21,22]:
( ) ( )⎟⎟⎠
⎞⎜⎜⎝
⎛⊗λ−⊗Λ
Ω= ∑
≠ijijijijiii m frvvσ
211 (4)
where Ω is the volume of some representative partition element, Λi equals 1 if atom i is within the volume element and 0 otherwise, and λij is the fraction of the length of the bond between atoms i and j lying within the volume element. In this work, we have chosen the volume element to be a sphere of radius equal to the copper lattice parameter, a = 0.36 nm, centred on each atom. Therefore, each σ can be associated to the local stress at the position of the central atom. 3.1. Uncracked samples Figure 3 shows the τ–γ responses for the three uncracked bicrystals simulated at 300 K. The discussion of the main results corresponding to the uncracked configuration of the symmetrical tilt boundary Σ17(530) can be found elsewhere [11,23]. However, it is important to note that: • The negative coupling is observed: the GB migrates
downwards when the shear stress is applied to the right. A shear coupling factor β ≈ –0.5 is computed.
• The slopes of the intermittent elastic loading stages are very similar to the elastic shear modulus, namely G = 27.3 GPa, for a single crystal with the same orientation as the samples and considering the elastic anisotropy of copper [24,25].
• The SCM is associated to a stick–slip phenomenon characterized by the overcoming of a critical value of applied shear stress, namely τc ≈ 0.4 GPa [26].
Figure 3. Shear stress, τ, vs. shear strain, γ, curves at 300 K of the uncracked copper bicrystals presenting a symmetrical tilt boundary Σ17(530). 3.2. Cracked samples Figure 4 shows the τ–γ responses for the three cracked bicrystals simulated at 300 K. Besides, Table 1 summarizes some relevant mechanical properties of
these samples: shear modulus, G, shear stress and shear strain for crack propagation, τprop and γprop, respectively, maximum applied shear stress, τmax, and shear strain at the maximum shear stress, γmax. The first thing that we can observe in Figure 4 is that the presence of cracks significantly affects their mechanical response. Surprisingly, the cracked samples are strengthened by the intergranular cracks. In the following sections, we detail and explain this behaviour.
Figure 4. Shear stress, τ, vs. shear strain, γ, curves at 300 K of the cracked copper bicrystals presenting a symmetrical tilt boundary Σ17(530). Table 1. Summary of the mechanical properties of the cracked copper bicrystals presenting a symmetrical tilt boundary Σ17(530) at 300 K.
(1) 2a/X = 1/2
(2) 2a/X = 1/3
(3) 2a/X = 1/4
G (GPa) 24.3 26.3 28.6
τprop (GPa) 0.93 1.24 –
γprop @ τprop 0.055 0.073 –
τmax (GPa) 1.35 2.04 2.29
γmax @ τmax 0.096 0.111 0.119 3.2.1. SCM behaviour Figure 4 shows that the cracked samples behave as uncracked specimens do [11,23]. This is, they behave elastically, with G values summarized in Table 1, and when a critical value of τ is overcome, the SCM of the GB occurs, with the same stick–slip behaviour. This is the main deformation mechanism while γ < 0.05–0.07. Unlike the uncracked samples, the applied shear stress does not remain at a low level. It needs to be increased for producing further deformation of the cracked sample. This is caused by the intergranular cracks which pin the GB [27,28]. Thus, the SCM can only take place away from the crack tips and that makes the GB to bow out (downwards, as β < 0; see Figure 5.a). The misorientation between the GB and the crack tip progressively increases and, therefore, further GB migration becomes more and more complicated [11].

(a)
(b)
Figure 5. Detail of the cracked copper bicrystal (2a/X = 1/3) presenting a symmetrical tilt boundary Σ17(530) at 300 K with (a) γ = 0.071 (the GB bows out), and (b) γ = 0.11 (the crack propagates, the GB keeps on migrating). 3.2.2. Crack propagation When the angle formed by the GB and the crack plane is ~31º, a different deformation mechanism activates. The propagation of the crack through the GB can be observed. That occurs at γ = 0.055 and γ = 0.073 for the samples with 2a/X = 1/2 and 2a/X = 1/3, respectively. However, it does not take place in the sample with 2a/X = 1/4. Therefore, there must also be a significant contribution of the crack length (the 2a/X ratio) and the stress concentration at the crack plane. As shown in Figure 5.b, the crack opening close to the crack tip produces different events of intergranular fracture along the GB when it lies on a (100) plane, indicating a possible ductile fracture. Further crack propagation is hindered and the SCM mechanism is enabled again.
~31º
2
1
3
(r,θ)
(a) (b)
(c) (d)
3.00 GPa -3.00 GPa
Figure 6. (a) Local coordinate system for the crack study [29]. (b) σ1, (c) τ12 and (d) σ2, for the cracked copper bicrystal (2a/X = 1/3) presenting a symmetrical tilt boundary Σ17(530) with γ = 0.074 at 300 K.
We are going to analyse the stress distribution ahead of the crack front (θ = 0), too. For that, we first calculate the local stress associated to the atoms, according to Equation 4. However, we have already mentioned that the crack advances at a particular angle. Therefore, we have to rotate the obtained stress tensor to a coordinate system as the one depicted in Figure 6. This coordinate system is such that the crack propagation occurs along the 1 direction. Note that, in all of the cases, the components τ13, τ23 and τ33 of the local stress tensor, are nearly zero or small compared with the other stress terms. Therefore, they are not presented here. The rest of stress terms are shown in Figure 6. Figure 7 shows the stress distribution ahead of the crack for the samples which showed crack propagation.
(a)
(b)
Figure 7. Stress distribution as a function of the distance to the crack tip, r: (a) 2a/X = 1/2 and (b) 2a/X = 1/3, at the corresponding γprop (see Table 1). The power–law fits of σ2, namely σ2 ∝ r–1/2, are also shown. In Figure 7, for each simulation, two different groups of data have been collected: the data series labelled “Up” refer to atoms just above the (100) plane (the crack propagation plane) and lying along the [010] direction, and the label “Down” refers to atoms just below the (001) plane and lying along [010]. Note that the curves depicted in Figure 7 represent the values of σ1, τ12 and σ2, averaged along the z axis, at different distances from the crack tip, r. However, it should also be reminded that, connaturally to the atomistic simulations, the position of the “crack tip” is not well defined, and that concepts such as “sharp crack” have no sense here. However, the position of crack tip can be bounded in the plane of the crack propagation. For this reason, the origin of the distances to the crack tip has been
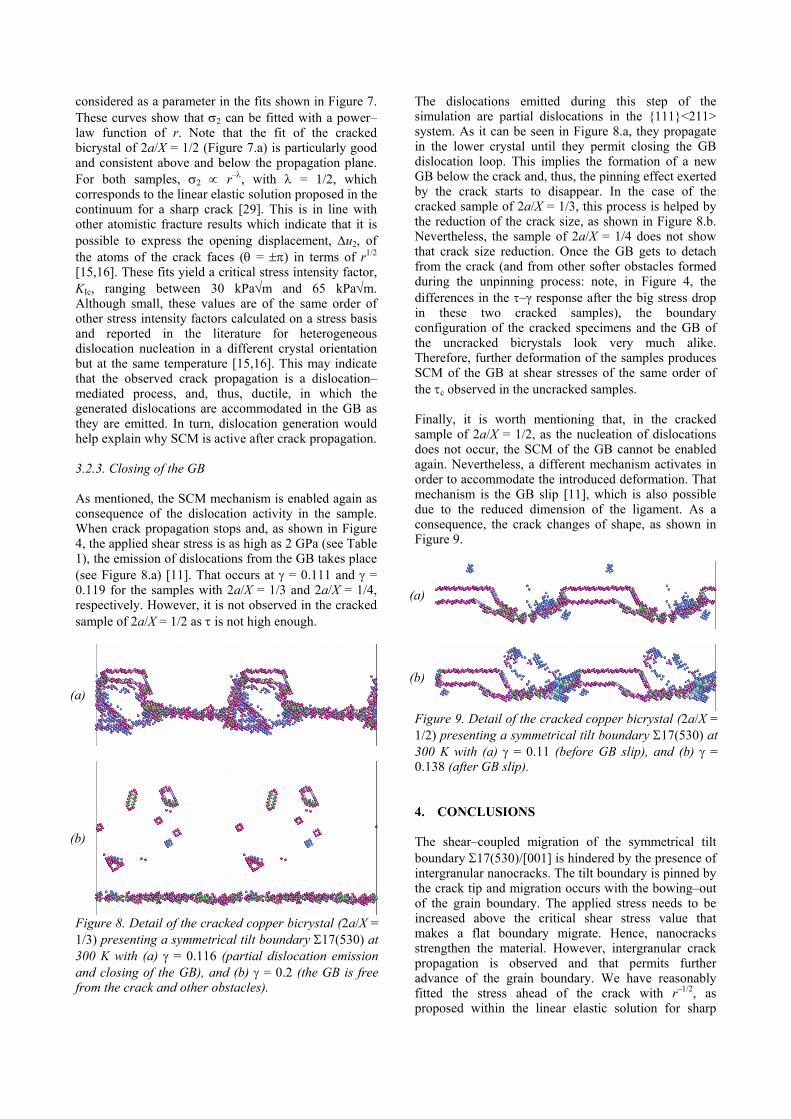
considered as a parameter in the fits shown in Figure 7. These curves show that σ2 can be fitted with a power–law function of r. Note that the fit of the cracked bicrystal of 2a/X = 1/2 (Figure 7.a) is particularly good and consistent above and below the propagation plane. For both samples, σ2 ∝ r–λ, with λ = 1/2, which corresponds to the linear elastic solution proposed in the continuum for a sharp crack [29]. This is in line with other atomistic fracture results which indicate that it is possible to express the opening displacement, ∆u2, of the atoms of the crack faces (θ = ±π) in terms of r1/2 [15,16]. These fits yield a critical stress intensity factor, KIc, ranging between 30 kPa√m and 65 kPa√m. Although small, these values are of the same order of other stress intensity factors calculated on a stress basis and reported in the literature for heterogeneous dislocation nucleation in a different crystal orientation but at the same temperature [15,16]. This may indicate that the observed crack propagation is a dislocation–mediated process, and, thus, ductile, in which the generated dislocations are accommodated in the GB as they are emitted. In turn, dislocation generation would help explain why SCM is active after crack propagation. 3.2.3. Closing of the GB As mentioned, the SCM mechanism is enabled again as consequence of the dislocation activity in the sample. When crack propagation stops and, as shown in Figure 4, the applied shear stress is as high as 2 GPa (see Table 1), the emission of dislocations from the GB takes place (see Figure 8.a) [11]. That occurs at γ = 0.111 and γ = 0.119 for the samples with 2a/X = 1/3 and 2a/X = 1/4, respectively. However, it is not observed in the cracked sample of 2a/X = 1/2 as τ is not high enough.
(a)
(b)
Figure 8. Detail of the cracked copper bicrystal (2a/X = 1/3) presenting a symmetrical tilt boundary Σ17(530) at 300 K with (a) γ = 0.116 (partial dislocation emission and closing of the GB), and (b) γ = 0.2 (the GB is free from the crack and other obstacles).
The dislocations emitted during this step of the simulation are partial dislocations in the 111<211> system. As it can be seen in Figure 8.a, they propagate in the lower crystal until they permit closing the GB dislocation loop. This implies the formation of a new GB below the crack and, thus, the pinning effect exerted by the crack starts to disappear. In the case of the cracked sample of 2a/X = 1/3, this process is helped by the reduction of the crack size, as shown in Figure 8.b. Nevertheless, the sample of 2a/X = 1/4 does not show that crack size reduction. Once the GB gets to detach from the crack (and from other softer obstacles formed during the unpinning process: note, in Figure 4, the differences in the τ–γ response after the big stress drop in these two cracked samples), the boundary configuration of the cracked specimens and the GB of the uncracked bicrystals look very much alike. Therefore, further deformation of the samples produces SCM of the GB at shear stresses of the same order of the τc observed in the uncracked samples. Finally, it is worth mentioning that, in the cracked sample of 2a/X = 1/2, as the nucleation of dislocations does not occur, the SCM of the GB cannot be enabled again. Nevertheless, a different mechanism activates in order to accommodate the introduced deformation. That mechanism is the GB slip [11], which is also possible due to the reduced dimension of the ligament. As a consequence, the crack changes of shape, as shown in Figure 9.
(a)
(b)
Figure 9. Detail of the cracked copper bicrystal (2a/X = 1/2) presenting a symmetrical tilt boundary Σ17(530) at 300 K with (a) γ = 0.11 (before GB slip), and (b) γ = 0.138 (after GB slip). 4. CONCLUSIONS The shear–coupled migration of the symmetrical tilt boundary Σ17(530)/[001] is hindered by the presence of intergranular nanocracks. The tilt boundary is pinned by the crack tip and migration occurs with the bowing–out of the grain boundary. The applied stress needs to be increased above the critical shear stress value that makes a flat boundary migrate. Hence, nanocracks strengthen the material. However, intergranular crack propagation is observed and that permits further advance of the grain boundary. We have reasonably fitted the stress ahead of the crack with r–1/2, as proposed within the linear elastic solution for sharp

cracks. The applied shear stress grows until new plastic–deformation mechanisms activate, such as dislocation emission of grain boundary sliding. The emission of dislocations takes place at the same time as shear–coupled migration, and, finally, the boundary can detach from the crack tip.
ACKNOWLEDMENTS This work was supported by the Department of Industry, Commerce and Tourism of the Basque Government (project ETORTEK inanoGUNE). A. Luque also acknowledges the Spanish Ministry of Science and Innovation and the European Social Fund (Torres Quevedo Programme).
REFERENCES
[1] Li, C.H., Edwards, E.H. and Parker, E.R., “Stress–
induced movement of crystal boundaries”, Acta Metall. 1, 223–229, 1953.
[2] Bainbridge, D.W., Li, C.H. and Edwards, E.H., “Recent observations on the motion of small angle dislocation boundaries”, Acta Metall., 2, 322–333, 1954.
[3] Winning, M., Gottstein, G. and Shvindlerman, L.S., “Stress induced grain boundary motion”, Acta Mater., 49, 211–219, 2001.
[4] Winning, M., Gottstein, G. and Shvindlerman, L.S., “On the mechanisms of grain boundary migration”, Acta Mater., 50, 353–363, 2002.
[5] Winning, M., “Motion of <100>–tilt grain boundaries”, Acta Mater., 51, 6465–6475, 2003.
[6] Cahn, J.W., Mishin, Y. and Suzuki, A., “Coupling grain boundary motion to shear deformation”, Acta Mater., 54, 4953–4975, 2006.
[7] Cahn, J.W., Mishin, Y. and Suzuki, A., “Duality of dislocation content of grain boundaries”, Philos. Mag., 86, 3965–3980, 2006.
[8] Molodov, D.A., Ivanov, V.A. and Gottstein, G., “Low angle tilt boundary migration coupled to shear deformation”, Acta Mater., 55, 1843–1848, 2007.
[9] Winning, M., “In–situ observations of coupled grain boundary motion”, Philos. Mag., 87, 5017–5031, 2007.
[10] Zhang, H., Du, D. and Srolovitz, D.J., “Effects of boundary inclination and boundary type on shear–driven grain boundary migration”, Philos. Mag., 88, 243–256, 2008.
[11] Luque, A., Aldazabal, J., Martínez–Esnaola, J.M. and Gil Sevillano, J., “Plastic deformation by conservative shear–coupled migration of tilt boundaries with intergranular nano–cracks or precipitates”, Philos. Mag., 2009, available online. DOI: 10.1080/14786430903097715.
[12] Daw, M.S. and Baskes, M.I., “Semiempirical, quantum mechanical calculation of hydrogen embrittlement in metals”, Phys. Rev. Lett., 50, 1258–1288, 1983.
[13] Daw, M.S. and Baskes, M.I., “Embedded–atom method: Derivation and application to impurities,
surfaces and other defects in metals”, Phys. Rev. B, 29, 6443–6453, 1984.
[14] Mishin, Y., Farkas, D., Mehl, M.J. and Papaconstatopoulos, D.A., “Structural stability and lattice defects in copper: Ab–initio, tight–binding and embedded–atom calculations”, Phys. Rev. B, 63, 224106/1–6, 2001.
[15] Luque, A., Aldazabal, J., Martínez–Esnaola, J.M. and Gil Sevillano, J., “Atomistic simulation of tensile strength and toughness of cracked Cu nanowires”, Fatigue Fract. Engng. Mater. Struct., 29, 615–622, 2006.
[16] Luque, A., Aldazabal, J., Martínez–Esnaola, J.M. and Gil Sevillano, J., “Molecular dynamics simulation of crack tip blunting in opposing directions along a symmetrical tilt boundary of copper bycristal”, Fatigue Fract. Engng. Mater. Struct., 30, 1008–1015, 2007.
[17] Nosé, S., “A unified formulation of the constant temperature molecular dynamics methods”, J. Chem. Phys. 81, 511–519, 1984.
[18] Hoover, W.G., “Canonical dynamics: Equilibrium phase–space distributions”, Phys. Rev. A, 31, 1695–1697, 1985.
[19] Li, J., “AtomEye: An efficient atomistic configuration viewer”, Modell. Simul. Mater. Sci. Eng., 11, 173–177, 2003.
[20] Sun, Z.H., Wang, X.X., Soh, A.K. and Wu, H.A., “On stress calculations in atomistic simulations”, Modell. Simul. Mater. Sci. Eng., 14, 423–431, 2006.
[21] Van Swygenhoven, H. and Derlet, P. M., “The atomistic simulation of dislocations in FCC metallic nanocystalline materials”, Dislocations in Solids, Ch 81, 1–42 (2008) Eds. J. Hirth, 2007.
[22] Cormier, J., Rickman, J.M. and Delph, T.J., “Stress calculation in atomistic simulations of perfect and imperfect solids”, J. Appl. Phys., 89, 99–104, 2001.
[23] Luque, A., Aldazabal, J., Martínez–Esnaola, J.M. and Gil Sevillano, J., “Mode II loading behaviour of intergranular cracks lying on Σ17(530)/[001] symmetrical tilt boundary in copper”, Phys. Status Solidi C, 6, 2107–2112, 2009.
[24] Sharif, A.A., Chu, F., Misra, A., Mitchell, T.E. and Petrovic, J.J., “
[25] Gale, W.F. and Totemeier, W.F. (editors), Smithells Metal Reference Book, Elsevier, Amsterdam (The Netherlands), 2004.
[26] Mishin, Y., Suzuki, A., Uberuaga, B.P. and Voter, A.F., “Stick–slip behaviour of grain boundaries studied by accelerated molecular dynamics”, Phys. Rev. B, 75, 224101/1–7, 2007.
[27] Scattergood, R.O. and Bacon, D.J., “The strengthening effect of voids”, Acta Metall., 30, 1665–1677 (1982).
[28] Osetsky, Y.N. and Bacon D.J., “Comparison of void strengthening in fcc and bcc metals: Large–scale atomic–level modelling”, Mater. Sci. Eng. A, 400/401, 374–377, 2005.
[29] Martín–Meizoso, A. and Martínez–Esnaola, J.M., Mecánica de la Fractura, Tecnun–Universidad de Navarra, Donostia–San Sebastián (Spain), 1999.