situational analysis report - csp.treasury.gov.za
TRANSCRIPT
1
CITIES SUPPORT PROGRAM TOWNSHIP ECONOMIC DEVELOPMENT PROJECT
HAMMANSKRAAL CITY OF TSHWANE
SITUATIONAL ANALYSIS REPORT
VERSION 2.5.
APRIL 2021
Prepared by the Sustainable Livelihoods Foundation TED Project Team

2
Cities Support Programme
Township Economy Development Project
Situation Analysis Report
Project Site: Hammanskraal, City of Tshwane
Prepared by the Sustainable Livelihoods Foundation TED Project
Team
Version 2.5.
April 2021

3
I. Executive Summary
The Cities Support Programme (CSP) of National Treasury (NT) has entered into an agreement with the
City of Tshwane (CoT) to provide technical support for a township economy development (TED) project.
This three-year intervention will strengthen the capacity of the CoT to strategize, plan, fund, implement
and monitor TED projects within the township of Hammanskraal.
The CSP appointed the Sustainable Livelihoods Foundation NPC (SLF) with a professional technical
assistance team (TAT) comprising a team leader; small-business development, social scientist, spatial
planning, public transport, housing, infrastructure development, environmental advisors and
community liaison persons. The TAT will collaborate with CoT to align the strategy to existing and
emerging development frameworks, strategies and projects and advance implementation of the
strategy through specific projects derived from the unique development challenges and opportunities
within the site.
In formulating projects and implementation plans, the TAT will facilitate processes of participatory
engagement and transversal planning to advance projects with spatial impact, whilst synergising
resources and ensuring alignment with sector plans. The resulting TED strategy will provide the City with
a replicable area-based development approach. The project will leverage institutional impacts through
knowledge sharing, strengthening metro strategies and policies, and through facilitating transversal
planning processes. It will benefit the metro through the building of new partnerships and arrangements
for the implementation of economic development projects, sourcing of funding, and gaining access to
specialist knowledge and expertise. This Situation Analysis identifies aspects and components of the
Hammanskraal township economy that could benefit from project interventions within an overarching
strategic alignment. Hammanskraal is a large, peri-urban township (in both spatial and population
terms) in the north-western portion of CoT. The township is approximately 50 kilometres from Pretoria.
It is bordered by the N1 on the eastern side of the site.
Theory of Change (ToC)
Building on prior CSP work, the ToC recognises townships as requiring a spatially and systems-oriented
development approach, influenced by 1) provision (and quality) of public goods and services, 2) the
regulatory environment, 3) the organisation of society, and 4) the character and orientation of economic

4
and business activities. Furthermore, there is a requirement for a context specific understanding of the
physical, social and psychological needs of township communities; to understand the range of shocks
that exacerbate economic vulnerability; and actions to strengthen accountability and governance.
Partners
The CSP has entered partnerships with the European Union supported Ecosystem Development for
Small Enterprise (EDSE) programme, the World Bank Group (South Africa) (WBG), and the Aspen
Network of Development Entrepreneurs (ANDE) to amplify the TED project. These align the TED project
with the Department of Small Business Development (DSBD), Small Enterprise Development Agency
(SEDA) and the Small Enterprise Finance Agency (SEFA). In addition, the CSP TED project will work
synergistically with the Neighbourhood Development Partnership Programme (NDPP) of National
Treasury.
Methods
The TAT undertook a series of seven simultaneous steps in preparing the situation analysis:
1. Establishing a transversal team of sector specialists.
2. Desk-top identification of all relevant municipal planning documents, and feasibility studies for
economic projects. In all, 117 official publications, academic publications and unpublished
reports were accessed.
3. Participatory engagement – because of COVID-19, engagement was primarily undertaken
through on-line engagements in the Hammanskraal Virtual Imbizo page on Facebook.
4. Spatial information - obtained data from open sources and the CoT including land use (zoning
schemes), cadastral boundaries, social and community infrastructure, water and sewerage
systems, electricity networks, telecommunications, natural features and roads and transport
infrastructure. In addition, the TAT undertook spatial analysis of identified high streets, business
nodes and development precincts.
5. Ecosystem survey – a team of field researchers used a survey instrument to collect data within
the field, focussing on economic high streets, business precincts, retail hub and identified nodes
/ precincts. Field research was undertaken in late 2020. The researchers surveyed 429 businesses
(micro-enterprises, SMEs and corporates), recorded 27 business hotspots and 34 institutional
services.

5
6. Site field research and engagement to qualitatively understand the socio-economic
characteristics of business and urban dynamics.
7. Sector specific investigations into essential aspects of the township economy.
To mitigate the challenge of relative scarcity of area-based data, the TAT accessed unusual data sources,
including private sector datasets and qualitative data.
Institutional ecosystem
The TAT assessed government strategies at national, provincial and metro levels to support businesses
within the township economy. National government programmes such as those driven by the DSBD
and its associated agencies of SEDA and SEFA include:
• New incentives (with the Medium-Term Expenditure Framework (MTEF) period),
• The Small Business and Innovation Fund (R3,2b),
• Black Business Supplier Development Programme (R906m),
• National Informal Business Upliftment Scheme (R248m),
• Enterprise Incubation Programme (R186m),
• Craft Sector Programme (R36m),
• SheTrades,
• Township Entrepreneurship Fund,
• Township and Rural Entrepreneurship Fund (TREP)
• The Small Business Economic Development Portal (www.smmesa.gov.za).
Gauteng Province Programmes
The Gauteng Provincial Government (GPG) has prioritised the Township Revitalisation Strategy (TRS) to
create strategic accessibility and connectivity to markets to transform township economies. Growing
Gauteng Together (GGT) 2030 aims for ‘building sustainable development for all’, creating jobs and
opportunities, with a focus on the Gauteng City Region (GCR) and ten high-growth sectors. Furthermore,
the GGT has a strong emphasis on water and energy security and a focus on promoting renewable
energy. Within the GGT the Township Revitalisation Action Plan seeks to change how townships are
regulated and governed; allow township firms to be formally recognised; revise state procurement rules
and programmatic support; de-risk lending to township firms of all sizes by financial service providers;
turn taxi ranks into micro-CBDs and support the taxi economy to use its scale to grow supporting value
chains and industries, and convert areas with high commercial densities into township high streets.
These interventions underpin the proposed Township Economic Development Bill which aims to direct
government procurement spend, enhance access to finance, assists registering SMES, enable high street

6
development and redress municipal by-law barriers to enterprise formalisation. Lastly, the Gauteng City
Region (GCR) Economic Development Plan (2015- 2020) intends to drive economic growth through
strategic targeting of priority sectors. Based on the current economic structure of Gauteng Province, the
GCR EDP is biased towards the service sectors, especially community services, finance and transport
although purports that the manufacturing sector should be at the centre of economic growth and
development. The EDP recognises a need to invest skills in various sub-sectors of the economy and
address the high barriers of entry in many of these industries – in particular those with high growth
potential such as agro-processing and steel. Within the context of these overarching provincial
strategies, the CoT has developed its own series of guiding policies and programmes.
City of Tshwane Programmes
The Tshwane 2030 Development Strategy espouses the City’s vision for a sustainable and prosperous
future and is underpinned by the Sustainable and Inclusive Growth Strategy (SIGS) which prioritises
selected sectors of:
• Knowledge Economy – with four public higher education institutions the Cityo has prioritised
access to education, economic growth and global recognition as an education and research
and development hub.
• Agricultural Production and agro-processing - production and processing infrastructure,
developing and dedicated land, supporting high yield and exportable crops; access to finance;
skills and knowledge base of small-holder farmers; facilitating market access and job creation.
• Tourism and marketing the City as a choice location for investments.
The green economy and spatial transformation are addressed in the Tshwane Regional Spatial
Development Framework (RSDF), 2018, which provides a specific spatial development framework for
each region and focuses on spatial transformation, economic transformation and ecological
transformation.
ToC is guided by an Integrated Development Plan (IDP), which is scheduled for review in 2021. Older,
but still relevant is the Tshwane Growth and Development Strategy (GDS) from 2006 which considers
the main sectors of the City economy to be automotive manufacturing, mining, retail, finance and
support services sectors; each of which has sector specific plans. As part of the City’s business incubation
programme to support SMMEs within the automotive industry, the City appointed the Ga-RanKuwa
Automotive Co-operative to provide mechanical and autobody repair services to its fleet.

7
Within the draft Tshwane MSDF (September 2019) it is noted that the local manufacturing sector can
also support the township economy. The GPG has assisted with access to markets and invested
substantial resources in industrial infrastructure including industrial parks and automotive hubs.
The City has also released land for business development, especially in townships.
Enterprise activity - The Micro-Enterprise Ecosystem
Hammanskraal field research was conducted in October/November 2020 to record a snapshot of
evidence of: i) business activities, ii) institutional facilities and iii) business hotspots and spatial
opportunities. The research team surveyed 429 businesses (micro-enterprises, SMEs and corporates),
recorded 27 business hotspots and 34 institutional services.
Of the 429 businesses identified, 7 (2%) were corporates, 56 (13%) were SMEs, and 366 (85%) micro-
enterprises. All corporates and 44 (94%) of SMEs were formal businesses that adhere to the legal and
administrative requirements of government whilst 253 (69%) of micro-enterprises self-reported as
informal enterprises. Of the 366 micro-enterprises, 78% (285) of businesses were open for trade during
the research period and full interviews were recorded. Retailing is the predominant theme of business
with the selling of clothes (10%/44), vegetables (10%/44), cooked food (9%/40), snacks & cigarettes
(9%/39) and hair salons (8%/35) commonplace. 70% (200) of the micro-enterprises are operated by
South Africans with immigrants from Zimbabwe (14%) and Mozambique (5%) notably operating
informal businesses in the township.
The Hammanskraal informal economy supports both survivalist / self-employment persons in business,
but also provides jobs. Some 157 (55%) of the respondents interviewed were the business owner, 6%
were running the business in a partnership (18), and 39% were employees (110).
The research found a high proportion of male owned businesses 72% (204) compared to the other
research sites; within this cohort, 32% (65) of whom were in their 30s. More than half of all women (48)
were in their 30s (24) and 40s (24) - likely a reflection of family (child-care) and livelihoods
responsibilities.
Business dynamics
The majority (62%) of micro-enterprises operated from informal trading spaces such as open ground or
non-demarcated trading sites in the vicinity of the street. Identified trading structures included 32% (90)
businesses operating from a shack or shed, 14% (41) from a street trading table or stand, 8% (24) from

8
a private house, and 7% (19) from a container. Some businesses were housed in business complexes
such as light industrial bee-hives that cluster together similar enterprises (such as car related businesses,
or welding and fabrication activities).
Rent
Just under half (47%) of respondents reported the businesses paid rent for their premises. A quarter of
these rent payers (68) were business owners, with just under half (84) South Africans, and two thirds (51)
of non-South Africans.. The monthly rental amounts varied, ranging from R100 for a site on open ground
with no services to R10,000 for a brick and mortar-built structure.
Access to utilities
Access to utilities in the area is uneven. The largest group of enterprises interviewed 46% (130) only had
informal access to utility services (through paying cash to neighbours or collecting water off-site), whilst
16% (45) had no utilities access at all. Trading stands (17) and shacks (17) were the least likely businesses
to access these services.
Time in business
Many businesses in Hammanskraal have been established recently with 51% (90) operating between
one and four years. These young businesses are also a reflection of relatively youthful business owners
with 21% (61) and 25% (71) of business owners being respectively in their 20s or younger, or in their
30s.
Operating challenges
The majority of respondents noted infrastructure (104) as the key challenge to operating and growing
their business. Crime (64), competition (48), storage (47), and ‘other’ (35) challenges were also
prominently mentioned. An important challenge is that of the nexus of business registration, support
mechanisms and informality. Many of the businesses in Hammanskraal township economy are not
necessarily informal by choice, but through circumstance whereby their micro-scale gs and lack of
operational capital present great restrictions on legal and operational compliance.
There is seeming misalignments between government business support programmes and the
conditions of deep informality that preclude many microenterprises from eligibility for support.

9
SMEs and Corporates
The SMEs in Hammanskraal included funeral (24%) and health services (29%), and wholesalers (29%).
These were all formal enterprises in regulated industries. Conversely, aside from shopping malls, the
CBD and industrial areas (which fell outside the scope of the enterprise survey), few corporate businesses
operate along high streets.l. The Temba City Mall, once an anchor for corporate business, has been
largely abandoned by tenants who have relocated elsewhere.
Business Hotspots
The ecosystem research documented 27 potential business hotspots. The sites of Old Warmbaths Road
(R101), and sites adjacent to shopping malls and industrial areas accommodate emerging clusters of
micro-enterprises and present valuable opportunities for development. Industrial beehives are
important sites where micro-manufacturing and service businesses have clustered. Furthermore, the
research identified clusters on high streets (such as intersections and corners with considerable
pedestrian activity) and outside of government services. Taxi ranks also represented a small (7%) but
valuable business clustering and hotspot opportunity.
Overall, 325 businesses operated from the hotspots located in the study: 197 from business hives,
including trader units within the CBD, 59 in high streets, and 23 at taxi ranks. Of the 27 hotspot sites,
81% (22) had formal site infrastructure, 95% (21) of which was considered functional by the occupants.
A number of business hives are managed by the North West Development Corporation (NWDC) (despite
physically these properties being in Gauteng Province). Whilst these sites are highly valued by business,
they are beset with challenges. In one case the business hive has had no electricity for over 12 months
due to disputes between government agencies about whom should service the bill.
Institutional services
There were 34 institutional services recorded, mostly (26% - 9) were financial services. Other services
included a women's clinic and animal clinic, prayer space, sports facility, and security service. Of the
available financial services, 67% (6) are ATMS and 22% (2) are insurance brokers. The ATMs appear to
be routinely out of order, meaning that the working facilities are under considerable pressure during
periods of high demand.
10
Township Wide Ecosystem
Hammanskraal site includes the Babelegi Industrial Park about 5 kilometres north of the CBD. Whilst
currently in need of reinvestment and with an enduring a high level of vacancies, Babalegi has
nevertheless retained a number of large industrial businesses including food producers, a ceramics
production firm, and auto component suppliers.
A potential opportunity for agglomerating local micro-enterprise is that of the privately owned (jointly
by Mowana Properties and Public Investment Corporation) Temba City Mall. With 90% of the retail
shops being vacant a new business strategy is required for the mall premises that could represent an
important opportunity for TED.
Important Sectors
Based on regional advantages, geography and other socio-economic circumstances there are some
important economic sectors in Hammanskraal with potential for investment and BDS:
Creative Economies - Local manufacturing of tourist curios and artwork sold to tourists visiting nearby
nature reserves and other local attractions. This sector could be enhanced through strategic investment.
• Micro-Manufacturing and Repair, Installation and Maintenance (RIM) - Considerable private
investments made into local houses presents a valuable opportunity for the micro-
manufacturing sector – such as upgrading gates, fences, doors and windows. There is also
demand for repair, installation and maintenance services in the support for the growing home
renovation economy. These businesses have value adding potential through converting raw
materials with labour into valuable products.
• Financial inclusion – a programme to strengthen this for SMMEs in Hammanskraal would
position these enterprises for business growth.
• Automotive Sector - Includes welders, mechanics, tyre fitment and car related activity. Important
opportunities are currently accessible in the aftermarket sector including maintenance, repairs,
refitment, spares, disposal of vehicles and recycling. A number of government and private sector
role-players support such investments.

11
Land use / Development plans
The TAT assessed relevant planning documents underpin the Hammanskraal land-use context:
• Municipal Spatial Development Framework (MSDF) - a long-term spatial planning tool
guiding spatial growth of the CoT. It identifies the Babelegi Industrial Area and the
Hammanskraal Train Station as opportunity areas.
• Regionalised Municipal Spatial Development Framework – which provides detailed
planning directives that align with the SDF for each region in the City. Region 2 (which includes
the study area) recognises the Hammanskraal Urban Core (and the need to formalize tenure,
upgrade infrastructure, and regeneration of the Babelegi Industrial Area), and Jubilee Mall (both
with prioritised social facilities). Further, the Temba Local Node is planned to accommodate
institutional community and retail uses on vacant land in area.
• Built Environment Performance Plan – a yearly mechanism aligning the IDP and budget with
spatial priorities to promote the effective functioning of the metropolitan built environment.
The BEPP indicates that Temba is classified as an ‘urban node’ – it is located in a peripheral area
in the CoT, though the area is projected to grow rapidly in the medium term. The plan notes
the need to address backlogs on basic service delivery. The BEPP proposes the re-establishment
of a passenger rail line between Shoshanguve and Hammanskraal and extending the
Atteridgeville Bus Rapid Transit Route further North, as a complement to increasing the public
transport capacity by way of the proposed rail line.
• Municipal Planning By-Law and Town Planning Scheme – which provides the legal
framework from the implementation of spatial policies.
Land Use Dynamics
The land use dynamic in Hammanskraal is complex. The traditional authority is an important landowner
and autonomous land administrator, though ownership of some of these lands remains with the state,
hence national government. We have been unable to access detailed data about land ownership in this
area, so it is uncertain how much land falls into this category.
Portions of land in the core area are zoned as ‘Undetermined.’ This zone is primarily intended for single
dwellings or agricultural use. A Municipal Transitional Settlement may be permitted as a consent use on
land zoned under this category. A significant proportion of the study area is zoned Residential 1.
Babelegi is zoned for industrial use. There are a variety of institutional and community facilities available
in the site. We note that only a small percentage of land is zoned for business purposes.

12
Tsošološo Programme Precinct Plans
The Tsošološo Programme seeks to create long-term change in marginalised areas of the CoT through
infrastructure and urban design interventions aimed at promoting better public space and access to
public facilities. The main funding for this intervention is provided through the Neighborhoods
Development Partnership Programme (NDPP) Grant. Hammanskraal/Temba is one of six marginalised
areas in the CoT that has received upgrades through the NDPP.
Three major precincts have been identified for development; the Hammanskraal Urban Core, including
sports, institutional and retail sub-precincts; the Babelegi Industrial Node to retain, expand and attract
new businesses to the node; and the Temba Node which includes vacant land around the Jubilee Mall
site.
Prioritised and high potential nodes
To inform possible TED opportunities, the report includes a series of spatial maps upon which an analysis
can be undertaken. In priority nodes, the TAT have analysed land-use, infrastructure and the built
environment, social-spatial ordering and the nature of organic micro-enterprise responses. .
The study area demonstrates a valuable capacity to accommodate social-economic strategies as
expressed in various urban spaces. Temba Square and the Temba ‘beach’ sites are notable spaces in the
social and cultural life of the community. These sites can play a role in the revitalisation of the township
economy, in terms of recreation, culture, and entertainment.
Infrastructure and Natural Systems
The Hammanskraal CBD is located at the confluence of the north-south and east-west transport
systems. The township is very dispersed in its spatial form radiating outwards from the CBD – particularly
to the north-west with limited possibilities for meaningful pedestrian connectivity across amenities in
the township as the distances are uncomfortable. As such it would be important for the CoT to consider
a series of strategic linkages across this infrastructure barrier to ensure better connectivity and
optimisation of development investments.
The dam and river system are a rare and valuable environmental feature that are underperforming in
terms of a natural asset to the township.

13
The legacy infrastructure of a railway system is still in place, although public transport has shifted to
public and private vehicular transport systems. The underperforming railway system and its associated
real estate needs to be radically repurposed to augment and leverage economic growth in the CBD.
Suggested development nodes:
• Hammanskraal CBD is currently a challenging environment for business. The defunct railway
infrastructure and its derelict nature is a threat to the sustainability of the precinct and needs
urgent attention to ensure the spatial transformation of the node. The CBD has significant
economic real estate that can play a productive role in the neighbourhood, but requires better
connectivity, optimisation of land and precinct management.
• The Temba local node is poorly defined. Its connective system of streets does not contribute to
a diversity of functions, connectivity and urban well-being. The Jubilee Mall is the primary
feature of the node and does not appear to have been leveraged to contribute to the broader
township economy – especially in terms of its relationship to transport, unlocking adjacent
property values and creating active streets. A strategic focus needs to be directed to properties
in this precinct with the aim to realise greater value in a manner that enhances the structural,
infrastructural and connectivity needs.
• The Temba City Precinct has an ideal set of diverse functions, operates at a good scale, is well
connected and well located geographically in the township. It enables valuable street activity
despite the Temba City Mall underperforming economically. The residual functions of the
market and taxi rank are valuable economic assets in the precinct and should be acknowledged
within a transformative re-development of the Mall. There are significant parcels of private and
public land in the area that are underperforming that could benefit from key interventions in
the area.
• Themba Square is an extraordinary social and public space. It is well-located and used by the
community. It exemplifies the capacity for urban spaces to enable the social and cultural life in
the township. The area contains a diversity of open space, social, commercial and residential
uses at a potentially comfortable scale. The nature of the built space allows for a natural urban
management that is invaluable in this context.
• The Temba Dam is a dynamic and valuable economic resource in the township. It
accommodates recreational users and is naturally well structured to be a high performing
natural and recreational asset. Importantly, it provides a critical east-west linkage that connects
the two parts of broader Hammanskraal – and does so via a social amenity (pedestrian bridge).

14
Housing
TAT utilised available quantitative and qualitative data to analyse the existing housing situation and the
main trends, upon which future opportunities were identified and discussed. As a social asset, housing
provides township residents with a safe and secure place to live, socialise, study and sleep. As an
economic asset, housing generates income and livelihood opportunities for homeowners. The social
and economic functions of housing influence its value as a financial asset. As a financial asset, the house
can be traded for money, used as collateral to access finance or as an investment to accumulate wealth,
which can be passed on to others.
Housing delivery is complicated due to problems associated with historical land use and settlement
policies, different administrative jurisdictions, and land management and challenges of lack of tenure.
Hammanskraal has a mix of poor and middle-income population, which is also reflected in the different
housing typologies that characterize neighbourhoods. The areas of Temba Unit 1 and Kudube Unit 2
record average property prices of R316,459 and R279,613 respectively, which are the highest in the
township. There is a noticeable class of middle-income households living in high quality houses on large
plots. Some of the properties are sold for R650,000 and more in these established neighbourhoods.
Homeowners have made substantial investments in their properties, renovating, expanding the original
structure and improving place-making. This presents important opportunities for local construction
industry.
New gated estate properties have emerged as well as rental apartments targeting middle-income
households. Instead of renting backyard dwellings, most low-income households live in RDP/BNG
housing or in the expanding informal settlement located on the urban periphery to the west. Land is
cheap and available, which contributes to low-density sprawl and fragmentation. The formalization of
informal settlements is an important strategy for the area. The aim should be to implement formal layout
plans, install bulk infrastructure and formalize individual erven to transfer ownership to households.
However, this is complicated for settlements located on tribal land as the transfer of ownership to
individuals is contested.
As of 2019, Hammanskraal had a registered housing stock of 8520. This corresponds well with all formal
housing recorded in the 2011 census. Between 2015 and 2019, the stock grew by 1536 registered
properties, which is a sizeable 18% of the total registered stock. All of the added properties were BNG
houses delivered in the Kanana area for people living in informal settlements. Given the latest
announcements by the Department of Human Settlements, indicating that free BNG housing delivery

15
will be drastically reduced and replaced by sites and services schemes, it is unlikely that government
investments in formal housing will play a significant role in future. There are opportunities for innovative
public-private partnerships in delivering higher-density affordable housing within the urban core of the
township.
Home-based enterprises and backyard rentals are important uses of the house as an economic asset.
Homes are the dominant business location for enterprises operating in residential neighbourhoods.
They offer vital products and services to the residential population including food and retail, educare,
entertainment, recycling and home maintenance. Homes are also used for businesses in high streets
and commercial hotspots, although mobile structures such as containers, tables and stands are much
more common.
Transport
Hammanskraal has a well-established road transport network, with nine minibus taxi ranks within the
study site. The passenger rail line is not operational. Despite this there are planned railway
enhancements that form an important part of local economic development in the site. Furthermore, the
Cityo recognises the need for Non-Motorised Transport (NMT) infrastructure. NMT needs to be more
visible, culturally acceptable and safe. This should also convey the message that NMT can be
“mainstream” and worthy of consideration. A number of potential initiatives can help to concentrate
activity on specific routes to improve the levels of ‘safety in numbers’ and also to increase visibility to
encourage more cycling. This can also make it easier for the CoT to justify budgeting for NMT
infrastructure on those routes, but efforts to boost numbers should not be seen as an alternative to
infrastructure.
Infrastructure
The TAT analysis focused on theIt important to examine the ways that infrastructure facilitates the
transport of resources between the wider economy and townships, and how it distributes resources to
households and individuals at site level. The growth of the digital economy has important business
development and operational opportunities for assisting SMMES to maintain customer relationships,
internal operations, competitive edge, and investment. Digital activities in townships are hampered by
connectivity challenges and Information Communication and System (ICT) barriers to entry. Though this
accessibility gap may have decreased towards more recent years, there are still many individuals that
16
are excluded from the utilisation of digital platforms and the digital economy. The CoT has rolled out
its first phase of free WiFi project in public spaces. Such free internet hotspots in Hammanskraal are
under construction. The Tshwane Business Process Outsourcing (BOP) Park Project was identified as a
possible technology hub by the CoT, with facilities including a call centre.
Water supply has been an issue in the area, with water shortages resulting from a small amount of water
taps in the area compared to the demand for water. With groundwater contaminated, tankers have
been required to service people’s needs. Submissions of ward priorities have identified water and
sanitation as constant challenges. The key challenge for stormwater management is illegal dumping,
which block drains and exacerbates localised flooding. Key areas for interventions include litter traps
and other forms of sustainable urban drainage systems.
Environment
Hammanskraal is recognised as an area that is vulnerable to climate impacts. The drive to promote the
green economy has been intensified in response to the COVID-19 pandemic. The City recognises the
need to build food security and climate resilience. As such the Tshwane LED Strategy highlights
agriculture, agro-processing, and rural development as a key pillars in the implementation plan. Linked
to this, the City has several key programmes to support urban agriculture in the township context.
Urban sprawl and informal housing development has impacted on available agricultural land in the
surrounding villages.
The City has recently completed a rooftop PV installation at City building and are working on expanding
the programme to other owned buildings as well as exploring biogas initiatives in Region 2 (including
Hammanskraal).
As Hammanskraal is vulnerable to water shortages due to reticulation issues this may provide an
opportunity to consider decentralised water supply options and rainwater harvesting.
A number of City initiatives have provided support to recycling and waste management but for the
most-part, these are running at low capacity or not currently operational.
The recycling infrastructure in Hammanskraal provides an important opportunity to upskill recycling
entrepreneurs and revive recycling businesses, without large capital outlays for new infrastructure.
17
Urban conditions and management
The CoT have made notable investments to provide (and enhance) public facilities in Hammanskraal.
These include the Nelson Mandal statue outside the sports facility, and the sporting facilities themselves;
a pedestrian bridge across the R101; trader storage units within the CBD; and street paving. The urban
core is relatively well provided with urban facilities, that include pocket parks (in Kuduge), sport stadia,
municipal offices. The residents have access to public schools, municipal halls, the provincial Jubilee
Hospital and post-tertiary training facilities (Tshwane North TVET College).
Despite notable investments by the City, economic development in Hammanskraal is constrained by the
challenging form of urban / peri-urban sprawl. These outlying areas are disconnected from public
institutions and resources. The distance from the CBD to low density settlements mean that these areas
are unsuited to transit-oriented-development (TOD) strategies. In the urban core, the spatial integration
challenges include:
• The relatively far distance of civic facilities from the west residential population with few
economic multipliers benefiting township micro-enterprises.
• The absence of safe points for pedestrians to cross the R101; the pedestrian bridge is unused
for safety reasons.
• There are considerable portions of undeveloped land and privately owned land within the urban
core (Temba node).
• The CBD has no inherent centre or logic to its spatial ordering, with the railway line and mobility
spines presenting a barrier to integration.
• The absence of a station and passenger rail service (as a potential central point within the CBD).
The urban environment of public space is under considerable strain. In the course of the field research,
the TAT identified several challenges, including public dumping, business encroachment on public
spaces, unauthorised business and residential developments, and vandalism to public facilities and
assets. The Temba Dam is a recognised recreational facility, though the picnic area is in a poor state of
maintenance, and inadequate in scale to accommodate potential demand. The dam itself is partially
covered with water hyacinth.
Project Opportunity identification
Based on the extensive fieldwork evidence as contained in this report and consultation with City
specialists, the TAT has identified a range of potential project interventions / or opportunities. These
have been considered in view of the socio-economic, institutional and spatial situation. In highlighted
the below opportunities, the TAT has been guided by the following variables:

18
I. Alignment with City / Metro programmes and development priorities,
II. The availability of funding within City / Metro budgets,
III. The identification of project implementing lead departments and units within the City / Metro,
IV. The potential for accessing external funding and partnerships,
V. The role of the TAT in providing technical assistance and adding value to project implementation,
VI. The potential for projects to have strong economic multipliers and result in a catalytic impact on
development,
VII. The potential for projects to leverage productivity enhancement,
VIII. The potential for projects to strengthen social cohesion and enhance community well-being,
including considerations of safety and security,
IX. The potential of project to contribute towards environmental sustainability and reduce the risks
from climate change,
X. The reach of projects and targeting of specific beneficiaries, including women, youth, informal
micro-enterprises and established SMEs,
XI. The timeframe for project implementation, recognising the need for immediate, short-term and
medium-term projects with varying levels of complexity,
XII. And the potential for projects to be replicable in other township localities.
The identified opportunities have been categorised within 7 headings: A) Policy and Strategy; B)
Enterprise Development; C) Nodal Development; D) Spatial Integration; E) Housing and Property;
F) Social and Community Infrastructure and G) Urban Management. The range of identified
opportunities within these categories are:
Table 1: TED Opportunities in Hammanskraal
A. Policy and Strategy
Opportunity Notes
Shopping malls foster and enable
opportunities for micro-enterprises.
The City to engage shopping mall owners to agree on
strategies to integrate micro-enterprises into their business
precincts, through adherence to development planning
agreements and proactive measures.
Industrial hives sustainably managed to
support small and micro-enterprises,
including micro-manufacturing.
The City to secure ownership of the existing business hives
(currently under the North West Development Corporation)
and to institute a management plan to ensure the
sustainability and appropriate use of the facilities.
19
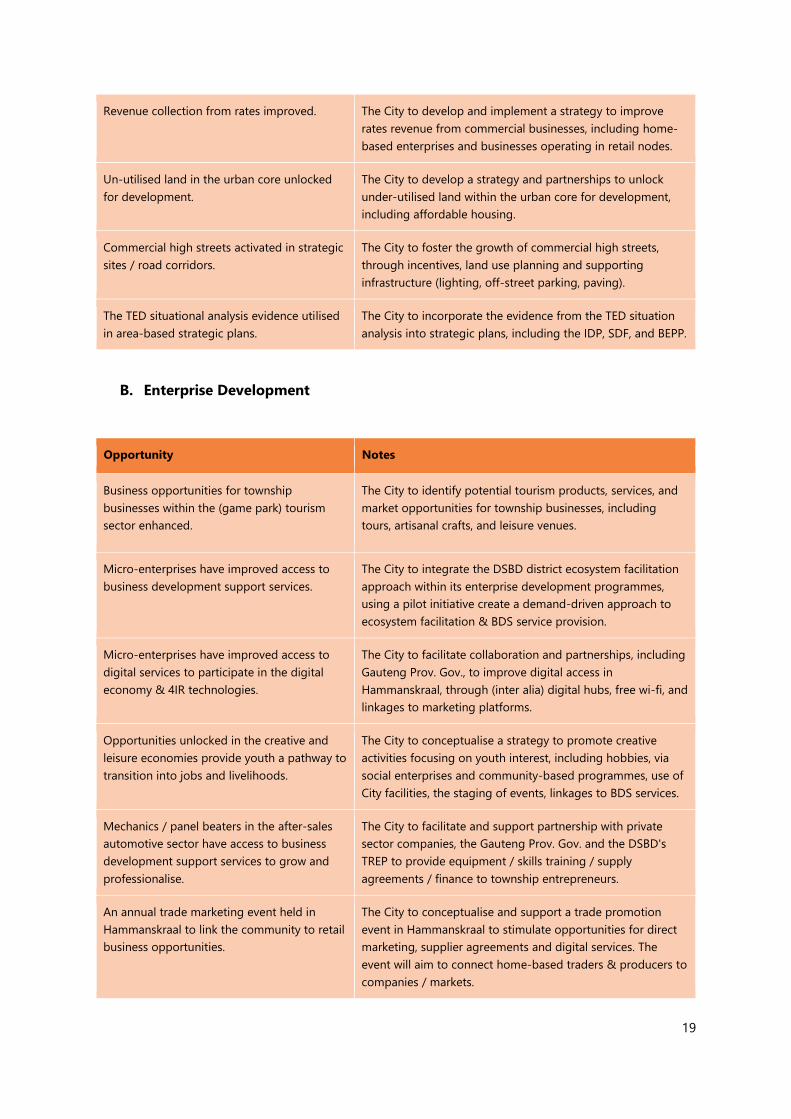
Revenue collection from rates improved. The City to develop and implement a strategy to improve
rates revenue from commercial businesses, including home-
based enterprises and businesses operating in retail nodes.
Un-utilised land in the urban core unlocked
for development.
The City to develop a strategy and partnerships to unlock
under-utilised land within the urban core for development,
including affordable housing.
Commercial high streets activated in strategic
sites / road corridors.
The City to foster the growth of commercial high streets,
through incentives, land use planning and supporting
infrastructure (lighting, off-street parking, paving).
The TED situational analysis evidence utilised
in area-based strategic plans.
The City to incorporate the evidence from the TED situation
analysis into strategic plans, including the IDP, SDF, and BEPP.
B. Enterprise Development
Opportunity Notes
Business opportunities for township
businesses within the (game park) tourism
sector enhanced.
The City to identify potential tourism products, services, and
market opportunities for township businesses, including
tours, artisanal crafts, and leisure venues.
Micro-enterprises have improved access to
business development support services.
The City to integrate the DSBD district ecosystem facilitation
approach within its enterprise development programmes,
using a pilot initiative create a demand-driven approach to
ecosystem facilitation & BDS service provision.
Micro-enterprises have improved access to
digital services to participate in the digital
economy & 4IR technologies.
The City to facilitate collaboration and partnerships, including
Gauteng Prov. Gov., to improve digital access in
Hammanskraal, through (inter alia) digital hubs, free wi-fi, and
linkages to marketing platforms.
Opportunities unlocked in the creative and
leisure economies provide youth a pathway to
transition into jobs and livelihoods.
The City to conceptualise a strategy to promote creative
activities focusing on youth interest, including hobbies, via
social enterprises and community-based programmes, use of
City facilities, the staging of events, linkages to BDS services.
Mechanics / panel beaters in the after-sales
automotive sector have access to business
development support services to grow and
professionalise.
The City to facilitate and support partnership with private
sector companies, the Gauteng Prov. Gov. and the DSBD's
TREP to provide equipment / skills training / supply
agreements / finance to township entrepreneurs.
An annual trade marketing event held in
Hammanskraal to link the community to retail
business opportunities.
The City to conceptualise and support a trade promotion
event in Hammanskraal to stimulate opportunities for direct
marketing, supplier agreements and digital services. The
event will aim to connect home-based traders & producers to
companies / markets.

20
Businesses providing personal care services
(hair care) have access to business
development support services to grow and
professionalise.
The City to facilitate partnerships with the DSBD's TREP
Programmes, the private sector and community-based
organisations to support personal care businesses (including
hairdressers and barber shops) with skills training, supplies
and marketing.
Urban agriculture productivity enhanced. The City to support localised agro-processing with technical
support and linkages to City initiatives (Rethabiseng food and
energy centre, Tshwane Agro-processing Hub, City of
Tshwane Fresh Produce Market).
Businesses have greater financial literacy and
have access to services and technologies,
including digital platforms
The City to facilitate partnerships, including Gauteng Prov.
Gov. and Finmark Trust, to extend financial literacy training
and improve access to services and technologies.
Street signage / public advertising extensively
utilised to promote local businesses.
The City to develop and implement a project (with
partnerships) to provide street signage / advertising boards
to promote local enterprises.
BDS support for businesses in the micro-
manufacturing and artisanal sector
Alongside the opportunity to reformulate the policy and
investment environment to regularize urban residential
densification, there is scope for City support towards the
various artisans manufacturing furniture, fitted kitchens and
other household items to develop this sector..
C. Nodal Development
Opportunity Notes
A development strategy for Temba City
precinct approved.
The City to develop a strategy and implementation plan to
stimulate investment in the Temba City precinct, synergising
with property developers and micro-enterprises.
The Temba City shopping mall revitalised The City to engage the mall owners (Public Investment
Corporation; Mowana Properties) to conceptualise a strategy
to revive the mall, aiming to accommodate local micro-
enterprises and social enterprises.
Temba Square precinct transformed into a
hub in support of social and economic
opportunities.
The City to develop and implement a plan to enhance the
social and entrepreneurial opportunities in Temba square and
surrounding properties, focusing on upgrading park facilities,
lighting, off-street parking, and paving and utilising crime
prevention through environmental design tools.
Public facilities serving transport and informal
trading in the CBD enhanced.
The City to implement a precinct management plan and
identify strategic projects to enhance facilities, including
waste management, ablutions, and taxi operations.

21
D. Spatial Integration
Opportunity Notes
Bicycles (cycling) are extensively used as a
means of low cost and efficient transport.
The City to promote cycling within the Hammanskraal area,
through improving safety, fostering partnerships, and
enhancing accessibility via an expanded network of NMT /
cycle lanes.
A passenger rail service, connecting
Hammanskraal to Pretoria CBD, to be
developed.
The City to engage PRASA, Provincial and National
government on the development of the passenger rail service
and provide strategic advice on the role of the station
precinct within the CBD.
Pedestrian paths / bridge connections
established to link residential areas to the
CBD and retail hubs.
The City to expand a network of pedestrian lanes and NMT
lanes, prioritising the connection between the CBD and
Temba.
Infrastructure developed to provide and
enable universal access to public transport.
The City to embrace and implement designs for universal
access in public transport hubs to ensure that people living
with disabilities / mobility requirements have access to public
transport infrastructure.
A secure pedestrian route created over the
R101 within the Hammanskraal CBD.
The City to commission research / planning to identify
options to re-design and re-develop the pedestrian bridge,
addressing safety concerns and facilitating usage.
E. Housing and Property
Opportunity Notes
Homeowners utilise water harvesting and
solar PV technologies.
The City to strategize incentives to encourage homeowners
invest in water harvesting and energy generation (solar),
providing technical support through partnerships.
Encourage housing investments by the public
and private sectors in strategic sites to raise
population densities, encourage mixed land
uses and stimulate additional economic
activity.
The City will introduce procedures to fast-track higher density
housing investments, including PPPs, in strategic sites,
including within the CBD and Temba node.
Informal land use formalised on high-streets
and villages.
The City to develop an approach (land use model) with the
support of National Government to formalise unauthorised
developments on land outside formal townships, focusing on
commercial use along high streets and villages within the
urban core.

22
F. Social and Community Infrastructure
Opportunity Notes
Temba beach revitalised as a leisure /
recreation destination.
The City to develop a strategy for reviving Temba beach as a
leisure / recreation destination and define project
components.
G. Urban Management
Opportunity Notes
Public Employment Programmes utilised to
address urban management challenges,
including the maintenance of recreational and
ecosystem resources.
The City to develop a strategy to re-purpose PEP to address
urban management challenges, including dumping with the
river system and CBD, through identifying partnerships and
new approaches.
Next Steps
In the Second Phase of the TED Project, the TAT will support the CoT to conduct an evaluation of the
merits of the identified opportunities. This process will require high-level transversal engagement with
all affected line departments and units. An evaluation matrix tool will be utilised to record the outcome
of this engagement process. The results of the evaluation will guide the project steering team to re-
assess the identified opportunities to be incorporated in the TAT supported township economy
development strategy for Hammanskraal.
The section of the 8 projects will be determined in consideration of the following criteria AND weighting
(minimum number of projects) to ensure that the range of project interventions address economic,
socio-spatial and institutional change necessary for transformative development. The TAT will provide
a high-level indication of the ‘value-add’ from technical assistance in respect to the selected projects in
support of the need for a range of project interventions across the categories indicated above.

23
Table 2: Criteria for project selection
Criteria
Min
imu
m
# o
f P
roje
cts
aligns with identified City programme and project priorities. 4
can be funded by the City. 4
has an identified lead department / unit for implementation. 4
can unlock new partnerships via the CSP and non-state actors. 2
will benefit from CSP technical assistance. 4
can enhance productivity and stimulate economic multipliers. 4
will benefit emerging entrepreneurs and marginalised groups. 4
will enhance social cohesion, improve safety, and contribute to environmental sustainability. 1
will strengthen spatial integration. 1
will enhance the availability of decent housing and accommodation. 2
will enable immediate wins (within a 24-month timeframe). 4
will improve the township business environment and ecosystem services. 2
is replicable in other townships. 4
The TAT support may include:
• Partnership facilitation,
• Strategic and policy advice,
• Project conceptualisation and design,
• Business case development,
• Research support and knowledge sharing,
• Project monitoring & evaluation and impact assessment,
• Project submission within City and NT budgeting process,
• Project spatial and architectural design,
• Quick-win implementation,
24
• Support in the preparation of calls for proposals or tenders.
At the conclusion of the assessment process, and agreement on the ranking and weighting of the
identified opportunities, the TAT will then support the CoT advance 8 projects within the framework of
an overarching township development strategy.

25
II. Abbreviations and Acronyms
ANDE Aspen Network of Development Entrepreneurs
BBBEE Broad-Based Black Economic Empowerment
BBSDP Black Business Development Programme
BDS Business Development Support
BEPP Built Environment Performance Plan
CAHF Centre for Affordable Housing Finance
CBD Central Business District
CIS Co-operatives Incentives Scheme
CoT City of Tshwane
COGTA Cooperative Governance and Traditional Affairs
CSP Cities Support Programme
DSBD Department of Small Business Development
DIMS District Information Management System
ED Economic Development
EDP Guateng City Regional Economic Development Plan
EDSE Ecosystem Development for Small Enterprise programme
GCR Gauteng City Region
GDS Growth and Development Strategy
GGT Gauteng Growing Together
GIS Geographic Information System
GPG Gauteng Provincial Government
IMEDP Informal Micro-Enterprise Development Programme
MSDF Municipal Spatial Development Framework
MTEF Medium-Term Expenditure Framework
NDPP Neighbourhoods Development Partnership Programme
NT National Treasury
NYDA National Youth Development Agency
PPE Personal Protection Equipment
RMSDF Regionalised Municipal Spatial Development Framework
SEDA Small Enterprise Development Agency

26
SEFA Small Enterprise Finance Agency
SIGS Sustainable and Inclusive Growth Strategy
SLF Sustainable Livelihoods Foundation
SME Small and Medium Enterprises
SMME Small, Medium and Micro-Enterprises
SPLUMA Spatial Development and Land Use Planning Act, 2013
StatsSA Statistics South Africa
TAT Technical Assistance Team
TEA Township Entrepreneur Alliance
TED Township Economic Development Project
TEDB Township Economic Development Bill
ToC Theory of Change
TOD transit-oriented-development
TPS Town Planning Scheme
TREP Township and Rural Entrepreneurship Programme
TRS Township Revitalisation Strategy
WGB World Bank Group (South Africa)

27
III. Table of Contents
I. Executive Summary ................................................................................................................................3
II. Abbreviations and Acronyms .......................................................................................................... 25
III. Table of Contents ................................................................................................................................. 27
IV. List of Figures, Maps and Tables .................................................................................................... 32
1. Situation Analysis Aims ...................................................................................................................... 36
2. Cities Support Programme Overview ........................................................................................... 38
3. Township Economy Development Project Overview .............................................................. 39
3.1. Project Aims ................................................................................................................................................... 39
3.2. CSP TED Theory of Change ...................................................................................................................... 40
3.3. Project Partners ............................................................................................................................................. 41
4. Approach and Methods ..................................................................................................................... 43
4.1. Establishment of transversal team......................................................................................................... 43
4.2. Desk-top analysis ......................................................................................................................................... 43
4.3. Participatory engagement ........................................................................................................................ 44
4.4. Spatial information ...................................................................................................................................... 47
4.5. Ecosystem survey ......................................................................................................................................... 48
4.6. Site field research and engagement ..................................................................................................... 52
4.7. Sector specific investigations .................................................................................................................. 53
5. Limitations .............................................................................................................................................. 54
6. Project Site .............................................................................................................................................. 56
7. Institutional ecosystem ...................................................................................................................... 58
7.1. National government programmes ...................................................................................................... 58
7.1.1. Small Enterprise Development Agency .......................................................................................................................... 59
7.1.2. Small Enterprise Finance Agency ...................................................................................................................................... 60
7.1.3. Black Business Supplier Development Programme .................................................................................................. 60

28
7.1.4. Co-operative Incentive Scheme ........................................................................................................................................ 61
7.1.5. Shared Economic Infrastructure Facility ........................................................................................................................ 61
7.1.6. Informal and Micro Enterprises Development Programme .................................................................................. 61
7.1.7. The Small Business Innovation Fund............................................................................................................................... 62
7.1.8. Township and Rural Entrepreneurship Programme ................................................................................................. 62
7.1.9. SheTrade ..................................................................................................................................................................................... 63
7.1.10. District Information Management System ................................................................................................................... 63
7.1.11. Small Business Economic Development Portal ........................................................................................................... 64
7.1.12. The Integrated Township Economic Development Programme ......................................................................... 64
7.1.13. NYDA – Grant Programme .................................................................................................................................................. 64
7.2. Gauteng Province Programmes.............................................................................................................. 65
7.2.1. Growing Gauteng Together 2030 .................................................................................................................................... 65
7.2.2. The Township Economic Revitalisation Action Plan ................................................................................................. 66
7.2.3. The Township Economic Development Bill .................................................................................................................. 67
7.3. Other Enterprise Development Support ............................................................................................. 68
7.3.1. Gauteng City Region Development Plan (2015-2020) ............................................................................................ 69
7.4. City of Tshwane Programmes ................................................................................................................. 70
7.4.1. City Policies ................................................................................................................................................................................ 70
7.4.2. Capital Economic Outlook (2016) ..................................................................................................................................... 71
8. Enterprise activity ................................................................................................................................. 72
8.1. Micro-Enterprise Ecosystem .................................................................................................................... 72
8.1.1. Approach .................................................................................................................................................................................... 72
8.1.2. Business categories ................................................................................................................................................................ 74
8.1.3. Business dynamics .................................................................................................................................................................. 82
8.1.4. Access to utilities ..................................................................................................................................................................... 87
8.1.5. Operating challenges ............................................................................................................................................................ 91
8.2. Corporate and SMEs ................................................................................................................................... 95
8.2.1. Corporates .................................................................................................................................................................................. 95
8.2.2. SMEs ............................................................................................................................................................................................. 95
8.3. Business Hotspot surveys ......................................................................................................................... 99
8.3.1. Available services .................................................................................................................................................................... 99
8.3.2. Place categories ....................................................................................................................................................................... 99
8.3.3. Barriers to operating ........................................................................................................................................................... 104
8.4. Institutional services................................................................................................................................. 105
8.5. Township Wide Ecosystem .................................................................................................................... 108
8.5.1. Babelegi Industrial Park ..................................................................................................................................................... 108
8.5.2. Temba City Mall .................................................................................................................................................................... 108

29
9. Important Sectors .............................................................................................................................. 110
9.1. Creative Economies .................................................................................................................................. 110
9.2. Micro-Manufacturing and Repair, Installation and Maintenance (RIM) .............................. 111
9.3. Financial Inclusion ..................................................................................................................................... 111
9.4. 4IR ................................................................................................................................................................... 112
9.5. Automotive Sector .................................................................................................................................... 112
9.5.1. Stakeholders within the township automotive industry ...................................................................................... 112
10. Land use ................................................................................................................................................ 116
10.1. Land Administration Policies ................................................................................................................ 116
10.2. Development Plans .................................................................................................................................. 117
10.2.1. Metropolitan Spatial Development Framework, 2012.......................................................................................... 117
10.2.2. Regionalized Municipal Spatial Development Framework: Region 2, 2018 ................................................ 117
10.2.3. Hammanskraal/Temba Spatial Development Framework, 2012 ...................................................................... 117
10.2.4. Built Environment Performance Plan, 2017/18 ........................................................................................................ 117
10.3. Land Use Dynamics .................................................................................................................................. 118
10.4. Precint Plans ................................................................................................................................................ 122
10.4.1. Tsošološo Programme Precinct Plans.......................................................................................................................... 122
10.4.2. Kudube Smart City Profiling Report, 2019 ................................................................................................................. 122
11. Prioritised and high potential nodes .......................................................................................... 124
11.1. Overview ....................................................................................................................................................... 124
11.1.1. Land Administration ............................................................................................................................................................ 127
11.1.2. Infrastructure and Natural Systems .............................................................................................................................. 127
11.2. Hammanskraal CBD.................................................................................................................................. 130
11.3. Temba Local Node.................................................................................................................................... 140
11.4. Temba City ................................................................................................................................................... 148
11.5. Themba Square .......................................................................................................................................... 157
11.6. Temba Dam ................................................................................................................................................. 163
12. Housing ................................................................................................................................................. 169
12.1. Overview ....................................................................................................................................................... 169
12.2. Conceptual Framework: Housing as social, economic and financial asset ......................... 169
12.3. Housing as Social Asset .......................................................................................................................... 170
12.4. Housing as economic asset ................................................................................................................... 176
12.5. Housing as financial asset...................................................................................................................... 178

30
13. The Transport System ....................................................................................................................... 181
13.1. Transport Infrastructure .......................................................................................................................... 181
13.2. Development Challenges ....................................................................................................................... 182
13.3. Connectivity Between Different Modes ............................................................................................ 182
13.4. Transport Options and Services .......................................................................................................... 182
13.5. Integrated Public Transport Networks .............................................................................................. 183
13.6. Non-Motorised Transport ..................................................................................................................... 186
13.7. NMT Precedents ........................................................................................................................................ 187
13.8. Universal Access ........................................................................................................................................ 189
14. Infrastructure ....................................................................................................................................... 193
14.1. Overview ....................................................................................................................................................... 193
14.2. Digital Infrastructure ................................................................................................................................ 193
14.3. Water and Wastewater Infrastructure ............................................................................................... 195
14.3.1. Sewerage ................................................................................................................................................................................. 195
14.4. Stormwater infrastructure ...................................................................................................................... 196
14.5. Energy Provision ........................................................................................................................................ 198
15. Environment ......................................................................................................................................... 200
15.1. Overview ....................................................................................................................................................... 200
15.2. Urban Agriculture...................................................................................................................................... 200
15.3. Decentralised renewable energy (Solar PV and Biogas) ............................................................ 201
15.4. Recycling and Waste Management ................................................................................................... 203
15.5. Urban Ecosystem Risks ........................................................................................................................... 203
15.6. Policy and regulatory Obstacles .......................................................................................................... 204
16. Urban conditions and management ........................................................................................... 205
17. Social and Cultural Considerations .............................................................................................. 209
17.1. Urban Everyday .......................................................................................................................................... 210
18. Potential Project Opportunities .................................................................................................... 213
18.1. Policy and Strategy ................................................................................................................................... 215
18.2. Enterprise Development ......................................................................................................................... 215
18.3. Nodal Development ................................................................................................................................. 217
18.4. Spatial Integration .................................................................................................................................... 217

31
18.5. Housing and Property ............................................................................................................................. 218
18.6. Social and Community Infrastructure ............................................................................................... 218
18.7. Urban Management ................................................................................................................................. 218
19. Next Steps ............................................................................................................................................. 219
20. Annexures ............................................................................................................................................. 221
20.1. References.................................................................................................................................................... 221
20.2. Persons Consulted .................................................................................................................................... 222
20.3. Business Development Services .......................................................................................................... 224

32
IV. List of Figures, Maps and Tables
Figure 1: Examples of Content Published on the Hammanskraal Virtual Imbizo ............................................. 46
Figure 2: Interactive GIS Tool ................................................................................................................................................. 48
Figure 3: Ecosystem Survey Tool in the CommCare App ........................................................................................... 50
Figure 4: Fieldwork Team in Hammanskraal .................................................................................................................... 51
Figure 5: Overview of business size and legal status ................................................................................................... 74
Figure 6: Micro-enterprise businesses by enterprise classification ........................................................................ 75
Figure 7: Examples of Enterprises in Hammanskraal .................................................................................................... 78
Figure 8: Nationality of respondents .................................................................................................................................. 79
Figure 9: Respondent business roles and nationality .................................................................................................. 80
Figure 10: Respondent age and gender ............................................................................................................................ 80
Figure 11 Business infrastructure ......................................................................................................................................... 82
Figure 12: Many businesses require public access to function optimally ............................................................ 83
Figure 13: Occupation model and rent paid in ZAR ..................................................................................................... 85
Figure 14: Available utilities .................................................................................................................................................... 87
Figure 15: Time in business .................................................................................................................................................... 90
Figure 16: Comparison of respondent age and time in business ........................................................................... 91
Figure 17: Main operating challenges ................................................................................................................................ 93
Figure 18: Support deemed beneficial by respondents .............................................................................................. 94
Figure 19: Corporate businesses by enterprise classification ................................................................................... 95
Figure 20 SME businesses by enterprise classification ................................................................................................ 96
Figure 21: Access to services .................................................................................................................................................. 99
Figure 22: Hotspot place categories ................................................................................................................................ 100
Figure 24: Number of businesses per site type ........................................................................................................... 103
Figure 23: Informal traders at the taxi rank outside of the largely abandoned Temba City Mall ........... 103
Figure 25: Operating barriers .............................................................................................................................................. 105
Figure 26: Institutional services .......................................................................................................................................... 106
Figure 27: Institutional Services ......................................................................................................................................... 107
Figure 28: Temba City Mall as a township economy opportunity? ..................................................................... 109
Figure 29: The existing pedestrian bridge is poorly designed and a den for social deviance resulting in
the bridge not being used for commuters and pedestrians due to safety concerns. The relationship of

33
the bridge to the adjacent shopping anchors requires review to better locate it in the CDB and optimise
opportunity and connectivity. ............................................................................................................................................ 132
Figure 30: Extracts from the Virtual Imbizo Poll on Temba City Mall ................................................................. 150
Figure 31: The poorly performing Temba City Shopping Centre results in significant under-utilised space
in the precinct. These pockets of spaces are ideally suited to be conceptualised into the larger operations
off the precinct. ........................................................................................................................................................................ 150
Figure 32: The Themba Shopping Centre is largely defunct par for the existing retail anchor and well-
suited to being repurposed. The trading stalls and taxi rank outside are very busy spaces. ................... 151
Figure 33: This well-used square is a traffic island with recreational facilities and adjacent social and
business uses on the adjacent side of the street. The size, location, landscaping and amenities provided
assist in the value the square provides to the township residents. ..................................................................... 158
Figure 34: The banks of the dam is popularly referred to as Themba Beach and a valuable vantage point
to experience the dam. The natural ecosystem along this edge lends itself to a destination through
which the dam and its environments could be experienced. ................................................................................ 164
Figure 35: Housing Asset Values and their contribution to TED .......................................................................... 170
Figure 36: An example of housing typologies found in Hammanskraal ........................................................... 171
Figure 37: An example of housing typologies found in Hammanskraal ........................................................... 172
Figure 38: An example of housing typologies found in Hammanskraal ........................................................... 172
Figure 39: An example of housing typologies found in Hammanskraal ........................................................... 173
Figure 40: An example of housing typologies found in Hammanskraal ........................................................... 173
Figure 41: An example of housing typologies found in Hammanskraal ........................................................... 174
Figure 42: Sprawling formal and informal settlement .............................................................................................. 175
Figure 43: Proportion of businesses operating of a property or an impermanent structure ................... 177
Figure 44: Tenure Status for Micro-Enterprises in Hammanskraal ...................................................................... 177
Figure 45: Typical cross section of a complete street with walkway/cycle track ............................................ 190
Figure 46: Typical intersection layout with universal access design ................................................................... 191
Figure 47: Examples of non-motorised transport and universal access infrastructure interventions .... 192
Figure 48: Urban Management Issues ............................................................................................................................ 207
Figure 49: Potential Spatial Development Opportunities ........................................................................................ 214
Table 1: TED Opportunities in Hammanskraal ................................................................................................................ 18
Table 2: Criteria for project selection ................................................................................................................................. 23
Table 3: ATMs in Hammanskraal ....................................................................................................................................... 106
Table 4: Uses that are and are not permitted for Undetermined and Residential 1 Use Zones .............. 120
Table 5: Coverage permissions for Undetermined and Residential 1 Use Zones .......................................... 121

34
Table 6: Estimated yield of the Kudube Smart City Plan ......................................................................................... 122
Table 7: Status Quo of the Hammanskraal CBD Node ............................................................................................. 133
Table 8: Status Quo of the Temba Node ....................................................................................................................... 142
Table 9: Status Quo of the Temba Ciry Node .............................................................................................................. 152
Table 10: Hammanskraal transport infrastructure (based on GIS Map) ............................................................ 181
Table 11: Hammanskraal transport options and services........................................................................................ 182
Table 12: Project Opportunities in Hammanskraal .................................................................................................... 215
Table 13: Criteria for project selection ............................................................................................................................ 219
Map 1: Land Use, Hammanskraal CBD ............................................................................................................................... 13
Map 2: Water, Sanitation and Stormwater Infrastructure, Themba City .............................................................. 13
Map 3: Natural Features and Open Space ....................................................................................................................... 16
Map 4: Hammanskraal in the Context of the City of Tshwane ................................................................................. 57
Map 5: Businesses, Business Hotspots and Institutional Services ........................................................................... 73
Map 6: Micro-Enterprise Businesses by Enterprise Classification ........................................................................... 76
Map 7: Survey and Open-Source Micro-Enterprises by Classification .................................................................. 77
Map 8: Micro-Enterprise Respondent Gender ................................................................................................................ 81
Map 9: Micro-Enterprise Trading Structures ................................................................................................................... 84
Map 10: Micro-Enterprise Site Rental ................................................................................................................................ 86
Map 11: Micro-Enterprise Water Access ........................................................................................................................... 88
Map 12: Micro-Enterprise Electricity Access .................................................................................................................... 89
Map 13: Corporates and Micro-Enterprises ..................................................................................................................... 97
Map 14: Corporates and Micro-Enterprises - Open-Source Data .......................................................................... 98
Map 15: Business Hotspots ................................................................................................................................................. 101
Map 16: Vacant Land ............................................................................................................................................................. 102
Map 17: Zoning in Hammanskraal ................................................................................................................................... 119
Map 18: Nodes in Hammanskraal and Themba .......................................................................................................... 126
Map 19: Land Ownership ..................................................................................................................................................... 129
Map 20: Hammanskraal Central Business District Node.......................................................................................... 134
Map 21: Existing Land Use, Hammanskraal CDB Node ............................................................................................ 135
Map 22: Land Ownership, Hammanskraal CBD Node .............................................................................................. 136
Map 23: Water, Sanitation and Stormwater Infrastructure, Hammanskraal CBD Node .............................. 137
Map 24: Public Transport Infrastructure, Hammanskraal CBD Node ................................................................. 138
Map 25: Development Proposal, Hammanskraal CBD Node ................................................................................. 139
Map 26: Temba Node ............................................................................................................................................................ 143

35
Map 27: Proposed Land Use Temba Node ................................................................................................................... 144
Map 28: Zoning, Temba Node ........................................................................................................................................... 145
Map 29: Transport, Temba Node ...................................................................................................................................... 146
Map 30: Water, Sanitation and Stormwater Infrastructure, Temba Node ........................................................ 147
Map 31: Temba City ............................................................................................................................................................... 153
Map 32: Zoning, Themba City ............................................................................................................................................ 154
Map 33: Public Transport Facilities and Routes, Themba City ............................................................................... 155
Map 34: Water, Sanitation and Stormwater Infrastructure, Themba City ......................................................... 156
Map 35: Temba Square ......................................................................................................................................................... 159
Map 36: Zoning, Themba Square ...................................................................................................................................... 160
Map 37: Public Transport Facilities and Routes, Themba City ............................................................................... 161
Map 38: Water, Sanitation and Stormwater Infrastructure, Themba City ......................................................... 162
Map 39: Temba Dam .............................................................................................................................................................. 165
Map 40: Zoning, Temba Dam ............................................................................................................................................. 166
Map 41: Water, Sanitation and Stormwater Infrastructure, Temba Dam .......................................................... 167
Map 42: Electricity Infrastructure, Temba Dam ........................................................................................................... 168
Map 43: Property Growth Rate, Hammanskraal .......................................................................................................... 179
Map 44: Average Property Values, Hammanskraal .................................................................................................... 180
Map 45: Public Transport Facilities and Routes, Hammanskraal .......................................................................... 185
Map 46: Water, Sanitation and Stormwater Infrastructure, Hammanskraal .................................................... 197
Map 47: Electricity Infrastructure, Hammanskraal ...................................................................................................... 199
Map 48: Natural Features and Open Space, Hammanskraal ................................................................................. 202

36
1. Situation Analysis Aims
The Cities Support Programme (CSP) of National Treasury (NT) has entered into an agreement with the
City of Tshwane Metropolitan Municipality to provide the metro with technical support for formulating
and resourcing a township economy development (TED) strategy. The TED project of the CSP is a three-
year intervention to strengthen the capacities of the beneficiary metros to strategise, plan, fund,
implement and monitor TED projects within specific townships to achieve a meaningful economic
development impact. In Tshwane the selected site is Hammanskraal.
The Situation Analysis of Hammanskraal is an important output towards the process of developing a
TED development strategy. The aim of the situation analysis is to identify aspects and components of
the township economy that could benefit from project interventions within an overarching strategic
alignment. The purpose of the analysis is not to delineate or define projects, but to indicate
opportunities where projects could meaningfully contribute towards a TED outcome. The opportunities
we have identified in this report will, in subsequent steps in the project process, be further investigated
through a series of processes. These will include participatory engagement with members from the
community of potential beneficiaries and consultations with metro and other specialists. In addition, the
opportunities will be further assessed to understand the project risks and identify measures that could
enhance sustainability and align to support structures within the business ecosystem.
The draft Situation Analysis provides a status report on crucial aspects of the township economy. The
analysis focuses on: i) the business ecosystem, ii) township micro-enterprises, iii) the land use systems
and characteristics, iv) strategic spatial nodes, including precincts, v) housing, vi) public transport, vii)
physical infrastructure, and viii) the environment.
The draft report will be circulated to stakeholders in the relevant line departments, as identified in the
project transversal planning process. The TED consultant will then engage with representatives from
these departments with the purpose to stress test the data contained in the report, obtain additional
information and data, and consider alternative perspectives on the findings. These inputs will then be
incorporated within a second draft. The revised draft will then provide an evidence platform to inform
the identification of projects and development of the TED strategy. We anticipate that the process of

37
finalising the Second Draft Situational Analysis Report will be concluded on or before the end of April
2021.

38
2. Cities Support Programme Overview
The Cities Support Programme is a multi-year demand-driven umbrella programme within the National
Treasury that aims to support the development of productive, well-governed, inclusive and sustainable
cities (http://csp.treasury.gov.za). The CSP operates within South Africa’s eight metros focused on the
following thematic components: Governance and Fiscal Sustainability, Climate Resilience, Economic
Development, Human Settlements and Public Transport. The CSP focuses on strengthening metro
capabilities through three core focus areas: one, city leadership and governance, two, integrated
planning and delivery within city spaces, and three, building an enabling environment for cities through
appropriate financial, fiscal frameworks and instruments and the refinement of sectoral policies,
regulations and support capabilities.
The economic development (ED) component of the CSP programme supports projects across all three
focus areas. Projects to support city partnerships for inclusive growth and regional economic
development collaboration are focused on building city economic development leadership and
governance capabilities. The Industrial Park Revitalisation, Sub-National Doing Business (a project that
enables cities to become more competitive in business processes related to small firms registering
property, receiving construction permits and getting electricity), and Township Economic Development
projects aim to strengthen integrated planning and delivery within city spaces. Finally, there are three
projects that intend to strengthen the enabling environment for metros, namely: Spatialised City
Economic Data; Economic Development Data Strategy; and City Incentives Review and Policy.
39
3. Township Economy Development Project Overview
3.1. Project Aims
The Township Economic Development Project is a 3- year project with technical support in the form of
a multi-disciplinary professional team. The project commenced in February 2020 and will conclude in
February 2023. The CSP has entered a memorandum of understanding with the City of Tshwane (CoT)
to implement the project in one township community.
The CSP appointed the Sustainable Livelihoods Foundation (SLF) NPC (www.livelihoods.org.za) to
implement the project. The professional technical assistance team (TAT) of consultants comprises a team
leader; a small-business development advisor, a social scientist, a spatial planner, a public transport
expert, a housing specialist, an infrastructure development advisor, an environmental expert and
community liaison persons.
The SLF TAT partner is mandated to work with the City to conceptualise an overarching TED strategy
for the selected township. The strategy will comprise a development vision, the delineation of specific
project (up to 8 projects), and a programme for implementation. The TAT partner will collaborate with
CoT to align the strategy to existing and emerging development frameworks, strategies and projects.
The TAT will advance the implementation of the strategy through specific projects. These projects will
derive from the unique development challenges and opportunities within each the site and hence
respond to, inter-alia, metro enterprise policy and strategy requirements; the building of partnerships
for project implementation; the need for business infrastructure in high potential precincts or nodes;
the improvement in the delivery of enterprise development support services; transversal alignment
within the metro and strengthened linkages across government; market development; and investment
in infrastructure.
In formulating projects and implementation plans, the TAT will facilitate a process of participatory
engagement at the township level to ensure that projects are responsive to the needs, capabilities, and
priorities of the beneficiaries. Within the metro, the TAT will facilitate a transversal planning process with
the aim to advance projects with spatial impact, whilst synergising resources and ensuring alignment
with sector plans. The intention is to support a range of projects that impact directly through business
support services and indirectly measures that improve the business environment and urban condition.

40
It is anticipated that the TED strategies will provide the CoT with a replicable area-based development
approach. As a technical assistance intervention, the project plans to leverage institutional impacts
through knowledge sharing, strengthening metro strategies and policies, and through facilitating
transversal planning processes. The TED project, furthermore, aims to benefit the metro through the
building of new partnerships and arrangements for the implementation of economic development
projects, the sourcing of funding, and gaining access to specialist knowledge and expertise.
The TED project will be undertaken in 7 Steps. The first step (step 1) requires a detailed situation analysis
of the socio-spatial, infrastructural and economic characteristics of the target township. The current
document contributes towards this output.
3.2. CSP TED Theory of Change
The TED project adopts an area-based approach to concentrate development within a specific
geographic site to address the pressing needs for local economic development and to reduce the
apartheid spatial and social legacies. The CSP has proposed a project Theory of Change (ToC) that
situates people and their communities at the heart of the development process. The foundation analysis
to this ToC is contained in the Township Economies Series #5: A framework for the development of
metro-strategies produced during the first phase of the CSP. In the ToC, townships are recognised as
spatially distinct areas that are structurally disconnected from the wider economy and therefore require
a spatially and systems-oriented development approach. The CSP framework identified four central
influences on TED development:
I. the provision (and quality) of public goods and services,
II. the regulatory environment that enables and constrains opportunities for business
development (and social enterprises),
III. the organisation of society through informal institutions (rules, customs, constraining behaviors
etc.) and organizational forms (groups, associations, stokvels, neighborhood watches etc.),
IV. and the character and orientation of economic activities in general and businesses in particular.
As a foundational principal, the CSP ToC holds that spatial factors have a strong influence on both social
organisation and economic activities within townships. Hence TED must address spatial obstacles and
enhance spatial opportunities for inclusion in local economic activities as well as the wider economy. At
41
the project commencement, the TAT have highlighted a further set of components within the
development processes. These include:
• The requirement for a context specific understanding of the physical, social and psychological
needs of township communities,
• The need to understand the range of shocks that cause or enhance economic vulnerability and,
at the same time, the human responses, including coping mechanisms, that enhance social
resilience.
• The importance of actions to strengthen accountability and governance, within the metro and
down to benefiting communities.
In supporting the Tshwane to develop TED strategies, the TAT support will clarify the methodological
approaches to identifying and prioritising TED interventions. The strategies will detail the logical
relationships between actors, resources, activities and outcomes in the development, specifying
indications against which the TED strategies can be evaluated and assessed. Each TED strategy will
provide a crucial opportunity for learning and knowledge sharing, as well as a reflection on the validity
of the CSP’s ToC thinking.
3.3. Project Partners
The CSP has entered partnerships to amplify the TED project. These include partnerships with the
European Union supported Ecosystem Development for Small Enterprise programme (EDSE), the World
Bank Group (South Africa) (WBG), and the Aspen Network of Development Entrepreneurs (ANDE). The
EDSE partnership aligns the TED project with the technical assistance to the Department of Small
Business Development. This partnership will enable the TED project to facilitate metro and project access
to development support opportunities within a broader ecosystem centred on the DSBD, which includes
the Small Enterprise Development Agency (SEDA) and the Small Enterprise Finance Agency (SEFA). The
EDSE programme provides linkages to private sector led opportunities and leverage to engage on
matters of policy and strategy.
The World Bank Group offers technical and financial leverage to support the TED project development
process in accordance with a partnership agreement that is in place with National Treasury. This support
includes providing opportunities to metros to utilise the CSP’s Economic Strategies Support Facility
within the World Bank to access global expertise for advice on complex challenges. Furthermore,
through the WBG’s support to metros and local organisations focused on strengthening and improving

42
efficiencies within the township housing market, the WBG provides an opportunity for alignment of
technical expertise, as well as funding to pilot an intervention to develop the township accommodation
rental market segment. The ANDE partners offers further opportunities for technical co-operation and
knowledge sharing.
The CSP TED project will work synergistically with the Neighbourhood Development Partnership
Programme (NDPP) of National Treasury. The NDPP provides financial and technical investment towards
the development of nodes and precincts that strengthen the township economy. The TED project has
drawn on and sought to advance the situational reports and design proposals for identified NDPP sites
of strategic importance in the benefiting townships. The TED project will aim to enhance these
investments through, inter alia, strategizing an enterprise-led approach to strengthening precinct
management and identifying projects to support business opportunities.
43
4. Approach and Methods
The TAT undertook a series of steps in preparing the situation analysis. The seven steps that we highlight
below were undertaken simultaneously.
4.1. Establishment of transversal team
The project was institutionally landed in an initial series of high-level engagements, which commenced
in 2019. In this project introductory phase, the TAT team was introduced to the metro departments of
economic development and CSP metro co-ordinator. The metro leadership team appointed a dedicated
project lead whose roles included the establishment of a transversal planning team and support to the
TAT in accessing data and conducting sector engagements.
4.2. Desk-top analysis
The TAT team identified all relevant municipal planning documents. These included the Built
Environment Performance Plans (BEPP); spatial development frameworks (SDF); district development
plans (DDP), local area plans (LAP) and plans for specific nodes; and integrated public transport network
(IPTN) plans. In addition, we accessed feasibility studies for economic projects. Through examining these
documents, we were able to comprehend metro spatial and economic development priorities situated
within Hammanskraal. The subsequent ecosystem survey and field research investigation focused on
the identified nodes, precincts and high streets. The consulted plans and literature are listed in Annexure
A. We identified a total of 122 sources, comprising official publications, academic publications and
unpublished reports.
To understand the history, structural nature of the benefiting township economies and sociological
characteristics of Hammanskraal, the TAT partner undertook a survey of professional (grey) and
academic literature on the subjects of economic development, spatial planning and township enterprise.
In addition, we investigated the ‘urban everyday’ through scanning newspaper articles and social media
postings. The academic and social media information would shape our approach to participant
engagement via the virtual imbizo.
44
The desk-top analysis enabled the TAT to identify aspects of the township economy in Hammanskraal
that have undergone transition or recently emerged in response to changing ecosystem opportunities
and market conditions. Finally, the literature review gave the TAT an insight into the social relationships
that underpin business practices and shape the environment in which micro-enterprises operate.
4.3. Participatory engagement
In the context of Covid-19, the TAT instituted on-line engagements. This was achieved through the
establishment of a Hammanskraal Virtual Imbizo page on Facebook. To initiate support for the page,
the TAT ran a series of advertisements and promotional campaigns which offered air-time vouchers as
prizes for the ‘best’ contribution posted on the page via images or text. As a support base was
established, the TAT utilised the Virtual Imibizo to investigate socio-economic conditions and business
developments in Hammanskraal. These interventions included campaigns to understand innovative
forms of non-motorised transport; to investigate the scope of activities within the creative sector; and
understand peoples’ leisure time activities. Through the virtual imbizo page, the TAT was able to recruit
local field research to support the TAT undertake the ecosystem surveys.
The Virtual Imbizo has also been used to advertise local businesses identified through field work and
action research interventions. This platform has also been used to post relevant business and job
opportunities. Engagement has also been fostered by disseminating the ecosystem survey results,
through a series of infographics and polls about which interventions people believe are priorities in key
locations in the study area.
SLF is involved in a project with the National Lotteries Commission of South Africa to produce a 30-
minute visual product on township life in South Africa. The competition’s mandate is to find creatives
(videographers and musicians) to participate in this project. The competitions have been a good source
of content engagement and have been useful in generating traffic to the virtual imbizo pages.
At the time of writing this report, the Hammanskraal Virtual Imbizo has achieved the following level of
support:
• Likes: 559
• Follows: 567
45
The Virtual Imbizo page recognises the multi-stakeholder composition of the TED development process,
including the City, project partners and the CSP. The TAT will manage the page for the duration of the
project. The short-term goal is to increase the level of community participation to a minimum of 1000
unique followers.

46
Figure 1: Examples of Content Published on the Hammanskraal Virtual Imbizo

47
4.4. Spatial information
To analyse the spatial dynamic of the site, the TAT obtained geospatial data from open sources and the
City. The goal was to obtain data on land use (zoning schemes), cadastral boundaries, social and
community infrastructure, water and sewerage systems, electricity networks, telecommunications,
natural features and roads and transport infrastructure. In some instances, this information was
unavailable.
From open sources (including Google Maps), the TAT identified businesses operating within the project
site and immediate surrounds.
All geospatial data has been compiled into a data portal. The portal has been utilised to examine the
development opportunities / limitations within the project site, from the area-wide perspective to the
micro-context of streets, nodes and precincts. Further, the data portal permits an analysis of the
relationship between the identified business activities (from open sources and the survey) across the
scope of the site and the physical relationship between businesses and the built and natural
environments and public infrastructure. The data portal comprises an important output of the situational
analysis process. The datasets have been compiled within a single PDF file, within which the document
contains a series of spatial layers that include the aerial imagery, site boundaries, land use, public
infrastructure and economic data. The PDF tool permits users to enable or disenable the GIS layers and
hence focus on specific issues and data relationships.

48
Figure 2: Interactive GIS Tool
The TAT undertook a spatial analysis of identified high streets, business nodes and development
precincts. The precise area of these spaces has been illustrated. The site layout, cadastral units and land-
use zones have been extracted from the geospatial portal and represented within these diagrams.
Within each of these micro-context analyses, we have sought to indicate the proposed building
footprint of developments as identified in project plans. We have utilised annotated photographs and
field research notes / observations to comment on the economic potential of these spaces.
4.5. Ecosystem survey
The TAT developed an ecosystem survey instrument to collect data in the field. The research approach
was to obtain information on the total ecosystem of businesses and institutional services within the site.
The research focussed on economic high streets, business precincts, retail hub and identified nodes /
precincts. A multi-component questionnaire, the research instrument comprised: i) a business survey; ii)
a survey of places at which business is conducted (‘hot spot’ analysis); iii) a survey of institutions
(including financial institutions); and iv) a stakeholder survey.
The data gathering process was undertaken by a team of field researchers. The TAT team recruited, via
the virtual imbizo platforms, and trained local researchers for this purpose. In the field, information was
recorded on hand-held tablets, with the questionnaire built within the CommCare app. The tablets

49
permitted the researchers to capture photographic and geospatial data, whilst the app enabled the data
to be safely stored in the cloud.
Field research was undertaken from August to November 2020. The local field researchers were
supported by experienced SLF researchers & consultants as well as collaborators from the EDSE project.
The 7 local field researchers were selected from 109 applications. Measures were instituted to ensure
that the field research team adhered to recommended guidelines to minimise exposure to COVID-19.
In Hammanskraal the researchers undertook 499 interviews, which included surveys of 368 township
micro-enterprise businesses. We recorded 54 small and medium enterprises (SMEs) (including larger
non-corporates), 7 corporates, 27 business ‘hotspots’, and 37 institutional services including ‘financial
services’. During the field research, the team undertook interviews with 6 local stakeholders. Further
interviews will be undertaken in Project Step 2.

50
Figure 3: Ecosystem Survey Tool in the CommCare App

51
Figure 4: Fieldwork Team in Hammanskraal

52
Description of figures 1 -4:
1. Covid-19 control protocols were instituted on a daily basis.
2. The survey focussed on key hotspots.
3. All micro-enterprises were surveyed in-situ.
4. A field worker interviewing a survey participant.
4.6. Site field research and engagement
The TAT undertook an immersed field research process to understand the socio-economic
characteristics of business and urban dynamics. The research methods were largely qualitative. These
included: ethnographic observations and note taking; capturing photographs of sites and aspects of the
township economy including the use of space; conducting interviews with key persons, business
operators and representatives of trader / business associations. To obtain data, the TAT walked across
transects within the site. We specifically inspected sites that contribute towards ‘place making’ and social
cohesion in the site. These included:
• The Central Business District (CBD) precinct, including some informal traders,
• Renbro Centre,
• Temba City precinct,
• The Old Warmwatersbad Road (R101) from the city centre towards the Babelegi Industrial park,
• Harry Gwala Avenue, including the areas surrounding the Jubilee Mall,
• Temba Road,
• Temba dam,
• Crafters Market, Dinokeng Reserve,
• Temba Stadium,
• Temba square,
• Mandela Sports Ground / Hammanskraal Sports Complex,
• Dilope.
The enterprise surveys were mainly undertaken with the CBD, along the R101, within the Temba City
Precinct, and along Harry Gwala Avenue. The team endeavoured to interview traders within the ‘station’
precinct but were frustrated from undertaking the research through ‘gatekeeping’ by the trader
committee leadership.
53
The team inspected the taxi ranks at the Renbro Centre, the Kopanong Centre, and at the Jubilee Mall.
4.7. Sector specific investigations
In accordance with the CSP theory of change, the TAT undertook a series of sector specific studies into
essential aspects of the township economy. This research sought to characterise the state of knowledge
and identify both opportunities and constraints for leveraging economic growth and business
development. An important component of this research was the engagement with metro specialists. In
some instances, the TAT has struggled to obtain internal reports / information and to secure meetings
with counterparts. In revising the draft and formulating the second draft, the TAT will endeavour to
schedule further meetings to address knowledge gaps and obtain missing data. These gaps have been
highlighted within the relevant sector status reports.
A notable challenge in undertaking the sector specific studies was the relative scarcity of area-based
data. To mitigate this challenge, the TAT has sought to access unusual data sources, including private
sector datasets and qualitative data. Through the CSP partners and collaborators, the TAT has sought
to obtain insights and data on specific aspects of the township economy. In this respect, the CSP’s
spatialised city economic data project has provided anonymised tax-return information on a limited
range of data variables, derived from the tax returns of the businesses operating within the site. From
the Centre for Affordable Housing Finance Africa (CAHF), the TAT have obtained data on formal market
property transactions. Since the TAT has considerable experience in township research, SLF could
contribute datasets and qualitative evidence to address knowledge gaps. We report on the analysis of
these datasets in the relevant sections.

54
5. Limitations
The Situation Analysis is a rapid research output, developed through consulting existing reports, utilising
available dataset, engaging with stakeholders and brief field research, including primary data collection.
The approach does not permit the TAT to undertake extensive surveys and consultation. The area-based
focus on a single township is a novel approach to development planning. Yet it should be noted that
the project site does not neatly fit into the geographical area / units used in statistical enumeration, in
particular the Sub-Place and Main Place boundaries as defined by Statistics South Africa (StatsSA). Nor
do the areas align with ward boundaries (which are re-assessed and realigned after local government
elections), but instead the project site includes multiple wards. Whilst Hammanskraal falls within the
municipal boundaries, it comprises multiple land administration systems, both the metropolitan system
and traditional authority systems.
The complexities in characterising the site are also reflected in the general shortage of site specific data.
Cities do not, as a matter of routine, collect and update geospatial data on township business activities,
whilst informal businesses or micro-enterprises operate in spatially fluid patterns and tend to resist
statistical enumeration. Open-source data, whilst providing an additional data source, also does not
reflect the frequent changes in the micro-enterprise environment. The data we obtained thus includes
businesses that are no longer in operation.
Shortly after the commencement of the project, the Covid-19 pandemic necessitated strict control
measures (lockdown), which then limited opportunities for in-person engagements and field-based
activities. Online engagements were instituted and proved to be a partially effective substitution for in-
person meetings and consultations. But whilst these engagements would permit organisational
efficiency, they did not enhance the process of building repour with the project steering team and nor
were more thorough day-long workshop possible. The TAT was only able to commence field research
after the introduction of level 3 restrictions. Despite our efforts to facilitate transversal planning
processes, the TAT was not able to consult with all relevant City stakeholders. Similarly, the TAT was
unable to access the necessary GIS information and project plans.
The ecosystem survey method was intended to provide an initial insight of business activities within the
township context. The approach was to conduct the survey on the high street and within specific nodes.
It was not possible to survey all contexts and situations, and thus we intentionally excluded residential

55
sites and transport operators. Since participation in the survey was voluntary, several business operators
did not participate for various reasons including their desire to avoid enumeration and fear of state
interference in their business practice (formalisation).

56
6. Project Site
Hammanskraal is situated approximately 45km north of the Pretoria CBD. The site is positioned on the
provincial boundary between North West and Gauteng, falling into Region 2 of the City of Tshwane.
The site comprises a core area and a secondary area. The core area comprises the following sub-places
(StatsSA): Babelegi Industrial, Marokolong SP, Temba Unit 1, Kanana, Kudube Unit2, and Leboneng. The
focus on the urban core, including the CBD, aligns with City priorities to foster economic development
in the commercial heart of the area. The secondary area comprises the sub-places of: Kudube Unit 10,
Kudube Unit 11, Sekampaneng, Ramotse, Kudube Unit D, Temba Unit D, and Temba Unit 11. The area
is shown in Map 1.

57
Map 4: Hammanskraal in the Context of the City of Tshwane

58
7. Institutional ecosystem
Townships are spatially distinct areas, structurally disconnected (in large extent) from the wider city
economy. The nature of society within these geographically marginalized spaces is, to a large extent,
shaped by four framework influences:
• the provision (and quality) of public goods and services,
• the regulatory environment which enables and constrains opportunities for business
development (and social enterprises),
• the organisation of society through informal institutions (rules, customs, constraining
behaviors etc.) and organizational forms (groups, associations, stokvels, neighbourhood
watches etc.) and,
• the character and orientation of economic activities and businesses.
Various government strategies at national, provincial and metro levels have been evolved to support
the reshaping of the above influences and enhancement of economic opportunities within township
economies.
7.1. National government programmes
The Department for Small Business Development (DSBD) is the national government agency
responsible, with its associated agencies, for enabling enterprise support. DSBD has mandated to
operate the Small Enterprise Development Agency (SEDA) and the Small Enterprise Finance Agency
(SEFA). Furthermore, according to DSBD, government programmes at a national level of relevance to
township economic development include the following:
• New incentives (with the Medium-Term Expenditure Framework (MTEF) period),
• The Small Business and Innovation Fund (R3,2b),
• Black Business Supplier Development Programme (R906m),
• National Informal Business Upliftment Scheme (R248m),
• Enterprise Incubation Programme (R186m),
• Craft Sector Programme (R36m),

59
• SheTrades,
• Township Entrepreneurship Fund,
• Township and Rural Entrepreneurship Fund (TREP).
Outside of the DSBD, other national government initiatives include those by Cooperative Governance
and Traditional Affairs (COGTA), and the National Youth Development Agency (NYDA), in particular:
• The Integrated Township Economic Development Programme (COGTA)
• The NYDA Grant Programme.
The DSBD also directly manages the Black Business Development Programme (BBSDP), Co-operatives
Incentive Scheme (CIS), Shared Economic Infrastructure Facility (SEIF) and the Informal Micro Enterprise
Development Programme (IMEDP). Some of the key partners and programmes under the DBSD
mandate are discussed below:
7.1.1. Small Enterprise Development Agency
SEDA is an agency of the DSBD with a mission to develop, support and promote small enterprises
throughout the country through non-financial business support. By 2019, Seda had a network of 53
branches, 17 information kiosks, 74 outreach offices where Seda shared with other ecosystem partners
and 76 incubation centres. In 2019, Seda reported that 6,957 new jobs were created and 19,064 jobs
sustained by supported clients.
An ecosystem appraisal undertaken as part of the inception of the EU Small-Medium and Micro-
Enterprise (SMME) Support Programme observed that although Seda was designed to be the premier
hub for the delivery of Business Development Services (BDS), it is only a small player among a large
number of institutions that fund and support SMMEs, without a key role in coordinating the market for
BDS. Though Seda has attempted to act as a coordinator, notably in the incubator space, these efforts
have not been reaching SMMEs in large numbers.
The EU Inception Report noted that whilst South Africa has a highly developed BDS market, it is
insufficiently accessible for different types of SMMEs and the quality is not always at the level required.
SEDA, however, has not been in a position to resolve these issues. SMMEs face challenges in accessing
supply chains without the support and would benefit from support through an organisation able to

60
identify opportunities and facilitate programmes (BDS, financial services) that could enable access to
these markets.
More recently, SEDA has shifted strategy to focus on becoming an effective facilitator of the BDS market
in South Africa rather than a direct provider, focused on strengthening the SMME support eco-system.
As part of this role, it is developing minimum standards and a registration platform for BDS providers,
as well as mapping and coordinating public and private incubators. It is also actively transitioning to
delivery based on the government’s new District Model initiated for development implementation in
2019.
7.1.2. Small Enterprise Finance Agency
Since 2017, SEFA has facilitated funding to 2,946 township-based/owned enterprises amounting to R199
million. The focus on supporting township-based/owned businesses was in line with the call from
government to develop rural and township economies into more economically and socially sustainable
communities. SEFA’s disbursement to township-owned enterprises makes up just 1% of the total SEFA
investment into the South African economy of R6.8 billion. This funding was disbursed through SEFA’s
different loan programmes as follows: Direct Lending (R108 million), Wholesale SMEs (R52 million);
Khula Credit Guarantee (R13 million), Microfinance (R22 million) and Co-operatives (R3 million). A
Township Entrepreneur Fund has recently been announced.
7.1.3. Black Business Supplier Development Programme
The BBSDP was introduced in 2002 to address the limitations associated with the participation of black
owned small enterprises in the mainstream economy. The BBSDP is a cost-sharing grant offered to
black-owned small enterprises to assist them to enhance their competitiveness and sustainability to
facilitate their integration into the mainstream economy. It provides grants to a maximum of R800 000
for tools, machinery and equipment and R200 000 for business development and training interventions
per eligible enterprise to improve corporate governance, management, marketing, productivity and use
of modern technology.
The BBSDP provides funds to black owned township enterprises. The support to township enterprises
has decreased from 123 (R56.2 million) to 77 (R37.9 million) from 2016-2019. The budget for the current
MTEF is R906m.
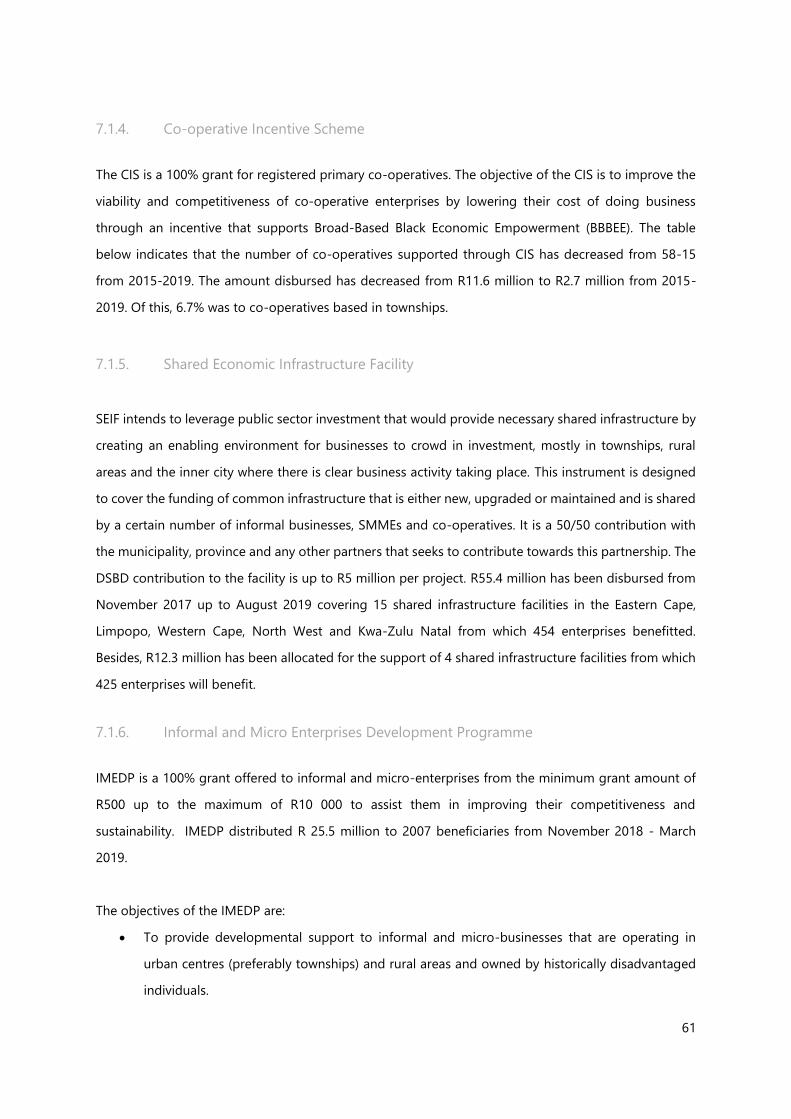
61
7.1.4. Co-operative Incentive Scheme
The CIS is a 100% grant for registered primary co-operatives. The objective of the CIS is to improve the
viability and competitiveness of co-operative enterprises by lowering their cost of doing business
through an incentive that supports Broad-Based Black Economic Empowerment (BBBEE). The table
below indicates that the number of co-operatives supported through CIS has decreased from 58-15
from 2015-2019. The amount disbursed has decreased from R11.6 million to R2.7 million from 2015-
2019. Of this, 6.7% was to co-operatives based in townships.
7.1.5. Shared Economic Infrastructure Facility
SEIF intends to leverage public sector investment that would provide necessary shared infrastructure by
creating an enabling environment for businesses to crowd in investment, mostly in townships, rural
areas and the inner city where there is clear business activity taking place. This instrument is designed
to cover the funding of common infrastructure that is either new, upgraded or maintained and is shared
by a certain number of informal businesses, SMMEs and co-operatives. It is a 50/50 contribution with
the municipality, province and any other partners that seeks to contribute towards this partnership. The
DSBD contribution to the facility is up to R5 million per project. R55.4 million has been disbursed from
November 2017 up to August 2019 covering 15 shared infrastructure facilities in the Eastern Cape,
Limpopo, Western Cape, North West and Kwa-Zulu Natal from which 454 enterprises benefitted.
Besides, R12.3 million has been allocated for the support of 4 shared infrastructure facilities from which
425 enterprises will benefit.
7.1.6. Informal and Micro Enterprises Development Programme
IMEDP is a 100% grant offered to informal and micro-enterprises from the minimum grant amount of
R500 up to the maximum of R10 000 to assist them in improving their competitiveness and
sustainability. IMEDP distributed R 25.5 million to 2007 beneficiaries from November 2018 - March
2019.
The objectives of the IMEDP are:
• To provide developmental support to informal and micro-businesses that are operating in
urban centres (preferably townships) and rural areas and owned by historically disadvantaged
individuals.

62
• To strengthen the capacity of credible informal and micro-enterprises to be sustainable through
the provision of access to information, business development support services and business
infrastructure (machinery, tools, equipment).
7.1.7. The Small Business Innovation Fund
The SBIF was announced in 2019 and provides a mixture of grants and loans through a new blended
finance model fund that aims to finance 100 000 young entrepreneurs. The grant portion will be up to
a maximum of R2.5-million per enterprise. The fund is run jointly by the DSBD and the Department of
Science and Technology; the grant is administered by SEFA. It is targets black-owned businesses in
townships and rural areas.
According to Minister Ntshavheni (Parliamentary Briefing, 10 July 2019), applicants must have the
potential to create at least 10 jobs to be eligible for funding. The National Treasury’s 2019 Budget
Review notes that R3.2-billion has been set aside over the next three years for the fund, which it will
lend to small business intermediaries, including fund managers and incubators. It is these intermediaries
will fund and support ideation and start-up companies, and small businesses focusing on innovation.
The blended finance model will be tested initially through the fund before consideration is made to
extend it to the government’s other small business financing agencies. According to the Minister, The
Land Bank has already agreed to partner with the DSBD to provide finance for small-scale (emerging)
farmers.
7.1.8. Township and Rural Entrepreneurship Programme
The DSBD, as part of its response to COVID19, initiated TREP to channel support to the township and
rural enterprises in the listed sectors, with the allocated budget support:
• Auto body repairers & mechanics: R225 million
• Bakeries & confectioneries: R100 million
• Clothing, textile and leather: R105 million
• Tshisanyama (braai restaurants): R 50 million
• Spaza shops support programme: R138.5 million
• Personal care services: R90 million
Current priorities within the programme include:

63
• Small-scale Bakeries – the assistance comes in the form of a financial package, through SEFA,
structured to cover the cost for equipment and working capital. It also proposes an off-take
agreement with Spaza’s for distribution of goods.
• Informal and small-scale clothing/textile producers – this support is aimed at the funding of
small clothing or textile makers but with a big push on PPE (Personal Protection Equipment)
manufacturing. The improvement in quality manufacturing of garments is also taken into
consideration that will enhance competitiveness.
• Automotive Aftermarkets Support – is aimed at independent automotive aftermarkets
businesses or enterprises located in townships and villages. This programme also prioritizes
informal fitment centres, qualified motor mechanics to operate an authorized repair centres,
qualified auto motor body repairers, and distributors of aftermarket auto parts.
7.1.9. SheTrade
The SheTrade digital platform is a programme for female entrepreneurs, jointly supported by DBSA and
SEDA. SheTrade aims to enhance support to women by connecting beneficiaries to potential investors,
business support organisations, and potential buyers. Through SheTrade platform, female
entrepreneurs will be exposed to a global market by connecting nationally, and regionally with other
female entrepreneurs and networks. The goal is to have 250 000 women-owned or led businesses
connect to markets by 2023.
7.1.10. District Information Management System
An ongoing challenge faced by the different levels of government, department agencies and
programmes is in the coordination of BDS services. Due to poor coordination, the SMME development
landscape is fragmented. As a consequence, consolidated data cannot be produced as data being held
across multiple platforms. The newly initiated DIMS will more effectively rack BDS interventions and the
impact thereof, offer quality assurance and improved enterprise supplier development, and enable
shared information in the BDS ecosystem. A key benefit of the DIMS is alignment with the existing
datasets of the DSBD and agencies in a “single version of the truth”. The DIMS is to be managed by
SEDA, but will be access to the BDS ecosystem as a whole.

64
7.1.11. Small Business Economic Development Portal
The Small Business Economic Development Portal – an initiative by the Department of Small Business
Development, SEFA and SEDA has been established to draw in and register SMMEs for support from
the department – in particular linked to the economic downturn caused by the COFID-19 pandemic.
This is coordinated through the website www.smmesa.gov.za and a hotline. The portal and initiative
includes:
• SMME Finance relief scheme soft loan facility for COVID-19 relief
• Business growth and resilience facility – linked to health care product suppliers in the fight
against COVID-19
• Restructuring of SEFA funded loans – payment holidays for SEFA funded SMMEs to reduce
burden of obligations during the COVID-19 pandemic
• Informal sector – programmes for business owners, spaza shops and the self employed
7.1.12. The Integrated Township Economic Development Programme
The Integrated Township Economic Development Programme is designed to respond to the need to
position townships as the foremost intervention of government, in developing thriving local economies.
Specific programmes will be designed to complement the needs of townships and these packaged
interventions. The programme is anchored in the following strategic pillars:
• Mapping and profiling of townships
• Eco-systems for township economies
• Economic Infrastructure and technology development
• Exemption incentives for township economies
• Investment strategies of township economies
• Spatial Transformation of township economies
• Image enhancement of township economies
7.1.13. NYDA – Grant Programme
The NYDA is designed to provide young entrepreneurs with an opportunity to access both financial and
non-financial BDS to establish or grow their businesses. The target audience is a range of potential
youth beneficiaries. The BDS includes cooperative development programme, business management
training, mentorship, and business consultancy services. The programme provides funding for
individuals or enterprises, with certain sectors eligible for up to R250 000 in partial, co-funding or

65
towards loan deposits. Young entrepreneurs can access a voucher programme that allows for them to
get business support from a NYDA approved BDS service provider. The vouchers range from R6 600 –
R19 800.
7.2. Gauteng Province Programmes
The Gauteng Provincial Government (GPG) has prioritised township economic development, with the
first phase of its Township Revitalisation Strategy (TRS) covering the period 2014 – 2019, and a second
phase currently being finalised. Within the TRS framework it has been recognised that strategic
accessibility and connectivity to markets is required to transform township economies – rather than a
model in which every facility and support institution is replicated in every township.
7.2.1. Growing Gauteng Together 2030
Growing Gauteng Together (GGT) 2030 was launched at the 2020 State of the Province Address (SOPA)
by the Premier, David Makhura. GGT aims for ‘building sustainable development for all’, creating jobs
and opportunities, with a focus on the Gauteng City Region (GCR). In its economic policy, GGT aims to
develop social agreements with the private sector, labour and communities in relation to the following
ten high-growth sectors:
• Energy, with a focus on new technologies and a diverse energy mix,
• Transportation and Logistics,
• ICT, Media and Digital Services – the digital economy,
• Tourism and Hospitality,
• Agri-food and Agribusiness, focusing on value chains,
• Construction and Infrastructure,
• Automotive, Aerospace and Defence,
• Financial Services,
• Cultural and Creative Industries,
• Industrialisation of Cannabis.
The GPG aims to establish innovation systems linked to each high growth sector. According to the
Premier, by 2025, the GCR will have three fully operating Special Economic Zones, in Ekurhuleni,
Tshwane and Sedibeng. In addition, there will be fifteen revitalised industrial parks, twelve agri-parks

66
and five agro-processing facilities across the five corridors. This will be a single industrial ecosystem that
supports the 10 high-growth sectors and township SMMEs.
In terms of public services, the GGT has a strong emphasis on water and energy security and a focus on
promoting renewable energy. The Province is engaging with the private sector on how to collaborate
and share resources in the rollout of affordable broadband connectivity and free Wi-Fi to poor
households.
7.2.2. The Township Economic Revitalisation Action Plan
While part of the wider strategy o GGT, the GPG has also paid particular attention to township economic
development, using instruments TRS and the Township Revitalisation Action Plan. The Action Plan is to
be updated every two years. Townships are considered hostage to the following trends:
• Township economies provide cheap labour to established nodes & absorbs new migrants/ surplus
labour.
• They are defined by disproportionate concentration of lower income households and lower skill
levels.
• Townships are defined by the relative absence of formal retail and commercial facilities results in
leakage of consumer spend to more established areas.
• Townships are characterized by non-residential activity [that] is informal, fragmented and non-
competitive.
• Private sector investment levels, while slowly increasing in certain relatively well-located townships,
are still very low.
• Regulation under democracy has largely applied legal instruments designed for more formal,
developed and relatively prosperous areas. An inability to enforce these has left a regulatory
vacuum, which has amplified the high levels of informality.
• Despite GPG’s allocation of over R20 billion to township enterprises, market conditions make it
very difficult to translate this into business creation or expansion in townships.
• Almost all township firms are small, informal SMMEs who cannot access formal markets and
financing for the goods and services they could provide.
• These small firms are immensely vulnerable in the face of corporate competition.
• For those selling services, the lack of proper commercial districts and high streets limits them to
operating from homes or pavements.

67
• The township real estate market faces its own specific version of this market failure – single story,
informal rentals in backyards not connected to services (other than through the main house) are
now the situation in which 1 in 4 households in Gauteng now live, but there is no affordable
financing, nor support to resolve issues such as land title, ownership, zoning.
Informed by the above, the policy approach being taken by GPG has been developed and incorporates
the following elements:
• Change how townships are regulated and governed so that the assumption is that any business
which can be legal, is legal, subject to certain conditions so that businesses can be recognised
and funded.
• Change how businesses in townships are legally recognised to allow firms to be formally
recognised by the government and BDS programmes designed to help them.
• Revise state procurement rules and programmatic support which allow government and its
main contractors to buy from large groups of township-based firms, with systems linking them
so they can supply if they were one large firm. This will build the capacity to supply the private
sector and open private sector markets to township firms by enabling discovery of suppliers,
de-risking the supply relationship and targeting programmatic support so that it enables
delivery. The same will be done with NGO funding to drive the care economy.
• Use the data from government procurement systems and other digital systems run by partners
to de-risk lending to township firms of all sizes by financial service providers.
• Turn taxi ranks into micro-CBD’s and support the taxi economy to use its scale to grow
supporting value chains and industries.
• Use a backyard real estate development model to convert areas with high commercial densities
into township high streets.
This analysis underpins the proposed Township Economic Development Bill.
7.2.3. The Township Economic Development Bill
The GPS Legislature introduced the Township Economic Development Bill (TEDB) in the June 2020. Its
finalisation requires further refinement and delegation of tasks with respect to the functional areas over
differing Provincial and Municipal legislative competence as well as executive authority and
administrative control. The intention of the TEDBl is to specify which areas are townships, and to

68
‘greenline’ these for certain forms of regulatory reform. The Bill introduces the notion of a Standard By-
Law for Developmental Township Governance that reflects the regulatory principles of the Bill, with
municipalities in Gauteng expected either to adopt the recommended Standard By-Law or demonstrate
how their regulations comply with the regulatory principles in the Bill (Act), as relevant to townships.
The TEDB outlines the following additional BDS measure:
• Procurement spend
GPG aims to spend R4 billion per annum in buying goods and services from 2,000 township
enterprises. The aim is also to ensure increased value for money, with a recognition that in some
instances, procurement from township enterprises simply meant government was paying an
added mark-up on goods sourced from suppliers outside the township.
• Access to finance
The GPG is partnering with selected banks to provide guarantees linked to purchase orders for
provincial procurement contracts. This strategy will unlock access to finance for entrepreneurs
who might not otherwise have the cashflow to service larger-scale contracts, enabling business
growth.
• The SME Clearing House
Gauteng has set up a platform for the registration of SMEs, that includes geo-location, with the
intention of using this platform as the basis for state procurement from SMEs. The SME Clearing
House currently has over 20,000 SMEs registered on it, with these mapped on an on-line map
at https://www.gpgsmmes.co.za/.
• A focus on High Streets
GPG is working closely with the taxi Industry and municipalities to rezone and develop taxi ranks
into retail and commercial hubs that will create markets for local mechanics, panel-beaters,
retailers, food sellers and manufacturers.
7.3. Other Enterprise Development Support
A comprehensive Enterprise Eco-System Appraisal of Gauteng was undertaken b ANDE in 2018. The
ANDE report highlights that Gauteng is the most developed province in South Africa but suffers from
disparities of support between wealthier and poorer suburbs, with a gap in the market for ecosystem
players that are interested in investing in infrastructure improvements in underserved areas, such as
shared workspaces, internet access, and incubation hubs.

69
The ANDE report argues that more early-stage risk capital should be made available to aspiring
entrepreneurs in the ideation phase to develop their business ideas into commercially viable products.
This will encourage more innovative and opportunity driven entrepreneurship. It would also ensure a
more inclusive environment for entrepreneurs from more vulnerable populations, including women and
youth.
7.3.1. Gauteng City Region Development Plan (2015-2020)
The GCR Economic Development Plan (2015- 2020) intends to drive economic growth through strategic
targeting of priority sectors. Based on the current economic structure of Gauteng Province, the GCR
EDP is biased towards the service sectors, especially community services, finance and transport. These
sectors tend to employ less people than those such as manufacturing, transport and construction
(although these more productive sectors are experiencing a decline as a process of de-industrialisation
unfolds in the province). The GCR EDP purports that the manufacturing sector should be at the centre
of economic growth and development, and there is a need to invest skills in various sub-sectors of the
economy whilst simultaneously addressing the high barriers of entry characterised by many of these
industries – in particular, those with high growth potential such as agro-processing and steel. Such an
approach would have high multiplier effects in terms of inclusion. The township economy could
potentially benefit from investments in these sectors, which are nominated in the priority list below:
• Food and beverages
• Furniture and timber
• Clothing footwear textile and leather
• Pharmaceuticals, plastics and chemicals
• Machinery and equipment
• Construction, building material and real estate
• Automotive and components
• Mining and mineral beneficiation
• Finance and retail
• ICT
• Tourism and creative industry
Within the context of these overarching provincial strategies, the City of Tshwane has developed its own
series of guiding policies and programmes.

70
7.4. City of Tshwane Programmes
7.4.1. City Policies
Tshwane is guided by its 2030 Development Strategy which builds on South Africa’s National
Development Plan of 2011. Within the Development Strategy, the Tshwane 2030 Development Strategy
espouses the City’s vision for a sustainable and prosperous future. An important component of the
strategy that relates to economic activities and sector support is the Sustainable and Inclusive Growth
Strategy (SIGS) which was released in 2016. Through the SIGS, the City has prioritised selected sectors,
including:
• Knowledge Economy - As a capital city, the City has a distinctive competitive edge to lead the
knowledge economy in the country. It hosts four (4) of the seven public higher education
institutions and boasts the highest concentration of science councils in the country. With this
high concentration of research and academia centers, the City has prioritised the knowledge
economy to drive access to education, economic growth and global recognition as an education
and research and development (R&D) hub.
• Agricultural Production and agro-processing. Agribusiness is an integral part of economic
development in Tshwane. SIGS (2016) identified several strategic objectives that rationalized its
focus on agribusiness, including: investing in infrastructure for production and processing,
developing and dedicated land for security (poverty alleviation), and supporting high yield and
exportable crops; providing access to finance; improve skills and knowledge base of small-
holder farmers; facilitating market access to new geographies both domestically and globally;
and creating permanent and seasonal jobs
• Tourism and marketing the City as a choice location for investments, attracting business and
leisure travelers, unlocking new opportunities for emerging entrepreneurs in local travel and
tourism services and products.
Matters such as the green economy and spatial transformation fall within the Tshwane Regional Spatial
Development Framework (RSDF), 2018. This provides a specific spatial development framework for each
region and focuses on spatial transformation, economic transformation and ecological transformation.
Tshwane is guided by an Integrated Development Plan (IDP), which is scheduled for review in 2021.
Once revisited, the new version of the IDP will define the strategic pillars that serve to guide the
development agenda for the City over a five-year period. Older, but still relevant is the Tshwane Growth
and Development Strategy (GDS) from 2006 which is aimed at targeting high-impact, fast track

71
interventions to unlock key enablers of accelerated and shared growth. The main sectors of the City
economy include automotive manufacturing, mining, retail, finance and support services sectors; each
of which has sector specific plans. As part of the City’s business incubation programme to support
SMMEs within the automotive industry, the City appointed the Ga-RanKuwa Automotive Co-operative
to provide mechanical and autobody repair services to its fleet.
Within the draft Tshwane MSDF (September 2019) it is noted that the local manufacturing sector can
also support the township economy. The GPG has assisted with access to markets and invested
substantial resources in industrial infrastructure including industrial parks and automotive hubs. These
investments are mainly driven through the Gauteng TRS.
The City has a land release strategy to make available portions of land for business development,
especially in townships to advance black economic empowerment and to revitalise the township
economy.
7.4.2. Capital Economic Outlook (2016)
In order to accelerate growth of township economies, the City has undertaken core projects which in
turn will contribute towards poverty alleviation and job creation. The breakdown of the 2015/16 financial
year achievements and plans includes:
• Support of an eco-furniture factory in Ga-Rankuwa: R1.5 million towards rental and utility
services.
• Development of a youth-owned township bakery facility worth R3.8 million was launched in
Soshanguve in 2015/16.
• A R6.6 million car wash.
• A brick-making facility in Mamelodi has been allocated R4.9 million.
• R3 million set aside for construction of a paper towel manufacturing facility.
• A fresh produce facility received R13.5 million for three years, including R3 million in 2015/16
for construction in Marabastad.
• Rolling out a free WiFi programme in public spaces in the township communities of
Soshanguve, Mamelodi and Atteridgeville.

72
8. Enterprise activity
8.1. Micro-Enterprise Ecosystem
8.1.1. Approach
The fifth phase of the surveys for the TED Ecosystem project was conducted in Hammanskraal and
conducted in October and November 2020. The aim of the ecosystem survey was to record evidence
of: i) business activities, ii) institutional facilities and iii) business hotspots and spatial opportunities. It is
important to note that the ecosystem survey is designed to provide a snapshot of business activities. A
full census would require extensive field research, the scope of which is outside of the ToRs of the service
provider.
The research team surveyed 429 businesses (micro-enterprises, SMEs and corporates), recorded 27
business hotspots and 34 institutional services.
The image below provides an overview of economic activity in Hammanskraal. Points in green are
businesses, points in yellow are institutional services, and points in white are the business hotspots on
which the research focused.

73
Map 5: Businesses, Business Hotspots and Institutional Services

74
Of the 429 businesses identified, 7 (2%) were Corporates, 56 (13%) were SMEs, and 366 (85%) micro-
enterprises. All corporates and 44 (94%) of SMEs were formal businesses that adhere to the legal and
administrative requirements of government whilst 253 (69%) of micro-enterprises self-reported as
informal enterprises.
Figure 5: Overview of business size and legal status
8.1.2. Business categories
Micro-enterprises make up 85% of businesses identified in Hammanskraal. Of the 366 micro-enterprises,
78% (285) of businesses were open for trade during the research period and full interviews were
recorded. The range of categories is shown in Figure 6 below. Retailing is the predominant theme of
business, reflected in the most common categories were micro-enterprises selling clothes (10%/44),
vegetables (10%/44), cooked food (9%/40), snacks & cigarettes (9%/39) and hair salons (8%/35).
7
55
113
1
253
0
50
100
150
200
250
300
corporate sme Micro-enterprise
Bu
sin
ess
lega
l sta
tus
Business size vs legal status
Formal (n=175) Informal (n=254)

75
Figure 6: Micro-enterprise businesses by enterprise classification
75
14
15 6
12
32
20
7
44
14
1 1
11
4
1822
36
68
2 1
10
2 2 2
12
63 2 1
7
25 24
53
1 2
0
5
10
15
20
25
30
35
40
45
50
Acc
om
mo
dat
ion
Ap
plia
nce
s
Art
s &
cra
fts
Bak
ery
Bra
aied
mea
t
Bu
ildin
g m
ater
ials
Bu
ildin
g se
rvic
es
Bu
sin
ess
se
rvic
es
Car
re
pai
rs
Car
was
h
Clo
the
s
Co
oke
d f
oo
d
Del
iver
y se
rvic
es
Dri
vin
g sc
ho
ol
Edu
care
Fin
anci
al s
ervi
ces
Fun
era
l se
rvic
es
Furn
itu
re
Gre
en g
roce
r
Gro
cery
re
tail
Hai
r ca
re
Har
dw
are
Hea
lth
ser
vice
Lau
nd
ry
Lega
l ser
vice
s
Liq
uo
r
Live
an
imal
s
Mea
t &
Po
ult
ry
Mec
han
ical
se
rvic
es
Mic
ro m
anu
fact
uri
ng
Per
son
al &
ho
me
acce
sso
rie
s
Ph
on
e se
rvic
es
Rec
yclin
g
Res
tau
ran
ts
Sho
e r
epai
r
Snac
ks &
cig
are
ttes
Spec
ialis
t st
ore
Tailo
r
Tran
spo
rt
Wh
ole
sale
Wo
od
, co
al &
gas
No
. bu
sin
esse
s
Business types
Enterprise classification: Micro-enterprises
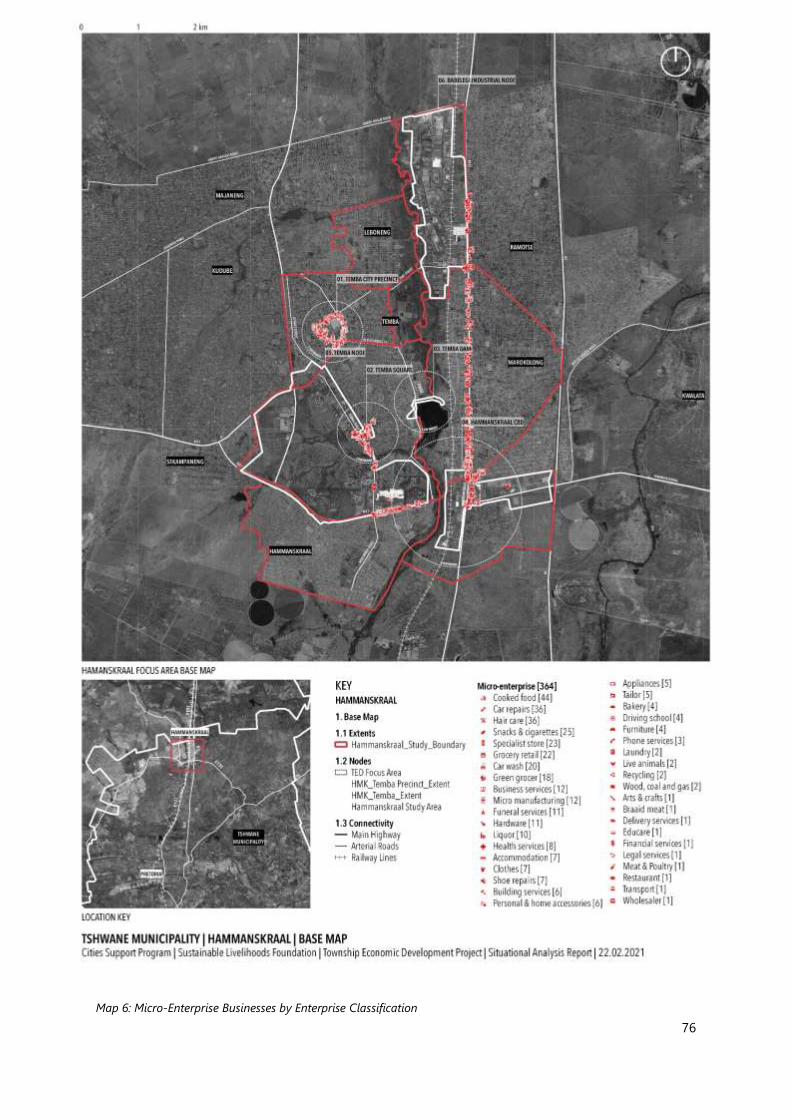
76
Map 6: Micro-Enterprise Businesses by Enterprise Classification

77
Map 7: Survey and Open-Source Micro-Enterprises by Classification

78
Figure 7: Examples of Enterprises in Hammanskraal

79
Description of figures 1 – 6:
1. Container-based bakery
2. Vehicle Servicing batteries
3. Engine overhaul
4. Nail Bar
5. Arts and crafts
6. Tyre fitment
Demographics
The demographics of business ownership in Hammanskraal are diverse in origins. Of the 285 micro-
enterprises interviewed, 70% (200) are operated by South Africans. Of the 29% of non-South Africans
running businesses in Hammanskraal, the majority are immigrants from Zimbabwe (14% of total sample)
and Mozambique (5% of total sample). The great majority of immigrant business owners in the site are
from Africa, although some representatives from the subcontinent including India, Pakistan and
Bangladesh were present.
Figure 8: Nationality of respondents
The nature of the Hammanskraal informal economy is that of both survivalist / self employment, but
also job creation. Some 157 (55%) of the respondents interviewed in the business reported as the
owners, 6% were running the business in a partnership (18), and 39% were employees (110).
200
1 3 6 9 2 1 113 3 2 1 3
39
10
50
100
150
200
250
Nu
mb
er o
f re
spo
nd
ents
Respondent's nationality
Respondents by Nationality

80
Figure 9: Respondent business roles and nationality
Similar to other sites the local informal economy is skewed towards male business operators and
relatively younger age cohorts. Hammanskraal hosted one of the highest proportion of male owned
businesses compared to the other research sites. In this case 72% (204) of the respondents were men,
32% (65) of whom were in their 30s. More than half of all women (48) were in their 30s (24) and 40s
(24). The young profile of females in the township economy is likely a further reflection of women
balancing both family (child-care) and livelihoods responsibilities.
Figure 10: Respondent age and gender
64
121
15
4536
310
20
40
60
80
100
120
140
Employee Owner Partner
Nu
mb
er o
f re
spo
nd
ents
Comparison of business roles and nationality
South African (n=200) Non-South African (n=84) Unknown (n=1)
55
65
49
24
6 5
1824 24
11
4
0
10
20
30
40
50
60
70
20s or younger 30s 40s 50s 60s 70s
Respondent's Age and Gender
Male (n = 204) Female (n =81)

81
Map 8: Micro-Enterprise Respondent Gender

82
8.1.3. Business dynamics
The majority (62%) of micro-enterprises operated from informal trading spaces such as open ground or
non-demarcated trading sites in the vicinity of the street. Overall, trading structures included 32% (90)
businesses operating from a shack or shed, 14% (41) from a street trading table or stand, 8% (24) from
a private house, and 7% (19) from a container. A number of businesses were housed in business
complexes such as light industrial dwellings that clustered together likeminded enterprises (such as car
related businesses, or welding and fabrication activities).
Figure 11 Business infrastructure
19
90
41
4
24
100
7
0 20 40 60 80 100 120
Container
Shack/shed
Street trading table/stand
Mobile
Private house
Business premises
Other
Number of businesses
Infr
astr
uct
ure
typ
e
Trading structure

83
Figure 12: Many businesses require public access to function optimally

84
Map 9: Micro-Enterprise Trading Structures

85
Rent
Rental incomes are clearly an important part of landowner income streams in the site. Just under half
(47%) of respondents reported the businesses paid rent for the premises they occupied. A quarter of
these rent payers (68) were business owners, with just under half (84) of South Africans, and two thirds
(51) of non-South Africans paying rent for their trading site. The monthly rental amounts varied, ranging
from R100 for a site on open ground with no services to R10,000 for a brick and mortar built structure.
Most common monthly rental amounts were between R1,000 and R2,000 with 21 respondents paying
R1,000, 14 paying R1,500, and 17 paying R2,000 per month.
Figure 13: Occupation model and rent paid in ZAR
135
68
9
73
Rented or owned premises
Rent Own Don't know NA
13
30
20
29
18
25
0
5
10
15
20
25
30
35
≦ R500 ≦ R1000 ≦ R1500 ≦ R2500 ≧R8000 Unknown
Nu
mb
er o
f b
usi
nes
ses
Rent paid
Monthly rent paid (in ZAR)

86
Map 10: Micro-Enterprise Site Rental

87
8.1.4. Access to utilities
Access to utilities reflects the uncoordinated governance approach that the Hammanskraal area has no
doubt received. Whilst 36% and 41% of businesses had formal access to water and electricity,
respectively, the majority of enterprises interviewed 46% (130) had informal access to these services
(through paying cash to neighbours or collecting water off-site), whilst 16% (45) had no utilities access
at all. The majority of those unable to access water (15% of total sample) or electricity (17% of total
sample) were conducting business from a from a trading stand (17) or shack (17).
Figure 14: Available utilities
140
103
42
120 116
49
0
20
40
60
80
100
120
140
160
Informal Formal None
Access to Utilities: Water and Electricity
Water Electricity

88
Map 11: Micro-Enterprise Water Access

89
Map 12: Micro-Enterprise Electricity Access
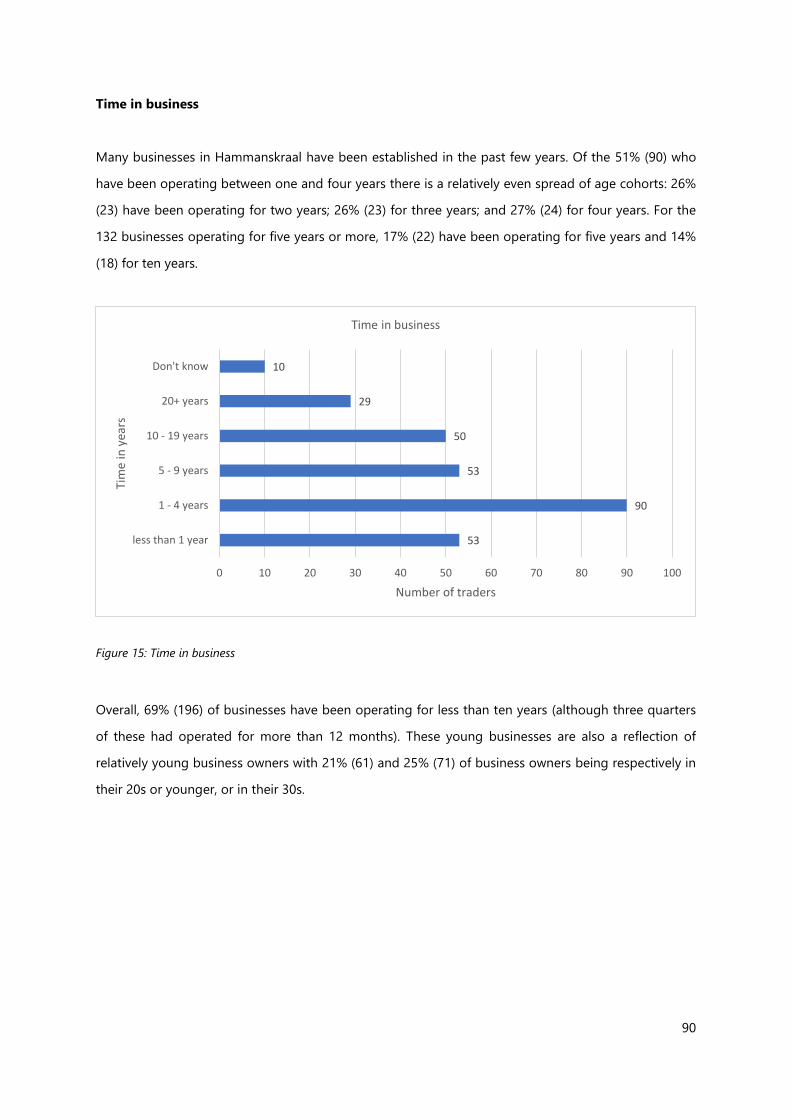
90
Time in business
Many businesses in Hammanskraal have been established in the past few years. Of the 51% (90) who
have been operating between one and four years there is a relatively even spread of age cohorts: 26%
(23) have been operating for two years; 26% (23) for three years; and 27% (24) for four years. For the
132 businesses operating for five years or more, 17% (22) have been operating for five years and 14%
(18) for ten years.
Figure 15: Time in business
Overall, 69% (196) of businesses have been operating for less than ten years (although three quarters
of these had operated for more than 12 months). These young businesses are also a reflection of
relatively young business owners with 21% (61) and 25% (71) of business owners being respectively in
their 20s or younger, or in their 30s.
53
90
53
50
29
10
0 10 20 30 40 50 60 70 80 90 100
less than 1 year
1 - 4 years
5 - 9 years
10 - 19 years
20+ years
Don't know
Number of traders
Tim
e in
yea
rs
Time in business

91
Figure 16: Comparison of respondent age and time in business
8.1.5. Operating challenges
Although micro-enterprises face numerous challenges in running a business in Hammanskraal, the
majority of respondents noted infrastructure (104) as the key challenge to operating. This is fitting
considering Hammanskraal’s at-best patchy development record to date. Other notable challenges for
business operators included crime (64) followed by competition (48), storage (47), and ‘other’ (35).
Crime reflects a universal township business challenge and is illustrated through the following quotes:
• Crime a serious concern, proper structure a need, no paving, no sanitation, no immediate lighting,
no drainage system but perfectly located within Temba City complex.”
• “She (the owner) was complaining about the crime and they stay in one premises and use a dirty
and unsafe toilet even find Nyaope Boys sleeping inside so it's not safe for a woman.”
• “She is a Mashonisa. She collects money mostly month end. It's not a safe business especially
dealing with men who don't want to pay up.”
• “Crime hampers the growth of the business and makes them lose valuable appliances brought in
by customers to be repairs as a result hampers business trust.”
• “Paved, immediate lighting, adjacent to Moretele Magistrates court and Temba City Complex,
perfectly located on the busy Molefe Makinta road but easily accessible by a number of substance
abuse addicts (which) raises a serious security concern.”
• “She was very comfortable but not when coming to other questions like her age and how much
she is paying her rent in the premises, she said it's not safe to just give away some information
because of crime.”
16
24
9
4
34
26
18
6 51
11
21
13
62
913
19
6
1 21 1
12 12
2 1
0
5
10
15
20
25
30
35
40
20s or younger 30s 40s 50s 60s 70s
Nu
mb
er o
f re
spo
nd
ents
Comparison of age and time in business
less than 1 year 1 - 4 years 5 - 9 years 10 - 19 years 20+ years

92
Conversely, the requirement for reliable infrastructure and business funding also elicited a range of
comments from the field research participants:
• “The owner of the business wants his business to get a proper structure but he is scared that if
they were to be given structures it might mean that they should relocate which is going to be a
challenge for him.”
• “Lack of infrastructure often sees him not operating daily and high levels of crime forces him to
often sleep by the business site that does not even have an enclosure.”
• “The business has a shelter that looks unsafe. There are connections of wires as Ephraim has no
access to electricity. He would like to receive good shelter, and he says that crime from Nyaope
Boys in this place is on the rise.”
• “The major challenge that I noticed is that the fresh meat did not have a proper storing place.
There also isn't a proper structure to provide shelter for the meat.”
• “No paving, illegal electricity connection, no streetlights etc. Lady says she is from Ghana but I
picked up a very strong Nigerian accent. She has no customers although located on a very busy
street.”
• “He is having a challenge because he is operating an internet cafe with no water and electricity.”
• “The owner said they are having a water crisis and it’s been years. Clients can't go to the toilet
because there's no water for the toilet to flush. The owner says people dug sewage pipes and then
just left them like that.”
• There is a water tank available for the carwash but the tap was stolen so at the moment water is
a problem because there isn't a proper water supply.”
These ‘other’ challenges included drugs, the business needing marketing and funding to increase their
presence and for customers not paying debts accrued for services and goods given out. 60 respondents
reported having no challenges to operating.

93
Figure 17: Main operating challenges
Some respondents provided comments, noting their challenges were interlinked with crime, weather,
competition and access to adequate utilities and sanitation: inadequate shelter provides no protection
from the elements; many businesses selling the same goods in close proximity and being outpriced by
neighbouring businesses; consequences of water shortages and load shedding; and needing increased
security from ‘Nyaope Boys’ and residents over weekends due to increased liquor sales and
consumption.
An important challenge is that of the nexus of business registration, support mechanisms and
informality. Many of the businesses in Hammanskraal are not necessarily informal by choice, but
through circumstance whereby their micro-scale beginnings and lack of operational capital present
great restrictions on legal and operational compliance:
“The creche is under the City of Tshwane but it's still unproclaimed so this helped to get a health certificate.
However, they only got conditional certificates. They are also led by a tribal authority. The creche has a
sick bay and isolation room for COVID. Before they could get COVID compliance, they had to have an
isolation room. The teachers are underpaid due to lack of fees paid.”
Most businesses have operated without external state financial investment. Nearly 90% of these
businesses (250) have not received any support to operate but said that if they had a choice in what
would benefit them, 53% (181) reported financing, 19% (48) infrastructure, and 6% (16) adequate shelter.
64
104
48
11
17
47
12
18
8
14
35
60
0 20 40 60 80 100 120
Crime
Infrastructure
Competition
Registration / Licensing
Location
Storage
Access to suppliers
No customers
No water
No electricity
Other
No challenge
Number of businesses
Ch
alle
nge
sChallenges faced by business

94
Importantly, comparing the microenterprise survey results against a review of the contemporary
literature linked to various government programmes to support economic growth reveals common
mismatches between business support offerings and township microenterprises. Important
misalignments are largely reflective of the conditions of deep informality that preclude many
microenterprises from eligibility for support. Characteristics such as formal business registration,
necessary permits and documentation are commonly not in place for informal business yet are required
as minimum conditions for support.
Figure 18: Support deemed beneficial by respondents
The strong interest in financing reflects both the desire for operational capital and also the need for
enhancing financial inclusion for microenterprise. The lack of operational capital experienced by many
businesses can commonly reflect their lack of access into formal financial sector systems, meaning that
any processes that may be able increase their access could represent and important economic
development intervention.
Opportunity: The City could facilitate partnerships, including with Gauteng Provincial Government
and agencies such as the Finmark Trust to extend financial literacy training and improve access to
services and technologies.
181
48
10
5
16
4
8
6
16
6
5
11
0 20 40 60 80 100 120 140 160 180 200
Financing
Infrastructure
Space
Registration
Shelter
Security
Storage
Location
Nothing
Don't know
Won't say
Other
Support deemed beneficial

95
Opportunity: City to facilitate partnerships with DBSD TREP programme, private sector and local
community organisations to support prominent businesses in Hammanskraal. For example:
Personal care services (hair salons) with formalisation tools, but also skills training, supplies and
marketing.
8.2. Corporate and SMEs
8.2.1. Corporates
Outside of the industrial areas (that were not part of the enterprise survey), very few corporate
businesses operate in Hammanskraal. Of the seven located in the research site, fuel stations were the
most prominent. Of those corporate businesses in the site, all were highly recognisable business brands
and included KFC, Select Food Store, Shoprite Usave; Engen, Shell, and Total service stations.
Figure 19: Corporate businesses by enterprise classification
8.2.2. SMEs
There were a variety of SMEs operating in Hammanskraal, but most commonly found were funeral
services (24% of sample), health services (29% of sample) and wholesalers (29% of sample). These were
all formal enterprises, which for western-trained medical doctors and funeral services are regulated
industries and require certain basic standards of certification from the state.
2
1
4
0
0,5
1
1,5
2
2,5
3
3,5
4
4,5
Cooked food Grocery retail Service station
Enterprise classification: Corporates

96
An important corporate business within the research site – the Temba City Mall has been largely
abandoned by tenants who have relocated to a newer mall in the vicinity. As seen in Lebowagoma and
other sites in South Africa where informal businesses have been drawn into the shopping mall
environment, the Temba City Mall may represent a new opportunity for rethinking the corporate mall
concept and enhancing inclusion of informal sector businesses within them. Such a process would take
advantage of the many concessions and utilities that malls have access too, passing them onto their
business tenants (see Chapter 8).
Opportunity: The City to engage with shopping mall owners to develop strategies to integrate
micro-enterprises into shopping mall precincts. The Temba City Mall represents an important
economic opportunity as a flagship project for reimagining how such retail environments could
create opportunity for microenterprise.
Figure 20 SME businesses by enterprise classification
2 23
1 12 2
13
1 1 1
4
7
1 1 12 2
1 1
7
0
2
4
6
8
10
12
14
Enterprise classification: SMEs

97
Map 13: Corporates and Micro-Enterprises

98
Map 14: Corporates and Micro-Enterprises - Open-Source Data

99
8.3. Business Hotspot surveys
There were 27 potential business hotspots identified and surveyed during the fieldwork process in
Hammanskraal. The majority of these were directly linked to the research site such as the Old
Warmbaths Rd, or adjacent to shopping malls and industrial areas where many traders have
congregated to sell to the passing commuter and pedestrian trade. These naturally emerging clusters
of micro-enterprises display valuable opportunities for development.
8.3.1. Available services
As is typical in Hammanskraal, the level of access to utilities and services found in business hotspots
was not equal. Of the 27 sites with business activity, 48% (13) had access to water, 52% (14) had access
to electricity and two thirds had waste disposal services on the site. Whilst 70% (19 of the sites) had no
access to Wi-Fi, where Wi-Fi was present (in eight of the sites), none of the resident businesses could
access it. Considering that Tshwane has invested considerable investments in rolling out Wi-Fi as a
service for the metro, this is an important local challenge.
Figure 21: Access to services
8.3.2. Place categories
The types of places that formed the recognised hotspots varied. Most of these areas (59%) could be
considered business hives where businesses have agglomerated in small clusters. Conversely 22% of
sites (6) were clusters of economic potential on high streets (such as intersections and corners with
13
9
5
14
76
18
98
19
0
5
10
15
20
Yes Some No
Hotspot: Business access to services
Water Electricity Waste disposal Wifi

100
considerable pedestrian activity) and outside of government services such as the local magistrate’s
court. Taxi ranks also represented a small (7%) but valuable business clustering and hotspot opportunity.
Opportunity: The high concentration of businesses within hotspots such as marketplaces and retail
nodes presents an important opportunity for marketing these ‘hubs’ and the businesses within
them. The City could, via partnerships work to provide street signage and advertising boards for
this purpose.
Figure 22: Hotspot place categories
16
6
1 12
1
0
2
4
6
8
10
12
14
16
18
Business hive High street Market place Retail node Taxi rank Open ground
Hotspot: Place category
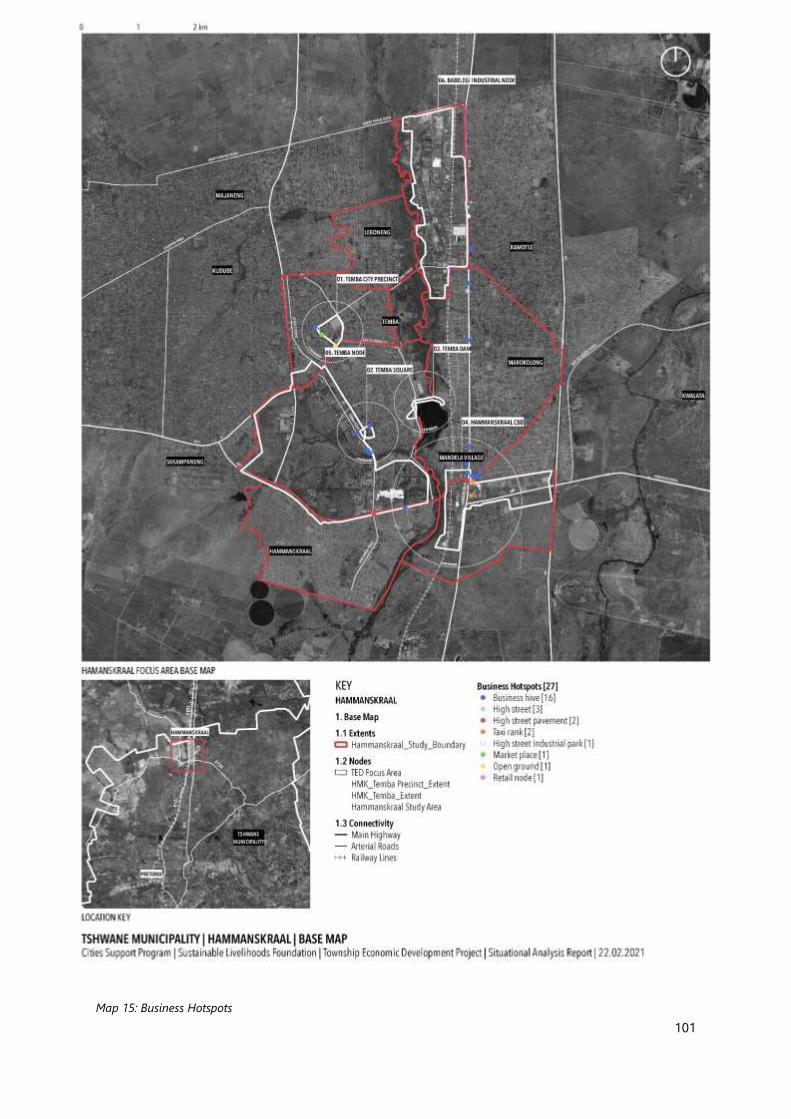
101
Map 15: Business Hotspots

102
Map 16: Vacant Land

103
Overall, 325 businesses operated from the hotspots located in the study: 197 from business hives, 59 in
high streets, and 23 at taxi ranks. Further investigation of the nature and role of business hives as a local
economic development opportunity should be investigated, with the momentum of their organic
growth and sustainability encouraged and supported.
Figure 24: Number of businesses per site type
Figure 23: Informal traders at the taxi rank outside of the largely abandoned Temba City Mall
197
59
18 20 238
0
50
100
150
200
250
Business hive High street Market place Retail node Taxi rank Open ground
Number of businesses operating in these sites

104
8.3.3. Barriers to operating
Of the 27 hotspot sites, 81% (22) had formal site infrastructure, 95% (21) of which was considered
functional by the occupants. The availability of services to such sites varied, in part due to the legacy of
local history inn Hammanskraal. During Apartheid a number of business hives were developed under
the prior Bantustan government. These were subsequently inherited by the North West Provincial
Government to manage, although physically these properties are in Gauteng Province. This has created
a range of administrative and management challenges. In one case the business hive has had no
electricity for over 12 months due to disputes between government agencies about whom should
service the bill. Due to the organic emergence of other sites, it is understandable that one third (8) of
respondents were unsure of who the management of such sites belonged to. In most sites (two thirds)
there were vacant sections or land or premises that could be leased out to new occupants – meaning
that at present many hotspots are economically underperforming.
Opportunity: City to secure ownership of the existing business hives and develop management plans
for to bolster their sustainability and support local economic activity of important value adding
businesses - e.g. automotive sector, furniture making.
Other issues that impact on business residents in hotspots included crime (30% of total sample)
although more than half of respondents (14) did not list crime as a major business challenge, potentially
making this a localised challenge for sites and businesses.

105
Figure 25: Operating barriers
The remaining operational barriers were varied and were focused on the need for enhanced delivery of
utilities to hotspot sites. Complaints included lack of lighting (33%), no water access (22%), inadequate
drainage systems (19%), inadequate or non-existent sanitation (11%) and paving (11%). This is
exemplified in various quotes from the current occupants: “The only problem is that there isn't a proper
drainage system and proper lighting in the business hotspot” and “A number of health services offered at
the business premises, but lack of signage makes it not easy to identify what services are offered in the
business hotspot.”
8.4. Institutional services
There were 34 institutional services sites recorded, 26% (9) of which are financial services. Those
recorded as ‘Other’ were a women's clinic and animal clinic, prayer space, sports facility, and security
service. Apart from financial services, most of the institutional services were closed during the fieldwork
process. These services were predominantly operated by the City of Tshwane (9).
8
4
14
4
1
2
1
0 2 4 6 8 10 12 14 16
Crime
Police harrassment
Not applicable
Water access
Lighting
Competition
Other
Hotspot: Barriers to conducting business

106
Figure 26: Institutional services
Of the available financial services, 67% (6) are ATMS and 22% (2) are insurance brokers. The insurance
brokers were Old Mutual and CTU which is underwritten by Hollard. The ATMs appear to be routinely
out of order, meaning that the working facilities are under considerable pressure during periods of high
demand. These facilities are also under threat from criminality. Some notable quotes include: “One
operating ATM and there is a line of people on the queue to withdraw cash, there are 2 machines on this
garage and the Standard bank one is the one that is working” and “This machine is out of service because
of ATM bomb gangs... people cannot access cash anymore”
Table 3: ATMs in Hammanskraal
ATMs Number
Absa 2
Capitec 1
First National Bank 1
Paycorp 1
Standard Bank 1
16
1
9
4
7
2
0 2 4 6 8 10 12 14 16 18
Service centre
Library
Financial services
Training facility
Other
Community hall
Available institutional services

107
Figure 27: Institutional Services

108
8.5. Township Wide Ecosystem
8.5.1. Babelegi Industrial Park
Babelegi Industrial Park is situated about 5 kilometres North of the Hammankraal CBD. The business in
the Industrial Park provide employment to surrounding communities. There are on-going programmes
to revitalise Babelegi. Whilst currently in need of reinvestment and with an enduring a high level of
vacancies, Babalegi has nevertheless retained a number of large industrial businesses including food
producers, a ceramics production firm, and auto component suppliers.
8.5.2. Temba City Mall
A further interesting opportunity for agglomerating local micro-enterprise is that of the privately owned
(jointly by Mowana Properties and Public Investment Corporation) Temba City Mall. This venue was
recently superseded by the new “Jubilee Mall” which was able to draw most existing tenants out. The
now largely empty Temba City Mall structure still contains a supermarket and a number of small
speciality shops, but over 90% of the premises are now vacant. Under current circumstances it appears
unlikely that the mall will be able to recover those tenants and it is clear that a new business strategy is
required for the mall premises.
The site has excellent facilities, hosts informal markets at the adjacent taxi rank and could be repurposed
to support a range of microenterprise business activities in commercially viable ways. Whilst the anchor
supermarket tenant remains the building still draws a significant audience. The mall premises are largely
already legally compliant with respect to land use zoning and usage and thus represents a potentially
viable development opportunity not commonly found within the township context. The superceded
nature of the Temba City Mall brings scope for a rethink about commercial strategies to integrate micro-
enterprises into the shopping mall precinct. Such a process could both revitalize the commercial
opportunities of the mall, but also bring about increased standards lifting for township business tenants
through increasingly bringing them into a legitimization framework. Encouraging township businesses
into the mall would give them access to well-developed utilities (water, ablutions, electricity) and allow
them to take advantage of zoning already in place, parking and foot traffic. There are other precedents
for drawing informal business into shopping malls, with a prominent longstanding example in
Lebowagoma.

109
Figure 28: Temba City Mall as a township economy opportunity?

110
9. Important Sectors
Whilst the microenterprise form and function in Hammanskraal is fairly typical of South African township
economies, there are some important local sectors that stand out as having potential for investment.
These sectors are highlighted due to particular regional advantages such as the clustering of relevant
skills types or markets in the area, being geographically close to important South African business
sectors, or due to other socio-economic circumstances that align to create local advantage. Aside from
the general business community within Hammanskraal, an important aspect of the local economy is the
presence of business hubs and light industrial parks (managed by North West Province). Within these
light industrial parks are a wide variety of informal businesses operated by local entrepreneurs.
Opportunity: Linking businesses within Hammanskraal to business development support services
– DBSD, SEDA and SEFA would bolster sustainability and further support these enterprises.
Furthermore, there is scope to link these enterprises to markets through an annual trade and
marketing event that would link these local businesses to economic opportunities.
Opportunity: Various localities within Hammanskraal (such as the Temba City Precinct, Temba City
Mall, the Hammanskraal CBD, and Temba Beach) could be further activated for business activities
through local strategic area and management plans and investment in revitalisation of the local
environment in ways suited to an enhanced business environment. Furthermore, securing City
ownership and management control of light industrial parks presently under North-West Province
would allow for enhanced management and investments to support their business tenants.
9.1. Creative Economies
Hammanskraal has a small but important creative sector. Local manufacturing of tourist curios and
artwork takes place for items that are sold to tourists visiting nearby nature reserves (such as
neighbouring Dinokeng Nature Reserve) and other local attractions. Further, Hammanskraal is home
to musicians, artists and individuals aligned to the tourism sector. Activities that actively foster and
promote Hammanskraal talent would be a valuable method of economic support. The local creative
economy has potential to be more effectively linked to both government-initiated arts and creatives
funding, but also the tourism sector. The City and Gauteng Provincial Government has programmes to
support SMMEs and microenterprises through workshops, networking, registration and directing them
111
to financing. Fostering these links would be an effective tool for supporting local SMMEs. The DSBD
TREP programme specifically supports clothing, textile and leather enterprises that are located in
townships and villages in terms of business support as well as access to funding, whilst SEDA focuses
on skills development in the jewellery sector.
Opportunity: The City to devise a strategy, with appropriate partnerships to reposition arts and crafts
to directly support township creatives – facilities, training and market development. The City to
support the development of a creative sector through supporting the process of supporting the
transition of hobbies to livelihoods. Existing BDS services and mechanisms of enterprise
formalisation to be promoted in order for creatives of various sectors to gain enhanced access to
formal sector funding opportunities, such as that from the National Arts Council or the National
Lottery Commission Trust.
9.2. Micro-Manufacturing and Repair, Installation and Maintenance (RIM)
The formal and traditional ownership status of many local houses presents a valuable opportunity for
homeowners to reinvest in their houses – such as upgrading gates, fences, doors and windows. These
activities could bolster demands for a local micro-manufacturing economy. The RIM economy and
micromanufacturing business is reasonably well represented in Hammanskraal with various business
actively engaged in the sector. Compared to retail businesses such as spaza shops these businesses
have strong value adding potential through converting raw materials with labour into valuable products.
Opportunity: Hammanskraal has a growing number of residential dwellings being built for the rental
market. Alongside the opportunity to reformulate the policy and investment environment to
regularize urban residential densification, there is scope for City support towards the various artisans
manufacturing furniture, fitted kitchens and other household items to support this activity.
9.3. Financial Inclusion
Many township businesses are constrained by their lack of formal sector financial market access. This
includes access to finance in terms of loans but also insurances and other financial products that can
enhance business security and prospects. A programme that bolsters enterprise access to these
products would be of important value to SMMEs in Hammanskraal.

112
9.4. 4IR
4IR projects such as Kandua which links technical specialists with customers, and digital platforms such
as Khula which market produce grown in an urban agriculture context have important potential for
application in Hammanskraal - and should be further explored and encouraged. An important initiative
that could be driven by the City is enhancing access to digital services in general, and links to 4IR driven
businesses / platforms in particular.
Opportunity: Improving enterprise access to digital economy. This should include links to SEDA
who actively promote digital hubs and the Gauteng Provincial Government initiatives. Enhanced Wi-
Fi access for increasing 4IR access for SMMEs in the township economy is also required. Such a
programme could also support enhanced participation in the digital formal financial sector.
9.5. Automotive Sector
The automotive service economy includes welders, mechanics, tyre fitment and car related activity are
all important contributors to job creation. This relatively dynamic sector is primed to benefit from
investment and BDS services.
This section of the report will be confined to opportunities that are currently accessible in the
aftermarket which includes post-sales maintenance, repairs, refitment, spares, disposal of vehicles and
recycling.
9.5.1. Stakeholders within the township automotive industry
The main stakeholders within the township automotive industry can be categorised into four main areas:
micro-enterprises and the associations that represent them; government and SOE; private sector
Original Equipment Manufacturers (OEMs) with B-BBEE targets; and customers (motorists including
those who own taxis and buses).
• Microenterprises and the Associations

113
The microenterprise surveys revealed that the majority of automotive entrepreneurs operate in
the ‘aftermarket’ offering repairs for vehicles that are out of warranty. These are commonly
include mechanics, panel beaters, spray painters, tyre fitters / wheel specialists, welders and
upholsterers.
The business activity is relatively commonplace and has, in some cases attracted important
external investment. For example, within the study sites some tyre fitting micro-enterprises have
created links to tyre manufacturers such as Dunlop and Tiger Wheel and Tyre and have secured
professional and branded premises. The majority however are unlinked to formal sector
business and work from home or premises along prominent township roads or near taxi ranks.
With respect to land use, most of these micro-enterprises (particularly home-based, and street-
based entities) operate in areas either outside of the regulatory frameworks, or illegally. Most
work with basic equipment and poor infrastructure, limited waste disposal, no access to ablution
facilities, and poor, if any shelter (which brings about susceptibility to changing weather). There
is also a lack of storage and the general hazard posed by them working without the necessary
accreditations. Often businesses are positioned close to their customers (near taxi ranks and
busy areas where they are visible and accessible). It is to be noted that City and state land that
is available for developing hubs and providing the much-needed infrastructure is not
necessarily close to where the greatest business opportunities lie.
A persistent challenge for township automotive microenterprises is access to markets. Financial
and non-financial support is important in ensuring that the enterprises are well operated and
governed but, without access to markets the enterprise have little chance of success. Market
access in the township economy is hindered through the geographic and economic isolation of
the township economy away from mainstream sectors, and the limited market within the
township economy for cars. Furthermore, it is uncommon for reasons such as crime and logistics
for vehicle owners residing outside of the township to bring their vehicles into these locations.
Finally, there are customer perception on the quality of the service.
Several associations represent the entrepreneurs and their needs. The Retail Motor Industry
(RMI) represents retail and associated motor industry within South Africa’s automotive
aftermarket. There are eight associations represented by RMI with over 8,000 members. The
RMI is the major employer representative of the Motor Industry Bargaining Council. It is not
clear at this stage how many township entrepreneurs are represented by RMI. An important
114
sectoral newcomer is the African Panel beaters and Motor Mechanics Association (APMMA),
through its chairperson Sisa Mbangxa, has been heavily involved and instrumental in the
shaping of the Draft Guidelines for Competition in the Automotive Aftermarket Industry (by the
Competition Commission). APMMA’s members are largely within the township.
• Government and Government-owned organisations
The South African government’s establishment of organisations such as the Automotive
Industry Development Centre (AIDC) and the Seda Automotive Technology Centre (SATeC) aim
to support the automotive industry, especially SMMEs. The AIDC has the Winterveldt Enterprise
Hub and Automotive Hubs (City of Tshwane) in partnership with OEMs, providing training,
business development and financial support. SATec focuses mainly on microbusinesses in the
townships and provides general business support in the form of business training, formalising
of businesses and accreditations.
G-Fleet Management, is a Trading Entity of the Gauteng Department of Roads and Transport,
that provides vehicle leasing and fleet management services for the public sector. Their services
include short-term rentals, replacement, total fleet management services-finance, maintenance,
repairs, tyres, accident damage and other motor-related services to all government
departments. The entity operates a fleet of over 7000 vehicles. G-Fleet presents an opportunity
to provide access to markets for micro enterprises, particularly in the fleet maintenance as it
relates to the aftermarket. At this stage it is unclear whether G-Fleet has any initiatives that
promote micro enterprises. G-Fleet does not have any visible agreements with SMMMEs.
As with the RIM sector above, when compared to more basic retail businesses such enterprises
have strong value adding potential. The automotive sector is an important potential beneficiary
of the Tshwane Economic Development Agency; Tshwane Automotive Special Economic Zone
(TASEZ) programme particularly for accessing training and mentorship. In addition, for formally
registered motor body repairers, mechanics, auto spares & fitment centres within the township,
there may be scope for support from the DBSD driven AfterMarket Support Scheme.
Opportunity: There is scope for the after-market automotive sector in Hammanskraal to benefit
from Metro-facilitated partnerships with various stakeholders such as private sector companies,

115
BDS stakeholders such as DSBD / SEDA and Provincial Government to provide equipment / skills
training / supply agreements / finance for entrepreneurs.

116
10. Land use
10.1. Land Administration Policies
We have reviewed the following planning documents to gain an understanding of the statutory and
policy environment for Hammanskraal:
• Municipal Spatial Development Framework
The Municipal Spatial Development Framework (MSDF) is a long-term spatial planning tool,
which provides metro-wide planning guidance for the spatial growth of the City of Tshwane.
This tool is required in terms of the Spatial Planning and Land Use Planning Act, 2013 (SPLUMA)
and forms part of the Integrated Development Planning (IDP) process, to the extent that it
assists with providing a spatial context for investments. In terms of the legal requirements, it is
subject to review every five years.
• Regionalised Municipal Spatial Development Framework
The Regionalised MSDF provides detailed planning directives that align with the SDF for each
region in the metro. This planning tool identifies issues and directives for specific areas within
each district and provides a shorter-term directive than the SDF.
• Built Environment Performance Plan
The Built Environment Performance Plan is intended as mechanism to align the IDP and budget
with spatial priorities each year, to promote the effective functioning of the metropolitan built
environment, in line with the guidelines set out by National Treasury.
• Municipal Planning By-Law and Town Planning Scheme
The Municipal Planning By-Law provides the legal framework from the implementation of
spatial policies. The Development Management Scheme provides the detailed zoning
guidelines and permissions. A wall-to-wall zoning scheme for each municipality is required in
terms of the SPLUMA, 2013.

117
10.2. Development Plans
10.2.1. Metropolitan Spatial Development Framework, 2012
The MDSF identifies the Babelegi Industrial Area and the Hammanskraal Train Station as opportunity
areas in Region 2 of the City of Tshwane..
10.2.2. Regionalized Municipal Spatial Development Framework: Region 2, 2018
The Hammanskraal CBD is indicated as an emerging node, with a focus on Transport-Oriented
Development (TOD).
We are particularly concerned with three of the nodes indicated in the MSDF. The first is called the
Hammanskraal Urban Core and includes the Jubilee Mall. Investment in social facilities is prioritised for
this area. The second node is the Temba Local Node. This node is to accommodate institutional
community and retail uses. The need to develop the vacant land in this node is acknowledged. The third
node is the Hammanskraal West Local Area Node. This node is adjacent to the Hammanskraal Urban
Core and provides supporting services to the surrounding neighbourhood.
10.2.3. Hammanskraal/Temba Spatial Development Framework, 2012
The Hammanskraal/Temba Spatial Development Framework focusses on the Hammanskraal CBD and
Temba CBD. This document highlights several strategic priorities in this area. These include the need to
formalize and provide secure tenure, upgrading infrastructure, such as the tertiary road network and
bulk engineering services, and regeneration of the Babelegi Industrial Area.
10.2.4. Built Environment Performance Plan, 2017/18
The BEPP indicates that Temba is classified as an ‘urban node’ – it is located in a peripheral area in the
CoT, though the area is projected to grow rapidly in the medium term. In support of this development,
the plans note the need to address backlogs on basic service delivery. If the backlogs are not addressed
and economic growth is not supported in this area, it will deepen the spatial inequalities that are
currently experienced in Temba.

118
The re-establishment of a passenger rail line is planned between Shoshanguve and Hammanskraal. If
achieved, this line would provide an alternative access point to Pretoria CBD. The BEPP also proposes
extending the Atteridgeville Bus Rapid Transit Route further North, as a complement to increasing the
public transport capacity by way of the proposed rail line.
Opportunity: The TED situational analysis evidence utilised in area-based strategic plans.
10.3. Land Use Dynamics
The Land Use Management By-Law was promulgated in 2016. The Tshwane Town Planning Scheme
(TPS) was introduced in 2008 (with further revisions in 2014). The TSP replaced older schemes. The area
to the West of the N1, which is mostly made up of Temba, is solely subject to the 2008 TPS. It is not
clear whether an older scheme was in effect in this area before 2008. The area to the East of the N1
used to be governed by the Peri-Urban Town Planning Scheme, 1975, which has been entirely replaced
by the TSP.
The land use dynamic in Hammanskraal is complex. The traditional authority is an important landowner
and autonomous land administrator. We have been unable to access data about land ownership in this
area, so it is uncertain how much land falls into this category.
Portions of land in the core area are zoned as ‘Undetermined.’ This zone is primarily intended for single
dwellings or agricultural use. A Municipal Transitional Settlement may be permitted as a consent use on
land zoned under this category. Municipal Transitional Settlements are governed by Schedule 27 of the
TPS, 2008 (rev. 2014). The intended dominant use for a MTS is for temporary emergency housing, which
should be formalized over time.

119
Map 17: Zoning in Hammanskraal

120
A significant proportion of the study area is zoned Residential 1. Babelegi is zoned for industrial use.
There are a variety of institutional and community facilities available in the site. A small percentage of
land is zoned for business purposes.
Table 4: Uses that are and are not permitted for Undetermined and Residential 1 Use Zones
Undetermined
Purposes for which buildings may
be erected or used or land used
Consent Use Not permitted
Agriculture Municipal Transitional
Settlement subject to Schedule
27
Industry
Farm Stall subject to schedule 10 Uses not indicated as primary or
‘not permitted’
Noxious Industry
One dwelling house Scrap Yard
Mini Storage
Residential 1
Purposes for which buildings may
be erected or used or land used
Consent Use Not permitted
One Dwelling house Backpackers Use not indicated as primary or
consent uses
One Additional Dwelling House Boarding House
Embassy/Consulate Commune
Day cate for the aged
Guest House
Institution
Parking site adjacent to use
zones 6,7, 8, 9, 10, 11, 12, 13, 14,
15, 18 & 28
,,
Place of child care
Place of Instruction
Place of Public Worship

121
Retirement Centre
Social Hall
Sport and Recreation Club
Sports and Recreation Ground
Veterinary Clinic which does not
comply with schedule 9
Veterinary Hospital
Wall of Remembrance in
conjunction with a Place of
Public Worship
Table 5: Coverage permissions for Undetermined and Residential 1 Use Zones
(1) (2) (3) (4) (5) (6)
Coverage zone
per property as
recorded in the
electronic
database of the
scheme
Parking garages
and public
garages,
warehouses,
buildings used
solely for the
display of
goods
Coverages for
uses not
indicated in
columns 2, 4,5,6
Coverage for
industries,
places of
Instruction,
Hotel, Boarding
House and
Guest House
Coverage for
Duplex
Dwellings,
Blocks of Flats,
Blocks of
Tenements and
Dwelling units
in Residential 4
Use Zone
Coverage for
Agricultural
Buildings,
Dwelling
Houses in Use
Zones 1, 17, 19
and Dwelling
Units in Use
Zones 2, 3 and
5, Hospitals
and Institutions
Residential 1 95% 80% 75% 75% 50%
Undetermined 70% 70% 70% 70% 70%
The regulations that relate to street building lines, density and minimum erf size for Land Use
Residential 1, are held in separate information files, which are only available when requested from
the City information offices.

122
10.4. Precint Plans
10.4.1. Tsošološo Programme Precinct Plans
The Tsošološo Programme seeks to create long-term change in marginalised areas of the City
through infrastructure and urban design interventions aimed at promoting better public space and
access to public facilities. The main funding for this intervention is provided through the
Neighborhoods Development Partnership Programme (NDPP) Grant. Hammanskraal/Temba is one
of six marginalised areas in the City that has received upgrades through the NDPP.
The Tsošološo Programme aims to foster spatial transformation through social and institutional
services as a means to facilitate socio-economic development. This is to brought about through
effective spatial planning, fostering better linkages and upgrading and re-structuring public
transport facilities and markets where appropriate.
Three major precincts have been identified for development. Firstly, the Hammanskraal Urban Core,
including sports, institutional and retail sub-precincts. Secondly, the Babelegi Industrial Node,
wherein the development aim is to retain, expand and attract new businesses to site. Thirdly, the
Temba Node includes the Jubilee Mall site and the vacant land around it, as well as the social
services along Temba Road.
10.4.2. Kudube Smart City Profiling Report, 2019
A 211 Ha site in Kudube has been identified for redevelopment as a high density, mixed use, mixed
income area. The locality for this development is remainder portion 1 of the farm Leeuwkraal 92 JR,
Hammanskraal. This development application was scheduled for submission to the City of Tshwane
in May 2019. The estimated yield for this project is as follows:
Table 6: Estimated yield of the Kudube Smart City Plan
Land Use Yield
Residential (Mixed Income) 7475 Units
Commercial (Offices and Retail) 178 680m2 (GCA)
Light Industrial 24 243m2 (GLA)
Institutional and Educational 108 448m2 (GLA)

123
This development, which is being carried out by IN & Associates Project Managers CC, at the
appointment and direction of the City of Tshwane Spatial Planning and Economic Development
Department, is a significant infill development opportunity in Region 2 and will result in significant
housing and infrastructure investments, which are set to stimulate the economy in this region
meaningfully.

124
11. Prioritised and high potential nodes
11.1. Overview
To inform any TED opportunities, we have produced a series of spatial maps upon which an analysis
could be undertaken. The maps are produced at two distinct scales (i) that of the study area – showing
the larger context of the township and the respective nodes under investigation and (ii) the nodal or
precinct area – showing a more detailed analysis of the land and infrastructure dynamics at a smaller
scale.
The maps intend to build a cohesive spatial overview. The data was largely obtained from the City,
including reports and plans. There is still data that is missing or pending. As a result, some maps have
been produced by manually allocating data (such as land use or zoning) to the drawings from relevant
planning documents.
In order to effectively bring about impact within the township, it is critical that the geographic extents
be appropriately identified. These are often described in spatial terms as nodes – a concentration,
consolidation of a variety or similarity of activity. Typically, these would exist along a route or at the
confluence of two or more such routes. In defining a node, we would aim to show the relative size,
distribution and relationship of focus areas with the larger study area. In conjunction with the
identification of geographic extents, the urban typologies are simultaneously identified in relation to
these extents. They may include streets, private land parcels, industry, natural features, informal
settlements that make up the physical elements of the node. Each urban typology warrants a unique
understanding and corresponding developmental response. The size and proximity of these nodes assist
in developing a strategy of how to optimize the developmental impact through seeing these nodes as
operating in isolation or relative to each other.
The identification of nodes has been based upon the institutional knowledge and documentation of the
Municipality. Following our assessment of the nodes and field investigations, these nodes were either
adopted, reprioritized or removed within the projects scope and node identification. In addition to the
identified nodes, the TAT team proposed additional nodes where the data and technical evidence
suggested. A basis for the identification of new nodes included,
(i) the capacity to bring catalytic spatial and economic transformation,

125
(ii) ability to be realized within the time, budgetary and technical constraints of the project,
(iii) A response to emergent social and economic activity.
(iv) The capacity to integrate stubborn and difficult development challenges.
The nodes identified are therefore a synthesis of the nodes identified by the municipality and the TAT
additional nodes – which revealed the priority nodes for the scope of the TED project.
The prioritised nodes for Hammanskraal include:
(i) Hammanskraal CBD
(ii) Themba City Precinct
(iii) Themba Square
(iv) Themba Beach Node

126
Map 18: Nodes in Hammanskraal and Themba

127
11.1.1. Land Administration
The nodes are connected via a street network and accessed via vehicular transport but are not suitable
for pedestrian linkages because of their distance from each other. The nodes therefore play autonomous
functions to the immediate areas they are located in.
The Jubilee shopping mall to the west of the north-south spine, creates a degree of economic symmetry
relative to the CBD to the east of the railway. The mall, however, is privately owned and suffocates any
broader beneficiation that could occur from a concentration of economic activity. While privately
owned, the mall precinct allows for a degree of urban management in terms of security, cleaning and
organisation that is not present in the study area. The transport hub at the mall could play a more
prominent role.
The study area demonstrates a valuable capacity to accommodate social desires in the township – which
are expressed in various urban spaces. Temba Square and the ‘Beach’ are notable spaces where social
and cultural life is accommodated. This is very encouraging and worth investing in, in the
conceptualisation the revitalisation of the township economy, for recreation, culture, and entertainment
purposes.
11.1.2. Infrastructure and Natural Systems
The Hammanskraal CBD is located at the confluence of the north-south and east-west transport
systems. The township is very dispersed in its spatial form radiating outwards from the CDB – particularly
to the north-west. This pattern results in very limited possibilities for pedestrian connectivity between
amenities in Hammanskraal as the distances are not easily walkable. The CBD focuses primarily on
business, services and transport with little provision for housing, offices or recreational spaces. There
are poor east-west connections – further separating the township into eastern and western portions.
This separation needs to be acknowledged in the development proposals to ensure that adequate
attention is directed towards these important structural dynamics. It would be important to look at a
series of strategic linkages across this infrastructure barrier to ensure better connectivity in order to
optimise on development investments.
The dam and river system are a rare and valuable environmental feature that grossly underperform as
a natural asset to the township. It would be incumbent to leverage this feature within a TED development

128
approach, as there are some existing use patterns that reveal the larger possibilities that could be
unlocked.
The railway system is not functional for passenger rail purposes and does not contribute to generating
urban activity. Designed to connect, the railways perform a dividing and contaminating function in the
township and need to be addressed urgently as they run the risk of threatening township economic
development and much needed spatial transformation. The legacy support infrastructure of a functional
railway system is still in place and supported by public and private vehicular transport systems. The
underperforming railway system and its associated real estate needs to be radically repurposed to
augment and leverage off the adjacent existing economic centres.
Opportunity: Commercial high streets activated in strategic sites / road corridors.

129
Map 19: Land Ownership

130
11.2. Hammanskraal CBD
The Hammanskraal CBD is economically active but is a harsh and unforgiving space in terms of user
experience. There is little respite from urban chaos and this space seems to have a solitary function of
trade and transport. Left unchecked and unmanaged the space runs the risk of intensifying this pattern
and becoming increasingly uncomfortable and congested. Very poor synergies exist between the
infrastructure if the state, private sector and the ‘people’. The lack of an organising system encourages
an assemblage of fragmented parts with poor interdependences between each other.
Intense vehicular and pedestrian conflict and limited spaces for safe pedestrian access is a concern. A
strong precinct management strategy would be very valuable, to co-ordinate growth and operations,
which would have a beneficial impact on property values. The node currently does not generate good
street connections into adjacent neighbourhoods because of the divisive nature of the road network,
which has a bias towards fast moving vehicular traffic. This results in the node functioning as a congested
silo with limited capacity to positively influence adjacent land value.
The defunct railway infrastructure and its derelict nature is a threat to the sustainability of the precinct
and needs urgent attention to ensure the spatial transformation of the node. The CBD has significant
economic real estate that can play a productive role in the neighbourhood but requires better
connectivity and land and precinct management.
The following suggestions are contemplated for the node:
1. Develop an Urban Management Plan and clearly demarcate a precinct within this node. The
stakeholders would need to be clearly defined and engaged in the process of the
transformation of the node. A stakeholder and management plan will create a secure
institutional space for increased private investment – especially through the adjacent land
parcels, which are currently underperforming.
2. Public Environment Upgrade. The sidewalks and connections across streets at the node need
to be designed to allow for better connectivity and safe walking for commuters/pedestrians and
economic opportunity for micro business. This would involve a public environment upgrade
that would include the design and implementation of sidewalk, lighting, signage (directional
and advertising) and landscaping (hard and soft).

131
3. East-West Link. The link along Harry Gwala Road is entirely vehicular with very limited options
for pedestrian access – due to the nature of the road infrastructure. This road could better link
to the shopping centre through a rehabilitation of its verges and activation of adjacent land.
4. Traffic Management. The area requires a comprehensive review of the traffic systems in order
to better delineate pedestrian, vehicular (private and public) and logistic movement, to manage
dangerous levels of congestion.
5. Pedestrian Bridge Review. The existing bridge over the R101 is poorly conceived and attracts
misuse by vulnerable groups rendering the infrastructure ‘highjacked’. Better integration of the
design of the bridge’s platforms, walkways and functions is needed. Examples of bridges
functioning as markets, such as in Warwick Street (Durban), are good examples of re-
conceptualising this utilitarian infrastructure to perform more productive uses. The bridge can
be better conceptualised to integrate the varying economic functions on either end of the road.
A special urban management strategy is needed between key stakeholders to ensure the bridge
functions well.
6. Linear Street Markets. The edges of land and the manner in which movement and entrances are
configured could be better organised. This would create clear edges, management areas,
legibility and help produce an active circulation system in the node.
7. Transnet Land Redevelopment and West-Link. The Transnet land requires clarity in terms of its
development future. At its most basic level, the space could be converted into a park and social
space with defined urban management. This would form the base infrastructure for any future
development. The possibility of introducing a connection using the existing bridge and crossing
over the river into Lebela Street could be investigated to better integrate the two parts of
development on either side of the river and activate increased development opportunities at
this node. Lebela Street extends directly towards opportunity nodes adjacent to the shopping
centre.
8. Public Art. It is also recommended that a public art and creative output program and project is
coupled with this development. This would engage local creative practitioners to enhance the
precinct and lend a particular creative and brand identity. Outputs could include sculpture,
installations, mosaic, murals as well as ephemeral or soft programs like performance.
Opportunity: Public facilities serving transport and informal trading in the CBD enhanced.
Opportunity: Un-utilised land in the urban core unlocked for development.

132
Figure 29: The existing pedestrian bridge is poorly designed and a den for social deviance resulting in the bridge not
being used for commuters and pedestrians due to safety concerns. The relationship of the bridge to the adjacent
shopping anchors requires review to better locate it in the CDB and optimise opportunity and connectivity.

133
The following section includes a series of maps relating to this node. The table below provides a summary of the status quo for the Hammanskraal CBD, as
indicated in the maps. In instances where the GIS data is not available or has not been provided, the table specifies the gaps.
Table 7: Status Quo of the Hammanskraal CBD Node
Connectivity/Transport Socio-
economic
Function
Current Zoning Digital Stormwater,
Water and
Sanitation
Energy Int Human
Settlements
Trader Access to
Infrastructure
The CBD straddles the R101
(Old Warmbaths Road).
Poor east-west connectivity
as a result of road
congestion on bridges over
the railway system.
Adequate road network. Bus
and taxi routes extend
along R101, east into the
commercial area and over
the M21 towards Themba.
There are four taxi
ranks/bus stops in this
node. The trainline currently
does not provide a
passenger service. Informal
pedestrian routes connect
the node to the Themba
node and Jubilee Mall. A
pedestrian bridge over the
R101 is considered unsafe
and not utilised.
An emerging
township CBD,
comprising
SME retailers,
corporate
retailers,
financial
services and
street traders.
Shopping malls
include the
Renbro Centre
and Kopanong
Centre. City
established
street trader
facilities. The
CBD includes
social, health
and educational
facilities.
Open Space in
the north-
western section
of the site, with
Institutional
zoning adjacent
to this section.
A residential
area is located
to the south of
the institutional
area, with
commercial
zoning around
the R101.
No Data
Available
Surrounding
residential area
has supply, access
to the new
proposed
residential section
will need to be
extended, supply
to institutional
area is not clear.
Streetlights and
High Masts are
present
throughout the
node. MV
Cables and
electricity
service
connection
feeders are also
present in most
of this precinct.
No Data Available Predominantly
informal or no water
access, some formal
access. More formal
electricity access
towards the north
of the precinct, with
informal or no
electricity access
predominating in
the southern part of
the site.

134
Map 20: Hammanskraal Central Business District Node

135
Map 21: Existing Land Use, Hammanskraal CDB Node

136
Map 22: Land Ownership, Hammanskraal CBD Node

137
Map 23: Water, Sanitation and Stormwater Infrastructure, Hammanskraal CBD Node

138
Map 24: Public Transport Infrastructure, Hammanskraal CBD Node
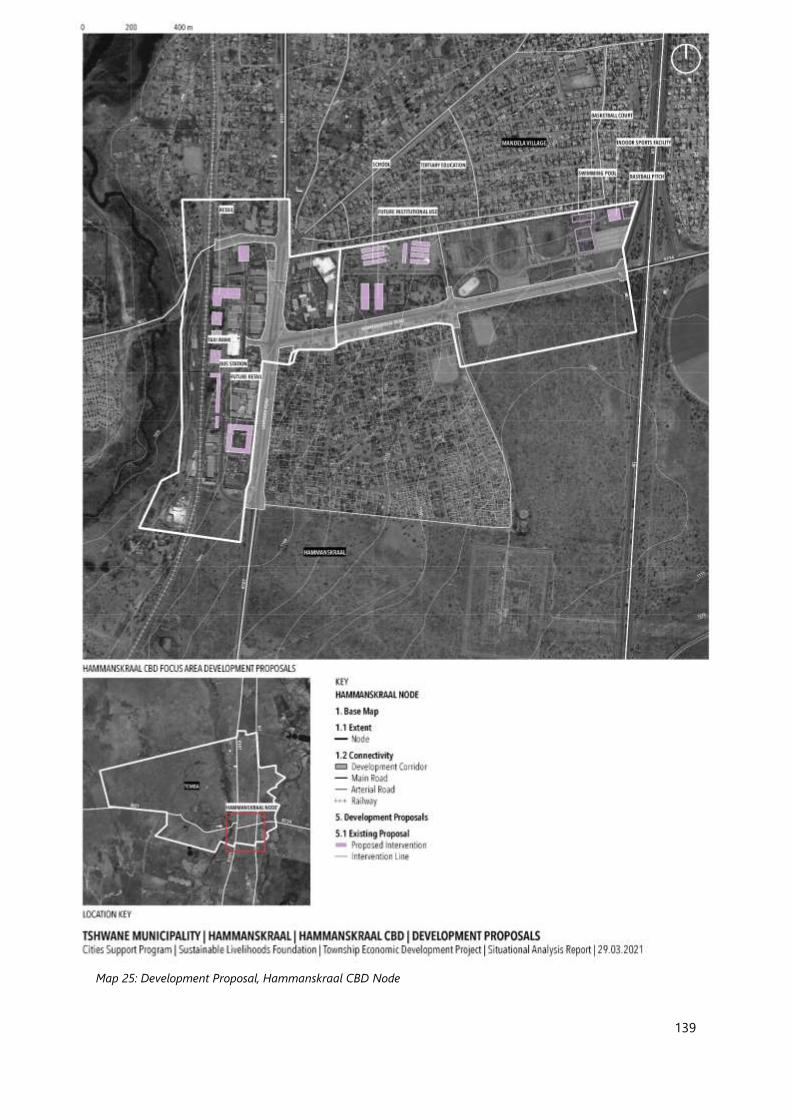
139
Map 25: Development Proposal, Hammanskraal CBD Node

140
11.3. Temba Local Node
The Temba local node is rather large and poorly defined. Its connective system of streets does not
contribute to a diversity of functions, connectivity and urban well-being. The Jubilee Mall is the primary
feature of the node and does not appear to have been leveraged to contribute to the broader context
– especially in terms of its relationship to transport, creating an inclusive economy, unlocking adjacent
property values and creating active streets. A special effort needs to be directed to properties in this
node being able to realise greater value and this needs to be done in a manner that deals with the
structural, infrastructural and connectivity failures of the area.
In addition to the considerations set forth in the Kudube Smart City Profile, set out in section 10.5.
above, the following suggestions are contemplated for the node:
1. Public Environment Upgrade. The sidewalks and connections across streets at the node need to be
designed to allow for better connectivity and safe walking for commuters/pedestrians and
economic opportunity for micro business. This would involve a general public environment upgrade
that would include the design and implementation of sidewalk, lighting, signage (directional and
advertising) and landscaping (hard and soft).
2. Secondary Node Activation. The commercial land around the intersection of Temba and Lebela
streets requires optimisation to stimulate coordinated economic activity. The location of this land
lends itself to dynamic future growth and requires packaging to ensure this occurs in an intentional
an informed manner.
3. Structural Adjustment - refers to the larger spatial and economic structural adjustments necessary
for the area. These have a long-term horizon, however, need to commence with small, clear and
incremental investments. The intention behind these would be to acknowledge existing forces of
the node (shopping centre and CBD specifically in this case) and harness these towards a more
transformative, inclusive and connected area. The following three work towards this larger idea:
a. East West Linkages. The connections along Harry Gwala and Lebela Street (proposed) to
the eastern CBD is worth considering as two high-level armatures upon which the township
expansion (10-20 year) would take place. Rapid growth is expected and these armatures
would provide the necessary framework for integrated growth.
b. Linear Street Markets (south side between Temba and Mfumo Street). The street edges to
the south of the street to be reviewed to better support economic activation of adjacent
properties. This would need to take into consideration parking, access, trading spaces,

141
signage and lighting. The adjacent properties would leverage off increased activity and
value due to this infrastructure as well as the shopping centre.
c. Commercial Micro-Node. The commercially zoned properties at the intersection of Temba
and Harry Gwala are to be optimised to play a key linking role towards the CBD along Lebela
Street and the Jubilee Mall. The possibility for dense mixed commercial, retail and transport
use functions would be explored.
Opportunity: Pedestrian paths / bridge connections established to link residential areas to the CBD
and retail hubs.

142
The following section includes a series of maps relating to this node. The table below provides a summary of the status quo for the Temba Node, as indicated
in the maps. In instances where the GIS data is not available or has not been provided, the table specifies the gaps.
Table 8: Status Quo of the Temba Node
Connectivity/Transport Socio-economic Function Current
Zoning
Digital Stormwater,
Water and
Sanitation
Energy Int Human
Settlements
Trader Access to
Infrastructure
One road (Harry Gwala
Avenue) connects the
CBD to Temba Road.
Proposed rail line to run
through the site, to the
North of Jubilee Mall,
with a train station
proposed for this node.
At present a bus/taxi
route runs along the
M21 north along Temba
Road. There are five
bus/taxi ranks in this
node.
Jubilee Mall (corporate and
SME retail) is a commercial
anchor within the node. The
mall precinct includes a
formal taxi rank and bus
station. Street trade and
informal shops occur on the
adjacent roads. The broader
node includes a Provincial
Hospital, City service centres
and offices, SAPS station,
social, health and
educational facilities. Much
informal land use along the
high streets (Harry Gwala
Avenue and Temba Road)
Gap in
zoning data
in Southern
portion of
the site.
Government
and industrial
zoning along
Temba Road.
No Data
Available
The stormwater
network in the
surrounding
residential areas is
well-connected,
but capacity will
need to be
extended into the
vacant land that is
proposed for
mixed-use
development. Bulk
facilities run
through the site,
with connections
running
throughout the
site.
Streetlights
along M21 and
Temba Road.
Streetlights and
High Masts in
the residential
area adjacent to
Temba Road.
Electricity
Service
Connection
Feeders along
M21. HV
Electricity line
runs through
the precinct.
The Kudube
Smart City Plan
seeks to
establish a
mixed-use
neighbourhood
with 7475 new
mixed income
housing units.
Along the M21: a
degree of formal
water access, with
no water access
predominating.
The dynamic is
similar for
electricity access.
Along Temba
Road:
predominantly
formal water and
electricity access,
with some
informal access.

143
Map 26: Temba Node

144
Map 27: Proposed Land Use Temba Node

145
Map 28: Zoning, Temba Node
,

146
Map 29: Transport, Temba Node

147
Map 30: Water, Sanitation and Stormwater Infrastructure, Temba Node

148
11.4. Temba City
This precinct has an ideal set of diverse functions, operates at a good scale. The node is well connected
and well located. Interesting and valuable street activity is found around this node, despite the Temba
City Mall underperforming economically. The residual functions of the market and taxi rank are valuable
economic assets in the precinct and should be acknowledged in the future development of the Mall.
There are significant parcels of private and public land in the area that are underperforming, which could
benefit from key interventions in the area – specifically the repurposing of the mall and development
incentives.
The following suggestions are contemplated for Temba City:
1. Develop an Urban Management Plan and the clearly demarcate a precinct within this node. The
stakeholders would need to be clearly defined and engaged in the process of the
transformation of the node. A stakeholder and management plan will create a secure
institutional space for increased private investment – especially through the adjacent
underperforming land parcels.
2. Mall Adaptive Reuse (Leisure). The mall infrastructure is well kept and suited for repurpose –
whilst still retaining the anchor retail tenant. The possibility to make the mall into a destination
indoor sports and recreation facility should be investigated. This would retain the shopping
centre anchor.
3. Linear Street Market. The market along Mosimegi Street attracts significant activity and is well-
located. This market should be amplified and expanded to occupy parts of the street. The
existing taxi rank would need to be designed to support the operations and growth of the
market.
4. A Civic Garden. The entire block of the Civic Square to be reinforced as a green heart within the
neighbourhood through an intensified landscaping and tree planting program. The space coul
d become a retreat for the neighbourhood seeking civic or recreational uses. The park lends
itself to be being managed as an asset between multiple stakeholders with the state as an
anchoring stakeholder.
Opportunity: A development strategy for Temba City precinct approved.
149
Opportunity: The Temba City shopping mall revitalised.
Opportunity: Shopping malls foster and enable opportunities for micro-enterprises.
Residents were mobilised on the Hammanskraal Virtual Imbizo by means of a poll about what
improvements Themba City might need. The participants were invited to vote on a poll and comment
on whether or not Themba City needs more stalls for informal traders. The post received 120 likes, 26
comments and 3 shares. People commented on the need for more shops in Themba City and how the
complex has been empty. Residents’ perceptions were that Jubilee Mall is overcrowded, which has been
a problem in the context of COVID-19. Some comments were on place-making issues such as security
and the presence of “Nyaope boys” and the need for renovations. One participant, in particular,
commented on the need for new management in the complex. The poll specifically asked what would
make Themba City better. It provided voters with multiple choice type responses and an option to write
any other responses that may have not been provided in the multiple-choice list. Thirteen people voted
on the Hammanskraal poll. The most voted suggestion for making Temba Square better was having Wi-
Fi access, followed by more trader stalls and having water and electricity for traders. Eleven people
provided additional suggestions such as turning the space into a food court, building proper structures
and adding ATM facilities. These suggestions, along with a more rigorous public participation process,
should be integrated into any design of this node.

150
Figure 31: The poorly performing Temba City Shopping Centre results in significant under-utilised space in the precinct.
These pockets of spaces are ideally suited to be conceptualised into the larger operations off the precinct.
Figure 30: Extracts from the Virtual Imbizo Poll on Temba City Mall

151
Figure 32: The Themba Shopping Centre is largely defunct par for the existing retail anchor and well-suited to being
repurposed. The trading stalls and taxi rank outside are very busy spaces.

152
The following section includes a series of maps relating to this node. The table below provides a summary of the status quo for the Temba City Node, as indicated
in the maps. In instances where the GIS data is not available or has not been provided, the table specifies the gaps.
Table 9: Status Quo of the Temba Ciry Node
Connectivity/Transport Socio-economic
Function
Current Zoning Digital Stormwater,
Water and
Sanitation
Energy Int Human
Settlements
Trader Access to
Infrastructure
Situated along Molefe
Makinta Road, which is a
municipal bus route. A taxi
rank is also located in this
node, on Mosimegi Street.
The node is situated within
the heart of the Temba
residential area. Pedestrian
and bicycle connectivity
are important.
The node comprises
the Temba City
Shopping Centre, SME
retailers and
wholesalers, the
Moretele Magistrate's
court and the
Department of Home
Affairs. Street traders
and micro-enterprises
operate from public
land and adjacent
properties.
The predominant zoning
in this micro-node is
business 1, which is the
site that Themba City
Shopping Centre and
surrounding properties
occupy. Two large erven
are zoned for
government and
educational purposed.
The surrounding area
supports low density
residential, with
residential 1 zoning.
No Data
Available
Themba City is
connected to
the water and
sewerage
network, which
is well-
connected in
this area. There
is no indication
of stormwater
infrastructure in
this site.
The electricity grid
is well-connected in
this micro-node,
with public street
lighting provided in
the form of high-
mast lights.
No data
available.
A fair number of
businesses in this
micro-node have
access to water,
the majority of
which have
informal access,
while some
businesses have
formal water
access. Access to
electricity follows
a similar pattern.

153
Map 31: Temba City

154
Map 32: Zoning, Themba City

155
Map 33: Public Transport Facilities and Routes, Themba City

156
Map 34: Water, Sanitation and Stormwater Infrastructure, Themba City

157
11.5. Themba Square
Themba Square is a very well used social and public space. It is well-located and used by the community.
It exemplifies the capacity for urban spaces to enable the social and cultural life in the township. The
site contains a diversity of open space, social, commercial and residential uses at a potentially
comfortable scale. Vehicular traffic is managed by the nature of the road infrastructure and allows for
safe pedestrian mobility across the spaces. The nature of the built space allows for a natural urban
management that is invaluable in this context. There are no vacancies and significant diverse participants
using the space at various times of the day creating an organic interdependence on the space and urban
upkeep.
The following suggestions are contemplated for Temba Square:
1. Urban Management Plan and the clear demarcation of a precinct within this node. The
stakeholders would need to be clearly defined and engaged in the process of the
transformation of the node. A secure stakeholder and management plan will create a secure
institutional space for increased private investment – especially through the adjacent
underperforming land parcels.
2. Edge Condition. The edges of adjacent properties facing onto Themba Square to be enhanced
to allow for better parking, activation, landscaping (hard and soft), trading spaces and signage.
Special attention to be directed towards lighting.
3. Public Environment Upgrade. The sidewalks and connections across streets at the node need
to be designed to allow for better connectivity and safe walking for commuters/pedestrians and
economic opportunity for micro business. This would involve a general public environment
upgrade that would include the design and implementation of sidewalk, lighting, signage
(directional and advertising) and landscaping (hard and soft).
4. Enhance connections. The links towards Themba Dam and the commercial spaces along Temba
Road needs to be enhanced through signage, lighting and clear walkways.
5. Public Art. It is also recommended that a public art and creative output program and project is
coupled with this development. This would engage local creative practitioners to enhance the
precinct and lend a particular creative and brand identity. Outputs could include sculpture,
installations, mosaic, murals as well as ephemeral or soft programs like performance.

158
Opportunity: Temba Square precinct transformed into a hub in support of social and economic
opportunities.
Figure 33: This well-used square is a traffic island with recreational facilities and adjacent social and business uses on
the adjacent side of the street. The size, location, landscaping and amenities provided assist in the value the square
provides to the township residents.

159
Map 35: Temba Square

160
Map 36: Zoning, Themba Square

161
Map 37: Public Transport Facilities and Routes, Themba City

162
Map 38: Water, Sanitation and Stormwater Infrastructure, Themba City

163
11.6. Temba Dam
The dam, particularly between the pedestrian bridge and dam wall is a dynamic and valuable leisure
resource in the township. It accommodates recreational users and is naturally well structured to be a
high performing natural and recreational asset. The pedestrian bridge provides a critical east-west
linkage that connects the two parts of broader Hammanskraal. This is further augmented by an adjacent
soccer field. An investment in this space could be coupled with a strong and important environmental
program to ensure the optimal function of the environmental system.
The following suggestions are contemplated for Temba Dam:
1. A Leisure Destination. The dam is a rare natural asset and has within this surrounds a series of
valuable spaces that can easily be activated to create a unique leisure experience in the
township. Towards this the following is considered:
a. Place-Making. The dam and immediate surrounds lacks spatial legibility - space to
enter, walk or gather. A place-making strategy would guide the spatial configuration of
the accessible Dam areas to function with greater legibility. Support built infrastructure
for seating, shade, artworks, waiting areas, water points, information and orientation
would be included.
b. Navigation. Lighting and signage would greatly increase safety, access and orientation
at the Dam.
c. Program. The dam is a dramatic natural feature which is under performing and
underrepresented. Through a careful study of the uses and users of the dam spaces, a
careful curation and activation of the spaces would greatly improve the use of the
space. The program could also include a strong neighbourhood environmental
campaign looking specifically at water and recycling.
2. Sports Facility. The open space between the dam and railway line is to be amplified from a open
soccer pitch towards a more consolidated sports facility. The dam itself is to be used for water
sports.

164
Opportunity: Temba beach revitalised as a leisure / recreation destination.
Figure 34: The banks of the dam is popularly referred to as Themba Beach and a valuable vantage point to experience
the dam. The natural ecosystem along this edge lends itself to a destination through which the dam and its
environments could be experienced.

165
Map 39: Temba Dam

166
Map 40: Zoning, Temba Dam

167
Map 41: Water, Sanitation and Stormwater Infrastructure, Temba Dam

168
Map 42: Electricity Infrastructure, Temba Dam

169
12. Housing
12.1. Overview
This section analyses the role of housing in township economic development in Hammanskraal. It uses
the housing asset framework to analyse the social, economic and financial functions of housing and
their contributions to township development. It also draws attention to the roles of place-making and
institutions in increasing the all-round value of housing and stimulating economic density, i.e., higher
investment in buildings and other physical structures.
The study uses available quantitative and qualitative data to analyse the existing housing situation and
the main trends, upon which future opportunities are identified and discussed. Information gaps
presented a significant challenge to understanding the housing dynamics in Hammanskraal. Limited
information on basic issues including population growth, housing demand, density, informal dwellings
and local property markets render the analysis incomplete.
12.2. Conceptual Framework: Housing as social, economic and financial asset
The housing asset framework (Rust 2020) 1 offers a useful conceptual lens to understand the social,
economic and financial importance of housing and how they can contribute to township economic
development. As a social asset, housing provides township residents with a safe and secure place to
live, socialise, study and sleep. As an economic asset, housing generates income and livelihood
opportunities for homeowners. The social and economic functions of housing influence its value as a
financial asset. As a financial asset, the house can be traded for money, used as collateral to access
finance or as an investment to accumulate wealth, which can be passed on to others. The figure below
depicts the social, economic and financial asset values of housing and their contribution to township
economic development.
1 Rust, K. (2020). Framing concept: Understanding the housing asset. Centre for Affordable Housing Finance.
http://housingfinanceafrica.org/documents/framing-concept-understanding-the-housing-asset/

170
Figure 35: Housing Asset Values and their contribution to TED
12.3. Housing as Social Asset
There seems to be continuous population growth in the area, both through natural growth and in-
migration, especially young people in search of work. Unfortunately, no recent count of the actual
population in the township is available.
Housing delivery is complicated due to problems associated with historical land use and settlement
policies, different administrative jurisdictions, tribal authorities and land management. In the
Hammanskraal node, the most eastern area is in public ownership, but the commercial core is almost
completely in private ownership. All the erven in the Temba node are still under state ownership. A
number of properties in the Temba precinct are not registered or verified. Formalisation of traditional
land can be hampered by resistance from tribal authorities, who fear to forfeit de facto ownership. In
addition, homeowners may be reluctant to formalise their erven because they would then incur rates
and service costs. Unregistered land poses challenges for development as long and laborious processes
are required to acquire the land. For instance, during a field visit we met people who have been living
in their houses for 25+ years without having received their title deeds. The hostels were built by
companies during apartheid era, and when factories left and tenants moved out, local residents
occupied the units. The houses require maintenance and infrastructure upgrading (especially fixing
roofing, formal electricity connection, outside painting), but the lack of security of tenure disincentivise
people from investing in their homes.

171
Hammanskraal has a mix of poor and middle-income population, which is also reflected in the different
housing typologies that characterize neighbourhoods. The areas of Temba Unit 1 and Kudube Unit 2
record average property prices of R316,459 and R279,613 respectively, which are the highest in the
township. There is a noticeable class of middle-income households living in high quality houses on large
plots. Some of the properties are sold for R650,000 and more in these established neighbourhoods.
Homeowners have made substantial investments in their properties, renovating, expanding the original
structure and improving place-making. This presents important opportunities for local construction
industry and enterprise operating along the value chain.
New gated estate properties have emerged as well as rental apartments targeting middle-income
households. For instance, during a field visit we met one property developer who was busy finishing
constructing a large double-storey apartment block containing 48 flats. Each have two bedrooms,
kitchen and bathroom and cost R4800 per month. All of them but five apartments were booked out
already. The owner has been in the construction business for 15 years and has built properties in Pretoria
and surrounding areas. He explains that building rental accommodation is profitable as bachelor flats
go for R2000 per month, single bedroom for R2800 per month and double-bedroom for R4500 per
month. Apparently, he bought the land on which the property is situated on from the local chief in 2010.
Figure 36: An example of housing typologies found in Hammanskraal

172
Figure 37: An example of housing typologies found in Hammanskraal
Figure 38: An example of housing typologies found in Hammanskraal
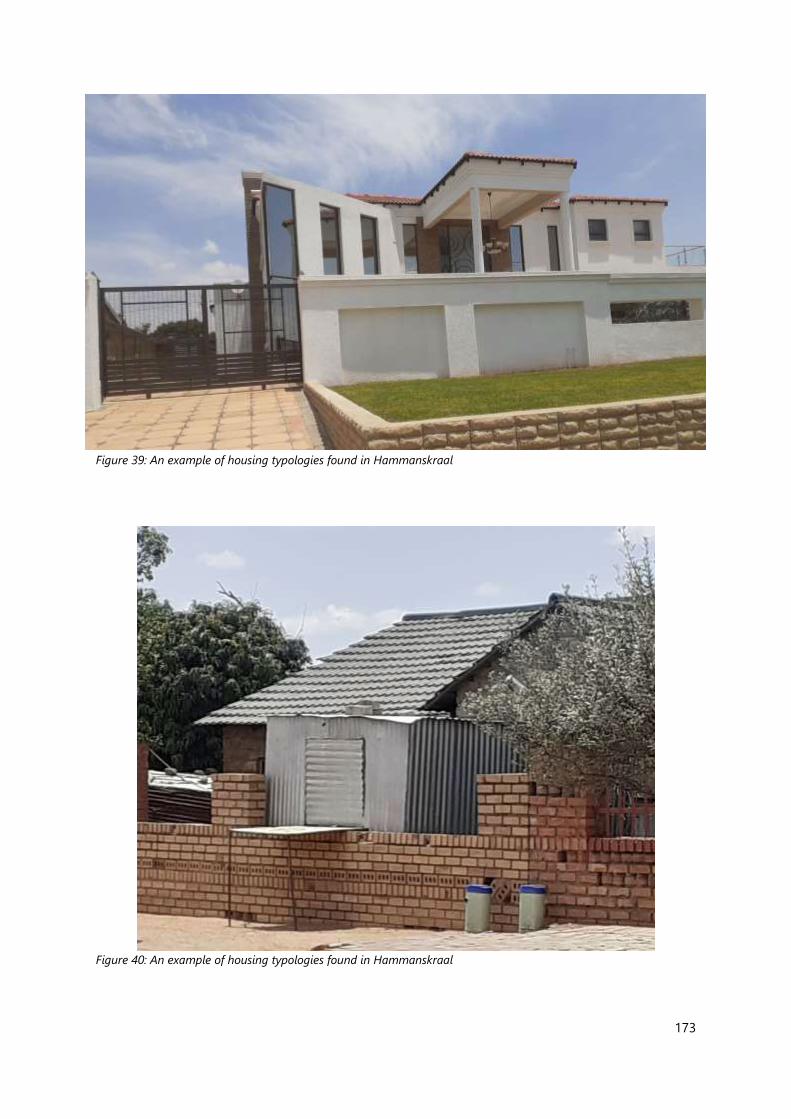
173
Figure 39: An example of housing typologies found in Hammanskraal
Figure 40: An example of housing typologies found in Hammanskraal

174
Figure 41: An example of housing typologies found in Hammanskraal
The backyard rental market exists but is less significant compared to other project areas. Nevertheless,
it offers some opportunities for the local construction and property industry as well as for businesses in
up- and downstream industries. Most of the construction of backyard rental accommodation is done
by informal builders and micro construction businesses, who contract local labour. Usually, they are
youth and unemployed. The construction process is relatively quick and cheap. For instance, during a
field visit we met one builder who builds a single-storey block of five rooms within two weeks at a total
cost of R17,500 (excluding material). Each room has pre-paid electricity, water tap and en-suite shower.
The homeowner sources and provides him with the material, which is purchased at local warehouses
and retail stores. Some owners buy cheaper bricks from informal brickmakers, but their quality is inferior
to NHBRC certified ones that you buy in formal stores. Many of the builders in Hammanskraal are from
Zimbabwe and Mozambique, which makes formalisation even more difficult as they lack some of the
documentation required.
Instead of renting backyard dwellings, most low-income households live in RDP/BNG housing or in the
expanding informal settlement located on the urban periphery to the west. Land is cheap and available,
which contributes to low-density sprawl and fragmentation. The inadequate conditions of informal
settlements pose health and safety risks to people, including those who are ineligible for higher quality
state-subsidised housing. The formalization of informal settlements is another important strategy for

175
the area. The aim is to implement formal layout plans, install bulk infrastructure and formalize individual
erven to transfer ownership to households. However, this is complicated for settlements located on
tribal land as the transfer of ownership to individuals is contested. Community politics and local
resistance can also hinder and eventually bring to a halt municipal plans to formalise informal
settlements.
Figure 42: Sprawling formal and informal settlement
People have established homes on land under the administration of traditional authorities. Most of
these developments fall outside the urban core and outside municipal oversight. It appears that the
lower middle- and middle-income groups (i.e., persons with cars) are moving outwards and investing in
and developing properties in these areas. Investment in land under traditional authority administration
presents the investor with several benefits: i) affordable and large size plots, ii) no rates, iii) customary
rights, such as the right to burial. Some of these neighbourhoods have access to water and electricity.
Opportunity: Informal land use formalised on high-streets and villages.
As of 2019, Hammanskraal had a registered housing stock of 8520. This corresponds well with all formal
housing recorded in the 2011 census. Between 2015 and 2019, the stock grew by 1536 registered
properties, which is a sizeable 18% of the total registered stock. All of the added properties were BNG
houses delivered in the Kanana area for people living in informal settlements. Given the latest
announcements by the Department of Human Settlements, indicating that free BNG housing delivery
will be drastically reduced and replaced by sites and services schemes, government investments in
formal housing may play a less significant role in future. However, there are opportunities for innovative

176
public-private partnerships in delivering higher-density affordable housing within the urban core of the
township. Through unlocking strategic sites and enable in-fill developments, the city can promote urban
consolidation, compaction and land use intensification. One such opportunity is the Kudube Smart City,
which is a 211ha mixed-use and mixed-income project in a significant node in Hammanskraal. While
the proposed development is predominantly residential, creating an estimated 7,475 housing units, it
also entails commercial, light industrial, educational, institutional and social uses.
Opportunity: Formal housing established in strategic sites.
12.4. Housing as economic asset
Some homeowners in Hammanskraal have rented out their space or purpose-built accommodation in
the back- or front-yard of their houses. While some of them are rented for free to family or friends,
others are exclusively aimed at generating income.
Home-based enterprises are another important use of the house as an economic asset. Homes are the
dominant business location for enterprises operating in residential neighbourhoods in the townships.
They offer vital products and services to the residential population including food and retail, educare,
entertainment, recycling and home maintenance. Homes are also used for businesses in high streets
and commercial hotspots, although mobile structures such as containers, tables and stands are much
more common. The recently conducted micro enterprise ecosystem survey recorded the location of
entrepreneurs operating in the selected high streets and hotspots, which we grouped into businesses
operating from property (private house & business premise) and impermanent structures (containers,
shed/shack, table). The survey recorded the location for 285 businesses out of 364 surveyed. The survey
highlights that more businesses (161) operate from mobile structures (56%) than from property (124 or
44%). The survey seems to indicate a demand for commercial space in properties in those areas, as 70%
of businesses rented the space compared to 25% who owned and 5% who did not declare their tenure
status.

177
Figure 43: Proportion of businesses operating of a property or an impermanent structure
Figure 44: Tenure Status for Micro-Enterprises in Hammanskraal
124
161
Ecosystem survey (Hammanskraal) - Business location
Property (private house & business premise) Mobile/Container/Shed/Shack
87
31
6
Micro enterprises operating from property - Tenure
rent own n/a

178
12.5. Housing as financial asset
The property market in Hammanskraal was almost entirely driven by the delivery of new BNG units over
the past five years. Property prices were on average low and most areas registered almost no growth.
The data suggests that formal tenure within Hammanskraal was widespread, but this did not translate
into a market for resales. The notable lack of formal transactions in Hammanskraal over the past five
years suggests that housing was rarely activated as a financial asset. Housing-based investments were
probably orientated towards owner-upgrades and rentals (and sales were mostly informal). It appears
that many property owners still prefer to trade houses informally, which is difficult to quantify as
transactions take place under the radar.

179
Map 43: Property Growth Rate, Hammanskraal

180
Map 44: Average Property Values, Hammanskraal
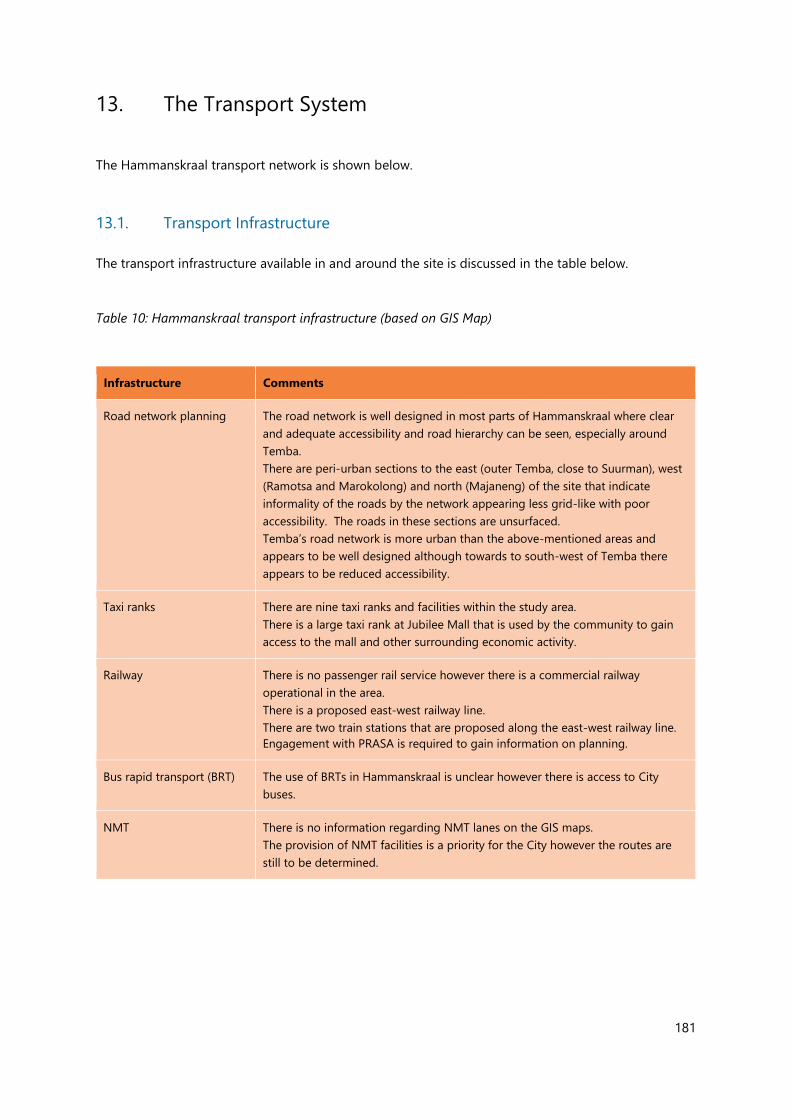
181
13. The Transport System
The Hammanskraal transport network is shown below.
13.1. Transport Infrastructure
The transport infrastructure available in and around the site is discussed in the table below.
Table 10: Hammanskraal transport infrastructure (based on GIS Map)
Infrastructure Comments
Road network planning The road network is well designed in most parts of Hammanskraal where clear
and adequate accessibility and road hierarchy can be seen, especially around
Temba.
There are peri-urban sections to the east (outer Temba, close to Suurman), west
(Ramotsa and Marokolong) and north (Majaneng) of the site that indicate
informality of the roads by the network appearing less grid-like with poor
accessibility. The roads in these sections are unsurfaced.
Temba’s road network is more urban than the above-mentioned areas and
appears to be well designed although towards to south-west of Temba there
appears to be reduced accessibility.
Taxi ranks There are nine taxi ranks and facilities within the study area.
There is a large taxi rank at Jubilee Mall that is used by the community to gain
access to the mall and other surrounding economic activity.
Railway There is no passenger rail service however there is a commercial railway
operational in the area.
There is a proposed east-west railway line.
There are two train stations that are proposed along the east-west railway line.
Engagement with PRASA is required to gain information on planning.
Bus rapid transport (BRT) The use of BRTs in Hammanskraal is unclear however there is access to City
buses.
NMT There is no information regarding NMT lanes on the GIS maps.
The provision of NMT facilities is a priority for the City however the routes are
still to be determined.

182
13.2. Development Challenges
The railway system in Hammanskraal has no station within the CBD, and the railway line is for freight
use and not commuter use.
There is evidence of transport infrastructure that has been damaged and vandalised, as well as
infrastructure that has been stolen. These include the pedestrian bridge that spans the R101. Some of
the sidewalks in the CBD are inaccessible to pedestrians due to street trader encroachment.
Opportunity: A secure pedestrian route created over the R101 within the Hammanskraal CBD.
13.3. Connectivity Between Different Modes
The GIS data indicates a limited number of taxi stops. It is unclear whether this information is complete
and accurate however the stops indicated are insufficient to service the population of Hammanskraal
and provide adequate connectivity to other modes of transport.
13.4. Transport Options and Services
The table below describes the transport options and services available within the site.
Table 11: Hammanskraal transport options and services
Transport options and
services
Comments
Private vehicles There is a portion of the community that lies within the middle-income group that
prefer to make use of their private vehicles over public transport.
NMT Sidewalks in some instances are used by informal traders and business owners to
set up the establishments. This reduces the space available for pedestrians and
cyclists to make use of the infrastructure.
The sidewalks in the CBD area are narrow and irregular. There is poor lighting and
little shade for pedestrians.

183
Bicycles are widely used in this site and therefore adequate NMT infrastructure is
required to ensure the safety of cyclists.
Motorcycles Motorcycles are used as e-hailing services.
E-hailing and e-delivery Motorbike delivery services are used in Hammanskraal.
Informal taxis It is unknown whether there are informal taxis operating in the site.
Mini-bus taxis Mini-bus taxis are available and widely used.
There are three formal taxi ranks within the site.
The City Transport Plan indicates that approximately eight informal and semi-
informal taxi ranks were listed as public transport facilities.
City buses Local buses are operational within the township. These buses are not as
formalized as the BRT system that is found in the greater City and are not easily
accessible to commuters residing in the inner sections of Hammanskraal.
The Transport Plan indicates that one informal and one formal bus station in
Hammanskraal.
Long distance buses There are long distance bus services, connecting Hammanskraal to several towns
in Limpopo such as Polokwane, Mokopane and Modimolle.
Walkability Walkability in this site is a challenge due to the narrow and poor developed NMT
infrastructure.
Pedestrians make use of the roads to walk to their desired destinations making it a
safety risk as they share the space with motor vehicles.
The terrain is flat, making it generally easy for pedestrians to walk around.
There is a bridge that spans over the Apies River however there are not any
walkways or NMT facilities connecting road pedestrians to the bridge. This is an
opportunity for the development of NMT facilities.
There is a pedestrian bridge over the R101 that is in good condition however it is
unused and poses a safety concern to pedestrians.
13.5. Integrated Public Transport Networks
The City strategies include the improvement of mobility options that involve public transport, non-
motorized transport and ride sharing.
The City has indicated that there are no plans or determined needs for the development of intermodal
facilities in the site. Plans to develop intermodal facilities will be driven largely by the stations that will
be built along proposed rail-line extension from Mabopane to Babelegi by PRASA. In its transport plans,
the City has identified the areas around the Hammanskraal railway station, the Mabopane railway
station, as well as the Kopanong railway station further towards the south in Klip-Kruisfontein as future
activity nodes.

184
Opportunity: A passenger rail service, connecting Hammanskraal to Pretoria CBD, to be developed.
There were plans to develop a formal taxi rank in Hammanskraal (New Eestersut). However, the site that
was identified for construction is now used for residential purpose. The process of updating the City’s
IPTN will determine if the taxi rank remains a priority. The process will determine whether there is a
need to formalise the informal taxi rank facilities. The City has indicated that their current most critical
plan related to taxi rank facilities is the major upgrade of existing formal facilities such as the taxi ranks
at Renbro Mall and Jubilee Mall.
Information was requested from the City regarding the incorporation of ICT infrastructure in public
transport spaces and vehicles such as mini-bus taxis and buses and it was confirmed that the roll out
wi-fi is an integral part of their intelligent transport systems and the processes are coordinated by their
ICT department. The roll out of ICT infrastructure in public transport facilities has not yet been realised.

185
Map 45: Public Transport Facilities and Routes, Hammanskraal
186
13.6. Non-Motorised Transport
The City has confirmed that there is a critical need to develop NMT linkages in the form of pedestrian
walkways, cyclist pathways and public transport laybys between Hammanskraal and Temba to enhance
mobility that will serve the Hammanskraal Activity Node, Jubilee Mall, Jubilee Hospital and Temba
Sports Complex. There are also plans to gradually extend the NMT linkage along the M20, Molefe
Makinta Drive.
Non-motorised transport is gaining popularity in South Africa and worldwide, with a number of factors
contributing, such as increased awareness of environmental issues, recognition that motorised transport
is reducing urban efficiency with increased low-density sprawl, health benefits of active lifestyles, the
ability to bypass traffic congestion, and the lower cost of cycling as transport.
Cyclists are extremely vulnerable to risks, including, the danger of cycling in traffic, risks of mugging
(particularly after dark), inability to cycle, lack of knowledge about bicycle maintenance, cultural norms
that discourage women or other groups from cycling, social norms that present cycling as a “rich
person’s sport” rather than a useful mode of transport, and so on. Therefore, rather than focusing on
trying to change behaviour, it would be best to focus on creating the conditions that give people
reasons to cycle.
It is important to recognise that the benefits of NMT extend well beyond providing a means for low-
cost travel and the other considerations mentioned above. There are other systemic benefits particularly
related to township economies:
• Local deliveries can be more cost-effective using cargo bikes or bicycles with trailers; in
many cases these are more suitable than bakkies or trucks, particularly for small
quantities .
• NMT can improve access to public transport for those not close to existing routes.
• Creating new job opportunities in transport sector with low barriers to entry: with the
right support mechanisms (financial, regulatory, legal), entrepreneurs can work
independently or collaboratively in developing and providing new forms of service for
the transport of goods and persons.
• Participating in the “sharing economy”: new forms of access to transport such as bike
share or cargo bike share can reduce the costs of transport by eliminating the need for
vehicle ownership, which can be one way to overcome the purchase cost barrier.
187
• The components of the transport system can be more diverse, distributed and small-
scale, creating greater resilience and adaptability.
• Infrastructure such as roads and other corridors can be built more cheaply where they
accommodate only lightweight NMT vehicles rather than heavier cars and trucks; such
corridors are also more efficient use of space, since a lane for bicycles can carry more
people per hour than the equivalent lane for motor vehicles.
These benefits should be considered in creating projects that incorporate NMT, and they can be
maximised by aiming to restructure townships around NMT as a medium- to long-term goal.
Opportunity: Pedestrian paths / bridge connections established to link residential areas to the CBD
and retail hubs.
13.7. NMT Precedents
These precedents focus on initiatives around South Africa that might have the potential to be replicated
in some of the TED sites. However, it must be emphasised that there may be local factors that either
support or undermine similar efforts elsewhere:
• Bicycle couriers - Soweto-based ibhoni delivery and Cloudy Deliveries in Langa (Cape Town) are
township bicycle courier companies.
• Bicycle tours - There are bicycle-based tours run in Soweto (by Book ibhoni, linked to ibhoni
Delivery), Hammanskraal, and in Masphumelele and Langa (Cape Town)
• Langa Bicycle Hub - Emerged from Langa community kitchen support, now provides a bicycle
rental service and is planning to establish a physical bike hub in Langa; also provides escorted
bike buses for commuters, for a fee. Relies on partnerships, donations and other forms of
support.
• Township bicycle sales - Khaltsha Cycles emerged as a business run by someone who previously
ran learn to cycle classes and helped organise bike buses with Open Streets Cape Town; now
sells bikes from a container in Khayelitsha, and promotes cycling with others to raise funds for
bikes for essential workers (Heroes on Bikes)
• Mobile advertising - Ads in Motion provide advertising on a trailer pulled by a bicycle.
• Restaurant food deliveries - Khaltsha Cycles works with Spinach King restaurant in Khayelitsha,
providing bicycle deliveries using bikes pulling trailers, similarly Spinach King has created a

188
supply chain in partnership with schools – schools grow food, and provide to Spinach King in
exchange for cooked food products.
• Cargo bikes - A company called Anywhere Berlin is establishing ‘micro factories’ in Gauteng
townships where electric cargo bikes are manufactured; designed for rugged township
conditions
• Pedicab services - A company called Mellowcabs has been manufacturing a three-wheeled
‘tricycle’ that originally was a pedal-powered pedicab, and later iterations are electrically
powered, with both passenger and cargo configurations. They have offered passenger services
in Stellenbosch and the V&A Waterfront, and they have partnered with DHL who provide
deliveries in central Cape Town using the cargo Mellowvans.
• Mobile bike repair and maintenance - Nomadic Mechanic is run by Khaltsha Cycles in
Khayelitsha. The Langa Bicycle Hub operates “Bike Brigades” that also provide on-call mobile
maintenance services, and who are teaching themselves. There is also a mobile mechanic in
Delft.
In addition to entrepreneurs, civil society has also been involved in support initiatives such as the
following:
• Bike buses - Open Streets Cape Town has been involved in establishing group bike rides for
commuting to the Cape Town CBD, and other loose groupings have established their own bike
buses.
• Delivery of food from community kitchens - During the pandemic lockdown in 2020, Langa CAN
(Community Action Network) organised bicycles to provide deliveries to people who were not
able to get to the community kitchens
• Walking buses - Around 2010 the Western Cape Provincial Government started walking buses
(escorted groups walking on predefined routes on an advertised schedule) in the Cape Town
CBD to make walking safer to and from Cape Town railway station. Some schools have walking
buses managed by parents.
• Cycling clubs - There is a BMX track and club (Velokhaya Life Cycling Academy) in Khayelitsha.
There is also a cycling club with a track in New Brighton.
• Bike distribution and support - Several NGOs have been working in partnership to distribute
bicycles and provide support. Bicycling Empowerment Network (BEN), Pedal Power Association
(PPA) and Qhubeka have worked together on this as well as on independent initiatives to
promote cycling. BEN has been involved in setting up township hubs for bike mechanics. PPA
does safety training.

189
• The Department of Transport, through its Shova Kalula Bicycle Project, handed over numerous
bicycles to Hammanskraal pupils who had to walk long distances to school.
It is important to ‘normalise NMT’ to encourage adoption. NMT needs to be more visible, culturally
acceptable and safe, with synergies created between projects. This should also convey the message that
NMT can be “mainstream” and worthy of consideration. Design choices reflect a value system, and when
a mode is ignored or deliberately ‘designed out’ of a space, this communicates lack of respect towards
that mode.
Bicycle deliveries are becoming the pioneer users in a number of areas, and while these would work
best with cargo bikes, they typically start with bikes with trailers because of cost, availability and
infrastructure. Deliveries also have a revenue stream, with relatively low barrier to entry. It therefore
makes sense to work with delivery services to raise visibility.
In transport sphere, it needs to be acknowledged that “culture” is not static. How we behave on public
streets is always evolving, influenced by the values embedded in the infrastructure design, by the vehicle
technologies that are present, and by the behaviour of others. This affects the travel modes we choose,
as well as our attitudes towards others who use this space. It therefore affects safety and whether users
feel they have a right to be on the streets and needs to be considered in the choice and design of
projects and strategies to create more functional streets.
A number of potential initiatives can help to concentrate activity on specific routes to improve the levels
of ‘safety in numbers’ and to increase visibility to encourage more cycling. This can also make it easier
for cities to justify budgeting for NMT infrastructure on those routes, but efforts to boost numbers
should not be seen as an alternative to infrastructure.
Opportunity: Bicycles (cycling) are extensively used as a means of low cost and efficient transport.
13.8. Universal Access
In transportation, the concept of the complete street is a design approach that requires streets to be
planned, designed and operated in a way that ensures the safety, convenience and comfort of users of
all ages and abilities regardless of their mode of transportation. A complete street is considerate of
motorists, pedestrians, cyclists and persons living with disabilities. The figure below, extracted from the

190
the National Department of Transport NMT Facility Guidelines of 2014, displays a typical example of a
cross section that accommodates all road users and it is recommended it be implemented in the non-
motorised transport and universal access improvements.
The objective of universal access design is to provide infrastructure and services that cater to the widest
range of users possible2. Streets that are not designed for universal access result in the limitation of
access to opportunities and services, imposing reliance on others to assist with movement and reduced
safety. The National Department of Transport states in their NMT Facility Guidelines sites that the lack
of NMT infrastructure is a probable cause of South Africa’s high road traffic fatality rate. The report also
states that there is an urgent need to improve safety on South African roads therefore universal access
design is a high priority and is in line with national government objectives.
A need to improve NMT and universal access design in New Brighton has been identified. The following
are some of the advantages of the implementation of NMT infrastructure:
• Improved accessibility to opportunities and services
• Increased safety of road users
• Reduced road fatalities
• Increased multi-modal travel
• Promotion of more energy-efficient and less pollutant modes of transport
• Greater integration of road users
Typical infrastructure interventions that could be put in place to improve NMT and universal access in
the township include:
2 National Department of Transport Non-Motorised Transport Facility Guidelines, 2014.
Figure 45: Typical cross section of a complete street with walkway/cycle track

191
• Formal walkways (sidewalks, off-road paths, safe crossings)
• Dedicated bicycle lanes
• Traffic calming measures (street humps/bumps/tables)
• Relevant traffic signaling and signage
• Tactile paving
• Audio traffic lights
• Dropped kerbs.
The NMT infrastructure is required to be complete and coherent, safe and easy to use, speed
appropriate, attractive and barrier free (see examples below). The National Department of Transport’s
NMT Facility Guidelines provides guidance on design considerations to achieve this objective and there
is an opportunity to achieve this goal in Hammanskraal.
Opportunity: Infrastructure developed to provide and enable universal access to public transport.
Figure 46: Typical intersection layout with universal access design

192
Figure 47: Examples of non-motorised transport and universal access infrastructure interventions

193
14. Infrastructure
14.1. Overview
Public infrastructure has an important role in Township Economic Development (TED), but each
township has specific (and hence different) infrastructure needs. It is therefore important to examine
the ways that infrastructure facilitates the transport of resources between the wider economy to
townships, and how it distributes resources to households and individuals in specific township sites.
The assessment of current ‘grey’ infrastructure requires three substantive considerations. The first
assesses current gaps or shortfalls at a community and sector level. The second identifies future
supply/demand influences that may hinder the efficient/affordable/sustainable flow of these resources.
The third proposes ways in which traditional infrastructure systems can be enhanced or adapted to build
local resilience, through for example, including more sustainable, innovative, or decentralised systems
(on-site biodigesters, rainfall harvesting, solar PVs etc.).
14.2. Digital Infrastructure
The growth of the digital economy has important business development and operational opportunities
for assisting SMMES to maintain customer relationships, internal operations, competitive edge, and
investment. While there is a current estimation of 410 000 SMEs possessing an online presence
(Department of Telecommunications & Postal Services, 2013) digital activities in townships are
hampered by connectivity challenges and Information Communication and System (ICT) barriers to
entry. Though this accessibility gap may have decreased towards more recent years, there are still many
individuals that are excluded from the utilisation of digital platforms and the digital economy.
Nationally, the Department of Telecommunications and Postal Services has had plans and ideas to boost
the digital economy including 1) Working to removing the fragmentations in the ICT sector, 2)
Improving the Department of Communications, 3) The roll-out of e-skills, 4) Finalising the ICT policy
review (finalised later in 2015). The National Development Plan’s (NDP) Medium-Term Strategic
Framework (MTSF) followed a draft digital readiness or ‘course corrections” initiative to understand the
pathways required for the digital future and 4IR (NPC, 2020). The SADA initiative is also encouraging

194
and sets out specific imperatives going beyond specific technologies to realising the pathways for digital
job creation.
In 2013 the City rolled out its first phase of free WiFi project. This service has been made available in
public spaces providing a capacity of 25 000 users spread across five locations in Soshanguve, Mamelodi
and Atteridgeville. Between 2015 and 2017, a further 1848 sites with free WiFi were deployed (including
sites within Hammanskraal) to ensure that every citizen would be within walking distance of free WiFi
(Business Tech, 2015). This service has been made available in public spaces, with many of the residents
of Tshwane making use of this free service with their digital devices. The second rollout phase of this
free WiFi project aims to create increased exponential traffic and will collaborate with Project Isizwe,
non-profit making initiative that seeks to provide free internet to Africa. Project Isizwe has managed to
assist in establishing a free internet zone in locations around Tshwane. The free internet hotspots in
Hammanskraal are under construction, although this has been delayed due to the COVID-19 pandemic
(City of Tshwane, 2018)..
The Tshwane Business Process Outsourcing (BPO) Park Project was identified as a technology hub by
the City, with facilities including a call centre. A tender was released in 2019 by National Treasury for
town planning services to design the BPO area. The City has commenced the first phase of the three-
phase development, a R70 million investment on infrastructure and services such as the construction of
two new buildings (each with a capacity to seat 500 people), fibre optic cable connection, furniture and
IT installation (IOL, 2019).
The BoP development intends to accelerate economic development for residents of the CoT by creating
3300 employment opportunities (1100 permanent jobs and 1980 temporary ones) from unlocking
industrial development once all three phases have been completed (IOL, 2019). The BPO park is
envisaged to attract an estimated R525million investment in infrastructure into the city (IOL, 2019). The
BPO park, once completed aims to extend fibre cabling to Hammanskraal to further enable the area to
become a more digital economy.
Opportunity: Through own-initiatives and partnerships with Gauteng Provincial Government, the
provision of digital infrastructure to enhance local microenterprise access to internet, digital
services and 4IR opportunities within Hammanskraal.

195
14.3. Water and Wastewater Infrastructure
Water supply has been an issue in the area, with water shortages resulting from a small amount of water
taps in the area compared to the demand for water, which resulted in the use of tankers to service
people’s needs in the area. To address this challenge of low water supply, residents started using
underground water, but this water supply was later found to be contaminated, a new challenge that
affected the health of residents.
Water tests conducted by the Council for Scientific and Industrial Research (CSIR) found that the water
in the area was unsafe for human consumption because of traces of E. coli and nitrates resulting from
sewerage outflows from the Rooiwal Wastewater Treatment Works into the Apies River, which feeds
into Leeuwkraal Dam, the main water supply to Hammanskraal (Mahlangu, 2019). Submissions of ward
priorities have identified water and sanitation as constant challenges.
Map 46 indicates the provision of water and sanitation in Hammanskraal. The maps indicate, while there
is access to water across the area, water piping only accommodates households per block, rather than
per household. These blocks can easily have 30 households sharing a tap.
14.3.1. Sewerage
Currently the only sewer infrastructure is in Kudube, Leboneng, Temba, and a section of Hammanskraal,
Mandela Village, and Klipdrift. Error! Reference source not found. depicts the current sewer provision
well, with many localities not having any sewerage infrastructure. This explains and support findings of
sewerage waste in the Apies River.
The Rooiwal plant, which treats 200 million litres of sewerage per day before it flows into the Apies River
and then the Leeukraal Dam — Hammanskraal’s water source, has experienced a number of problems,
starting in 2010. Despite having had two upgrades since then, the plant still occasionally discharges
partially treated effluent into the river (Smit, 2019).
Aging infrastructure and lack of maintenance resulted in spills of raw sewerage into the Apies River,
which feeds into Leeuwkraal Dam, the main water supply to Hammanskraal (Moatshe, 2020). The
contamination of the Apies from Rooiwal has caused the potable water provided to the Hammanskraal
community to be contaminated by e-coli and other harmful matter. The Temba Water Treatment Works,
which extracts water from Leeuwkraal Dam, provides water to Hammanskraal.

196
There is currently a R2.1 billion project to improve and expand the capacity of the Rooiwal waste water
treatment plant, with the intention to address the longstanding problem of dirty water experienced by
Hammanskraal residents (Moatshe, 2020). This project has commenced, and is anticipated to be
completed in June 2022.
14.4. Stormwater infrastructure
Stormwater infrastructure is functioning and maintained to the extent that financial and resources all
for the City of Tshwane. The key challenge for stormwater management is illegal dumping, which block
drains and exacerbates localised flooding. Key areas for interventions include litter traps and other forms
of sustainable urban drainage systems.

197
Map 46: Water, Sanitation and Stormwater Infrastructure, Hammanskraal

198
14.5. Energy Provision
The City two power plants, Rooiwal and Pretoria West. These plants are both operating below their
optimum capacity. The City announced that both plants will be refurbished to improve their power
generation capacity. Hammanskraal has one in feed substation that distributes 11kV of electricity to the
region. There have been recent cases of power outages in Hammanskraal due to regular cable theft.
Hammanskraal is served by the ESKOM power facility, and there are two electrical substations in
Hammanskraal – Temba Substation and Eskom Substation Temba. However, there have been recent
cases of power outages in Hammanskraal due to regular cable theft. The areas has frequently
experienced cuts to electricity supply at peak periods, in ESKOM’s attempt to protect infrastructure from
overloading (Nicolson, 2020). Already, households in Hammanskraal have inadequate access to
electricity, with ESKOM providing high voltage lines that households have connected into, formally or
informally. Only Temba has adequate access to electricity, with electrical cables on each road.
There is currently no streetlighting in Hammanskraal. Map 47, indicating the electricity and lighting
network, shows that the lighting in the area is primarly provided by high light masts. While high light
masts do have lighting footprints, there are significant shadowing effects, which makes it dangerous for
people to move around. Effective public lighting is necessary to create safer neighbourhoods.
There are plans to produce renewable energy, in particular at the Rooiwal site. The City is investigating
the establishment of a 40MW Solar PV generation plant with interest from the automotive industry in
Rosslyn as a primary off taker. Opportunities are emerging in the wake of metropolitan municipalities
becoming able to procure their own power.

199
Map 47: Electricity Infrastructure, Hammanskraal

200
15. Environment
15.1. Overview
Where many cities are now mainstreaming ‘green economy’ considerations to address sustainability
challenges, the view that an inclusive green economy should explicitly recognise and integrate the
informal economy is gaining traction. Some provinces are starting to mainstream green economy
strategies, circular economy thinking, and engage in informal economy upliftment planning, there has
been little crossover or integration of these into economic development discourses.
The assessment defines those involved, either as direct good/service providers or contributors along
the value chains, as ‘green entrepreneurs’, despite varying levels of activity. It is important to note that
the business intention for the activities identified may not be defined by explicit motivations related to
the green economy. However, the green economy ‘co-benefit’ (sustainability/ecologically enhancing
outcomes) of these activities should be leveraged for additional support from institutions and
programmes where the green economy is a priority.
Hammanskraal is recognised as an area that is vulnerable to Tshwane’s key climate impacts. The drive
to promote the green economy has been intensified in response to the COVID pandemic. The City
recognises the need to build food security and climate resilience.
15.2. Urban Agriculture
The Tshwane LED Strategy highlights agriculture, agro-processing, and rural development as a key pillar
in the implementation plan. Linked to this, the City has several key programmes to support urban
agriculture. Hammanskraal has been prioritised as a pilot site in a project that aims to significantly
contribute to agriculture and rural development through improved access to the internet and high-
speed fibre connections for agri-businesses (Department of Economic Development and Spatial
Planning, 2019).
The City is directly involved in several activities in Region 2 and adjacently in Region 5 which contribute
to an enabling and accessible agricultural product market locally. These include an agro-processing hub
is planned in Region 5 to promote agricultural beneficiation and local value chain development (TEDA,

201
n.d.). Agricultural development and extension services through the hub will also be offered, ranging
from crops to livestock management, and even aqua processing.
Food and Trees for Africa also runs workshops in Hammanskraal, one of 36 areas where their EduPlant
Programme is active, which provides schools with introductory permaculture techniques, methods, skills,
and knowledge on how to start and maintain school food gardens (Food & Trees for Africa, 2019). The
City has also started providing small urban farming cooperatives with input and training in an effort to
promote food gardens and combat hunger (Mahlangu, 2015).
The Department of Agriculture has contributed tools, equipment, and training towards urban agriculture
initiatives in Hammanskraal like the Food Gardening Programme, led by the Youth in Action Against
Unemployment (YAAU)3.
Hammanskraal is densely populated; there are pockets of land, especially around the Apies River and
periphery, that remain open and undeveloped and could be used for agriculture. Whilst these areas are
important ecological assets, agricultural land is increasingly experiencing encroachment from
expanding informal settlement.
Opportunity: Urban agriculture productivity enhanced.
15.3. Decentralised renewable energy (Solar PV and Biogas)
The City has recently completed a rooftop PV installation at City building and are working on expanding
the programme to other owned buildings as well as exploring biogas initiatives in Region 2 (including
Hammanskraal), 5 and 7. There is also an opportunity to develop a solar harvesting farm around the
Rooiwal area (Personal communication, Tshwane Representative, September 2020).
Opportunity: Homeowners utilise water harvesting and solar PV technologies.
3 The SLFs Hammanskraal Virtual Imbizo was used to source this.

202
Map 48: Natural Features and Open Space, Hammanskraal
203
15.4. Recycling and Waste Management
A number of City initiatives have provided support to recycling and waste management but for the
most-part, these are running at low capacity or not currently operational.
The City has put out tenders to find operators to run buy- back centres but questions remain about
optimal placement of equipment and infrastructure around the buy-back centres and whether these
can be commercially viable given the low volumes of recyclables collected from surrounding areas
(Personal communication, Tshwane Representative, September 2020).
There is also evidence of vermiculture and composting. This could be important to support urban
agriculture efforts in the area and provide local markets for farming inputs building sustainability and
success of urban farming efforts.
The recycling infrastructure in Hammanskraal provides an important opportunity to upskill recycling
entrepreneurs and revive recycling businesses, without large capital outlays for new infrastructure.
15.5. Urban Ecosystem Risks
Hammanskraal is vulnerable to water shortages due to reticulation issues. This challenge may provide
an opportunity to consider decentralised water supply options and rainwater harvesting. Heat mapping
has also indicated that droughts and hot days are like climate hazards in the future. This makes the
maintenance of Hammanskraal’s green infrastructure essential to contribute to temperature regulation
and the protection of resource-based livelihoods.
Individuals in Hammanskraal are known to have invested in water storage tanks, while the Department
of Water and Sanitation also provided 36 water tanks to nine schools in Hammanskraal – each school
benefitting from four 2 500 litre water tanks (RSA, 2020). Some storage tanks are linked to harvesting,
while others are filled with municipal water.
Opportunity: Homeowners utilise water harvesting and solar PV technologies.

204
15.6. Policy and regulatory Obstacles
The City’s Green Economy Strategy (2014) forms the foundation of its climate response and green
economy action. However, it is evident that limited resources and capacity constraints hamper
sustainable operations.

205
16. Urban conditions and management
The City have made notable investments to provide (and enhance) public facilities in Hammanskraal.
These include the Nelson Mandal statue outside the sports facility, and the sporting facilities themselves;
a pedestrian bridge across the R101; trader storage units; and street paving. The urban core is relatively
well provided with urban facilities, that include pocket parks (in Kuduge), sport stadia, municipal offices.
The residents have access to public schools, municipal halls, the provincial Jubilee Hospital and post-
tertiary training facilities (Tshwane North TVET College).
Economic development in Hammanskraal is constrained by the pattern of development. The expansion
of settlement in areas under traditional authorities presents a challenging form of urban / peri-urban
sprawl. These outlying areas are disconnected from public institutions and resources. The peri-urban
economy is spatially connected to the urban core via mini-bus system, which imposes a high cost-
burden on these households. The distance from the CBD and low density mean that these areas are
unsuited to transit-oriented-development (TOD) strategies. The spatial disconnection of residential sites
from areas of high potential economic opportunity occurs at both regional and nodal scale. In the urban
core, the spatial integration challenges include:
• The relatively far distance of the Nelson Mandela sporting facilities from the west residential
population. The precinct is peripheral to the CBD and main residential areas. If the Mandela
status is a tourist attraction, there is weak evidence of economic multipliers benefiting township
micro-enterprises.
• The absence of safe points for pedestrians to cross the R101; the pedestrian bridge is unused
for safety reasons.
• There are considerable portions of undeveloped land, including privately owned land.
• The CBD has no inherent centre or logic to its spatial ordering, with the railway line and mobility
spines presenting a barrier to integration.
• The absence of a station and passenger rail service (as a potential central point within the CBD).
The urban environment of public space is under-considerable strain. In the course of the field research,
we identified the following urban-management challenges:
• As an economic hub, the under-utilized land within the CBD, including PRASA land, restricts
growth opportunities. The Hammanskraal station precinct is a ‘hang-out’ for thieves and drug-
users and thus harbours security risk.

206
• Public dumping, especially within CBD and in green belts. In residential areas, there is a
particular dumping problem with nappies. There is extensive dumping within the dam site,
especially north of the dam wall.
• There are numerous sites at which buildings (and traders) encroachment through unauthorised
usage on sidewalks along important pedestrian / cycle routes. These encroachments will impact
on effectors to provide pedestrian access and NMT.
• The pedestrian bridge in the CBD has been inappropriately designed. As a result of security
risks, the bridge is not used by pedestrians. It has become a ‘hang-out’ for Nyaope (cannabis,
heroin and antiretrovirals combination) addicts.
• We identified several examples where businesses mis-used public resources (municipal water;
and electricity).
• Unauthorized construction of commercial properties along high streets, including the R101 and
Harry Gwala Avenue.
• Water quality is poor and the water reticulation system is inadequate. The CoT have contracted
a service provider to repair the reticulation system, but this work has not been fulfilled /
competently conducted.
• Inappropriate spatial planning of Jubilee Shopping Mall (there is insufficient pedestrian access
points; taxi routes inter-connect with private vehicles; there is inadequate accommodation for
traders inside the mall).
• Public property under the control of the NW Development Corporation, including several SME
hives.
• Destruction of property (e.g. taxi office) during political conflicts.
• Property and commercial development on land under traditional authority administration.
• Inadequate facilities for traders in CBD (including abolitions).
The Temba Dam is a recognised recreational facility. We noted that the seating on the dam wall is
damaged. The picnic area is in a poor state of maintenance, and inadequate in scale to accommodate
potential demand. The dam itself is partially covered with water hyacinth. Yet there is considerable scope
for reviving this site as a place of recreation and tourist destination. The suspension bridge, immediately
below the dam wall that spans the Apies River, offers a further ‘pull’ factor.
Opportunity: Public Employment Programmes utilised to address urban management challenges,
including the maintenance of recreational and ecosystem resources.

207
Figure 48: Urban Management Issues

208
Description of figures 1 – 6:
1. Under-utilized land within the CBD, including PRASA land (harbors security risk).
2. Public dumping, especially within CBD and in green belts. In residential areas, there is a particular dumping
problem with nappies.
3. Building (and trader) encroachment on sidewalks along important pedestrian / cycle routes.
4. Inappropriately designed bridge in CBD. As a result of security risks, the bridge is not used by pedestrians. It
has become a hang-out for Nyaope (cannabis, heroin and antiretrovirals combination) addicts.
5. Misuse of public resources (municipal water; and electricity).
6. Unauthorized construction of commercial properties along high streets.
The Hammanskraal skills developments centre, along Old Warmbath road, was built in 2006 for training
SMME’s in tour guiding, tour operation and SA hosting (Tourism division) (University of Pretoria, n.d.).
It is not properly marketed within the community. The Tshwane Dam and Apies River are identified as
future tourist attraction in Hammanskraal, but not yet developed, and the existing Mandela village
community-trading complex has not fully competed in tourism but has great potential as can be
incorporated in Dinokeng Tourism initiative (University of Pretoria, n.d.).
Opportunity: Business opportunities for township businesses within the (game park) tourism sector
enhanced.

209
17. Social and Cultural Considerations
Hammanskraal began as a settlement when a group of people known as AmaNdebele-a-Moletlane
settled in the area in the late 19th century. The colonial government establish a ‘Native Commissioners
Office’ in 1904. The community purchased two farms in 1911 and 1922. According to title deed records,
a farm called Hammanskraal 112 JR was bought by Frederick Christoffel Eloff, who then sold it to TW
Beckett and Co. TW Beckett and Co. then sold the property on to SB Rens in 1927. The subsequent
division of these farms enabled titled deeds to be issued (Godsell, 2015: 47).
Hammanskraal was included in the so-called Bophuthatswana ‘bantustan’, which was established in
1972, it was was subsequently granted ‘independence’ in 1977 and reintegrated into the Republic of
South Africa in 1994 (Godsell, 2015). The Babelegi Industrial area was the first attempt that the
government made at industrial decentralization in a ‘bantustan’. At its height, Babelegi was an important
source of employment. With the transition in the governmental structures post-1994 and the
emergence of competing industrial nodes such as Rosslyn, Babelegi has fallen into decline (Godsell,
2015).
With the oldest portions of the site dating to the 1940s, the urban core has a diversely supplied with
social and community infrastructure, including places of worship. Outside the urban core, especially in
areas under traditional land administration, settlements have fewer social and community amenities in
contrast. The settlements are largely unplanned with untarred roads.
There is notable wealth stratification in the greater Hammanskraal area, as evident in the contrast
between the upper-middle income & middle-income suburbs, on the one hand, and the settlements of
per-urban poor, as well as resident in informal settlements, on the other hand. There is a substantial
middle income / upper middle-income population in the study site. In Ward 75, which covers much of
the urban core, the 2011 Census reported that 73% of household owned the house and that 51% of
households had access to the internet.
Homeowners in middle-income strata have made considerable investment into their properties,
renovating, expanding the original building and investing in place-making. Properties in these well-
established neighbourhoods cost upwards of R650,000. We identified new gated-estate property
developments (Stellenbosch) and flat rentals targeting middle income earners. The site contains a
diverse range of business services (professionals, food, car washes etc.), retail offerings, and social &

210
community facilities that underpin the middle-income investment into the township and secures their
retention. But there are threats to the sustainability of these strata and neighbourhoods. These threats
include under-performing educational facilities; service delivery failure (water, in particular); mobility
constraints including traffic jams; and the high-level dependence on employment within the state sector
and limited private sector alternatives.
The social tension between the middle-income and poorer strata is partially reflected in the outcome of
the municipal election in Ward 75. In 2016, the ANC received 65% of the vote (down from 78% in 2011),
whilst both the EFF and the DA polled 16%.
The site includes both municipal and traditional authority administered land. These areas are rapidly
expanding, accommodating both middle-income (car owning) and the poor. For those with private
transport, property development in these areas presents the investor with a number of benefits: i)
affordable and large size plots, ii) no rates, iii) customary rights, such as the right to burial. Some of
these neighbourhoods have access to water and electricity and are, in comparative terms, functional in
the sense of having a clear organising logic and standards. We heard anecdotal evidence that some
traditional authorities stipulate the requirement that buildings should be (informal) planned, meaning
that the plans should be generally compliant the municipal regulations. Yet these investments do not
contribute to municipal revenue. Furthermore, the land under traditional authorities includes portions
of high potential land along mobility and activity corridors which ought to fall within a common
municipal land jurisdiction.
In contrast to dense urban settlements, crime is of modest scale. In 2018/2019, the following crimes
were noted within the Hammanskraal Police Station area: 14 murders; 62 sexual offences; 15 attempted
murders; 483 cases of assault; 346 cases of robbery; and 330 cases of burglary. Robbery and burglary
that target businesses, whilst relatively modest sub-component of these figures, presents a risk to
entrepreneurial investment and the business ecosystem.
17.1. Urban Everyday
Covid-19 has been an important news item in this area, as it has had an impact on peoples’ daily lives.
Some issues that have been reported on include vandalism to schools in Gauteng, which extended to
Hammanskraal. During the initial stages of lockdown, a large group of people gathered, but were
dispersed and some were arrested for contravening lockdown regulations. Other noteworthy stories

211
around Covid-19 has related to the fact that Non-Profit Organisations rallied or were started to provide
people who were rendered vulnerable by the lockdown some support in the form of food parcels. The
lockdown has made accessing retail opportunities more difficult for elderly and vulnerable persons who
were required to queue to go shopping.
Some people have responded to the lockdown entrepreneurially - one report covered a story of a
woman who started making masks and another of a e-hailing taxi driver who created a shield to be
placed between him and passengers with the help of a family member who had tailoring skills.
There has been extensive reporting about water issues that residents of Hammanskraal have
experienced. The water quality in Hammanskraal has been reported as being incredibly poor. Some
residents have developed illnesses, such as intestinal infections as a result of drinking the tap water in
Hammanskraal. The result has been that Manyone residents have needed to buy their own bottled
water, an expense that many households feel is unfairly carried by the individuals. This issue has resulted
in some community members organising into a Residents Association in order to organise around this
issue. Reports indicated that water was being driven into the area in tanks by the City.
Various reports have indicated that sport has a role to play in this community. We found Facebook
Groups for a Netball Association and a Tennis Club in Hammanskraal. A fun run for climate change was
well-supported and there are reports that there is a roller-skating rink in this area, which has hosted
international events. The SAPS even hosted a soccer fun-day with women from this area for Women’s
Day in 2019.
Zakes Bantwini conducted a search for musical talent in February 2020, as part of an initiative started
by the NGO Khulisa Social Solutions. The talent search was intended to take place nation-wide, with
Hammanskraal as the first place to start from. The intention for the talent search was to assist artists
with skills development, in order to facilitate a platform for artists. 40 aspiring musicians from
Hammanskraal attended.
Some reports have indicated issues around maintenance of schools. Two noteworthy reports include a
small boy who died on school grounds when a soccer goal post fell on him. Another incident that was
reported on related to a classroom ceiling that collapsed while a group of learners were inside the
building, injuring twenty pupils.

212
There have also been reports of illegal firearms, that were found buried on someone’s property, as well
as arms that were stolen from the South African National Defence Force in this area.
There is a cycling club – the Hammanskraal Cycling Club – which has a social media presence. It has
promoted the use of bicycles as a form of transport, means of exercise, as well as for the development
of young and aspiring cyclists.

213
18. Potential Project Opportunities
Based on the extensive fieldwork evidence and consultation with City specialists, the TAT has identified
a range of potential project interventions. These have been considered in view of the socio-economic,
institutional and spatial situation. In highlighting the below opportunities, the TAT has been guided by
the following variables:
I. Alignment with City / Metro programmes and development priorities,
II. The availability of funding within City / Metro budgets,
III. The identification of project implementing lead departments and units within the City / Metro,
IV. The potential for accessing external funding and partnerships,
V. The role of the TAT in providing technical assistance and adding value to project
implementation,
VI. The potential for projects to have strong economic multipliers and result in a catalytic impact
on development,
VII. The potential for projects to leverage productivity enhancement,
VIII. The potential for projects to strengthen social cohesion and enhance community well-being,
including considerations of safety and security,
IX. The potential of project to contribute towards environmental sustainability and reduce the risks
from climate change,
X. The reach of projects and targeting of specific beneficiaries, including women, youth, informal
micro-enterprises and established SMEs,
XI. The timeframe for project implementation, recognising the need for immediate, short-term and
medium-term projects with varying levels of complexity,
XII. And the potential for projects to be replicable in other township localities.
The scope of potential projects is wide; the proposed opportunities allow for discussion of the merits or
otherwise of each intervention before final selection.

214
Figure 49: Potential Spatial Development Opportunities

215
The identified opportunities have been categorised within 7 headings: A) Policy and Strategy; B)
Enterprise Development; C) Nodal Development; D) Spatial Integration; E) Housing and Property; F)
Social and Community Infrastructure and G) Urban Management. The range of identified opportunities
within these categories are:
Table 12: Project Opportunities in Hammanskraal
18.1. Policy and Strategy
Opportunity Notes
Shopping malls foster and enable
opportunities for micro-enterprises.
The City to engage shopping mall owners to agree on
strategies to integrate micro-enterprises into their business
precincts, through adherence to development planning
agreements and proactive measures.
Industrial hives sustainably managed to
support small and micro-enterprises,
including micro-manufacturing.
The City to secure ownership of the existing business hives
(currently under the North West Development Corporation)
and to institute a management plan to ensure the
sustainability and appropriate use of the facilities.
Revenue collection from rates improved. The City to develop and implement a strategy to improve
rates revenue from commercial businesses, including home-
based enterprises and businesses operating in retail nodes.
Un-utilised land in the urban core unlocked
for development.
The City to develop a strategy and partnerships to unlock
under-utilised land within the urban core for development,
including affordable housing.
Commercial high streets activated in strategic
sites / road corridors.
The City to foster the growth of commercial high streets,
through incentives, land use planning and supporting
infrastructure (lighting, off-street parking, paving).
The TED situational analysis evidence utilised
in area-based strategic plans.
The City to incorporate the evidence from the TED situation
analysis into strategic plans, including the IDP, SDF, and BEPP.
18.2. Enterprise Development
Opportunity Notes
Business opportunities for township
businesses within the (game park) tourism
sector enhanced.
The City to identify potential tourism products, services, and
market opportunities for township businesses, including
tours, artisanal crafts, and leisure venues.

216
Micro-enterprises have improved access to
business development support services.
The City to integrate the DSBD district ecosystem facilitation
approach within its enterprise development programmes,
using a pilot initiative create a demand-driven approach to
ecosystem facilitation & BDS service provision.
Micro-enterprises have improved access to
digital services to participate in the digital
economy & 4IR technologies.
The City to facilitate collaboration and partnerships, including
Gauteng Prov. Gov., to improve digital access in
Hammanskraal, through (inter alia) digital hubs, free wi-fi, and
linkages to marketing platforms.
Opportunities unlocked in the creative and
leisure economies provide youth a pathway to
transition into jobs and livelihoods.
The City to conceptualise a strategy to promote creative
activities focusing on youth interest, including hobbies, via
social enterprises and community-based programmes, use of
City facilities, the staging of events, linkages to BDS services.
Mechanics / panel beaters in the after-sales
automotive sector have access to business
development support services to grow and
professionalise.
The City to facilitate and support partnership with private
sector companies, the Gauteng Prov. Gov. and the DSBD's
TREP to provide equipment / skills training / supply
agreements / finance to township entrepreneurs.
An annual trade marketing event held in
Hammanskraal to link the community to retail
business opportunities.
The City to conceptualise and support a trade promotion
event in Hammanskraal to stimulate opportunities for direct
marketing, supplier agreements and digital services. The
event will aim to connect home-based traders & producers to
companies / markets.
Businesses providing personal care services
(hair care) have access to business
development support services to grow and
professionalise.
The City to facilitate partnerships with the DSBD's TREP
Programmes, the private sector and community-based
organisations to support personal care businesses (including
hairdressers and barber shops) with skills training, supplies
and marketing.
Urban agriculture productivity enhanced. The City to support localised agro-processing with technical
support and linkages to City initiatives (Rethabiseng food and
energy centre, Tshwane Agro-processing Hub, City of
Tshwane Fresh Produce Market).
Businesses have greater financial literacy and
have access to services and technologies,
including digital platforms
The City to facilitate partnerships, including Gauteng Prov.
Gov. and Finmark Trust, to extend financial literacy training
and improve access to services and technologies.
Street signage / public advertising extensively
utilised to promote local businesses.
The City to develop and implement a project (with
partnerships) to provide street signage / advertising boards
to promote local enterprises.
BDS support for businesses in the micro-
manufacturing and artisanal sector
Alongside the opportunity to reformulate the policy and
investment environment to regularize urban residential
densification, there is scope for City support towards the
various artisans manufacturing furniture, fitted kitchens and
other household items to support this activity.

217
18.3. Nodal Development
Opportunity Notes
A development strategy for Temba City
precinct approved.
The City to develop a strategy and implementation plan to
stimulate investment in the Temba City precinct, synergising
with property developers and micro-enterprises.
The Temba City shopping mall revitalised The City to engage the mall owners (Public Investment
Corporation; Mowana Properties) to conceptualise a strategy
to revive the mall, aiming to accommodate local micro-
enterprises and social enterprises.
Temba Square precinct transformed into a
hub in support of social and economic
opportunities.
The City to develop and implement a plan to enhance the
social and entrepreneurial opportunities in Temba square and
surrounding properties, focusing on upgrading park facilities,
lighting, off-street parking, and paving and utilising crime
prevention through environmental design tools.
Public facilities serving transport and informal
trading in the CBD enhanced.
The City to implement a precinct management plan and
identify strategic projects to enhance facilities, including
waste management, ablutions, and taxi operations.
18.4. Spatial Integration
Opportunity Notes
Bicycles (cycling) are extensively used as a
means of low cost and efficient transport.
The City to promote cycling within the Hammanskraal area,
through improving safety, fostering partnerships, and
enhancing accessibility via an expanded network of NMT /
cycle lanes.
A passenger rail service, connecting
Hammanskraal to Pretoria CBD, to be
developed.
The City to engage PRASA, Provincial and National
government on the development of the passenger rail service
and provide strategic advice on the role of the station
precinct within the CBD.
Pedestrian paths / bridge connections
established to link residential areas to the
CBD and retail hubs.
The City to expand a network of pedestrian lanes and NMT
lanes, prioritising the connection between the CBD and
Temba.
Infrastructure developed to provide and
enable universal access to public transport.
The City to embrace and implement designs for universal
access in public transport hubs to ensure that people living
with disabilities / mobility requirements have access to public
transport infrastructure.
A secure pedestrian route created over the
R101 within the Hammanskraal CBD.
The City to commission research / planning to identify
options to re-design and re-develop the pedestrian bridge,
addressing safety concerns and facilitating usage.

218
18.5. Housing and Property
Opportunity Notes
Homeowners utilise water harvesting and
solar PV technologies.
The City to strategize incentives to encourage homeowners
invest in water harvesting and energy generation (solar),
providing technical support through partnerships.
Encourage housing investments by the public
and private sectors in strategic sites to raise
population densities, encourage mixed land
uses and stimulate additional economic
activity.
The City will introduce procedures to fast-track higher density
housing investments, including PPPs, in strategic sites,
including within the CBD and Temba node.
Informal land use formalised on high-streets
and villages.
The City to develop an approach (land use model) with the
support of National Government to formalise unauthorised
developments on land outside formal townships, focusing on
commercial use along high streets and villages within the
urban core.
18.6. Social and Community Infrastructure
Opportunity Notes
Temba beach revitalised as a leisure /
recreation destination.
The City to develop a strategy for reviving Temba beach as a
leisure / recreation destination and define project
components.
18.7. Urban Management
Opportunity Notes
Public Employment Programmes utilised to
address urban management challenges,
including the maintenance of recreational and
ecosystem resources.
The City to develop a strategy to re-purpose PEP to address
urban management challenges, including dumping with the
river system and CBD, through identifying partnerships and
new approaches.

219
19. Next Steps
In the Second Phase of the TED Project, the TAT will support the CoT to conduct an evaluation of the
merits of the identified opportunities. This process will require high-level transversal engagement with
all affected line departments and units. An evaluation matrix tool will be utilised to record the outcome
of this engagement process. The results of the evaluation will guide the project steering team to re-
assess the identified opportunities to be incorporated in the TAT supported township economy
development strategy for Hammanskraal.
The section of the 8 projects will be determined in consideration of the following criteria AND weighting
(minimum number of projects) to ensure that the range of project interventions address economic,
socio-spatial and institutional change necessary for transformative development. The TAT will provide
a high-level indication of the ‘value-add’ from technical assistance in respect to the selected projects in
support of the need for a range of project interventions across the categories indicated above.
Table 13: Criteria for project selection
Criteria
Min
imu
m
# o
f
Pro
jects
aligns with identified City programme and project priorities. 4
can be funded by the City. 4
has an identified lead department / unit for implementation. 4
can unlock new partnerships via the CSP and non-state actors. 2
will benefit from CSP technical assistance. 4
can enhance productivity and stimulate economic multipliers. 4
will benefit emerging entrepreneurs and marginalised groups. 4
will enhance social cohesion, improve safety, and contribute to environmental sustainability. 1
will strengthen spatial integration. 1
will enhance the availability of decent housing and accommodation. 2

220
will enable immediate wins (within a 24-month timeframe). 4
will improve the township business environment and ecosystem services. 2
is replicable in other townships. 4
The TAT support may include:
• Partnership facilitation,
• Strategic and policy advice,
• Project conceptualisation and design,
• Business case development,
• Research support and knowledge sharing,
• Project monitoring & evaluation and impact assessment,
• Project submission within City and NT budgeting process,
• Project spatial and architectural design,
• Quick-win implementation,
• Support in the preparation of calls for proposals or tenders.
At the conclusion of the assessment process, and agreement on the ranking and weighting of the
identified opportunities, the TAT will then support the CoT advance 8 projects within the framework of
an overarching township development strategy.
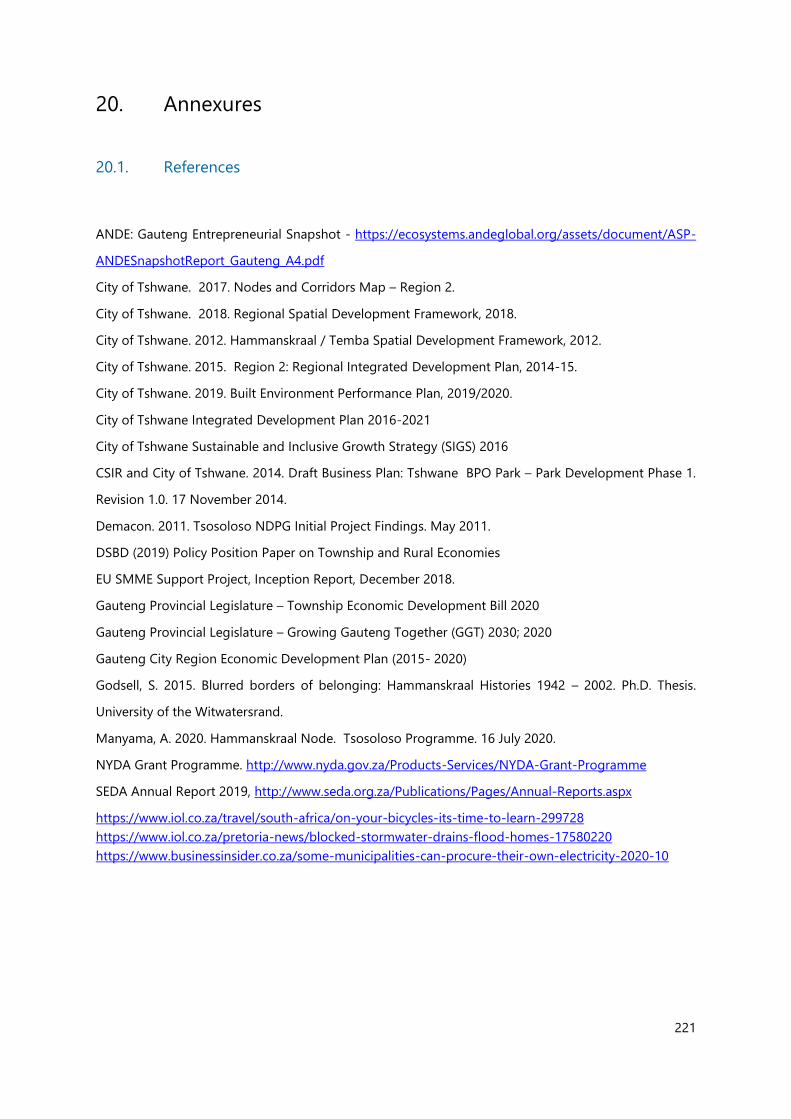
221
20. Annexures
20.1. References
ANDE: Gauteng Entrepreneurial Snapshot - https://ecosystems.andeglobal.org/assets/document/ASP-
ANDESnapshotReport_Gauteng_A4.pdf
City of Tshwane. 2017. Nodes and Corridors Map – Region 2.
City of Tshwane. 2018. Regional Spatial Development Framework, 2018.
City of Tshwane. 2012. Hammanskraal / Temba Spatial Development Framework, 2012.
City of Tshwane. 2015. Region 2: Regional Integrated Development Plan, 2014-15.
City of Tshwane. 2019. Built Environment Performance Plan, 2019/2020.
City of Tshwane Integrated Development Plan 2016-2021
City of Tshwane Sustainable and Inclusive Growth Strategy (SIGS) 2016
CSIR and City of Tshwane. 2014. Draft Business Plan: Tshwane BPO Park – Park Development Phase 1.
Revision 1.0. 17 November 2014.
Demacon. 2011. Tsosoloso NDPG Initial Project Findings. May 2011.
DSBD (2019) Policy Position Paper on Township and Rural Economies
EU SMME Support Project, Inception Report, December 2018.
Gauteng Provincial Legislature – Township Economic Development Bill 2020
Gauteng Provincial Legislature – Growing Gauteng Together (GGT) 2030; 2020
Gauteng City Region Economic Development Plan (2015- 2020)
Godsell, S. 2015. Blurred borders of belonging: Hammanskraal Histories 1942 – 2002. Ph.D. Thesis.
University of the Witwatersrand.
Manyama, A. 2020. Hammanskraal Node. Tsosoloso Programme. 16 July 2020.
NYDA Grant Programme. http://www.nyda.gov.za/Products-Services/NYDA-Grant-Programme
SEDA Annual Report 2019, http://www.seda.org.za/Publications/Pages/Annual-Reports.aspx
https://www.iol.co.za/travel/south-africa/on-your-bicycles-its-time-to-learn-299728
https://www.iol.co.za/pretoria-news/blocked-stormwater-drains-flood-homes-17580220
https://www.businessinsider.co.za/some-municipalities-can-procure-their-own-electricity-2020-10

222
20.2. Persons Consulted
Surname Name Unit / Department
Babamia Mehboob CoT
Brand Evan CoT, City Sustainability
Dyi Lolita CoT
Etsebeth Chris CoT, Roads and Transport
Hilder Tommy CoT
Hlatshwayo Sabelo CoT
Hoosain Ahmed CoT
Lambert Frank CoT
Loykisoonlal Devenand CoT, Business Compliance & Regulation
Mabitsi Rashela CoT
Madumo Dennis CoT, Spatial Planning
Maine Ntiski CoT, Urban Agriculture
Maharaj Kosheek AIDC Stakeholder Relations Manager
Mahlangu Sunday CoT, SMME Development & Support
Malungane Remmy AIDC
Manasoe Benjamin CoT, Executive Director Economic Development
Manyama Andy CoT, City Strategy and Organisational Performance
Masombuka Levy Hammanskraal Business Forum
Matlala Sepele Senior Specialist: Automotive, Economic
Development and Spatial Planning
Melly Terence CoT
Mbangxa Sisa African Panelbeaers and Motor Mechanics
Association
Mbhokodo Ismael CoT
Moabi Marcia CoT, Economic Development
223
Modiselle Kedibone CoT
Mosidi Sibusiso CoT
Motsepe Busisiwe CoT, Regional Director: Region 2
Moraba Evelyn CoT
Mphaga Sello CoT, City Sustainability
Neshehe Fhelani CoT
Newton Lutske CoT, Adaptation and Resilience
Ninham Eugenie NT, NDPP
Oelofse Tinus CoT, Electricity Department
Pheela Zashe CoT, Spatial Planning
Thale Gordon CoT, Metro Planning
Van der Merwe Ewoud CoT, Public Works and Infrastructure Development
Viljoen Hendrina CoT, Creative Industries and Policy Development

224
20.3. Business Development Services
Name of Organisation Services Provided National/Provincial/L
ocal
NATIONAL
Dept. of Small Business Development
-
- Debt Relief Fund
- Business Growth /Resilience Fund
- Township & Rural Entrepreneurship Programme (TREP)
* Autobody Repairers & Mechanics
* Bakeries & Confectioneries
* Butcheries support
* Shisanyamas & Cooked Food support
Dept. of Science & Innovation
* Mmamose Seloane – Director
Technology Localisation Unit
- Technology Stations programme)
https://www.tia.org.za/blog/20202/06/15tia-partners-with-black-vc-partner-wz-capital
Department of Trade, Industries &
Competition – dtic
www.thedtic.gov.za > incentives >
black-industrialists-scheme
- Black Industrialists Programme
(seeks to increase the level of participation of black South Africans in ownership & control of productive
enterprises in key sectors & value chains)
- SMEs & township & rural
- SEZ & Industrial Parks
Small Enterprise Development
Agency- SEDA
http://www.seda.org/MYBUSINESS/ST
P/Pages/Incubation.aspx
Various including:
- Supplier Development Programme
- Hubs & Incubators (Seda Technology Programme)
- Fem_In-Tech Development Programme:https://youtube.be/_-M1Oxgdn4
- COVID-19 One-Stop Information Portal
- www.seda.org.za
- https://pmg.org.za/cpmmittee-meeting/305221/ &30616/ & 30665/

225
Little Fish – www.itweb
https://www.itweb.co.za/content/Rg
eVDqPYGegvKJN3
Platform for 600 SMMEs two-way communication consumes & businesses, geo-location services
connecting consumers to SMMEs in their vicinity & in-app stock orders. Also provides access to
finance through its alternative credit scoring
PILLAR 5 GROUP
Address: Baruch Regent House (3rd
Floor), Cnr Voortrekker &, Durban Rd,
Bellville, 7530
Phone: 074 932 4911
Business development service
The PILLAR 5 GROUP is a leading Business Development Group with a strong focus on entrepreneurial
support. Our aim is to deliver superior strategic content and provide brand support to aspiring entrepreneurs
and young innovators seeking to expand into international markets and rise to the top echelons of their
respective industries.
Fetola
www.fetola.co.za
https://fetola.co.za/mentor-hotline/
Tailor-made enterprise & supplier development programmes
- Mentorship
- Business Incubation
- Reputation & brand building
- Youth, Women & People with disabilities enterprises
- Green/Sustainable sector, food security, & farming, local manufacturing & technology
- National
- Cape Town
The Awethu Project
www.awethuprojects.co.za
The Awethu Project Launch Pad Incubator aims to grow businesses focusing on micro businesses throughout
South Africa
National
Red Bull Amaphiko Academy
www.redbull.com
- A launch pad for start-up social entrepreneurs
- 10 day of connection & collaboration with leading innovators, entrepreneurs & storytellers
- South African Furniture Industry – SAFI
- District Development Model – https://www.cogta.gov.za/ddm/
SEDA Automotive Technology Centre
http://www.satec.co.za/
National Youth Development Agency
– NYDA
http://www.nyda.gov.za/
Youth Development Agency
- Various youth-focused services both financial and non-financial
- Youth Micro Enterprise Relief Fund (YMERF)
National and Provincial

226
- One-on-one mentor who will assist you to develop business, personal & strategic development plans that
will take 18 months
BizQube
www.abbc.co.za/index.php/incubator
- Offers accredited business training
- Customised mentoring
- Enterprise supplier development opportunities in food, beverage, cosmetic & pharmaceutical
manufacturing
Smorgasbord
https://smorgasbord.co.za/
An organisation dedicated to supporting & incubating food start-ups
(food & beverage related)
Focus on building & sustaining food & beverage sector in South Africa
- Invest in & create market opportunities for early stage food od business
Raizcorp
htttps://raizcorp.com
Works with entrepreneurs at stages of their life cycle
- Incubation services
Business acceleration for entrepreneurs
- Execute enterprise & Supplier development on behalf of corporates
The Thomson Reuters Labs
https://innovation.thomsonreuters.com/
labs/labs/incubator.html
The incubator is a 6 - 12 month programme
Diverse group of mentors
Free office space
Access to data & tools
Customers Networks Investor circle
Focussing on:
RegTech
LegalTech
Taxtech
Newstech amongst other things provides affordable business opportunities & workshop to empower
entrepreneurs
Practical workshops including manufacturing
Cape Town
The Furniture Technology Centre Trust –
Furntech
Support to existing & start-up businesses providing incubation to entrepreneurs with skills in the furniture
manufacturing industry
Cape Town
Johannesburg

227
furntech.org.za
French Tech
capetown.lafrenchtech.com
A global incubator that aims to connect entrepreneurs from France & South Africa & also find funding for
these start-ups in Africa
Private Sector
SAB Foundation Tholoane Enterprise
Programme –
www.sabfoundation.co.za/tholoana-
enterprise-programme
Kick-Start
SABInbev
R157 million invested in supporting 473 entrepreneurs
Youth Enterprise Programme
Women Owned Taverns Programme
SAB Tholoana First
Floor, Block C Plum
Park 25 Gabriel Road
Plumstead, Cape Town
Kuba Online ecosystem for small business development. Job Booster programme aimed at accelerating job
creation through supporting & empowering micro-enterprises (https://www.iol.co.za/business-
report/careers/50-entrepreneurs-set-to-benefit-from-job-booster-programme-8e4e6fc9-0e32-4b9e-9f3e-
2e08b01abc63
Cape Town based with
a national footprint
Kandua An online market place which focuses on providing home services with 10 000 vetted SMME and
independent individuals in 100 service categories. https://ventureburn.com/2020/09/sa-tech-startup-
partners-with-french=development-agency
Johannesburg base
with a national
footprint
Transnet Hub
http://www.transnet.net/BusinessWith/P
ages/Enterprise Development-HUB.aspx
- This is an enterprise development hub
- Aimed at expanding business opportunities for smaller enterprises & new business entrants
National
SA Business Hub
http://www.sabusinesshub.co.za/
- A website based hub that offers affordable & on demand business training, knowledge and information,
coaching, an online marketplace for goods & services
Pick “n Pay Small Business – Enterprise
Foundation
- Financial & non-financial support for enterprises
_ Committed to enterprises currently receiving their support
- Opportunities for new BEE suppliers
National

228
http://www.picknpay.co.za/foundation-
our-projects/small-business-incubation
Shanduka Black Umbrellas
www.shandukablackumbrellas.org./
Emerging businesses support
infrastructure
mentorship and collaboration to assist their transition from incubation to viable independent businesses
office space & facilities
business software & database of business tools
bookkeeping
drivers and vehicles
National