short-term energy outlook december 2002 - u.s. … · · 2011-10-17energy information...
TRANSCRIPT
Energy Information Administration/Short-Term Energy Outlook -- December 2002 1
Short-Term Energy Outlook December 2002 Overview
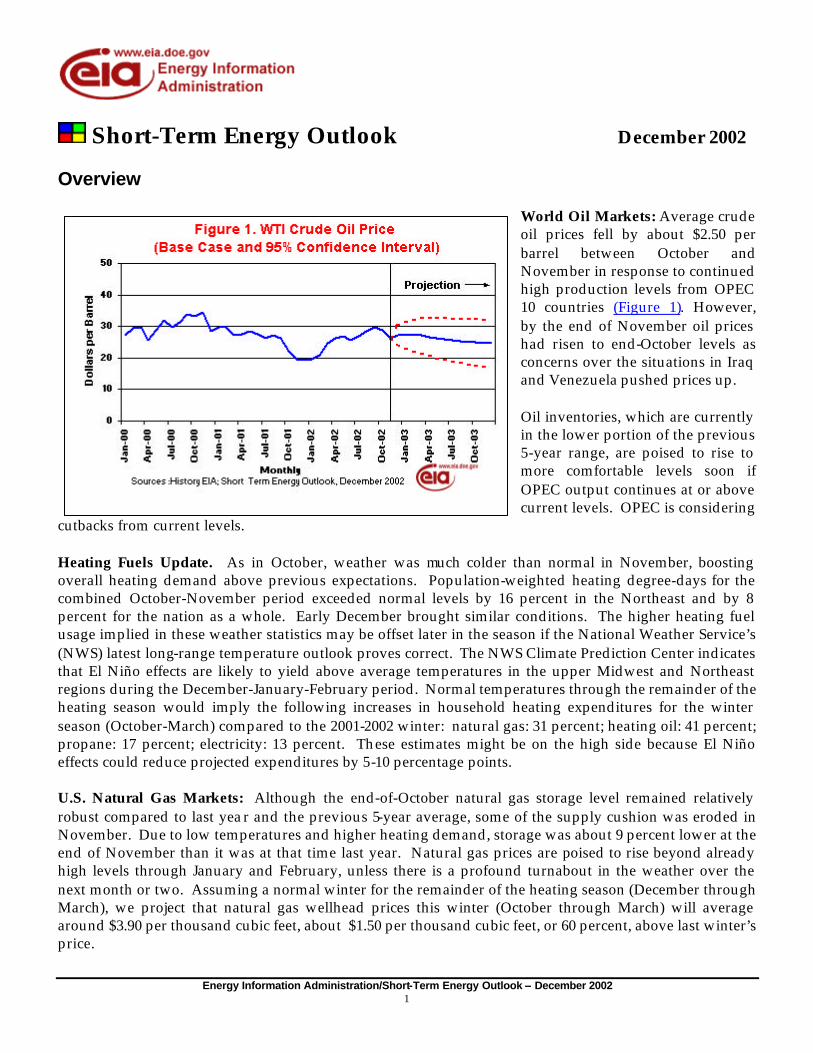
World Oil Markets: Average crude oil prices fell by about $2.50 per barrel between October and November in response to continued high production levels from OPEC 10 countries (Figure 1). However, by the end of November oil prices had risen to end-October levels as concerns over the situations in Iraq and Venezuela pushed prices up. Oil inventories, which are currently in the lower portion of the previous 5-year range, are poised to rise to more comfortable levels soon if OPEC output continues at or above current levels. OPEC is considering
cutbacks from current levels. Heating Fuels Update. As in October, weather was much colder than normal in November, boosting overall heating demand above previous expectations. Population-weighted heating degree-days for the combined October-November period exceeded normal levels by 16 percent in the Northeast and by 8 percent for the nation as a whole. Early December brought similar conditions. The higher heating fuel usage implied in these weather statistics may be offset later in the season if the National Weather Service’s (NWS) latest long-range temperature outlook proves correct. The NWS Climate Prediction Center indicates that El Niño effects are likely to yield above average temperatures in the upper Midwest and Northeast regions during the December-January-February period. Normal temperatures through the remainder of the heating season would imply the following increases in household heating expenditures for the winter season (October-March) compared to the 2001-2002 winter: natural gas: 31 percent; heating oil: 41 percent; propane: 17 percent; electricity: 13 percent. These estimates might be on the high side because El Niño effects could reduce projected expenditures by 5-10 percentage points. U.S. Natural Gas Markets: Although the end-of-October natural gas storage level remained relatively robust compared to last year and the previous 5-year average, some of the supply cushion was eroded in November. Due to low temperatures and higher heating demand, storage was about 9 percent lower at the end of November than it was at that time last year. Natural gas prices are poised to rise beyond already high levels through January and February, unless there is a profound turnabout in the weather over the next month or two. Assuming a normal winter for the remainder of the heating season (December through March), we project that natural gas wellhead prices this winter (October through March) will average around $3.90 per thousand cubic feet, about $1.50 per thousand cubic feet, or 60 percent, above last winter’s price.
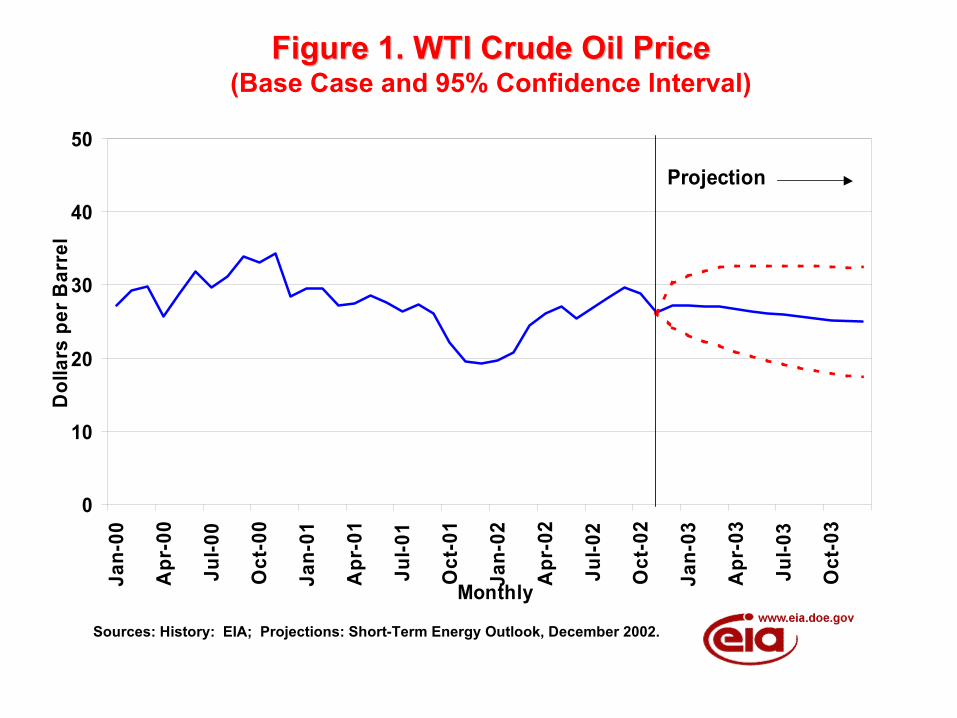
Figure 1. WTI Crude Oil PriceFigure 1. WTI Crude Oil Price(Base Case and 95% Confidence Interval)
Sources: History: EIA; Projections: Short-Term Energy Outlook, December 2002.
0
10
20
30
40
50Ja
n-00
Apr
-00
Jul-0
0
Oct
-00
Jan-
01
Apr
-01
Jul-0
1
Oct
-01
Jan-
02
Apr
-02
Jul-0
2
Oct
-02
Jan-
03
Apr
-03
Jul-0
3
Oct
-03
Monthly
Dol
lars
per
Bar
rel
Projection
Energy Information Administration/Short-Term Energy Outlook -- December 2002 2
Data Notes. Beginning with this issue of the Outlook, electricity generation and related fuel consumption totals will be presented on a basis consistent with the definitions and aggregates used in the 2001 edition of EIA’s Annual Energy Review. The natural gas demand and balancing item totals are likely to show the greatest change. See “Interim Data Changes in the Short-Term Energy Outlook Data System Related to Electric Power Sector and Natural Gas Market Data Revisions” for details. International Oil Markets Crude Oil Prices. Average crude oil prices fell in November, as the Brent, OPEC Basket, and West Texas Intermediate (WTI) crude oil spot prices averaged $2.50 per barrel lower in November than in October, principally because of continued high production levels from OPEC 10 countries (Figure 1). However, by the end of November oil prices had risen to end-October levels as concerns over the situations in Iraq and Venezuela pushed prices higher. The OPEC basket price has remained above $22 per barrel since March 8, and the October average of $27.60 per barrel marked the eighth consecutive month that the average monthly OPEC basket price remained within OPEC’s original target range of $22 - $28 per barrel. The monthly average OPEC basket price is projected to average within this target range throughout the forecast period. International Oil Supply and Demand. November OPEC 10 production is estimated to have been 2.7 million barrels per day above quota levels, about the same as revised estimates for October production. Iraqi production fell in November, as UN-sanctioned oil exports averaged over 200,000 barrels per day below October levels. The Outlook assumes that Iraqi production will continue to fluctuate around the October average level of 2.4 million barrels per day. OPEC 10 production above quota levels has risen faster than projected over the past 3-4 months, with the largest increases occurring in September. At these higher production levels, market fundamentals will reduce upward pressures on prices. OECD inventory levels, which approached 5-year lows in September, should begin rising over the next few months as additional supplies reach their markets, and return to the middle of their observed range sometime next year (Figure 2). As a result, world crude oil prices are believed to have peaked on the basis
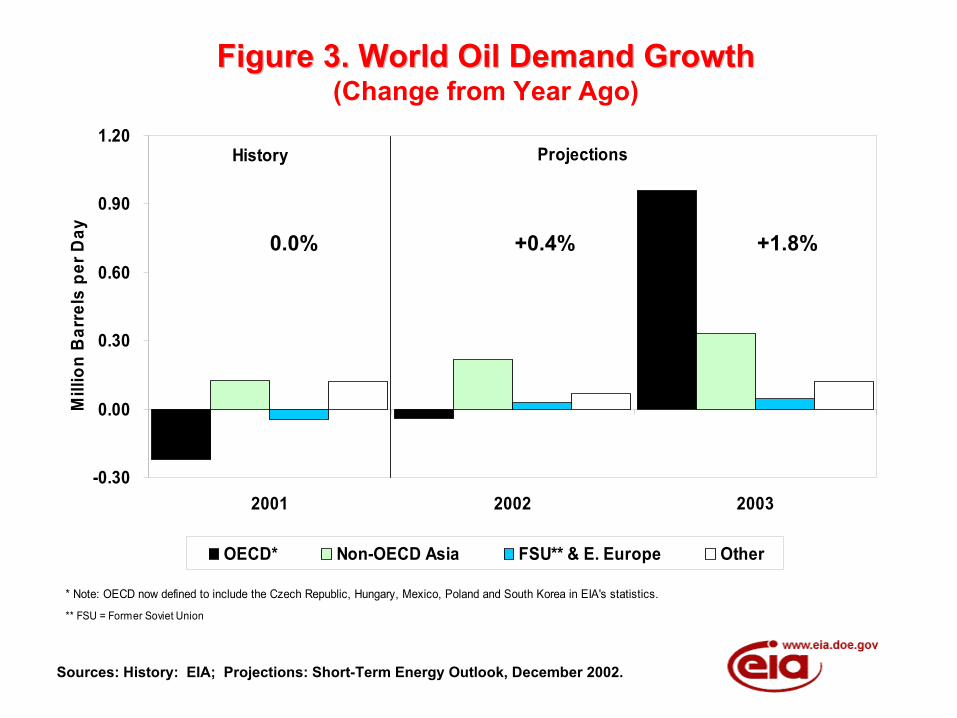
of market fundamentals (this excludes price effects from the situations in Iraq and Venezuela, which are unpredictable). The limiting factors for OPEC 10 production growth in 2003 will continue to be the situations in Iraq and Venezuela, and whether world oil demand will recover as expected (Figure 3). The U.S. economy is projected to grow by over 3 percent annually in 2003, and lead to the recovery in U.S. oil demand. The U.S. is expected to provide over half of the 1.4 million barrels per day growth in world oil demand in 2003, with China and other non-OECD countries projected to provide a total of another 0.5 million barrels
per day of demand growth next year. U. S. Energy Prices Motor Gasoline: At $1.44 per gallon, retail motor gasoline prices hit their highest point for the year in
Figure 2. OECD Commercial Oil StocksFigure 2. OECD Commercial Oil Stocks
Sources: History: EIA; Projections: Short-Term Energy Outlook, December 2002.
2.00
2.10
2.20
2.30
2.40
2.50
2.60
2.70
2.80
2.90
3.00
Jan-00
Apr-00
Jul-0
0Oct-
00Ja
n-01Apr-0
1Ju
l-01
Oct-01
Jan-02
Apr-02
Jul-0
2Oct-
02Ja
n-03Apr-0
3Ju
l-03
Oct-03
Bill
ion
Bar
rels
End-of-monthInventories
Previous 5-yearmin/max range
Projection
Sources: History: EIA; Projections: Short-Term Energy Outlook, December 2002.
Figure 3. World Oil Demand GrowthFigure 3. World Oil Demand Growth(Change from Year Ago)
-0.30
0.00
0.30
0.60
0.90
1.20
2001 2002 2003
Mill
ion
Bar
rels
per
Day
OECD* Non-OECD Asia FSU** & E. Europe Other
History Projections
** FSU = Former Soviet Union
* Note: OECD now defined to include the Czech Republic, Hungary, Mexico, Poland and South Korea in EIA's statistics.
0.0% +0.4% +1.8%
Energy Information Administration/Short-Term Energy Outlook -- December 2002 3
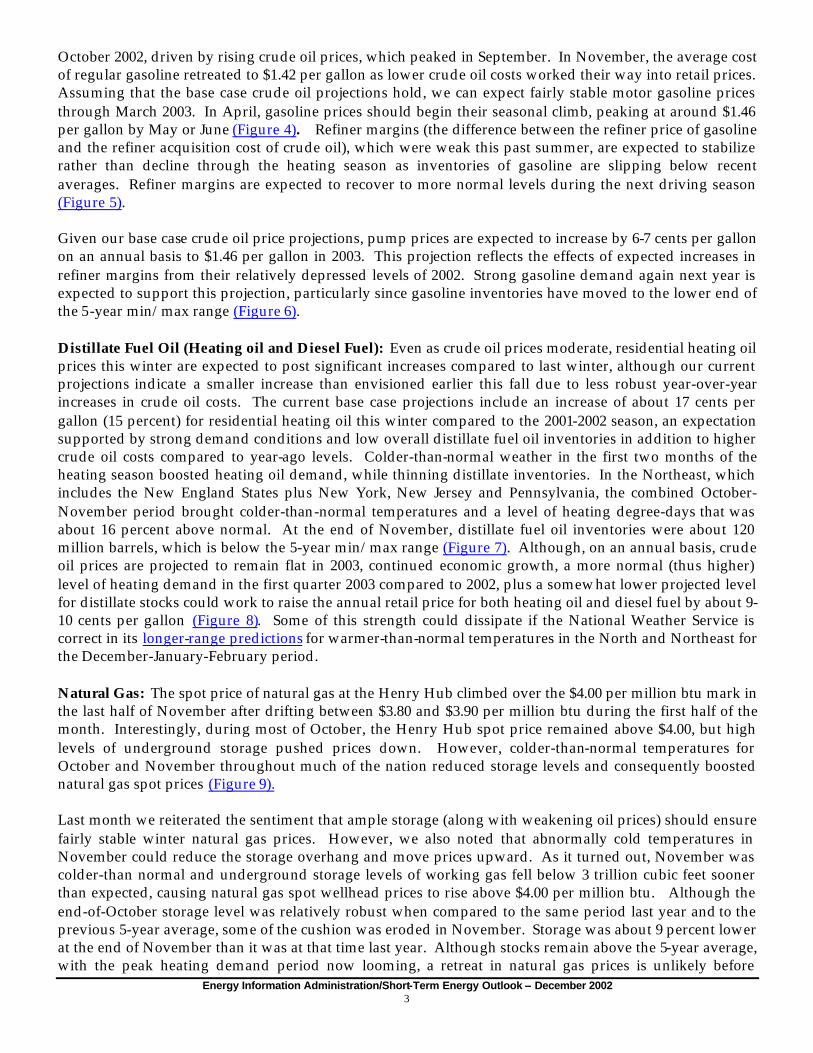
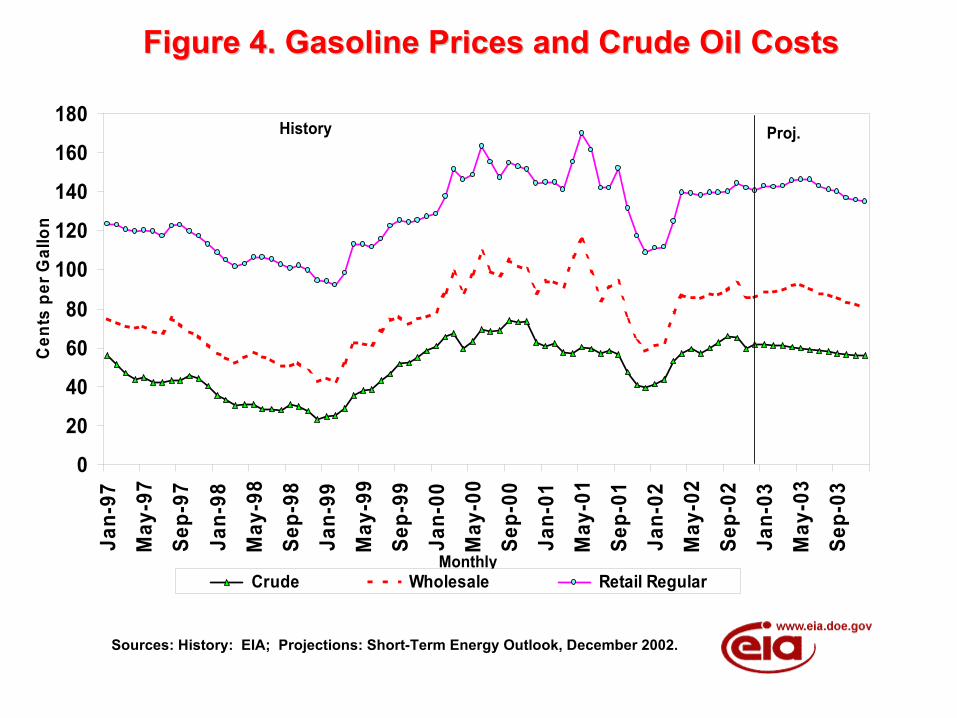
October 2002, driven by rising crude oil prices, which peaked in September. In November, the average cost of regular gasoline retreated to $1.42 per gallon as lower crude oil costs worked their way into retail prices. Assuming that the base case crude oil projections hold, we can expect fairly stable motor gasoline prices through March 2003. In April, gasoline prices should begin their seasonal climb, peaking at around $1.46 per gallon by May or June (Figure 4). Refiner margins (the difference between the refiner price of gasoline and the refiner acquisition cost of crude oil), which were weak this past summer, are expected to stabilize rather than decline through the heating season as inventories of gasoline are slipping below recent averages. Refiner margins are expected to recover to more normal levels during the next driving season (Figure 5). Given our base case crude oil price projections, pump prices are expected to increase by 6-7 cents per gallon on an annual basis to $1.46 per gallon in 2003. This projection reflects the effects of expected increases in refiner margins from their relatively depressed levels of 2002. Strong gasoline demand again next year is expected to support this projection, particularly since gasoline inventories have moved to the lower end of the 5-year min/max range (Figure 6). Distillate Fuel Oil (Heating oil and Diesel Fuel): Even as crude oil prices moderate, residential heating oil prices this winter are expected to post significant increases compared to last winter, although our current projections indicate a smaller increase than envisioned earlier this fall due to less robust year-over-year increases in crude oil costs. The current base case projections include an increase of about 17 cents per gallon (15 percent) for residential heating oil this winter compared to the 2001-2002 season, an expectation supported by strong demand conditions and low overall distillate fuel oil inventories in addition to higher crude oil costs compared to year-ago levels. Colder-than-normal weather in the first two months of the heating season boosted heating oil demand, while thinning distillate inventories. In the Northeast, which includes the New England States plus New York, New Jersey and Pennsylvania, the combined October-November period brought colder-than-normal temperatures and a level of heating degree-days that was about 16 percent above normal. At the end of November, distillate fuel oil inventories were about 120 million barrels, which is below the 5-year min/max range (Figure 7). Although, on an annual basis, crude oil prices are projected to remain flat in 2003, continued economic growth, a more normal (thus higher) level of heating demand in the first quarter 2003 compared to 2002, plus a somewhat lower projected level for distillate stocks could work to raise the annual retail price for both heating oil and diesel fuel by about 9-10 cents per gallon (Figure 8). Some of this strength could dissipate if the National Weather Service is correct in its longer-range predictions for warmer-than-normal temperatures in the North and Northeast for the December-January-February period. Natural Gas: The spot price of natural gas at the Henry Hub climbed over the $4.00 per million btu mark in the last half of November after drifting between $3.80 and $3.90 per million btu during the first half of the month. Interestingly, during most of October, the Henry Hub spot price remained above $4.00, but high levels of underground storage pushed prices down. However, colder-than-normal temperatures for October and November throughout much of the nation reduced storage levels and consequently boosted natural gas spot prices (Figure 9). Last month we reiterated the sentiment that ample storage (along with weakening oil prices) should ensure fairly stable winter natural gas prices. However, we also noted that abnormally cold temperatures in November could reduce the storage overhang and move prices upward. As it turned out, November was colder-than normal and underground storage levels of working gas fell below 3 trillion cubic feet sooner than expected, causing natural gas spot wellhead prices to rise above $4.00 per million btu. Although the end-of-October storage level was relatively robust when compared to the same period last year and to the previous 5-year average, some of the cushion was eroded in November. Storage was about 9 percent lower at the end of November than it was at that time last year. Although stocks remain above the 5-year average, with the peak heating demand period now looming, a retreat in natural gas prices is unlikely before
Sources: History: EIA; Projections: Short-Term Energy Outlook, December 2002.
Figure 4. Gasoline Prices and Crude Oil CostsFigure 4. Gasoline Prices and Crude Oil Costs
0
20
40
60
80
100
120
140
160
180Ja
n-97
May
-97
Sep-
97Ja
n-98
May
-98
Sep-
98Ja
n-99
May
-99
Sep-
99Ja
n-00
May
-00
Sep-
00Ja
n-01
May
-01
Sep-
01Ja
n-02
May
-02
Sep-
02Ja
n-03
May
-03
Sep-
03
Monthly
Cen
ts p
er G
allo
n
Crude Wholesale Retail Regular
History Proj.
Figure 5. Motor Gasoline SpreadsFigure 5. Motor Gasoline Spreads
Sources: History: EIA; Projections: Short-Term Energy Outlook, December 2002.
0.0
10.0
20.0
30.0
40.0
50.0
60.0
70.0
80.0
199501 199601 199701 199801 199901 200001 200101 200201 200301
Cen
ts p
er G
allo
n
Refiner
Retail
Total
History
Proj.
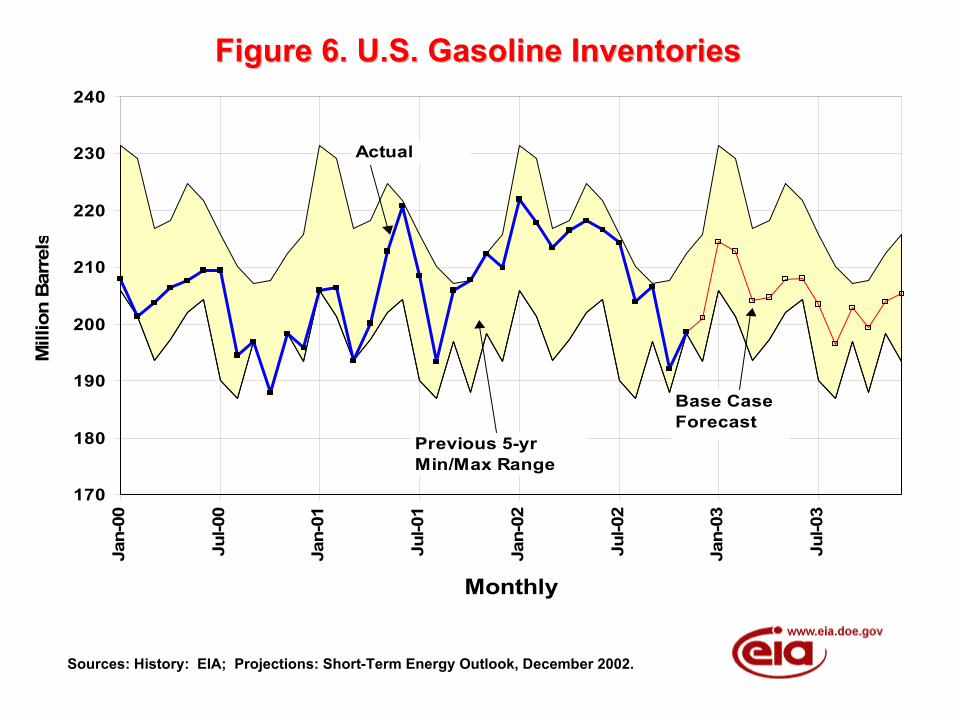
Figure 6. U.S. Gasoline InventoriesFigure 6. U.S. Gasoline Inventories
Sources: History: EIA; Projections: Short-Term Energy Outlook, December 2002.
170
180
190
200
210
220
230
240Ja
n-00
Jul-0
0
Jan-
01
Jul-0
1
Jan-
02
Jul-0
2
Jan-
03
Jul-0
3
Monthly
Mill
ion
Bar
rels
Actual
Base CaseForecast
Previous 5-yr Min/Max Range
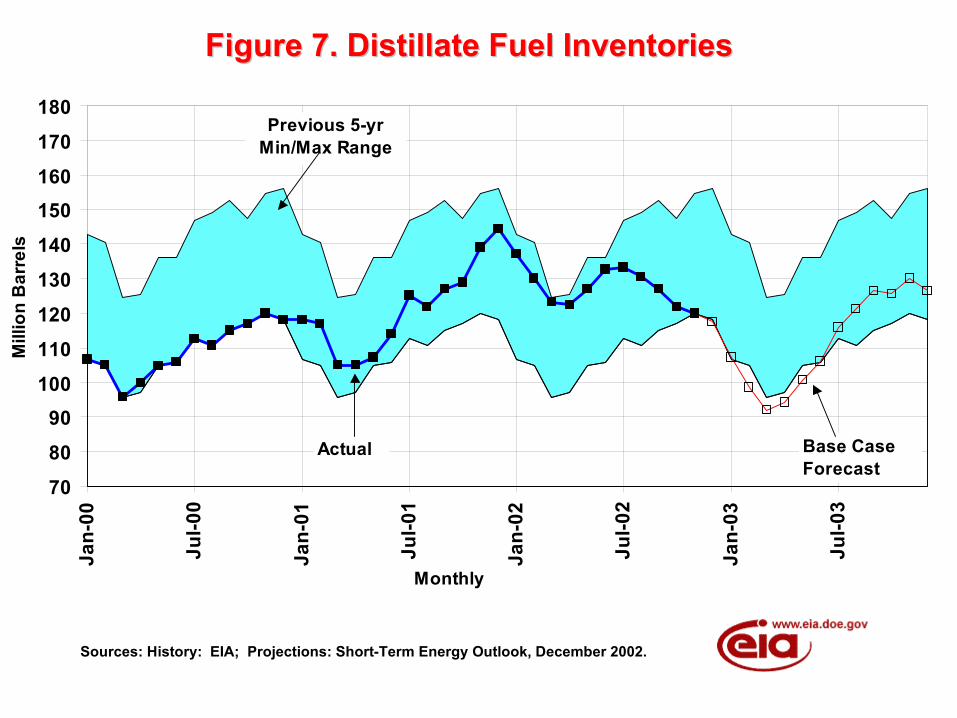
Figure 7. Distillate Fuel InventoriesFigure 7. Distillate Fuel Inventories
Sources: History: EIA; Projections: Short-Term Energy Outlook, December 2002.
708090
100110120130140150160170180
Jan-
00
Jul-0
0
Jan-
01
Jul-0
1
Jan-
02
Jul-0
2
Jan-
03
Jul-0
3
Monthly
Mill
ion
Bar
rels
Actual Base CaseForecast
Previous 5-yr Min/Max Range
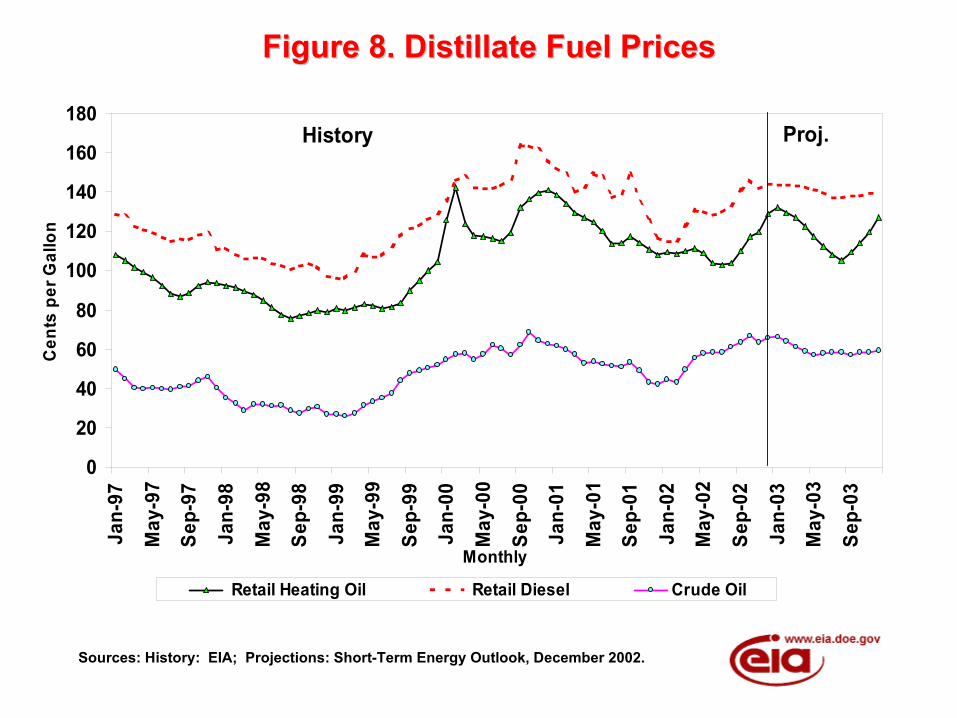
Figure 8. Distillate Fuel PricesFigure 8. Distillate Fuel Prices
Sources: History: EIA; Projections: Short-Term Energy Outlook, December 2002.
0
20
40
60
80
100
120
140
160
180Ja
n-97
May
-97
Sep-
97
Jan-
98
May
-98
Sep-
98
Jan-
99
May
-99
Sep-
99
Jan-
00
May
-00
Sep-
00
Jan-
01
May
-01
Sep-
01
Jan-
02
May
-02
Sep-
02
Jan-
03
May
-03
Sep-
03
Monthly
Cen
ts p
er G
allo
n
Retail Heating Oil Retail Diesel Crude Oil
History Proj.
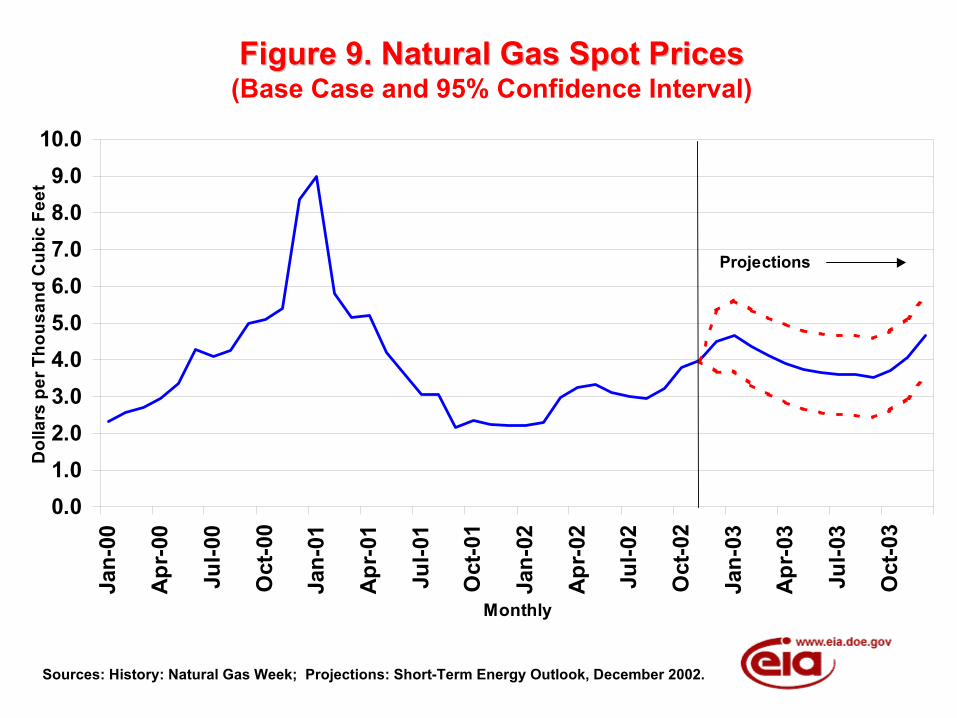
Figure 9. Natural Gas Spot PricesFigure 9. Natural Gas Spot Prices(Base Case and 95% Confidence Interval)
Sources: History: Natural Gas Week; Projections: Short-Term Energy Outlook, December 2002.
0.01.02.03.04.05.06.07.08.09.0
10.0Ja
n-00
Apr-0
0
Jul-0
0
Oct
-00
Jan-
01
Apr-0
1
Jul-0
1
Oct
-01
Jan-
02
Apr-0
2
Jul-0
2
Oct
-02
Jan-
03
Apr-0
3
Jul-0
3
Oct
-03
Monthly
Dol
lars
per
Tho
usan
d C
ubic
Fee
t
Projections
Energy Information Administration/Short-Term Energy Outlook -- December 2002 4
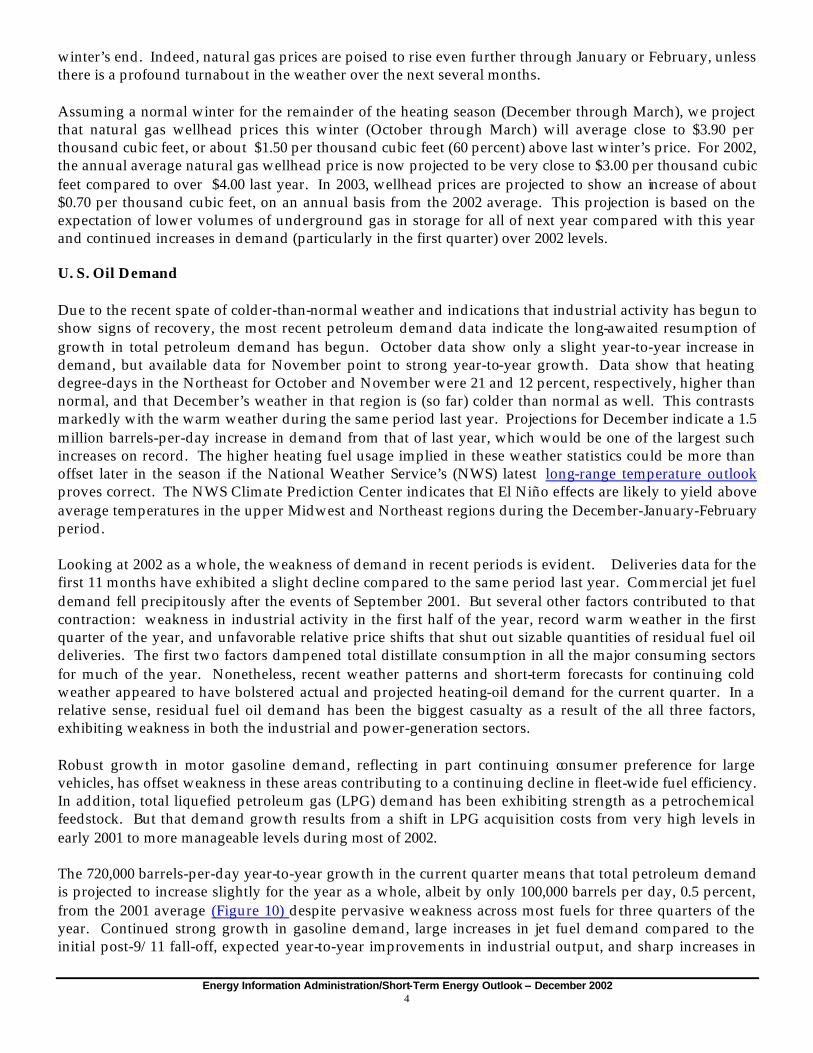
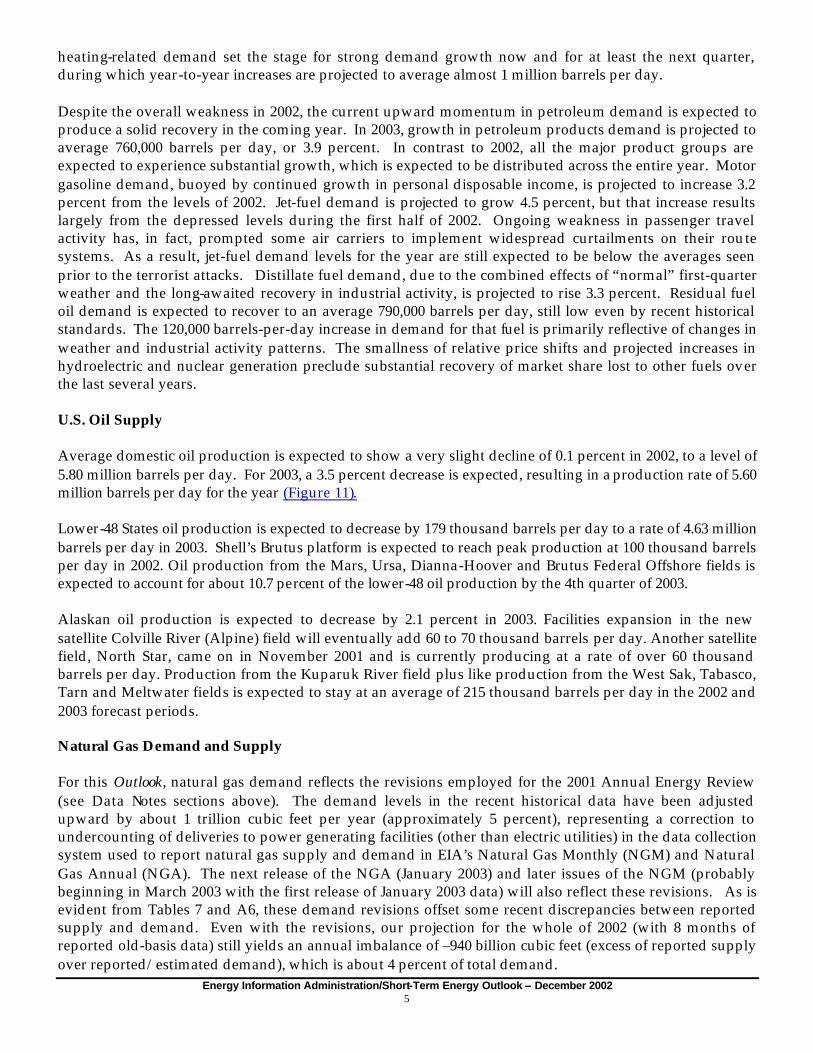
winter’s end. Indeed, natural gas prices are poised to rise even further through January or February, unless there is a profound turnabout in the weather over the next several months. Assuming a normal winter for the remainder of the heating season (December through March), we project that natural gas wellhead prices this winter (October through March) will average close to $3.90 per thousand cubic feet, or about $1.50 per thousand cubic feet (60 percent) above last winter’s price. For 2002, the annual average natural gas wellhead price is now projected to be very close to $3.00 per thousand cubic feet compared to over $4.00 last year. In 2003, wellhead prices are projected to show an increase of about $0.70 per thousand cubic feet, on an annual basis from the 2002 average. This projection is based on the expectation of lower volumes of underground gas in storage for all of next year compared with this year and continued increases in demand (particularly in the first quarter) over 2002 levels. U. S. Oil Demand Due to the recent spate of colder-than-normal weather and indications that industrial activity has begun to show signs of recovery, the most recent petroleum demand data indicate the long-awaited resumption of growth in total petroleum demand has begun. October data show only a slight year-to-year increase in demand, but available data for November point to strong year-to-year growth. Data show that heating degree-days in the Northeast for October and November were 21 and 12 percent, respectively, higher than normal, and that December’s weather in that region is (so far) colder than normal as well. This contrasts markedly with the warm weather during the same period last year. Projections for December indicate a 1.5 million barrels-per-day increase in demand from that of last year, which would be one of the largest such increases on record. The higher heating fuel usage implied in these weather statistics could be more than offset later in the season if the National Weather Service’s (NWS) latest long-range temperature outlook proves correct. The NWS Climate Prediction Center indicates that El Niño effects are likely to yield above average temperatures in the upper Midwest and Northeast regions during the December-January-February period. Looking at 2002 as a whole, the weakness of demand in recent periods is evident. Deliveries data for the first 11 months have exhibited a slight decline compared to the same period last year. Commercial jet fuel demand fell precipitously after the events of September 2001. But several other factors contributed to that contraction: weakness in industrial activity in the first half of the year, record warm weather in the first quarter of the year, and unfavorable relative price shifts that shut out sizable quantities of residual fuel oil deliveries. The first two factors dampened total distillate consumption in all the major consuming sectors for much of the year. Nonetheless, recent weather patterns and short-term forecasts for continuing cold weather appeared to have bolstered actual and projected heating-oil demand for the current quarter. In a relative sense, residual fuel oil demand has been the biggest casualty as a result of the all three factors, exhibiting weakness in both the industrial and power-generation sectors. Robust growth in motor gasoline demand, reflecting in part continuing consumer preference for large vehicles, has offset weakness in these areas contributing to a continuing decline in fleet-wide fuel efficiency. In addition, total liquefied petroleum gas (LPG) demand has been exhibiting strength as a petrochemical feedstock. But that demand growth results from a shift in LPG acquisition costs from very high levels in early 2001 to more manageable levels during most of 2002. The 720,000 barrels-per-day year-to-year growth in the current quarter means that total petroleum demand is projected to increase slightly for the year as a whole, albeit by only 100,000 barrels per day, 0.5 percent, from the 2001 average (Figure 10) despite pervasive weakness across most fuels for three quarters of the year. Continued strong growth in gasoline demand, large increases in jet fuel demand compared to the initial post-9/11 fall-off, expected year-to-year improvements in industrial output, and sharp increases in
-400
-300
-200
-100
0
100
200
300
400
500
600
700
800
2001 2002 2003
Thou
sand
Bar
rels
per
Day
Total Motor Gasoline Jet Fuel Fuel Oil * Other
History Projections
* Sum of distillate and residual fuel.
Figure 10. Petroleum Products Demand GrowthFigure 10. Petroleum Products Demand Growth(Change from Year Ago)
Sources: History: EIA; Projections: Short-Term Energy Outlook, December 2002.
- 0.3% +0.5% +3.8%
Energy Information Administration/Short-Term Energy Outlook -- December 2002 5
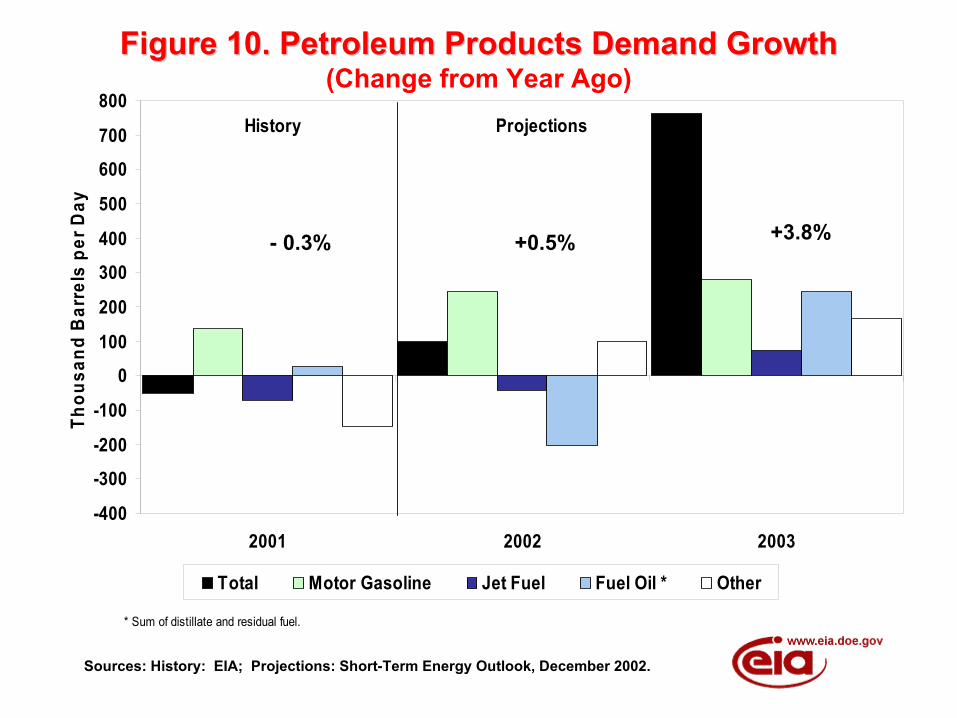
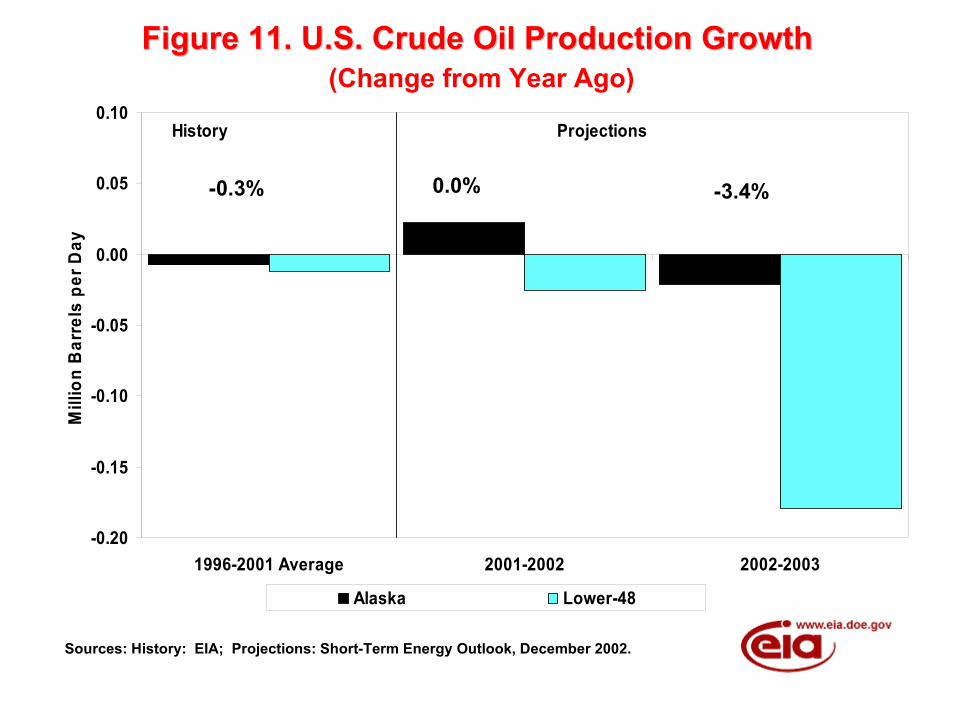
heating-related demand set the stage for strong demand growth now and for at least the next quarter, during which year-to-year increases are projected to average almost 1 million barrels per day. Despite the overall weakness in 2002, the current upward momentum in petroleum demand is expected to produce a solid recovery in the coming year. In 2003, growth in petroleum products demand is projected to average 760,000 barrels per day, or 3.9 percent. In contrast to 2002, all the major product groups are expected to experience substantial growth, which is expected to be distributed across the entire year. Motor gasoline demand, buoyed by continued growth in personal disposable income, is projected to increase 3.2 percent from the levels of 2002. Jet-fuel demand is projected to grow 4.5 percent, but that increase results largely from the depressed levels during the first half of 2002. Ongoing weakness in passenger travel activity has, in fact, prompted some air carriers to implement widespread curtailments on their route systems. As a result, jet-fuel demand levels for the year are still expected to be below the averages seen prior to the terrorist attacks. Distillate fuel demand, due to the combined effects of “normal” first-quarter weather and the long-awaited recovery in industrial activity, is projected to rise 3.3 percent. Residual fuel oil demand is expected to recover to an average 790,000 barrels per day, still low even by recent historical standards. The 120,000 barrels-per-day increase in demand for that fuel is primarily reflective of changes in weather and industrial activity patterns. The smallness of relative price shifts and projected increases in hydroelectric and nuclear generation preclude substantial recovery of market share lost to other fuels over the last several years. U.S. Oil Supply Average domestic oil production is expected to show a very slight decline of 0.1 percent in 2002, to a level of 5.80 million barrels per day. For 2003, a 3.5 percent decrease is expected, resulting in a production rate of 5.60 million barrels per day for the year (Figure 11). Lower-48 States oil production is expected to decrease by 179 thousand barrels per day to a rate of 4.63 million barrels per day in 2003. Shell’s Brutus platform is expected to reach peak production at 100 thousand barrels per day in 2002. Oil production from the Mars, Ursa, Dianna-Hoover and Brutus Federal Offshore fields is expected to account for about 10.7 percent of the lower-48 oil production by the 4th quarter of 2003. Alaskan oil production is expected to decrease by 2.1 percent in 2003. Facilities expansion in the new satellite Colville River (Alpine) field will eventually add 60 to 70 thousand barrels per day. Another satellite field, North Star, came on in November 2001 and is currently producing at a rate of over 60 thousand barrels per day. Production from the Kuparuk River field plus like production from the West Sak, Tabasco, Tarn and Meltwater fields is expected to stay at an average of 215 thousand barrels per day in the 2002 and 2003 forecast periods. Natural Gas Demand and Supply For this Outlook, natural gas demand reflects the revisions employed for the 2001 Annual Energy Review (see Data Notes sections above). The demand levels in the recent historical data have been adjusted upward by about 1 trillion cubic feet per year (approximately 5 percent), representing a correction to undercounting of deliveries to power generating facilities (other than electric utilities) in the data collection system used to report natural gas supply and demand in EIA’s Natural Gas Monthly (NGM) and Natural Gas Annual (NGA). The next release of the NGA (January 2003) and later issues of the NGM (probably beginning in March 2003 with the first release of January 2003 data) will also reflect these revisions. As is evident from Tables 7 and A6, these demand revisions offset some recent discrepancies between reported supply and demand. Even with the revisions, our projection for the whole of 2002 (with 8 months of reported old-basis data) still yields an annual imbalance of –940 billion cubic feet (excess of reported supply over reported/estimated demand), which is about 4 percent of total demand.
-0.20
-0.15
-0.10
-0.05
0.00
0.05
0.10
1996-2001 Average 2001-2002 2002-2003
Mill
ion
Bar
rels
per
Day
Alaska Lower-48
History Projections
Sources: History: EIA; Projections: Short-Term Energy Outlook, December 2002.
Figure 11. U.S. Crude Oil Production GrowthFigure 11. U.S. Crude Oil Production Growth (Change from Year Ago)
-0.3% 0.0% -3.4%
Energy Information Administration/Short-Term Energy Outlook -- December 2002 6
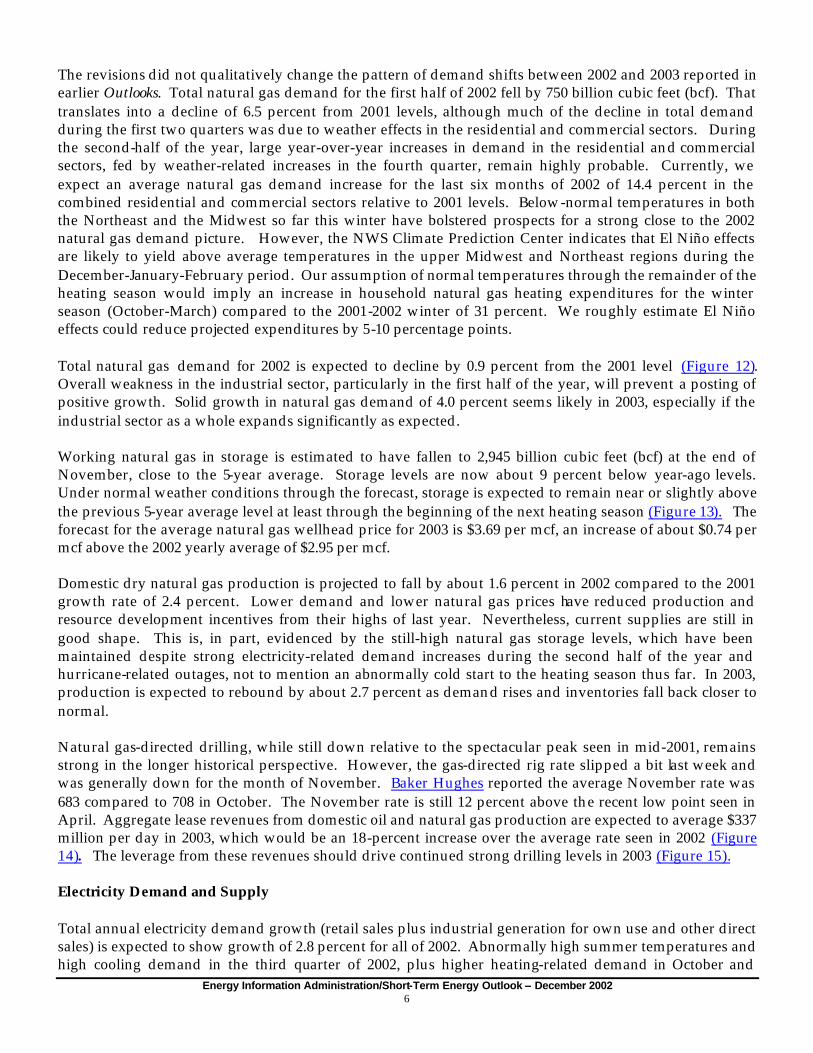
The revisions did not qualitatively change the pattern of demand shifts between 2002 and 2003 reported in earlier Outlooks. Total natural gas demand for the first half of 2002 fell by 750 billion cubic feet (bcf). That translates into a decline of 6.5 percent from 2001 levels, although much of the decline in total demand during the first two quarters was due to weather effects in the residential and commercial sectors. During the second-half of the year, large year-over-year increases in demand in the residential and commercial sectors, fed by weather-related increases in the fourth quarter, remain highly probable. Currently, we expect an average natural gas demand increase for the last six months of 2002 of 14.4 percent in the combined residential and commercial sectors relative to 2001 levels. Below-normal temperatures in both the Northeast and the Midwest so far this winter have bolstered prospects for a strong close to the 2002 natural gas demand picture. However, the NWS Climate Prediction Center indicates that El Niño effects are likely to yield above average temperatures in the upper Midwest and Northeast regions during the December-January-February period. Our assumption of normal temperatures through the remainder of the heating season would imply an increase in household natural gas heating expenditures for the winter season (October-March) compared to the 2001-2002 winter of 31 percent. We roughly estimate El Niño effects could reduce projected expenditures by 5-10 percentage points. Total natural gas demand for 2002 is expected to decline by 0.9 percent from the 2001 level (Figure 12). Overall weakness in the industrial sector, particularly in the first half of the year, will prevent a posting of positive growth. Solid growth in natural gas demand of 4.0 percent seems likely in 2003, especially if the industrial sector as a whole expands significantly as expected. Working natural gas in storage is estimated to have fallen to 2,945 billion cubic feet (bcf) at the end of November, close to the 5-year average. Storage levels are now about 9 percent below year-ago levels. Under normal weather conditions through the forecast, storage is expected to remain near or slightly above the previous 5-year average level at least through the beginning of the next heating season (Figure 13). The forecast for the average natural gas wellhead price for 2003 is $3.69 per mcf, an increase of about $0.74 per mcf above the 2002 yearly average of $2.95 per mcf. Domestic dry natural gas production is projected to fall by about 1.6 percent in 2002 compared to the 2001 growth rate of 2.4 percent. Lower demand and lower natural gas prices have reduced production and resource development incentives from their highs of last year. Nevertheless, current supplies are still in good shape. This is, in part, evidenced by the still-high natural gas storage levels, which have been maintained despite strong electricity-related demand increases during the second half of the year and hurricane-related outages, not to mention an abnormally cold start to the heating season thus far. In 2003, production is expected to rebound by about 2.7 percent as demand rises and inventories fall back closer to normal. Natural gas-directed drilling, while still down relative to the spectacular peak seen in mid-2001, remains strong in the longer historical perspective. However, the gas-directed rig rate slipped a bit last week and was generally down for the month of November. Baker Hughes reported the average November rate was 683 compared to 708 in October. The November rate is still 12 percent above the recent low point seen in April. Aggregate lease revenues from domestic oil and natural gas production are expected to average $337 million per day in 2003, which would be an 18-percent increase over the average rate seen in 2002 (Figure 14). The leverage from these revenues should drive continued strong drilling levels in 2003 (Figure 15). Electricity Demand and Supply Total annual electricity demand growth (retail sales plus industrial generation for own use and other direct sales) is expected to show growth of 2.8 percent for all of 2002. Abnormally high summer temperatures and high cooling demand in the third quarter of 2002, plus higher heating-related demand in October and
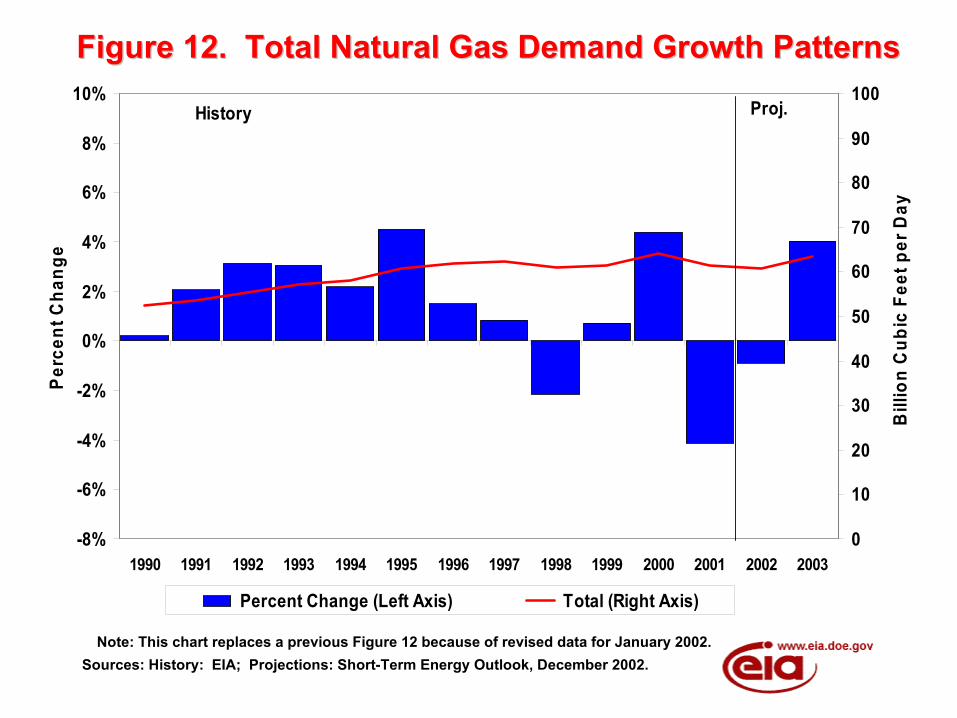
Figure 12. Total Natural Gas Demand Growth PatternsFigure 12. Total Natural Gas Demand Growth Patterns
Sources: History: EIA; Projections: Short-Term Energy Outlook, December 2002.Note: This chart replaces a previous Figure 12 because of revised data for January 2002.
-8%
-6%
-4%
-2%
0%
2%
4%
6%
8%
10%
1990 1991 1992 1993 1994 1995 1996 1997 1998 1999 2000 2001 2002 2003
Perc
ent C
hang
e
0
10
20
30
40
50
60
70
80
90
100
Bill
ion
Cub
ic F
eet p
er D
ay
Percent Change (Left Axis) Total (Right Axis)
History Proj.
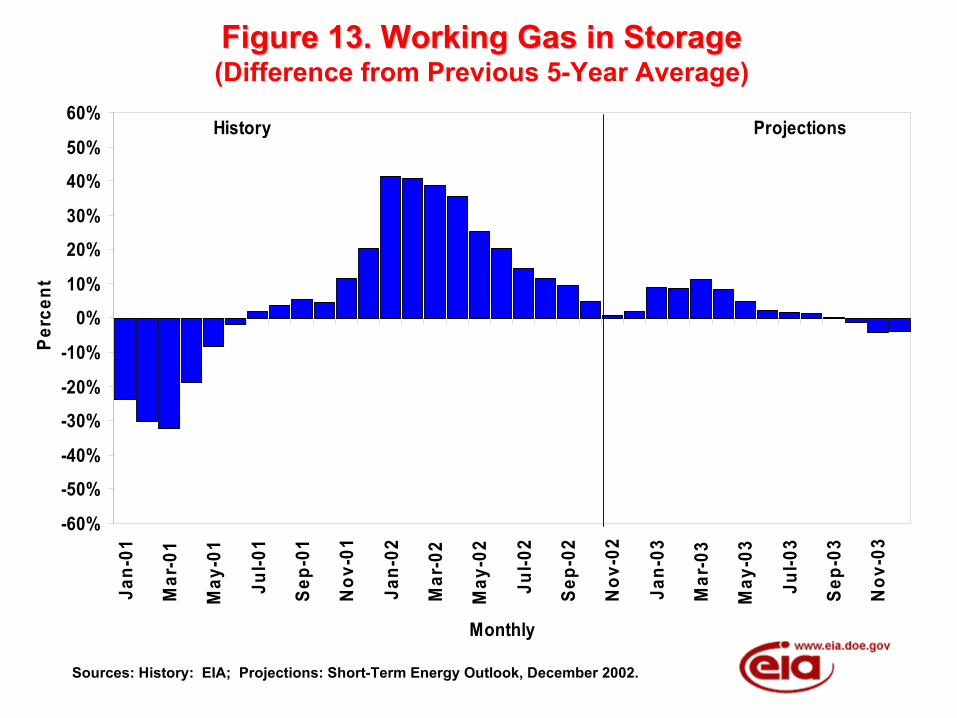
Figure 13. Working Gas in StorageFigure 13. Working Gas in Storage(Difference from Previous 5-Year Average)
Sources: History: EIA; Projections: Short-Term Energy Outlook, December 2002.
-60%
-50%
-40%
-30%
-20%
-10%
0%
10%
20%
30%
40%
50%
60%Ja
n-01
Mar
-01
May
-01
Jul-0
1
Sep-
01
Nov
-01
Jan-
02
Mar
-02
May
-02
Jul-0
2
Sep-
02
Nov
-02
Jan-
03
Mar
-03
May
-03
Jul-0
3
Sep-
03
Nov
-03
Monthly
Perc
ent
History Projections
Figure 14. U.S. Oil and Gas Production RevenuesFigure 14. U.S. Oil and Gas Production Revenues
Sources: History: EIA; Projections: Short-Term Energy Outlook, December 2002.
0
100
200
300
400
500
600
700
Jan-97
Jul-9
7Ja
n-98Ju
l-98
Jan-99
Jul-9
9Ja
n-00Ju
l-00
Jan-01
Jul-0
1Ja
n-02Ju
l-02
Jan-03
Jul-0
3M
illio
n D
olla
rs p
er D
ay
Projections
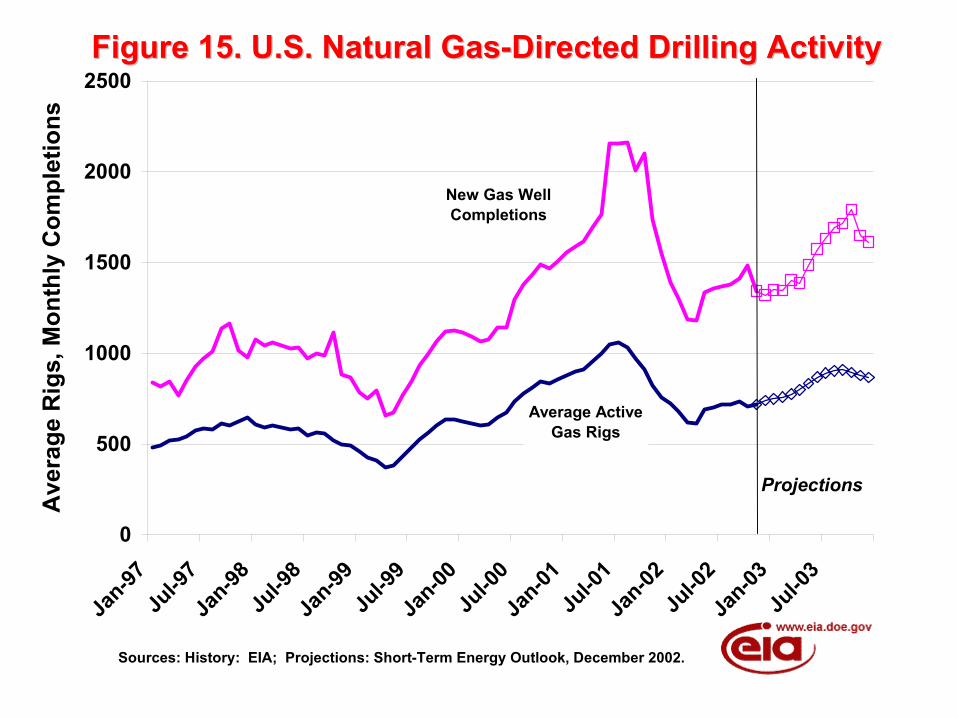
Figure 15. U.S. Natural Gas-Directed Drilling ActivityFigure 15. U.S. Natural Gas-Directed Drilling Activity
Sources: History: EIA; Projections: Short-Term Energy Outlook, December 2002.
0
500
1000
1500
2000
2500
Jan-97
Jul-9
7Ja
n-98Ju
l-98
Jan-99
Jul-9
9Ja
n-00Ju
l-00
Jan-01
Jul-0
1Ja
n-02Ju
l-02
Jan-03
Jul-0
3
Ave
rage
Rig
s, M
onth
ly C
ompl
etio
ns
Projections
New Gas Well Completions
Average Active Gas Rigs
Energy Information Administration/Short-Term Energy Outlook -- December 2002 7
November sharply increased electricity demand. Based on Edison Electric Institute data on weekly electricity output, U.S. electricity production rose 6.5 percent for the third quarter 2002 compared to the year-earlier level. Our estimate for third-quarter 2002 growth in total demand has been revised to 5.8 percent. In 2003, while the economy is expected to continue to recover, electricity demand is expected to grow by a relatively subdued rate of about 1.1 percent (Figure 16) since little or no net summer demand growth would be expected under normal levels of cooling degree-days. Total U.S. electricity demand is expected to be 4.6 percent higher this winter than it was last winter, due to continuing growth in the economy, a cold start to the heating season, and assumptions of normal temperatures for the remainder of the winter, which would imply 18-percent colder conditions this winter than last.
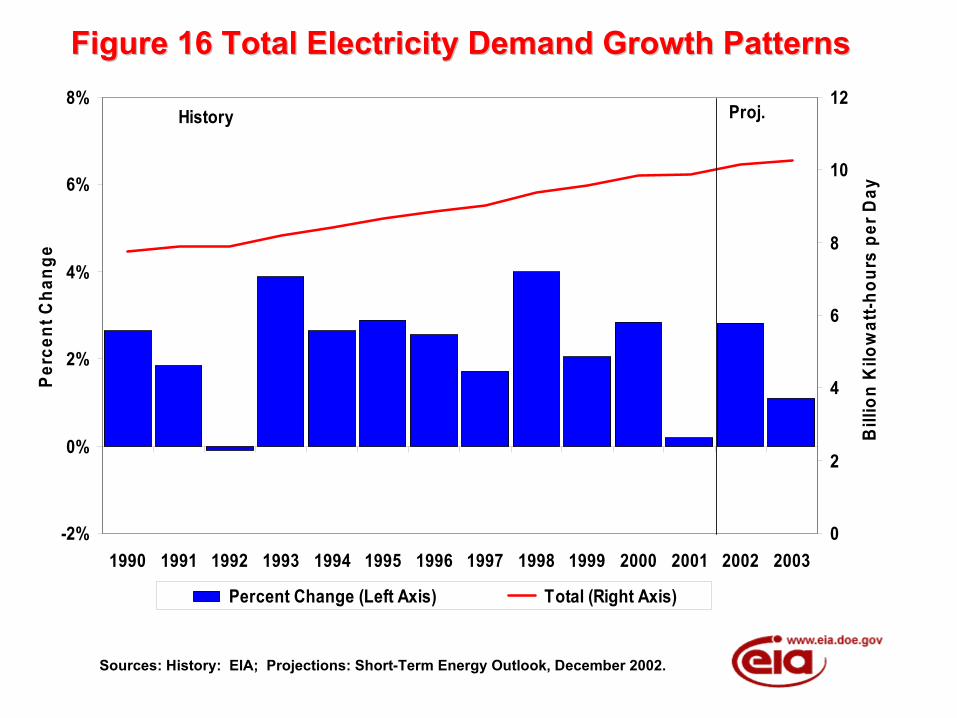
Figure 16 Total Electricity Demand Growth PatternsFigure 16 Total Electricity Demand Growth Patterns
Sources: History: EIA; Projections: Short-Term Energy Outlook, December 2002.
-2%
0%
2%
4%
6%
8%
1990 1991 1992 1993 1994 1995 1996 1997 1998 1999 2000 2001 2002 2003
Perc
ent C
hang
e
0
2
4
6
8
10
12
Bill
ion
Kilo
wat
t-hou
rs p
er D
ay
Percent Change (Left Axis) Total (Right Axis)
History Proj.
Energy Information Administration/Short-Term Energy Outlook -- December 2002 1
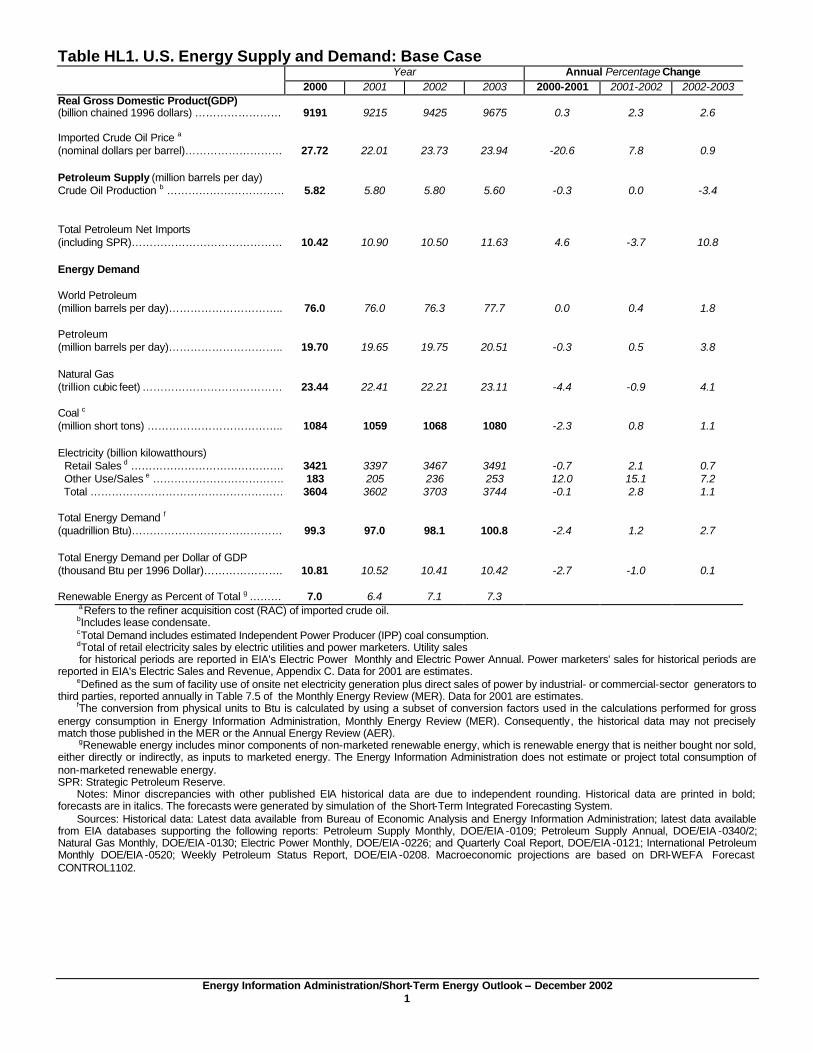
Table HL1. U.S. Energy Supply and Demand: Base Case Year Annual Percentage Change
2000 2001 2002 2003 2000-2001 2001-2002 2002-2003 Real Gross Domestic Product(GDP) (billion chained 1996 dollars) ……………………
9191
9215
9425
9675
0.3
2.3
2.6
Imported Crude Oil Price a (nominal dollars per barrel)……………………… 27.72 22.01 23.73 23.94 -20.6 7.8 0.9
Petroleum Supply (million barrels per day) Crude Oil Production b …………………………… 5.82 5.80 5.80 5.60 -0.3 0.0 -3.4
Total Petroleum Net Imports (including SPR)…………………………………… 10.42 10.90 10.50 11.63 4.6 -3.7 10.8
Energy Demand
World Petroleum (million barrels per day)………………………….. 76.0 76.0 76.3 77.7 0.0 0.4 1.8
Petroleum (million barrels per day)………………………….. 19.70 19.65 19.75 20.51 -0.3 0.5 3.8
Natural Gas (trillion cubic feet) ………………………………… 23.44 22.41 22.21 23.11 -4.4 -0.9 4.1
Coal c (million short tons) ……………………………….. 1084 1059 1068 1080 -2.3 0.8 1.1
Electricity (billion kilowatthours) Retail Sales d ……………………………………. 3421 3397 3467 3491 -0.7 2.1 0.7 Other Use/Sales e ………………………………. 183 205 236 253 12.0 15.1 7.2 Total ……………………………………………… 3604 3602 3703 3744 -0.1 2.8 1.1
Total Energy Demand f (quadrillion Btu)…………………………………… 99.3 97.0 98.1 100.8 -2.4 1.2 2.7
Total Energy Demand per Dollar of GDP (thousand Btu per 1996 Dollar)…………………. 10.81 10.52 10.41 10.42 -2.7 -1.0 0.1
Renewable Energy as Percent of Total g ……… 7.0 6.4 7.1 7.3 aRefers to the refiner acquisition cost (RAC) of imported crude oil. bIncludes lease condensate. cTotal Demand includes estimated Independent Power Producer (IPP) coal consumption. dTotal of retail electricity sales by electric utilities and power marketers. Utility sales for historical periods are reported in EIA's Electric Power Monthly and Electric Power Annual. Power marketers' sales for historical periods are reported in EIA's Electric Sales and Revenue, Appendix C. Data for 2001 are estimates. eDefined as the sum of facility use of onsite net electricity generation plus direct sales of power by industrial- or commercial-sector generators to third parties, reported annually in Table 7.5 of the Monthly Energy Review (MER). Data for 2001 are estimates. fThe conversion from physical units to Btu is calculated by using a subset of conversion factors used in the calculations performed for gross energy consumption in Energy Information Administration, Monthly Energy Review (MER). Consequently, the historical data may not precisely match those published in the MER or the Annual Energy Review (AER). gRenewable energy includes minor components of non-marketed renewable energy, which is renewable energy that is neither bought nor sold, either directly or indirectly, as inputs to marketed energy. The Energy Information Administration does not estimate or project total consumption of non-marketed renewable energy. SPR: Strategic Petroleum Reserve. Notes: Minor discrepancies with other published EIA historical data are due to independent rounding. Historical data are printed in bold; forecasts are in italics. The forecasts were generated by simulation of the Short-Term Integrated Forecasting System. Sources: Historical data: Latest data available from Bureau of Economic Analysis and Energy Information Administration; latest data available from EIA databases supporting the following reports: Petroleum Supply Monthly, DOE/EIA -0109; Petroleum Supply Annual, DOE/EIA -0340/2; Natural Gas Monthly, DOE/EIA -0130; Electric Power Monthly, DOE/EIA -0226; and Quarterly Coal Report, DOE/EIA -0121; International Petroleum Monthly DOE/EIA -0520; Weekly Petroleum Status Report, DOE/EIA -0208. Macroeconomic projections are based on DRI-WEFA Forecast CONTROL1102.
Energy Information Administration/Short-Term Energy Outlook -- December 2002 2
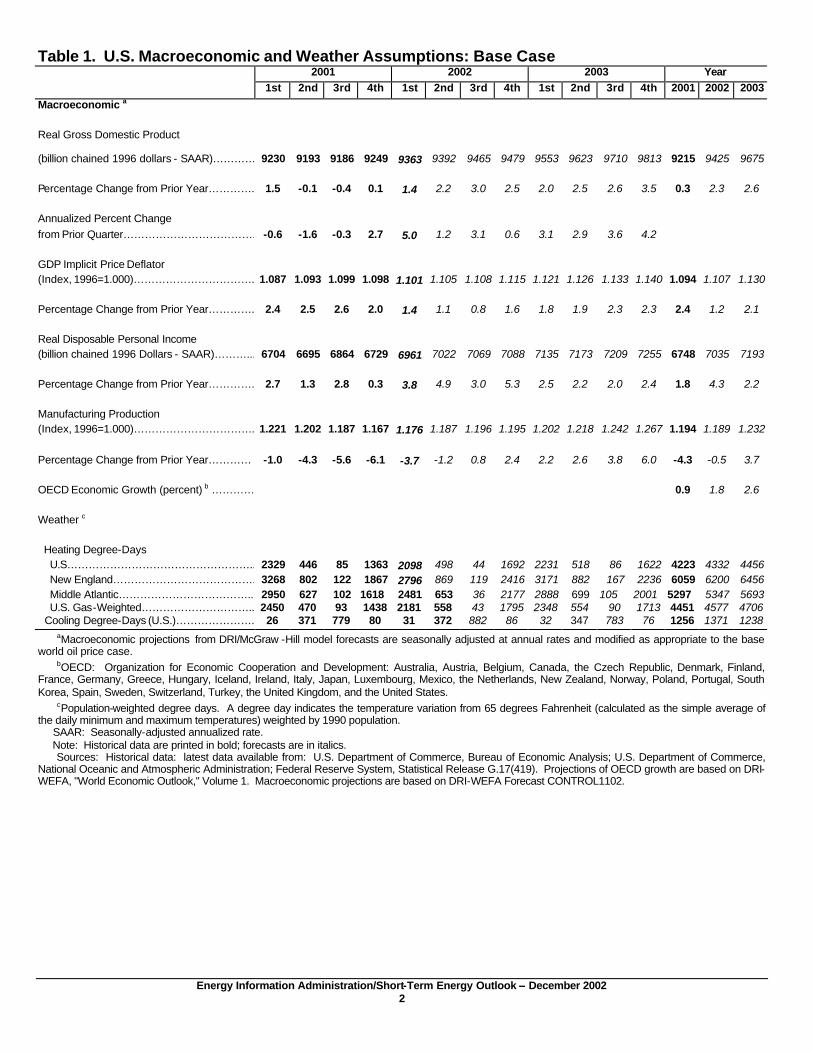
Table 1. U.S. Macroeconomic and Weather Assumptions: Base Case 2001 2002 2003 Year
1st 2nd 3rd 4th 1st 2nd 3rd 4th 1st 2nd 3rd 4th 2001 2002 2003
Macroeconomic a Real Gross Domestic Product
(billion chained 1996 dollars - SAAR)………… 9230 9193 9186 9249 9363 9392 9465 9479 9553 9623 9710 9813 9215 9425 9675 Percentage Change from Prior Year…………. 1.5 -0.1 -0.4 0.1 1.4 2.2 3.0 2.5 2.0 2.5 2.6 3.5 0.3 2.3 2.6 Annualized Percent Change from Prior Quarter………………………………. -0.6 -1.6 -0.3 2.7 5.0 1.2 3.1 0.6 3.1 2.9 3.6 4.2 GDP Implicit Price Deflator (Index, 1996=1.000)……………………………. 1.087 1.093 1.099 1.098 1.101 1.105 1.108 1.115 1.121 1.126 1.133 1.140 1.094 1.107 1.130 Percentage Change from Prior Year…………. 2.4 2.5 2.6 2.0 1.4 1.1 0.8 1.6 1.8 1.9 2.3 2.3 2.4 1.2 2.1 Real Disposable Personal Income (billion chained 1996 Dollars - SAAR)………... 6704 6695 6864 6729 6961 7022 7069 7088 7135 7173 7209 7255 6748 7035 7193 Percentage Change from Prior Year…………. 2.7 1.3 2.8 0.3 3.8 4.9 3.0 5.3 2.5 2.2 2.0 2.4 1.8 4.3 2.2 Manufacturing Production (Index, 1996=1.000)……………………………. 1.221 1.202 1.187 1.167 1.176 1.187 1.196 1.195 1.202 1.218 1.242 1.267 1.194 1.189 1.232 Percentage Change from Prior Year………… -1.0 -4.3 -5.6 -6.1 -3.7 -1.2 0.8 2.4 2.2 2.6 3.8 6.0 -4.3 -0.5 3.7 OECD Economic Growth (percent) b ………… 0.9 1.8 2.6 Weather c Heating Degree-Days U.S…………………………………………….. 2329 446 85 1363 2098 498 44 1692 2231 518 86 1622 4223 4332 4456 New England…………………………………. 3268 802 122 1867 2796 869 119 2416 3171 882 167 2236 6059 6200 6456 Middle Atlantic……………………………….. 2950 627 102 1618 2481 653 36 2177 2888 699 105 2001 5297 5347 5693 U.S. Gas-Weighted………………………….. 2450 470 93 1438 2181 558 43 1795 2348 554 90 1713 4451 4577 4706 Cooling Degree-Days (U.S.)…………………. 26 371 779 80 31 372 882 86 32 347 783 76 1256 1371 1238
aMacroeconomic projections from DRI/McGraw -Hill model forecasts are seasonally adjusted at annual rates and modified as appropriate to the base world oil price case. bOECD: Organization for Economic Cooperation and Development: Australia, Austria, Belgium, Canada, the Czech Republic, Denmark, Finland, France, Germany, Greece, Hungary, Iceland, Ireland, Italy, Japan, Luxembourg, Mexico, the Netherlands, New Zealand, Norway, Poland, Portugal, South Korea, Spain, Sweden, Switzerland, Turkey, the United Kingdom, and the United States. cPopulation-weighted degree days. A degree day indicates the temperature variation from 65 degrees Fahrenheit (calculated as the simple average of the daily minimum and maximum temperatures) weighted by 1990 population. SAAR: Seasonally-adjusted annualized rate. Note: Historical data are printed in bold; forecasts are in italics. Sources: Historical data: latest data available from: U.S. Department of Commerce, Bureau of Economic Analysis; U.S. Department of Commerce, National Oceanic and Atmospheric Administration; Federal Reserve System, Statistical Release G.17(419). Projections of OECD growth are based on DRI-WEFA, "World Economic Outlook," Volume 1. Macroeconomic projections are based on DRI-WEFA Forecast CONTROL1102.
Energy Information Administration/Short-Term Energy Outlook -- December 2002 3
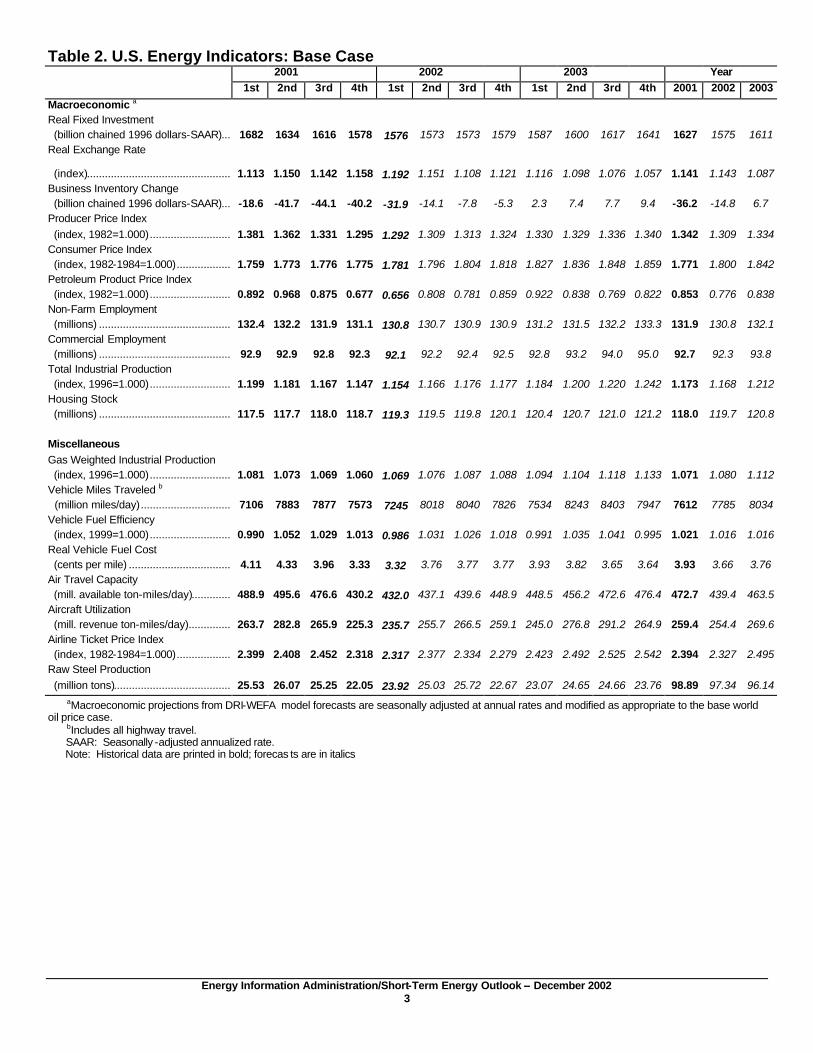
Table 2. U.S. Energy Indicators: Base Case 2001 2002 2003 Year
1st 2nd 3rd 4th 1st 2nd 3rd 4th 1st 2nd 3rd 4th 2001 2002 2003
Macroeconomic a Real Fixed Investment (billion chained 1996 dollars-SAAR)................................1682 1634 1616 1578 1576 1573 1573 1579 1587 1600 1617 1641 1627 1575 1611 Real Exchange Rate
(index)................................................................1.113 1.150 1.142 1.158 1.192 1.151 1.108 1.121 1.116 1.098 1.076 1.057 1.141 1.143 1.087 Business Inventory Change (billion chained 1996 dollars-SAAR)................................-18.6 -41.7 -44.1 -40.2 -31.9 -14.1 -7.8 -5.3 2.3 7.4 7.7 9.4 -36.2 -14.8 6.7 Producer Price Index (index, 1982=1.000)................................1.381 1.362 1.331 1.295 1.292 1.309 1.313 1.324 1.330 1.329 1.336 1.340 1.342 1.309 1.334 Consumer Price Index (index, 1982-1984=1.000)................................1.759 1.773 1.776 1.775 1.781 1.796 1.804 1.818 1.827 1.836 1.848 1.859 1.771 1.800 1.842 Petroleum Product Price Index (index, 1982=1.000)................................0.892 0.968 0.875 0.677 0.656 0.808 0.781 0.859 0.922 0.838 0.769 0.822 0.853 0.776 0.838 Non-Farm Employment (millions) ................................................................132.4 132.2 131.9 131.1 130.8 130.7 130.9 130.9 131.2 131.5 132.2 133.3 131.9 130.8 132.1 Commercial Employment (millions) ................................................................92.9 92.9 92.8 92.3 92.1 92.2 92.4 92.5 92.8 93.2 94.0 95.0 92.7 92.3 93.8 Total Industrial Production (index, 1996=1.000)................................1.199 1.181 1.167 1.147 1.154 1.166 1.176 1.177 1.184 1.200 1.220 1.242 1.173 1.168 1.212 Housing Stock (millions) ................................................................117.5 117.7 118.0 118.7 119.3 119.5 119.8 120.1 120.4 120.7 121.0 121.2 118.0 119.7 120.8 Miscellaneous Gas Weighted Industrial Production (index, 1996=1.000)................................1.081 1.073 1.069 1.060 1.069 1.076 1.087 1.088 1.094 1.104 1.118 1.133 1.071 1.080 1.112 Vehicle Miles Traveled b (million miles/day)................................ 7106 7883 7877 7573 7245 8018 8040 7826 7534 8243 8403 7947 7612 7785 8034 Vehicle Fuel Efficiency (index, 1999=1.000)................................0.990 1.052 1.029 1.013 0.986 1.031 1.026 1.018 0.991 1.035 1.041 0.995 1.021 1.016 1.016 Real Vehicle Fuel Cost (cents per mile) ................................................................4.11 4.33 3.96 3.33 3.32 3.76 3.77 3.77 3.93 3.82 3.65 3.64 3.93 3.66 3.76 Air Travel Capacity (mill. available ton-miles/day)................................488.9 495.6 476.6 430.2 432.0 437.1 439.6 448.9 448.5 456.2 472.6 476.4 472.7 439.4 463.5 Aircraft Utilization (mill. revenue ton-miles/day)................................263.7 282.8 265.9 225.3 235.7 255.7 266.5 259.1 245.0 276.8 291.2 264.9 259.4 254.4 269.6 Airline Ticket Price Index (index, 1982-1984=1.000)................................2.399 2.408 2.452 2.318 2.317 2.377 2.334 2.279 2.423 2.492 2.525 2.542 2.394 2.327 2.495 Raw Steel Production (million tons)................................................................25.53 26.07 25.25 22.05 23.92 25.03 25.72 22.67 23.07 24.65 24.66 23.76 98.89 97.34 96.14
aMacroeconomic projections from DRI-WEFA model forecasts are seasonally adjusted at annual rates and modified as appropriate to the base world oil price case. bIncludes all highway travel. SAAR: Seasonally -adjusted annualized rate. Note: Historical data are printed in bold; forecas ts are in italics
Energy Information Administration/Short-Term Energy Outlook -- December 2002 4
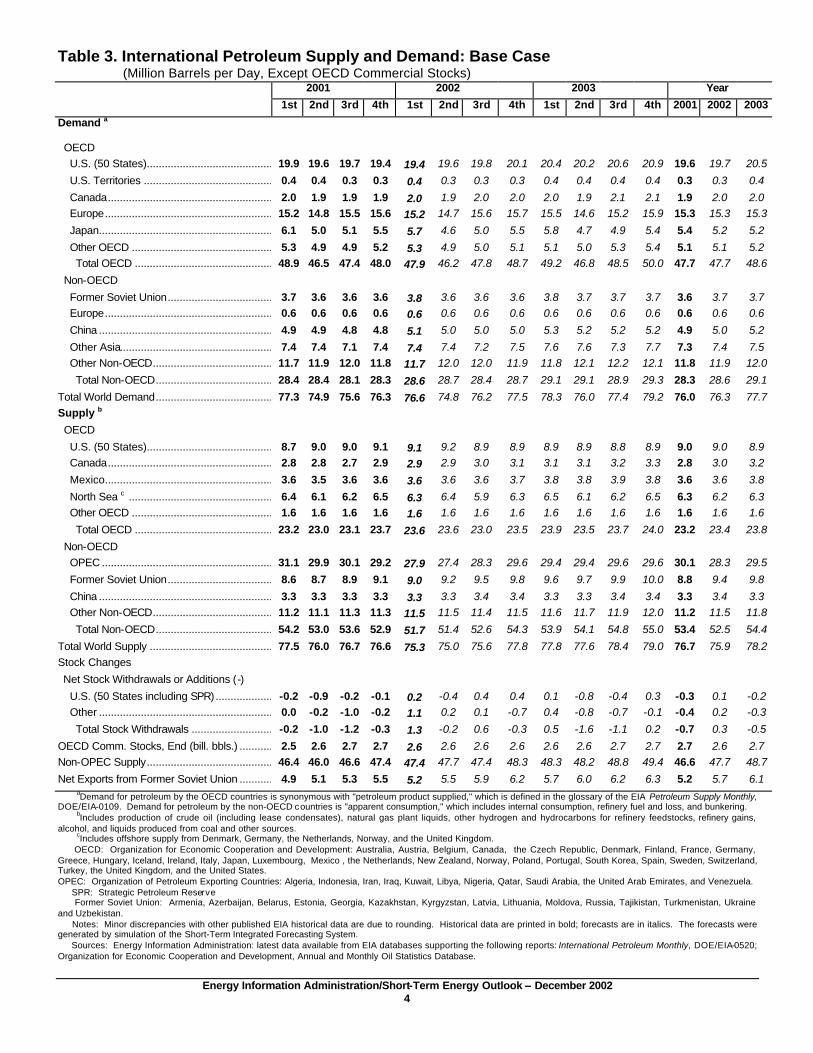
Table 3. International Petroleum Supply and Demand: Base Case (Million Barrels per Day, Except OECD Commercial Stocks)
2001 2002 2003 Year
1st 2nd 3rd 4th 1st 2nd 3rd 4th 1st 2nd 3rd 4th 2001 2002 2003
Demand a
OECD U.S. (50 States)................................................................19.9 19.6 19.7 19.4 19.4 19.6 19.8 20.1 20.4 20.2 20.6 20.9 19.6 19.7 20.5
U.S. Territories ................................................................0.4 0.4 0.3 0.3 0.4 0.3 0.3 0.3 0.4 0.4 0.4 0.4 0.3 0.3 0.4
Canada................................................................2.0 1.9 1.9 1.9 2.0 1.9 2.0 2.0 2.0 1.9 2.1 2.1 1.9 2.0 2.0 Europe................................................................15.2 14.8 15.5 15.6 15.2 14.7 15.6 15.7 15.5 14.6 15.2 15.9 15.3 15.3 15.3
Japan................................................................6.1 5.0 5.1 5.5 5.7 4.6 5.0 5.5 5.8 4.7 4.9 5.4 5.4 5.2 5.2
Other OECD ................................................................5.3 4.9 4.9 5.2 5.3 4.9 5.0 5.1 5.1 5.0 5.3 5.4 5.1 5.1 5.2 Total OECD ................................................................48.9 46.5 47.4 48.0 47.9 46.2 47.8 48.7 49.2 46.8 48.5 50.0 47.7 47.7 48.6
Non-OECD
Former Soviet Union................................................................3.7 3.6 3.6 3.6 3.8 3.6 3.6 3.6 3.8 3.7 3.7 3.7 3.6 3.7 3.7 Europe................................................................0.6 0.6 0.6 0.6 0.6 0.6 0.6 0.6 0.6 0.6 0.6 0.6 0.6 0.6 0.6
China ................................................................4.9 4.9 4.8 4.8 5.1 5.0 5.0 5.0 5.3 5.2 5.2 5.2 4.9 5.0 5.2
Other Asia................................................................7.4 7.4 7.1 7.4 7.4 7.4 7.2 7.5 7.6 7.6 7.3 7.7 7.3 7.4 7.5 Other Non-OECD................................................................11.7 11.9 12.0 11.8 11.7 12.0 12.0 11.9 11.8 12.1 12.2 12.1 11.8 11.9 12.0
Total Non-OECD................................................................28.4 28.4 28.1 28.3 28.6 28.7 28.4 28.7 29.1 29.1 28.9 29.3 28.3 28.6 29.1
Total World Demand................................................................77.3 74.9 75.6 76.3 76.6 74.8 76.2 77.5 78.3 76.0 77.4 79.2 76.0 76.3 77.7 Supply b
OECD
U.S. (50 States)................................................................8.7 9.0 9.0 9.1 9.1 9.2 8.9 8.9 8.9 8.9 8.8 8.9 9.0 9.0 8.9 Canada................................................................2.8 2.8 2.7 2.9 2.9 2.9 3.0 3.1 3.1 3.1 3.2 3.3 2.8 3.0 3.2
Mexico................................................................3.6 3.5 3.6 3.6 3.6 3.6 3.6 3.7 3.8 3.8 3.9 3.8 3.6 3.6 3.8
North Sea c ................................................................6.4 6.1 6.2 6.5 6.3 6.4 5.9 6.3 6.5 6.1 6.2 6.5 6.3 6.2 6.3 Other OECD ................................................................1.6 1.6 1.6 1.6 1.6 1.6 1.6 1.6 1.6 1.6 1.6 1.6 1.6 1.6 1.6
Total OECD ................................................................23.2 23.0 23.1 23.7 23.6 23.6 23.0 23.5 23.9 23.5 23.7 24.0 23.2 23.4 23.8
Non-OECD OPEC ................................................................31.1 29.9 30.1 29.2 27.9 27.4 28.3 29.6 29.4 29.4 29.6 29.6 30.1 28.3 29.5
Former Soviet Union................................................................8.6 8.7 8.9 9.1 9.0 9.2 9.5 9.8 9.6 9.7 9.9 10.0 8.8 9.4 9.8
China ................................................................3.3 3.3 3.3 3.3 3.3 3.3 3.4 3.4 3.3 3.3 3.4 3.4 3.3 3.4 3.3 Other Non-OECD................................................................11.2 11.1 11.3 11.3 11.5 11.5 11.4 11.5 11.6 11.7 11.9 12.0 11.2 11.5 11.8
Total Non-OECD................................................................54.2 53.0 53.6 52.9 51.7 51.4 52.6 54.3 53.9 54.1 54.8 55.0 53.4 52.5 54.4
Total World Supply ................................................................77.5 76.0 76.7 76.6 75.3 75.0 75.6 77.8 77.8 77.6 78.4 79.0 76.7 75.9 78.2 Stock Changes
Net Stock Withdrawals or Additions (-)
U.S. (50 States including SPR)................................-0.2 -0.9 -0.2 -0.1 0.2 -0.4 0.4 0.4 0.1 -0.8 -0.4 0.3 -0.3 0.1 -0.2 Other ................................................................0.0 -0.2 -1.0 -0.2 1.1 0.2 0.1 -0.7 0.4 -0.8 -0.7 -0.1 -0.4 0.2 -0.3
Total Stock Withdrawals ................................-0.2 -1.0 -1.2 -0.3 1.3 -0.2 0.6 -0.3 0.5 -1.6 -1.1 0.2 -0.7 0.3 -0.5
OECD Comm. Stocks, End (bill. bbls.) ................................2.5 2.6 2.7 2.7 2.6 2.6 2.6 2.6 2.6 2.6 2.7 2.7 2.7 2.6 2.7 Non-OPEC Supply................................................................46.4 46.0 46.6 47.4 47.4 47.7 47.4 48.3 48.3 48.2 48.8 49.4 46.6 47.7 48.7
Net Exports from Former Soviet Union ................................4.9 5.1 5.3 5.5 5.2 5.5 5.9 6.2 5.7 6.0 6.2 6.3 5.2 5.7 6.1 aDemand for petroleum by the OECD countries is synonymous with "petroleum product supplied," which is defined in the glossary of the EIA Petroleum Supply Monthly,
DOE/EIA-0109. Demand for petroleum by the non-OECD countries is "apparent consumption," which includes internal consumption, refinery fuel and loss, and bunkering. bIncludes production of crude oil (including lease condensates), natural gas plant liquids, other hydrogen and hydrocarbons for refinery feedstocks, refinery gains, alcohol, and liquids produced from coal and other sources. cIncludes offshore supply from Denmark, Germany, the Netherlands, Norway, and the United Kingdom. OECD: Organization for Economic Cooperation and Development: Australia, Austria, Belgium, Canada, the Czech Republic, Denmark, Finland, France, Germany, Greece, Hungary, Iceland, Ireland, Italy, Japan, Luxembourg, Mexico , the Netherlands, New Zealand, Norway, Poland, Portugal, South Korea, Spain, Sweden, Switzerland, Turkey, the United Kingdom, and the United States. OPEC: Organization of Petroleum Exporting Countries: Algeria, Indonesia, Iran, Iraq, Kuwait, Libya, Nigeria, Qatar, Saudi Arabia, the United Arab Emirates, and Venezuela. SPR: Strategic Petroleum Reserve Former Soviet Union: Armenia, Azerbaijan, Belarus, Estonia, Georgia, Kazakhstan, Kyrgyzstan, Latvia, Lithuania, Moldova, Russia, Tajikistan, Turkmenistan, Ukraine and Uzbekistan. Notes: Minor discrepancies with other published EIA historical data are due to rounding. Historical data are printed in bold; forecasts are in italics. The forecasts were generated by simulation of the Short-Term Integrated Forecasting System. Sources: Energy Information Administration: latest data available from EIA databases supporting the following reports: International Petroleum Monthly, DOE/EIA-0520; Organization for Economic Cooperation and Development, Annual and Monthly Oil Statistics Database.
Energy Information Administration/Short-Term Energy Outlook -- December 2002 5
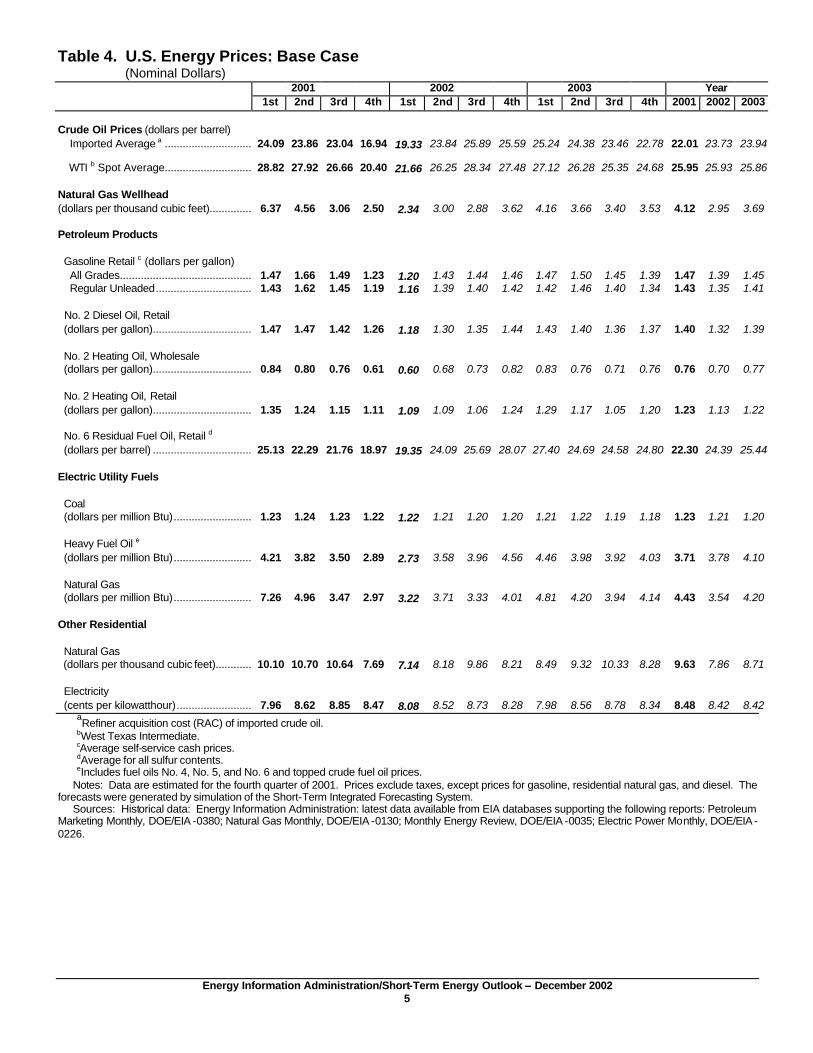
Table 4. U.S. Energy Prices: Base Case (Nominal Dollars)
2001 2002 2003 Year 1st 2nd 3rd 4th 1st 2nd 3rd 4th 1st 2nd 3rd 4th 2001 2002 2003
Crude Oil Prices (dollars per barrel) Imported Average a ................................
24.09 23.86 23.04 16.94 19.33 23.84 25.89 25.59 25.24 24.38 23.46 22.78 22.01 23.73 23.94
WTI b Spot Average................................28.82 27.92 26.66 20.40 21.66 26.25 28.34 27.48 27.12 26.28 25.35 24.68 25.95 25.93 25.86
Natural Gas Wellhead (dollars per thousand cubic feet)................................6.37 4.56 3.06 2.50 2.34 3.00 2.88 3.62 4.16 3.66 3.40 3.53 4.12 2.95 3.69
Petroleum Products
Gasoline Retail c (dollars per gallon) All Grades................................................................1.47 1.66 1.49 1.23 1.20 1.43 1.44 1.46 1.47 1.50 1.45 1.39 1.47 1.39 1.45 Regular Unleaded................................ 1.43 1.62 1.45 1.19 1.16 1.39 1.40 1.42 1.42 1.46 1.40 1.34 1.43 1.35 1.41
No. 2 Diesel Oil, Retail (dollars per gallon)................................................................1.47 1.47 1.42 1.26 1.18 1.30 1.35 1.44 1.43 1.40 1.36 1.37 1.40 1.32 1.39
No. 2 Heating Oil, Wholesale (dollars per gallon)................................................................0.84 0.80 0.76 0.61 0.60 0.68 0.73 0.82 0.83 0.76 0.71 0.76 0.76 0.70 0.77
No. 2 Heating Oil, Retail (dollars per gallon)................................................................1.35 1.24 1.15 1.11 1.09 1.09 1.06 1.24 1.29 1.17 1.05 1.20 1.23 1.13 1.22
No. 6 Residual Fuel Oil, Retail d (dollars per barrel) ................................................................25.13 22.29 21.76 18.97 19.35 24.09 25.69 28.07 27.40 24.69 24.58 24.80 22.30 24.39 25.44
Electric Utility Fuels
Coal (dollars per million Btu)................................1.23 1.24 1.23 1.22 1.22 1.21 1.20 1.20 1.21 1.22 1.19 1.18 1.23 1.21 1.20
Heavy Fuel Oil e (dollars per million Btu)................................4.21 3.82 3.50 2.89 2.73 3.58 3.96 4.56 4.46 3.98 3.92 4.03 3.71 3.78 4.10
Natural Gas (dollars per million Btu)................................7.26 4.96 3.47 2.97 3.22 3.71 3.33 4.01 4.81 4.20 3.94 4.14 4.43 3.54 4.20
Other Residential
Natural Gas (dollars per thousand cubic feet)................................10.10 10.70 10.64 7.69 7.14 8.18 9.86 8.21 8.49 9.32 10.33 8.28 9.63 7.86 8.71
Electricity (cents per kilowatthour)................................7.96 8.62 8.85 8.47 8.08 8.52 8.73 8.28 7.98 8.56 8.78 8.34 8.48 8.42 8.42
aRefiner acquisition cost (RAC) of imported crude oil.
bWest Texas Intermediate. cAverage self-service cash prices. dAverage for all sulfur contents. eIncludes fuel oils No. 4, No. 5, and No. 6 and topped crude fuel oil prices. Notes: Data are estimated for the fourth quarter of 2001. Prices exclude taxes, except prices for gasoline, residential natural gas, and diesel. The forecasts were generated by simulation of the Short-Term Integrated Forecasting System. Sources: Historical data: Energy Information Administration: latest data available from EIA databases supporting the following reports: Petroleum Marketing Monthly, DOE/EIA -0380; Natural Gas Monthly, DOE/EIA -0130; Monthly Energy Review, DOE/EIA -0035; Electric Power Monthly, DOE/EIA -0226.
Energy Information Administration/Short-Term Energy Outlook -- December 2002 6
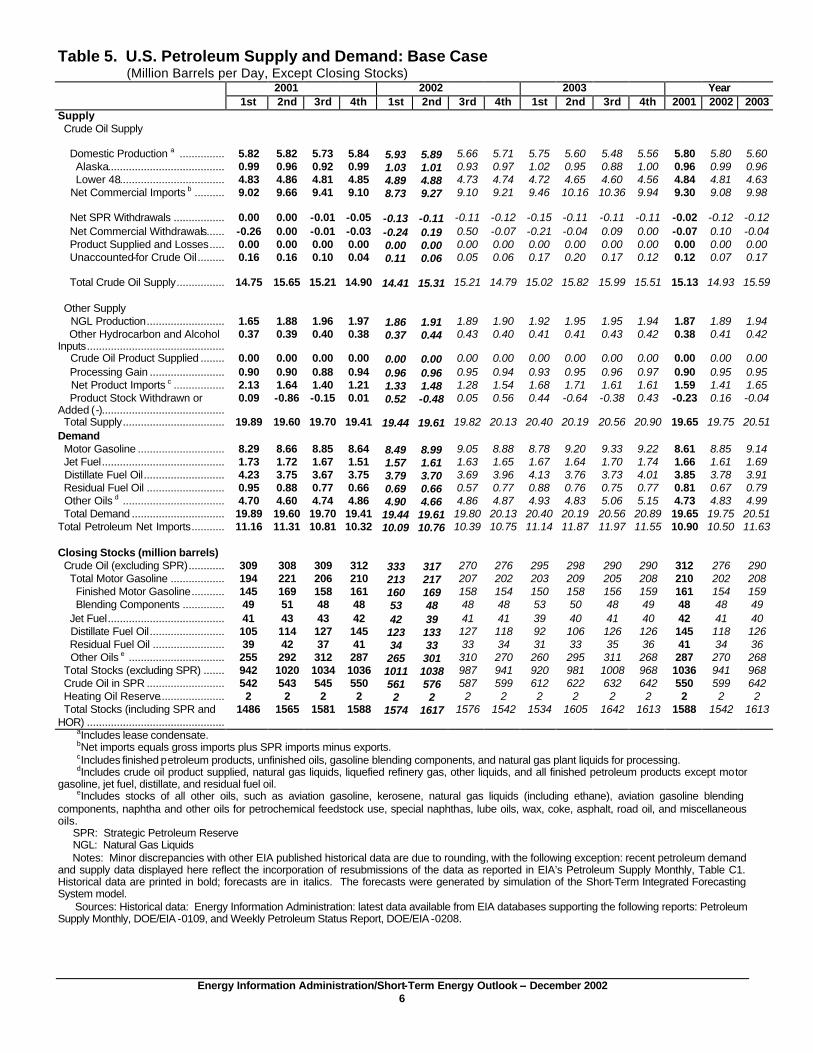
Table 5. U.S. Petroleum Supply and Demand: Base Case (Million Barrels per Day, Except Closing Stocks)
2001 2002 2003 Year 1st 2nd 3rd 4th 1st 2nd 3rd 4th 1st 2nd 3rd 4th 2001 2002 2003
Supply Crude Oil Supply
Domestic Production a .......................5.82 5.82 5.73 5.84 5.93 5.89 5.66 5.71 5.75 5.60 5.48 5.56 5.80 5.80 5.60 Alaska...............................................0.99 0.96 0.92 0.99 1.03 1.01 0.93 0.97 1.02 0.95 0.88 1.00 0.96 0.99 0.96 Lower 48...........................................4.83 4.86 4.81 4.85 4.89 4.88 4.73 4.74 4.72 4.65 4.60 4.56 4.84 4.81 4.63 Net Commercial Imports b ..................9.02 9.66 9.41 9.10 8.73 9.27 9.10 9.21 9.46 10.16 10.36 9.94 9.30 9.08 9.98 Net SPR Withdrawals .........................0.00 0.00 -0.01 -0.05 -0.13 -0.11 -0.11 -0.12 -0.15 -0.11 -0.11 -0.11 -0.02 -0.12 -0.12 Net Commercial Withdrawals..............-0.26 0.00 -0.01 -0.03 -0.24 0.19 0.50 -0.07 -0.21 -0.04 0.09 0.00 -0.07 0.10 -0.04 Product Supplied and Losses.............0.00 0.00 0.00 0.00 0.00 0.00 0.00 0.00 0.00 0.00 0.00 0.00 0.00 0.00 0.00 Unaccounted-for Crude Oil.................0.16 0.16 0.10 0.04 0.11 0.06 0.05 0.06 0.17 0.20 0.17 0.12 0.12 0.07 0.17
Total Crude Oil Supply........................14.75 15.65 15.21 14.90 14.41 15.31 15.21 14.79 15.02 15.82 15.99 15.51 15.13 14.93 15.59
Other Supply NGL Production................................1.65 1.88 1.96 1.97 1.86 1.91 1.89 1.90 1.92 1.95 1.95 1.94 1.87 1.89 1.94 Other Hydrocarbon and Alcohol Inputs......................................................
0.37 0.39 0.40 0.38 0.37 0.44 0.43 0.40 0.41 0.41 0.43 0.42 0.38 0.41 0.42
Crude Oil Product Supplied ................0.00 0.00 0.00 0.00 0.00 0.00 0.00 0.00 0.00 0.00 0.00 0.00 0.00 0.00 0.00 Processing Gain ................................0.90 0.90 0.88 0.94 0.96 0.96 0.95 0.94 0.93 0.95 0.96 0.97 0.90 0.95 0.95 Net Product Imports c .........................2.13 1.64 1.40 1.21 1.33 1.48 1.28 1.54 1.68 1.71 1.61 1.61 1.59 1.41 1.65 Product Stock Withdrawn or Added (-).................................................
0.09 -0.86 -0.15 0.01 0.52 -0.48 0.05 0.56 0.44 -0.64 -0.38 0.43 -0.23 0.16 -0.04
Total Supply..........................................19.89 19.60 19.70 19.41 19.44 19.61 19.82 20.13 20.40 20.19 20.56 20.90 19.65 19.75 20.51 Demand Motor Gasoline ................................ 8.29 8.66 8.85 8.64 8.49 8.99 9.05 8.88 8.78 9.20 9.33 9.22 8.61 8.85 9.14 Jet Fuel.................................................1.73 1.72 1.67 1.51 1.57 1.61 1.63 1.65 1.67 1.64 1.70 1.74 1.66 1.61 1.69 Distillate Fuel Oil................................4.23 3.75 3.67 3.75 3.79 3.70 3.69 3.96 4.13 3.76 3.73 4.01 3.85 3.78 3.91 Residual Fuel Oil ................................0.95 0.88 0.77 0.66 0.69 0.66 0.57 0.77 0.88 0.76 0.75 0.77 0.81 0.67 0.79 Other Oils d ..........................................4.70 4.60 4.74 4.86 4.90 4.66 4.86 4.87 4.93 4.83 5.06 5.15 4.73 4.83 4.99 Total Demand ................................ 19.89 19.60 19.70 19.41 19.44 19.61 19.80 20.13 20.40 20.19 20.56 20.89 19.65 19.75 20.51 Total Petroleum Net Imports...................11.16 11.31 10.81 10.32 10.09 10.76 10.39 10.75 11.14 11.87 11.97 11.55 10.90 10.50 11.63
Closing Stocks (million barrels) Crude Oil (excluding SPR)....................309 308 309 312 333 317 270 276 295 298 290 290 312 276 290 Total Motor Gasoline ..........................194 221 206 210 213 217 207 202 203 209 205 208 210 202 208 Finished Motor Gasoline...................145 169 158 161 160 169 158 154 150 158 156 159 161 154 159 Blending Components ......................49 51 48 48 53 48 48 48 53 50 48 49 48 48 49 Jet Fuel...............................................41 43 43 42 42 39 41 41 39 40 41 40 42 41 40 Distillate Fuel Oil................................105 114 127 145 123 133 127 118 92 106 126 126 145 118 126 Residual Fuel Oil ................................39 42 37 41 34 33 33 34 31 33 35 36 41 34 36 Other Oils e ........................................255 292 312 287 265 301 310 270 260 295 311 268 287 270 268 Total Stocks (excluding SPR) ...............942 1020 1034 1036 1011 1038 987 941 920 981 1008 968 1036 941 968 Crude Oil in SPR ................................542 543 545 550 561 576 587 599 612 622 632 642 550 599 642 Heating Oil Reserve..............................2 2 2 2 2 2 2 2 2 2 2 2 2 2 2 Total Stocks (including SPR and HOR) ......................................................
1486 1565 1581 1588 1574 1617 1576 1542 1534 1605 1642 1613 1588 1542 1613
aIncludes lease condensate. bNet imports equals gross imports plus SPR imports minus exports. cIncludes finished petroleum products, unfinished oils, gasoline blending components, and natural gas plant liquids for processing. dIncludes crude oil product supplied, natural gas liquids, liquefied refinery gas, other liquids, and all finished petroleum products except motor gasoline, jet fuel, distillate, and residual fuel oil. eIncludes stocks of all other oils, such as aviation gasoline, kerosene, natural gas liquids (including ethane), aviation gasoline blending components, naphtha and other oils for petrochemical feedstock use, special naphthas, lube oils, wax, coke, asphalt, road oil, and miscellaneous oils. SPR: Strategic Petroleum Reserve NGL: Natural Gas Liquids Notes: Minor discrepancies with other EIA published historical data are due to rounding, with the following exception: recent petroleum demand and supply data displayed here reflect the incorporation of resubmissions of the data as reported in EIA’s Petroleum Supply Monthly, Table C1. Historical data are printed in bold; forecasts are in italics. The forecasts were generated by simulation of the Short-Term Integrated Forecasting System model. Sources: Historical data: Energy Information Administration: latest data available from EIA databases supporting the following reports: Petroleum Supply Monthly, DOE/EIA -0109, and Weekly Petroleum Status Report, DOE/EIA -0208.
Energy Information Administration/Short-Term Energy Outlook -- December 2002 7
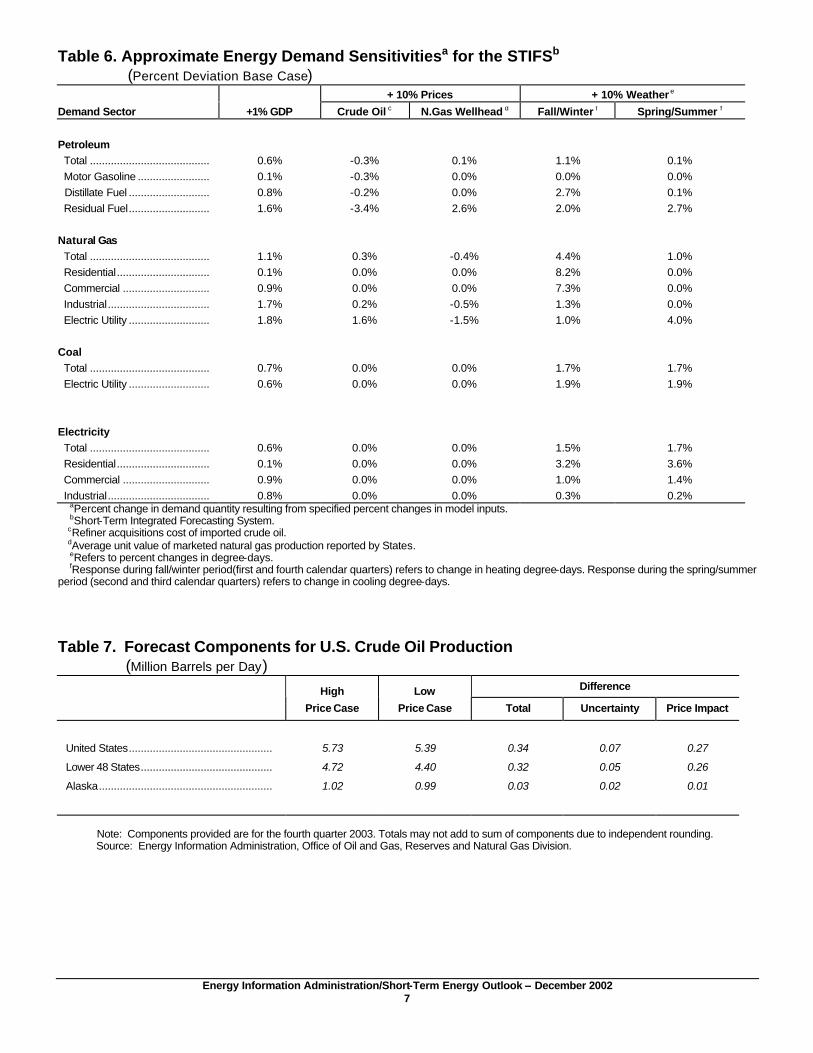
Table 6. Approximate Energy Demand Sensitivitiesa for the STIFSb (Percent Deviation Base Case)
+ 10% Prices + 10% Weather e
Demand Sector +1% GDP Crude Oil c N.Gas Wellhead d Fall/Winter f Spring/Summer f
Petroleum Total ........................................ 0.6% -0.3% 0.1% 1.1% 0.1% Motor Gasoline ........................ 0.1% -0.3% 0.0% 0.0% 0.0% Distillate Fuel ........................... 0.8% -0.2% 0.0% 2.7% 0.1% Residual Fuel........................... 1.6% -3.4% 2.6% 2.0% 2.7%
Natural Gas Total ........................................ 1.1% 0.3% -0.4% 4.4% 1.0% Residential............................... 0.1% 0.0% 0.0% 8.2% 0.0% Commercial ............................. 0.9% 0.0% 0.0% 7.3% 0.0% Industrial.................................. 1.7% 0.2% -0.5% 1.3% 0.0% Electric Utility ........................... 1.8% 1.6% -1.5% 1.0% 4.0%
Coal Total ........................................ 0.7% 0.0% 0.0% 1.7% 1.7% Electric Utility ........................... 0.6% 0.0% 0.0% 1.9% 1.9%
Electricity Total ........................................ 0.6% 0.0% 0.0% 1.5% 1.7% Residential............................... 0.1% 0.0% 0.0% 3.2% 3.6% Commercial ............................. 0.9% 0.0% 0.0% 1.0% 1.4% Industrial.................................. 0.8% 0.0% 0.0% 0.3% 0.2%
aPercent change in demand quantity resulting from specified percent changes in model inputs. bShort-Term Integrated Forecasting System. cRefiner acquisitions cost of imported crude oil. dAverage unit value of marketed natural gas production reported by States. eRefers to percent changes in degree-days. fResponse during fall/winter period(first and fourth calendar quarters) refers to change in heating degree-days. Response during the spring/summer period (second and third calendar quarters) refers to change in cooling degree-days.
Table 7. Forecast Components for U.S. Crude Oil Production (Million Barrels per Day)
Difference
High
Price Case
Low
Price Case Total Uncertainty Price Impact
United States................................................ 5.73 5.39 0.34 0.07 0.27
Lower 48 States............................................ 4.72 4.40 0.32 0.05 0.26
Alaska.......................................................... 1.02 0.99 0.03 0.02 0.01
Note: Components provided are for the fourth quarter 2003. Totals may not add to sum of components due to independent rounding. Source: Energy Information Administration, Office of Oil and Gas, Reserves and Natural Gas Division.
Energy Information Administration/Short-Term Energy Outlook -- December 2002 8
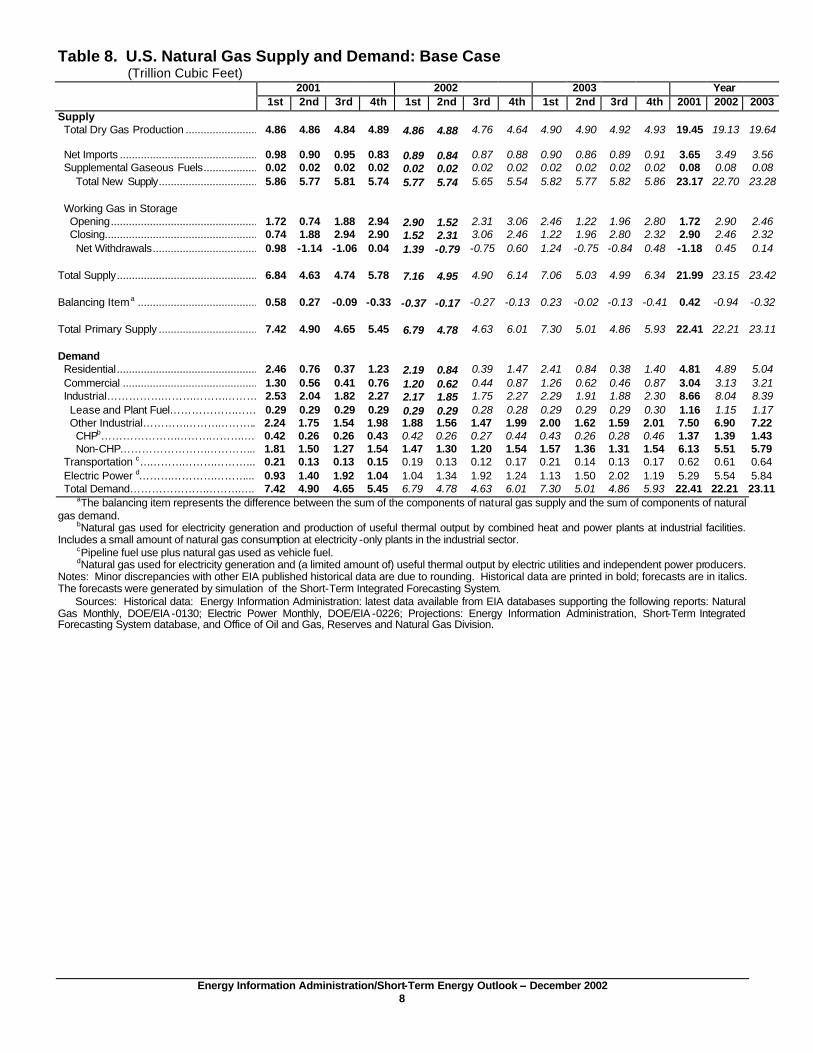
Table 8. U.S. Natural Gas Supply and Demand: Base Case (Trillion Cubic Feet)
2001 2002 2003 Year 1st 2nd 3rd 4th 1st 2nd 3rd 4th 1st 2nd 3rd 4th 2001 2002 2003
Supply Total Dry Gas Production ................................
4.86 4.86 4.84 4.89 4.86 4.88 4.76 4.64 4.90 4.90 4.92 4.93 19.45 19.13 19.64
Net Imports ................................................................0.98 0.90 0.95 0.83 0.89 0.84 0.87 0.88 0.90 0.86 0.89 0.91 3.65 3.49 3.56 Supplemental Gaseous Fuels................................0.02 0.02 0.02 0.02 0.02 0.02 0.02 0.02 0.02 0.02 0.02 0.02 0.08 0.08 0.08 Total New Supply................................................................5.86 5.77 5.81 5.74 5.77 5.74 5.65 5.54 5.82 5.77 5.82 5.86 23.17 22.70 23.28
Working Gas in Storage Opening................................................................1.72 0.74 1.88 2.94 2.90 1.52 2.31 3.06 2.46 1.22 1.96 2.80 1.72 2.90 2.46 Closing................................................................0.74 1.88 2.94 2.90 1.52 2.31 3.06 2.46 1.22 1.96 2.80 2.32 2.90 2.46 2.32 Net Withdrawals................................................................0.98 -1.14 -1.06 0.04 1.39 -0.79 -0.75 0.60 1.24 -0.75 -0.84 0.48 -1.18 0.45 0.14
Total Supply................................................................6.84 4.63 4.74 5.78 7.16 4.95 4.90 6.14 7.06 5.03 4.99 6.34 21.99 23.15 23.42
Balancing Item a ................................................................0.58 0.27 -0.09 -0.33 -0.37 -0.17 -0.27 -0.13 0.23 -0.02 -0.13 -0.41 0.42 -0.94 -0.32
Total Primary Supply ................................................................7.42 4.90 4.65 5.45 6.79 4.78 4.63 6.01 7.30 5.01 4.86 5.93 22.41 22.21 23.11
Demand Residential................................................................2.46 0.76 0.37 1.23 2.19 0.84 0.39 1.47 2.41 0.84 0.38 1.40 4.81 4.89 5.04 Commercial ................................................................1.30 0.56 0.41 0.76 1.20 0.62 0.44 0.87 1.26 0.62 0.46 0.87 3.04 3.13 3.21 Industrial…………………………………… 2.53 2.04 1.82 2.27 2.17 1.85 1.75 2.27 2.29 1.91 1.88 2.30 8.66 8.04 8.39 Lease and Plant Fuel…………………… 0.29 0.29 0.29 0.29 0.29 0.29 0.28 0.28 0.29 0.29 0.29 0.30 1.16 1.15 1.17 Other Industrial………………………….. 2.24 1.75 1.54 1.98 1.88 1.56 1.47 1.99 2.00 1.62 1.59 2.01 7.50 6.90 7.22 CHPb……………………………………. 0.42 0.26 0.26 0.43 0.42 0.26 0.27 0.44 0.43 0.26 0.28 0.46 1.37 1.39 1.43 Non-CHP……………………………….. 1.81 1.50 1.27 1.54 1.47 1.30 1.20 1.54 1.57 1.36 1.31 1.54 6.13 5.51 5.79 Transportation c…………………………... 0.21 0.13 0.13 0.15 0.19 0.13 0.12 0.17 0.21 0.14 0.13 0.17 0.62 0.61 0.64 Electric Power d…………………………... 0.93 1.40 1.92 1.04 1.04 1.34 1.92 1.24 1.13 1.50 2.02 1.19 5.29 5.54 5.84 Total Demand…………………………….. 7.42 4.90 4.65 5.45 6.79 4.78 4.63 6.01 7.30 5.01 4.86 5.93 22.41 22.21 23.11
aThe balancing item represents the difference between the sum of the components of natural gas supply and the sum of components of natural gas demand.
bNatural gas used for electricity generation and production of useful thermal output by combined heat and power plants at industrial facilities. Includes a small amount of natural gas consumption at electricity -only plants in the industrial sector.
cPipeline fuel use plus natural gas used as vehicle fuel. dNatural gas used for electricity generation and (a limited amount of) useful thermal output by electric utilities and independent power producers.
Notes: Minor discrepancies with other EIA published historical data are due to rounding. Historical data are printed in bold; forecasts are in italics. The forecasts were generated by simulation of the Short-Term Integrated Forecasting System. Sources: Historical data: Energy Information Administration: latest data available from EIA databases supporting the following reports: Natural Gas Monthly, DOE/EIA -0130; Electric Power Monthly, DOE/EIA -0226; Projections: Energy Information Administration, Short-Term Integrated Forecasting System database, and Office of Oil and Gas, Reserves and Natural Gas Division.
Energy Information Administration/Short-Term Energy Outlook -- December 2002 9
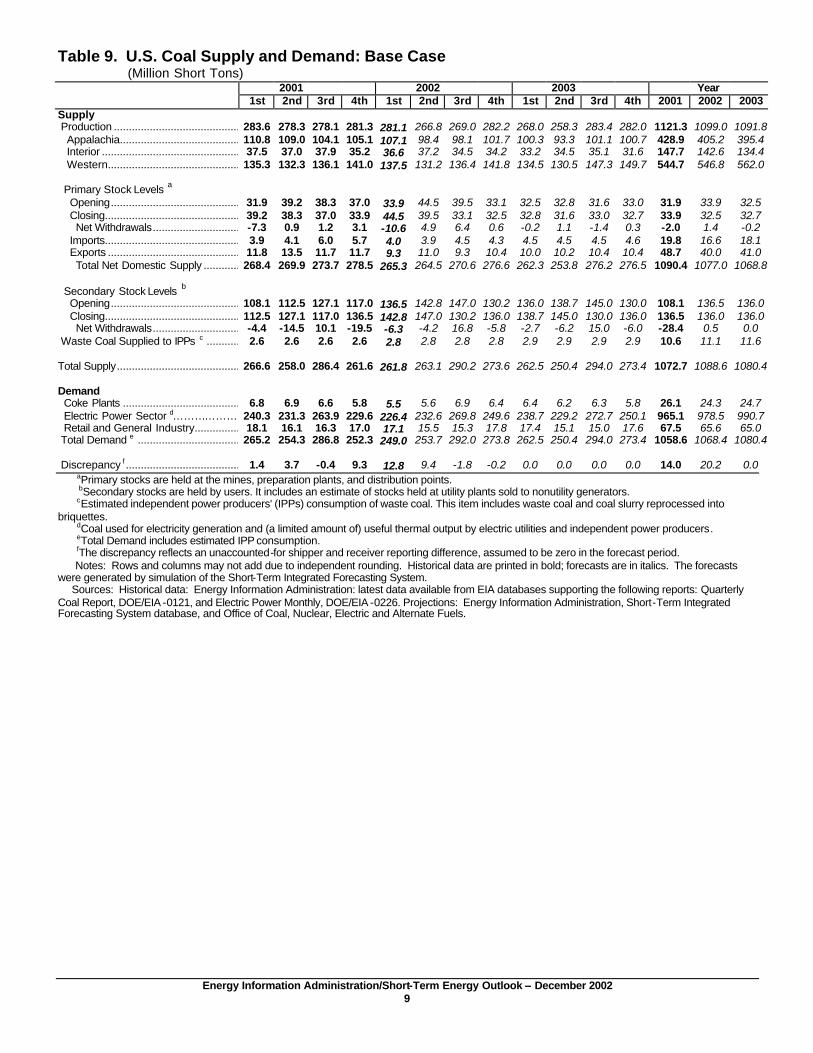
Table 9. U.S. Coal Supply and Demand: Base Case (Million Short Tons)
2001 2002 2003 Year 1st 2nd 3rd 4th 1st 2nd 3rd 4th 1st 2nd 3rd 4th 2001 2002 2003
Supply Production ..................................................283.6 278.3 278.1 281.3 281.1 266.8 269.0 282.2 268.0 258.3 283.4 282.0 1121.3 1099.0 1091.8 Appalachia................................................110.8 109.0 104.1 105.1 107.1 98.4 98.1 101.7 100.3 93.3 101.1 100.7 428.9 405.2 395.4 Interior ......................................................37.5 37.0 37.9 35.2 36.6 37.2 34.5 34.2 33.2 34.5 35.1 31.6 147.7 142.6 134.4 Western....................................................135.3 132.3 136.1 141.0 137.5 131.2 136.4 141.8 134.5 130.5 147.3 149.7 544.7 546.8 562.0
Primary Stock Levels a Opening...................................................31.9 39.2 38.3 37.0 33.9 44.5 39.5 33.1 32.5 32.8 31.6 33.0 31.9 33.9 32.5 Closing.....................................................39.2 38.3 37.0 33.9 44.5 39.5 33.1 32.5 32.8 31.6 33.0 32.7 33.9 32.5 32.7 Net Withdrawals................................-7.3 0.9 1.2 3.1 -10.6 4.9 6.4 0.6 -0.2 1.1 -1.4 0.3 -2.0 1.4 -0.2 Imports.....................................................3.9 4.1 6.0 5.7 4.0 3.9 4.5 4.3 4.5 4.5 4.5 4.6 19.8 16.6 18.1 Exports ....................................................11.8 13.5 11.7 11.7 9.3 11.0 9.3 10.4 10.0 10.2 10.4 10.4 48.7 40.0 41.0 Total Net Domestic Supply ....................268.4 269.9 273.7 278.5 265.3 264.5 270.6 276.6 262.3 253.8 276.2 276.5 1090.4 1077.0 1068.8
Secondary Stock Levels b Opening...................................................108.1 112.5 127.1 117.0 136.5 142.8 147.0 130.2 136.0 138.7 145.0 130.0 108.1 136.5 136.0 Closing.....................................................112.5 127.1 117.0 136.5 142.8 147.0 130.2 136.0 138.7 145.0 130.0 136.0 136.5 136.0 136.0 Net Withdrawals................................-4.4 -14.5 10.1 -19.5 -6.3 -4.2 16.8 -5.8 -2.7 -6.2 15.0 -6.0 -28.4 0.5 0.0 Waste Coal Supplied to IPPs c ...................2.6 2.6 2.6 2.6 2.8 2.8 2.8 2.8 2.9 2.9 2.9 2.9 10.6 11.1 11.6
Total Supply.................................................266.6 258.0 286.4 261.6 261.8 263.1 290.2 273.6 262.5 250.4 294.0 273.4 1072.7 1088.6 1080.4
Demand Coke Plants ...............................................6.8 6.9 6.6 5.8 5.5 5.6 6.9 6.4 6.4 6.2 6.3 5.8 26.1 24.3 24.7 Electric Power Sector d………………. 240.3 231.3 263.9 229.6 226.4 232.6 269.8 249.6 238.7 229.2 272.7 250.1 965.1 978.5 990.7 Retail and General Industry.......................18.1 16.1 16.3 17.0 17.1 15.5 15.3 17.8 17.4 15.1 15.0 17.6 67.5 65.6 65.0 Total Demand e ..........................................265.2 254.3 286.8 252.3 249.0 253.7 292.0 273.8 262.5 250.4 294.0 273.4 1058.6 1068.4 1080.4 Discrepancy f ..............................................1.4 3.7 -0.4 9.3 12.8 9.4 -1.8 -0.2 0.0 0.0 0.0 0.0 14.0 20.2 0.0
aPrimary stocks are held at the mines, preparation plants, and distribution points. bSecondary stocks are held by users. It includes an estimate of stocks held at utility plants sold to nonutility generators. cEstimated independent power producers' (IPPs) consumption of waste coal. This item includes waste coal and coal slurry reprocessed into briquettes. dCoal used for electricity generation and (a limited amount of) useful thermal output by electric utilities and independent power producers. eTotal Demand includes estimated IPP consumption. fThe discrepancy reflects an unaccounted-for shipper and receiver reporting difference, assumed to be zero in the forecast period. Notes: Rows and columns may not add due to independent rounding. Historical data are printed in bold; forecasts are in italics. The forecasts were generated by simulation of the Short-Term Integrated Forecasting System. Sources: Historical data: Energy Information Administration: latest data available from EIA databases supporting the following reports: Quarterly Coal Report, DOE/EIA -0121, and Electric Power Monthly, DOE/EIA -0226. Projections: Energy Information Administration, Short-Term Integrated Forecasting System database, and Office of Coal, Nuclear, Electric and Alternate Fuels.
Energy Information Administration/Short-Term Energy Outlook -- December 2002 10
Table 10. U.S. Electricity Supply and Demand: Base Case (Billion Kilowatt-hours)
2001 2002 2003 Year 1st 2nd 3rd 4th 1st 2nd 3rd 4th 1st 2nd 3rd 4th 2001 2002 2003
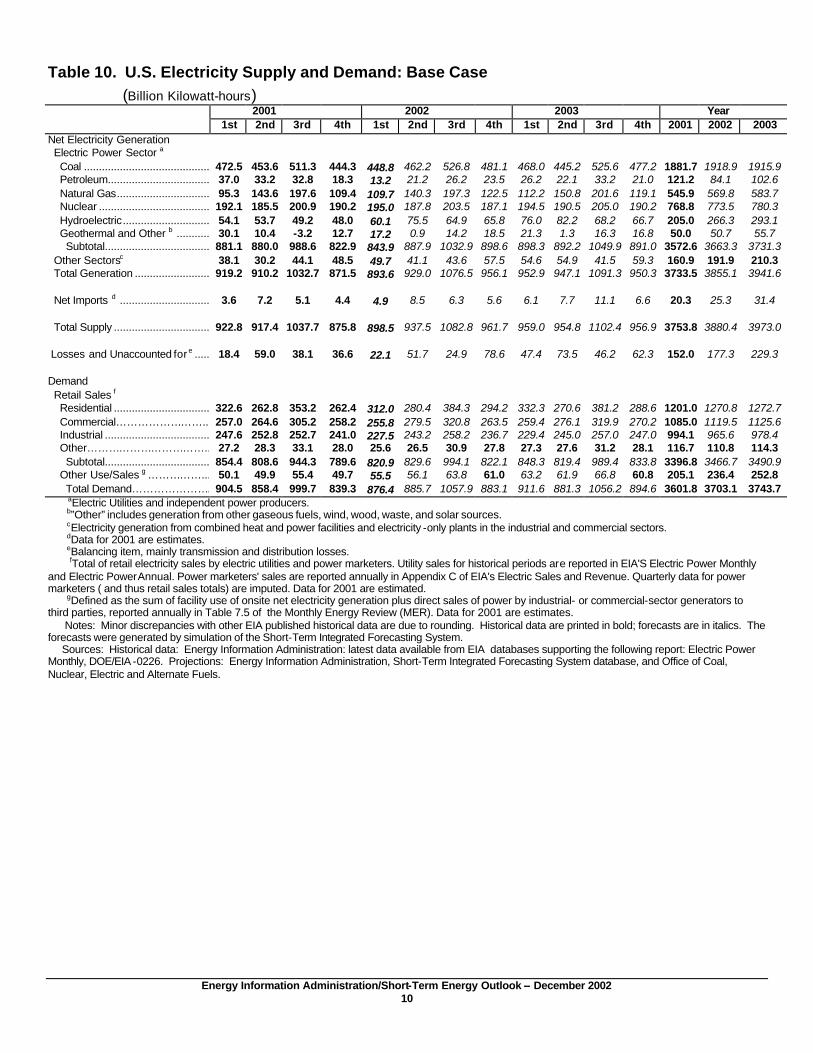
Net Electricity Generation Electric Power Sector a Coal ................................................................472.5 453.6 511.3 444.3 448.8 462.2 526.8 481.1 468.0 445.2 525.6 477.2 1881.7 1918.9 1915.9 Petroleum................................................................37.0 33.2 32.8 18.3 13.2 21.2 26.2 23.5 26.2 22.1 33.2 21.0 121.2 84.1 102.6 Natural Gas................................ 95.3 143.6 197.6 109.4 109.7 140.3 197.3 122.5 112.2 150.8 201.6 119.1 545.9 569.8 583.7 Nuclear ................................................................192.1 185.5 200.9 190.2 195.0 187.8 203.5 187.1 194.5 190.5 205.0 190.2 768.8 773.5 780.3 Hydroelectric................................54.1 53.7 49.2 48.0 60.1 75.5 64.9 65.8 76.0 82.2 68.2 66.7 205.0 266.3 293.1 Geothermal and Other b ................................30.1 10.4 -3.2 12.7 17.2 0.9 14.2 18.5 21.3 1.3 16.3 16.8 50.0 50.7 55.7 Subtotal................................................................881.1 880.0 988.6 822.9 843.9 887.9 1032.9 898.6 898.3 892.2 1049.9 891.0 3572.6 3663.3 3731.3 Other Sectorsc 38.1 30.2 44.1 48.5 49.7 41.1 43.6 57.5 54.6 54.9 41.5 59.3 160.9 191.9 210.3 Total Generation ................................919.2 910.2 1032.7 871.5 893.6 929.0 1076.5 956.1 952.9 947.1 1091.3 950.3 3733.5 3855.1 3941.6 Net Imports d ................................ 3.6 7.2 5.1 4.4 4.9 8.5 6.3 5.6 6.1 7.7 11.1 6.6 20.3 25.3 31.4 Total Supply ................................ 922.8 917.4 1037.7 875.8 898.5 937.5 1082.8 961.7 959.0 954.8 1102.4 956.9 3753.8 3880.4 3973.0 Losses and Unaccounted for e ................................18.4 59.0 38.1 36.6 22.1 51.7 24.9 78.6 47.4 73.5 46.2 62.3 152.0 177.3 229.3 Demand Retail Sales f Residential ................................ 322.6 262.8 353.2 262.4 312.0 280.4 384.3 294.2 332.3 270.6 381.2 288.6 1201.0 1270.8 1272.7 Commercial…………………….. 257.0 264.6 305.2 258.2 255.8 279.5 320.8 263.5 259.4 276.1 319.9 270.2 1085.0 1119.5 1125.6 Industrial ................................................................247.6 252.8 252.7 241.0 227.5 243.2 258.2 236.7 229.4 245.0 257.0 247.0 994.1 965.6 978.4 Other…………………………….. 27.2 28.3 33.1 28.0 25.6 26.5 30.9 27.8 27.3 27.6 31.2 28.1 116.7 110.8 114.3 Subtotal................................................................854.4 808.6 944.3 789.6 820.9 829.6 994.1 822.1 848.3 819.4 989.4 833.8 3396.8 3466.7 3490.9 Other Use/Sales g ……………... 50.1 49.9 55.4 49.7 55.5 56.1 63.8 61.0 63.2 61.9 66.8 60.8 205.1 236.4 252.8 Total Demand…………………. 904.5 858.4 999.7 839.3 876.4 885.7 1057.9 883.1 911.6 881.3 1056.2 894.6 3601.8 3703.1 3743.7 aElectric Utilities and independent power producers. b”Other” includes generation from other gaseous fuels, wind, wood, waste, and solar sources. cElectricity generation from combined heat and power facilities and electricity -only plants in the industrial and commercial sectors. dData for 2001 are estimates. eBalancing item, mainly transmission and distribution losses. fTotal of retail electricity sales by electric utilities and power marketers. Utility sales for historical periods are reported in EIA'S Electric Power Monthly and Electric Power Annual. Power marketers' sales are reported annually in Appendix C of EIA's Electric Sales and Revenue. Quarterly data for power marketers ( and thus retail sales totals) are imputed. Data for 2001 are estimated. gDefined as the sum of facility use of onsite net electricity generation plus direct sales of power by industrial- or commercial-sector generators to third parties, reported annually in Table 7.5 of the Monthly Energy Review (MER). Data for 2001 are estimates. Notes: Minor discrepancies with other EIA published historical data are due to rounding. Historical data are printed in bold; forecasts are in italics. The forecasts were generated by simulation of the Short-Term Integrated Forecasting System. Sources: Historical data: Energy Information Administration: latest data available from EIA databases supporting the following report: Electric Power Monthly, DOE/EIA -0226. Projections: Energy Information Administration, Short-Term Integrated Forecasting System database, and Office of Coal, Nuclear, Electric and Alternate Fuels.
Energy Information Administration/Short-Term Energy Outlook – December 2002 1
Table A1. Annual U.S. Energy Supply and Demand: Base Case Year
1989 1990 1991 1992 1993 1994 1995 1996 1997 1998 1999 2000 2001 2002 2003 Real Gross Domestic Product (GDP)
(billion chained 1996 dollars)................................................................6592 6708 6676 6880 7063 7348 7544 7813 8159 8509 8859 9191 9215 9425 9675 Imported Crude Oil Price a (nominal dollars per barrel)................................................................18.07 21.79 18.74 18.20 16.13 15.53 17.14 20.62 18.49 12.07 17.26 27.72 22.01 23.73 23.94 Petroleum Supply
Crude Oil Production b (million barrels per day) ................................................................7.61 7.36 7.42 7.17 6.85 6.66 6.56 6.46 6.45 6.25 5.88 5.82 5.80 5.80 5.60 Total Petroleum Net Imports (including SPR) (million barrels per day) ................................................................7.20 7.16 6.42 6.94 7.62 8.05 7.89 8.50 9.16 9.76 9.91 10.42 10.90 10.50 11.63 Energy Demand
World Petroleum (million barrels per day) ................................................................65.9 66.0 66.6 66.8 67.0 68.3 69.9 71.4 72.9 73.6 75.0 76.0 76.0 76.3 77.7 U.S. Petroleum (million barrels per day) ................................................................17.37 17.04 16.77 17.10 17.24 17.72 17.72 18.31 18.62 18.92 19.52 19.70 19.65 19.75 20.51 Natural Gas (trillion cubic feet) ................................................................19.12 19.16 19.56 20.23 20.79 21.24 22.20 22.60 22.73 22.24 22.39 23.44 22.41 22.21 23.11 Coal (million short tons) ................................................................895 904 899 908 944 951 962 1006 1030 1037 1039 1084 1059 1073 1080 Electricity (billion kilowatthours) Retail Sales c ................................................................2647 2713 2762 2763 2861 2935 3013 3101 3146 3264 3312 3421 3397 3467 3491 Other Use/Sales d ................................................................108 115 118 122 128 134 144 146 148 161 183 183 205 236 253 Total ................................................................................................2755 2828 2880 2885 2989 3069 3157 3247 3294 3425 3495 3604 3602 3703 3744 Total Energy Demand e (quadrillion Btu) ................................................................84.9 84.6 84.6 86.1 87.8 89.6 91.5 94.5 95.0 95.3 97.0 99.3 97.0 98.1 100.8 Total Energy Demand per Dollar of GDP (thousand Btu per 1996 Dollar)................................................................12.88 12.61 12.68 12.51 12.43 12.19 12.13 12.12 11.64 11.20 10.95 10.81 10.52 10.41 10.42
aRefers to the imported cost of crude oil to U.S. refiners. bIncludes lease condensate. cTotal of retail electricity sales by electric utilities and power marketers. Utility sales for historical periods are reported in EIA's Electric Power Monthly and Electric Power Annual. Power marketers' sales for historical periods are reported in EIA's Electric Sales and Revenue, Appendix C. dDefined as the sum of facility use of onsite net electricity generation plus direct sales of power by industrial- or commercial-sector generators to third parties, reported annually in Table 7.5 of the Monthly Energy Review (MER). Data for 2001 are estimates. e "Total Energy Demand" refers to the aggregate energy concept presented in Energy Information Administration, Annual Energy Review, 2001, DOE/EIA-0384(01) (AER), Table 1.1. The conversion from physical units to Btu is calculated using a subset of conversion factors used in the calculations performed for gross energy consumption in Energy Information Administration, Monthly Energy Review (MER). Consequently, the historical data may not precisely match those published in the MER or the AER. Notes: SPR: Strategic Petroleum Reserve. Minor discrepancies with other published EIA historical data are due to independent rounding. Historical data are printed in bold; forecasts are in italics. The forecasts were generated by simulation of the Short-Term Integrated Forecasting System. Sources: Historical data: Latest data available from Bureau of Economic Analysis; Energy Information Administration; latest data available from EIA databases supporting the following reports: Petroleum Supply Monthly, DOE/EIA-0109; Petroleum Supply Annual, DOE/EIA-0340/2; Natural Gas Monthly, DOE/EIA-0130; Electric Power Monthly, DOE/EIA-0226; Quarterly Coal Report, DOE/EIA-0121; International Petroleum Monthly DOE/EIA-520, and Weekly Petroleum Status Report DOE/EI A-0208. Macroeconomic projections are based on DRI-WEFA Forecast CONTROL1102.
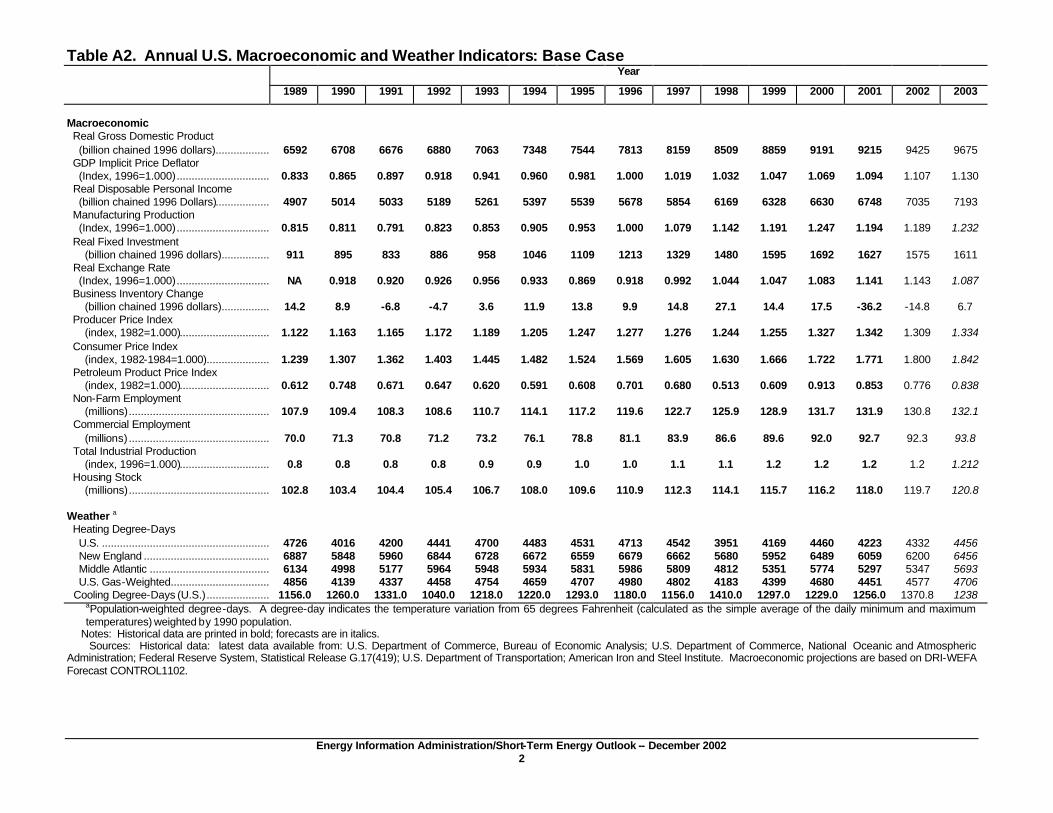
Energy Information Administration/Short-Term Energy Outlook -- December 2002 2
Table A2. Annual U.S. Macroeconomic and Weather Indicators: Base Case
Year
1989 1990 1991 1992 1993 1994 1995 1996 1997 1998 1999 2000 2001 2002 2003
Macroeconomic Real Gross Domestic Product (billion chained 1996 dollars)...........................6592 6708 6676 6880 7063 7348 7544 7813 8159 8509 8859 9191 9215 9425 9675 GDP Implicit Price Deflator (Index, 1996=1.000)................................ 0.833 0.865 0.897 0.918 0.941 0.960 0.981 1.000 1.019 1.032 1.047 1.069 1.094 1.107 1.130 Real Disposable Personal Income (billion chained 1996 Dollars)...........................4907 5014 5033 5189 5261 5397 5539 5678 5854 6169 6328 6630 6748 7035 7193 Manufacturing Production (Index, 1996=1.000)................................ 0.815 0.811 0.791 0.823 0.853 0.905 0.953 1.000 1.079 1.142 1.191 1.247 1.194 1.189 1.232 Real Fixed Investment (billion chained 1996 dollars).........................911 895 833 886 958 1046 1109 1213 1329 1480 1595 1692 1627 1575 1611 Real Exchange Rate (Index, 1996=1.000)................................ NA 0.918 0.920 0.926 0.956 0.933 0.869 0.918 0.992 1.044 1.047 1.083 1.141 1.143 1.087 Business Inventory Change (billion chained 1996 dollars).........................14.2 8.9 -6.8 -4.7 3.6 11.9 13.8 9.9 14.8 27.1 14.4 17.5 -36.2 -14.8 6.7 Producer Price Index (index, 1982=1.000)................................ 1.122 1.163 1.165 1.172 1.189 1.205 1.247 1.277 1.276 1.244 1.255 1.327 1.342 1.309 1.334 Consumer Price Index (index, 1982-1984=1.000)..............................1.239 1.307 1.362 1.403 1.445 1.482 1.524 1.569 1.605 1.630 1.666 1.722 1.771 1.800 1.842 Petroleum Product Price Index (index, 1982=1.000)................................ 0.612 0.748 0.671 0.647 0.620 0.591 0.608 0.701 0.680 0.513 0.609 0.913 0.853 0.776 0.838 Non-Farm Employment (millions)........................................................107.9 109.4 108.3 108.6 110.7 114.1 117.2 119.6 122.7 125.9 128.9 131.7 131.9 130.8 132.1 Commercial Employment (millions) ........................................................70.0 71.3 70.8 71.2 73.2 76.1 78.8 81.1 83.9 86.6 89.6 92.0 92.7 92.3 93.8 Total Industrial Production (index, 1996=1.000)................................ 0.8 0.8 0.8 0.8 0.9 0.9 1.0 1.0 1.1 1.1 1.2 1.2 1.2 1.2 1.212 Housing Stock (millions)........................................................102.8 103.4 104.4 105.4 106.7 108.0 109.6 110.9 112.3 114.1 115.7 116.2 118.0 119.7 120.8
Weather a Heating Degree-Days U.S. ................................................................4726 4016 4200 4441 4700 4483 4531 4713 4542 3951 4169 4460 4223 4332 4456 New England ...................................................6887 5848 5960 6844 6728 6672 6559 6679 6662 5680 5952 6489 6059 6200 6456 Middle Atlantic .................................................6134 4998 5177 5964 5948 5934 5831 5986 5809 4812 5351 5774 5297 5347 5693 U.S. Gas-Weighted..........................................4856 4139 4337 4458 4754 4659 4707 4980 4802 4183 4399 4680 4451 4577 4706 Cooling Degree-Days (U.S.)..............................1156.0 1260.0 1331.0 1040.0 1218.0 1220.0 1293.0 1180.0 1156.0 1410.0 1297.0 1229.0 1256.0 1370.8 1238
aPopulation-weighted degree-days. A degree-day indicates the temperature variation from 65 degrees Fahrenheit (calculated as the simple average of the daily minimum and maximum temperatures) weighted by 1990 population.
Notes: Historical data are printed in bold; forecasts are in italics. Sources: Historical data: latest data available from: U.S. Department of Commerce, Bureau of Economic Analysis; U.S. Department of Commerce, National Oceanic and Atmospheric Administration; Federal Reserve System, Statistical Release G.17(419); U.S. Department of Transportation; American Iron and Steel Institute. Macroeconomic projections are based on DRI-WEFA Forecast CONTROL1102.
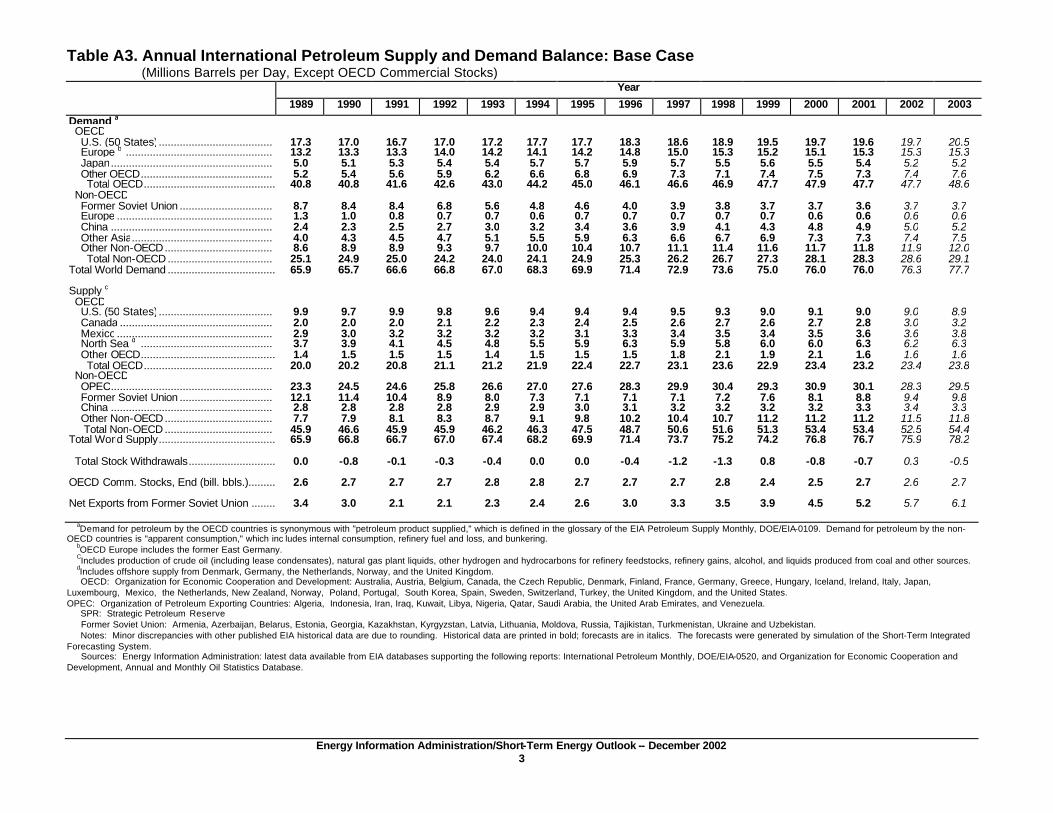
Energy Information Administration/Short-Term Energy Outlook -- December 2002 3
Table A3. Annual International Petroleum Supply and Demand Balance: Base Case (Millions Barrels per Day, Except OECD Commercial Stocks)
Year
1989 1990 1991 1992 1993 1994 1995 1996 1997 1998 1999 2000 2001 2002 2003
Demand a OECD U.S. (50 States)...................................... 17.3 17.0 16.7 17.0 17.2 17.7 17.7 18.3 18.6 18.9 19.5 19.7 19.6 19.7 20.5 Europe b ................................................. 13.2 13.3 13.3 14.0 14.2 14.1 14.2 14.8 15.0 15.3 15.2 15.1 15.3 15.3 15.3 Japan...................................................... 5.0 5.1 5.3 5.4 5.4 5.7 5.7 5.9 5.7 5.5 5.6 5.5 5.4 5.2 5.2 Other OECD............................................ 5.2 5.4 5.6 5.9 6.2 6.6 6.8 6.9 7.3 7.1 7.4 7.5 7.3 7.4 7.6 Total OECD................................................................40.8 40.8 41.6 42.6 43.0 44.2 45.0 46.1 46.6 46.9 47.7 47.9 47.7 47.7 48.6 Non-OECD Former Soviet Union ............................... 8.7 8.4 8.4 6.8 5.6 4.8 4.6 4.0 3.9 3.8 3.7 3.7 3.6 3.7 3.7 Europe .................................................... 1.3 1.0 0.8 0.7 0.7 0.6 0.7 0.7 0.7 0.7 0.7 0.6 0.6 0.6 0.6 China ...................................................... 2.4 2.3 2.5 2.7 3.0 3.2 3.4 3.6 3.9 4.1 4.3 4.8 4.9 5.0 5.2 Other Asia............................................... 4.0 4.3 4.5 4.7 5.1 5.5 5.9 6.3 6.6 6.7 6.9 7.3 7.3 7.4 7.5 Other Non-OECD.................................... 8.6 8.9 8.9 9.3 9.7 10.0 10.4 10.7 11.1 11.4 11.6 11.7 11.8 11.9 12.0 Total Non-OECD ................................... 25.1 24.9 25.0 24.2 24.0 24.1 24.9 25.3 26.2 26.7 27.3 28.1 28.3 28.6 29.1 Total World Demand ................................................................65.9 65.7 66.6 66.8 67.0 68.3 69.9 71.4 72.9 73.6 75.0 76.0 76.0 76.3 77.7 Supply c OECD U.S. (50 States)...................................... 9.9 9.7 9.9 9.8 9.6 9.4 9.4 9.4 9.5 9.3 9.0 9.1 9.0 9.0 8.9 Canada ................................................... 2.0 2.0 2.0 2.1 2.2 2.3 2.4 2.5 2.6 2.7 2.6 2.7 2.8 3.0 3.2 Mexico.................................................... 2.9 3.0 3.2 3.2 3.2 3.2 3.1 3.3 3.4 3.5 3.4 3.5 3.6 3.6 3.8 North Sea d ............................................ 3.7 3.9 4.1 4.5 4.8 5.5 5.9 6.3 5.9 5.8 6.0 6.0 6.3 6.2 6.3 Other OECD................................................................1.4 1.5 1.5 1.5 1.4 1.5 1.5 1.5 1.8 2.1 1.9 2.1 1.6 1.6 1.6 Total OECD........................................... 20.0 20.2 20.8 21.1 21.2 21.9 22.4 22.7 23.1 23.6 22.9 23.4 23.2 23.4 23.8 Non-OECD OPEC...................................................... 23.3 24.5 24.6 25.8 26.6 27.0 27.6 28.3 29.9 30.4 29.3 30.9 30.1 28.3 29.5 Former Soviet Union ............................... 12.1 11.4 10.4 8.9 8.0 7.3 7.1 7.1 7.1 7.2 7.6 8.1 8.8 9.4 9.8 China ...................................................... 2.8 2.8 2.8 2.8 2.9 2.9 3.0 3.1 3.2 3.2 3.2 3.2 3.3 3.4 3.3 Other Non-OECD.................................... 7.7 7.9 8.1 8.3 8.7 9.1 9.8 10.2 10.4 10.7 11.2 11.2 11.2 11.5 11.8 Total Non-OECD .................................... 45.9 46.6 45.9 45.9 46.2 46.3 47.5 48.7 50.6 51.6 51.3 53.4 53.4 52.5 54.4 Total World Supply................................................................65.9 66.8 66.7 67.0 67.4 68.2 69.9 71.4 73.7 75.2 74.2 76.8 76.7 75.9 78.2 Total Stock Withdrawals................................ 0.0 -0.8 -0.1 -0.3 -0.4 0.0 0.0 -0.4 -1.2 -1.3 0.8 -0.8 -0.7 0.3 -0.5 OECD Comm. Stocks, End (bill. bbls.)................................2.6 2.7 2.7 2.7 2.8 2.8 2.7 2.7 2.7 2.8 2.4 2.5 2.7 2.6 2.7 Net Exports from Former Soviet Union ................................3.4 3.0 2.1 2.1 2.3 2.4 2.6 3.0 3.3 3.5 3.9 4.5 5.2 5.7 6.1
aDemand for petroleum by the OECD countries is synonymous with "petroleum product supplied," which is defined in the glossary of the EIA Petroleum Supply Monthly, DOE/EIA-0109. Demand for petroleum by the non-OECD countries is "apparent consumption," which inc ludes internal consumption, refinery fuel and loss, and bunkering. bOECD Europe includes the former East Germany. CIncludes production of crude oil (including lease condensates), natural gas plant liquids, other hydrogen and hydrocarbons for refinery feedstocks, refinery gains, alcohol, and liquids produced from coal and other sources. dIncludes offshore supply from Denmark, Germany, the Netherlands, Norway, and the United Kingdom. OECD: Organization for Economic Cooperation and Development: Australia, Austria, Belgium, Canada, the Czech Republic, Denmark, Finland, France, Germany, Greece, Hungary, Iceland, Ireland, Italy, Japan, Luxembourg, Mexico, the Netherlands, New Zealand, Norway, Poland, Portugal, South Korea, Spain, Sweden, Switzerland, Turkey, the United Kingdom, and the United States. OPEC: Organization of Petroleum Exporting Countries: Algeria, Indonesia, Iran, Iraq, Kuwait, Libya, Nigeria, Qatar, Saudi Arabia, the United Arab Emirates, and Venezuela. SPR: Strategic Petroleum Reserve Former Soviet Union: Armenia, Azerbaijan, Belarus, Estonia, Georgia, Kazakhstan, Kyrgyzstan, Latvia, Lithuania, Moldova, Russia, Tajikistan, Turkmenistan, Ukraine and Uzbekistan. Notes: Minor discrepancies with other published EIA historical data are due to rounding. Historical data are printed in bold; forecasts are in italics. The forecasts were generated by simulation of the Short-Term Integrated Forecasting System. Sources: Energy Information Administration: latest data available from EIA databases supporting the following reports: International Petroleum Monthly, DOE/EIA-0520, and Organization for Economic Cooperation and Development, Annual and Monthly Oil Statistics Database.
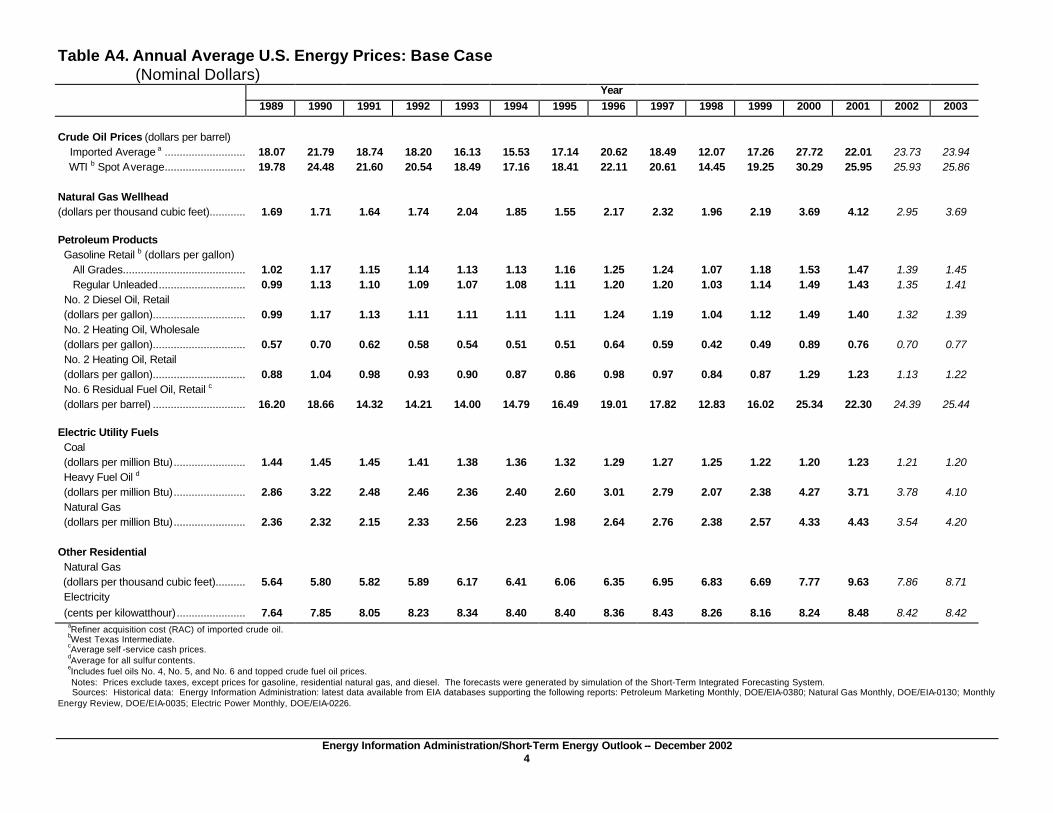
Energy Information Administration/Short-Term Energy Outlook -- December 2002 4
Table A4. Annual Average U.S. Energy Prices: Base Case (Nominal Dollars)
Year 1989 1990 1991 1992 1993 1994 1995 1996 1997 1998 1999 2000 2001 2002 2003
Crude Oil Prices (dollars per barrel) Imported Average a ................................18.07 21.79 18.74 18.20 16.13 15.53 17.14 20.62 18.49 12.07 17.26 27.72 22.01 23.73 23.94 WTI b Spot Average................................19.78 24.48 21.60 20.54 18.49 17.16 18.41 22.11 20.61 14.45 19.25 30.29 25.95 25.93 25.86
Natural Gas Wellhead (dollars per thousand cubic feet)................................1.69 1.71 1.64 1.74 2.04 1.85 1.55 2.17 2.32 1.96 2.19 3.69 4.12 2.95 3.69
Petroleum Products Gasoline Retail b (dollars per gallon) All Grades................................................................1.02 1.17 1.15 1.14 1.13 1.13 1.16 1.25 1.24 1.07 1.18 1.53 1.47 1.39 1.45 Regular Unleaded................................ 0.99 1.13 1.10 1.09 1.07 1.08 1.11 1.20 1.20 1.03 1.14 1.49 1.43 1.35 1.41 No. 2 Diesel Oil, Retail (dollars per gallon)................................ 0.99 1.17 1.13 1.11 1.11 1.11 1.11 1.24 1.19 1.04 1.12 1.49 1.40 1.32 1.39 No. 2 Heating Oil, Wholesale (dollars per gallon)................................ 0.57 0.70 0.62 0.58 0.54 0.51 0.51 0.64 0.59 0.42 0.49 0.89 0.76 0.70 0.77 No. 2 Heating Oil, Retail (dollars per gallon)................................ 0.88 1.04 0.98 0.93 0.90 0.87 0.86 0.98 0.97 0.84 0.87 1.29 1.23 1.13 1.22 No. 6 Residual Fuel Oil, Retail c (dollars per barrel) ................................ 16.20 18.66 14.32 14.21 14.00 14.79 16.49 19.01 17.82 12.83 16.02 25.34 22.30 24.39 25.44
Electric Utility Fuels Coal (dollars per million Btu)................................1.44 1.45 1.45 1.41 1.38 1.36 1.32 1.29 1.27 1.25 1.22 1.20 1.23 1.21 1.20 Heavy Fuel Oil d (dollars per million Btu)................................2.86 3.22 2.48 2.46 2.36 2.40 2.60 3.01 2.79 2.07 2.38 4.27 3.71 3.78 4.10 Natural Gas (dollars per million Btu)................................2.36 2.32 2.15 2.33 2.56 2.23 1.98 2.64 2.76 2.38 2.57 4.33 4.43 3.54 4.20
Other Residential Natural Gas (dollars per thousand cubic feet)................................5.64 5.80 5.82 5.89 6.17 6.41 6.06 6.35 6.95 6.83 6.69 7.77 9.63 7.86 8.71 Electricity (cents per kilowatthour)................................7.64 7.85 8.05 8.23 8.34 8.40 8.40 8.36 8.43 8.26 8.16 8.24 8.48 8.42 8.42
aRefiner acquisition cost (RAC) of imported crude oil. bWest Texas Intermediate. cAverage self -service cash prices. dAverage for all sulfur contents. eIncludes fuel oils No. 4, No. 5, and No. 6 and topped crude fuel oil prices. Notes: Prices exclude taxes, except prices for gasoline, residential natural gas, and diesel. The forecasts were generated by simulation of the Short-Term Integrated Forecasting System. Sources: Historical data: Energy Information Administration: latest data available from EIA databases supporting the following reports: Petroleum Marketing Monthly, DOE/EIA-0380; Natural Gas Monthly, DOE/EIA-0130; Monthly Energy Review, DOE/EIA-0035; Electric Power Monthly, DOE/EIA-0226.
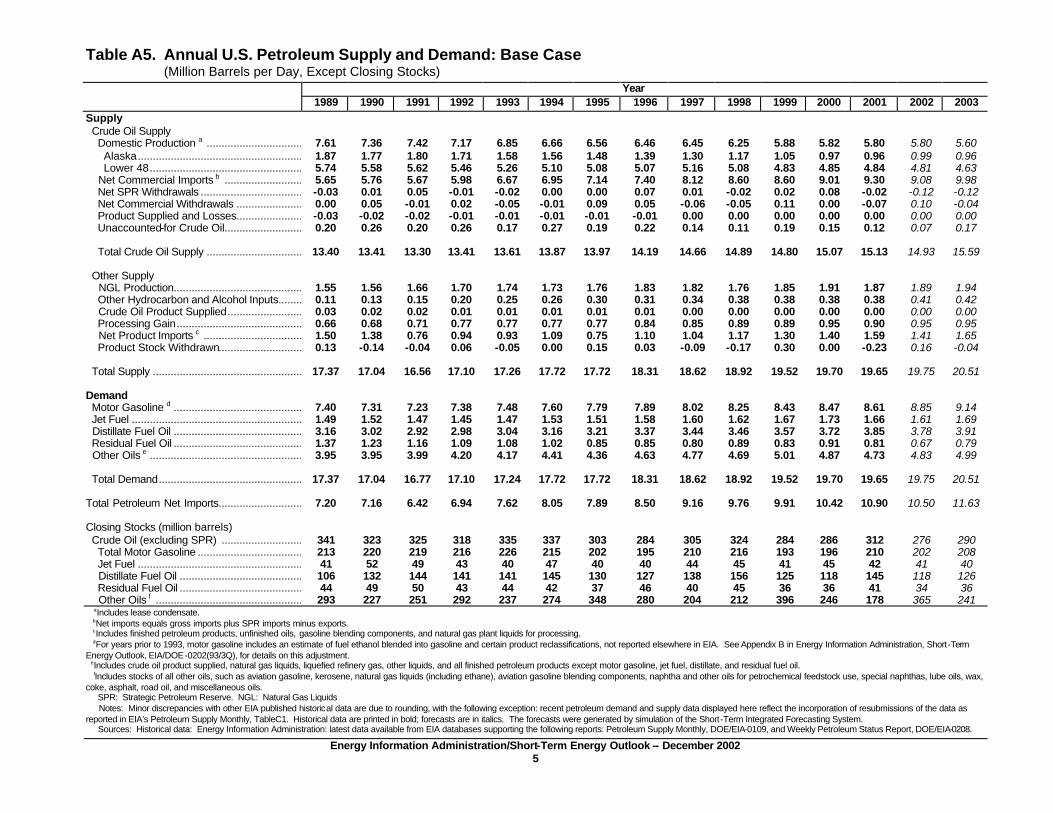
Energy Information Administration/Short-Term Energy Outlook -- December 2002 5
Table A5. Annual U.S. Petroleum Supply and Demand: Base Case (Million Barrels per Day, Except Closing Stocks)
Year 1989 1990 1991 1992 1993 1994 1995 1996 1997 1998 1999 2000 2001 2002 2003
Supply Crude Oil Supply Domestic Production a ................................ 7.61 7.36 7.42 7.17 6.85 6.66 6.56 6.46 6.45 6.25 5.88 5.82 5.80 5.80 5.60 Alaska................................................................1.87 1.77 1.80 1.71 1.58 1.56 1.48 1.39 1.30 1.17 1.05 0.97 0.96 0.99 0.96 Lower 48................................................................5.74 5.58 5.62 5.46 5.26 5.10 5.08 5.07 5.16 5.08 4.83 4.85 4.84 4.81 4.63 Net Commercial Imports b ................................5.65 5.76 5.67 5.98 6.67 6.95 7.14 7.40 8.12 8.60 8.60 9.01 9.30 9.08 9.98 Net SPR Withdrawals ................................................................-0.03 0.01 0.05 -0.01 -0.02 0.00 0.00 0.07 0.01 -0.02 0.02 0.08 -0.02 -0.12 -0.12 Net Commercial Withdrawals ................................0.00 0.05 -0.01 0.02 -0.05 -0.01 0.09 0.05 -0.06 -0.05 0.11 0.00 -0.07 0.10 -0.04 Product Supplied and Losses................................-0.03 -0.02 -0.02 -0.01 -0.01 -0.01 -0.01 -0.01 0.00 0.00 0.00 0.00 0.00 0.00 0.00 Unaccounted-for Crude Oil................................0.20 0.26 0.20 0.26 0.17 0.27 0.19 0.22 0.14 0.11 0.19 0.15 0.12 0.07 0.17
Total Crude Oil Supply ................................ 13.40 13.41 13.30 13.41 13.61 13.87 13.97 14.19 14.66 14.89 14.80 15.07 15.13 14.93 15.59
Other Supply NGL Production................................................................1.55 1.56 1.66 1.70 1.74 1.73 1.76 1.83 1.82 1.76 1.85 1.91 1.87 1.89 1.94 Other Hydrocarbon and Alcohol Inputs................................0.11 0.13 0.15 0.20 0.25 0.26 0.30 0.31 0.34 0.38 0.38 0.38 0.38 0.41 0.42 Crude Oil Product Supplied................................0.03 0.02 0.02 0.01 0.01 0.01 0.01 0.01 0.00 0.00 0.00 0.00 0.00 0.00 0.00 Processing Gain................................................................0.66 0.68 0.71 0.77 0.77 0.77 0.77 0.84 0.85 0.89 0.89 0.95 0.90 0.95 0.95 Net Product Imports c ................................................................1.50 1.38 0.76 0.94 0.93 1.09 0.75 1.10 1.04 1.17 1.30 1.40 1.59 1.41 1.65 Product Stock Withdrawn................................0.13 -0.14 -0.04 0.06 -0.05 0.00 0.15 0.03 -0.09 -0.17 0.30 0.00 -0.23 0.16 -0.04
Total Supply ................................................................17.37 17.04 16.56 17.10 17.26 17.72 17.72 18.31 18.62 18.92 19.52 19.70 19.65 19.75 20.51
Demand Motor Gasoline d ................................................................7.40 7.31 7.23 7.38 7.48 7.60 7.79 7.89 8.02 8.25 8.43 8.47 8.61 8.85 9.14 Jet Fuel ................................................................1.49 1.52 1.47 1.45 1.47 1.53 1.51 1.58 1.60 1.62 1.67 1.73 1.66 1.61 1.69 Distillate Fuel Oil ................................................................3.16 3.02 2.92 2.98 3.04 3.16 3.21 3.37 3.44 3.46 3.57 3.72 3.85 3.78 3.91 Residual Fuel Oil ................................................................1.37 1.23 1.16 1.09 1.08 1.02 0.85 0.85 0.80 0.89 0.83 0.91 0.81 0.67 0.79 Other Oils e ................................................................3.95 3.95 3.99 4.20 4.17 4.41 4.36 4.63 4.77 4.69 5.01 4.87 4.73 4.83 4.99
Total Demand................................................................17.37 17.04 16.77 17.10 17.24 17.72 17.72 18.31 18.62 18.92 19.52 19.70 19.65 19.75 20.51
Total Petroleum Net Imports................................7.20 7.16 6.42 6.94 7.62 8.05 7.89 8.50 9.16 9.76 9.91 10.42 10.90 10.50 11.63
Closing Stocks (million barrels) Crude Oil (excluding SPR) ................................341 323 325 318 335 337 303 284 305 324 284 286 312 276 290 Total Motor Gasoline ................................................................213 220 219 216 226 215 202 195 210 216 193 196 210 202 208 Jet Fuel ................................................................41 52 49 43 40 47 40 40 44 45 41 45 42 41 40 Distillate Fuel Oil ................................................................106 132 144 141 141 145 130 127 138 156 125 118 145 118 126 Residual Fuel Oil ................................................................44 49 50 43 44 42 37 46 40 45 36 36 41 34 36 Other Oils f ................................................................293 227 251 292 237 274 348 280 204 212 396 246 178 365 241 aIncludes lease condensate. bNet imports equals gross imports plus SPR imports minus exports. cIncludes finished petroleum products, unfinished oils, gasoline blending components, and natural gas plant liquids for processing. dFor years prior to 1993, motor gasoline includes an estimate of fuel ethanol blended into gasoline and certain product reclassifications, not reported elsewhere in EIA. See Appendix B in Energy Information Administration, Short-Term Energy Outlook, EIA/DOE-0202(93/3Q), for details on this adjustment. eIncludes crude oil product supplied, natural gas liquids, liquefied refinery gas, other liquids, and all finished petroleum products except motor gasoline, jet fuel, distillate, and residual fuel oil. fIncludes stocks of all other oils, such as aviation gasoline, kerosene, natural gas liquids (including ethane), aviation gasoline blending components, naphtha and other oils for petrochemical feedstock use, special naphthas, lube oils, wax, coke, asphalt, road oil, and miscellaneous oils. SPR: Strategic Petroleum Reserve. NGL: Natural Gas Liquids Notes: Minor discrepancies with other EIA published historical data are due to rounding, with the following exception: recent petroleum demand and supply data displayed here reflect the incorporation of resubmissions of the data as reported in EIA’s Petroleum Supply Monthly, TableC1. Historical data are printed in bold; forecasts are in italics. The forecasts were generated by simulation of the Short-Term Integrated Forecasting System. Sources: Historical data: Energy Information Administration: latest data available from EIA databases supporting the following reports: Petroleum Supply Monthly, DOE/EIA-0109, and Weekly Petroleum Status Report, DOE/EIA-0208.
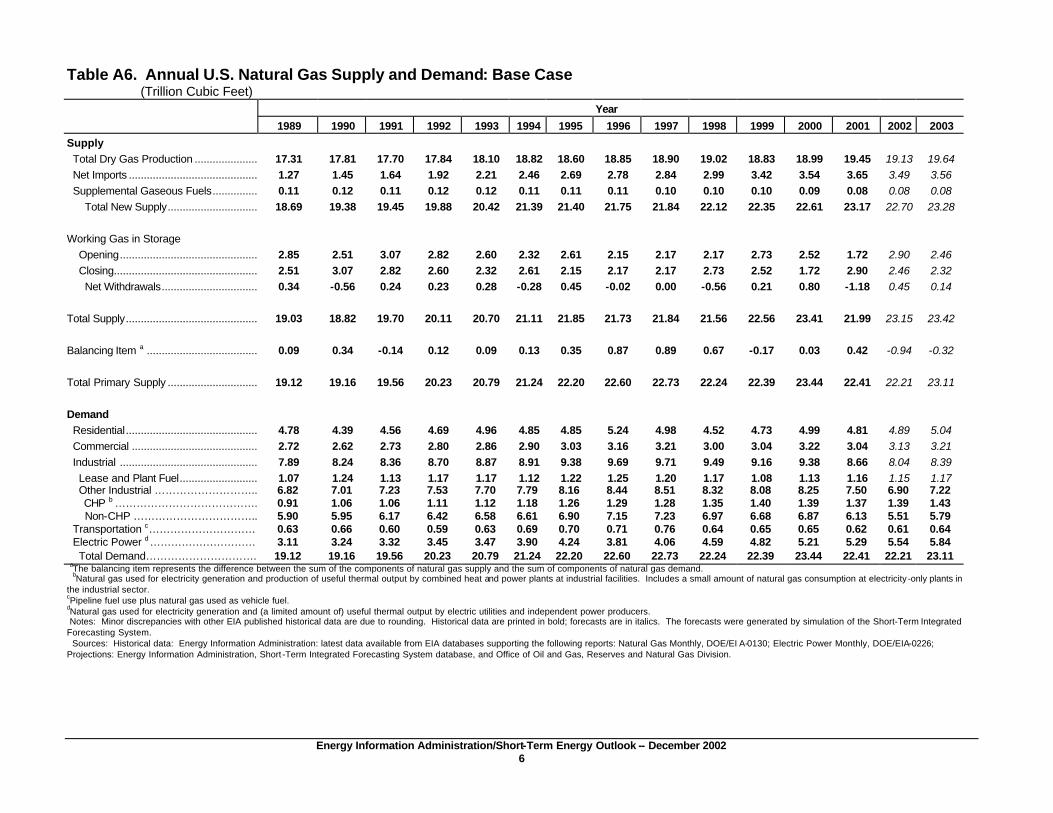
Energy Information Administration/Short-Term Energy Outlook -- December 2002 6
Table A6. Annual U.S. Natural Gas Supply and Demand: Base Case (Trillion Cubic Feet)
Year
1989 1990 1991 1992 1993 1994 1995 1996 1997 1998 1999 2000 2001 2002 2003
Supply Total Dry Gas Production ................................17.31 17.81 17.70 17.84 18.10 18.82 18.60 18.85 18.90 19.02 18.83 18.99 19.45 19.13 19.64 Net Imports ................................................................1.27 1.45 1.64 1.92 2.21 2.46 2.69 2.78 2.84 2.99 3.42 3.54 3.65 3.49 3.56 Supplemental Gaseous Fuels................................0.11 0.12 0.11 0.12 0.12 0.11 0.11 0.11 0.10 0.10 0.10 0.09 0.08 0.08 0.08 Total New Supply................................ 18.69 19.38 19.45 19.88 20.42 21.39 21.40 21.75 21.84 22.12 22.35 22.61 23.17 22.70 23.28
Working Gas in Storage Opening................................................................2.85 2.51 3.07 2.82 2.60 2.32 2.61 2.15 2.17 2.17 2.73 2.52 1.72 2.90 2.46 Closing................................................................2.51 3.07 2.82 2.60 2.32 2.61 2.15 2.17 2.17 2.73 2.52 1.72 2.90 2.46 2.32 Net Withdrawals................................ 0.34 -0.56 0.24 0.23 0.28 -0.28 0.45 -0.02 0.00 -0.56 0.21 0.80 -1.18 0.45 0.14
Total Supply................................................................19.03 18.82 19.70 20.11 20.70 21.11 21.85 21.73 21.84 21.56 22.56 23.41 21.99 23.15 23.42
Balancing Item a ................................................................0.09 0.34 -0.14 0.12 0.09 0.13 0.35 0.87 0.89 0.67 -0.17 0.03 0.42 -0.94 -0.32
Total Primary Supply ................................ 19.12 19.16 19.56 20.23 20.79 21.24 22.20 22.60 22.73 22.24 22.39 23.44 22.41 22.21 23.11
Demand Residential................................................................4.78 4.39 4.56 4.69 4.96 4.85 4.85 5.24 4.98 4.52 4.73 4.99 4.81 4.89 5.04 Commercial ................................................................2.72 2.62 2.73 2.80 2.86 2.90 3.03 3.16 3.21 3.00 3.04 3.22 3.04 3.13 3.21 Industrial ................................................................7.89 8.24 8.36 8.70 8.87 8.91 9.38 9.69 9.71 9.49 9.16 9.38 8.66 8.04 8.39 Lease and Plant Fuel................................ 1.07 1.24 1.13 1.17 1.17 1.12 1.22 1.25 1.20 1.17 1.08 1.13 1.16 1.15 1.17 Other Industrial ……………………….. 6.82 7.01 7.23 7.53 7.70 7.79 8.16 8.44 8.51 8.32 8.08 8.25 7.50 6.90 7.22 CHP b …………………………………. 0.91 1.06 1.06 1.11 1.12 1.18 1.26 1.29 1.28 1.35 1.40 1.39 1.37 1.39 1.43 Non-CHP …………………………….. 5.90 5.95 6.17 6.42 6.58 6.61 6.90 7.15 7.23 6.97 6.68 6.87 6.13 5.51 5.79 Transportation c………………………… 0.63 0.66 0.60 0.59 0.63 0.69 0.70 0.71 0.76 0.64 0.65 0.65 0.62 0.61 0.64 Electric Power d ………………………… 3.11 3.24 3.32 3.45 3.47 3.90 4.24 3.81 4.06 4.59 4.82 5.21 5.29 5.54 5.84 Total Demand…………………………. 19.12 19.16 19.56 20.23 20.79 21.24 22.20 22.60 22.73 22.24 22.39 23.44 22.41 22.21 23.11 aThe balancing item represents the difference between the sum of the components of natural gas supply and the sum of components of natural gas demand. bNatural gas used for electricity generation and production of useful thermal output by combined heat and power plants at industrial facilities. Includes a small amount of natural gas consumption at electricity -only plants in the industrial sector. cPipeline fuel use plus natural gas used as vehicle fuel. dNatural gas used for electricity generation and (a limited amount of) useful thermal output by electric utilities and independent power producers. Notes: Minor discrepancies with other EIA published historical data are due to rounding. Historical data are printed in bold; forecasts are in italics. The forecasts were generated by simulation of the Short-Term Integrated Forecasting System. Sources: Historical data: Energy Information Administration: latest data available from EIA databases supporting the following reports: Natural Gas Monthly, DOE/EI A-0130; Electric Power Monthly, DOE/EIA-0226; Projections: Energy Information Administration, Short -Term Integrated Forecasting System database, and Office of Oil and Gas, Reserves and Natural Gas Division.
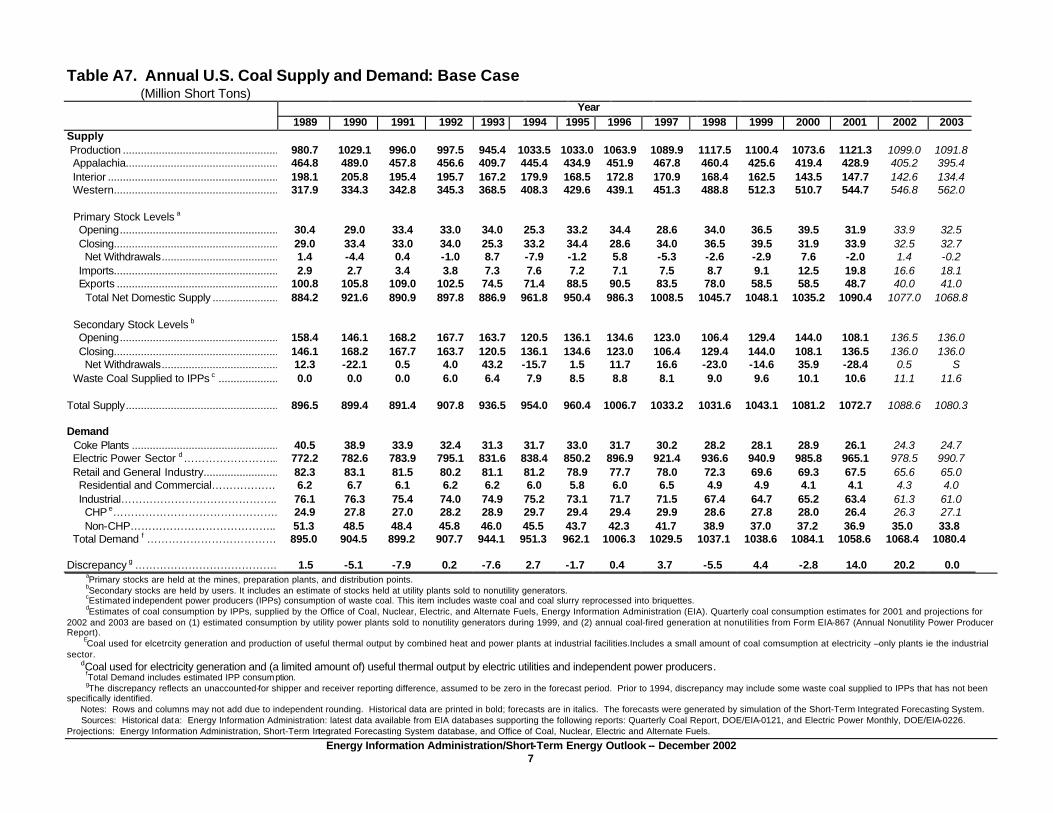
Energy Information Administration/Short-Term Energy Outlook -- December 2002 7
Table A7. Annual U.S. Coal Supply and Demand: Base Case (Million Short Tons)
Year 1989 1990 1991 1992 1993 1994 1995 1996 1997 1998 1999 2000 2001 2002 2003
Supply Production ................................................................980.7 1029.1 996.0 997.5 945.4 1033.5 1033.0 1063.9 1089.9 1117.5 1100.4 1073.6 1121.3 1099.0 1091.8 Appalachia................................................................464.8 489.0 457.8 456.6 409.7 445.4 434.9 451.9 467.8 460.4 425.6 419.4 428.9 405.2 395.4 Interior ................................................................198.1 205.8 195.4 195.7 167.2 179.9 168.5 172.8 170.9 168.4 162.5 143.5 147.7 142.6 134.4 Western................................................................317.9 334.3 342.8 345.3 368.5 408.3 429.6 439.1 451.3 488.8 512.3 510.7 544.7 546.8 562.0
Primary Stock Levels a Opening................................................................30.4 29.0 33.4 33.0 34.0 25.3 33.2 34.4 28.6 34.0 36.5 39.5 31.9 33.9 32.5 Closing................................................................29.0 33.4 33.0 34.0 25.3 33.2 34.4 28.6 34.0 36.5 39.5 31.9 33.9 32.5 32.7 Net Withdrawals................................................................1.4 -4.4 0.4 -1.0 8.7 -7.9 -1.2 5.8 -5.3 -2.6 -2.9 7.6 -2.0 1.4 -0.2 Imports................................................................2.9 2.7 3.4 3.8 7.3 7.6 7.2 7.1 7.5 8.7 9.1 12.5 19.8 16.6 18.1 Exports ................................................................100.8 105.8 109.0 102.5 74.5 71.4 88.5 90.5 83.5 78.0 58.5 58.5 48.7 40.0 41.0 Total Net Domestic Supply ................................884.2 921.6 890.9 897.8 886.9 961.8 950.4 986.3 1008.5 1045.7 1048.1 1035.2 1090.4 1077.0 1068.8
Secondary Stock Levels b Opening................................................................158.4 146.1 168.2 167.7 163.7 120.5 136.1 134.6 123.0 106.4 129.4 144.0 108.1 136.5 136.0 Closing................................................................146.1 168.2 167.7 163.7 120.5 136.1 134.6 123.0 106.4 129.4 144.0 108.1 136.5 136.0 136.0 Net Withdrawals................................................................12.3 -22.1 0.5 4.0 43.2 -15.7 1.5 11.7 16.6 -23.0 -14.6 35.9 -28.4 0.5 S Waste Coal Supplied to IPPs c ................................0.0 0.0 0.0 6.0 6.4 7.9 8.5 8.8 8.1 9.0 9.6 10.1 10.6 11.1 11.6
Total Supply................................................................896.5 899.4 891.4 907.8 936.5 954.0 960.4 1006.7 1033.2 1031.6 1043.1 1081.2 1072.7 1088.6 1080.3
Demand Coke Plants ................................................................40.5 38.9 33.9 32.4 31.3 31.7 33.0 31.7 30.2 28.2 28.1 28.9 26.1 24.3 24.7 Electric Power Sector d ……………………... 772.2 782.6 783.9 795.1 831.6 838.4 850.2 896.9 921.4 936.6 940.9 985.8 965.1 978.5 990.7 Retail and General Industry................................82.3 83.1 81.5 80.2 81.1 81.2 78.9 77.7 78.0 72.3 69.6 69.3 67.5 65.6 65.0 Residential and Commercial……………… 6.2 6.7 6.1 6.2 6.2 6.0 5.8 6.0 6.5 4.9 4.9 4.1 4.1 4.3 4.0 Industrial…………………………………….. 76.1 76.3 75.4 74.0 74.9 75.2 73.1 71.7 71.5 67.4 64.7 65.2 63.4 61.3 61.0 CHP e………………………………………. 24.9 27.8 27.0 28.2 28.9 29.7 29.4 29.4 29.9 28.6 27.8 28.0 26.4 26.3 27.1 Non-CHP………………………………….. 51.3 48.5 48.4 45.8 46.0 45.5 43.7 42.3 41.7 38.9 37.0 37.2 36.9 35.0 33.8 Total Demand f ……………………………… 895.0 904.5 899.2 907.7 944.1 951.3 962.1 1006.3 1029.5 1037.1 1038.6 1084.1 1058.6 1068.4 1080.4
Discrepancy g …………………………………. 1.5 -5.1 -7.9 0.2 -7.6 2.7 -1.7 0.4 3.7 -5.5 4.4 -2.8 14.0 20.2 0.0
aPrimary stocks are held at the mines, preparation plants, and distribution points. bSecondary stocks are held by users. It includes an estimate of stocks held at utility plants sold to nonutility generators. cEstimated independent power producers (IPPs) consumption of waste coal. This item includes waste coal and coal slurry reprocessed into briquettes. dEstimates of coal consumption by IPPs, supplied by the Office of Coal, Nuclear, Electric, and Alternate Fuels, Energy Information Administration (EIA). Quarterly coal consumption estimates for 2001 and projections for 2002 and 2003 are based on (1) estimated consumption by utility power plants sold to nonutility generators during 1999, and (2) annual coal-fired generation at nonutilities from Form EIA-867 (Annual Nonutility Power Producer Report). ECoal used for elcetrcity generation and production of useful thermal output by combined heat and power plants at industrial facilities.Includes a small amount of coal comsumption at electricity –only plants ie the industrial sector. dCoal used for electricity generation and (a limited amount of) useful thermal output by electric utilities and independent power producers. fTotal Demand includes estimated IPP consumption. gThe discrepancy reflects an unaccounted-for shipper and receiver reporting difference, assumed to be zero in the forecast period. Prior to 1994, discrepancy may include some waste coal supplied to IPPs that has not been specifically identified. Notes: Rows and columns may not add due to independent rounding. Historical data are printed in bold; forecasts are in italics. The forecasts were generated by simulation of the Short-Term Integrated Forecasting System. Sources: Historical data: Energy Information Administration: latest data available from EIA databases supporting the following reports: Quarterly Coal Report, DOE/EIA-0121, and Electric Power Monthly, DOE/EIA-0226. Projections: Energy Information Administration, Short-Term Integrated Forecasting System database, and Office of Coal, Nuclear, Electric and Alternate Fuels.
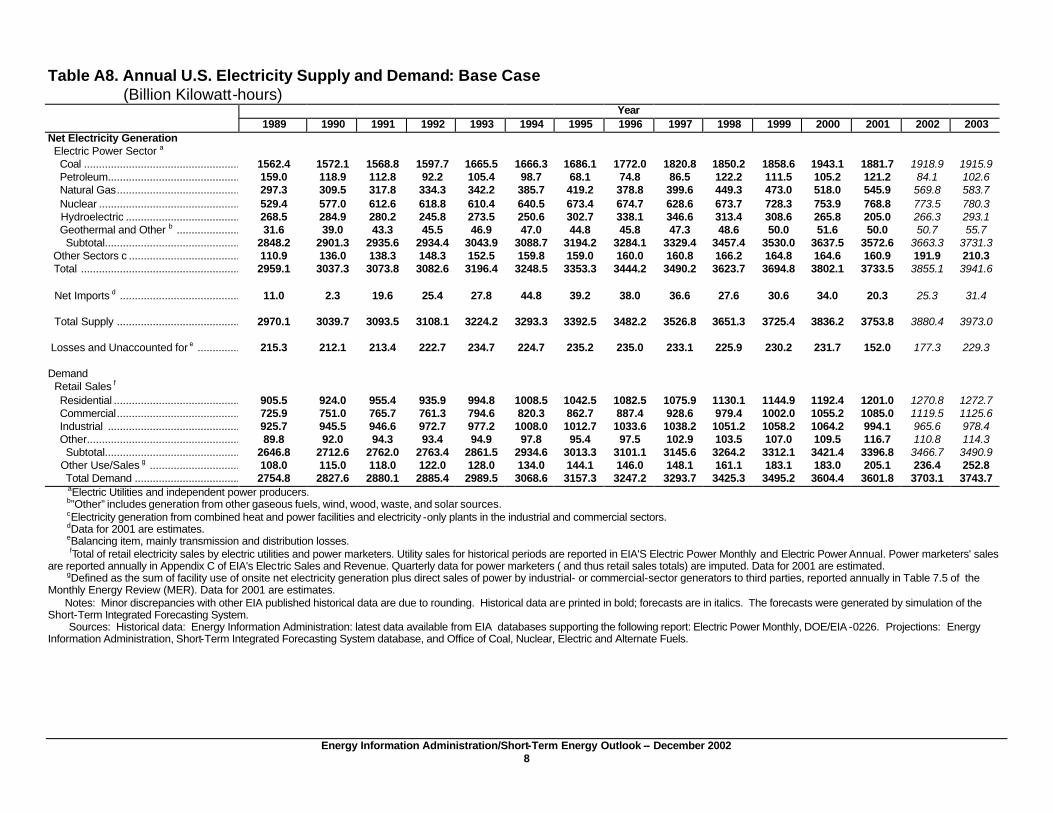
Energy Information Administration/Short-Term Energy Outlook -- December 2002 8
Table A8. Annual U.S. Electricity Supply and Demand: Base Case (Billion Kilowatt-hours)
Year 1989 1990 1991 1992 1993 1994 1995 1996 1997 1998 1999 2000 2001 2002 2003
Net Electricity Generation Electric Power Sector a Coal ................................................................1562.4 1572.1 1568.8 1597.7 1665.5 1666.3 1686.1 1772.0 1820.8 1850.2 1858.6 1943.1 1881.7 1918.9 1915.9 Petroleum................................................................159.0 118.9 112.8 92.2 105.4 98.7 68.1 74.8 86.5 122.2 111.5 105.2 121.2 84.1 102.6 Natural Gas................................................................297.3 309.5 317.8 334.3 342.2 385.7 419.2 378.8 399.6 449.3 473.0 518.0 545.9 569.8 583.7 Nuclear ................................................................529.4 577.0 612.6 618.8 610.4 640.5 673.4 674.7 628.6 673.7 728.3 753.9 768.8 773.5 780.3 Hydroelectric ................................................................268.5 284.9 280.2 245.8 273.5 250.6 302.7 338.1 346.6 313.4 308.6 265.8 205.0 266.3 293.1 Geothermal and Other b ................................31.6 39.0 43.3 45.5 46.9 47.0 44.8 45.8 47.3 48.6 50.0 51.6 50.0 50.7 55.7 Subtotal................................................................2848.2 2901.3 2935.6 2934.4 3043.9 3088.7 3194.2 3284.1 3329.4 3457.4 3530.0 3637.5 3572.6 3663.3 3731.3 Other Sectors c ................................................................110.9 136.0 138.3 148.3 152.5 159.8 159.0 160.0 160.8 166.2 164.8 164.6 160.9 191.9 210.3 Total ................................................................2959.1 3037.3 3073.8 3082.6 3196.4 3248.5 3353.3 3444.2 3490.2 3623.7 3694.8 3802.1 3733.5 3855.1 3941.6
Net Imports d ................................................................11.0 2.3 19.6 25.4 27.8 44.8 39.2 38.0 36.6 27.6 30.6 34.0 20.3 25.3 31.4
Total Supply ................................................................2970.1 3039.7 3093.5 3108.1 3224.2 3293.3 3392.5 3482.2 3526.8 3651.3 3725.4 3836.2 3753.8 3880.4 3973.0
Losses and Unaccounted for e ................................215.3 212.1 213.4 222.7 234.7 224.7 235.2 235.0 233.1 225.9 230.2 231.7 152.0 177.3 229.3 Demand Retail Sales f Residential ................................................................905.5 924.0 955.4 935.9 994.8 1008.5 1042.5 1082.5 1075.9 1130.1 1144.9 1192.4 1201.0 1270.8 1272.7 Commercial................................................................725.9 751.0 765.7 761.3 794.6 820.3 862.7 887.4 928.6 979.4 1002.0 1055.2 1085.0 1119.5 1125.6 Industrial ................................................................925.7 945.5 946.6 972.7 977.2 1008.0 1012.7 1033.6 1038.2 1051.2 1058.2 1064.2 994.1 965.6 978.4 Other................................................................89.8 92.0 94.3 93.4 94.9 97.8 95.4 97.5 102.9 103.5 107.0 109.5 116.7 110.8 114.3 Subtotal................................................................2646.8 2712.6 2762.0 2763.4 2861.5 2934.6 3013.3 3101.1 3145.6 3264.2 3312.1 3421.4 3396.8 3466.7 3490.9 Other Use/Sales g ................................ 108.0 115.0 118.0 122.0 128.0 134.0 144.1 146.0 148.1 161.1 183.1 183.0 205.1 236.4 252.8 Total Demand ................................................................2754.8 2827.6 2880.1 2885.4 2989.5 3068.6 3157.3 3247.2 3293.7 3425.3 3495.2 3604.4 3601.8 3703.1 3743.7 aElectric Utilities and independent power producers. b”Other” includes generation from other gaseous fuels, wind, wood, waste, and solar sources. cElectricity generation from combined heat and power facilities and electricity -only plants in the industrial and commercial sectors. dData for 2001 are estimates. eBalancing item, mainly transmission and distribution losses. fTotal of retail electricity sales by electric utilities and power marketers. Utility sales for historical periods are reported in EIA'S Electric Power Monthly and Electric Power Annual. Power marketers' sales are reported annually in Appendix C of EIA's Electric Sales and Revenue. Quarterly data for power marketers ( and thus retail sales totals) are imputed. Data for 2001 are estimated. gDefined as the sum of facility use of onsite net electricity generation plus direct sales of power by industrial- or commercial-sector generators to third parties, reported annually in Table 7.5 of the Monthly Energy Review (MER). Data for 2001 are estimates. Notes: Minor discrepancies with other EIA published historical data are due to rounding. Historical data are printed in bold; forecasts are in italics. The forecasts were generated by simulation of the Short-Term Integrated Forecasting System. Sources: Historical data: Energy Information Administration: latest data available from EIA databases supporting the following report: Electric Power Monthly, DOE/EIA -0226. Projections: Energy Information Administration, Short-Term Integrated Forecasting System database, and Office of Coal, Nuclear, Electric and Alternate Fuels.