1 short-term outlook presented by: garret sloan, cfa, short-term fixed income strategist october...
TRANSCRIPT

1
Short-term Outlook Presented by:Garret Sloan, CFA, Short-term Fixed Income Strategist
October 2011
2
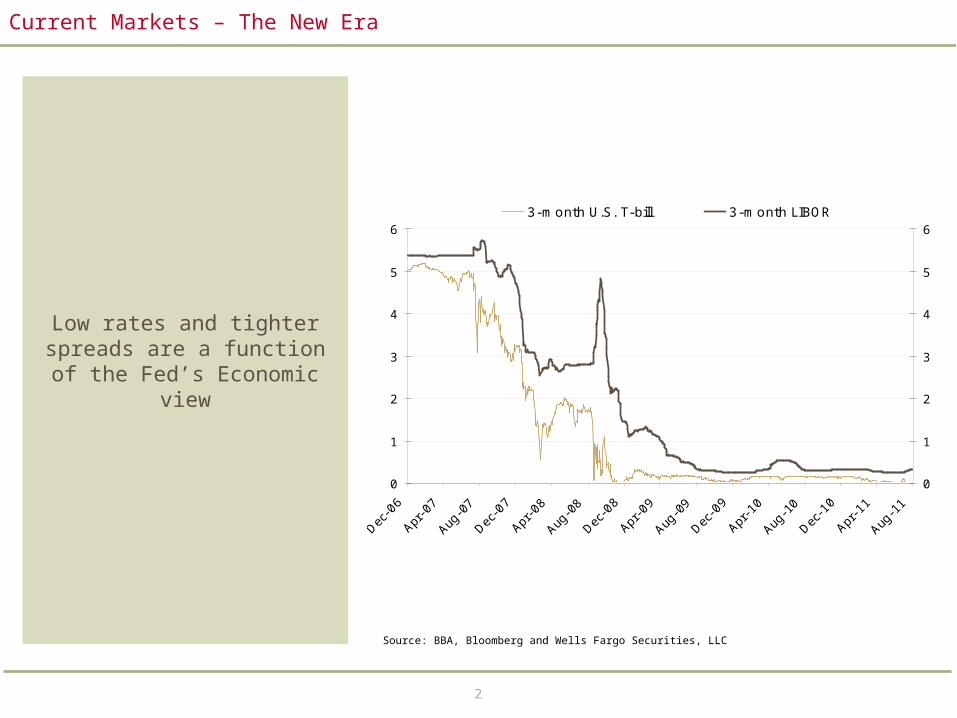
Current Markets – The New Era
Low rates and tighter spreads are a function of the Fed’s Economic view
Source: BBA, Bloomberg and Wells Fargo Securities, LLC
0
1
2
3
4
5
6
Dec-0
6
Apr-0
7
Aug-0
7
Dec-0
7
Apr-0
8
Aug-0
8
Dec-0
8
Apr-0
9
Aug-0
9
Dec-0
9
Apr-1
0
Aug-1
0
Dec-1
0
Apr-1
1
Aug-1
1
0
1
2
3
4
5
63-month U.S. T-bill 3-month LIBOR
Source: BBA, Bloomberg
Short Term Rates Remain Low

3
The Great Recession in Perspective
The hole this recession dug was large and will take years to climb out
Source: U.S. Department of Commerce, Congressional Budget Office, U.S. Department of Labor and Wells Fargo Securities, LLC
Labor MarketOutput Gap
Employment CyclesPercent Change from Cycle Peak
-8.0%
-6.0%
-4.0%
-2.0%
0.0%
2.0%
4.0%
6.0%
8.0%
10.0%
0 4 8 12 16 20 24 28 32 36 40 44 48
-8.0%
-6.0%
-4.0%
-2.0%
0.0%
2.0%
4.0%
6.0%
8.0%
10.0%1948-1949 Cycle1981-1982 Cycle1989-1991 Cycle2001 Cycle2007-To-DateForecast
Output Gap in the U.S. Trillions of Dollars, Potential vs. Actual GDP, Inflation Adjusted
$10.7
$11.2
$11.7
$12.2
$12.7
$13.2
$13.7
$14.2
2000 2002 2004 2006 2008 2010
$10.7
$11.2
$11.7
$12.2
$12.7
$13.2
$13.7
$14.2
Potential GDP: Q3 @ $14.1 Trillion
Actual GDP: Q3 @ $13.3 Trillion
Output Gap = $860 Billion
GDP
Real GDP Change in RecessionsPercentage Change Peak- to-Trough
-5%
-4%
-3%
-2%
-1%
0%
1%
1948-1949Cycle
1953-1954Cycle
1957-1958Cycle
1960-1961Cycle
1969-1970Cycle
1973-1975Cycle
1980Cycle
1981-1982Cycle
1989-1991Cycle
2001Cycle
2007-2009Cycle
-5%
-4%
-3%
-2%
-1%
0%
1%

4
Slow progress in unemployment continues to weigh heavily on Fed policy.
Deleveraging of consumer balance sheets has leveled off, but credit-related spending is expected to remain subdued.
Both new and existing home sales plummeted following the expiration of the homebuyer tax credit program. The gap between existing and new home sales is widening.
The U.S. housing market is still being weighed down by the enormous supply of vacant homes for rent and for sale.
Rising interest rates will make it even more difficult for housing to recover, making the Fed more convinced that it needs to keep rates lower for longer.
Regulatory uncertainty is causing banks, companies and individuals to become more risk-averse
Highlights
What is the Fed Looking at?
Source: BLS, Federal Reserve, U.S. Department of Commerce, Federal Housing Finance Agency, National Association of Realtors, S&P Corp. and Wells Fargo Securities, LLC
Metrics continue to indicate that the Fed Policy will remain highly accommodative
0
500
1000
1500
2000
2500
3000
0
500
1000
1500
2000
2500
3000
Source: Federal Reserve
Total Consumer Credit Outstanding($ billions)
Total Decline: -6.57%
Non-Revolving: +2.4%Revolving: -18.0%
3
3.5
4
4.5
5
5.5
6
6.5
7
7.5
8
0
200
400
600
800
1000
1200
1400
1600
New Home Sales: Aug @ 295 thousand
Existing Home Sales: Aug @ 5.03 million
Existing New and Single Family Home SalesSeasonally Adjusted Annual Rate
0
1
2
3
4
5
6New Homes Inventory: August @ 164 thousand
Existing Homes Inventory: August @ 3.58 million
Single-Family Home InventoryMillions of Units
0
2
4
6
8
10
12
14
16
18
20
0
2
4
6
8
10
12
14
16
18
20U6 U3
Source: BLS
Total Unemployment

5
The Unemployment Rate Remains Flat
The Unemployment Rate remains above 9 percent.
Meanwhile, participation rates have risen slightly.
The flat unemployment rate, coupled with a rising
participation rate likely means that workers are
accepting part-time employment.
Source: BLS and Wells Fargo Securities, LLC
0
2
4
6
8
10
12
62
63
64
65
66
67
68
69
70Unemployment (LHS) Labor Participation (RHS)
Source: BLS
Unemployment vs. Participation
Mar '84 = 64.1 Sep '11 = 64.2

6
The Fed Continues to Exert Control
The amount of cash sitting on bank balance sheets is
indicative of a lack of credit demand, a relative
unwillingness by banks to lend based on regulatory and economic uncertainty and highly accommodative
Fed monetary policy.
Source: Federal Reserve and Wells Fargo Securities, LLC
-
200
400
600
800
1,000
1,200
1,400
1,600
1,800
Jul-9
3
J ul-9
4
J ul-9
5
J ul-9
6
J ul-9
7
J ul-9
8
J ul-9
9
J ul-0
0
J ul-0
1
J ul-0
2
J ul-0
3
J ul-0
4
J ul-0
5
J ul-0
6
J ul-0
7
J ul-0
8
J ul-0
9
J ul-1
0
J ul-1
1
.
-
200
400
600
800
1,000
1,200
1,400
1,600
1,800
Source: Federal Reserve
Excess ReservesAt Commercial Banks ($ billions)
$1,577B
9/11, 2001 - $38 billion
QE2

7
The Fed Continues to Exert Control - QE2, Forward Rate Transparency and Operation Twist
The impact of the August change in the Fed policy
statement had an immediate impact on the shape of the
yield curve.
After the August announcement, the 3-year fell close to 2-year levels
and the 2-year closed in on the 1-year yield.
Source: Federal Reserve and Wells Fargo Securities, LLC
0
0.2
0.4
0.6
0.8
1
1.2
1.4
1.6
1.8
1M 3M 6M 1Y 2Y 3Y 5Y
Current 15-Jul QE2
Treasury Yield Curve
15 bps
23 bps
37 bps38 bps

8
Operation Twist began last week with three purchases
and one sales operation. The impact has been
minimal as markets have been more focused on other
influences.
The sales operation for short-dated Treasury
collateral was oversubscribed more than
30 times.
Source: Bloomberg and Wells Fargo Securities, LLC
The Fed Continues to Exert Control –Operation Twist
914
41
25
4239
28
1 2.5
1611
54
111
130
0
20
40
60
80
100
120
140
1-3 mo 3-6 mo 6M-2 Yr 2-3 Yr 3-5 Yr 5 -10 Yr 10 - 30 Yr
0
20
40
60
80
100
120
140Average Roll Current Roll
Source: Bloomberg
Shape of Treasury Curve
"Operation Twist" would likely focus on flattening this area of
the curve
And possibly result in flattening this area of the curve even further...
9
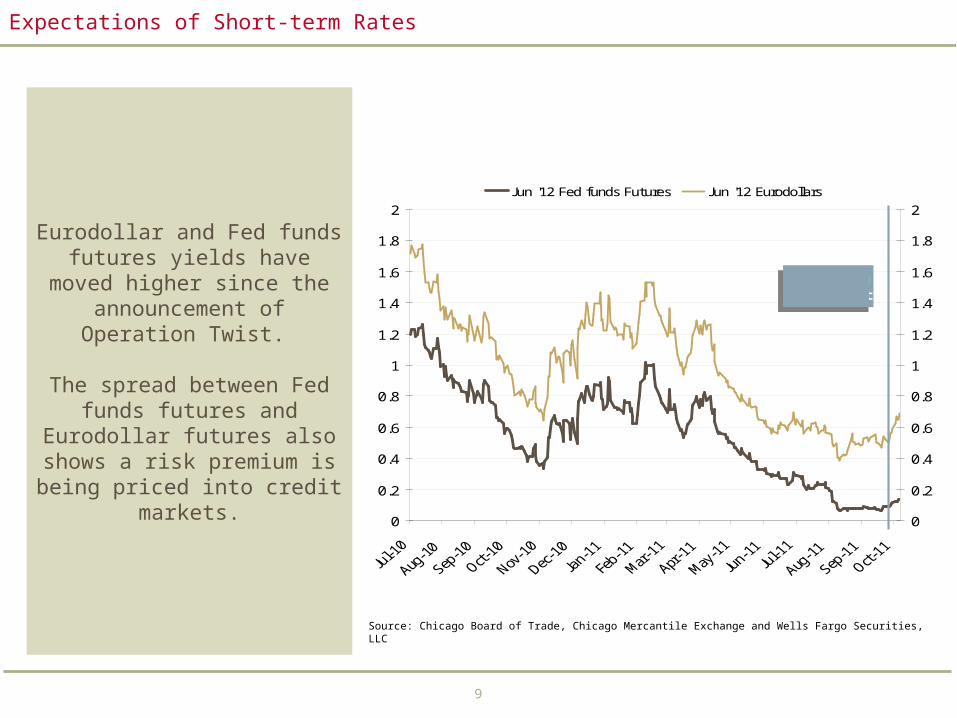
Expectations of Short-term Rates
Eurodollar and Fed funds futures yields have moved
higher since the announcement of Operation
Twist.
The spread between Fed funds futures and
Eurodollar futures also shows a risk premium is being priced into credit
markets.
Source: Chicago Board of Trade, Chicago Mercantile Exchange and Wells Fargo Securities, LLC
0
0.2
0.4
0.6
0.8
1
1.2
1.4
1.6
1.8
2
0
0.2
0.4
0.6
0.8
1
1.2
1.4
1.6
1.8
2Jun '12 Fed funds Futures Jun '12 Eurodollars
Source: CBOT, CME
Futures-Implied Yields
Operation Twist

10
Corporate Balance Sheets Remain Flush
Cash accumulation on corporate balance sheets had begun to decrease in
Q4 2010, but cash accumulation has
accelerated in 2011, putting more downward pressure
on rates.
Source: Bloomberg and Wells Fargo Securities, LLC
-
500
1,000
1,500
2,000
2,500
3,000
Q1 1999
Q4 1999
Q3 2000
Q2 2001
Q1 2002
Q4 2002
Q4 2003
Q2 2004
Q1 2005
Q4 2005
Q3 2006
Q2 2007
Q1 2008
Q4 2008
Q3 2009
Q2 2010
Q4 2010
$-
$500
$1,000
$1,500
$2,000
$2,500
$3,000
Source: Bloomberg, Wells Fargo Securities
Cash and Short-Term Investments($ billions) through Q2
$2.725 trillion
11
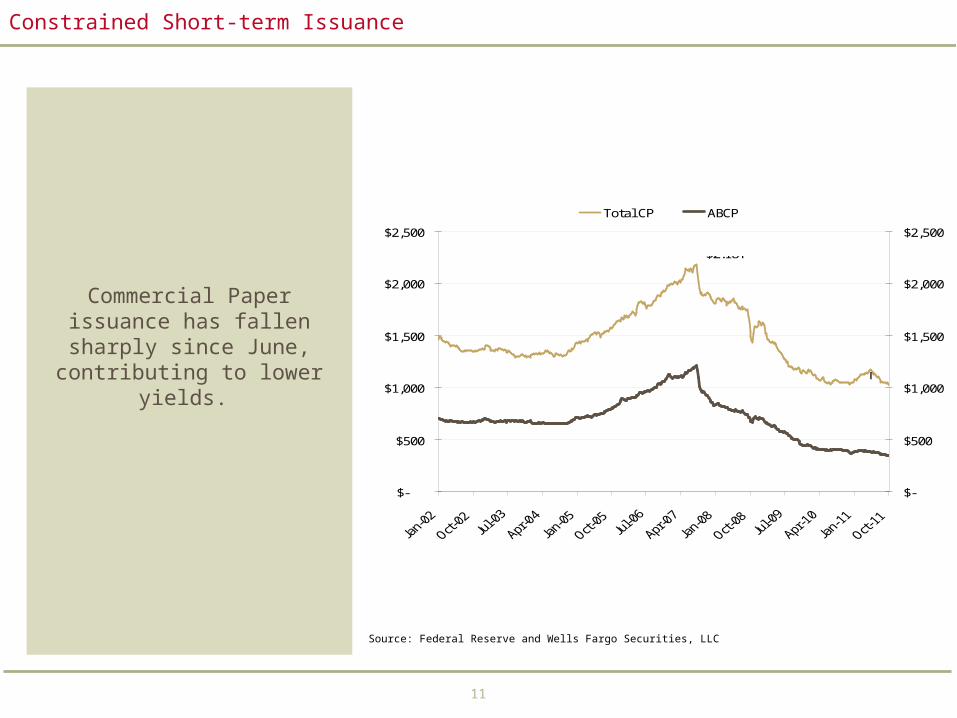
Constrained Short-term Issuance
Commercial Paper issuance has fallen sharply since
June, contributing to lower yields.
Source: Federal Reserve and Wells Fargo Securities, LLC
$-
$500
$1,000
$1,500
$2,000
$2,500
$-
$500
$1,000
$1,500
$2,000
$2,500
Total CP ABCP
Source: Federal Reserve
$2.18T
$1.21T
$350B
$1.025T
Commercial Paper Outstanding
12
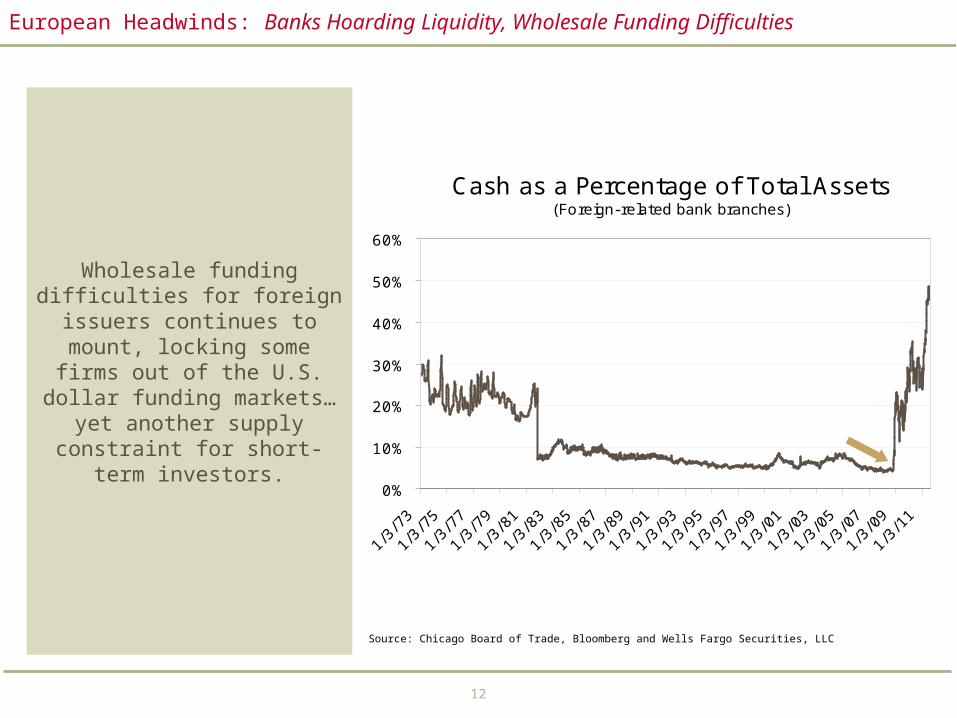
European Headwinds: Banks Hoarding Liquidity, Wholesale Funding Difficulties
Wholesale funding difficulties for foreign
issuers continues to mount, locking some firms out of the U.S. dollar funding markets…yet another
supply constraint for short-term investors.
Source: Chicago Board of Trade, Bloomberg and Wells Fargo Securities, LLC
Cash as a Percentage of Total Assets(Foreign-related bank branches)
0%
10%
20%
30%
40%
50%
60%
1/3/
73
1/3/
75
1/3/
77
1/3/
79
1/3/
81
1/3/
83
1/3/
85
1/3/
87
1/3/
89
1/3/
91
1/3/
93
1/3/
95
1/3/
97
1/3/
99
1/3/
01
1/3/
03
1/3/
05
1/3/
07
1/3/
09
1/3/
11
Source: Federal Reserve
48.60%
4.58%

13
Large Time Deposit Funding has declined
significantly, while balances owed to parent-related
entities has sharply increased.
Source: Federal Reserve and Wells Fargo Securities, LLC
Wholesale Funding(as a % of total assets/ liabilities)
-60%
-40%
-20%
0%
20%
40%
60%
80%
100%Large Time Deposits Net Due to Foreign Parent
Source: Federal Reserve
85%
44%
- 47%
11%
European Headwinds: Banks Hoarding Liquidity, Wholesale Funding Difficulties

14
Balance Sheet Headwinds: Deleveraging and Housing Difficulties Continue
Distress in the U.S. housing market is likely causing a
drag on the economy regardless of whatever
monetary and fiscal stimulus is provided.
Source: Federal Reserve and Wells Fargo Securities, LLC
$-
$5
$10
$15
$20
$25
$30
$ trillio
ns
Total Assets OE Mortgages
Source: Federal Reserve
U.S. Real Estate Assets, Liabilities and Equity
15
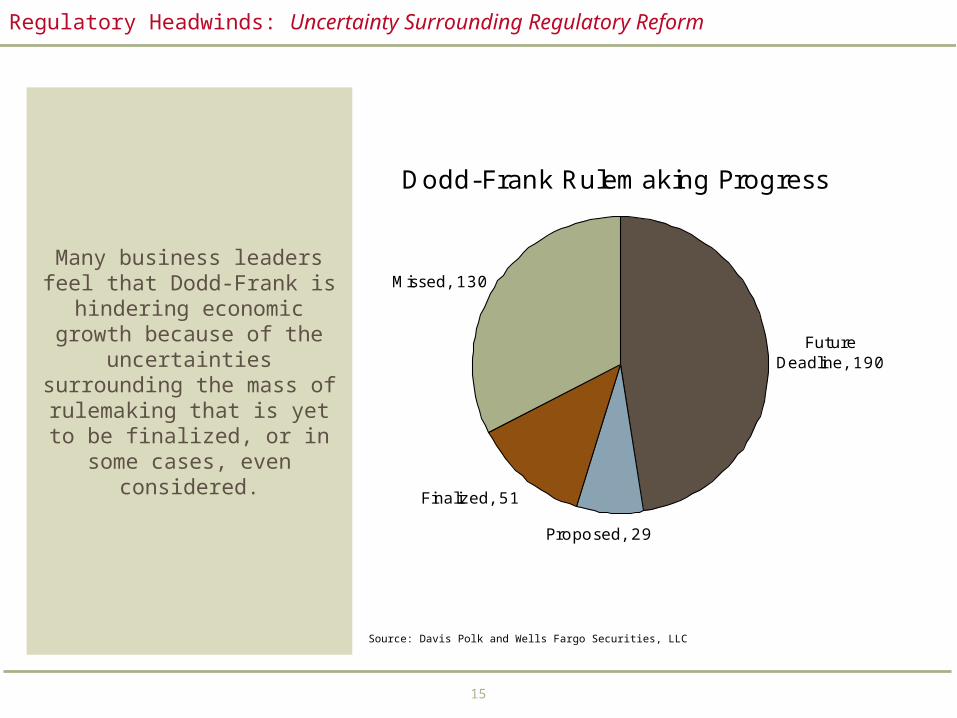
Regulatory Headwinds: Uncertainty Surrounding Regulatory Reform
Many business leaders feel that Dodd-Frank is
hindering economic growth because of the uncertainties
surrounding the mass of rulemaking that is yet to be finalized, or in some cases,
even considered.
Source: Davis Polk and Wells Fargo Securities, LLC
Dodd-Frank Rulemaking Progress
Future Deadline, 190
Proposed, 29
Finalized, 51
Missed, 130

16
The Fed’s Next Move
“U.S. fiscal policy must be placed on a sustainable path that ensures that debt relative to national income is at least stable or, preferably, declining over time. .”
- Ben Bernanke in Jackson Hole August 2011
Source: Federal Reserve and Wells Fargo Securities, LLC
ActionsStatements
Unfortunately, the recession, besides being extraordinarily severe as well as global in scope, was also unusual in being associated with both a very deep slump in the housing market and a historic financial crisis.
These two features of the downturn, individually and in combination, have acted to slow the natural recovery process.
Although we expect a moderate recovery to continue and indeed to strengthen over time, the Committee has marked down its outlook for the likely pace of growth over coming quarters.
The target for the federal funds rate would be held at its current low levels for at least two more years.
Without significant policy changes, the finances of the federal government will inevitably spiral out of control, risking severe economic and financial damage.
The Committee currently anticipates that economic conditions--including low rates of resource utilization and a subdued outlook for inflation over the medium run--are likely to warrant exceptionally low levels for the federal funds rate at least through mid-2013.
The Committee also will maintain its existing policy of reinvesting principal payments from its securities holdings. The Committee will regularly review the size and composition of its securities holdings and is prepared to adjust those holdings as appropriate.
Operation Twist - the Committee decided today to extend the average maturity of its holdings of securities. The Committee intends to purchase, by the end of June 2012, $400 billion of Treasury securities with remaining maturities of 6 years to 30 years and to sell an equal amount of Treasury securities with remaining maturities of 3 years or less. This program should put downward pressure on longer-term interest rates and help make broader financial conditions more accommodative.

17
The Fed’s Exit Strategy
The Fed eventually expects to begin reducing the size of
its balance sheet and adjusting it back to primarily Treasury
securities.
With recent discussions around “Operation Twist” and clarity on the path of
short-term rates, the timeline for reductions in the Fed’s balance sheet have been moved out
further.
Source: Federal Reserve and Wells Fargo Securities, LLC
US Factors Supplying Reserve Funds
-
500
1,000
1,500
2,000
2,500
3,000
1/5/
05
5/5/
05
9/5/
05
1/5/
06
5/5/
06
9/5/
06
1/5/
07
5/5/
07
9/5/
07
1/5/
08
5/5/
08
9/5/
08
1/5/
09
5/5/
09
9/5/
09
1/5/
10
5/5/
10
9/5/
10
1/5/
11
5/5/
11
($ B
illio
ns)
Treasury Agency MBS Other
Source: Federal Reserv e. Wells Fargo Securities
Federal Reserve Securities Holdings

18
Positioning Corporate Cash Portfolios
Framing the structure of a cash portfolio is important to determining the appropriate investment strategy
Source: ICI, Wells Fargo Securities, LLC
Segmentation of the Corporate Cash Portfolio – For Illustrative Purposes Only
Operating Cash (Horizon - daily)
Reserve Cash (Horizon - Quarterly)
Restricted Cash (Horizon - longer-term)
Strategic Cash (Horizon - longer-term)
Liquidity, Stability
of Principal
Less liquidity, higher yields,
more price volatility
Q1 Q2 Q3 Q4

19
Positioning Corporate Portfolios
There is little to no pickup in yield for taking on duration risk outside of the credit markets.
Source: Wells Fargo Securities, LLC
Relative Value in the Money Markets – For Illustrative Purposes Only
0
5
10
15
20
25
30
35
40
45
1-Day 7-Day 30- 60- 90-
A2/P2
VRDN
UK
Nordics
Aussies
J apanese
Canadians
Non-Financials
Financials
DiscosBills
ECR

202020
Market Strategist Commentary is a product of Wells Fargo Securities, LLC’s fixed income trading desk and is not a product of Wells Fargo Securities, LLC’s Global Research Department. The views of the Market Strategist may differ from that of the Global Research Department. Publications of Wells Fargo Securities, LLC’s Global Research Department may be viewed at www.wellsfargo.com/research. Additional information is available on request.
About Wells Fargo Securities Wells Fargo Securities is the trade name for the capital markets and investment banking services of Wells Fargo & Company and its affiliates, including Wells Fargo Securities, LLC, member FINRA and SIPC.
Important Information for Non-U.S.. Recipients
The securities and related financial instruments described herein may not be eligible for sale in all jurisdictions or to certain categories of investors. For certain non-U.S.. institutional readers (including readers in the EEA), this report is distributed by Wells Fargo Securities International Limited. For the purposes of Section 21 of the U.K. Financial Services and Markets Act 2000, this report has been approved by Wells Fargo Securities International Limited. This report is not intended for, and should not be relied on by, private customers. Please consult your Financial Advisor or the Wells Fargo Securities office in your area for additional information. U.S. residents are directed to wachovia.com for investment and related services. For Wells Fargo SecuritiesInternational Limited's policy for managing conflicts of interest in connection with research, please go to: www.wachoviaresearch.com/conflicts
Important Information for Australian Recipients
Wells Fargo Securities, LLC is exempt from the requirements to hold an Australian financial services license in respect of the financial services it provides to wholesale clients in Australia. Wells Fargo Securities, LLC is a U.S. broker-dealer registered with the U.S. Securities and Exchange Commission and a member of FINRA and SIPC. Wells Fargo Securities, LLC is regulated under U.S. laws which differ from Australian laws. Any offer or documentation provided to you by Wells Fargo Securities, LLC in the course of providing the financial services will be prepared in accordance with the laws of the United States and not Australian laws.
Important Disclosures Relating to Conflicts of Interest and Potential Conflicts of Interest
Wells Fargo Securities, LLC may sell or buy the subject securities to/from customers on a principal basis. Wells Fargo Securities, LLC has or may have proprietary positions in the securities mentioned herein. The trading desk has or may have proprietary positions in the securities mentioned herein. The author’s compensation is based on, among other things, Wells Fargo Securities, LLC’s overall performance, the profitability of Wells Fargo Securities, LLC’s Fixed income Department and the profitability of the trading desk.
This report, IDs and passwords are available at www.wellsfargo.com/researchThis report is for your information only and is not an offer to sell, or a solicitation of an offer to buy, the securities or instruments named or described in this report. Interested parties are advised to contact the entity with which they deal, or the entity that provided this report to them, if they desire further information. The information in this report has been obtained or derived from sources believed by Wells Fargo Securities, LLC to be reliable, but Wells Fargo Securities, LLC does not represent that this information is accurate or complete. Any opinions or estimates contained in this report represent the judgment of Wells Fargo Securities, LLC at this time and are subject to change without notice. Wells Fargo Securities, LLC and its affiliates may from time to time provide advice with respect to, acquire, hold or sell a position in, the securities or instruments named or described in this report. Wells Fargo Securities, LLC is a separate legal entity and distinct from affiliated banks.Copyright © 2009 Wells Fargo & Company
SECURITIES: NOT FDIC-INSURED/NOT BANK-GUARANTEED/MAY LOSE VALUE
Disclosure Appendix