short-term energy outlook november 2002 overview · · 2011-10-17energy information...
TRANSCRIPT
Energy Information Administration/Short-Term Energy Outlook -- November 2002 1
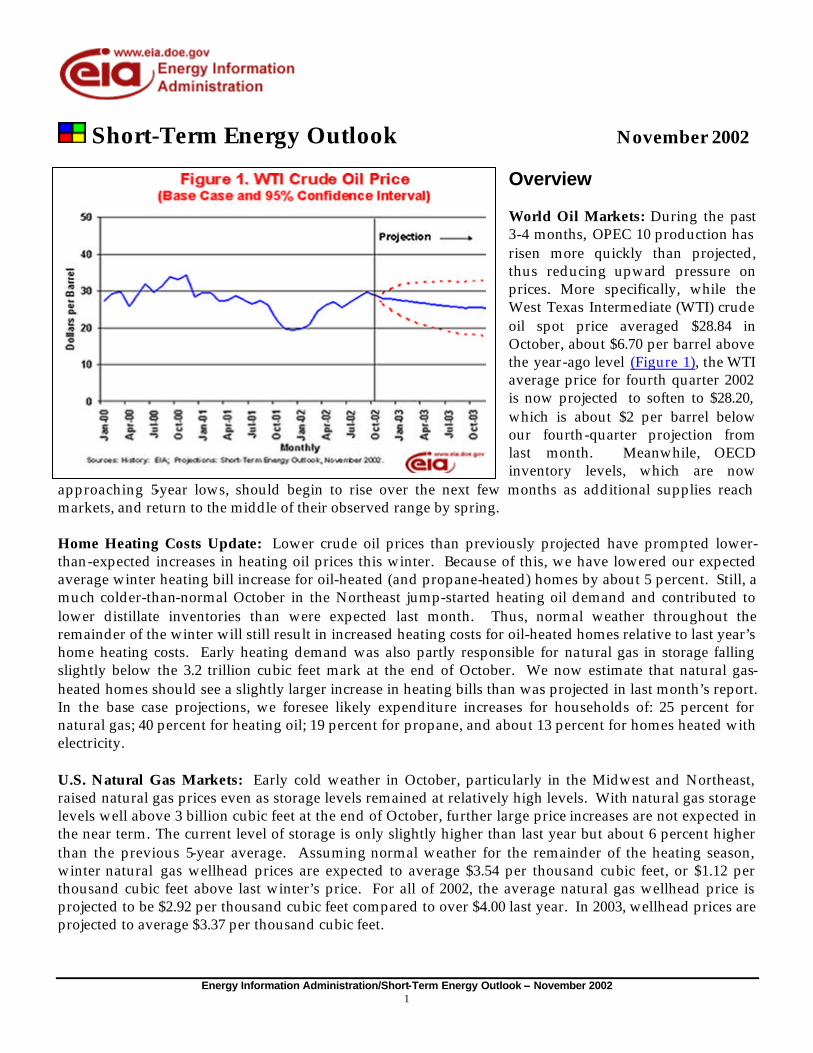
Short-Term Energy Outlook November 2002 Overview World Oil Markets: During the past 3-4 months, OPEC 10 production has risen more quickly than projected, thus reducing upward pressure on prices. More specifically, while the West Texas Intermediate (WTI) crude oil spot price averaged $28.84 in October, about $6.70 per barrel above the year-ago level (Figure 1), the WTI average price for fourth quarter 2002 is now projected to soften to $28.20, which is about $2 per barrel below our fourth-quarter projection from last month. Meanwhile, OECD inventory levels, which are now
approaching 5-year lows, should begin to rise over the next few months as additional supplies reach markets, and return to the middle of their observed range by spring. Home Heating Costs Update: Lower crude oil prices than previously projected have prompted lower-than-expected increases in heating oil prices this winter. Because of this, we have lowered our expected average winter heating bill increase for oil-heated (and propane-heated) homes by about 5 percent. Still, a much colder-than-normal October in the Northeast jump-started heating oil demand and contributed to lower distillate inventories than were expected last month. Thus, normal weather throughout the remainder of the winter will still result in increased heating costs for oil-heated homes relative to last year’s home heating costs. Early heating demand was also partly responsible for natural gas in storage falling slightly below the 3.2 trillion cubic feet mark at the end of October. We now estimate that natural gas-heated homes should see a slightly larger increase in heating bills than was projected in last month’s report. In the base case projections, we foresee likely expenditure increases for households of: 25 percent for natural gas; 40 percent for heating oil; 19 percent for propane, and about 13 percent for homes heated with electricity. U.S. Natural Gas Markets: Early cold weather in October, particularly in the Midwest and Northeast, raised natural gas prices even as storage levels remained at relatively high levels. With natural gas storage levels well above 3 billion cubic feet at the end of October, further large price increases are not expected in the near term. The current level of storage is only slightly higher than last year but about 6 percent higher than the previous 5-year average. Assuming normal weather for the remainder of the heating season, winter natural gas wellhead prices are expected to average $3.54 per thousand cubic feet, or $1.12 per thousand cubic feet above last winter’s price. For all of 2002, the average natural gas wellhead price is projected to be $2.92 per thousand cubic feet compared to over $4.00 last year. In 2003, wellhead prices are projected to average $3.37 per thousand cubic feet.
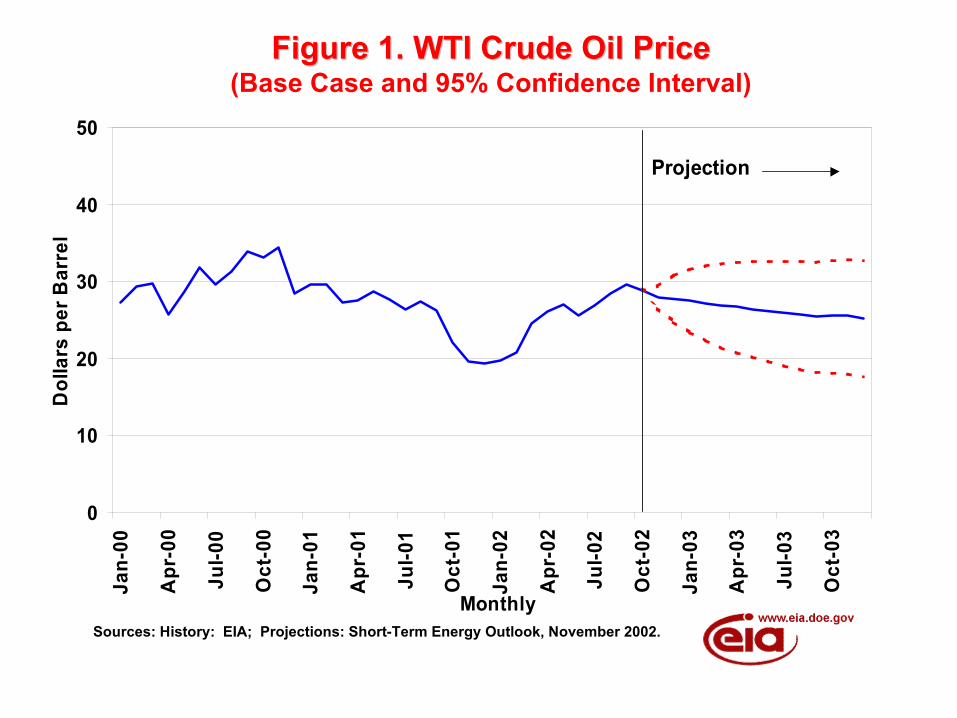
Figure 1. WTI Crude Oil PriceFigure 1. WTI Crude Oil Price(Base Case and 95% Confidence Interval)
Sources: History: EIA; Projections: Short-Term Energy Outlook, November 2002.
0
10
20
30
40
50Ja
n-00
Apr
-00
Jul-0
0
Oct
-00
Jan-
01
Apr
-01
Jul-0
1
Oct
-01
Jan-
02
Apr
-02
Jul-0
2
Oct
-02
Jan-
03
Apr
-03
Jul-0
3
Oct
-03
Monthly
Dol
lars
per
Bar
rel
Projection
Energy Information Administration/Short-Term Energy Outlook -- November 2002 2
Data Notes: EIA’s Annual Energy Review, 2001 (AER2001) was released on EIA’s website on October 29, 2002. The report included some important revisions and improvements to the historical data for electricity generation and related fuel consumption between 1989 and 2001. Details concerning the nature of these changes are provided in Appendix H of the AER2001. One particularly important result of these data changes is that total natural gas demand estimates have been revised upward significantly in most of the years since 1989. So far, only annual estimates for the revised data are available. Higher frequency databases, including those that support this Outlook and the Monthly Energy Review, will not be available until Spring 2003. Until then, the aggregate natural gas balance shown in the Outlook will remain on the old basis. International Oil Markets Crude Oil Prices. Average prices of key crude oils were down slightly last month, as the Brent, OPEC Basket, and West Texas Intermediate (WTI) crude oil spot prices averaged $0.10-$0.90 per barrel less in October than in September. By the end of October oil prices had fallen by $3-$4 per barrel from end-September levels. Concerns over low OECD commercial oil inventories were offset by the prospect of increasing supplies in the near future, as the OPEC 10 continued to increase production above quota levels, Iraqi exports began rising, and hope for a diplomatic solution in the U.N.’s confrontation with Iraq eased tensions. The OPEC basket price has been above $22 per barrel since March 8, and the October average of $27.30 per barrel marked the eighth consecutive month that the average monthly OPEC basket price remained within OPEC’s original target range of $22 - $28 per barrel. The monthly average OPEC basket price is projected to remain within this target range throughout the forecast period. International Oil Supply and Demand. In October, OPEC 10 production is estimated to have risen to about 2.7 million barrels per day above quota levels, led by increases from Saudi Arabia, Iran and Venezuela. Iraqi production also continued to rise in October as U.N.-sanctioned oil exports averaged almost 600,000 barrels per day above September levels. The Outlook assumes that Iraqi production will continue to fluctuate around the October average level of 2.4 million barrels per day, with a brief downturn expected following the next rollover of the U.N.’s oil-for-food program at the end of November.
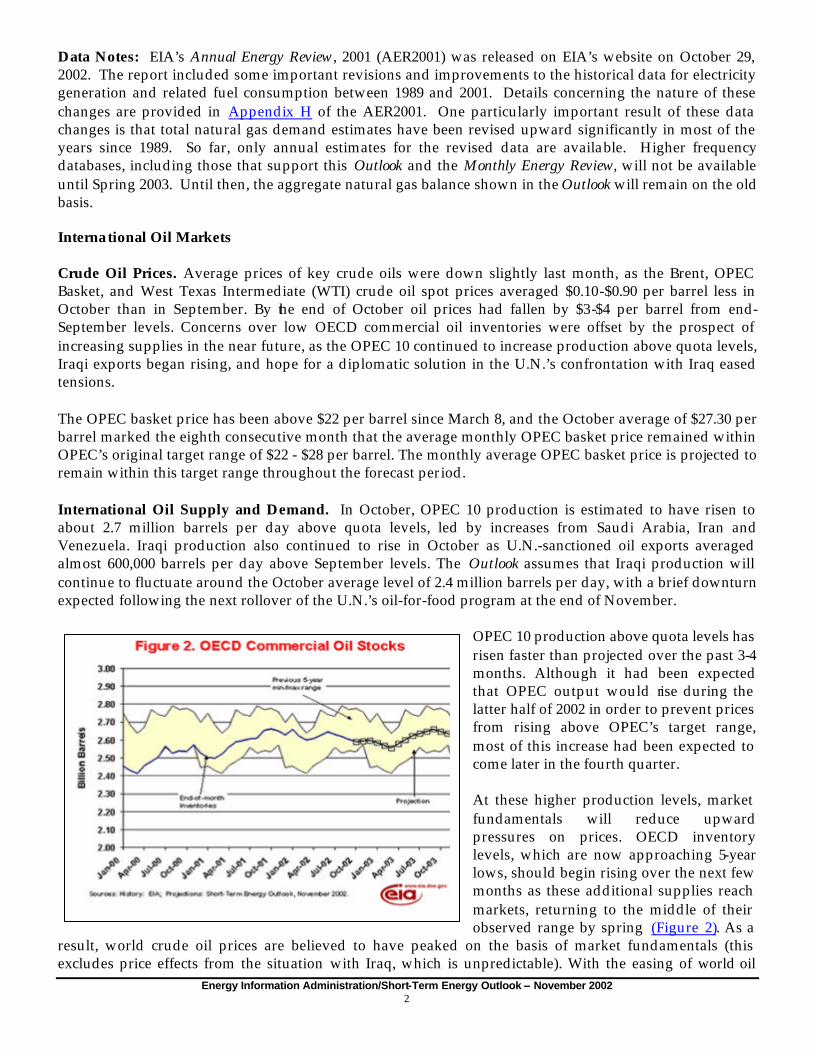
OPEC 10 production above quota levels has risen faster than projected over the past 3-4 months. Although it had been expected that OPEC output would rise during the latter half of 2002 in order to prevent prices from rising above OPEC’s target range, most of this increase had been expected to come later in the fourth quarter. At these higher production levels, market fundamentals will reduce upward pressures on prices. OECD inventory levels, which are now approaching 5-year lows, should begin rising over the next few months as these additional supplies reach markets, returning to the middle of their observed range by spring (Figure 2). As a
result, world crude oil prices are believed to have peaked on the basis of market fundamentals (this excludes price effects from the situation with Iraq, which is unpredictable). With the easing of world oil
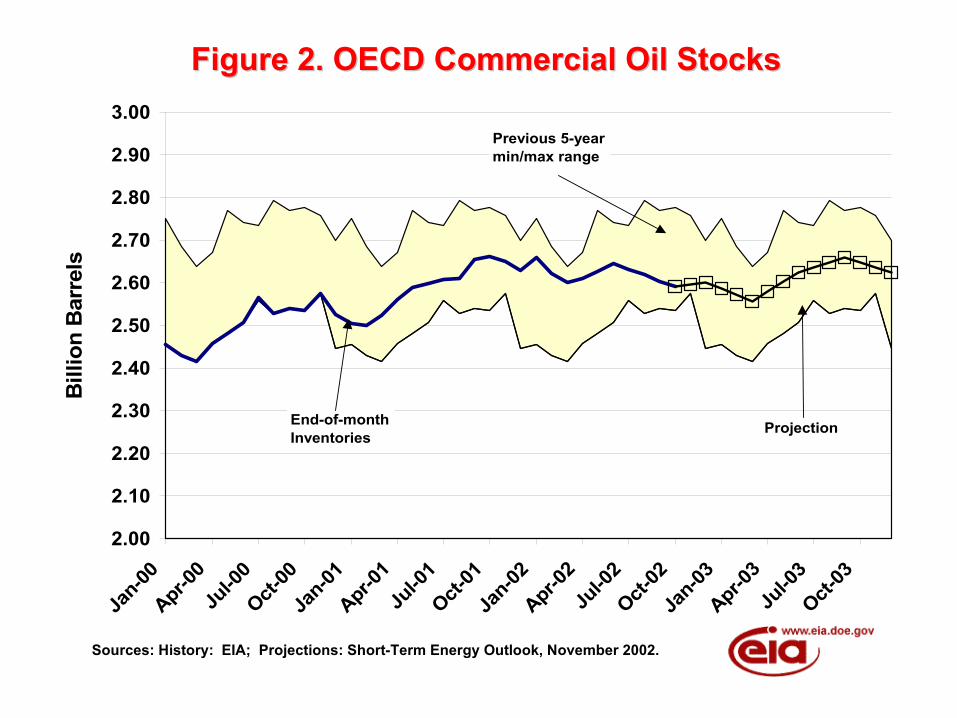
Figure 2. OECD Commercial Oil StocksFigure 2. OECD Commercial Oil Stocks
Sources: History: EIA; Projections: Short-Term Energy Outlook, November 2002.
2.00
2.10
2.20
2.30
2.40
2.50
2.60
2.70
2.80
2.90
3.00
Jan-00
Apr-00
Jul-0
0Oct-
00Ja
n-01Apr-0
1Ju
l-01
Oct-01
Jan-02
Apr-02
Jul-0
2Oct-
02Ja
n-03Apr-0
3Ju
l-03
Oct-03
Bill
ion
Bar
rels
End-of-monthInventories
Previous 5-yearmin/max range
Projection
Energy Information Administration/Short-Term Energy Outlook -- November 2002 3
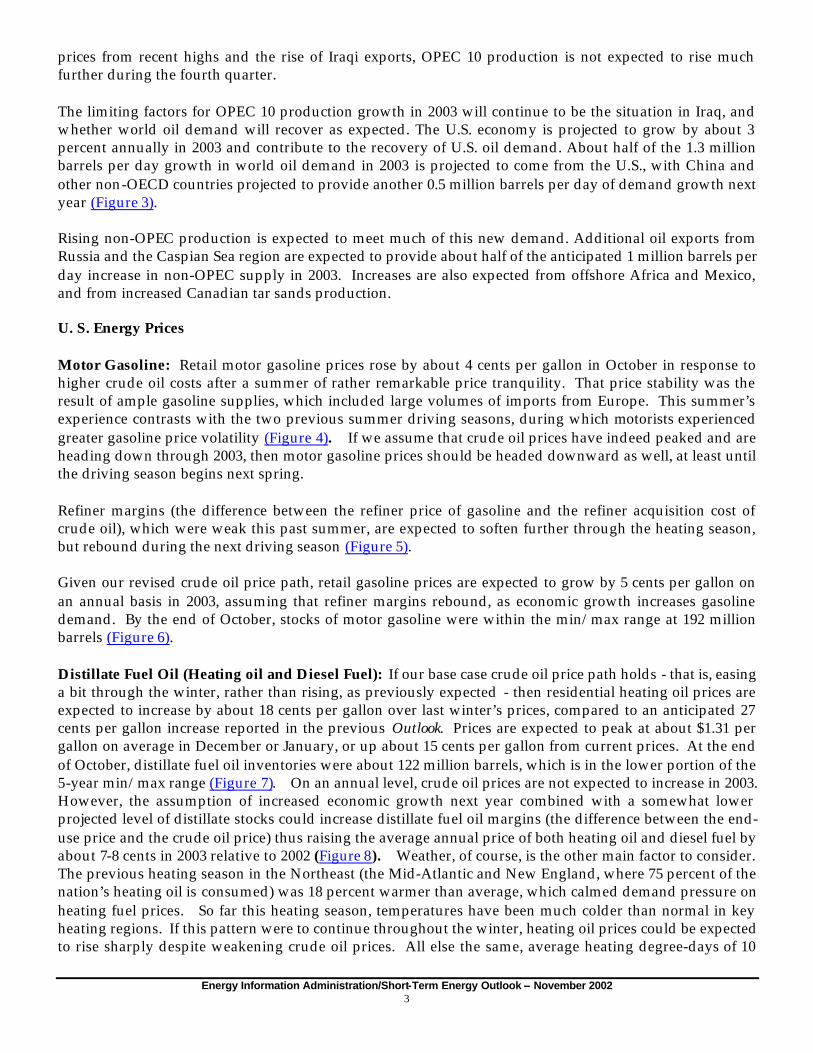
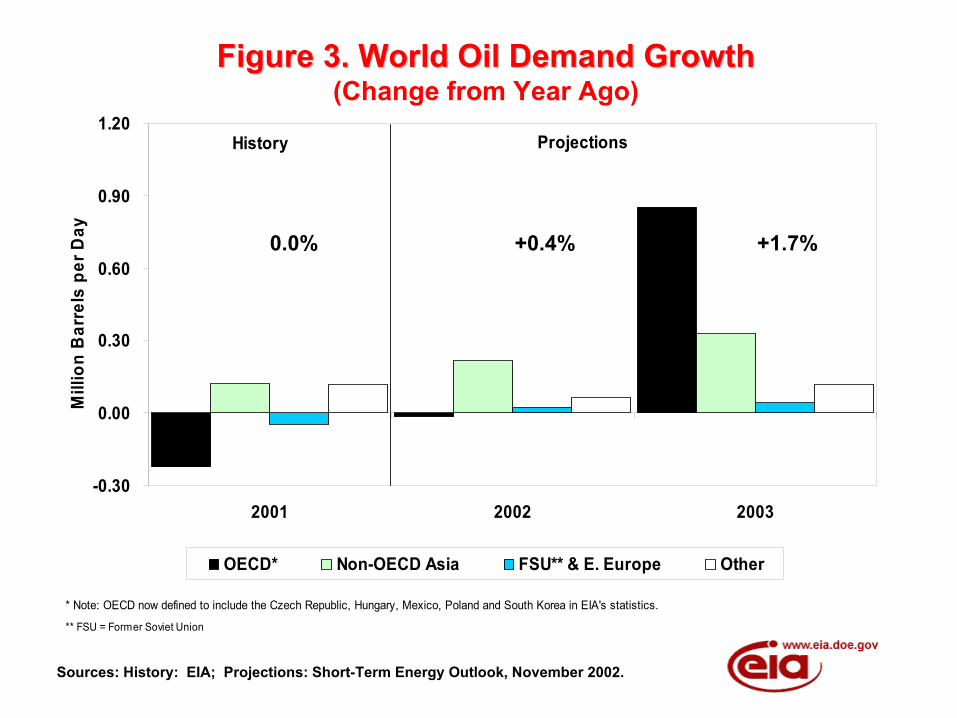
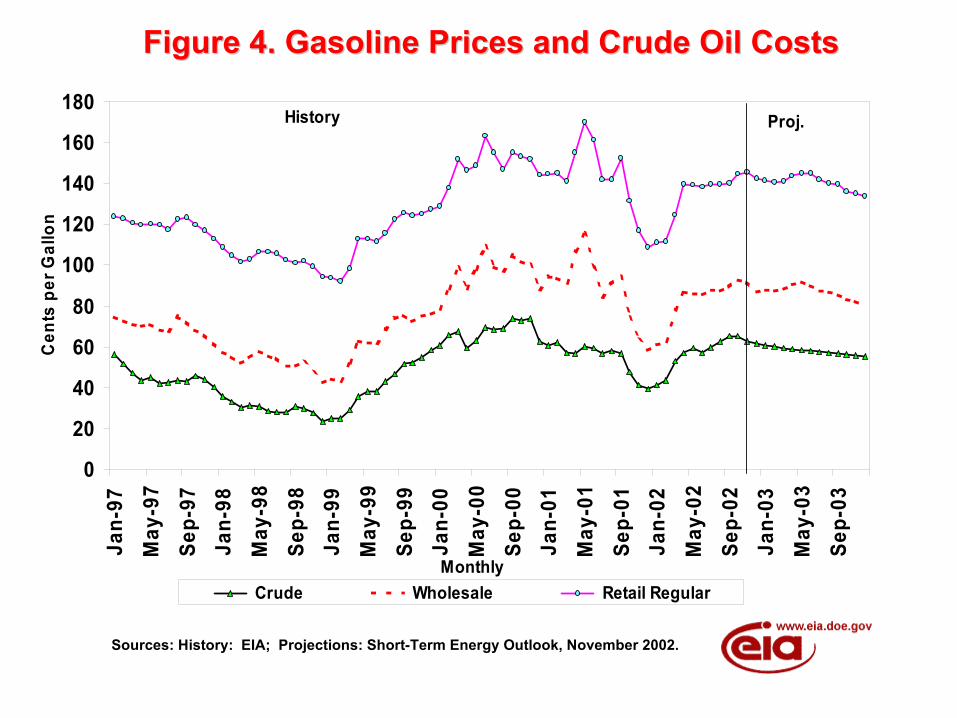
prices from recent highs and the rise of Iraqi exports, OPEC 10 production is not expected to rise much further during the fourth quarter. The limiting factors for OPEC 10 production growth in 2003 will continue to be the situation in Iraq, and whether world oil demand will recover as expected. The U.S. economy is projected to grow by about 3 percent annually in 2003 and contribute to the recovery of U.S. oil demand. About half of the 1.3 million barrels per day growth in world oil demand in 2003 is projected to come from the U.S., with China and other non-OECD countries projected to provide another 0.5 million barrels per day of demand growth next year (Figure 3). Rising non-OPEC production is expected to meet much of this new demand. Additional oil exports from Russia and the Caspian Sea region are expected to provide about half of the anticipated 1 million barrels per day increase in non-OPEC supply in 2003. Increases are also expected from offshore Africa and Mexico, and from increased Canadian tar sands production. U. S. Energy Prices Motor Gasoline: Retail motor gasoline prices rose by about 4 cents per gallon in October in response to higher crude oil costs after a summer of rather remarkable price tranquility. That price stability was the result of ample gasoline supplies, which included large volumes of imports from Europe. This summer’s experience contrasts with the two previous summer driving seasons, during which motorists experienced greater gasoline price volatility (Figure 4). If we assume that crude oil prices have indeed peaked and are heading down through 2003, then motor gasoline prices should be headed downward as well, at least until the driving season begins next spring. Refiner margins (the difference between the refiner price of gasoline and the refiner acquisition cost of crude oil), which were weak this past summer, are expected to soften further through the heating season, but rebound during the next driving season (Figure 5). Given our revised crude oil price path, retail gasoline prices are expected to grow by 5 cents per gallon on an annual basis in 2003, assuming that refiner margins rebound, as economic growth increases gasoline demand. By the end of October, stocks of motor gasoline were within the min/max range at 192 million barrels (Figure 6). Distillate Fuel Oil (Heating oil and Diesel Fuel): If our base case crude oil price path holds - that is, easing a bit through the winter, rather than rising, as previously expected - then residential heating oil prices are expected to increase by about 18 cents per gallon over last winter’s prices, compared to an anticipated 27 cents per gallon increase reported in the previous Outlook. Prices are expected to peak at about $1.31 per gallon on average in December or January, or up about 15 cents per gallon from current prices. At the end of October, distillate fuel oil inventories were about 122 million barrels, which is in the lower portion of the 5-year min/max range (Figure 7). On an annual level, crude oil prices are not expected to increase in 2003. However, the assumption of increased economic growth next year combined with a somewhat lower projected level of distillate stocks could increase distillate fuel oil margins (the difference between the end-use price and the crude oil price) thus raising the average annual price of both heating oil and diesel fuel by about 7-8 cents in 2003 relative to 2002 (Figure 8). Weather, of course, is the other main factor to consider. The previous heating season in the Northeast (the Mid-Atlantic and New England, where 75 percent of the nation’s heating oil is consumed) was 18 percent warmer than average, which calmed demand pressure on heating fuel prices. So far this heating season, temperatures have been much colder than normal in key heating regions. If this pattern were to continue throughout the winter, heating oil prices could be expected to rise sharply despite weakening crude oil prices. All else the same, average heating degree-days of 10
Sources: History: EIA; Projections: Short-Term Energy Outlook, November 2002.
Figure 3. World Oil Demand GrowthFigure 3. World Oil Demand Growth(Change from Year Ago)
-0.30
0.00
0.30
0.60
0.90
1.20
2001 2002 2003
Mill
ion
Bar
rels
per
Day
OECD* Non-OECD Asia FSU** & E. Europe Other
History Projections
** FSU = Former Soviet Union
* Note: OECD now defined to include the Czech Republic, Hungary, Mexico, Poland and South Korea in EIA's statistics.
0.0% +0.4% +1.7%
Sources: History: EIA; Projections: Short-Term Energy Outlook, November 2002.
Figure 4. Gasoline Prices and Crude Oil CostsFigure 4. Gasoline Prices and Crude Oil Costs
0
20
40
60
80
100
120
140
160
180Ja
n-97
May
-97
Sep-
97Ja
n-98
May
-98
Sep-
98Ja
n-99
May
-99
Sep-
99Ja
n-00
May
-00
Sep-
00Ja
n-01
May
-01
Sep-
01Ja
n-02
May
-02
Sep-
02Ja
n-03
May
-03
Sep-
03
Monthly
Cen
ts p
er G
allo
n
Crude Wholesale Retail Regular
History Proj.
Figure 5. Motor Gasoline SpreadsFigure 5. Motor Gasoline Spreads
Sources: History: EIA; Projections: Short-Term Energy Outlook, November 2002.
0.0
10.0
20.0
30.0
40.0
50.0
60.0
70.0
80.0
199501 199601 199701 199801 199901 200001 200101 200201 200301
Cen
ts p
er G
allo
n
Refiner
Retail
Total
History Proj.
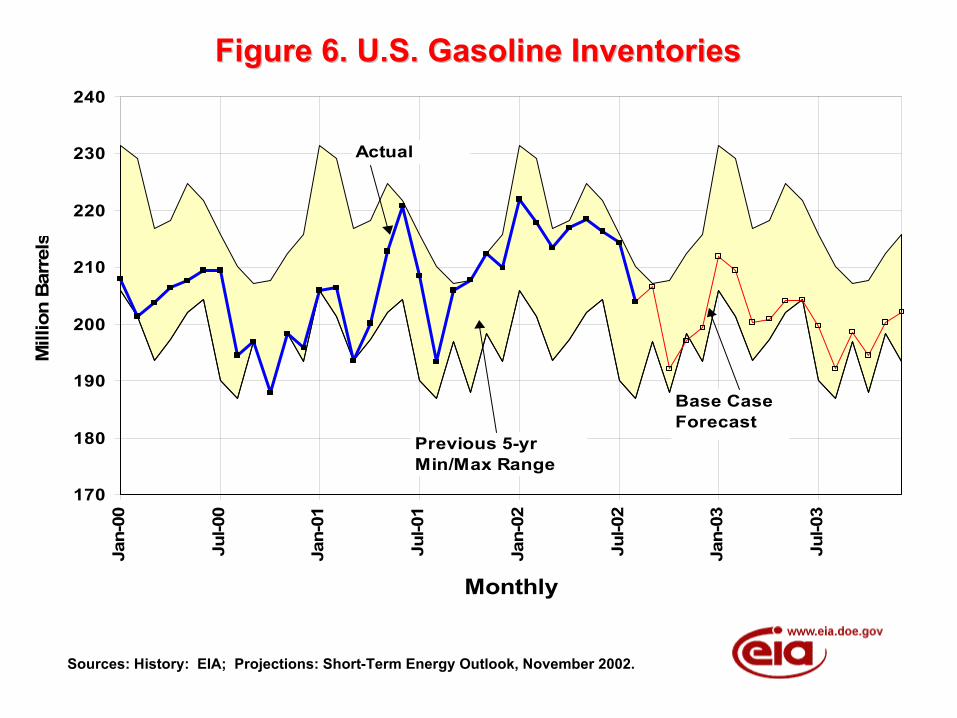
Figure 6. U.S. Gasoline InventoriesFigure 6. U.S. Gasoline Inventories
Sources: History: EIA; Projections: Short-Term Energy Outlook, November 2002.
170
180
190
200
210
220
230
240Ja
n-00
Jul-0
0
Jan-
01
Jul-0
1
Jan-
02
Jul-0
2
Jan-
03
Jul-0
3
Monthly
Mill
ion
Bar
rels
Actual
Base CaseForecast
Previous 5-yr Min/Max Range
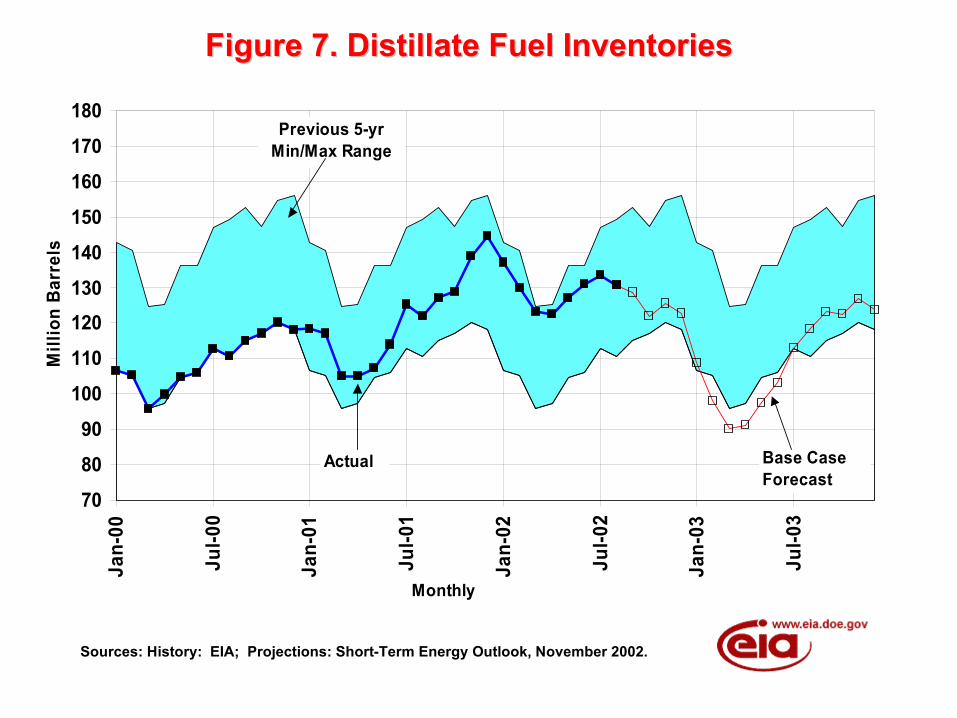
Figure 7. Distillate Fuel InventoriesFigure 7. Distillate Fuel Inventories
Sources: History: EIA; Projections: Short-Term Energy Outlook, November 2002.
708090
100110120130140150160170180
Jan-
00
Jul-0
0
Jan-
01
Jul-0
1
Jan-
02
Jul-0
2
Jan-
03
Jul-0
3
Monthly
Mill
ion
Barr
els
Actual Base CaseForecast
Previous 5-yr Min/Max Range

Figure 8. Distillate Fuel PricesFigure 8. Distillate Fuel Prices
Sources: History: EIA; Projections: Short-Term Energy Outlook, November 2002.
0
20
40
60
80
100
120
140
160
180Ja
n-97
May
-97
Sep-
97Ja
n-98
May
-98
Sep-
98Ja
n-99
May
-99
Sep-
99Ja
n-00
May
-00
Sep-
00Ja
n-01
May
-01
Sep-
01Ja
n-02
May
-02
Sep-
02Ja
n-03
May
-03
Sep-
03
Monthly
Cen
ts p
er G
allo
n
Retail Heating Oil Retail Diesel Crude Oil
History Proj.

Energy Information Administration/Short-Term Energy Outlook -- November 2002 4
percent above base-case (normal) levels are estimated to increase heating oil prices by about 8 cents per gallon (see Winter Fuels Outlook: 2002-2003). Natural Gas: September hurricanes in the Gulf of Mexico temporarily shut in some gas production, causing spot prices at the Henry Hub and elsewhere to rise above the $4.00 per million btu mark for most of October. Early cold weather in October, particularly in the Midwest, also helped raise prices even as storage levels remained relatively high (Figure 9). With storage levels well above 3 trillion cubic feet (tcf) at the end of October, further large price increases are not expected in the near term, unless the weather turns abnormally cold for a prolonged period. A level of 3-3.2 tcf of working gas in storage by November 1 is considered sufficient to ensure adequate natural gas supplies for the winter. The current (end of October) storage level for working gas is 3.15 tcf, about the same level as year ago, when the wellhead price was $2.45 per thousand cubic feet, and about 5 percent higher than the previous 5-year average. Moreover, with crude oil prices expected to decline over the next several months there should be less upward pressure on natural gas wellhead prices. The combination of ample storage and lower crude oil prices should ensure fairly stable natural gas prices through the winter. Unusually cold weather for November in the gas consuming regions could cause natural gas inventories to be withdrawn more rapidly than planned, and consequently prices would respond by moving upward. A situation like this occurred in 1996, when November weather was nearly 20 percent colder than normal. In that case, although the temperatures in December and January were slightly warmer than average, enough gas in storage was withdrawn in November to keep wellhead prices elevated through the end of January. Assuming normal weather (13 percent colder than last winter) for the remainder of the heating season (November through March), we expect to see winter natural gas wellhead prices averaging around $3.54 per thousand cubic feet, or about $1.12 per thousand cubic feet above last winter’s price. For the year, the annual average natural gas wellhead price is projected to be about $2.92 per thousand cubic feet compared to over $4.00 last year. Wellhead prices in 2003 are projected to gain about $0.45 per thousand cubic feet over the annual average price for 2002, due to lower projected volumes of underground natural gas in storage for most of next year compared with 2002, increasing economic growth (which increases natural gas demand), and little or no change in the annual average crude oil price for 2003. U. S. Oil Demand Year-to-date data indicate overall weakness in total petroleum demand, which, through October, has declined by an estimated 0.4 percent compared to the same period last year. This weakness has been brought about by three main factors: weakness in industrial activity, record warm weather in the first quarter of the year, and unfavorable relative price shifts in the price-sensitive sectors. The first two factors have dampened total distillate consumption in all the major consuming sectors. (Despite a colder-than-average October, preliminary estimates for that month indicate continued decline in total distillate demand, reflecting continued weakness in the industrial sector). In a relative sense, residual fuel oil demand has been the biggest casualty as a result of all three factors, exhibiting weakness in both the industrial and power-generation sectors. In addition, commercial aviation has undergone a structural downward shift that has lasted for more than a year. Offsetting weakness in these areas, there has been robust growth in motor gasoline demand, reflecting (in part) continuing consumer preference for large vehicles. One result of this trend has been an ongoing reduction in overall fuel efficiency. In addition, recent weather patterns and forecasts for continuing cold weather appeared to have bolstered heating oil demand. Data show that heating degree-days in the Northeast for October, the first month in the winter season, were 21 percent higher than normal, and that November’s weather in that region is forecast to be colder than normal as well. Despite record warm weather during the first quarter, total liquefied petroleum gas demand has been exhibiting strength as a petrochemical feedstock. But that demand growth resulted from a shift in
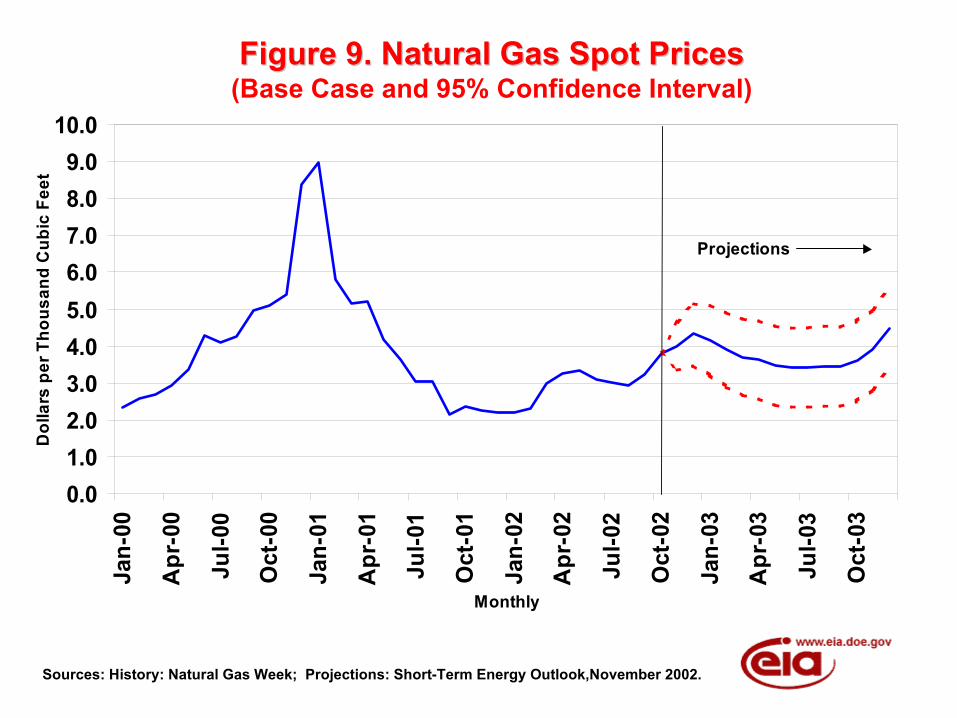
Figure 9. Natural Gas Spot PricesFigure 9. Natural Gas Spot Prices(Base Case and 95% Confidence Interval)
Sources: History: Natural Gas Week; Projections: Short-Term Energy Outlook,November 2002.
0.01.02.03.04.05.06.07.08.09.0
10.0Ja
n-00
Apr
-00
Jul-0
0
Oct
-00
Jan-
01
Apr
-01
Jul-0
1
Oct
-01
Jan-
02
Apr
-02
Jul-0
2
Oct
-02
Jan-
03
Apr
-03
Jul-0
3
Oct
-03
Monthly
Dol
lars
per
Tho
usan
d C
ubic
Fee
t
Projections

Energy Information Administration/Short-Term Energy Outlook -- November 2002 5
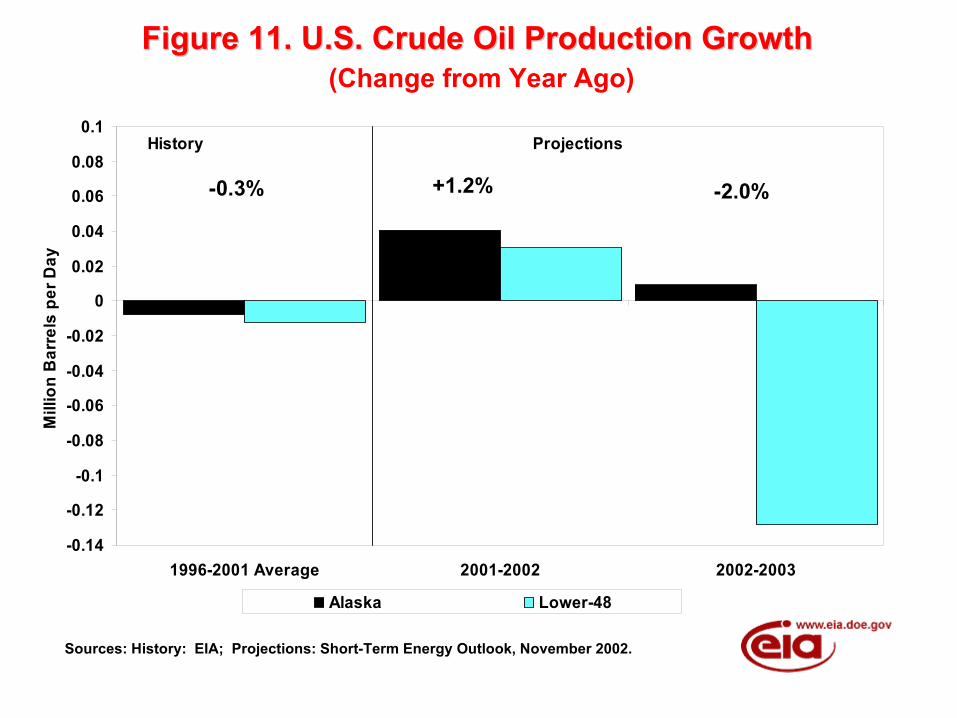
economics, following greatly dampened liquefied petroleum gas demand in 2001, when natural gas prices reached record highs. Despite the negative trends seen in the current year, total domestic petroleum demand is projected to increase for the year as a whole by 90,000 barrels per day, or 0.5 percent, from the 2001 average (Figure 10). Robust increases in motor gasoline demand (3.0 percent) and liquefied petroleum gases demand (6.1 percent) are largely offset by declines in jet fuel demand (2.6 percent), distillate demand (2 percent), residual fuel oil demand (18 percent) and other oils (about 1 percent). Residual fuel oil demand, in particular, is projected to reach an all-time low of 660,000 barrels per day, due to the combined effects of lower natural gas prices (on an annual basis) and continued weakness in industrial activity. The combined effects of the events of September 2001 on jet fuel markets in the last quarter of that year and the prospect of normal or colder-than-normal weather for the current quarter (in contrast to the warm weather of a year ago) are projected to result in a year-to-year increase of 600,000 barrels per day in petroleum demand for the October-to-December period. This would ensure a small increase in total petroleum products demand for the year as a whole. That growth in the current quarter could, of course, be even larger if the relatively cold weather currently evident in the Northeast persists through the end of the year. In 2003, growth in petroleum products demand is projected to average 630,000 barrels per day, or 3.4 percent. In contrast to 2002, growth in 2003 is expected to be distributed among all the major product groups and across the year as a whole. Motor gasoline demand, buoyed by accelerating growth in personal disposable income and continued deterioration in average fuel efficiency, is projected to increase by about another 3 percent above 2002 levels. Jet-fuel demand is projected to grow 5 percent, but that increase results largely from the depressed levels of 2002. Continued weakness in air travel activity has, in fact, prompted some air carriers to implement selective curtailments over the next 12 months. As a result, jet-fuel demand levels for the year are expected to be below the average of 2000, the year prior to the terrorist attacks. Distillate fuel demand is projected to rise about 3.6 percent due to the weather effects and the long-awaited recovery in industrial activity. Residual fuel oil demand is expected to stabilize at an average level of about 730,000 barrels per day. The 100,000 barrels-per-day increase is more reflective of year-to-year changes in weather and industrial activity patterns. The smallness of relative price shifts and projected increases in hydroelectric generation preclude the recovery of the substantial market share lost to other fuels over the last several years. U.S. Oil Supply Average domestic oil production in 2002 is expected to increase by about 70,000 barrels per day, or 1 percent, to a level of 5.87 million barrels of oil per day. For 2003, a 2.0 percent decrease is expected resulting in a production rate of 5.75 million barrels of oil per day average for the year (Figure 11). Lower 48 States oil production is expected to increase slightly to a rate of 4.87 million barrels per day in 2002, followed by a decrease of 130,000 thousand barrels per day in 2003. Shell’s Brutus platform is expected to peak its oil production at 100 thousand barrels per day this year. Oil production from the Mars, Troika, Ursa, Dianna-Hoover and Brutus Federal Offshore fields is expected to account for about 9.5 percent of the lower-48 oil production by the 4th quarter of 2003. Alaska is expected to account for about 18 percent of total U.S. oil production in 2003. Alaska oil production is expected to increase by 4 percent in 2002 and increase by 1 percent in 2003. The increase in 2003 will be the result of field facilities expansion in the new satellite Colville River (Alpine) field, which will eventually add 60 to 70 thousand barrels per day. Another satellite field, North Star, came on in November 2001 and is currently producing at a rate of over 60 thousand barrels per day. Production from the Kuparuk River, West Sak, Tabasco, Tarn and Meltwater fields are expected to total an average of 215 thousand barrels per day and to remain steady during the 2002 and 2003 forecast periods.

-400
-300
-200
-100
0
100
200
300
400
500
600
700
800
2001 2002 2003
Thou
sand
Bar
rels
per
Day
Total Motor Gasoline Jet Fuel Fuel Oil * Other
History Projections
* Sum of distillate and residual fuel.
Figure 10. Petroleum Products Demand GrowthFigure 10. Petroleum Products Demand Growth(Change from Year Ago)
Sources: History: EIA; Projections: Short-Term Energy Outlook, November 2002.
- 0.3% +0.5% +3.4%
Sources: History: EIA; Projections: Short-Term Energy Outlook, November 2002.
Figure 11. U.S. Crude Oil Production GrowthFigure 11. U.S. Crude Oil Production Growth (Change from Year Ago)
-0.14
-0.12
-0.1
-0.08
-0.06
-0.04
-0.02
0
0.02
0.04
0.06
0.08
0.1
1996-2001 Average 2001-2002 2002-2003
Mill
ion
Bar
rels
per
Day
Alaska Lower-48
History Projections
-0.3% +1.2% -2.0%
Energy Information Administration/Short-Term Energy Outlook -- November 2002 6
Natural Gas Demand and Supply Total natural gas demand for the first half of 2002 fell by 610 bcf. That translates into a decline of 5.2 percent from 2001 levels, although nearly 50 percent of the first-half decline in total demand was due to weather effects in the residential and commercial sectors. Second-half strength in the residential and commercial sectors, fed by weather-related increases in the fourth quarter, remains highly probable. Currently, we expect an average natural gas demand increase for the last six months of 2002 of 13.2 percent in the combined residential and commercial sectors relative to 2001 levels. Below-normal temperatures in both the Northeast and the Midwest so far this winter have bolstered prospects for a strong close to 2002 for natural gas demand. Although natural gas in storage at the end of the injection season was high by historical standards, earlier predictions of peak storage above 3,200 billion cubic feet proved wrong partly because of the cold October and early November weather. Electric power-related demand for natural gas (defined as demand from electric utilities plus nonutility generators, including industrial and commercial cogenerators) is expected to post an increase of about 6 percent in 2002, driven in large measure by the strong growth in electricity demand and output in the third quarter related to above-normal temperatures and cooling demand across much of the country. Additional growth in this sector of about 3 percent is expected for 2003. The lower growth rate expected next year is mainly the result of relatively weak third-quarter 2003 growth (on a year-over-year basis) under normal (i.e., cooler) weather assumptions. Total natural gas demand growth for 2002 is expected to be 1.1 percent (Figure 12). Weakness in the industrial sector prevents the growth rate from being more substantial. Excluding the portion of industrial demand not related to power and steam production by nonutilities, total natural gas demand is expected to show an increase of about 3.0 percent in 2002, largely due to increases in the electric power sector driven by increased cooling and heating demand in the third and fourth quarters. In 2003, this subset of total demand is expected to grow by an additional 3 percent in the current base case. Thus, moderate strength in natural gas demand seems very likely in 2003, especially if the industrial sector as a whole expands significantly as expected. How much any increased industrial use is likely to contribute to growth next year is hard to say at this point, but a resurgence toward more normal growth patterns could increase the growth rate significantly. Concerning the industrial sector demand for natural gas, it should be said that the levels implied in the current monthly data published by EIA and used in the database that supports this Outlook are understated. EIA has recently released new annual data that give an indication of how significant this understatement is for the years 1989-2000 and for 2001 on a preliminary basis (see EIA’s Annual Energy Review 2001 (AER2001), particularly Appendix H.) While monthly and quarterly counterparts to the new annual data will not be available until Spring 2003, these data should help to address some of the large gas imbalances evident in the data, including, for example, those reported for the first half of 2002. We are in the process of developing interim revisions of the monthly data for use in our forecasts that will provide consistency with the new AER2001 concepts. We expect to include those interim revisions in the December 2002 Short-Term Energy Outlook. Working natural gas in storage is estimated to have reached 3,149 billion cubic feet (bcf) at the end of October, approximately 5 percent above the 5-year average. Storage levels are now about equal to year-ago levels, although end-October levels in 2002 were still quite high. Under normal weather conditions through the forecast, storage is expected to remain above average levels at least through the beginning of the next heating season (Figure 13). The forecast for the average natural gas wellhead price for 2003 is $3.37 per mcf, an increase of about $0.45 per mcf from the 2002 yearly average of $2.93 per mcf.
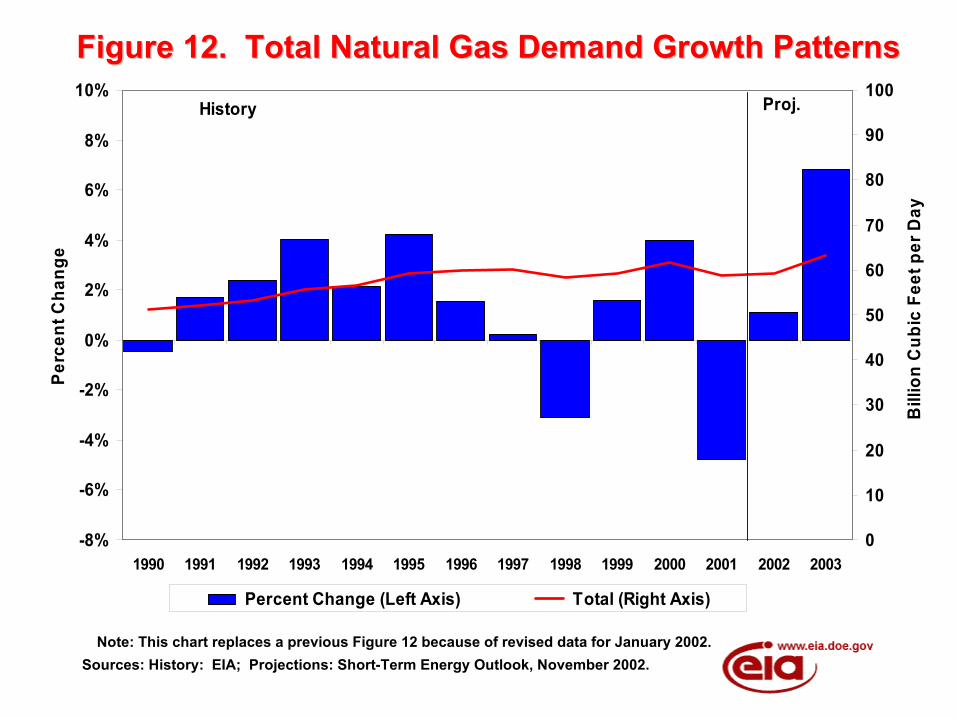
Figure 12. Total Natural Gas Demand Growth PatternsFigure 12. Total Natural Gas Demand Growth Patterns
Sources: History: EIA; Projections: Short-Term Energy Outlook, November 2002.Note: This chart replaces a previous Figure 12 because of revised data for January 2002.
-8%
-6%
-4%
-2%
0%
2%
4%
6%
8%
10%
1990 1991 1992 1993 1994 1995 1996 1997 1998 1999 2000 2001 2002 2003
Perc
ent C
hang
e
0
10
20
30
40
50
60
70
80
90
100
Bill
ion
Cub
ic F
eet p
er D
ay
Percent Change (Left Axis) Total (Right Axis)
History Proj.
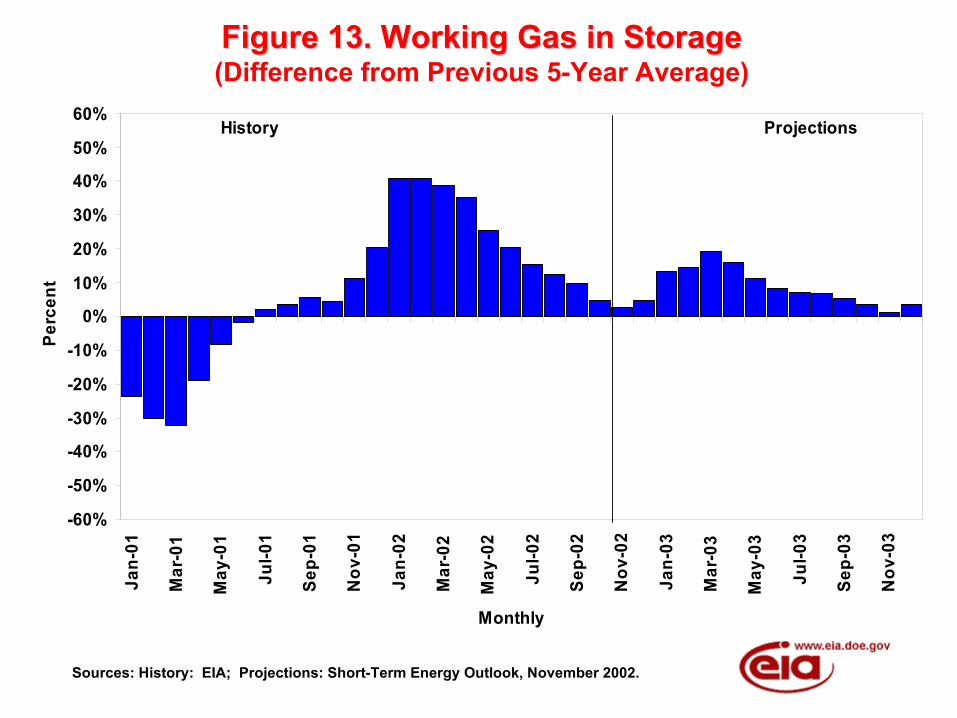
Figure 13. Working Gas in StorageFigure 13. Working Gas in Storage(Difference from Previous 5-Year Average)
Sources: History: EIA; Projections: Short-Term Energy Outlook, November 2002.
-60%
-50%
-40%
-30%
-20%
-10%
0%
10%
20%
30%
40%
50%
60%Ja
n-01
Mar
-01
May
-01
Jul-0
1
Sep-
01
Nov
-01
Jan-
02
Mar
-02
May
-02
Jul-0
2
Sep-
02
Nov
-02
Jan-
03
Mar
-03
May
-03
Jul-0
3
Sep-
03
Nov
-03
Monthly
Perc
ent
History Projections
Energy Information Administration/Short-Term Energy Outlook -- November 2002 7
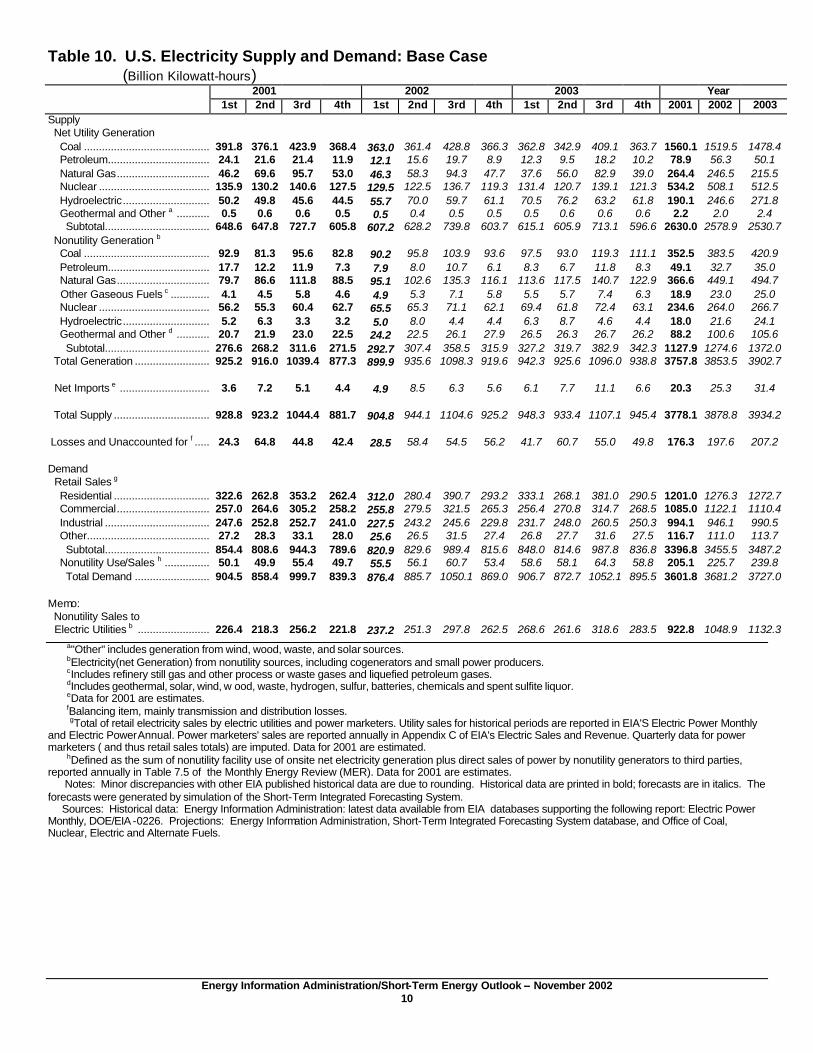
Domestic dry natural gas production is projected to fall by about 1.3 percent in 2002 compared to the 2001 growth rate of 2.4 percent. Lower natural gas prices have reduced production and resource development incentives from their highs of last year. However, in view of the fact that, as reported here, gas demand levels are underreported, current supplies appear to be in good shape. This is, in part, evidenced by the still-high natural gas storage levels, which have been maintained despite strong electricity-related demand increases during the third quarter. In 2003, production is expected to rebound by well over 2 percent as demand rises and inventories fall back closer to normal. Natural gas-directed drilling, while still down relative to the spectacular peak seen in mid-2001, remains strong in the longer historical perspective. However, the gas-directed rig rate slipped a bit last week and was generally down for the month of October. Baker Hughes reported average active rigs drilling for natural gas as of November 1 at 692, down from 710 the previous week. The average October rate was 709 compared to 736 in September. The October rate is still 16 percent above the recent low point seen in April. Aggregate lease revenues from domestic oil and natural gas production are expected to average $319 million per day in 2003, which would be a 12-percent increase over the average rate seen in 2002 (Figure 14). The leverage from these revenues should drive continued strong drilling levels in 2003 (Figure 15). Electricity Demand and Supply Total annual electricity demand growth (retail sales plus industrial generation for own use and other direct sales) is expected to show growth of 2.2 percent for all of 2002. Abnormally high summer temperatures and high cooling demand increased electricity demand sharply in the third quarter of 2002. Based on Edison Electric Institute data on weekly electricity output, U.S. electricity production rose 6.5 percent for the third quarter 2002 compared to the year-earlier level. Our estimate for third-quarter 2002 growth in total demand has been revised to 5.0 percent. In 2003, while the economy is expected to continue to recover, electricity demand is expected to grow by a relatively subdued rate of about 1 percent (Figure 16) since little or no net summer demand growth would be expected under normal levels of cooling degree-days. Total U.S. electricity demand is expected to be 3.5 percent higher this winter than it was last winter, due to the slowly rising economy and assumptions of normal temperatures for the remainder of the winter, which would imply 13-percent colder conditions this winter than last, contributing to higher heating-related electricity demand. In 2001, total hydropower generation reached lows not seen since 1966. In 2002, total hydro generation is expected to rise by 29 percent as normal precipitation returns to the Pacific Census Division (Washington, Oregon and California), the main region affected. Total oil-fired generation is projected to drop by as much as 31 percent compared to last year, principally because of higher prices relative to other fuels. On the other hand, total natural gas-fired generation is projected to rise by 10.2 percent above last year. Total nuclear generation is expected to rise by 0.4 percent from the 2001 level in 2002 and by an additional 0.9 percent in 2003.
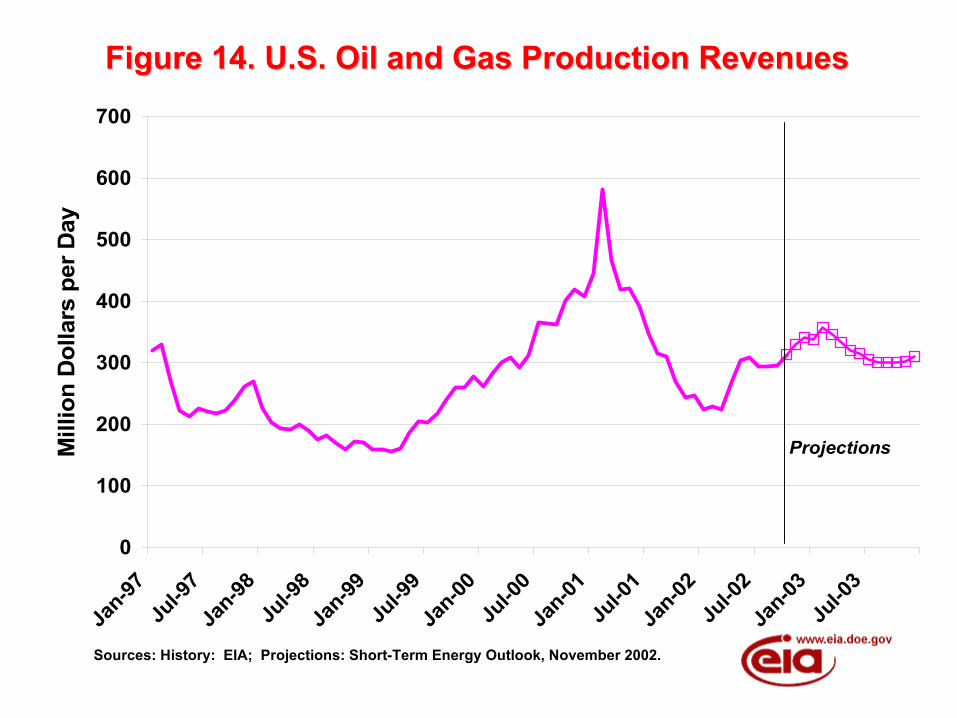
Figure 14. U.S. Oil and Gas Production RevenuesFigure 14. U.S. Oil and Gas Production Revenues
Sources: History: EIA; Projections: Short-Term Energy Outlook, November 2002.
0
100
200
300
400
500
600
700
Jan-97
Jul-9
7Ja
n-98Ju
l-98
Jan-99
Jul-9
9Ja
n-00Ju
l-00
Jan-01
Jul-0
1Ja
n-02Ju
l-02
Jan-03
Jul-0
3M
illio
n D
olla
rs p
er D
ay
Projections
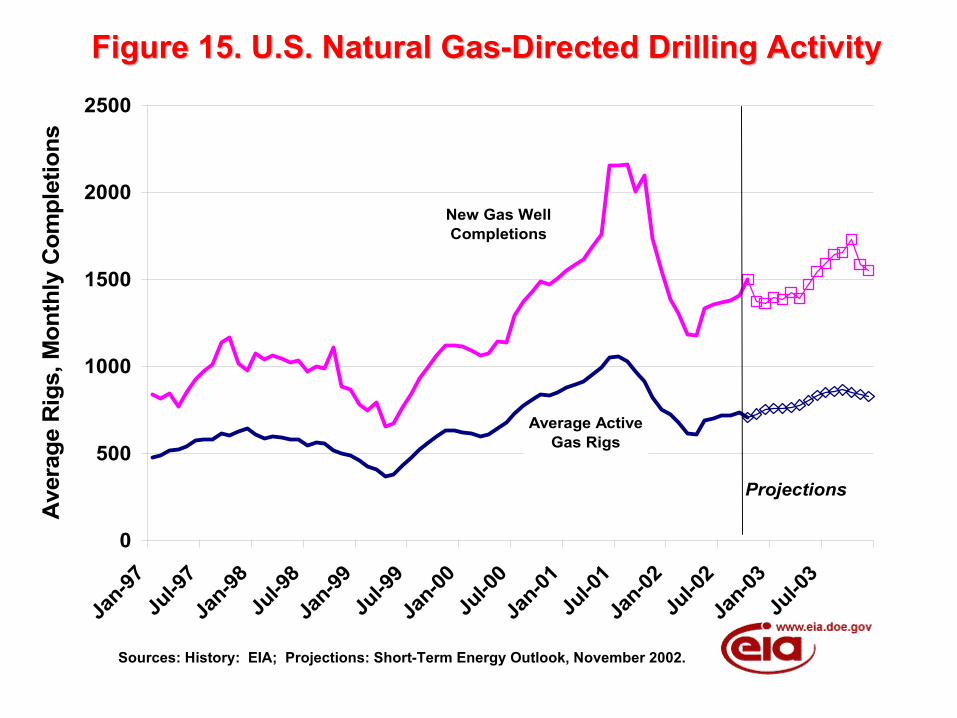
Figure 15. U.S. Natural Gas-Directed Drilling ActivityFigure 15. U.S. Natural Gas-Directed Drilling Activity
Sources: History: EIA; Projections: Short-Term Energy Outlook, November 2002.
0
500
1000
1500
2000
2500
Jan-97
Jul-9
7Ja
n-98Ju
l-98
Jan-99
Jul-9
9Ja
n-00Ju
l-00
Jan-01
Jul-0
1Ja
n-02Ju
l-02
Jan-03
Jul-0
3
Ave
rage
Rig
s, M
onth
ly C
ompl
etio
ns
Projections
New Gas Well Completions
Average Active Gas Rigs
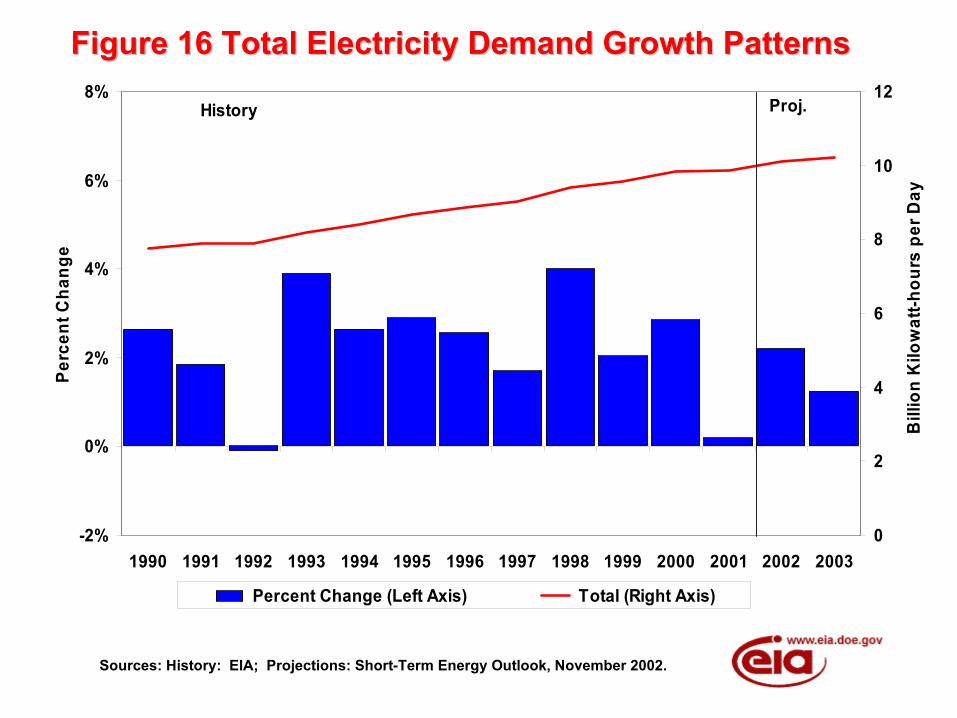
Figure 16 Total Electricity Demand Growth PatternsFigure 16 Total Electricity Demand Growth Patterns
Sources: History: EIA; Projections: Short-Term Energy Outlook, November 2002.
-2%
0%
2%
4%
6%
8%
1990 1991 1992 1993 1994 1995 1996 1997 1998 1999 2000 2001 2002 2003
Perc
ent C
hang
e
0
2
4
6
8
10
12
Bill
ion
Kilo
wat
t-hou
rs p
er D
ay
Percent Change (Left Axis) Total (Right Axis)
History Proj.

Energy Information Administration/Short-Term Energy Outlook -- November 2002 1
Table HL1. U.S. Energy Supply and Demand: Base Case Year Annual Percentage Change
2000 2001 2002 2003 2000-2001 2001-2002 2002-2003 Real Gross Domestic Product (GDP) (billion chained 1996 dollars) ..............… 9191 9215 9425 9708 0.3 2.3 3.0
Imported Crude Oil Price a (nominal dollars per barrel).................…. 27.72 22.01 23.85 23.99 -20.6 8.4 0.6
Petroleum Supply (million barrels per day)
Crude Oil Production b ............................ 5.82 5.80 5.87 5.75 -0.3 1.2 -2.0 Total Petroleum Net Imports (including SPR)..................................…. 10.43 10.91 10.47 11.39 4.6 -4.0 8.8 Energy Demand World Petroleum (million barrels per day).......................... 76.0 76.0 76.3 77.6 0.0 0.4 1.7 Petroleum (million barrels per day).......................... 19.70 19.65 19.74 20.41 -0.3 0.5 3.4 Natural Gas (trillion cubic feet) ................................... 22.54 21.40 21.64 23.11 -5.1 1.1 6.8 Coal c (million short tons) .................................. 1081 1050 1063 1061 -2.9 1.2 -0.2 Electricity (billion kilowatthours) Retail Sales d ........................................ 3421 3397 3455 3487 -0.7 1.7 0.9 Nonutility Use/Sales e ........................... 183 205 226 240 12.0 10.2 6.2 Total ...........................…………………. 3604 3602 3681 3727 -0.1 2.2 1.2 Total Energy Demand f (quadrillion Btu)............………………….. 99.6 97.1 97.8 100.7 -2.5 0.8 3.0 Total Energy Demand per Dollar of GDP (thousand Btu per 1996 Dollar)………… 10.83 10.53 10.37 10.38 -2.8 -1.5 0.1 Renewable Energy as Percent of Total g ……………………………………..
7.2 6.7 7.5 7.8
aRefers to the refiner acquisition cost (RAC) of imported crude oil. bIncludes lease condensate. cTotal Demand includes estimated Independent Power Producer (IPP) coal consumption. dTotal of retail electricity sales by electric utilities and power marketers. Utility sales for historical periods are reported in EIA's Electric Power Monthly and Electric Power Annual. Power marketers' sales for historical periods are reported in EIA's Electric Sales and Revenue, Appendix C. Data for 2001 are estimates. eDefined as the sum of nonutility facility use of onsite net electricity generation plus direct sales of power by nonutility generators to third parties, reported annually in Table 7.5 of the Monthly Energy Review (MER). Data for 2001 are estimates. fThe conversion from physical units to Btu is calculated by using a subset of conversion factors used in the calculations performed for gross energy consumption in Energy Information Administration, Monthly Energy Review (MER). Consequently, the historical data may not precisely match those published in the MER or the Annual Energy Review (AER). gRenewable energy includes minor components of non-marketed renewable energy, which is renewable energy that is neither bought nor sold, either directly or indirectly, as inputs to marketed energy. The Energy Information Administration does not estimate or project total consumption of non-marketed renewable energy. SPR: Strategic Petroleum Reserve. Notes: Minor discrepancies with other published EIA historical data are due to independent rounding. Historical data are printed in bold; forecasts are in italics. The forecasts were generated by simulation of the Short-Term Integrated Forecasting System. Sources: Historical data: Latest data available from Bureau of Economic Analysis and Energy Information Administration; latest data available from EIA databases supporting the following reports: Petroleum Supply Monthly, DOE/EIA -0109; Petroleum Supply Annual, DOE/EIA -0340/2; Natural Gas Monthly, DOE/EIA -0130; Electric Power Monthly, DOE/EIA -0226; and Quarterly Coal Report, DOE/EIA -0121; International Petroleum Monthly DOE/EIA -0520; Weekly Petroleum Status Report, DOE/EIA -0208. Macroeconomic projections are based on DRI-WEFA Forecast CONTROL0902.
Energy Information Administration/Short-Term Energy Outlook -- November 2002 2
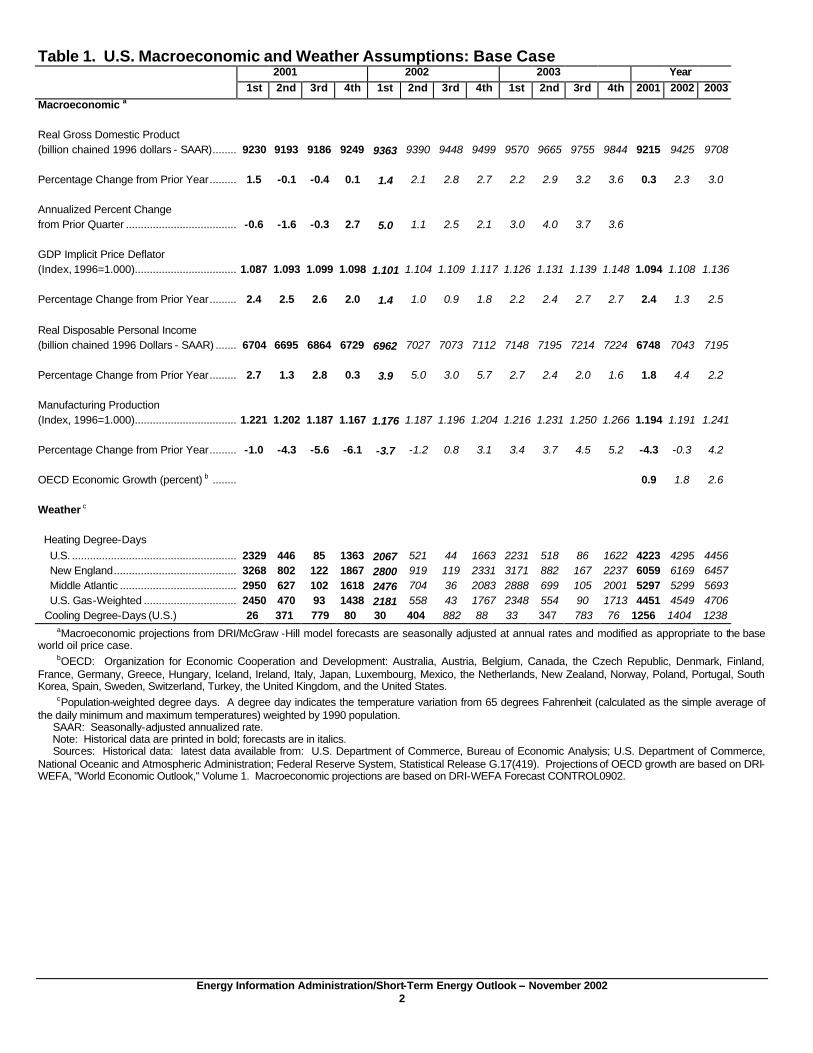
Table 1. U.S. Macroeconomic and Weather Assumptions: Base Case 2001 2002 2003 Year
1st 2nd 3rd 4th 1st 2nd 3rd 4th 1st 2nd 3rd 4th 2001 2002 2003
Macroeconomic a
Real Gross Domestic Product (billion chained 1996 dollars - SAAR)................................9230 9193 9186 9249 9363 9390 9448 9499 9570 9665 9755 9844 9215 9425 9708
Percentage Change from Prior Year................................1.5 -0.1 -0.4 0.1 1.4 2.1 2.8 2.7 2.2 2.9 3.2 3.6 0.3 2.3 3.0
Annualized Percent Change from Prior Quarter ................................................................-0.6 -1.6 -0.3 2.7 5.0 1.1 2.5 2.1 3.0 4.0 3.7 3.6
GDP Implicit Price Deflator (Index, 1996=1.000)................................................................1.087 1.093 1.099 1.098 1.101 1.104 1.109 1.117 1.126 1.131 1.139 1.148 1.094 1.108 1.136
Percentage Change from Prior Year................................2.4 2.5 2.6 2.0 1.4 1.0 0.9 1.8 2.2 2.4 2.7 2.7 2.4 1.3 2.5
Real Disposable Personal Income (billion chained 1996 Dollars - SAAR) ................................6704 6695 6864 6729 6962 7027 7073 7112 7148 7195 7214 7224 6748 7043 7195
Percentage Change from Prior Year................................2.7 1.3 2.8 0.3 3.9 5.0 3.0 5.7 2.7 2.4 2.0 1.6 1.8 4.4 2.2
Manufacturing Production (Index, 1996=1.000)................................................................1.221 1.202 1.187 1.167 1.176 1.187 1.196 1.204 1.216 1.231 1.250 1.266 1.194 1.191 1.241
Percentage Change from Prior Year................................-1.0 -4.3 -5.6 -6.1 -3.7 -1.2 0.8 3.1 3.4 3.7 4.5 5.2 -4.3 -0.3 4.2
OECD Economic Growth (percent) b ................................ 0.9 1.8 2.6
Weather c Heating Degree-Days U.S. ................................................................2329 446 85 1363 2067 521 44 1663 2231 518 86 1622 4223 4295 4456 New England................................................................3268 802 122 1867 2800 919 119 2331 3171 882 167 2237 6059 6169 6457 Middle Atlantic ................................................................2950 627 102 1618 2476 704 36 2083 2888 699 105 2001 5297 5299 5693 U.S. Gas-Weighted ................................ 2450 470 93 1438 2181 558 43 1767 2348 554 90 1713 4451 4549 4706 Cooling Degree-Days (U.S.) 26 371 779 80 30 404 882 88 33 347 783 76 1256 1404 1238
aMacroeconomic projections from DRI/McGraw -Hill model forecasts are seasonally adjusted at annual rates and modified as appropriate to the base world oil price case. bOECD: Organization for Economic Cooperation and Development: Australia, Austria, Belgium, Canada, the Czech Republic, Denmark, Finland, France, Germany, Greece, Hungary, Iceland, Ireland, Italy, Japan, Luxembourg, Mexico, the Netherlands, New Zealand, Norway, Poland, Portugal, South Korea, Spain, Sweden, Switzerland, Turkey, the United Kingdom, and the United States. cPopulation-weighted degree days. A degree day indicates the temperature variation from 65 degrees Fahrenheit (calculated as the simple average of the daily minimum and maximum temperatures) weighted by 1990 population. SAAR: Seasonally-adjusted annualized rate. Note: Historical data are printed in bold; forecasts are in italics. Sources: Historical data: latest data available from: U.S. Department of Commerce, Bureau of Economic Analysis; U.S. Department of Commerce, National Oceanic and Atmospheric Administration; Federal Reserve System, Statistical Release G.17(419). Projections of OECD growth are based on DRI-WEFA, "World Economic Outlook," Volume 1. Macroeconomic projections are based on DRI-WEFA Forecast CONTROL0902.
Energy Information Administration/Short-Term Energy Outlook -- November 2002 3
Table 2. U.S. Energy Indicators: Base Case 2001 2002 2003 Year
1st 2nd 3rd 4th 1st 2nd 3rd 4th 1st 2nd 3rd 4th 2001 2002 2003
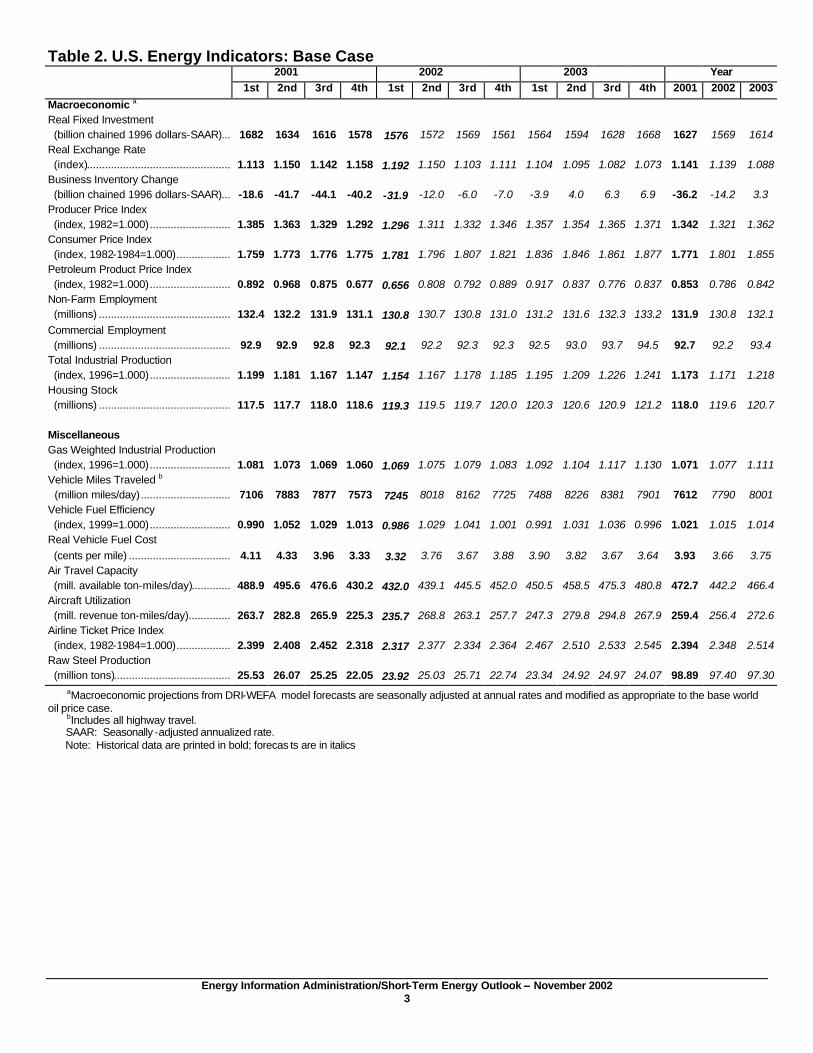
Macroeconomic a Real Fixed Investment (billion chained 1996 dollars-SAAR)................................1682 1634 1616 1578 1576 1572 1569 1561 1564 1594 1628 1668 1627 1569 1614 Real Exchange Rate (index)................................................................1.113 1.150 1.142 1.158 1.192 1.150 1.103 1.111 1.104 1.095 1.082 1.073 1.141 1.139 1.088 Business Inventory Change (billion chained 1996 dollars-SAAR)................................-18.6 -41.7 -44.1 -40.2 -31.9 -12.0 -6.0 -7.0 -3.9 4.0 6.3 6.9 -36.2 -14.2 3.3 Producer Price Index (index, 1982=1.000)................................1.385 1.363 1.329 1.292 1.296 1.311 1.332 1.346 1.357 1.354 1.365 1.371 1.342 1.321 1.362 Consumer Price Index (index, 1982-1984=1.000)................................1.759 1.773 1.776 1.775 1.781 1.796 1.807 1.821 1.836 1.846 1.861 1.877 1.771 1.801 1.855 Petroleum Product Price Index (index, 1982=1.000)................................0.892 0.968 0.875 0.677 0.656 0.808 0.792 0.889 0.917 0.837 0.776 0.837 0.853 0.786 0.842 Non-Farm Employment (millions) ................................................................132.4 132.2 131.9 131.1 130.8 130.7 130.8 131.0 131.2 131.6 132.3 133.2 131.9 130.8 132.1 Commercial Employment (millions) ................................................................92.9 92.9 92.8 92.3 92.1 92.2 92.3 92.3 92.5 93.0 93.7 94.5 92.7 92.2 93.4 Total Industrial Production (index, 1996=1.000)................................1.199 1.181 1.167 1.147 1.154 1.167 1.178 1.185 1.195 1.209 1.226 1.241 1.173 1.171 1.218 Housing Stock (millions) ................................................................117.5 117.7 118.0 118.6 119.3 119.5 119.7 120.0 120.3 120.6 120.9 121.2 118.0 119.6 120.7 Miscellaneous Gas Weighted Industrial Production (index, 1996=1.000)................................1.081 1.073 1.069 1.060 1.069 1.075 1.079 1.083 1.092 1.104 1.117 1.130 1.071 1.077 1.111 Vehicle Miles Traveled b (million miles/day)................................ 7106 7883 7877 7573 7245 8018 8162 7725 7488 8226 8381 7901 7612 7790 8001 Vehicle Fuel Efficiency (index, 1999=1.000)................................0.990 1.052 1.029 1.013 0.986 1.029 1.041 1.001 0.991 1.031 1.036 0.996 1.021 1.015 1.014 Real Vehicle Fuel Cost (cents per mile) ................................................................4.11 4.33 3.96 3.33 3.32 3.76 3.67 3.88 3.90 3.82 3.67 3.64 3.93 3.66 3.75 Air Travel Capacity (mill. available ton-miles/day)................................488.9 495.6 476.6 430.2 432.0 439.1 445.5 452.0 450.5 458.5 475.3 480.8 472.7 442.2 466.4 Aircraft Utilization (mill. revenue ton-miles/day)................................263.7 282.8 265.9 225.3 235.7 268.8 263.1 257.7 247.3 279.8 294.8 267.9 259.4 256.4 272.6 Airline Ticket Price Index (index, 1982-1984=1.000)................................2.399 2.408 2.452 2.318 2.317 2.377 2.334 2.364 2.467 2.510 2.533 2.545 2.394 2.348 2.514 Raw Steel Production (million tons)................................................................25.53 26.07 25.25 22.05 23.92 25.03 25.71 22.74 23.34 24.92 24.97 24.07 98.89 97.40 97.30
aMacroeconomic projections from DRI-WEFA model forecasts are seasonally adjusted at annual rates and modified as appropriate to the base world oil price case. bIncludes all highway travel. SAAR: Seasonally -adjusted annualized rate. Note: Historical data are printed in bold; forecas ts are in italics
Energy Information Administration/Short-Term Energy Outlook -- November 2002 4
Table 3. International Petroleum Supply and Demand: Base Case (Million Barrels per Day, Except OECD Commercial Stocks)
2001 2002 2003 Year
1st 2nd 3rd 4th 1st 2nd 3rd 4th 1st 2nd 3rd 4th 2001 2002 2003
Demand a
OECD U.S. (50 States)................................................................19.9 19.6 19.7 19.4 19.4 19.6 19.9 20.0 20.3 20.1 20.5 20.8 19.6 19.7 20.4
U.S. Territories ................................................................0.4 0.4 0.3 0.3 0.4 0.3 0.3 0.3 0.4 0.4 0.4 0.4 0.3 0.3 0.4
Canada................................................................2.0 1.9 1.9 1.9 2.0 1.9 2.0 2.0 2.0 1.9 2.1 2.1 1.9 2.0 2.0 Europe................................................................15.2 14.8 15.5 15.6 15.2 14.7 15.6 15.7 15.5 14.6 15.2 15.9 15.3 15.3 15.3
Japan................................................................6.1 5.0 5.1 5.5 5.7 4.6 5.0 5.5 5.8 4.7 4.9 5.4 5.4 5.2 5.2
Other OECD ................................................................5.3 4.9 4.9 5.2 5.3 4.9 5.0 5.3 5.1 5.0 5.3 5.3 5.1 5.2 5.2 Total OECD ................................................................48.9 46.5 47.4 48.0 47.9 46.2 47.8 48.8 49.1 46.8 48.4 49.8 47.7 47.7 48.5
Non-OECD
Former Soviet Union................................................................3.7 3.6 3.6 3.6 3.8 3.6 3.6 3.6 3.8 3.7 3.7 3.7 3.6 3.7 3.7 Europe................................................................0.6 0.6 0.6 0.6 0.6 0.6 0.6 0.6 0.6 0.6 0.6 0.6 0.6 0.6 0.6
China ................................................................4.9 4.9 4.8 4.8 5.1 5.0 5.0 5.0 5.3 5.2 5.2 5.2 4.9 5.0 5.2
Other Asia................................................................7.4 7.4 7.1 7.4 7.4 7.4 7.2 7.5 7.6 7.6 7.3 7.7 7.3 7.4 7.5 Other Non-OECD................................................................11.7 11.9 12.0 11.8 11.7 12.0 12.0 11.9 11.8 12.1 12.2 12.1 11.8 11.9 12.0
Total Non-OECD................................................................28.4 28.4 28.1 28.3 28.6 28.7 28.4 28.7 29.1 29.1 28.9 29.3 28.3 28.6 29.1
Total World Demand................................................................77.3 74.9 75.6 76.3 76.6 74.8 76.2 77.5 78.2 76.0 77.3 79.1 76.0 76.3 77.6 Supply b
OECD
U.S. (50 States)................................................................8.7 9.0 9.0 9.1 9.1 9.2 9.1 9.1 9.0 9.0 9.0 9.0 9.0 9.1 9.0 Canada................................................................2.8 2.8 2.7 2.9 2.9 2.9 2.9 3.1 3.1 3.1 3.2 3.3 2.8 3.0 3.2
Mexico................................................................3.6 3.5 3.6 3.6 3.6 3.6 3.6 3.6 3.8 3.8 3.9 3.8 3.6 3.6 3.8
North Sea c ................................................................6.4 6.1 6.2 6.5 6.3 6.4 5.9 6.5 6.5 6.1 6.2 6.5 6.3 6.3 6.3 Other OECD ................................................................1.6 1.6 1.6 1.6 1.6 1.6 1.6 1.6 1.6 1.6 1.6 1.6 1.6 1.6 1.6
Total OECD ................................................................23.2 23.0 23.1 23.7 23.6 23.6 23.1 24.0 24.0 23.6 23.9 24.2 23.2 23.6 23.9
Non-OECD OPEC ................................................................31.1 29.9 30.1 29.2 27.9 27.4 28.2 29.3 29.2 29.1 29.1 29.1 30.1 28.2 29.1
Former Soviet Union................................................................8.6 8.7 8.9 9.1 9.0 9.2 9.5 9.5 9.6 9.7 9.9 10.0 8.8 9.3 9.8
China ................................................................3.3 3.3 3.3 3.3 3.3 3.3 3.4 3.4 3.3 3.3 3.4 3.4 3.3 3.4 3.3 Other Non-OECD................................................................11.2 11.1 11.3 11.3 11.5 11.5 11.4 11.8 11.6 11.7 11.9 12.0 11.2 11.6 11.8
Total Non-OECD................................................................54.2 53.0 53.6 52.9 51.7 51.4 52.5 54.0 53.7 53.8 54.3 54.5 53.4 52.4 54.1
Total World Supply ................................................................77.5 76.0 76.7 76.6 75.3 75.0 75.6 77.9 77.6 77.4 78.2 78.7 76.7 76.0 78.0 Stock Changes
Net Stock Withdrawals or Additions (-)
U.S. (50 States including SPR)................................-0.2 -0.9 -0.2 -0.1 0.2 -0.4 0.4 0.3 0.1 -0.8 -0.4 0.3 -0.3 0.1 -0.2 Other ................................................................0.0 -0.2 -1.0 -0.2 1.1 0.3 0.2 -0.7 0.4 -0.6 -0.5 0.1 -0.4 0.2 -0.1
Total Stock Withdrawals ................................-0.2 -1.0 -1.2 -0.3 1.2 -0.2 0.6 -0.4 0.6 -1.4 -0.8 0.4 -0.7 0.3 -0.3
OECD Comm. Stocks, End (bill. bbls.) ................................2.5 2.6 2.7 2.7 2.6 2.6 2.6 2.6 2.6 2.6 2.7 2.6 2.7 2.6 2.6 Non-OPEC Supply................................................................46.4 46.0 46.6 47.4 47.4 47.7 47.5 48.6 48.4 48.3 49.0 49.6 46.6 47.8 48.8
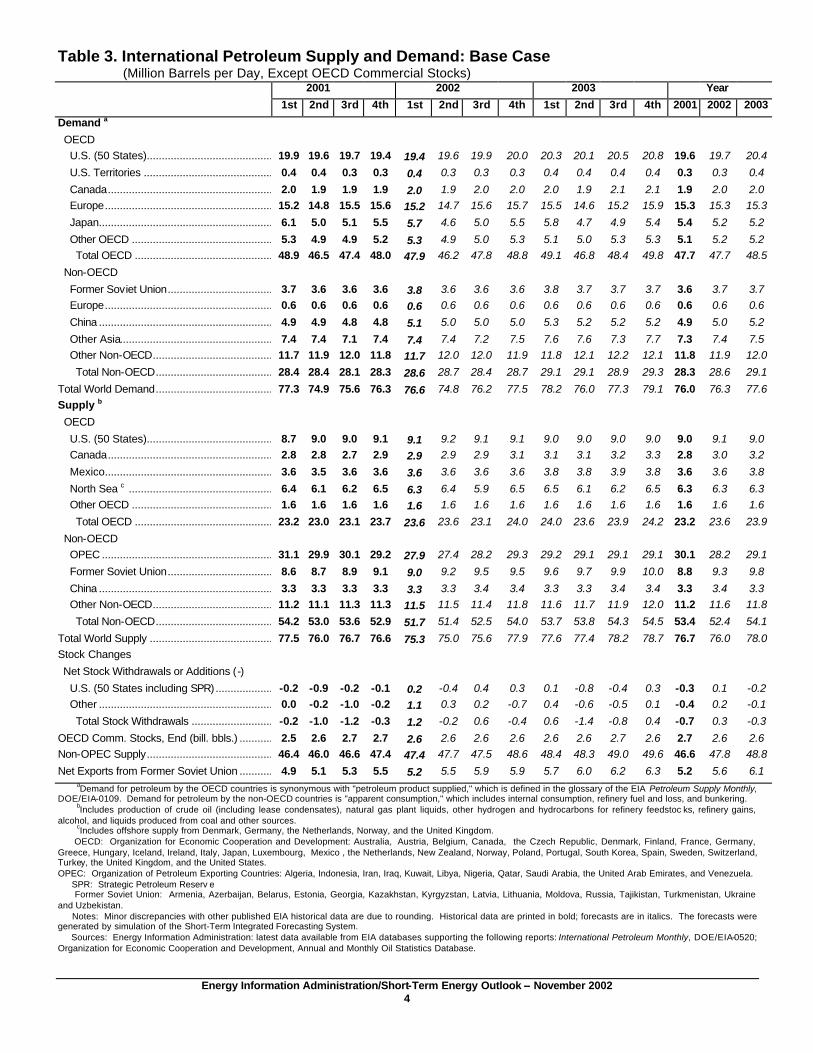
Net Exports from Former Soviet Union ................................4.9 5.1 5.3 5.5 5.2 5.5 5.9 5.9 5.7 6.0 6.2 6.3 5.2 5.6 6.1 aDemand for petroleum by the OECD countries is synonymous with "petroleum product supplied," which is defined in the glossary of the EIA Petroleum Supply Monthly,
DOE/EIA-0109. Demand for petroleum by the non-OECD countries is "apparent consumption," which includes internal consumption, refinery fuel and loss, and bunkering. bIncludes production of crude oil (including lease condensates), natural gas plant liquids, other hydrogen and hydrocarbons for refinery feedstoc ks, refinery gains, alcohol, and liquids produced from coal and other sources. cIncludes offshore supply from Denmark, Germany, the Netherlands, Norway, and the United Kingdom. OECD: Organization for Economic Cooperation and Development: Australia, Austria, Belgium, Canada, the Czech Republic, Denmark, Finland, France, Germany, Greece, Hungary, Iceland, Ireland, Italy, Japan, Luxembourg, Mexico , the Netherlands, New Zealand, Norway, Poland, Portugal, South Korea, Spain, Sweden, Switzerland, Turkey, the United Kingdom, and the United States. OPEC: Organization of Petroleum Exporting Countries: Algeria, Indonesia, Iran, Iraq, Kuwait, Libya, Nigeria, Qatar, Saudi Arabia, the United Arab Emirates, and Venezuela. SPR: Strategic Petroleum Reserv e Former Soviet Union: Armenia, Azerbaijan, Belarus, Estonia, Georgia, Kazakhstan, Kyrgyzstan, Latvia, Lithuania, Moldova, Russia, Tajikistan, Turkmenistan, Ukraine and Uzbekistan. Notes: Minor discrepancies with other published EIA historical data are due to rounding. Historical data are printed in bold; forecasts are in italics. The forecasts were generated by simulation of the Short-Term Integrated Forecasting System. Sources: Energy Information Administration: latest data available from EIA databases supporting the following reports: International Petroleum Monthly, DOE/EIA-0520; Organization for Economic Cooperation and Development, Annual and Monthly Oil Statistics Database.

Energy Information Administration/Short-Term Energy Outlook -- November 2002 5
Table 4. U.S. Energy Prices: Base Case (Nominal Dollars)
2001 2002 2003 Year 1st 2nd 3rd 4th 1st 2nd 3rd 4th 1st 2nd 3rd 4th 2001 2002 2003
Crude Oil Prices (dollars per barrel) Imported Average a ................................24.09 23.86 23.04 16.94 19.33 23.84 25.83 26.18 25.00 24.26 23.68 23.09 22.01 23.85 23.99 WTI b Spot Average................................28.82 27.92 26.66 20.40 21.66 26.25 28.34 28.20 27.23 26.42 25.71 25.47 25.95 26.11 26.20
Natural Gas Wellhead (dollars per thousand cubic feet)................................6.37 4.56 3.06 2.50 2.34 3.00 2.88 3.48 3.70 3.29 3.16 3.33 4.12 2.92 3.37
Petroleum Products
Gasoline Retail c (dollars per gallon) All Grades................................................................1.47 1.66 1.49 1.23 1.20 1.43 1.44 1.49 1.46 1.50 1.46 1.40 1.47 1.39 1.45 Regular Unleaded................................ 1.43 1.62 1.45 1.19 1.16 1.39 1.40 1.44 1.41 1.45 1.40 1.35 1.43 1.35 1.40
No. 2 Diesel Oil, Retail (dollars per gallon)................................................................1.47 1.47 1.42 1.26 1.18 1.30 1.35 1.45 1.42 1.40 1.37 1.39 1.40 1.32 1.39
No. 2 Heating Oil, Wholesale (dollars per gallon)................................................................0.84 0.80 0.76 0.61 0.60 0.68 0.73 0.88 0.85 0.77 0.73 0.78 0.76 0.72 0.79
No. 2 Heating Oil, Retail (dollars per gallon)................................................................1.35 1.24 1.15 1.11 1.09 1.09 1.05 1.27 1.29 1.16 1.06 1.21 1.23 1.14 1.22
No. 6 Residual Fuel Oil, Retail d (dollars per barrel) ................................................................25.13 22.29 21.76 18.97 19.35 24.09 25.65 26.98 26.09 24.12 23.81 23.96 22.30 24.01 24.53
Electric Utility Fuels
Coal (dollars per million Btu)................................1.23 1.24 1.23 1.22 1.22 1.21 1.20 1.20 1.21 1.22 1.19 1.18 1.23 1.21 1.20
Heavy Fuel Oil e (dollars per million Btu)................................4.21 3.82 3.50 2.89 2.73 3.65 4.03 4.39 4.22 3.84 3.84 3.91 3.71 3.72 3.95
Natural Gas (dollars per million Btu)................................7.26 4.96 3.47 2.97 3.22 3.74 3.32 3.83 4.31 3.82 3.68 3.94 4.43 3.50 3.88
Other Residential
Natural Gas (dollars per thousand cubic feet)................................10.10 10.70 10.64 7.69 7.14 8.18 9.64 8.06 8.06 8.89 10.02 8.11 9.63 7.80 8.37
Electricity (cents per kilowatthour)................................7.96 8.62 8.85 8.47 8.08 8.49 8.62 8.25 7.96 8.55 8.78 8.34 8.48 8.38 8.41
aRefiner acquisition cost (RAC) of imported crude oil.
bWest Texas Intermediate. cAverage self-service cash prices. dAverage for all sulfur contents. eIncludes fuel oils No. 4, No. 5, and No. 6 and topped crude fuel oil prices. Notes: Data are estimated for the fourth quarter of 2001. Prices exclude taxes, except prices for gasoline, residential natural gas, and diesel. The forecasts were generated by simulation of the Short-Term Integrated Forecasting System. Sources: Historical data: Energy Information Administration: latest data available from EIA databases supporting the following reports: Petroleum Marketing Monthly, DOE/EIA -0380; Natural Gas Monthly, DOE/EIA -0130; Monthly Energy Review, DOE/EIA -0035; Electric Power Monthly, DOE/EIA -0226.
Energy Information Administration/Short-Term Energy Outlook -- November 2002 6
Table 5. U.S. Petroleum Supply and Demand: Base Case (Million Barrels per Day, Except Closing Stocks)
2001 2002 2003 Year 1st 2nd 3rd 4th 1st 2nd 3rd 4th 1st 2nd 3rd 4th 2001 2002 2003
Supply Crude Oil Supply Domestic Production a .......................5.82 5.82 5.73 5.84 5.93 5.89 5.80 5.86 5.88 5.74 5.68 5.71 5.80 5.87 5.75 Alaska...............................................0.99 0.96 0.92 0.99 1.03 1.01 0.95 1.02 1.06 0.99 0.97 1.04 0.96 1.00 1.01 Lower 48...........................................4.83 4.86 4.81 4.85 4.89 4.88 4.86 4.84 4.82 4.76 4.71 4.67 4.84 4.87 4.74 Net Commercial Imports b ..................9.02 9.66 9.41 9.10 8.73 9.26 9.03 9.09 9.24 10.11 10.18 9.73 9.30 9.03 9.82 Net SPR Withdrawals .........................0.00 0.00 -0.01 -0.05 -0.13 -0.16 -0.10 -0.14 -0.15 -0.11 -0.11 -0.11 -0.02 -0.13 -0.12 Net Commercial Withdrawals..............-0.26 0.00 -0.01 -0.03 -0.24 0.18 0.48 -0.11 -0.23 -0.03 0.09 -0.01 -0.07 0.08 -0.04 Product Supplied and Losses.............0.00 0.00 0.00 0.00 0.00 0.00 0.00 0.00 0.00 0.00 0.00 0.00 0.00 0.00 0.00 Unaccounted-for Crude Oil.................0.16 0.16 0.10 0.04 0.11 0.13 0.03 0.05 0.18 0.20 0.17 0.12 0.12 0.08 0.17
Total Crude Oil Supply........................14.75 15.65 15.21 14.90 14.41 15.30 15.24 14.76 14.93 15.92 16.01 15.45 15.13 14.93 15.58
Other Supply NGL Production................................1.65 1.88 1.96 1.97 1.86 1.91 1.90 1.84 1.82 1.88 1.90 1.94 1.87 1.88 1.89 Other Hydrocarbon and Alcohol Inputs......................................................
0.37 0.39 0.40 0.38 0.37 0.44 0.42 0.41 0.41 0.41 0.43 0.42 0.38 0.41 0.42
Crude Oil Product Supplied ................0.00 0.00 0.00 0.00 0.00 0.00 0.00 0.00 0.00 0.00 0.00 0.00 0.00 0.00 0.00 Processing Gain ................................0.90 0.90 0.88 0.94 0.96 0.96 0.95 0.96 0.92 0.95 0.97 0.98 0.90 0.96 0.96 Net Product Imports c .........................2.13 1.64 1.40 1.21 1.33 1.48 1.35 1.49 1.65 1.57 1.54 1.55 1.59 1.41 1.57 Product Stock Withdrawn or Added (-).................................................
0.09 -0.86 -0.15 0.01 0.52 -0.46 0.00 0.56 0.53 -0.60 -0.35 0.42 -0.23 0.15 0.00
Total Supply..........................................19.89 19.60 19.70 19.41 19.44 19.64 19.85 20.01 20.25 20.12 20.49 20.77 19.65 19.74 20.41 Demand Motor Gasoline ................................ 8.29 8.66 8.85 8.64 8.49 9.00 9.06 8.92 8.73 9.22 9.35 9.17 8.61 8.87 9.12 Jet Fuel.................................................1.73 1.72 1.67 1.51 1.57 1.61 1.63 1.65 1.68 1.65 1.70 1.75 1.66 1.61 1.70 Distillate Fuel Oil................................4.23 3.75 3.67 3.75 3.79 3.72 3.67 3.89 4.12 3.76 3.73 4.00 3.85 3.77 3.90 Residual Fuel Oil ................................0.95 0.88 0.77 0.66 0.69 0.66 0.60 0.71 0.79 0.69 0.70 0.73 0.81 0.66 0.73 Other Oils d ..........................................4.70 4.60 4.74 4.86 4.90 4.66 4.90 4.85 4.92 4.80 5.01 5.11 4.73 4.83 4.96 Total Demand ................................ 19.89 19.60 19.70 19.41 19.44 19.64 19.85 20.01 20.25 20.12 20.49 20.76 19.65 19.74 20.41 Total Petroleum Net Imports...................11.17 11.33 10.82 10.33 10.11 10.76 10.38 10.58 10.89 11.68 11.72 11.28 10.91 10.47 11.39
Closing Stocks (million barrels) Crude Oil (excluding SPR)....................309 308 309 312 333 317 273 283 303 306 298 299 312 283 299 Total Motor Gasoline ..........................194 221 206 210 213 216 207 199 200 204 199 202 210 199 202 Finished Motor Gasoline...................145 169 158 161 160 168 159 154 149 156 153 156 161 154 156 Blending Components ......................49 51 48 48 53 48 47 46 51 48 46 46 48 46 46 Jet Fuel...............................................41 43 43 42 42 40 41 43 41 43 43 43 42 43 43 Distillate Fuel Oil................................105 114 127 145 123 131 129 123 90 103 123 124 145 123 124 Residual Fuel Oil ................................39 42 37 41 34 33 33 35 32 34 36 37 41 35 37 Other Oils e ........................................255 292 312 287 265 300 311 269 258 292 308 264 287 269 264 Total Stocks (excluding SPR) ...............942 1020 1034 1036 1011 1037 992 951 925 983 1007 969 1036 951 969 Crude Oil in SPR ................................542 543 545 550 561 576 586 598 612 622 632 642 550 598 642 Heating Oil Reserve..............................2 2 2 2 2 2 2 2 2 2 2 2 2 2 2 Total Stocks (including SPR and HOR) ......................................................
1486 1565 1581 1588 1575 1615 1580 1552 1538 1606 1641 1613 1588 1552 1613
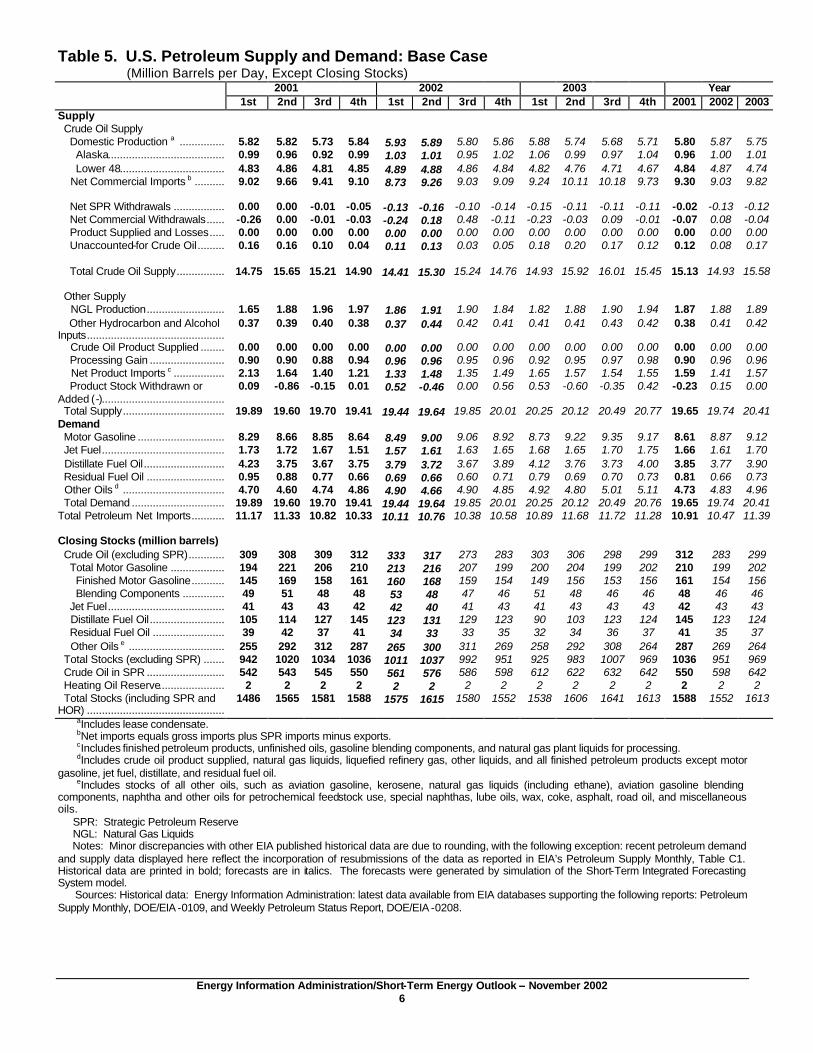
aIncludes lease condensate. bNet imports equals gross imports plus SPR imports minus exports. cIncludes finished petroleum products, unfinished oils, gasoline blending components, and natural gas plant liquids for processing. dIncludes crude oil product supplied, natural gas liquids, liquefied refinery gas, other liquids, and all finished petroleum products except motor gasoline, jet fuel, distillate, and residual fuel oil. eIncludes stocks of all other oils, such as aviation gasoline, kerosene, natural gas liquids (including ethane), aviation gasoline blending components, naphtha and other oils for petrochemical feedstock use, special naphthas, lube oils, wax, coke, asphalt, road oil, and miscellaneous oils. SPR: Strategic Petroleum Reserve NGL: Natural Gas Liquids Notes: Minor discrepancies with other EIA published historical data are due to rounding, with the following exception: recent petroleum demand and supply data displayed here reflect the incorporation of resubmissions of the data as reported in EIA’s Petroleum Supply Monthly, Table C1. Historical data are printed in bold; forecasts are in italics. The forecasts were generated by simulation of the Short-Term Integrated Forecasting System model. Sources: Historical data: Energy Information Administration: latest data available from EIA databases supporting the following reports: Petroleum Supply Monthly, DOE/EIA -0109, and Weekly Petroleum Status Report, DOE/EIA -0208.
Energy Information Administration/Short-Term Energy Outlook -- November 2002 7
Table 6. Approximate Energy Demand Sensitivitiesa for the STIFSb (Percent Deviation Base Case)
+ 10% Prices + 10% Weather e
Demand Sector +1% GDP Crude Oil c N.Gas Wellhead d Fall/Winter f Spring/Summer f
Petroleum Total ........................................ 0.6% -0.3% 0.1% 1.1% 0.1% Motor Gasoline ........................ 0.1% -0.3% 0.0% 0.0% 0.0% Distillate Fuel ........................... 0.8% -0.2% 0.0% 2.7% 0.1% Residual Fuel........................... 1.6% -3.4% 2.6% 2.0% 2.7%
Natural Gas Total ........................................ 1.1% 0.3% -0.4% 4.4% 1.0% Residential............................... 0.1% 0.0% 0.0% 8.2% 0.0% Commercial ............................. 0.9% 0.0% 0.0% 7.3% 0.0% Industrial.................................. 1.7% 0.2% -0.5% 1.3% 0.0% Electric Utility ........................... 1.8% 1.6% -1.5% 1.0% 4.0%
Coal Total ........................................ 0.7% 0.0% 0.0% 1.7% 1.7% Electric Utility ........................... 0.6% 0.0% 0.0% 1.9% 1.9%
Electricity Total ........................................ 0.6% 0.0% 0.0% 1.5% 1.7% Residential............................... 0.1% 0.0% 0.0% 3.2% 3.6% Commercial ............................. 0.9% 0.0% 0.0% 1.0% 1.4% Industrial.................................. 0.8% 0.0% 0.0% 0.3% 0.2%
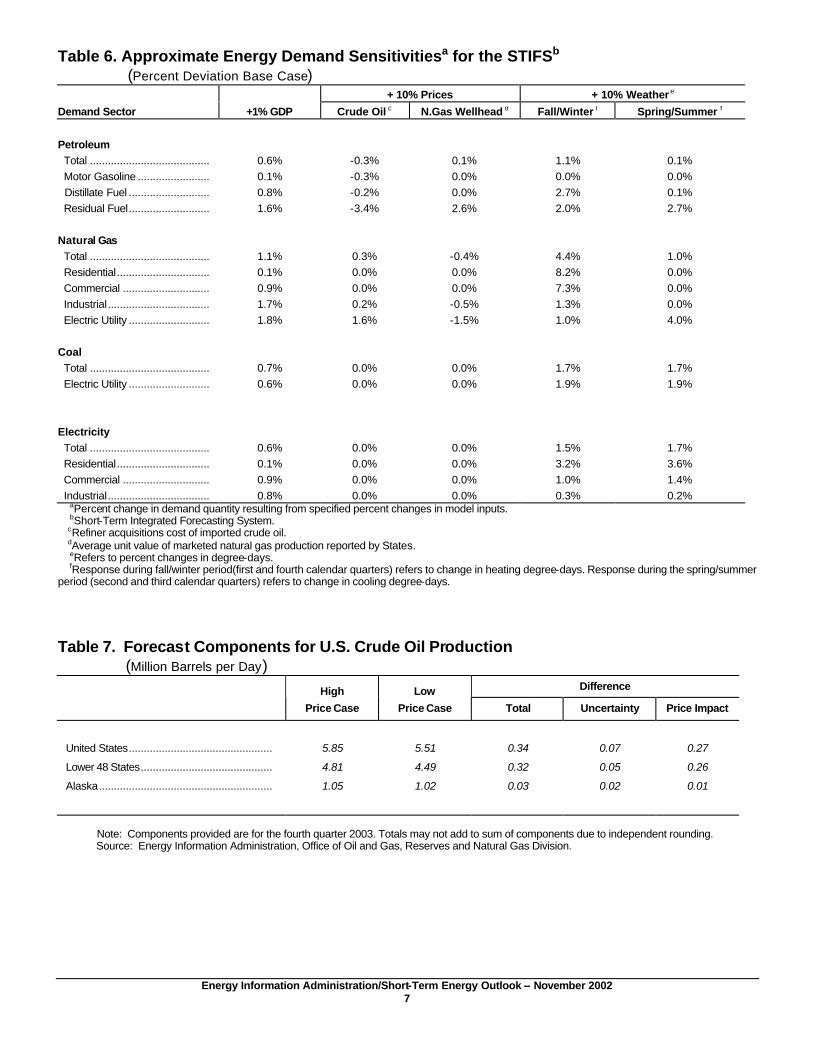
aPercent change in demand quantity resulting from specified percent changes in model inputs. bShort-Term Integrated Forecasting System. cRefiner acquisitions cost of imported crude oil. dAverage unit value of marketed natural gas production reported by States. eRefers to percent changes in degree-days. fResponse during fall/winter period(first and fourth calendar quarters) refers to change in heating degree-days. Response during the spring/summer period (second and third calendar quarters) refers to change in cooling degree-days.
Table 7. Forecast Components for U.S. Crude Oil Production (Million Barrels per Day)
Difference
High
Price Case
Low
Price Case Total Uncertainty Price Impact
United States................................................ 5.85 5.51 0.34 0.07 0.27
Lower 48 States............................................ 4.81 4.49 0.32 0.05 0.26
Alaska.......................................................... 1.05 1.02 0.03 0.02 0.01
Note: Components provided are for the fourth quarter 2003. Totals may not add to sum of components due to independent rounding. Source: Energy Information Administration, Office of Oil and Gas, Reserves and Natural Gas Division.

Energy Information Administration/Short-Term Energy Outlook -- November 2002 8
Table 8. U.S. Natural Gas Supply and Demand: Base Case (Trillion Cubic Feet)
2001 2002 2003 Year 1st 2nd 3rd 4th 1st 2nd 3rd 4th 1st 2nd 3rd 4th 2001 2002 2003
Supply Total Dry Gas Production ................................4.86 4.86 4.84 4.89 4.86 4.82 4.73 4.79 4.85 4.88 4.93 5.04 19.45 19.20 19.71 Net Imports ................................................................0.98 0.90 0.95 0.83 0.89 0.84 0.86 0.86 0.86 0.83 0.87 0.91 3.65 3.46 3.48 Supplemental Gaseous Fuels................................0.02 0.02 0.02 0.02 0.02 0.02 0.02 0.02 0.02 0.02 0.02 0.02 0.08 0.08 0.09 Total New Supply................................................................5.86 5.77 5.81 5.74 5.77 5.68 5.61 5.67 5.74 5.74 5.82 5.97 23.17 22.74 23.28
Working Gas in Storage Opening................................................................1.72 0.74 1.88 2.94 2.90 1.52 2.31 3.06 2.52 1.30 2.08 2.94 1.72 2.90 2.52 Closing................................................................0.74 1.88 2.94 2.90 1.52 2.31 3.06 2.52 1.30 2.08 2.94 2.49 2.90 2.52 2.49 Net Withdrawals................................................................0.98 -1.14 -1.06 0.04 1.39 -0.79 -0.75 0.54 1.22 -0.77 -0.86 0.45 -1.18 0.38 0.03
Total Supply................................................................6.84 4.63 4.74 5.78 7.16 4.89 4.86 6.21 6.96 4.97 4.96 6.42 21.99 23.12 23.31
Balancing Item a ................................................................0.25 -0.03 -0.27 -0.53 -0.56 -0.37 -0.14 -0.42 0.29 0.06 -0.06 -0.49 -0.59 -1.48 -0.19
Total Primary Supply ................................................................7.09 4.60 4.48 5.24 6.60 4.52 4.72 5.79 7.25 5.03 4.90 5.93 21.40 21.64 23.11
Demand Lease and Plant Fuel................................ 0.29 0.29 0.29 0.29 0.29 0.29 0.29 0.30 0.30 0.30 0.30 0.31 1.16 1.17 1.22 Pipeline Use................................................................0.20 0.13 0.13 0.15 0.19 0.13 0.13 0.16 0.21 0.14 0.13 0.17 0.61 0.60 0.64 Residential................................................................2.45 0.76 0.37 1.22 2.19 0.84 0.41 1.44 2.42 0.85 0.40 1.40 4.81 4.88 5.07 Commercial ................................................................1.34 0.59 0.43 0.77 1.20 0.63 0.46 0.85 1.26 0.62 0.46 0.86 3.12 3.14 3.21 Industrial (Incl. Nonutility Use)................................2.33 2.11 2.29 2.28 2.29 2.06 2.48 2.54 2.68 2.55 2.77 2.80 9.01 9.38 10.79 Electric Utilities ................................................................0.47 0.71 0.97 0.53 0.45 0.58 0.96 0.48 0.38 0.57 0.84 0.40 2.69 2.47 2.19 Total Demand ................................................................7.09 4.60 4.48 5.24 6.60 4.52 4.72 5.79 7.25 5.03 4.90 5.93 21.40 21.64 23.11
aThe balancing item represents the difference between the sum of the components of natural gas supply and the sum of components of natural gas demand. Notes: Minor discrepancies with other EIA published historical data are due to rounding. Historical data are printed in bold; forecasts are in italics. The forecasts were generated by simulation of the Short-Term Integrated Forecasting System. Sources: Historical data: Energy Information Administration: latest data available from EIA databases supporting the following reports: Natural Gas Monthly, DOE/EIA -0130; Electric Power Monthly, DOE/EIA -0226; Projections: Energy Information Administration, Short-Term Integrated Forecasting System database, and Office of Oil and Gas, Reserves and Natural Gas Division.

Energy Information Administration/Short-Term Energy Outlook -- November 2002 9
Table 9. U.S. Coal Supply and Demand: Base Case (Million Short Tons)
2001 2002 2003 Year 1st 2nd 3rd 4th 1st 2nd 3rd 4th 1st 2nd 3rd 4th 2001 2002 2003
Supply Production ..................................................283.6 278.3 278.1 281.3 281.1 266.8 267.7 273.2 268.6 254.1 281.4 272.5 1121.3 1088.8 1076.5 Appalachia................................................110.8 109.0 104.1 105.1 107.1 98.4 97.8 98.3 101.2 95.6 100.4 97.3 428.9 401.6 394.5 Interior ......................................................37.5 37.0 37.9 35.2 36.6 37.2 34.4 31.9 32.2 30.8 34.8 30.5 147.7 140.1 128.3 Western....................................................135.3 132.3 136.1 141.0 137.5 131.2 135.5 139.0 135.2 127.7 146.2 144.6 544.7 543.1 553.8
Primary Stock Levels a Opening...................................................31.9 39.2 38.3 37.0 33.9 44.5 39.5 33.1 32.5 32.8 31.6 33.0 31.9 33.9 32.5 Closing.....................................................39.2 38.3 37.0 33.9 44.5 39.5 33.1 32.5 32.8 31.6 33.0 32.7 33.9 32.5 32.7 Net Withdrawals................................-7.3 0.9 1.2 3.1 -10.6 4.9 6.4 0.6 -0.2 1.1 -1.4 0.3 -2.0 1.4 -0.2 Imports.....................................................3.9 4.1 6.0 5.7 4.0 3.9 4.4 4.3 3.6 3.5 3.5 3.6 19.8 16.5 14.2 Exports ....................................................11.8 13.5 11.7 11.7 9.3 11.0 9.8 10.4 9.7 9.9 10.0 10.0 48.7 40.5 39.6 Total Net Domestic Supply ....................268.4 269.9 273.7 278.5 265.3 264.5 268.8 267.6 262.3 248.9 273.5 266.3 1090.4 1066.2 1051.0
Secondary Stock Levels b Opening...................................................108.1 112.5 127.1 117.0 136.5 142.8 147.0 121.4 126.5 130.7 135.7 122.8 108.1 136.5 126.5 Closing.....................................................112.5 127.1 117.0 136.5 142.8 147.0 121.4 126.5 130.7 135.7 122.8 127.7 136.5 126.5 127.7 Net Withdraw als................................-4.4 -14.5 10.1 -19.5 -6.3 -4.2 25.6 -5.1 -4.3 -4.9 12.9 -4.9 -28.4 10.0 -1.2 Waste Coal Supplied to IPPs c ...................2.6 2.6 2.6 2.6 2.8 2.8 2.8 2.8 2.9 2.9 2.9 2.9 10.6 11.1 11.6
Total Supply.................................................266.6 258.0 286.4 261.6 261.8 263.1 297.1 265.3 260.9 246.9 289.3 264.3 1072.7 1087.3 1061.4
Demand Coke Plants ...............................................6.8 6.9 6.6 5.8 5.5 5.6 6.9 6.3 6.3 6.2 6.4 5.9 26.1 24.3 24.8 Electricity Production Electric Utilities .........................................200.8 193.2 220.5 191.8 184.5 183.1 223.0 192.7 189.0 179.5 214.7 191.3 806.3 783.3 774.5 Nonutilities (Excl. Cogen.) d .....................36.7 34.7 40.8 38.5 47.2 45.1 52.0 48.4 48.2 46.1 53.2 49.6 150.6 192.7 197.1 Retail and General Industry........................18.1 16.1 16.3 17.0 17.1 12.4 15.2 17.8 17.4 15.1 15.0 17.6 67.5 62.5 65.0 Total Demand e ..........................................262.3 251.0 284.2 253.0 254.1 246.2 297.1 265.3 260.9 246.9 289.3 264.3 1050.5 1062.8 1061.4
Discrepancy f ..............................................4.3 7.0 2.2 8.6 7.6 16.9 0.0 0.0 0.0 0.0 0.0 0.0 22.2 24.5 0.0
aPrimary stocks are held at the mines, preparation plants, and distribution points. bSecondary stocks are held by users. It includes an estimate of stocks held at utility plants sold to nonutility generators. cEstimated independent power producers' (IPPs) consumption of waste coal. This item includes waste coal and coal slurry reprocessed into briquettes. dEstimates of coal consumption by IPPs, supplied by the Office of Coal, Nuclear, Electric, and Alternate Fuels, Energy Information Administration (EIA). Quarterly coal consumption estimates for 2001 and projections for 2002 and 2003 are based on (1) estimated consumption by utility power plants sold to nonutility generators during 1999 and 2000, and (2) annual coal-fired generation at nonutilities from Form EIA -867 (Annual Nonutility Power Producer Report). eTotal Demand includes estimated IPP consumption. fThe discrepancy reflects an unaccounted-for shipper and receiver reporting difference, assumed to be zero in the forecast period. Notes: Rows and columns may not add due to independent rounding. Historical data are printed in bold; forecasts are in italics. The forecasts were generated by simulation of the Short-Term Integrated Forecasting System. Sources: Historical data: Energy Information Administration: latest data available from EIA databases supporting the following reports: Quarterly Coal Report, DOE/EIA -0121, and Electric Power Monthly, DOE/EIA -0226. Projections: Energy Information Administration, Short-Term Integrated Forecasting System database, and Office of Coal, Nuclear, Electric and Alternate Fuels.
Energy Information Administration/Short-Term Energy Outlook -- November 2002 10
Table 10. U.S. Electricity Supply and Demand: Base Case (Billion Kilowatt-hours)
2001 2002 2003 Year 1st 2nd 3rd 4th 1st 2nd 3rd 4th 1st 2nd 3rd 4th 2001 2002 2003
Supply Net Utility Generation Coal ................................................................391.8 376.1 423.9 368.4 363.0 361.4 428.8 366.3 362.8 342.9 409.1 363.7 1560.1 1519.5 1478.4 Petroleum................................................................24.1 21.6 21.4 11.9 12.1 15.6 19.7 8.9 12.3 9.5 18.2 10.2 78.9 56.3 50.1 Natural Gas................................ 46.2 69.6 95.7 53.0 46.3 58.3 94.3 47.7 37.6 56.0 82.9 39.0 264.4 246.5 215.5 Nuclear ................................................................135.9 130.2 140.6 127.5 129.5 122.5 136.7 119.3 131.4 120.7 139.1 121.3 534.2 508.1 512.5 Hydroelectric................................50.2 49.8 45.6 44.5 55.7 70.0 59.7 61.1 70.5 76.2 63.2 61.8 190.1 246.6 271.8 Geothermal and Other a ................................0.5 0.6 0.6 0.5 0.5 0.4 0.5 0.5 0.5 0.6 0.6 0.6 2.2 2.0 2.4 Subtotal................................................................648.6 647.8 727.7 605.8 607.2 628.2 739.8 603.7 615.1 605.9 713.1 596.6 2630.0 2578.9 2530.7 Nonutility Generation b Coal ................................................................92.9 81.3 95.6 82.8 90.2 95.8 103.9 93.6 97.5 93.0 119.3 111.1 352.5 383.5 420.9 Petroleum................................................................17.7 12.2 11.9 7.3 7.9 8.0 10.7 6.1 8.3 6.7 11.8 8.3 49.1 32.7 35.0 Natural Gas................................ 79.7 86.6 111.8 88.5 95.1 102.6 135.3 116.1 113.6 117.5 140.7 122.9 366.6 449.1 494.7 Other Gaseous Fuels c ................................4.1 4.5 5.8 4.6 4.9 5.3 7.1 5.8 5.5 5.7 7.4 6.3 18.9 23.0 25.0 Nuclear ................................................................56.2 55.3 60.4 62.7 65.5 65.3 71.1 62.1 69.4 61.8 72.4 63.1 234.6 264.0 266.7 Hydroelectric................................ 5.2 6.3 3.3 3.2 5.0 8.0 4.4 4.4 6.3 8.7 4.6 4.4 18.0 21.6 24.1 Geothermal and Other d ................................20.7 21.9 23.0 22.5 24.2 22.5 26.1 27.9 26.5 26.3 26.7 26.2 88.2 100.6 105.6 Subtotal................................................................276.6 268.2 311.6 271.5 292.7 307.4 358.5 315.9 327.2 319.7 382.9 342.3 1127.9 1274.6 1372.0 Total Generation ................................925.2 916.0 1039.4 877.3 899.9 935.6 1098.3 919.6 942.3 925.6 1096.0 938.8 3757.8 3853.5 3902.7 Net Imports e ................................ 3.6 7.2 5.1 4.4 4.9 8.5 6.3 5.6 6.1 7.7 11.1 6.6 20.3 25.3 31.4 Total Supply ................................ 928.8 923.2 1044.4 881.7 904.8 944.1 1104.6 925.2 948.3 933.4 1107.1 945.4 3778.1 3878.8 3934.2 Losses and Unaccounted for f ................................24.3 64.8 44.8 42.4 28.5 58.4 54.5 56.2 41.7 60.7 55.0 49.8 176.3 197.6 207.2 Demand Retail Sales g Residential ................................ 322.6 262.8 353.2 262.4 312.0 280.4 390.7 293.2 333.1 268.1 381.0 290.5 1201.0 1276.3 1272.7 Commercial................................ 257.0 264.6 305.2 258.2 255.8 279.5 321.5 265.3 256.4 270.8 314.7 268.5 1085.0 1122.1 1110.4 Industrial ................................................................247.6 252.8 252.7 241.0 227.5 243.2 245.6 229.8 231.7 248.0 260.5 250.3 994.1 946.1 990.5 Other................................................................27.2 28.3 33.1 28.0 25.6 26.5 31.5 27.4 26.8 27.7 31.6 27.5 116.7 111.0 113.7 Subtotal................................................................854.4 808.6 944.3 789.6 820.9 829.6 989.4 815.6 848.0 814.6 987.8 836.8 3396.8 3455.5 3487.2 Nonutility Use/Sales h ................................50.1 49.9 55.4 49.7 55.5 56.1 60.7 53.4 58.6 58.1 64.3 58.8 205.1 225.7 239.8 Total Demand ................................904.5 858.4 999.7 839.3 876.4 885.7 1050.1 869.0 906.7 872.7 1052.1 895.5 3601.8 3681.2 3727.0 Memo: Nonutility Sales to Electric Utilities b ................................226.4 218.3 256.2 221.8 237.2 251.3 297.8 262.5 268.6 261.6 318.6 283.5 922.8 1048.9 1132.3
a"Other" includes generation from wind, wood, waste, and solar sources. bElectricity(net Generation) from nonutility sources, including cogenerators and small power producers. cIncludes refinery still gas and other process or waste gases and liquefied petroleum gases. dIncludes geothermal, solar, wind, w ood, waste, hydrogen, sulfur, batteries, chemicals and spent sulfite liquor. eData for 2001 are estimates. fBalancing item, mainly transmission and distribution losses. gTotal of retail electricity sales by electric utilities and power marketers. Utility sales for historical periods are reported in EIA'S Electric Power Monthly and Electric Power Annual. Power marketers' sales are reported annually in Appendix C of EIA's Electric Sales and Revenue. Quarterly data for power marketers ( and thus retail sales totals) are imputed. Data for 2001 are estimated. hDefined as the sum of nonutility facility use of onsite net electricity generation plus direct sales of power by nonutility generators to third parties, reported annually in Table 7.5 of the Monthly Energy Review (MER). Data for 2001 are estimates. Notes: Minor discrepancies with other EIA published historical data are due to rounding. Historical data are printed in bold; forecasts are in italics. The forecasts were generated by simulation of the Short-Term Integrated Forecasting System. Sources: Historical data: Energy Information Administration: latest data available from EIA databases supporting the following report: Electric Power Monthly, DOE/EIA -0226. Projections: Energy Information Administration, Short-Term Integrated Forecasting System database, and Office of Coal, Nuclear, Electric and Alternate Fuels.
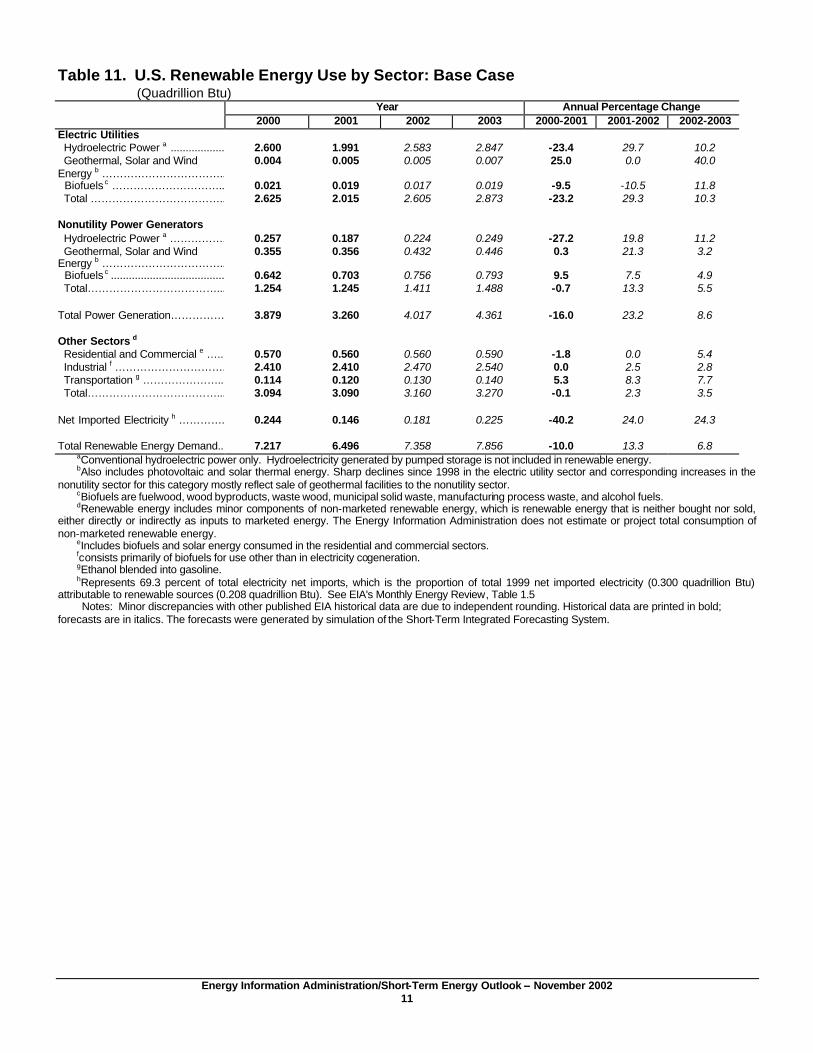
Energy Information Administration/Short-Term Energy Outlook -- November 2002 11
Table 11. U.S. Renewable Energy Use by Sector: Base Case (Quadrillion Btu)
Year Annual Percentage Change 2000 2001 2002 2003 2000-2001 2001-2002 2002-2003
Electric Utilities Hydroelectric Power a ................................2.600 1.991 2.583 2.847 -23.4 29.7 10.2 Geothermal, Solar and Wind Energy b ……………………………..
0.004 0.005 0.005 0.007 25.0 0.0 40.0
Biofuels c ………………………….. 0.021 0.019 0.017 0.019 -9.5 -10.5 11.8 Total ……………………………….. 2.625 2.015 2.605 2.873 -23.2 29.3 10.3
Nonutility Power Generators Hydroelectric Power a ……………. 0.257 0.187 0.224 0.249 -27.2 19.8 11.2 Geothermal, Solar and Wind Energy b ……………………………..
0.355 0.356 0.432 0.446 0.3 21.3 3.2
Biofuels c ................................................................0.642 0.703 0.756 0.793 9.5 7.5 4.9 Total………………………………... 1.254 1.245 1.411 1.488 -0.7 13.3 5.5
Total Power Generation…………… 3.879 3.260 4.017 4.361 -16.0 23.2 8.6
Other Sectors d Residential and Commercial e ….. 0.570 0.560 0.560 0.590 -1.8 0.0 5.4 Industrial f …………………………. 2.410 2.410 2.470 2.540 0.0 2.5 2.8 Transportation g ………………….. 0.114 0.120 0.130 0.140 5.3 8.3 7.7 Total………………………………... 3.094 3.090 3.160 3.270 -0.1 2.3 3.5
Net Imported Electricity h …………. 0.244 0.146 0.181 0.225 -40.2 24.0 24.3
Total Renewable Energy Demand.. 7.217 6.496 7.358 7.856 -10.0 13.3 6.8
aConventional hydroelectric power only. Hydroelectricity generated by pumped storage is not included in renewable energy. bAlso includes photovoltaic and solar thermal energy. Sharp declines since 1998 in the electric utility sector and corresponding increases in the nonutility sector for this category mostly reflect sale of geothermal facilities to the nonutility sector. cBiofuels are fuelwood, wood byproducts, waste wood, municipal solid waste, manufacturing process waste, and alcohol fuels. dRenewable energy includes minor components of non-marketed renewable energy, which is renewable energy that is neither bought nor sold, either directly or indirectly as inputs to marketed energy. The Energy Information Administration does not estimate or project total consumption of non-marketed renewable energy. eIncludes biofuels and solar energy consumed in the residential and commercial sectors. fconsists primarily of biofuels for use other than in electricity cogeneration. gEthanol blended into gasoline. hRepresents 69.3 percent of total electricity net imports, which is the proportion of total 1999 net imported electricity (0.300 quadrillion Btu) attributable to renewable sources (0.208 quadrillion Btu). See EIA's Monthly Energy Review, Table 1.5 Notes: Minor discrepancies with other published EIA historical data are due to independent rounding. Historical data are printed in bold; forecasts are in italics. The forecasts were generated by simulation of the Short-Term Integrated Forecasting System.

Energy Information Administration/Short-Term Energy Outlook – November 2002 1
Table A1. Annual U.S. Energy Supply and Demand: Base Case
Year
1989 1990 1991 1992 1993 1994 1995 1996 1997 1998 1999 2000 2001 2002 2003 Real Gross Domestic Product (GDP) (billion chained 1996 dollars)................................................................6592 6708 6676 6880 7063 7348 7544 7813 8159 8509 8859 9191 9215 9425 9708 Imported Crude Oil Price a (nominal dollars per barrel)................................................................18.07 21.79 18.74 18.20 16.13 15.53 17.14 20.62 18.49 12.07 17.26 27.72 22.01 23.85 23.99 Petroleum Supply
Crude Oil Production b (million barrels per day) ................................................................7.61 7.36 7.42 7.17 6.85 6.66 6.56 6.46 6.45 6.25 5.88 5.82 5.80 5.87 5.75 Total Petroleum Net Imports (including SPR) (million barrels per day) ................................................................7.20 7.18 6.80 6.96 7.66 8.09 7.89 8.50 9.16 9.76 9.92 10.43 10.91 10.47 11.39 Energy Demand
World Petroleum (million barrels per day) ................................................................65.9 66.0 66.6 66.8 67.0 68.3 69.9 71.4 72.9 73.6 75.0 76.0 76.0 76.3 77.6 U.S. Petroleum (million barrels per day) ................................................................17.37 17.04 16.77 17.10 17.24 17.72 17.72 18.31 18.62 18.92 19.52 19.70 19.65 19.74 20.41 Natural Gas (trillion cubic feet)................................................................18.80 18.72 19.03 19.54 20.28 20.71 21.58 21.96 21.95 21.27 21.61 22.54 21.40 21.64 23.11 Coal (million short tons) ................................................................895 903 899 907 943 950 962 1006 1030 1038 1045 1081 1050 1063 1061 Electricity (billion kilowatthours) Retail Sales c ................................................................2647 2713 2762 2763 2861 2935 3013 3101 3146 3264 3312 3421 3397 3455 3487 Nonutility Own Use d ................................................................NA 115 118 122 128 134 144 146 148 161 183 183 205 226 240 Total ................................................................................................NA 2828 2880 2885 2989 3069 3157 3247 3294 3425 3495 3604 3602 3681 3727 Total Energy Demand e (quadrillion Btu) ................................................................84.2 84.2 84.5 85.6 87.4 89.2 90.9 93.9 94.2 94.8 97.0 99.6 97.0 98.2 101.3 Total Energy Demand per Dollar of GDP (thousand Btu per 1996 Dollar)................................................................NA 12.55 12.66 12.44 12.37 12.14 12.05 12.04 11.54 11.14 10.95 10.83 10.53 10.41 10.43
aRefers to the imported cost of crude oil to U.S. refiners. bIncludes lease condensate. cTotal of retail electricity sales by electric utilities and power marketers. Utility sales for historical periods are reported in EIA's Electric Power Monthly and Electric Power Annual. Power marketers' sales for historical periods are reported in EIA's Electric Sales and Revenue, Appendix C. dDefined as the sum of nonutility facility use of onsite net electricity generation plus direct sales of power by nonutility generators to third parties, reported annually in Table 7.5 of the Monthly Energy Review (MER). Data for 2001 are estimates. e "Total Energy Demand" refers to the aggregate energy concept presented in Energy Information Administration, Annual Energy Review, 1999, DOE/EIA-0384(97) (AER), Table 1.1. Prior to 1990, some components of renewable energy consumption, particularly relating to consum ption at nonutility electric generating facilities, were not available. For those years, a less compehensive measure of total energy demand can be found in EIA's AER. The conversion from physical units to Btu is calculated using a subset of conversion factors used in the calculations performed for gross energy consumption in Energy Information Administration, Monthly Energy Review (MER). Consequently, the historical data may not precisely match those published in the MER or the AER. Notes: SPR: Strategic Petroleum Reserve. Minor discrepancies with other published EIA historical data are due to independent rounding. Historical data are printed in bold; forecasts are in italics. The forecasts were generated by simulation of the Short-Term Integrated Forec asting System. Sources: Historical data: Latest data available from Bureau of Economic Analysis; Energy Information Administration; latest data available from EIA databases supporting the following reports: Petroleum Supply Monthly, DOE/EIA-0109; Petroleum Supply Annual, DOE/EIA-0340/2; Natural Gas Monthly, DOE/EIA-0130; Electric Power Monthly, DOE/EIA-0226; Quarterly Coal Report, DOE/EIA-0121; International Petroleum Monthly DOE/EIA-520, and Weekly Petroleum Status Report DOE/EIA-0208. Macroeconomic projections are based on DRI-WEFA Forecast CONTROL0902.
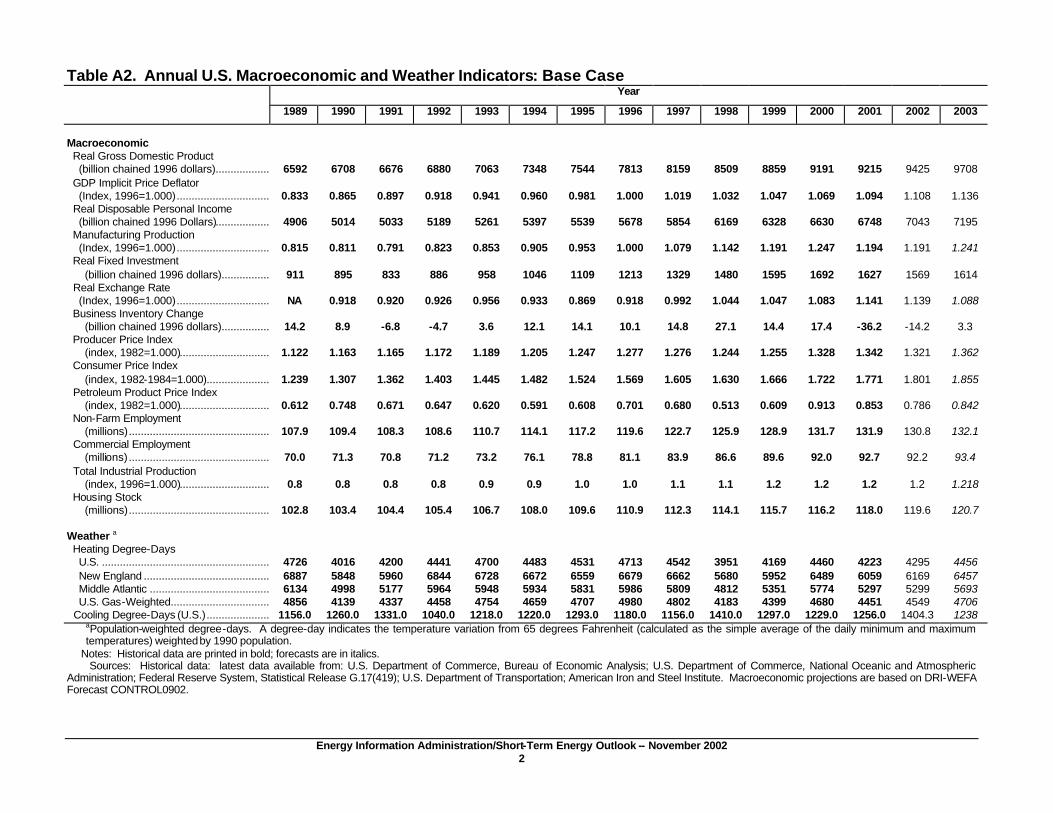
Energy Information Administration/Short-Term Energy Outlook -- November 2002 2
Table A2. Annual U.S. Macroeconomic and Weather Indicators: Base Case
Year
1989 1990 1991 1992 1993 1994 1995 1996 1997 1998 1999 2000 2001 2002 2003
Macroeconomic Real Gross Domestic Product (billion chained 1996 dollars)...........................6592 6708 6676 6880 7063 7348 7544 7813 8159 8509 8859 9191 9215 9425 9708 GDP Implicit Price Deflator (Index, 1996=1.000)................................ 0.833 0.865 0.897 0.918 0.941 0.960 0.981 1.000 1.019 1.032 1.047 1.069 1.094 1.108 1.136 Real Disposable Personal Income (billion chained 1996 Dollars)...........................4906 5014 5033 5189 5261 5397 5539 5678 5854 6169 6328 6630 6748 7043 7195 Manufacturing Production (Index, 1996=1.000)................................ 0.815 0.811 0.791 0.823 0.853 0.905 0.953 1.000 1.079 1.142 1.191 1.247 1.194 1.191 1.241 Real Fixed Investment (billion chained 1996 dollars).........................911 895 833 886 958 1046 1109 1213 1329 1480 1595 1692 1627 1569 1614 Real Exchange Rate (Index, 1996=1.000)................................ NA 0.918 0.920 0.926 0.956 0.933 0.869 0.918 0.992 1.044 1.047 1.083 1.141 1.139 1.088 Business Inventory Change (billion chained 1996 dollars).........................14.2 8.9 -6.8 -4.7 3.6 12.1 14.1 10.1 14.8 27.1 14.4 17.4 -36.2 -14.2 3.3 Producer Price Index (index, 1982=1.000)................................ 1.122 1.163 1.165 1.172 1.189 1.205 1.247 1.277 1.276 1.244 1.255 1.328 1.342 1.321 1.362 Consumer Price Index (index, 1982-1984=1.000)..............................1.239 1.307 1.362 1.403 1.445 1.482 1.524 1.569 1.605 1.630 1.666 1.722 1.771 1.801 1.855 Petroleum Product Price Index (index, 1982=1.000)................................ 0.612 0.748 0.671 0.647 0.620 0.591 0.608 0.701 0.680 0.513 0.609 0.913 0.853 0.786 0.842 Non-Farm Employment (millions)........................................................107.9 109.4 108.3 108.6 110.7 114.1 117.2 119.6 122.7 125.9 128.9 131.7 131.9 130.8 132.1 Commercial Employment (millions) ........................................................70.0 71.3 70.8 71.2 73.2 76.1 78.8 81.1 83.9 86.6 89.6 92.0 92.7 92.2 93.4 Total Industrial Production (index, 1996=1.000)................................ 0.8 0.8 0.8 0.8 0.9 0.9 1.0 1.0 1.1 1.1 1.2 1.2 1.2 1.2 1.218 Housing Stock (millions)........................................................102.8 103.4 104.4 105.4 106.7 108.0 109.6 110.9 112.3 114.1 115.7 116.2 118.0 119.6 120.7
Weather a Heating Degree-Days U.S. ................................................................4726 4016 4200 4441 4700 4483 4531 4713 4542 3951 4169 4460 4223 4295 4456 New England ...................................................6887 5848 5960 6844 6728 6672 6559 6679 6662 5680 5952 6489 6059 6169 6457 Middle Atlantic .................................................6134 4998 5177 5964 5948 5934 5831 5986 5809 4812 5351 5774 5297 5299 5693 U.S. Gas-Weighted..........................................4856 4139 4337 4458 4754 4659 4707 4980 4802 4183 4399 4680 4451 4549 4706 Cooling Degree-Days (U.S.)..............................1156.0 1260.0 1331.0 1040.0 1218.0 1220.0 1293.0 1180.0 1156.0 1410.0 1297.0 1229.0 1256.0 1404.3 1238
aPopulation-weighted degree-days. A degree-day indicates the temperature variation from 65 degrees Fahrenheit (calculated as the simple average of the daily minimum and maximum temperatures) weighted by 1990 population.
Notes: Historical data are printed in bold; forecasts are in italics. Sources: Historical data: latest data available from: U.S. Department of Commerce, Bureau of Economic Analysis; U.S. Department of Commerce, National Oceanic and Atmospheric Administration; Federal Reserve System, Statistical Release G.17(419); U.S. Department of Transportation; American Iron and Steel Institute. Macroeconomic projections are based on DRI-WEFA Forecast CONTROL0902.
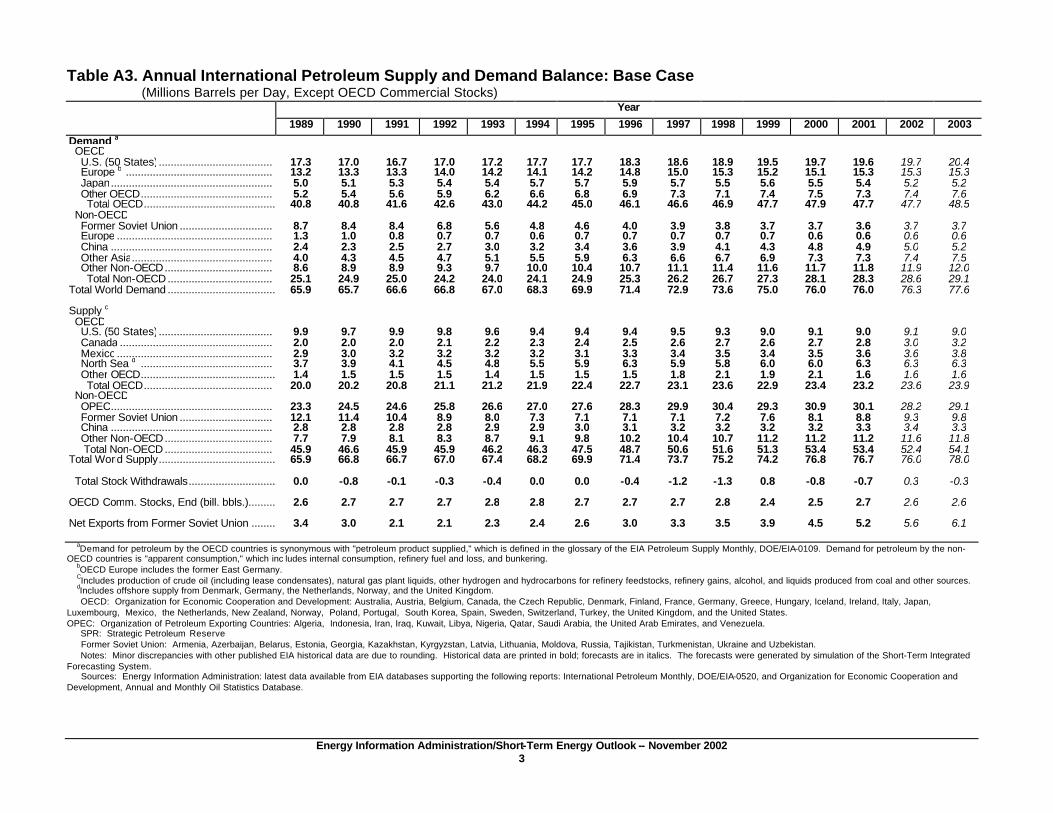
Energy Information Administration/Short-Term Energy Outlook -- November 2002 3
Table A3. Annual International Petroleum Supply and Demand Balance: Base Case (Millions Barrels per Day, Except OECD Commercial Stocks)
Year
1989 1990 1991 1992 1993 1994 1995 1996 1997 1998 1999 2000 2001 2002 2003
Demand a OECD U.S. (50 States)...................................... 17.3 17.0 16.7 17.0 17.2 17.7 17.7 18.3 18.6 18.9 19.5 19.7 19.6 19.7 20.4 Europe b ................................................. 13.2 13.3 13.3 14.0 14.2 14.1 14.2 14.8 15.0 15.3 15.2 15.1 15.3 15.3 15.3 Japan...................................................... 5.0 5.1 5.3 5.4 5.4 5.7 5.7 5.9 5.7 5.5 5.6 5.5 5.4 5.2 5.2 Other OECD............................................ 5.2 5.4 5.6 5.9 6.2 6.6 6.8 6.9 7.3 7.1 7.4 7.5 7.3 7.4 7.6 Total OECD................................................................40.8 40.8 41.6 42.6 43.0 44.2 45.0 46.1 46.6 46.9 47.7 47.9 47.7 47.7 48.5 Non-OECD Former Soviet Union ............................... 8.7 8.4 8.4 6.8 5.6 4.8 4.6 4.0 3.9 3.8 3.7 3.7 3.6 3.7 3.7 Europe .................................................... 1.3 1.0 0.8 0.7 0.7 0.6 0.7 0.7 0.7 0.7 0.7 0.6 0.6 0.6 0.6 China ...................................................... 2.4 2.3 2.5 2.7 3.0 3.2 3.4 3.6 3.9 4.1 4.3 4.8 4.9 5.0 5.2 Other Asia............................................... 4.0 4.3 4.5 4.7 5.1 5.5 5.9 6.3 6.6 6.7 6.9 7.3 7.3 7.4 7.5 Other Non-OECD.................................... 8.6 8.9 8.9 9.3 9.7 10.0 10.4 10.7 11.1 11.4 11.6 11.7 11.8 11.9 12.0 Total Non-OECD ................................... 25.1 24.9 25.0 24.2 24.0 24.1 24.9 25.3 26.2 26.7 27.3 28.1 28.3 28.6 29.1 Total World Demand ................................................................65.9 65.7 66.6 66.8 67.0 68.3 69.9 71.4 72.9 73.6 75.0 76.0 76.0 76.3 77.6 Supply c OECD U.S. (50 States)...................................... 9.9 9.7 9.9 9.8 9.6 9.4 9.4 9.4 9.5 9.3 9.0 9.1 9.0 9.1 9.0 Canada ................................................... 2.0 2.0 2.0 2.1 2.2 2.3 2.4 2.5 2.6 2.7 2.6 2.7 2.8 3.0 3.2 Mexico.................................................... 2.9 3.0 3.2 3.2 3.2 3.2 3.1 3.3 3.4 3.5 3.4 3.5 3.6 3.6 3.8 North Sea d ............................................ 3.7 3.9 4.1 4.5 4.8 5.5 5.9 6.3 5.9 5.8 6.0 6.0 6.3 6.3 6.3 Other OECD................................................................1.4 1.5 1.5 1.5 1.4 1.5 1.5 1.5 1.8 2.1 1.9 2.1 1.6 1.6 1.6 Total OECD........................................... 20.0 20.2 20.8 21.1 21.2 21.9 22.4 22.7 23.1 23.6 22.9 23.4 23.2 23.6 23.9 Non-OECD OPEC...................................................... 23.3 24.5 24.6 25.8 26.6 27.0 27.6 28.3 29.9 30.4 29.3 30.9 30.1 28.2 29.1 Former Soviet Union ............................... 12.1 11.4 10.4 8.9 8.0 7.3 7.1 7.1 7.1 7.2 7.6 8.1 8.8 9.3 9.8 China ...................................................... 2.8 2.8 2.8 2.8 2.9 2.9 3.0 3.1 3.2 3.2 3.2 3.2 3.3 3.4 3.3 Other Non-OECD.................................... 7.7 7.9 8.1 8.3 8.7 9.1 9.8 10.2 10.4 10.7 11.2 11.2 11.2 11.6 11.8 Total Non-OECD .................................... 45.9 46.6 45.9 45.9 46.2 46.3 47.5 48.7 50.6 51.6 51.3 53.4 53.4 52.4 54.1 Total World Supply................................................................65.9 66.8 66.7 67.0 67.4 68.2 69.9 71.4 73.7 75.2 74.2 76.8 76.7 76.0 78.0 Total Stock Withdrawals................................ 0.0 -0.8 -0.1 -0.3 -0.4 0.0 0.0 -0.4 -1.2 -1.3 0.8 -0.8 -0.7 0.3 -0.3 OECD Comm. Stocks, End (bill. bbls.)................................2.6 2.7 2.7 2.7 2.8 2.8 2.7 2.7 2.7 2.8 2.4 2.5 2.7 2.6 2.6 Net Exports from Former Soviet Union ................................3.4 3.0 2.1 2.1 2.3 2.4 2.6 3.0 3.3 3.5 3.9 4.5 5.2 5.6 6.1
aDemand for petroleum by the OECD countries is synonymous with "petroleum product supplied," which is defined in the glossary of the EIA Petroleum Supply Monthly, DOE/EIA-0109. Demand for petroleum by the non-OECD countries is "apparent consumption," which inc ludes internal consumption, refinery fuel and loss, and bunkering. bOECD Europe includes the former East Germany. CIncludes production of crude oil (including lease condensates), natural gas plant liquids, other hydrogen and hydrocarbons for refinery feedstocks, refinery gains, alcohol, and liquids produced from coal and other sources. dIncludes offshore supply from Denmark, Germany, the Netherlands, Norway, and the United Kingdom. OECD: Organization for Economic Cooperation and Development: Australia, Austria, Belgium, Canada, the Czech Republic, Denmark, Finland, France, Germany, Greece, Hungary, Iceland, Ireland, Italy, Japan, Luxembourg, Mexico, the Netherlands, New Zealand, Norway, Poland, Portugal, South Korea, Spain, Sweden, Switzerland, Turkey, the United Kingdom, and the United States. OPEC: Organization of Petroleum Exporting Countries: Algeria, Indonesia, Iran, Iraq, Kuwait, Libya, Nigeria, Qatar, Saudi Arabia, the United Arab Emirates, and Venezuela. SPR: Strategic Petroleum Reserve Former Soviet Union: Armenia, Azerbaijan, Belarus, Estonia, Georgia, Kazakhstan, Kyrgyzstan, Latvia, Lithuania, Moldova, Russia, Tajikistan, Turkmenistan, Ukraine and Uzbekistan. Notes: Minor discrepancies with other published EIA historical data are due to rounding. Historical data are printed in bold; forecasts are in italics. The forecasts were generated by simulation of the Short-Term Integrated Forecasting System. Sources: Energy Information Administration: latest data available from EIA databases supporting the following reports: International Petroleum Monthly, DOE/EIA-0520, and Organization for Economic Cooperation and Development, Annual and Monthly Oil Statistics Database.

Energy Information Administration/Short-Term Energy Outlook -- November 2002 4
Table A4. Annual Average U.S. Energy Prices: Base Case (Nominal Dollars)
Year 1989 1990 1991 1992 1993 1994 1995 1996 1997 1998 1999 2000 2001 2002 2003
Crude Oil Prices (dollars per barrel) Imported Average a ................................18.07 21.79 18.74 18.20 16.13 15.53 17.14 20.62 18.49 12.07 17.26 27.72 22.01 23.85 23.99 WTI b Spot Average................................19.78 24.48 21.60 20.54 18.49 17.16 18.41 22.11 20.61 14.45 19.25 30.29 25.95 26.11 26.20
Natural Gas Wellhead (dollars per thousand cubic feet)................................1.69 1.71 1.64 1.74 2.04 1.85 1.55 2.17 2.32 1.96 2.19 3.69 4.12 2.92 3.37
Petroleum Products Gasoline Retail b (dollars per gallon) All Grades................................................................1.02 1.17 1.15 1.14 1.13 1.13 1.16 1.25 1.24 1.07 1.18 1.53 1.47 1.39 1.45 Regular Unleaded................................ 0.99 1.13 1.10 1.09 1.07 1.08 1.11 1.20 1.20 1.03 1.14 1.49 1.43 1.35 1.40 No. 2 Diesel Oil, Retail (dollars per gallon)................................ 0.99 1.17 1.13 1.11 1.11 1.11 1.11 1.24 1.19 1.04 1.12 1.49 1.40 1.32 1.39 No. 2 Heating Oil, Wholesale (dollars per gallon)................................ 0.57 0.70 0.62 0.58 0.54 0.51 0.51 0.64 0.59 0.42 0.49 0.89 0.76 0.72 0.79 No. 2 Heating Oil, Retail (dollars per gallon)................................ 0.88 1.04 0.98 0.93 0.90 0.87 0.86 0.98 0.97 0.84 0.87 1.29 1.23 1.14 1.22 No. 6 Residual Fuel Oil, Retail c (dollars per barrel) ................................ 16.20 18.66 14.32 14.21 14.00 14.79 16.49 19.01 17.82 12.83 16.02 25.34 22.30 24.01 24.53
Electric Utility Fuels Coal (dollars per million Btu)................................1.44 1.45 1.45 1.41 1.38 1.36 1.32 1.29 1.27 1.25 1.22 1.20 1.23 1.21 1.20 Heavy Fuel Oil d (dollars per million Btu)................................2.86 3.22 2.48 2.46 2.36 2.40 2.60 3.01 2.79 2.07 2.38 4.27 3.71 3.72 3.95 Natural Gas (dollars per million Btu)................................2.36 2.32 2.15 2.33 2.56 2.23 1.98 2.64 2.76 2.38 2.57 4.33 4.43 3.50 3.88
Other Residential Natural Gas (dollars per thousand cubic feet)................................5.64 5.80 5.82 5.89 6.17 6.41 6.06 6.35 6.95 6.83 6.69 7.77 9.63 7.80 8.37 Electricity (cents per kilowatthour)................................7.64 7.85 8.05 8.23 8.34 8.40 8.40 8.36 8.43 8.26 8.16 8.24 8.48 8.38 8.41
aRefiner acquisition cost (RAC) of imported crude oil. bWest Texas Intermediate. cAverage self -service cash prices. dAverage for all sulfur contents. eIncludes fuel oils No. 4, No. 5, and No. 6 and topped crude fuel oil prices. Notes: Prices exclude taxes, except prices for gasoline, residential natural gas, and diesel. The forecasts were generated by simulation of the Short-Term Integrated Forecasting System. Sources: Historical data: Energy Information Administration: latest data available from EIA databases supporting the following reports: Petroleum Marketing Monthly, DOE/EIA-0380; Natural Gas Monthly, DOE/EIA-0130; Monthly Energy Review, DOE/EIA-0035; Electric Power Monthly, DOE/EIA-0226.

Energy Information Administration/Short-Term Energy Outlook -- November 2002 5
Table A5. Annual U.S. Petroleum Supply and Demand: Base Case (Million Barrels per Day, Except Closing Stocks)
Year 1989 1990 1991 1992 1993 1994 1995 1996 1997 1998 1999 2000 2001 2002 2003
Supply Crude Oil Supply Domestic Production a ................................ 7.61 7.36 7.42 7.17 6.85 6.66 6.56 6.46 6.45 6.25 5.88 5.82 5.80 5.87 5.75 Alaska................................................................1.87 1.77 1.80 1.71 1.58 1.56 1.48 1.39 1.30 1.17 1.05 0.97 0.96 1.00 1.01 Lower 48................................................................5.74 5.58 5.62 5.46 5.26 5.10 5.08 5.07 5.16 5.08 4.83 4.85 4.84 4.87 4.74 Net Commercial Imports b ................................5.65 5.76 5.67 5.98 6.67 6.95 7.14 7.40 8.12 8.60 8.60 9.01 9.30 9.03 9.82 Net SPR Withdrawals ................................................................-0.03 0.01 0.05 -0.01 -0.02 0.00 0.00 0.07 0.01 -0.02 0.02 0.08 -0.02 -0.13 -0.12 Net Commercial Withdrawals ................................0.00 0.05 -0.01 0.02 -0.05 -0.01 0.09 0.05 -0.06 -0.05 0.11 0.00 -0.07 0.08 -0.04 Product Supplied and Losses................................-0.03 -0.02 -0.02 -0.01 -0.01 -0.01 -0.01 -0.01 0.00 0.00 0.00 0.00 0.00 0.00 0.00 Unaccounted-for Crude Oil................................0.20 0.26 0.20 0.26 0.17 0.27 0.19 0.22 0.14 0.11 0.19 0.15 0.12 0.08 0.17
Total Crude Oil Supply ................................ 13.40 13.41 13.30 13.41 13.61 13.87 13.97 14.19 14.66 14.89 14.80 15.07 15.13 14.93 15.58
Other Supply NGL Production................................................................1.55 1.56 1.66 1.70 1.74 1.73 1.76 1.83 1.82 1.76 1.85 1.91 1.87 1.88 1.89 Other Hydrocarbon and Alcohol Inputs................................0.11 0.13 0.15 0.20 0.25 0.26 0.30 0.31 0.34 0.38 0.38 0.38 0.38 0.41 0.42 Crude Oil Product Supplied................................0.03 0.02 0.02 0.01 0.01 0.01 0.01 0.01 0.00 0.00 0.00 0.00 0.00 0.00 0.00 Processing Gain................................................................0.66 0.68 0.71 0.77 0.77 0.77 0.77 0.84 0.85 0.89 0.89 0.95 0.90 0.96 0.96 Net Product Imports c ................................................................1.50 1.38 1.13 0.94 0.93 1.09 0.75 1.10 1.04 1.17 1.30 1.40 1.59 1.41 1.57 Product Stock Withdrawn................................0.13 -0.14 -0.04 0.06 -0.05 0.00 0.15 0.03 -0.09 -0.17 0.30 0.00 -0.23 0.15 0.00
Total Supply ................................................................17.37 17.04 16.93 17.10 17.26 17.72 17.72 18.31 18.62 18.92 19.52 19.70 19.65 19.74 20.41
Demand Motor Gasoline d ................................................................7.40 7.31 7.23 7.38 7.48 7.60 7.79 7.89 8.02 8.25 8.43 8.47 8.61 8.87 9.12 Jet Fuel ................................................................1.49 1.52 1.47 1.45 1.47 1.53 1.51 1.58 1.60 1.62 1.67 1.73 1.66 1.61 1.70 Distillate Fuel Oil ................................................................3.16 3.02 2.92 2.98 3.04 3.16 3.21 3.37 3.44 3.46 3.57 3.72 3.85 3.77 3.90 Residual Fuel Oil ................................................................1.37 1.23 1.16 1.09 1.08 1.02 0.85 0.85 0.80 0.89 0.83 0.91 0.81 0.66 0.73 Other Oils e ................................................................3.95 3.95 3.99 4.20 4.17 4.41 4.36 4.63 4.77 4.69 5.01 4.87 4.73 4.83 4.96
Total Demand................................................................17.37 17.04 16.77 17.10 17.24 17.72 17.72 18.31 18.62 18.92 19.52 19.70 19.65 19.74 20.41
Total Petroleum Net Imports................................7.20 7.18 6.80 6.96 7.66 8.09 7.89 8.50 9.16 9.76 9.92 10.43 10.91 10.47 11.39
Closing Stocks (million barrels) Crude Oil (excluding SPR) ................................341 323 325 318 335 337 303 284 305 324 284 286 312 283 299 Total Motor Gasoline ................................................................213 220 219 216 226 215 202 195 210 216 193 196 210 199 202 Jet Fuel ................................................................41 52 49 43 40 47 40 40 44 45 41 45 42 43 43 Distillate Fuel Oil ................................................................106 132 144 141 141 145 130 127 138 156 125 118 145 123 124 Residual Fuel Oil ................................................................44 49 50 43 44 42 37 46 40 45 36 36 41 35 37 Other Oils f ................................................................293 227 251 292 237 274 348 280 204 212 396 246 178 354 247 aIncludes lease condensate. bNet imports equals gross imports plus SPR imports minus exports. cIncludes finished petroleum products, unfinished oils, gasoline blending components, and natural gas plant liquids for processing. dFor years prior to 1993, motor gasoline includes an estimate of fuel ethanol blended into gasoline and certain product reclassifications, not reported elsewhere in EIA. See Appendix B in Energy Information Administration, Short-Term Energy Outlook, EIA/DOE-0202(93/3Q), for details on this adjustment. eIncludes crude oil product supplied, natural gas liquids, liquefied refinery gas, other liquids, and all finished petroleum products except motor gasoline, jet fuel, distillate, and residual fuel oil. fIncludes stocks of all other oils, such as aviation gasoline, kerosene, natural gas liquids (including ethane), aviation gasoline blending components, naphtha and other oils for petrochemical feedstock use, special naphthas, lube oils, wax, coke, asphalt, road oil, and miscellaneous oils. SPR: Strategic Petroleum Reserve. NGL: Natural Gas Liquids Notes: Minor discrepancies with other EIA published historical data are due to rounding, with the following exception: recent petroleum demand and supply data displayed here reflect the incorporation of resubmissions of the data as reported in EIA’s Petroleum Supply Monthly, TableC1. Historical data are printed in bold; forecasts are in italics. The forecasts were generated by simulation of the Short-Term Integrated Forecasting System. Sources: Historical data: Energy Information Administration: latest data available from EIA databases supporting the following reports: Petroleum Supply Monthly, DOE/EIA-0109, and Weekly Petroleum Status Report, DOE/EIA-0208.
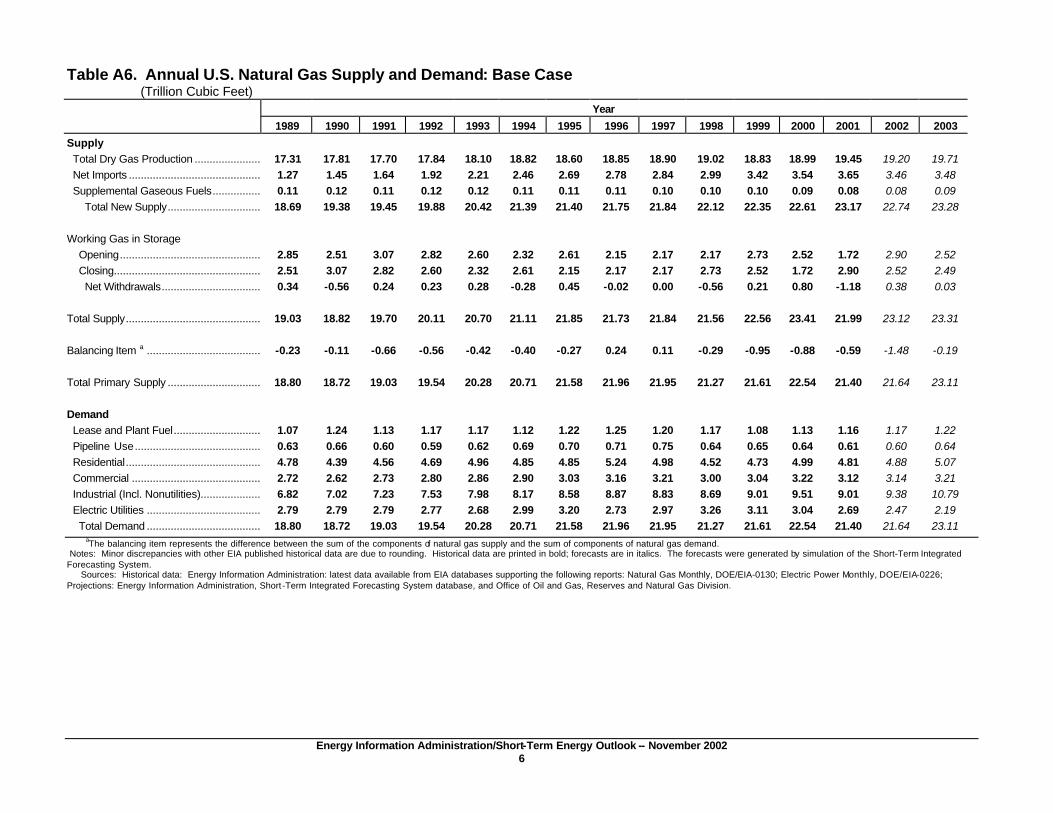
Energy Information Administration/Short-Term Energy Outlook -- November 2002 6
Table A6. Annual U.S. Natural Gas Supply and Demand: Base Case (Trillion Cubic Feet)
Year
1989 1990 1991 1992 1993 1994 1995 1996 1997 1998 1999 2000 2001 2002 2003
Supply Total Dry Gas Production ................................17.31 17.81 17.70 17.84 18.10 18.82 18.60 18.85 18.90 19.02 18.83 18.99 19.45 19.20 19.71 Net Imports ................................................................1.27 1.45 1.64 1.92 2.21 2.46 2.69 2.78 2.84 2.99 3.42 3.54 3.65 3.46 3.48 Supplemental Gaseous Fuels................................0.11 0.12 0.11 0.12 0.12 0.11 0.11 0.11 0.10 0.10 0.10 0.09 0.08 0.08 0.09 Total New Supply................................ 18.69 19.38 19.45 19.88 20.42 21.39 21.40 21.75 21.84 22.12 22.35 22.61 23.17 22.74 23.28
Working Gas in Storage Opening................................................................2.85 2.51 3.07 2.82 2.60 2.32 2.61 2.15 2.17 2.17 2.73 2.52 1.72 2.90 2.52 Closing................................................................2.51 3.07 2.82 2.60 2.32 2.61 2.15 2.17 2.17 2.73 2.52 1.72 2.90 2.52 2.49 Net Withdrawals................................................................0.34 -0.56 0.24 0.23 0.28 -0.28 0.45 -0.02 0.00 -0.56 0.21 0.80 -1.18 0.38 0.03
Total Supply................................................................19.03 18.82 19.70 20.11 20.70 21.11 21.85 21.73 21.84 21.56 22.56 23.41 21.99 23.12 23.31
Balancing Item a ................................................................-0.23 -0.11 -0.66 -0.56 -0.42 -0.40 -0.27 0.24 0.11 -0.29 -0.95 -0.88 -0.59 -1.48 -0.19
Total Primary Supply ................................ 18.80 18.72 19.03 19.54 20.28 20.71 21.58 21.96 21.95 21.27 21.61 22.54 21.40 21.64 23.11
Demand Lease and Plant Fuel................................ 1.07 1.24 1.13 1.17 1.17 1.12 1.22 1.25 1.20 1.17 1.08 1.13 1.16 1.17 1.22 Pipeline Use................................................................0.63 0.66 0.60 0.59 0.62 0.69 0.70 0.71 0.75 0.64 0.65 0.64 0.61 0.60 0.64 Residential................................................................4.78 4.39 4.56 4.69 4.96 4.85 4.85 5.24 4.98 4.52 4.73 4.99 4.81 4.88 5.07 Commercial ................................................................2.72 2.62 2.73 2.80 2.86 2.90 3.03 3.16 3.21 3.00 3.04 3.22 3.12 3.14 3.21 Industrial (Incl. Nonutilities)................................6.82 7.02 7.23 7.53 7.98 8.17 8.58 8.87 8.83 8.69 9.01 9.51 9.01 9.38 10.79 Electric Utilities ................................................................2.79 2.79 2.79 2.77 2.68 2.99 3.20 2.73 2.97 3.26 3.11 3.04 2.69 2.47 2.19 Total Demand ................................................................18.80 18.72 19.03 19.54 20.28 20.71 21.58 21.96 21.95 21.27 21.61 22.54 21.40 21.64 23.11
aThe balancing item represents the difference between the sum of the components of natural gas supply and the sum of components of natural gas demand. Notes: Minor discrepancies with other EIA published historical data are due to rounding. Historical data are printed in bold; forecasts are in italics. The forecasts were generated by simulation of the Short-Term Integrated Forecasting System. Sources: Historical data: Energy Information Administration: latest data available from EIA databases supporting the following reports: Natural Gas Monthly, DOE/EIA-0130; Electric Power Monthly, DOE/EIA-0226; Projections: Energy Information Administration, Short -Term Integrated Forecasting System database, and Office of Oil and Gas, Reserves and Natural Gas Division.

Energy Information Administration/Short-Term Energy Outlook -- November 2002 7
Table A7. Annual U.S. Coal Supply and Demand: Base Case (Million Short Tons)
Year 1989 1990 1991 1992 1993 1994 1995 1996 1997 1998 1999 2000 2001 2002 2003
Supply Production ................................................................980.7 1029.1 996.0 997.5 945.4 1033.5 1033.0 1063.9 1089.9 1117.5 1100.4 1073.6 1121.3 1088.8 1076.5 Appalachia................................................................464.8 489.0 457.8 456.6 409.7 445.4 434.9 451.9 467.8 460.4 425.6 419.4 428.9 401.6 394.5 Interior ................................................................ 198.1 205.8 195.4 195.7 167.2 179.9 168.5 172.8 170.9 168.4 162.5 143.5 147.7 140.1 128.3 Western................................................................317.9 334.3 342.8 345.3 368.5 408.3 429.6 439.1 451.3 488.8 512.3 510.7 544.7 543.1 553.8
Primary Stock Levels a Opening................................................................30.4 29.0 33.4 33.0 34.0 25.3 33.2 34.4 28.6 34.0 36.5 39.5 31.9 33.9 32.5 Closing................................................................29.0 33.4 33.0 34.0 25.3 33.2 34.4 28.6 34.0 36.5 39.5 31.9 33.9 32.5 32.7 Net Withdrawals................................................................1.4 -4.4 0.4 -1.0 8.7 -7.9 -1.2 5.8 -5.3 -2.6 -2.9 7.6 -2.0 1.4 -0.2 Imports................................................................ 2.9 2.7 3.4 3.8 7.3 7.6 7.2 7.1 7.5 8.7 9.1 12.5 19.8 16.5 14.2 Exports ................................................................100.8 105.8 109.0 102.5 74.5 71.4 88.5 90.5 83.5 78.0 58.5 58.5 48.7 40.5 39.6 Total Net Domestic Supply ................................884.2 921.6 890.9 897.8 886.9 961.8 950.4 986.3 1008.5 1045.7 1048.1 1035.2 1090.4 1066.2 1051.0
Secondary Stock Levels b Opening................................................................158.4 146.1 168.2 167.7 163.7 120.5 136.1 134.6 123.0 106.4 129.4 144.0 108.1 136.5 126.5 Closing................................................................146.1 168.2 167.7 163.7 120.5 136.1 134.6 123.0 106.4 129.4 144.0 108.1 136.5 126.5 127.7 Net Withdrawals................................................................12.3 -22.1 0.5 4.0 43.2 -15.7 1.5 11.7 16.6 -23.0 -14.6 35.9 -28.4 10.0 -1.2 Waste Coal Supplied to IPPs c ................................0.0 0.0 0.0 6.0 6.4 7.9 8.5 8.8 8.1 9.0 9.6 10.1 10.6 11.1 11.6
Total Supply................................................................896.5 899.4 891.4 907.8 936.5 954.0 960.4 1006.7 1033.2 1031.6 1043.1 1081.2 1072.7 1087.3 1061.4
Demand Coke Plants ................................................................40.5 38.9 33.9 32.4 31.3 31.7 33.0 31.7 30.2 28.2 28.1 28.9 26.1 24.3 24.8 Electricity Production Electric Utilities ................................................................766.9 773.5 772.3 779.9 813.5 817.3 829.0 874.7 900.4 910.9 894.1 859.3 806.3 783.3 774.5 Nonutilities (Excl. Cogen.) d ................................ 5.7 7.4 11.4 15.0 17.5 19.9 21.2 22.2 21.6 26.9 52.7 123.3 150.6 192.7 197.1 Retail and General Industry................................ 82.3 83.1 81.5 80.2 81.1 81.2 78.9 77.7 78.0 72.3 69.6 69.3 67.5 62.5 65.0 Total Demand e ................................................................895.4 902.9 899.1 907.4 943.5 950.1 962.0 1006.3 1030.1 1038.3 1044.5 1080.9 1050.5 1062.8 1061.4
Discrepancy f ................................................................1.1 -3.5 -7.7 0.5 -7.0 3.9 -1.6 0.4 3.1 -6.7 -1.5 0.4 22.2 24.5 0.0
aPrimary stocks are held at the mines, preparation plants, and distribution points. bSecondary stocks are held by users. It includes an estimate of stocks held at utility plants sold to nonutility generators. cEstimated independent power producers (IPPs) consumption of waste coal. This item includes waste coal and coal slurry reprocessed into briquettes. dEstimates of coal consumption by IPPs, supplied by the Office of Coal, Nuclear, Electric, and Alternate Fuels, Energy Information Administration (EIA). Quarterly coal consumption estimates for 2001 and projections for 2002 and 2003 are based on (1) estimated consumption by utility power plants sold to nonutility generators during 1999, and (2) annual coal-fired generation at nonutilities from Form EIA-867 (Annual Nonutility Power Producer Report). eTotal Demand includes estimated IPP consumption. fThe discrepancy reflects an unaccounted-for shipper and receiver reporting difference, assumed to be zero in the forecast period. Prior to 1994, discrepancy may include some waste coal supplied to IPPs that has not been specifically identified. Notes: Rows and columns may not add due to independent rounding. Historical data are printed in bold; forecasts are in italics. The forecasts were generated by simulation of the Short-Term Integrated Forecasting System. Sources: Historical data: Energy Information Administration: latest data available from EIA databases supporting the following reports: Quarterly Coal Report, DOE/EIA-0121, and Electric Power Monthly, DOE/EIA-0226. Projections: Energy Information Administration, Short-Term Integrated Forecasting System database, and Office of Coal, Nuclear, Electric and Alternate Fuels.
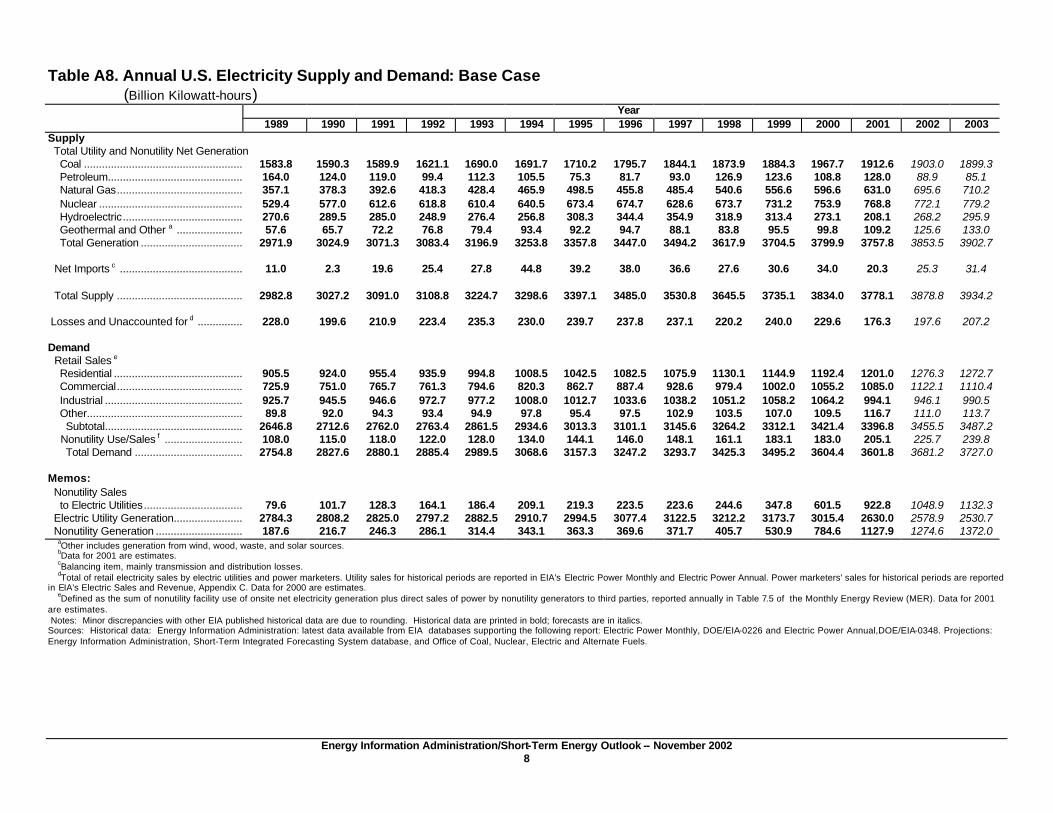
Energy Information Administration/Short-Term Energy Outlook -- November 2002 8
Table A8. Annual U.S. Electricity Supply and Demand: Base Case (Billion Kilowatt-hours)
Year 1989 1990 1991 1992 1993 1994 1995 1996 1997 1998 1999 2000 2001 2002 2003
Supply Total Utility and Nonutility Net Generation Coal ................................................................1583.8 1590.3 1589.9 1621.1 1690.0 1691.7 1710.2 1795.7 1844.1 1873.9 1884.3 1967.7 1912.6 1903.0 1899.3 Petroleum................................................................164.0 124.0 119.0 99.4 112.3 105.5 75.3 81.7 93.0 126.9 123.6 108.8 128.0 88.9 85.1 Natural Gas................................................................357.1 378.3 392.6 418.3 428.4 465.9 498.5 455.8 485.4 540.6 556.6 596.6 631.0 695.6 710.2 Nuclear ................................................................529.4 577.0 612.6 618.8 610.4 640.5 673.4 674.7 628.6 673.7 731.2 753.9 768.8 772.1 779.2 Hydroelectric................................................................270.6 289.5 285.0 248.9 276.4 256.8 308.3 344.4 354.9 318.9 313.4 273.1 208.1 268.2 295.9 Geothermal and Other a ................................57.6 65.7 72.2 76.8 79.4 93.4 92.2 94.7 88.1 83.8 95.5 99.8 109.2 125.6 133.0 Total Generation ................................................................2971.9 3024.9 3071.3 3083.4 3196.9 3253.8 3357.8 3447.0 3494.2 3617.9 3704.5 3799.9 3757.8 3853.5 3902.7
Net Imports c ................................................................11.0 2.3 19.6 25.4 27.8 44.8 39.2 38.0 36.6 27.6 30.6 34.0 20.3 25.3 31.4
Total Supply ................................................................2982.8 3027.2 3091.0 3108.8 3224.7 3298.6 3397.1 3485.0 3530.8 3645.5 3735.1 3834.0 3778.1 3878.8 3934.2
Losses and Unaccounted for d ................................228.0 199.6 210.9 223.4 235.3 230.0 239.7 237.8 237.1 220.2 240.0 229.6 176.3 197.6 207.2
Demand Retail Sales e Residential ................................................................905.5 924.0 955.4 935.9 994.8 1008.5 1042.5 1082.5 1075.9 1130.1 1144.9 1192.4 1201.0 1276.3 1272.7 Commercial................................................................725.9 751.0 765.7 761.3 794.6 820.3 862.7 887.4 928.6 979.4 1002.0 1055.2 1085.0 1122.1 1110.4 Industrial ................................................................925.7 945.5 946.6 972.7 977.2 1008.0 1012.7 1033.6 1038.2 1051.2 1058.2 1064.2 994.1 946.1 990.5 Other................................................................89.8 92.0 94.3 93.4 94.9 97.8 95.4 97.5 102.9 103.5 107.0 109.5 116.7 111.0 113.7 Subtotal................................................................2646.8 2712.6 2762.0 2763.4 2861.5 2934.6 3013.3 3101.1 3145.6 3264.2 3312.1 3421.4 3396.8 3455.5 3487.2 Nonutility Use/Sales f ................................ 108.0 115.0 118.0 122.0 128.0 134.0 144.1 146.0 148.1 161.1 183.1 183.0 205.1 225.7 239.8 Total Demand ................................................................2754.8 2827.6 2880.1 2885.4 2989.5 3068.6 3157.3 3247.2 3293.7 3425.3 3495.2 3604.4 3601.8 3681.2 3727.0
Memos: Nonutility Sales to Electric Utilities................................................................79.6 101.7 128.3 164.1 186.4 209.1 219.3 223.5 223.6 244.6 347.8 601.5 922.8 1048.9 1132.3 Electric Utility Generation................................2784.3 2808.2 2825.0 2797.2 2882.5 2910.7 2994.5 3077.4 3122.5 3212.2 3173.7 3015.4 2630.0 2578.9 2530.7 Nonutility Generation ................................ 187.6 216.7 246.3 286.1 314.4 343.1 363.3 369.6 371.7 405.7 530.9 784.6 1127.9 1274.6 1372.0
aOther includes generation from wind, wood, waste, and solar sources. bData for 2001 are estimates. cBalancing item, mainly transmission and distribution losses. dTotal of retail electricity sales by electric utilities and power marketers. Utility sales for historical periods are reported in EIA's Electric Power Monthly and Electric Power Annual. Power marketers' sales for historical periods are reported
in EIA's Electric Sales and Revenue, Appendix C. Data for 2000 are estimates. eDefined as the sum of nonutility facility use of onsite net electricity generation plus direct sales of power by nonutility generators to third parties, reported annually in Table 7.5 of the Monthly Energy Review (MER). Data for 2001
are estimates. Notes: Minor discrepancies with other EIA published historical data are due to rounding. Historical data are printed in bold; forecasts are in italics. Sources: Historical data: Energy Information Administration: latest data available from EIA databases supporting the following report: Electric Power Monthly, DOE/EIA-0226 and Electric Power Annual,DOE/EIA-0348. Projections: Energy Information Administration, Short-Term Integrated Forecasting System database, and Office of Coal, Nuclear, Electric and Alternate Fuels.