shoppers stop - bombay stock exchange · shoppers stop ltd. is a professionally managed and...
TRANSCRIPT
SEC/043/2018-19
BSE Limited Mumbai Samachar Marg, Fort, Mumbai - 400 001 .
Stock Code : 532638
Dear Sirs,
SHOPPERS STOP
August 10, 2018
National Stock Exchange of India Ltd. Exchange Plaza, Bandra-Kurla Complex, Sandra (East}, Mumbai - 400 051 . SHOPERSTOP
Sub: Submission of Annual Report 2017-2018.
Pursuant to Regulation 34(1) of the SEBI (Listing Obligations and Disclosure Requirements) Regulations, 2015, we wish to inform you that the members at the 21st Annual General Meeting of the Company held on July 27, 2018 have approved and adopted the Annual Report for the financial year 2017-18.
In this connection, please find enclosed herewith the said Annual Report for the financial year 2017-18. The same is also available on the Company's website at www.shoppersstop.com.
We request you to kindly take the same on record.
Thanking you,
Encl: aa
Shoppers Stop limited Registered & Service Office - Urnang Tower, 5th Floor, Mindspace, Off. Link Road, Malad (West), Murnbai - 400 064, Maharashtra. T + 022 42497000, F + 022 28808877.CIN : L51900MH1997PLC108798. E- mail us at [email protected] , To ll Free No.:T + 1- 800- 419 - 6648 (9 am to 9 prn).

BRINGING ROMANCE BACK TO RETAIL
A N N U A L R E P O R T 2 0 1 7 - 2 0 1 8

CONTENTS
Strategic Report02 Group Overview08 Our Reach09 Key Highlights of 2017-1810 Chairman’s Review 12 Managing Director’s Review 14 Bringing Romance Back to Retail24 Board of Directors28 Corporate Information29 Financial Highlights & Key Ratios
Statutory Reports30 Management Discussion & Analysis 40 Directors’ Report 71 Business Responsibility Report 80 Corporate Governance Report
Cautionary StatementThe statements made in this report describe the Company’s objectives, projections, expectations and estimations, which may be ’forward-looking statements’ within the meaning of applicable securities laws and regulations. The annual results can differ materially from those expressed or implied, depending on the economic and climatic conditions, Government policies, and other incidental factors which are beyond the control of the Company.
Financial Statements96 Standalone Financial Accounts 146 Consolidated Financial Accounts

BRINGING ROMANCEBACK TO RETAIL
When we entered the business of retailing in 1991, we had a simple mission – to transform the way India shops. From a single 4,000 sq. ft. store in suburban Mumbai, we have metamorphosed into a trusted retailer that caters to millions of customers across the length and breadth of the country.
But our raison d’être remains the same.
We are a retailer at heart but have always stood for much more than just our products, our brands, our stores and our services. We represent all those soul-stirring moments that unfurl as people shop for something new – a young couple starting a family of their own, daddy’s little girl growing into an independent young woman, a group of friends becoming each other’s confidantes. We are deeply connected to our customers’ journeys.
We are bringing the stories back to shopping.We are bringing the giggles back to the trial room.We are bringing the exhilaration back to online shopping.
We are bringing the romance back to retail.
But in the recent past, India’s retail ethos has significantly shifted. Deep-discounting has become par for the course. And, brand loyalty has lost its sheen. The time has therefore come for retail to reinvigorate itself and rewrite its story. As pioneers of the industry, we are taking charge and leading that change.
Our customers come through our doors for our superior product assortment, but we want them to stay for the moments of personal transformation they experience in our aisles. Our customers click onto our shopping site for convenience, but we want them to come back for the sheer joy and promise of adding to their shopping carts.
And so, we are making the shopping experience more immersive, more seamless and more exciting. There’s more to enjoy. And much more to look forward to.

Annual Report 2017-201802 AnnAnnualual RReport 2017-2018000000000000000000000000000000222222222222222222222222222222222222222222222222222222222222222222222222222222222222222222222222222222222222222222222222222222222222222222222222222222222222222222222
GROUP OVERVIEWShoppers Stop Ltd. is a professionally managed and systems-driven organisation promoted by the K. Raheja Corp Group (Chandru L. Raheja Group). Your Company has played a pivotal role in bringing about the retail revolution in India. Since inception in 1991, we have introduced various retail formats that have set a benchmark for the Indian retail industry. Apart from the flagship business of department stores, we also operate specialty stores for beauty, books-toys-stationery and home décor.
Annual Report 2017-201802

ST
RA
TE
GIC
RE
PO
RT
ST
AT
UT
OR
Y R
EP
OR
TS
FIN
AN
CIA
L S
TA
TE
ME
NT
S
0303
ST
AT
UT
OR
Y R
EP
OR
TS
FIN
AN
CIA
L S
TA
TE
ME
NT
SS
TR
AT
EG
IC R
EP
OR
T
SHOPPERS STOPIndia’s foremost fashion retailer offering 400+ brands

Annual Report 2017-201804
Our shopping website and mobile app have more than 50,000+ products across different categories and sub-categories to choose from
Annual Report 2017-201804

ST
RA
TE
GIC
RE
PO
RT
ST
AT
UT
OR
Y R
EP
OR
TS
FIN
AN
CIA
L S
TA
TE
ME
NT
S
05
HOMESTOP
CROSSWORD
Premium home concept store
The definitive place and space for those who seek information, knowledge or simply the pleasure of reading
05
ST
AT
UT
OR
Y R
EP
OR
TS
FIN
AN
CIA
L S
TA
TE
ME
NT
SS
TR
AT
EG
IC R
EP
OR
T

51
30(Including 16 shop-in-shop)
Annual Report 2017-201806
STORES
(Including 17 shop-in-shop)STORES

HELLO BEAUTIFUL!Bringing the best brands in beauty to our customers
2
8(Including 2 shop-in-shop)
STORES
07
11STORES STORES

Annual Report 2017-201808
OUR REACH
Amritsar
Delhi
Ahmedabad
Vadodara
Bhopal
Noida
Pune
Jaipur
Hyderabad
Gurgaon Chandigarh
Raipur
Surat
Siliguri
RanchiGandhinagar
Udaipur
KottayamKochi
Panaji
Calicut
Nashik
Kohima
Mangalore
Thrissur
Vijayawada
MysoreCoimbatore
Aurangabad
Indore
Durgapur
Kolhapur
Trivandrum
Meerut
Agra
LaturNagpur
Visakhapatnam
LudhianaJalandhar
ChennaiBengaluru
Mumbai
Kolkata
LucknowKanpur
Shoppers Stop
DC locations
Specialty* * (includes Crossword, Mothercare, HomeStop, M.A.C, Clinique, Bobbi Brown, Smashbox and Estée Lauder outlets)
Graphical representation not to scale
Faridabad
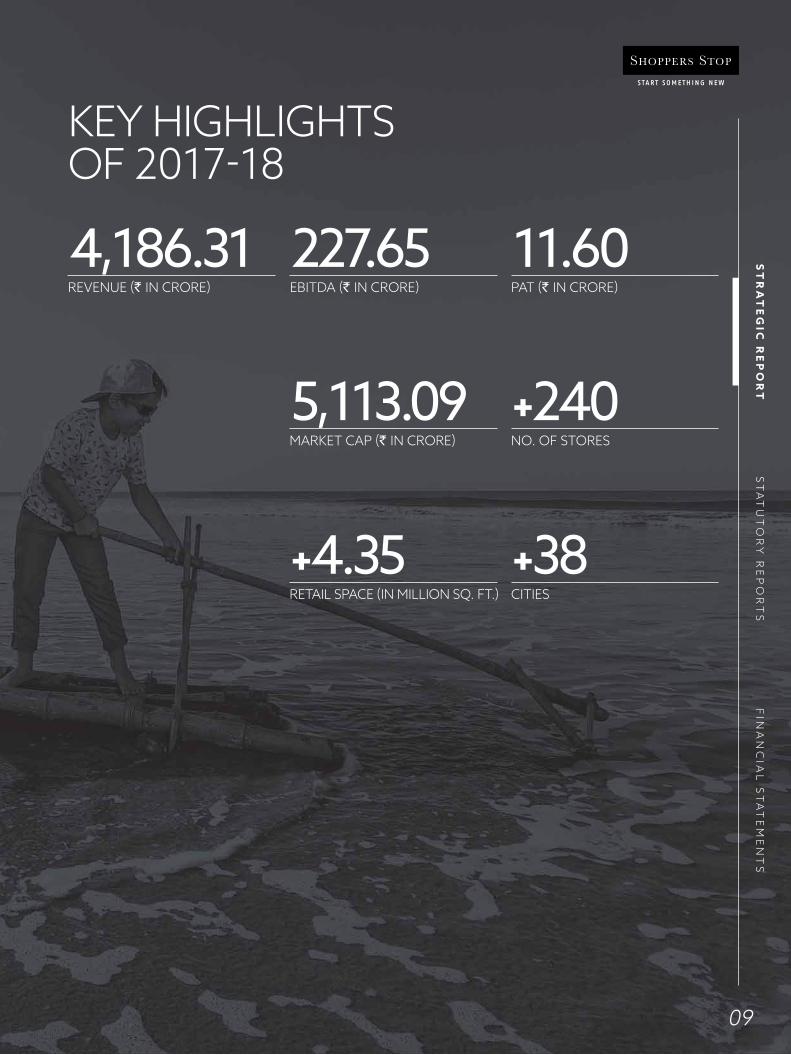
KEY HIGHLIGHTS OF 2017-18
09
4,186.31REVENUE (` IN CRORE)
227.65EBITDA (` IN CRORE)
11.60PAT (` IN CRORE)
+240NO. OF STORES
5,113.09MARKET CAP (` IN CRORE)
+38CITIES
+4.35RETAIL SPACE (IN MILLION SQ. FT.)
ST
AT
UT
OR
Y R
EP
OR
TS
FIN
AN
CIA
L S
TA
TE
ME
NT
SS
TR
AT
EG
IC R
EP
OR
T
Annual Report 2017-201810
CHAIRMAN’S REVIEW
Annual Report 2017-201810
It was a year of major upheavals. To bring our focus back on the department store and omni-channel business, we have exited from all the Company’s non-core businesses.

ST
RA
TE
GIC
RE
PO
RT
ST
AT
UT
OR
Y R
EP
OR
TS
FIN
AN
CIA
L S
TA
TE
ME
NT
S
11
+75%CONTRIBUTION TO COMPANY’S SALES
+5.3 MillionFIRST CITIZEN LOYALTY PROGRAMME MEMBERS
It is with a great pride and reflection that I present to you my final annual report of Shoppers Stop as its chairman. It was a year in which we made key decisions to align ourselves to the changing dynamics of the retail industry and secure our long-term growth.
The fiscal was also a remarkable one for the Indian economy and was characterised by implementation of path-breaking policy reforms such as the goods and services tax (GST). Notwithstanding the initial disruptions across the supply chain, over the longer term, GST will benefit all sections of the economy. Along with enhancing transparency and boosting investments, it will accelerate the pace of formalisation of the economy, which will aid organised players.
Our economy withstood these hiccups efficiently and registered a growth of 6.7%. Amid early signs of reviving private investment, improving industrial production and favourable monetary policies, the Indian economy is likely to grow at 7.4% in the ongoing fiscal (source: RBI). Rising purchasing power owing to multiple enablers such as a normal monsoon, pay hike for government employees and continued thrust to the rural economy is likely to propel consumption growth in the economy. This will improve the prospects of India’s retail sector.
With rapid growth of the online retail segment on one hand, and increasing participation from foreign players on the other, the Indian retail industry is going through an exciting phase. Healthy economic growth, improving
demographic profile (in favour of young, earning middle-class population), urbanisation and growing prominence of the Tier-2 and Tier-3 cities, are the key growth drivers for Indian retail. The sector is projected to grow from $672 billion in 2017 to $1.1 trillion in 2020. Further, the size of India’s modern retail could double over the next three years to $111.25 billion (Source: IBEF Retail Report, 2018).
In FY 2018, your Company invested significant efforts into identifying strategic priorities and strengthening operations. A result of this was that we exited our non-core businesses in the mixed retail format, entertainment centres and duty-free airport retailing segments. We also accelerated the pace of deleveraging our balance sheet and reduce debt worth ` 508 crores during the year. The cash flows freed will be deployed to enhance our business and take the Company to greater heights.
Your Company also put up a healthy performance. Uptick in like-to-like sales coupled with higher cost-efficiencies and savings in interest costs boosted our overall profitability. Going forward, we will expand our reach with a complementary mix of brick-and-mortar stores and our online presence. Adoption of this omnichannel strategy will empower us to stay ahead of the curve by meeting our customers’ latent and existing needs with speed and efficiency.
I reflect on my 20-year plus association with Shoppers Stop with a great pride. As one of the early
Dear Shareholders,entrants in the Indian organised retail sector, your Company has earned longstanding trust and respect of customers. The fact that our existing customers contribute 75% of our revenues is a testimony to the healthy bond that we share with them. Over the years, we have built a large yet agile retail Company that is ready to deliver a promising future.
As I step down from the Board as the Chairman of Shoppers Stop, my heart is filled with the love and respect showered upon me by all the people I connected with over these two decades. No words can sufficiently express my heartfelt gratitude to all the customers, employees, business associates and investors who have supported us.
I would request you all to welcome Mr. B.S. Nagesh as the Non-Executive Chairman of Shoppers Stop with the same love and respect that you have bestowed upon me in the past many years. He has been associated with the Company since the very first day and has donned multiple hats throughout its exciting journey. I am confident that under his able leadership, we are uniquely poised to accelerate the growth momentum of the Company. It is our constant endeavour to delight our customers and create value for all our stakeholders in a sustainable manner.
On behalf of the Board of Directors of Shoppers Stop, I want to thank you all for your continued trust, confidence, and support.
Chandru L. Raheja Chairman

Annual Report 2017-201812
MANAGING DIRECTOR’S REVIEW
At Shoppers Stop, our number one goal has been to transform the way India shops. This approach has always guided our strategy and served our stakeholders well. FY 2018 was no exception, despite the year being fraught with extraneous challenges. We ended the year with a sales growth of 3.4% and our operating profit (EBITDA) stood at ` 227.65 crores.
While the long-term macro India story remains intact, there were substantial structural hiccups in the first half of last year, mainly on account of the mammoth roll-out of GST. But with our team’s many years of experience successfully in managing such challenges, we were
Dear Shareholders,
Annual Report 2017-201812
On the business side, FY 2018 was a hallmark year for us. We have made strategic decisions to evolve our business as our customers’ preferences have evolved.
ST
RA
TE
GIC
RE
PO
RT
ST
AT
UT
OR
Y R
EP
OR
TS
FIN
AN
CIA
L S
TA
TE
ME
NT
S
13
able to swiftly adjust our inventories and sales. As a result of this, we are happy to report that your Company is 100% GST compliant and all processes in the supply-chain have been seamlessly aligned to power onward and upward.
On the business side, FY 2018 was a hallmark year for us. We have made strategic decisions to evolve our business as our customers’ preferences have evolved.
SHARPEN FOCUS ON CORE BUSINESS + STRENGTHEN THE BALANCE SHEET In a bid to sharpen our focus on our core department store business and omni-channel strategy, we decided to exit our peripheral non-core businesses. Therefore, we divested our stakes in Hypercity Retail — the mixed retail format, Timezone Entertainment Private Limited – the JV business of family entertainment centres, and Nuance Group (India) Pvt. Ltd. – the duty-free airport retailing JV. We believe that these exits will serve in giving us the eagle eye focus required to significantly scale-up our core-businesses while also dramatically change our balance sheet and thereby increase shareholder value. We aim to be completely debt-free by FY 2019.
We plan to open 4-6 department stores and 8-10 beauty stores each year for the next 3 years to reach a wider and broader footprint. Where our physical stores are not present, our online shopping site will give customers the joy of shopping at a single click. Our robust investment in omni-channel will continue steadfastly.
Furthermore, as a testament to Shoppers Stop’s potential and India’s
robust retail story, Amazon.com NV Investment Holdings LLC, registered as Foreign Portfolio Investor with SEBI in India, has invested by acquiring 5% stake in your Company.
OMNI-CHANNEL PIVOT Shoppers Stop was among the first retailers to invest in e-commerce, digital technology and organisational alignment to support a seamless customer experience. However, we understand that customer expectations are changing at an even faster pace today than just a few years ago. In view of this, we have embarked on a path-breaking partnership with Amazon India to deepen our presence in the online space. In addition to our own shopping site www.shoppersstop.com and mobile app, online shoppers will now have the opportunity to also experience Shoppers Stop in the marketplace arena via our flagship brand store on Amazon.in. This alliance with Amazon.in will give a significant fillip to the growth of our omni-channel business, helping us to achieve our target of 10% of overall sales from digital touch-points much quicker than we had anticipated.
BUILDING SUPERLATIVE ASSORTMENT AND CUSTOMER EXPERIENCES In the year gone by, we have partnered and launched a slew of new brands such as Rheson by Rhea and Sonam Kapoor, Nush by Anushka Sharma and Smashbox in beauty. We will continue to evaluate opportunities to bring in aspirational and sought-after brands into our fold.
Further, we are making improvements in our Private brands portfolio especially with respect to styling
and pricing. We are positive that these changes will bear fruit in the coming year and be a game-changer for the brand.
We continue to create exciting, unique and engaging experiences for our customers. Our aim is not just to delight, but also to elevate customer experience. We believe our investments in technology and analytics will further help us enhance our customer centricity.
Our love for our customers and our passion for retail has compelled us to relook at the way we conduct our business and our role in shaping India’s retail story. We want to bring the joy back to shopping by bringing the romance back to retail.
My life has been enriched both professionally and personally in the last 17 years while donning various management roles in this wonderful and exciting journey at Shoppers Stop. I feel humbled to be a part of this magnificent journey in which your Company has achieved key milestones like going from 7 stores in 2001 to 83 in March 2018, marquee brand and partner associations, and successful rollout of impactful customer engagement programmes.
I am delighted to welcome Rajiv Suri who will take over from me. Rajiv comes with a rich experience of 25 years in the global retail industry, and I envision him to take your Company to greater heights from here on. I request you all to extend a warm welcome to him and continue support in the times ahead as we ‘Start Something New’.
Govind S. Shrikhande Managing Director

Annual Report 2017-201814

BRINGING ROMANCEBACK TO RETAIL
We are upping the ante, we are revitalising the business, we are changing the way we engage with our customers, we are
15

THE SPARKLING ALLURE OF OUR BRANDS
Over the years, in order to differentiate ourselves and keep our customers hooked to our assortment, we have introduced to India multiple exciting fashion labels and brands through exclusive and non-exclusive retail arrangements with coveted brands. We have also partnered with India’s leading designers, fashion icons and celebrities to co-create and/or
Annual Report 2017-201816
From the moment you step into our stores or click onto our shopping website, you are drawn into a luscious array of the best Indian and international brands. We offer an incomparable range of fashion apparel, accessories, beauty, footwear, perfumes, home products, maternity and childcare products, toys and much more.
distribute exclusive fashion brands in the country.
One of our big-ticket announcements in FY 2018 was the launch of Rhea and Sonam Kapoor’s highly-anticipated fashion brand Rheson. Rheson is a complete embodiment of Rhea and Sonam’s style statement and personalities – each piece of the collection is distinctive, unique
Our beauty business is one of the key drivers of our top-line growth and also among our biggest differentiators in the market. Our assortment of beauty, skincare and cosmetics is unparalleled with
and homegrown in the truest sense. The design sensibility and concept comes from Rhea and Sonam and the Shoppers Stop team brings their vision to life with our long-time retail experience.
In the year gone by, we also introduced Anushka Sharma’s popular fashion brand Nush.
brands such as Estee Lauder, M.A.C, Clinique, Bobbi Brown, Smashbox, Guerlain, Clarins, L’Oreal, Shiseido, Elizabeth Arden and many more lining our shelves. We pride ourselves on introducing to our customers
the world of beauty and cosmetics, and helping them experience such renowned brands on their home turf and on their own terms. Our beauty advisors and experts are nifty, helpful and always ready to serve customers with a smile.

KRITI SANON’S WOMEN’S LINE — MS. TAKEN
VIRAT KOHLI’S BREAKAWAY YOUTH FASHION BRAND — WROGN
RHEA & SONAM KAPOOR’S HIGH-STREET FASHION BRAND — RHESON
ANUSHKA SHARMA’S HIGH-STREET FASHION BRAND — NUSH
DESIGNER ROCKY STAR’S LINE– RS BY ROCKY STAR
A WOMEN’S HIGH-STREET BRAND BY FASHION STALWARTS DOLLY SIDHWANI, BHAVANA PANDEY AND NANDITA MAHTANI — LOVE GEN
17
ST
AT
UT
OR
Y R
EP
OR
TS
FIN
AN
CIA
L S
TA
TE
ME
NT
SS
TR
AT
EG
IC R
EP
OR
T

Annual Report 2018
THE SHEER JOY OF MAGICAL EXPERIENCES We have always believed that shopping is an emotional experience and not a transactional exchange. And while the retail ethos may have shifted over the last few years, our endeavour is to keep the needle pointing due north by creating joyful experiences for our customers each time they walk into our stores or shop online.
Annual Report 2017-2018
MAGICAL MAKEOVER MARATHONS
We organise annual Makeover Marathons across the country where we create exclusive make-up booths for customers and give them the opportunity to experience and use high-end beauty and cosmetics brands including Clarins, Dior, Shiseido, Givenchy, Elizabeth Arden and many more. Customers are treated to complimentary makeovers and tutorials by professional make-up artists from the finest of skincare and cosmetic brands.
RENDEZVOUS WITH CELEBRITIES
We organise exclusive meet and greets with A — listers, bollywood celebrities and influencers to give our customers a chance to interact with their favourite brand ambassadors and influencers. In the past year, Rhea and Sonam Kapoor visited our stores to style 100s of young girls in Rheson. Kriti Sanon visited our Kolkata store to interact with fans of Ms. Taken.
PATH-BREAKING PERSONAL SHOPPER PROGRAMME
The Personal Shopper programme has been a resounding success. The Personal Shopper is a well-trained advisor who has expertise in the latest fashion trends, a complete understanding of the store and brands, and an innate ability to assess customers’ needs, shortlist products and help them arrive at a shopping decision. Our stores have designated premium Personal Shopper Lounges where customers are consulted and assisted.
Through this initiative, we wish to create a stress-free shopping experience for our customers. The Personal Shopper Service is a complimentary service and is available across all stores in the country.
By creating an initiative focused on customer delight, we have seen average ticket size increase by nearly 300% for assisted customers.
18

SERVICES IN THE COMFORT OF YOUR HOME
Recently, and owing to the programme’s success, we are rolling out the Personal Shopper Service ‘AT HOME’ across our stores in a phased manner. Through a prior appointment at select stores, a Shoppers Stop Personal Shopper will visit our customers’ homes to offer complimentary trials, pay-at-home service, curated collections and personal styling all from the convenience of our customers’ home.
PERSONALISATION AND CUSTOMISATION
To celebrate our 26 years in the retail business, we conducted an exclusive personalisation and customisation drive in our stores. Customers were given a chance to create their own signature aroma with Soulflower, engrave their name on any Cross Pen, and create a customised monogram on select products.
19
ST
AT
UT
OR
Y R
EP
OR
TS
FIN
AN
CIA
L S
TA
TE
ME
NT
SS
TR
AT
EG
IC R
EP
OR
T

Annual Report 2017-201820
We have been one of the earliest believers and adopters of O2O (Online to Offline). We began our journey of pivoting to omni-channel way back in 2015 via our partnership with SAP for their Hybris software — the world’s fastest growing commerce platform provider.
Subsequently, we have adopted multiple technologies such as Warehouse Management System (WMS), Order Management System, CRM, Enterprise Service Bus and
River Sand Master Data Management to enable one-view of the customer, one-view of order and one-view of inventory. This is aimed at creating a seamless and unified shopping experience for customers across multiple channels i.e. Physical stores, Web, Social, and Marketplaces. Going a step further in our omni-channel play this past year, we embarked on a path-breaking partnership with Amazon India.
THE IRRESISTIBLE ATTRACTION OF OMNI-CHANNEL
Annual Report 2017-201820
ta le
omer,dy. ing dforltiple
nd a step hannelebreaking
Digital disruption and the explosion of e-commerce has had a catalytic effect on modern retail. Today, customers are platform-agnostic and therefore don’t view brands as distinctly online or offline. Instead, they look for a seamless, integrated and unified shopping experience across all brand channels. We understand the way India shops and have therefore altered our business model to delight our customers each and every time.

ST
RA
TE
GIC
RE
PO
RT
ST
AT
UT
OR
Y R
EP
OR
TS
FIN
AN
CIA
L S
TA
TE
ME
NT
S
2121
ST
AT
UT
OR
Y R
EP
OR
TS
FIN
AN
CIA
L S
TA
TE
ME
NT
SS
TR
AT
EG
IC R
EP
OR
T
Annual Report 2017-201822
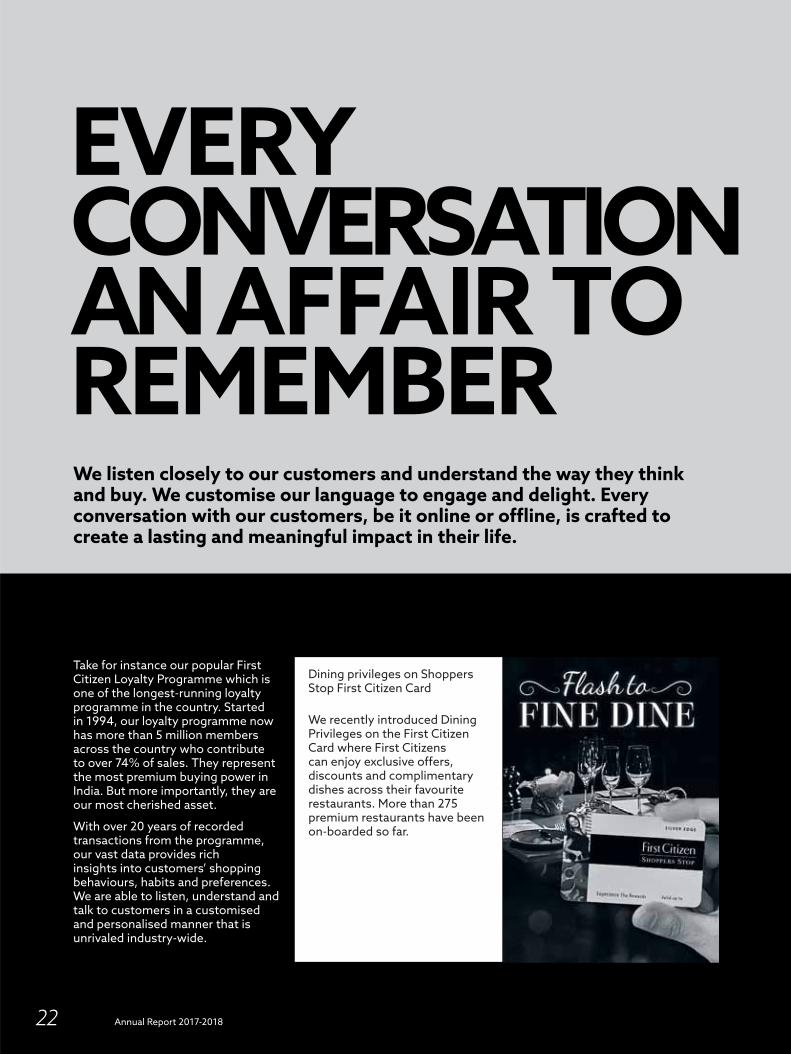
EVERY CONVERSATION AN AFFAIR TO REMEMBERWe listen closely to our customers and understand the way they think and buy. We customise our language to engage and delight. Every conversation with our customers, be it online or offline, is crafted to create a lasting and meaningful impact in their life.
Dining privileges on Shoppers Stop First Citizen Card
We recently introduced Dining Privileges on the First Citizen Card where First Citizens can enjoy exclusive offers, discounts and complimentary dishes across their favourite restaurants. More than 275 premium restaurants have been on-boarded so far.
Take for instance our popular First Citizen Loyalty Programme which is one of the longest-running loyalty programme in the country. Started in 1994, our loyalty programme now has more than 5 million members across the country who contribute to over 74% of sales. They represent the most premium buying power in India. But more importantly, they are our most cherished asset.
With over 20 years of recorded transactions from the programme, our vast data provides rich insights into customers’ shopping behaviours, habits and preferences. We are able to listen, understand and talk to customers in a customised and personalised manner that is unrivaled industry-wide.
Annual Report 2017-201822

ST
RA
TE
GIC
RE
PO
RT
ST
AT
UT
OR
Y R
EP
OR
TS
FIN
AN
CIA
L S
TA
TE
ME
NT
S
23
We have created a dedicated Anayltics team to analyse the proprietary First Citizen data. The team is tasked with the responsibility to understand the shopping data and cull insights. These insights (branded internally as “First Insight”) are used to create targeted one-to-one communications and relevant offers for customers which in turn lead to incremental sales.
In FY 2018, we have achieved ` 415 crores worth of incremental sales through such initiatives.
Digital technology and social media affords us uninhibited interaction with our customers. Staying connected to them and engaged with them only allows us to further strengthen our relationship. From Facebook interactions to viral Twitter campaigns, from informative YouTube videos to quirky Insta stories, our social media platforms speak the language of the youth and the young-at-heart.
OUR FACEBOOK PAGE HAS MORE THAN 10 MILLION FANS MAKING US THE TOP RETAILER ON FACEBOOK IN INDIA.
23
ST
AT
UT
OR
Y R
EP
OR
TS
FIN
AN
CIA
L S
TA
TE
ME
NT
SS
TR
AT
EG
IC R
EP
OR
T
Annual Report 2017-201824
BOARD OF DIRECTORS
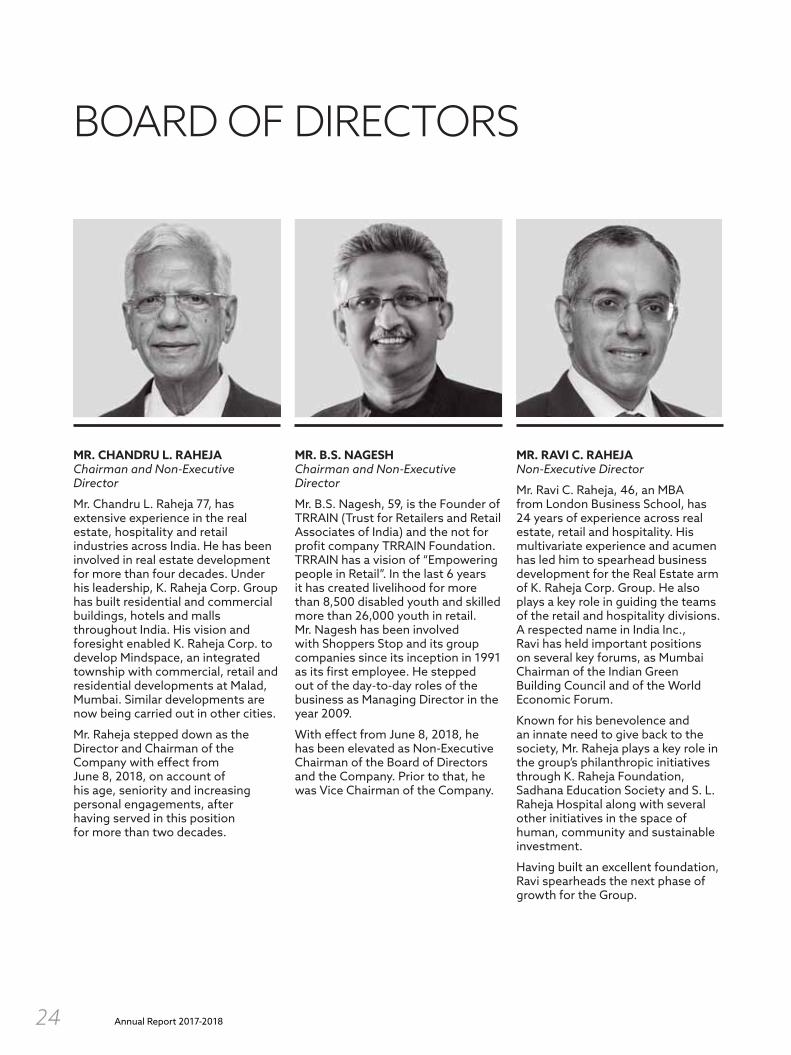
MR. B.S. NAGESH Chairman and Non-Executive Director
Mr. B.S. Nagesh, 59, is the Founder of TRRAIN (Trust for Retailers and Retail Associates of India) and the not for profit company TRRAIN Foundation. TRRAIN has a vision of “Empowering people in Retail”. In the last 6 years it has created livelihood for more than 8,500 disabled youth and skilled more than 26,000 youth in retail. Mr. Nagesh has been involved with Shoppers Stop and its group companies since its inception in 1991 as its first employee. He stepped out of the day-to-day roles of the business as Managing Director in the year 2009.
With effect from June 8, 2018, he has been elevated as Non-Executive Chairman of the Board of Directors and the Company. Prior to that, he was Vice Chairman of the Company.
MR. CHANDRU L. RAHEJA Chairman and Non-Executive Director
Mr. Chandru L. Raheja 77, has extensive experience in the real estate, hospitality and retail industries across India. He has been involved in real estate development for more than four decades. Under his leadership, K. Raheja Corp. Group has built residential and commercial buildings, hotels and malls throughout India. His vision and foresight enabled K. Raheja Corp. to develop Mindspace, an integrated township with commercial, retail and residential developments at Malad, Mumbai. Similar developments are now being carried out in other cities.
Mr. Raheja stepped down as the Director and Chairman of the Company with effect from June 8, 2018, on account of his age, seniority and increasing personal engagements, after having served in this position for more than two decades.
MR. RAVI C. RAHEJA Non-Executive Director
Mr. Ravi C. Raheja, 46, an MBA from London Business School, has 24 years of experience across real estate, retail and hospitality. His multivariate experience and acumen has led him to spearhead business development for the Real Estate arm of K. Raheja Corp. Group. He also plays a key role in guiding the teams of the retail and hospitality divisions. A respected name in India Inc., Ravi has held important positions on several key forums, as Mumbai Chairman of the Indian Green Building Council and of the World Economic Forum.
Known for his benevolence and an innate need to give back to the society, Mr. Raheja plays a key role in the group’s philanthropic initiatives through K. Raheja Foundation, Sadhana Education Society and S. L. Raheja Hospital along with several other initiatives in the space of human, community and sustainable investment.
Having built an excellent foundation, Ravi spearheads the next phase of growth for the Group.

ST
RA
TE
GIC
RE
PO
RT
ST
AT
UT
OR
Y R
EP
OR
TS
FIN
AN
CIA
L S
TA
TE
ME
NT
S
25
PROF. NITIN J. SANGHAVI Independent and Non-Executive Director
Professor Nitin Sanghavi, 69, is a Professor of Retail Marketing and Strategy at Alliance Manchester Business School, UK. He brings to our Board immense wisdom as an educator and rich experience of working with retailers around the globe over 33 years. He holds a Masters and PhD from the University of Manchester. He has been Visiting Professor at respected institutions in Japan, Australia, Spain, Italy France, India and USA including Harvard Business School. He also acts as a strategy advisor to the Boards of many blue-chip retail organisations in UK, Europe, USA , Middle East and India. He has also been advisor to the British Council, Commonwealth Secretariat and Special Advisor to the World Bank on Retailing. He has been given many awards globally for his outstanding contribution to retailing and is ranked consistently as one of the world’s top retail professor.
MR. NEEL C. RAHEJA Non-Executive Director
Mr. Neel Raheja, 43, is a Post Graduate in Commerce from Mumbai University. He also holds a Degree in Law and has successfully completed the Owner/President Management Programme from Harvard Business School. Over the last 25 years, he has been actively involved with K. Raheja Corp. Group’s businesses. As a Group President, he has spearheaded Hotel business development and growth, and been instrumental in establishing brands like Shoppers Stop, Inorbit Malls and Crossword Bookstores.
MR. DEEPAK GHAISAS Independent and Non-Executive Director
Mr. Deepak Ghaisas, 60, is a qualified Chartered Accountant, Cost Accountant and Company Secretary. He leads strategy development, visioning and conceptualisation of breakthrough business models for Gencoval Group, his new venture in Healthcare and Bio Tech. Mr. Ghaisas is the first Indian CFO to be felicitated with the prestigious CFO Asia award.
Annual Report 2017-201826
BOARD OF DIRECTORS (CONTD.)
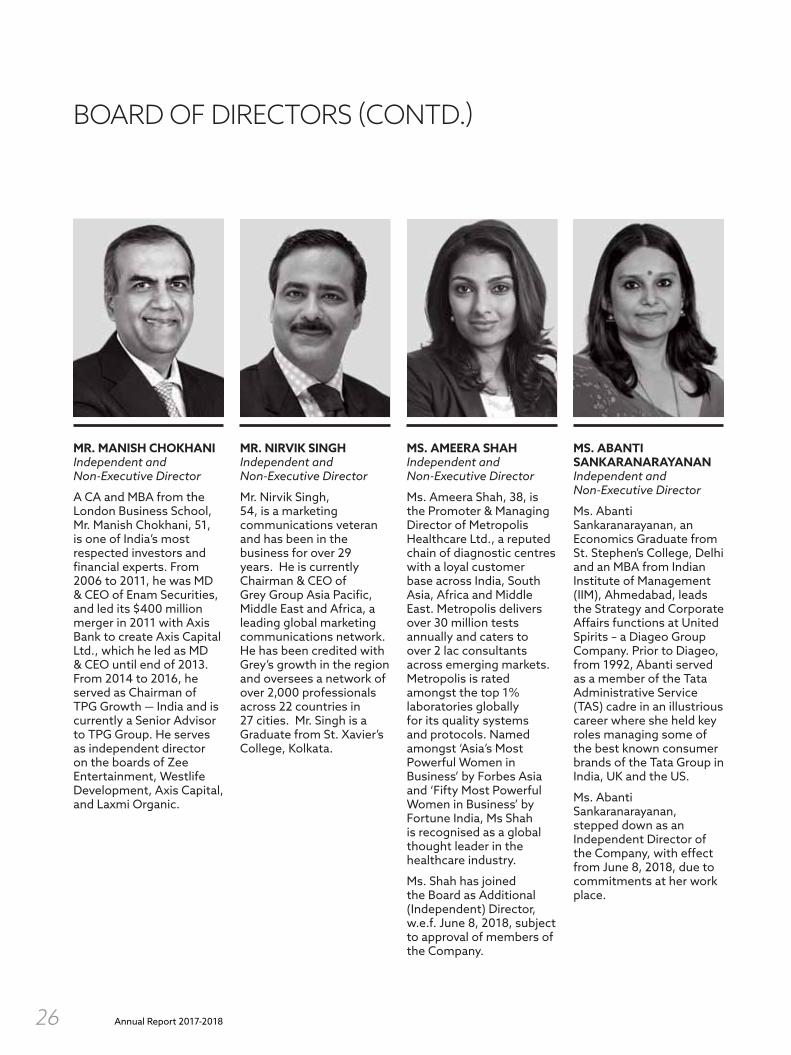
MR. MANISH CHOKHANI Independent and Non-Executive Director
A CA and MBA from the London Business School, Mr. Manish Chokhani, 51, is one of India’s most respected investors and financial experts. From 2006 to 2011, he was MD & CEO of Enam Securities, and led its $400 million merger in 2011 with Axis Bank to create Axis Capital Ltd., which he led as MD & CEO until end of 2013. From 2014 to 2016, he served as Chairman of TPG Growth — India and is currently a Senior Advisor to TPG Group. He serves as independent director on the boards of Zee Entertainment, Westlife Development, Axis Capital, and Laxmi Organic.
MR. NIRVIK SINGH Independent and Non-Executive Director
Mr. Nirvik Singh, 54, is a marketing communications veteran and has been in the business for over 29 years. He is currently Chairman & CEO of Grey Group Asia Pacific, Middle East and Africa, a leading global marketing communications network. He has been credited with Grey’s growth in the region and oversees a network of over 2,000 professionals across 22 countries in 27 cities. Mr. Singh is a Graduate from St. Xavier’s College, Kolkata.
MS. AMEERA SHAH Independent and Non-Executive Director
Ms. Ameera Shah, 38, is the Promoter & Managing Director of Metropolis Healthcare Ltd., a reputed chain of diagnostic centres with a loyal customer base across India, South Asia, Africa and Middle East. Metropolis delivers over 30 million tests annually and caters to over 2 lac consultants across emerging markets. Metropolis is rated amongst the top 1% laboratories globally for its quality systems and protocols. Named amongst ‘Asia’s Most Powerful Women in Business’ by Forbes Asia and ‘Fifty Most Powerful Women in Business’ by Fortune India, Ms Shah is recognised as a global thought leader in the healthcare industry.
Ms. Shah has joined the Board as Additional (Independent) Director, w.e.f. June 8, 2018, subject to approval of members of the Company.
MS. ABANTI SANKARANARAYANAN Independent and Non-Executive Director
Ms. Abanti Sankaranarayanan, an Economics Graduate from St. Stephen’s College, Delhi and an MBA from Indian Institute of Management (IIM), Ahmedabad, leads the Strategy and Corporate Affairs functions at United Spirits – a Diageo Group Company. Prior to Diageo, from 1992, Abanti served as a member of the Tata Administrative Service (TAS) cadre in an illustrious career where she held key roles managing some of the best known consumer brands of the Tata Group in India, UK and the US.
Ms. Abanti Sankaranarayanan, stepped down as an Independent Director of the Company, with effect from June 8, 2018, due to commitments at her work place.

ST
RA
TE
GIC
RE
PO
RT
ST
AT
UT
OR
Y R
EP
OR
TS
FIN
AN
CIA
L S
TA
TE
ME
NT
S
27
MR. GARETH THOMAS Independent and Non-Executive Director
Gareth Thomas, 61, holds an Honours Degree in Law from the University of Wales. For the decade up until 2010 he was Retail Director of John Lewis, before retiring after a 30 year career with the John Lewis Partnership. He is now a Trustee for the Tate Galleries and the American Museum in Britain.
He is a Non- Executive Director on the Board of the Co-operative Group, in UK.
Mr. Gareth Thomas stepped down as an Independent Director of the Company with effect from October 26, 2017, on account of his personal engagements and new commitments.
MR. GOVIND SHRIKHANDE Customer Care Associate and Managing Director
Mr. Govind Shrikhande, 57, is the Managing Director of the Company. Mr. Shrikhande has been with the Company for more than seventeen years and has played a key role in the Company’s growth from 7 stores in 2001 to 97 stores (including HomeStop stores) till date. He was also instrumental in the re-branding initiative of the Department Store format – Shoppers Stop in the year 2008.
Before joining Shoppers Stop, Mr. Shrikhande spent more than 16 years working in leading textile and apparel companies, such as Mafatlal, Arvind, Arrow and Bombay Dyeing. He is a graduate of Textile Technology from Veermata Jijabai Technological Institute (VJTI), Mumbai, and is a management graduate from Symbiosis Institute of Business Management, Pune.
Mr. Shrikhande, resigned as a Managing Director w.e.f. June 30, 2018. He has stepped down to pursue other interest, his personal commitments and other engagements.
MR. RAJIV SURI Customer Care Associate and Managing Director & Chief Executive Officer
Mr. Rajiv Suri, 55, is the Managing Director & Chief Executive Officer of the Company. Mr. Suri was appointed as the CEO on January 9, 2018. He brings over 25 years of strategic leadership experience across Europe, Middle East, Africa and Asia with a proven track record of driving transformational change in organisations, accelerating store expansion powered by operational efficiencies and reenergising corporate culture paradigms. He holds a Strategic Retail Management certification from the prestigious Harvard Business School.
The Board of Directors at its meeting held on June 8, 2018, appointed Mr. Rajiv Suri as an Additional Director and Managing Director, designated as “Managing Director & Chief Executive Officer” of the Company, subject to approval of shareholders of the Company and other regulatory approvals, as may be applicable.

Annual Report 2017-201828
CORPORATE INFORMATION
Board of Directors Registered Office & Service OfficeChandru L Raheja (upto June 8, 2018) – Chairman Umang Tower, 5th Floor, B. S. Nagesh (w.e.f. June 8, 2018) – Chairman Mindspace, Off Link Road,Ravi C. Raheja – Director Malad (West), Mumbai - 400 064, India.Neel C. Raheja – Director Website: www.shoppersstop.comDeepak Ghaisas – Director E-mail: [email protected] Sanghavi – Director CIN:L51900MH1997PLC108798Manish Chokhani – DirectorNirvik Singh – Director Ameera Shah (w.e.f. June 8, 2018) – Director Statutory AuditorsAbanti Sankaranarayanan (upto June 8, 2018) – Director S R B C & CO LLPGareth Thomas (upto October 26, 2017) – DirectorGovind Shrikhande (upto June 30, 2018) – Managing Director Rajiv Suri (w.e.f. June 8, 2018) – Managing Director Internal Auditors
& Chief Executive Officer
KPMG
Audit Committee Registrar & Share Transfer Agent Deepak Ghaisas – Chairman Karvy Computershare Private LimitedRavi C. Raheja – Member Karvy Selenium Tower B, Plot 31-32, Gachibowli,Nitin Sanghavi – Member Financial District, Nanakramguda, Hyderabad - 500 032.Manish Chokhani – Member Tel 040 6716 1500
Fax 040 23420814E-mail [email protected]
Nomination, Remuneration& Corporate Governance CommitteeNirvik Singh – Chairman BankersNeel C. Raheja – Member Axis Bank Limited Nitin Sanghavi – Member ICICI Bank Limited
IDBI Bank LimitedIDFC Bank Limited
Stakeholders Relationship Committee HDFC Bank LimitedRavi C. Raheja – Chairman Kotak Mahindra Bank LimitedNeel C. Raheja – Member Yes Bank LimitedB.S. Nagesh – Member Bank of IndiaDeepak Ghaisas – Member
Management TeamCorporate Social Responsibility Committee Govind Shrikhande Ameera Shah – Chairperson Rajiv SuriRavi C. Raheja – Member Amin KassamRajiv Suri – Member Gopal Asthana
Karunakaran MohanasundaramManeesh Mittal
Company Secretary BVM RaoBharat Sanghavi Anil Shankar
Devadas NairSumit Puri
Solicitors Wadia Ghandy & Co.

ST
RA
TE
GIC
RE
PO
RT
ST
AT
UT
OR
Y R
EP
OR
TS
FIN
AN
CIA
L S
TA
TE
ME
NT
S
29
FINANCIAL HIGHLIGHTS & KEY RATIOS
(All amount in ` lacs)Profitability Statement 2017-18 2016-17 2015-16 2014-15 2013-14No. of Stores 165 150 146 138 130INCOMEGross Retail Sales 413,576 400,096 371,545 340,613 305,215Less: Value Added Tax 41,985 19,073 17,969 16,095 14,582Gross Retail Sales (Net of taxes) 371,591 381,023 353,577 324,517 290,633Other Operating & Miscellaneous Income 5,793 6,552 7,451 4,501 3,326
377,383 387,574 361,028 329,018 293,959EXPENDITURESCost of goods sold 238,837 250,576 231,245 207,806 188,096Employee costs 30,010 27,350 24,552 22,703 20,445Operating and administrative expenses 86,511 89,464 83,583 79,351 70,017
355,358 367,390 339,380 309,860 278,557EBIDTA 22,025 20,184 21,648 19,158 15,402Interest and finance charges 2,751 3,820 3,786 3,621 2,886Depreciation 11,193 11,553 9,856 8,581 6,178Profit Before Tax before exceptional items 8,082 4,812 8,006 6,956 6,338Exceptional Items 4,344 4,780 2,381 - 67Profit Before Tax after exceptional items 3,738 32 5,625 6,956 6,271Profit After tax 1,866 (1,994) 2,288 4,074 3,700BALANCE SHEET ITEMSShare Capital 4,398 4,175 4,173 4,168 4,161Reserve & Surplus 90,939 71,900 73,691 72,360 68,706Loan Funds 8,738 57,590 58,983 51,839 45,131Deferred Tax (Liability) / Assets 1,978 429 361 (956) (996)Capital Employed 102,097 133,237 136,487 129,323 118,994Fixed Assets 66,593 65,220 65,943 61,056 58,090Net Working Capital (157) 792 (1,444) (1,605) (3,734)PROFIT & LOSS RATIOSSales (Chain level growth) 3.4% 7.7% 9.1% 11.6% 19.2%Sales (Like to Like growth) 2.1% 3.1% 8.5% 5.0% 10.2%Gross Profit Margin 32.1% 32.6% 32.9% 34.3% 33.6%Operating Expenses Ratio 28.2% 29.2% 29.1% 30.0% 29.6%Operating Margin (EBIDTA) (Before exceptional item) 5.3% 5.0% 5.8% 5.6% 5.0%PBT Margin before exceptional item 2.0% 1.2% 2.2% 2.0% 2.1%PAT Margin 0.5% -0.5% 0.6% 1.2% 1.2%Interest Coverage 7.33 4.75 4.84 4.49 4.45BALANCE SHEET RATIOSDebtors No. of Days 2 2 2 3 3Creditors No. of Days 81 78 78 88 82Stock Turnover Ratio 3.2 2.8 2.5 2.7 2.3Current Ratio 0.6 0.9 0.8 0.9 0.9Assets Turnover Ratio 3.6 3.0 2.8 2.8 2.8Debt Equity Ratio 0.1 0.8 0.8 0.7 0.6RETURN TO INVESTORSReturn on Networth 12.6% 11.2% 15.3% 14.2% 13.0%Return on Capital Employed 9.2% 6.4% 8.9% 8.5% 8.3%Book Value Per Share (in `) 112.86 91.11 93.33 92.44 88.02EPS
Basic 1.37 (2.39) 3.0 4.9 4.5Diluted 1.35 (2.39) 3.0 4.9 4.4
Cash EPS 15.46 11.45 14.56 15.29 11.93Dividend Per Share 0.75 0.75 0.75 0.75 0.75Note 1:- Number of stores includes the Shoppers Stop Department stores and Speciality Stores (viz. Home Stop, Mother
Care, Mac, Clinique, Estee Lauder, Bobbi Brown, Smashbox & Airport Business).Note 2:- Figures have been regrouped for Presentation and calculation purpose.Note 3:- Figures for 2015-16, 2016-17 & 2017-18 have been stated as per Ind As requirement and not comparable with earlier
years to that extent.(Source – Company MIS)

Annual Report 2017-201830
MANAGEMENT DISCUSSION AND ANALYSISfor the year ended 31 March 2018
INDIAN RETAIL.
The last two decades, Indian Retail Industry has undergone considerable change with respect to size, scope and complexity. From USD 672 billion in 2016, the Indian Retail market is expected to grow to USD 1100 billion in 2020 with the help of rise in income levels, growing aspirations, favourable demographics and ease of credit. Globally, India is fifth-largest destination in retail space and is growing at a rate of 12% per annum.
E-TAILING.
India’s internet population will grow to 650 million users in 2020 from 430 million users in 2017, covering nearly half the population of the country. 20% of these internet users have already adopted e-commerce and this is projected to grow to 30% by 2020. With the digital ageing (time for which user has been active on the internet) expected to cross 2 years by 2020, the wallet share of e-commerce amongst adopters will also grow, potentially resulting in online transactions worth USD 100 billion in 2020 with 40-45% of these being for e-commerce. Apparel and Beauty categories are likely to lead this phase of e-commerce growth, with women shoppers forming as much as 45% of the digital adopters. Tier 2/3/4 cities are expected to grow to nearly 50% of the online spends, up from 40% in 2017; and the current youth mix (74% online shoppers aged less than 34 years in 2017) will decline to 67% by 2020.
MODERN RETAIL
Modern Retail in India has seen a dream run in the past year on the basis of strong valuation rating and improvement in business performance. Modern retail is well poised, after demonetisation and GST, given its underpenetration to total trade. Retailers have become more agile and investible, with increased focus on return ratios, debt reduction and exit from non-core assets.
MODERN RETAIL – CHALLENGES AHEAD.
Discounting by online retailers has taken a toll on physical retailers due to the shift from physical to online platforms on heavy discounting. However physical retailers now being more prepared and online players focusing on profitability some stabilisation of the competition from online retail is expected. Complete customer experience and interaction, strong brand and robust supply chain management, store network and scalability are some of the factors for online retailers to go offline. It is critical for retailers to define a viable transformation agenda to stay relevant. Efficient supply chain, efficient merchandise positioning in accordance with catchments, delivering in-store experience, ensuring optimum merchandise value
in relation to its price, effective allocation of space would help modern retail grow consistently.
S.W.O.T. ANALYSIS
Strengths:
First Citizens: Our Loyalty Programme ‘First Citizen‘ has continued to be one of the main strengths of our business. We crossed the 5.3 million mark in memberships, making it one of the largest loyalty programmes in the country across sectors. The Company continues to believe that its loyalty programme is not only a source of substantial competitive advantage, but also a very strong strategic tool. Your Company believes that its First Citizens will continue to drive its growth by increased average expenditure in our stores, aided by data-driven and analytics-backed targeted activities/promotions. Our fan base on social media has also been increasing, with more than 10.8 million fans on our Facebook page. We see significant opportunities on both these platforms for engaging our customers.
Management Strength & Corporate Governance: The Company has a professional and well-established management team. Furthermore, the Company’s unwavering focus on good corporate governance has been a beacon for the industry. Our internal and external auditors are amongst the Big 4 audit firms of the globe. The Board has 5 independent Directors with rich & diverse experience across Industries & Geographies.
Strong Brand: Shoppers Stop has been a forerunner in establishing a Pan India Retail Brand. Our strong brand image, helps us in being, the first choice for shopping by elite customers, anchor tenant for mall operators & place to launch new brands for all brands & suppliers.
Strong focus on Systems, Processes and People: Besides continuing to invest in retail front end as well as back end processes with IT enablement, the Company is investing into technology transformational projects. The Company believes that continuous investment in people, process and technology will drive sustainable and profitable growth for the Company. We have in the past year, undertaken a number of new initiatives in the technology transformation and continue to improve our current information technology capabilities and processes.
Strong Distribution and Logistics Network and Supply Chain: We have created a robust distribution and logistics network, with four regional distribution centres covering more than 510,000 square feet handling over 400,000 SKUs per year and working 24x7. The organisation strongly believes that the
– S TAT U T O R Y R E P O R T S –
ST
RA
TE
GIC
RE
PO
RT
ST
AT
UT
OR
Y R
EP
OR
TS
FIN
AN
CIA
L S
TA
TE
ME
NT
S
31
‘hub-and-spoke’ model followed by it for its Omni-channel distribution network which supports the e-commerce/Brick & Mortar Distribution Centre Operations, will stand it in good stead for the Strategy envisaged in the forthcoming years.
Enhancing our Human capital: We continue to develop our Customer Care Associates (CCAs) across all levels through Development & Assessment centres for promotion decisions, career planning and succession planning. Individual and organisational development is the primary objective of the assessment centre. We also conduct Associate Satisfaction survey every year and derive ASI scores, which helps us in identifying the index scores of respect, credibility, fairness and pride with the organisation. We continue to benchmark our compensation and benefits through consultants, with the best in the industry to pay our associates accordingly.
We benefit from our Promoters’ association with the real estate business and their relationships with developers, which have helped us acquire preferred properties at competitive rates. Our investment in new stores in last four to five years has resulted in to a robust network of 83 department stores at prominent catchments spread across the country. We are also parallelly embarking on our omni-channel journey to tap into the exponential ecommerce growth in India.
E-commerce: This year, the Company shall focus on strengthening its e-commerce presence to build on the investments made over the last 3 years to drive more than 100% sales growth, and to create seamless experiences across online and offline in order to drive digitally influenced store sales, as well as adoption of digital channels by store customers and on leveraging its partnership with Amazon to improve sales through, making our full assortment available to the vast traffic garnered by Amazon; as well as to develop experience centres at Shoppers Stop stores to increase consumer relevance, engagement & hence foot-falls.
The Company believes that more consumers across the country will discover Shoppers Stop through its digital shopping channels due to the convenience of shopping our full assortment at best prices across channels viz. stores, mobile, website & Amazon with the added advantage of being able to return, exchange anytime, anywhere.
Risks and Concerns:
Execution: We believe the key risk to our growth is execution risk. The Company has a strong execution team and we believe it has the capability to execute varied retail formats.
Employee retention: The Company believes that employee satisfaction and retention is of prime importance. The demand for experienced personnel in modern retail will only increase in the near term and long term. Your Company believes that this problem will persist until the industry reaches a steady growth phase.
Pressure on retail lease rentals: Rent is one of the largest components in a retail business’ fixed costs, and the case is no different for the Company. The permission of 100% FDI in single brand retail is also one of the reasons for increased demand for prominent catchments in key malls consequently resulting in to higher rentals. Power cost is also a matter of concern as it puts substantial pressure on profits.
Internet usage: Development of New Technologies: E-commerce Platforms being adopted by Brands themselves or by B2C & B2B Applications; as well as the obsolescence of older technologies could have a significant impact on the performance of the Company. The Company will be making focused and substantial investments to embrace new technologies and infrastructure for the Omni-channel, which is a combination of physical store and online site.
Economic Slowdown: Economic slowdowns have a direct impact on consumption. Retail being the end service provider of consumption in the supply/Value chain, is bound to face difficulties in an environment of economic slowdown. The Company continuously looks at stepping up the marketing activities and strong cost control to protect the Company’s profitability.
Opportunities:
Geographical reach: Your Company continues to increase its Pan-India footprint. The Company’s strategy to increase the number of departmental stores, and therefore improve city wise penetration in new cities, increase market share in existing cities through additional new stores in those cities, and new stores in Tier II cities, remains unchanged. Over the last Seven years the Company’s retail space has increased from 2.3 million square feet for the year ended March 31, 2011 to 4.3 million square feet for the year ended March 31, 2018 which is an impressive increase of 87%.
Format diversification and expansion: Your Company, in its constant endeavour to capture wallet share, has diversified into multiple formats viz., HomeStop which retails hard and soft furnishing, M.A.C., Bobby Brown, Estee Lauder, Smashbox & Clinique which retail high end makeup & skin care products, Mother Care which retails infant and kids merchandise. The Company has also made a successful foray into internet retailing through its e-retailing portal. The Company continues to expand these formats successfully and will maintain a focus on them.
Private & Exclusive Brands: The Private Brand Business is a very important component in our business. We started our journey from being just fashion Labels to becoming National Brands with high customer traction and Brand recall. ‘Stop’ is number one apparel brand in Shoppers Stop. The financial growth has been mapped season-over-season so as to monitor and work towards increase the share of Private Brand contribution to the Chain. Private brands brings the much needed product differentiation in business.

Annual Report 2017-201832
The product, trend mapping, visual merchandising, in-store presentation, brand building, discounting and phasing strategy is bring worked upon at a category level so as to bring a diverse and unique assortment and experience for the consumer. The brand team is also working towards increasing the sell through of range and improve the fashion quotient as apt for the target consumer segment. Through Brand building and engagement of loyalty customers we are pushing for analytics driven sales and are also working closely with Marketing to increase footfall and get more new customers to the store.
Omni-channel: New-age, digital companies are increasingly chasing ubiquity in the customer’s life, and hence aiming to become one-stop-destinations for all digital needs of the customer, while also starting to create off-line presence to make up for the absence of ‘experience/touch-feel-try’.
The Company had recognised this shift at an early stage and developed a strategy to counter the impact.
Over the last 3 years, the Company has made significant investments to embrace new technologies and infrastructure for omni-channel, which is a combination of its physical and digital customer touch points.
The Company continues to make focused investments in technology & operations set-up towards providing seamless shopping experiences through online and by digitally transforming our stores continuing to drive profitable revenue growth. Adding to the online commerce platform (SAP Hybris), CRM (Microsoft Dynamics) and WMS (JDA) built over 2015-2017, last year, the technology rollout with the deployment of Riversand Master Data Management (MDM) for a unified view of product and customer, IBM Sterling Order Management System for a unified view of orders, and an integration layer involving TIBCO’s Enterprise Service Bus (ESB) to enable customer journeys across channels.
As a result, of these initiatives, the Company has now been able to introduce omni-channel experiences such as Express Store Pickup and Ship from Store, while growing online sales for FY 2018 by 63% over FY 2017.
The Company entered into a commercial agreement with Amazon Seller Services Pvt. Ltd. wherein Shoppers Stop now has an exclusive flagship store on the Amazon marketplace – listing the Company’s portfolio of 400+ brands. Additionally, as part of this arrangement, Amazon experience centres will be created across the physical network of Shoppers Stop stores, and Shoppers Stop & Amazon India will also conduct joint marketing efforts.
Threats:
Economic slowdown: Economic slowdowns have a direct impact on consumption. Retail, being the end service provider of consumption in the supply/value
chain, is bound to face difficulties in an environment of economic slowdown.
Threat of new entrants: With India continuing to be an attractive retail market, the Company expects many new entrants into the sector, thus increasing competition. However, the nationwide footprint, excellent customer service levels, look & feel of the stores, competitive product offerings & capability of its management team to execute the business operations & expansion are the few factors amongst many which would certainly help the Company to retain its market share.
Competitive rivalry in the industry: There is intense rivalry among leading national retailers for new locations and quality real estate. The Company believes that it has a robust pipeline of stores for future expansion.
Growing competition from online players’ price war among e-tailers for ramping up sales by offering steep discounts, attractive deals and lucky draws on a range of products, has brought disruption to the traditional retail sector.
Availability of quality real estate space at commercially viable cost and at desired locations is a greatest challenge and will impact the growth of the Company.
Retailers measure entry as footfalls, which is the number of people entering the stores. This is computed through manual count in all stores during trading hours.
(Customer entry in million)
CUSTOMER ENTRY DEPARTMENTAL STORE
2017-18
2016-17
2015-16
2014-15
2013-14
42.5
46.8
45.4
45.6
46.8
(Source: Company MIS)
CONVERSION RATIO
Conversion is the ratio of the number of transactions (Cash Memo) versus the total customer entry into the stores. Tracking conversion helps the retailer understand the productivity of his front-end store employees and the attractiveness of the merchandise and services.
CONVERSION RATIO % DEPARTMENTAL STORE
2017-18
2016-17
2015-16
2014-15
2013-14 21
24.3
25.6
26.1
27.5
(Source: Company MIS)

ST
RA
TE
GIC
RE
PO
RT
ST
AT
UT
OR
Y R
EP
OR
TS
FIN
AN
CIA
L S
TA
TE
ME
NT
S
33
SALES
Gross Sales both at chain level and for Like-To-Like stores has grown against last year. The growth was 2% in gross retail turnover of Shoppers Stop departmental store business. The sales per sq. has been computed on built-up area.
SALES (LIKE-TO-LIKE GROWTH %)DEPARTMENTAL STORE
2017-18
2016-17
2015-16
2014-15
2013-14
2.1
3.1
8.5
5.0
10.2
(Source: Company MIS)
SALES PER SQUARE FEET (IN `) DEPARTMENTAL STORE
2017-18
2016-17
2015-16
2014-15
2013-14
9600
9171
8974
8244
8228
(Source: Company MIS)
APPAREL
The Apparel contribution to total sales of the Shoppers Stop departmental store business was 63.1% in 2017-18 as compared to 63.6% in 2016-17.
NON-APPAREL
This category includes Cosmetics, Personal Accessories, Jewellery, Leather goods, Home Wares, Electronics, Books and Music. These lifestyle products have high aspiration value, and as the consuming class increases, there will be a big surge in the demand for this category. The Non-Apparel contribution to total sales of the Company was 36.9% in 2017-18 as compared to 36.4% in 2016-17.
SALES MIX % DEPARTMENTAL STORE
2017-18
2016-17
2015-16
2014-15
2013-14
36.9
36.4
35.8
36.0
37.8
63.1Apparels Non–Apparels
63.6
64.2
64.0
62.2
(Source: Company MIS)
PRIVATE & EXCLUSIVE BRANDS
Your Company aims to provide a differentiated and unique offering to the customer through its own Private Brands as well as through exclusive private brands. The contribution of Private Brand is at 10.1% of sales as compared to 12.0% last year. Your Company is working on several new initiatives to drive the share of existing Private Brands like Stop, Life, Haute Curry, Vittorio Fratini, & Kashish. Exclusive brand contribution of Sales is at 3.8% as compared to 4.2% last year. Exclusive brands include, brands/labels such as WROGN by Virat Kohli & Desigual the Spanish fast fashion brand, RS by ROCKY STAR, FLAUNT BY FAMINA, RHE-SON.
PRIVATE BRAND SALES MIX %
2017-18
2016-17
2015-16
2014-15
10.1
12.0
13.5
14.1
(Source: Company MIS)
EXCLUSIVE BRAND SALES MIX %
2017-18
2016-17
2015-16
2014-15
3.8
4.2
3.5
2.9
(Source: Company MIS)
AVERAGE SELLING PRICE (ASP)
Average Selling Price is the Gross Retail Sales divided by the number of units sold. Tracking ASP helps the retailer to align the offering as per the customer segment as well as improve the productivity of the floor space.
AVERAGE SELLING PRICE (LIKE-TO-LIKE) (DEPARTMENTAL STORES)
Ave
rage
Sel
ling
Pric
e (`
)
2017-182016-172015-162014-152013-14
1300120011001000
900800700600
Year
1215
11741136
1121
1087
(Source: Company MIS)
Annual Report 2017-201834
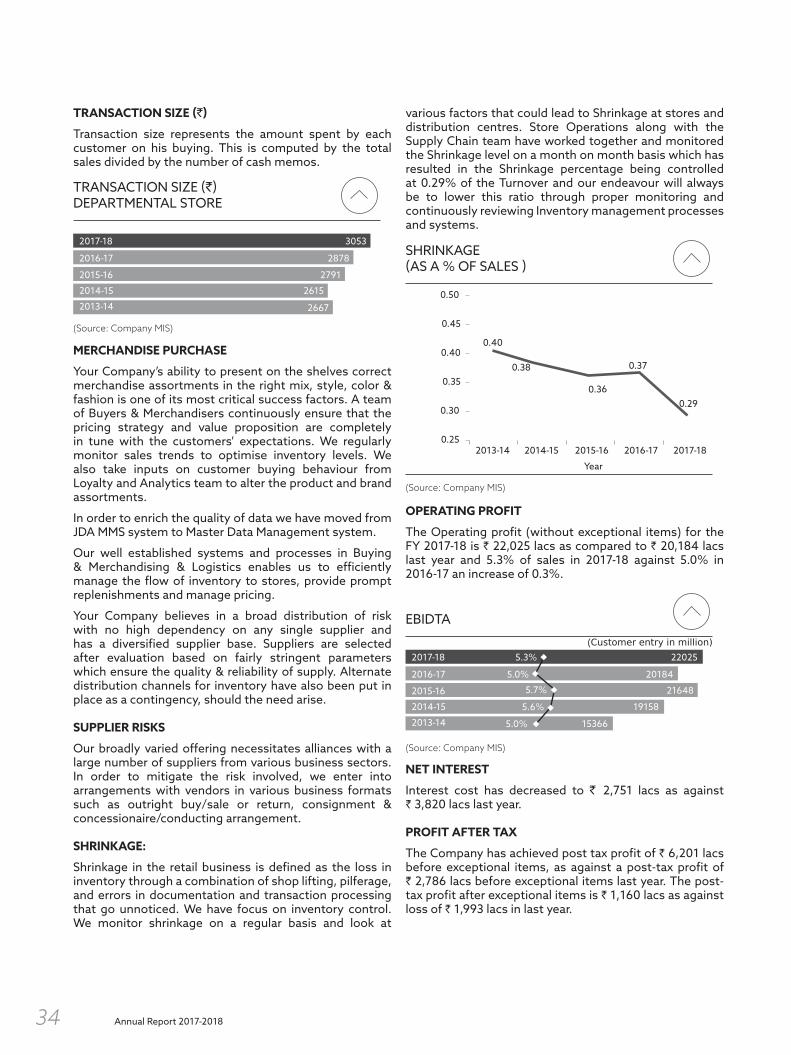
TRANSACTION SIZE (`)
Transaction size represents the amount spent by each customer on his buying. This is computed by the total sales divided by the number of cash memos.
TRANSACTION SIZE (`) DEPARTMENTAL STORE
2017-18
2016-17
2015-16
2014-15
2013-14
3053
2878
2791
2615
2667
(Source: Company MIS)
MERCHANDISE PURCHASE
Your Company’s ability to present on the shelves correct merchandise assortments in the right mix, style, color & fashion is one of its most critical success factors. A team of Buyers & Merchandisers continuously ensure that the pricing strategy and value proposition are completely in tune with the customers’ expectations. We regularly monitor sales trends to optimise inventory levels. We also take inputs on customer buying behaviour from Loyalty and Analytics team to alter the product and brand assortments.
In order to enrich the quality of data we have moved from JDA MMS system to Master Data Management system.
Our well established systems and processes in Buying & Merchandising & Logistics enables us to efficiently manage the flow of inventory to stores, provide prompt replenishments and manage pricing.
Your Company believes in a broad distribution of risk with no high dependency on any single supplier and has a diversified supplier base. Suppliers are selected after evaluation based on fairly stringent parameters which ensure the quality & reliability of supply. Alternate distribution channels for inventory have also been put in place as a contingency, should the need arise.
SUPPLIER RISKS
Our broadly varied offering necessitates alliances with a large number of suppliers from various business sectors. In order to mitigate the risk involved, we enter into arrangements with vendors in various business formats such as outright buy/sale or return, consignment & concessionaire/conducting arrangement.
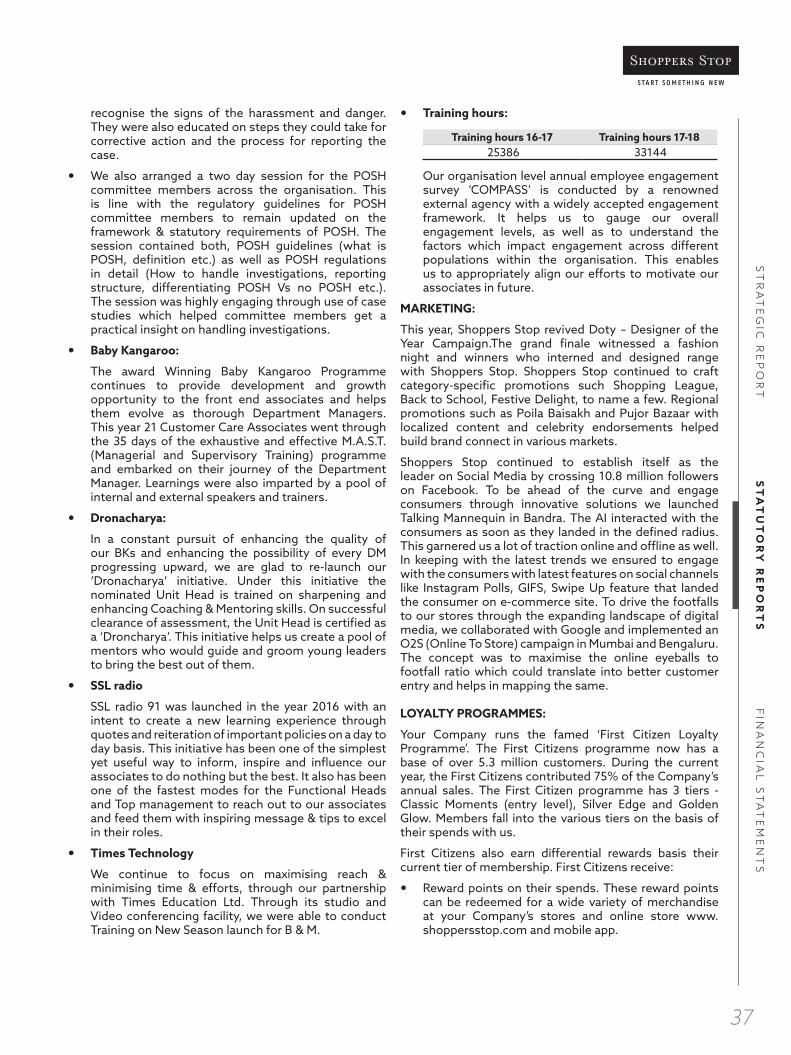
SHRINKAGE:
Shrinkage in the retail business is defined as the loss in inventory through a combination of shop lifting, pilferage, and errors in documentation and transaction processing that go unnoticed. We have focus on inventory control. We monitor shrinkage on a regular basis and look at
various factors that could lead to Shrinkage at stores and distribution centres. Store Operations along with the Supply Chain team have worked together and monitored the Shrinkage level on a month on month basis which has resulted in the Shrinkage percentage being controlled at 0.29% of the Turnover and our endeavour will always be to lower this ratio through proper monitoring and continuously reviewing Inventory management processes and systems.
SHRINKAGE (AS A % OF SALES )
2017-182016-172015-162014-152013-14
0.50
0.45
0.40
0.35
0.30
0.25
Year
0.37
0.36
0.38
0.40
0.29
(Source: Company MIS)
OPERATING PROFIT
The Operating profit (without exceptional items) for the FY 2017-18 is ` 22,025 lacs as compared to ` 20,184 lacs last year and 5.3% of sales in 2017-18 against 5.0% in 2016-17 an increase of 0.3%.
(Customer entry in million)
EBIDTA
2017-18
2016-17
2015-16
2014-15
2013-14
220255.3%
201845.0%
21648
19158
15366
5.7%
5.6%
5.0%
(Source: Company MIS)
NET INTEREST
Interest cost has decreased to ` 2,751 lacs as against ` 3,820 lacs last year.
PROFIT AFTER TAX
The Company has achieved post tax profit of ` 6,201 lacs before exceptional items, as against a post-tax profit of ` 2,786 lacs before exceptional items last year. The post-tax profit after exceptional items is ` 1,160 lacs as against loss of ` 1,993 lacs in last year.

ST
RA
TE
GIC
RE
PO
RT
ST
AT
UT
OR
Y R
EP
OR
TS
FIN
AN
CIA
L S
TA
TE
ME
NT
S
35
DIVIDEND
The Board of Directors have recommended a dividend of 15% i.e. (` 0.75 per share) for the year under review.
INVENTORY
The inventory as at the end of current year is ` 32,842 lacs as against ` 35,277 lacs as at the end of the last year. Inventory holding period is 16 weeks during the current fiscal against 18 weeks last year. The inventory has been valued at lower of cost or net realisable value.
LIQUIDITY
The cash generated from operations is ` 32,187 lacs.
PRODUCTIVITY / OPERATING EFFICIENCY PARAMETERS
We look at our Gross Margin with reference to our Space, Inventory and Labour to monitor our efficiency with the help of 3 indicators i.e. Gross Margin Return on Inventory (GMROI), Gross Margin Return on Floor Space (GMROF) and Gross Margin Return on Labour (GMROL).
GMROI helps to optimise inventory levels, GMROF helps to maximise the cash margins and GMROL helps to increase labour productivity.
3.87 3.77 3.97
3.92
5.12
GM
RO
I (`
Inve
ntor
y)
2017-182016-172015-162014-152013-14
6.00
5.50
4.50
3.50
2.50
5.00
4.00
3.00
Year
GMROI
(Source: Company MIS)
GMROF
GM
ROF
(` p
er u
nit o
f ret
ail s
pace
)
27152786
29893035
3111
2017-182016-172015-162014-152013-14Year
330031002900270025002300210019001700
(Source: Company MIS)
GMROL
GM
ROL
(` p
er e
mpl
oyee
)
2,400,000
2,100,000
1,800,000
1,500,000
1,200,0002017-182016-172015-162014-152013-14
Year
1,833,2571,957,859
2,052,649
2,248,663
2,281,997
(Source: Company MIS)
PARTNER SATISFACTION INDEX (PSI)
The performance of any Company depends on the association and relationship it builds with various vendors/ partners over a period of time. To evaluate this satisfaction and expectation, your Company has appointed CSMM (Customer Satisfaction Measurement and Management), a part of IMRB (Indian Marketing and Research Bureau) to do an impartial evaluation of our relationship with various stakeholders. This helps your organisation understand the expectations of various business partners, current strengths and concern areas thereby help set a clear roadmap for improvement and better performance.
Our PSI scores for the five years are as below.
Year 2013 2014 2015 2016 2017
Scores 4.31 4.18 4.13 4.17 4.05
PARTNERSHIP FOR PROGRESS
Partnership for Progress (PFP) is a vendor, meet which your Company conducts annually. During this event, your Company gets and gives opportunity to the top retail vendors / brands to discuss and strengthen the association, apart from exploring various business possibilities with each other. The summit also becomes a platform for your Company as well as its partners to share their experiences with each other. Your Company also invites well known international and national speakers to share learning and experience which is closely related to Retail, Brand, Customer, Logistics, etc.
Your Company also recognises the performance of top partners who are rewarded with ‘SHOPPERS STOP PINNACLE AWARDS’ during this summit.
This is an activity with more than 100 vendors/partners attending the summit.

Annual Report 2017-201836
HUMAN RESOURCES:
STYLE:
To build the organisational capability and make the organisation future ready, a 18 months programme called Shoppers Stop Young Leaders Evaluation (STYLE) programme was launched. 27 High Potentials across all functions were chosen through scientific assessments and they underwent varied initiatives across competencies like Leadership, Innovation, Storytelling etc. They were also given Live projects to work upon to develop & nurture them. The training exposure happened through External Subject Matter Experts.
ILearn:
To engage, educate and empower our learners through a blended learning mechanism, we introduced a digital platform branded as ‘ILearn’ that allows our managers and future leaders to manage their learning needs at their own pace. We have partnered with digital e-learning content experts to help our people access world-class content at their fingertips. This content is jointly designed by industry experts and professors from reputed institutes like Harvard, Stanford, Kelloggs to name a few. The blended learning model encompasses a bouquet of courses keeping in mind current skills required at the job and the competencies to do them in a right way. 850 managers across Stores and Services Office have been identified to be engaged through this initiative this year.
SIP:
We continue our journey to inspire and influence our people through Leadership Talk series branded as SIP – ‘Systematic Investment in People.’ We’ve used this platform effectively to engage our employees and seek a whole new perspective through some eminent speakers. The insights and personal stories of some of the best thought leaders often inspire our learners to reflect, evaluate, assess and then action. Thus bringing a 360 degree transformation in their personal or professional approach. We added a new outlook in the way we look at innovation in day-to-day life through the session conducted by Rolex award winner Sonam Wangchuk. The famous veteran of Kargil fame, General V.P. Malik also showed us the power of Leading from Behind. We have had an overwhelming response with the participation crossing over 400 people from Services Office for these sessions.
Cashier Excellence programme:
Cashiering process is the last touchpoint and the customer experience at this stage plays an important role in the overall engagement at the store. We conducted a benchmarking activity across diverse industries to study trends and service levels at the cash tills. To stand out and differentiate our service at this touchpoint we needed to bring a subtle balance in functional and behavioural abilities of our cashiers.
We designed an intervention which was a fine blend of observed best practices and ideal desired behaviours that our cashiers should demonstrate during customer engagement. We covered cashiers across all stores as a part of this service excellence initiative. To constantly reinforce key learnings of the programme a customised sticker is pasted on POS machines for cashiers’ immediate reference.
Outbound
Offsite trainings are a great platform for informal learning and breaking monotony. We conducted this year’s Service office outbound session at Lonavla. This one and half day intervention aimed at helping team members network and meeting new people working in other functions. This opened avenues for future inter and intra department collaboration. The training activities were designed to bring out fresh perspectives on aspects like innovation, teamwork, collaboration, problem solving, design thinking and seamless execution. The theme of this intervention to Refresh, Recharge, Renew truly met participant expectations.
Hosting Skills
With our organisation aiming to become Omni-channel it is important for us to create differentiation with our service. To create a seamless experience for our customers it was imperative that we looked at an innovative way of servicing them. Hosting a customer rather than merely selling or servicing could help us boost the service experience 3X times at the stores. This learning initiative focused on bringing a shift in the mindsets from being sale oriented to being service oriented. We focused on imparting associates with key skills that could help them host the customer with ease and confidence thus creating a wholesome experience. Customer Care Associates, Personal Shoppers, Cashiers, CSD / FCD team members, Department Managers and Unit Heads were part of this intervention.
IGDS
We continue to inculcate and give our employees, exposure to Best International Retail Practices through IGDS. Three of the senior leader participated in this year’s IGDS US Retail Executive Tour. The journey helped them look at technology practices followed by best-in-class retailers.
Personal Safety & Defense
Living the philosophy of Start Something New we initiated a pilot of Personal Shoppers at Home service in three cities. Self-Management and Personal safety of our employee becomes utmost important while they are away from the store. Subject Matter Expert Mr. Anuj Sharma conducted a two day session where the participants were made aware of the various aspects of the POSH Law and urban safety at the store or at the extended workplaces like travel or the customer’s residence. They were told how to
ST
RA
TE
GIC
RE
PO
RT
ST
AT
UT
OR
Y R
EP
OR
TS
FIN
AN
CIA
L S
TA
TE
ME
NT
S
37
recognise the signs of the harassment and danger. They were also educated on steps they could take for corrective action and the process for reporting the case.
We also arranged a two day session for the POSH committee members across the organisation. This is line with the regulatory guidelines for POSH committee members to remain updated on the framework & statutory requirements of POSH. The session contained both, POSH guidelines (what is POSH, definition etc.) as well as POSH regulations in detail (How to handle investigations, reporting structure, differentiating POSH Vs no POSH etc.). The session was highly engaging through use of case studies which helped committee members get a practical insight on handling investigations.
Baby Kangaroo:
The award Winning Baby Kangaroo Programme continues to provide development and growth opportunity to the front end associates and helps them evolve as thorough Department Managers. This year 21 Customer Care Associates went through the 35 days of the exhaustive and effective M.A.S.T. (Managerial and Supervisory Training) programme and embarked on their journey of the Department Manager. Learnings were also imparted by a pool of internal and external speakers and trainers.
Dronacharya:
In a constant pursuit of enhancing the quality of our BKs and enhancing the possibility of every DM progressing upward, we are glad to re-launch our ‘Dronacharya’ initiative. Under this initiative the nominated Unit Head is trained on sharpening and enhancing Coaching & Mentoring skills. On successful clearance of assessment, the Unit Head is certified as a ‘Droncharya’. This initiative helps us create a pool of mentors who would guide and groom young leaders to bring the best out of them.
SSL radio
SSL radio 91 was launched in the year 2016 with an intent to create a new learning experience through quotes and reiteration of important policies on a day to day basis. This initiative has been one of the simplest yet useful way to inform, inspire and influence our associates to do nothing but the best. It also has been one of the fastest modes for the Functional Heads and Top management to reach out to our associates and feed them with inspiring message & tips to excel in their roles.
Times Technology
We continue to focus on maximising reach & minimising time & efforts, through our partnership with Times Education Ltd. Through its studio and Video conferencing facility, we were able to conduct Training on New Season launch for B & M.
Training hours:
Training hours 16-17 Training hours 17-1825386 33144
Our organisation level annual employee engagement survey ‘COMPASS’ is conducted by a renowned external agency with a widely accepted engagement framework. It helps us to gauge our overall engagement levels, as well as to understand the factors which impact engagement across different populations within the organisation. This enables us to appropriately align our efforts to motivate our associates in future.
MARKETING:
This year, Shoppers Stop revived Doty – Designer of the Year Campaign.The grand finale witnessed a fashion night and winners who interned and designed range with Shoppers Stop. Shoppers Stop continued to craft category-specific promotions such Shopping League, Back to School, Festive Delight, to name a few. Regional promotions such as Poila Baisakh and Pujor Bazaar with localized content and celebrity endorsements helped build brand connect in various markets.
Shoppers Stop continued to establish itself as the leader on Social Media by crossing 10.8 million followers on Facebook. To be ahead of the curve and engage consumers through innovative solutions we launched Talking Mannequin in Bandra. The AI interacted with the consumers as soon as they landed in the defined radius. This garnered us a lot of traction online and offline as well. In keeping with the latest trends we ensured to engage with the consumers with latest features on social channels like Instagram Polls, GIFS, Swipe Up feature that landed the consumer on e-commerce site. To drive the footfalls to our stores through the expanding landscape of digital media, we collaborated with Google and implemented an O2S (Online To Store) campaign in Mumbai and Bengaluru. The concept was to maximise the online eyeballs to footfall ratio which could translate into better customer entry and helps in mapping the same.
LOYALTY PROGRAMMES:
Your Company runs the famed ‘First Citizen Loyalty Programme’. The First Citizens programme now has a base of over 5.3 million customers. During the current year, the First Citizens contributed 75% of the Company’s annual sales. The First Citizen programme has 3 tiers - Classic Moments (entry level), Silver Edge and Golden Glow. Members fall into the various tiers on the basis of their spends with us.
First Citizens also earn differential rewards basis their current tier of membership. First Citizens receive:
Reward points on their spends. These reward points can be redeemed for a wide variety of merchandise at your Company’s stores and online store www.shoppersstop.com and mobile app.

Annual Report 2017-201838
Members can earn and redeem points via their mobile phones.
Exclusive schemes, benefits and promotions.
Extended and exclusive shopping hours – especially during the festive season. Special previews before the sale periods.
Invitations to exclusive events – both in-store as well as those organised outside the stores.
Home delivery of altered merchandise for select tiers.
Exclusive First Citizen lounge at select stores.
Co-branded Credit card Programme with Citibank
Your Company in association with Citibank continues to offer its First Citizens an option to add on a credit card to their existing loyalty cards. This enables First Citizens to add on a credit line to their purchases. They also have the added advantage of being able to choose from amongst various attractive financing options, cash back schemes, EMI schemes, etc., for buying at your Company’s stores.
RISK MANAGEMENT AND INTERNAL CONTROL
Effective governance consists of competent management; implementation of standard policies and processes; maintenance of an appropriate audit programme with internal control environment; effective risk monitoring and management information systems (MIS).
The Company has an integrated approach for management of risk and has formulated the framework for regulatory and risk management, standardising the definition of internal controls.
It also provides a framework for risk management and regulatory compliance, which requires risk assessments and related policies, a control-based environment and activities, information and communication procedures, and a monitoring mechanism for the control environment.
The Company has laid down a sound system of Internal Controls for financial reporting of various transactions, efficiency of operations and compliance with relevant laws and regulations commensurate with its size and nature of business. The Company has a well-defined system of management reporting and periodic review of businesses to ensure timely decision-making.
These internal control procedures ensure the following:
Efficient use and protection of resources.
Compliance with policies, procedures and statutes.
Accuracy and promptness of financial reports.
The MIS forms an integral part of the Company’s control mechanism. All operating parameters are monitored and controlled, with material deviations from the annual planning and budgeting and business outlook including capital expenditure reported to the Board on uarterly basis.
In line with the needs of Companies Act, 2013 the Company has documented & tested all the key internal controls
related to both Financial Reporting and Operational Controls.
Reports of internal auditors are reviewed by the Audit Committee, and corrective measures are carried out towards further improvement in systems and procedures and compliance with Internal Control System. The board also recognises the work of the auditors as an independent check on the information received from the management on the operations and performance of the Company
TECHNOLOGY INITIATIVES:
2017-18 has been an exciting and action filled year for your Company. Changing market, emerging technologies and evolving customer behaviours require us to better understand our consumers need and reformulate our technology portfolio. Beside the regulatory changes in the form of GST gave us an opportunity to relook at some of our business processes and build newer capabilities. We are motivated by our position; our excellent progress leaves us in a confident position for the future. Some of the key initiatives that your Company took during the year are:
In-store Customer Engagement Initiatives and Improved Experience
In the context of a changing customer who wants a combination of luxury and fashion, your Company rolled out the Personal Shopper programme where technology played a crucial role by integrating the entire process from appointment booking to the feedback into the CRM solution and empowering our frontend associates with in-store mobile apps. Quick surveys and feedback systems were implemented to get the sense of what our customers are experiencing in-store.
Based on the extensive analytics deployed by your Company, we understand that our customers shop by brands. Brand wise points earning and redemption was a therefore a natural response which was built and rolled out in our Loyalty programme.
Faster Supply Chain & Smarter Fulfilment Model
Merchandise has its best worth when it has reached the store front in shortest possible time and is frequently refreshed. Your Company continues to invest into technologies that optimise the supply chain operational processes and makes products available for the customer efficiently. Single scan carton receiving process and automation of reverse logistics has been implemented this year to significantly reduce the goods receipt and pull back time. This enables the associates to focus more on the customers.
Information Security & Compliance Initiative
This year we continued improve upon security best practices and recertified our information security standard for PCI / DSS and extended the scope to obtain certification for our e-commerce business.

ST
RA
TE
GIC
RE
PO
RT
ST
AT
UT
OR
Y R
EP
OR
TS
FIN
AN
CIA
L S
TA
TE
ME
NT
S
39
Your Company also transitioned to GST with almost no impact on the business, your stores were open to receive the customers with a GST compliant solution on 1st of July. Your Company has very successfully changed its core solutions for GST and has met all the timelines mandated by the Government under GST.
Integrated Processes & People Efficiency
All round communications and seamlessly integrating technologies are the key to creating an agile business. Your Company has invested in the best of the breed Master Data Management (MDM) solution this year thereby allowing us to manage all the business critical data with integrity and accuracy. This is already in use extensively in the product on-boarding and on-line enrichment processes and has significantly reduced the time to make our products available online.
Another major initiative delivered this year is the Enterprise Service Bus (ESB) which integrates all the key business technologies with minimum impact. The MDM & ESB technologies form the base on which your Company will continue to maintain its leadership position in Retail Technology.
Solutions for Associate Enablement
Human resource being a critical element in maintaining a customer centric organisation culture, your Company added several new initiatives to automate the various processes like promotion, separation and performance management in an employee lifecycle.
CORPORATE GOVERNANCE
Your Company has taken steps to ensure that the Corporate Governance guidelines are adopted and fully complied with. The detailed Corporate Governance Report is attached with this report.
CAUTIONARY STATEMENT
The statement made in this section describes the Company’s objectives, projections, expectations and estimations which may be ’forward-looking statements’ within the meaning of applicable securities laws and regulations. The annual results can differ materially from those expressed or implied, depending on the economic and climatic conditions, Government policies and other incidental factors which are beyond the control of the Company.

Annual Report 2017-201840
2. OVERVIEW OF COMPANY’S PERFORMANCE
During the year under review, your Company has opened 4 department stores i.e. one store each at New Delhi, Mumbai – Thane, Hyderabad and Chennai taking its chain of stores to 83 stores (including 6 airport stores) with 13 HomeStop stores under its operations. Under “Beauty format”, the Company added 4 Clinique, 4 Bobbi Brown and 2 Smash Box stores.
The Gross Retail Turnover of the Company is ` 418,631.46 lacs (previous year ` 405,715.62 lacs), registering a growth of 3.18% y-o-y basis. The retail turnover net of taxes and cost of concessionaire/consignment merchandise stood at ` 359,148.91 lacs with a like-to-like growth at 2.10% p.a. EBITDA stood at ` 22,765.63 lacs, a growth of 2.50% with a Profit before exceptional items at ` 7,956.97 lacs a growth of 65.37% over the previous year.
The year under review, has been a hallmark year for the Company. With the aim to sharpen focus on core department store business and omni-channel strategy, the Company exited non-core businesses i.e. Hypercity, Timezone and Duty-free airport retail. The details of these disinvestment are provided in ‘Subsidiaries, Associates and Joint Venture’, section of this report. The Company raised ` 17,925.70 lacs
by offering 5% of its share capital to Amazon.com NV Investment Holdings LLC, Foreign Portfolio Investor, on a private placement basis.
These measures have significantly changed the balance sheet of your Company and will deliver greater shareholder value. At the beginning of the year, the Company had a debt of ` 57,590.17 lacs at standalone level and ` 88,510.57 lacs at consolidated level which is reduced to ` 8737.89 lacs at standalone level and ` 12,534.88 lacs at consolidated level. In fact, net debt at standalone level is ` 6,734.34 lacs, as ` 2,003.55 lacs continues to be invested in Debt mutual funds – Liquid Growth Schemes. The Company has been successful to reduce the debt-equity ratio from 0.76 to 0.09 and expects to be debt free within a couple of quarters to come.
Further, analysis of operating performance is carried under Management Discussion and Analysis, which forms part of this Annual report.
Loyalty Programme continues to grow strong with more than 53 lacs members contributing to 75% of its sales.
Our intent to bring the romance back to retail through stronger assortment, experiences and customer service coupled with re-engineered strategy on Private Brands, will continue in the years to come.
Dear Members,
Your Directors present herewith 21st Annual Report on the business and operations of the Company together with the Audited Financial Statements for the year ended March 31, 2018.
1. FINANCIAL PERFORMANCE
(` in lacs)
ParticularsYear ended
March 31, 2018Year ended
March 31, 2017RETAIL TURNOVEROwn merchandise – Gross of tax 387,316.73 367,500.86Concessionaire/consignment merchandise – Gross of tax 26,259.14 32,595.04Other Retail operating income 5,055.59 5,619.72
418,631.46 405,715.62Less: Value Added Tax 41,985.29 19,073.24Less: Cost of concessionaire/consignment merchandise 17,497.26 21,838.13
359,148.91 364,804.25Other Income 1,602.03 2,956.98Total Income 360,750.94 367,761.23Profit before Depreciation & Tax 19,149.51 16,364.13Less: Depreciation 11,192.54 11,552.61Profit before Tax 7,956.97 4,811.52Exceptional Items 5,040.96 4,780.00Profit before Tax 2,916.01 31.52Less: Provision for Tax 1,755.63 2,025.37(Loss)/Profit for the year (A) 1,160.38 (1,993.85)Other comprehensive (income)/loss (B) (706.08) 26.24Total comprehensive income/(loss) for the year (A)+(B) 1,866.46 (1,967.61)
DIRECTORS’ REPORTfor the year ended March 31, 2018
– S TAT U T O R Y R E P O R T S –
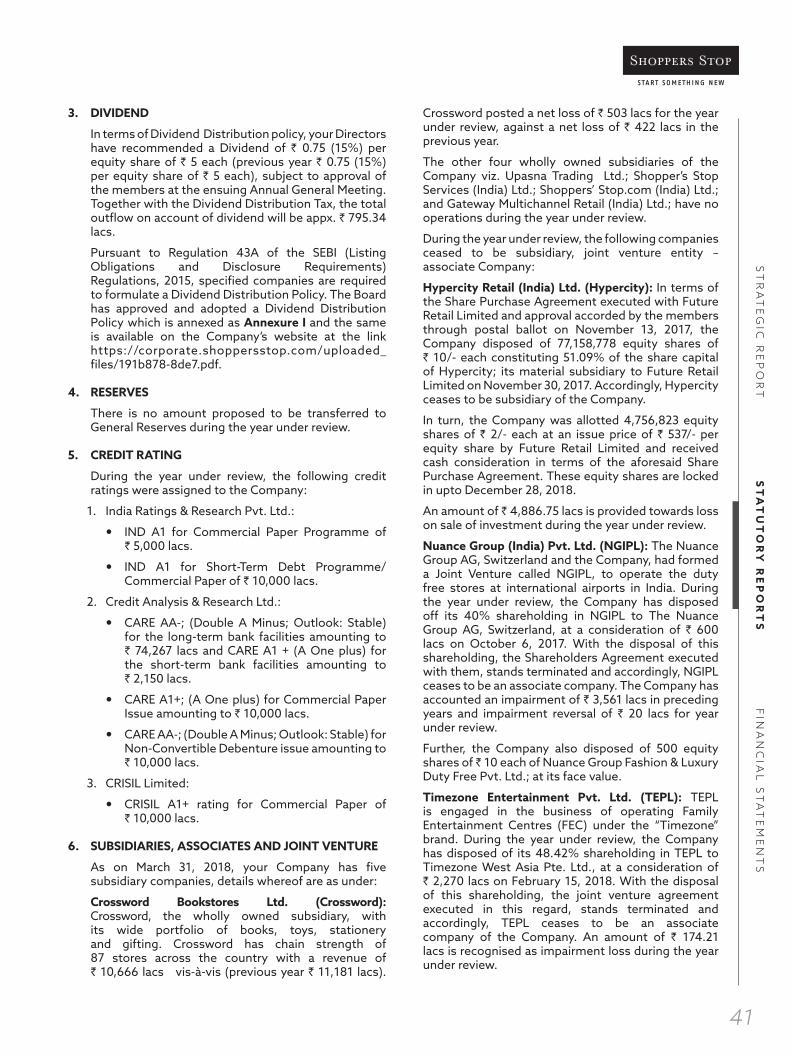
ST
RA
TE
GIC
RE
PO
RT
ST
AT
UT
OR
Y R
EP
OR
TS
FIN
AN
CIA
L S
TA
TE
ME
NT
S
41
3. DIVIDEND
In terms of Dividend Distribution policy, your Directors have recommended a Dividend of ` 0.75 (15%) per equity share of ` 5 each (previous year ` 0.75 (15%) per equity share of ` 5 each), subject to approval of the members at the ensuing Annual General Meeting. Together with the Dividend Distribution Tax, the total outflow on account of dividend will be appx. ` 795.34 lacs.
Pursuant to Regulation 43A of the SEBI (Listing Obligations and Disclosure Requirements) Regulations, 2015, specified companies are required to formulate a Dividend Distribution Policy. The Board has approved and adopted a Dividend Distribution Policy which is annexed as Annexure I and the same is available on the Company’s website at the link https://corporate.shoppersstop.com/uploaded_files/191b878-8de7.pdf.
4. RESERVES
There is no amount proposed to be transferred to General Reserves during the year under review.
5. CREDIT RATING
During the year under review, the following credit ratings were assigned to the Company:
1. India Ratings & Research Pvt. Ltd.:
IND A1 for Commercial Paper Programme of ` 5,000 lacs.
IND A1 for Short-Term Debt Programme/Commercial Paper of ` 10,000 lacs.
2. Credit Analysis & Research Ltd.:
CARE AA-; (Double A Minus; Outlook: Stable) for the long-term bank facilities amounting to ` 74,267 lacs and CARE A1 + (A One plus) for the short-term bank facilities amounting to ` 2,150 lacs.
CARE A1+; (A One plus) for Commercial Paper Issue amounting to ` 10,000 lacs.
CARE AA-; (Double A Minus; Outlook: Stable) for Non-Convertible Debenture issue amounting to ` 10,000 lacs.
3. CRISIL Limited:
CRISIL A1+ rating for Commercial Paper of ` 10,000 lacs.
6. SUBSIDIARIES, ASSOCIATES AND JOINT VENTURE
As on March 31, 2018, your Company has five subsidiary companies, details whereof are as under:
Crossword Bookstores Ltd. (Crossword): Crossword, the wholly owned subsidiary, with its wide portfolio of books, toys, stationery and gifting. Crossword has chain strength of 87 stores across the country with a revenue of ` 10,666 lacs vis-à-vis (previous year ` 11,181 lacs).
Crossword posted a net loss of ` 503 lacs for the year under review, against a net loss of ` 422 lacs in the previous year.
The other four wholly owned subsidiaries of the Company viz. Upasna Trading Ltd.; Shopper’s Stop Services (India) Ltd.; Shoppers’ Stop.com (India) Ltd.; and Gateway Multichannel Retail (India) Ltd.; have no operations during the year under review.
During the year under review, the following companies ceased to be subsidiary, joint venture entity – associate Company:
Hypercity Retail (India) Ltd. (Hypercity): In terms of the Share Purchase Agreement executed with Future Retail Limited and approval accorded by the members through postal ballot on November 13, 2017, the Company disposed of 77,158,778 equity shares of ` 10/- each constituting 51.09% of the share capital of Hypercity; its material subsidiary to Future Retail Limited on November 30, 2017. Accordingly, Hypercity ceases to be subsidiary of the Company.
In turn, the Company was allotted 4,756,823 equity shares of ` 2/- each at an issue price of ` 537/- per equity share by Future Retail Limited and received cash consideration in terms of the aforesaid Share Purchase Agreement. These equity shares are locked in upto December 28, 2018.
An amount of ` 4,886.75 lacs is provided towards loss on sale of investment during the year under review.
Nuance Group (India) Pvt. Ltd. (NGIPL): The Nuance Group AG, Switzerland and the Company, had formed a Joint Venture called NGIPL, to operate the duty free stores at international airports in India. During the year under review, the Company has disposed off its 40% shareholding in NGIPL to The Nuance Group AG, Switzerland, at a consideration of ` 600 lacs on October 6, 2017. With the disposal of this shareholding, the Shareholders Agreement executed with them, stands terminated and accordingly, NGIPL ceases to be an associate company. The Company has accounted an impairment of ` 3,561 lacs in preceding years and impairment reversal of ` 20 lacs for year under review.
Further, the Company also disposed of 500 equity shares of ̀ 10 each of Nuance Group Fashion & Luxury Duty Free Pvt. Ltd.; at its face value.
Timezone Entertainment Pvt. Ltd. (TEPL): TEPL is engaged in the business of operating Family Entertainment Centres (FEC) under the “Timezone” brand. During the year under review, the Company has disposed of its 48.42% shareholding in TEPL to Timezone West Asia Pte. Ltd., at a consideration of ` 2,270 lacs on February 15, 2018. With the disposal of this shareholding, the joint venture agreement executed in this regard, stands terminated and accordingly, TEPL ceases to be an associate company of the Company. An amount of ` 174.21 lacs is recognised as impairment loss during the year under review.

Annual Report 2017-201842
Except for the above, no Company has become or ceased to be subsidiary, joint venture entity or associate company.
In accordance with the provisions contained in Section 136 of the Companies Act, 2013, the Annual Report of the Company, containing therein its Standalone and the Consolidated Financial Statements are available on the Company’s website www.shoppersstop.com. Further, the Financial Statements of each of the aforesaid subsidiary companies are available on the Company’s website and shall also be available for inspection during business hours at the Registered Office of the Company. Any member who is interested in obtaining a copy of the Financial Statements may write to the Company Secretary at the Registered Office of the Company.
7. CONSOLIDATED FINANCIAL STATEMENTS
In accordance with the provisions of Section 129(3) of the Companies Act, 2013 and Regulation 34 of the SEBI (Listing Obligations & Disclosure Requirements) Regulations, 2015 (Listing Regulations) the Consolidated Financial Statements forms part of this Annual Report and shall also be laid before the ensuing Annual General Meeting of the Company. The Consolidated Financial Statements have been prepared in accordance with the Indian Accounting Standards (IND AS) under Section 133 of the Companies Act, 2013.
A Report on the performance and financial position of these subsidiaries included in the Consolidated Financial Statement and their contribution to the overall performance of the Company, is provided in Form AOC-1 and forms part of this Annual Report.
8. EMPLOYEES STOCK OPTION SCHEME
The Nomination, Remuneration & Corporate Governance Committee of the Company, inter-alia, administers and monitors the Employee Stock Option Scheme. During the year under review, the Company has allotted 60,020 equity shares of ` 5/- each on exercise of vested options by certain employees of the Company and its subsidiaries.
During the year under review, the Company has not granted any Employee Stock Options.
In terms of the provisions of the SEBI (Share Based Employee Benefits) Regulations, 2014, the details of the Stock Options granted under the ESOP Scheme is annexed herewith as Annexure II. Further, certificate from S R B C & CO LLP, Statutory Auditors of the Company, with respect to implementation of Employee Stock Option Scheme, would be placed at the ensuing Annual General Meeting for inspection by the Members and a copy will also be available for inspection at the Registered Office of the Company.
9. PREFERENTIAL ALLOTMENT OF EQUITY SHARES
The Company has allotted 43,95,925 equity shares of ` 5/- each at a price of ` 407.78/- per equity share,
aggregating to ` 17,925.70 lacs to Amazon.com NV Investment Holdings LLC, Foreign Portfolio Investor, on private placement basis on January 12, 2018. Pursuant to SEBI (Issue of Capital and Disclosure Requirements) Regulations, 2009, as amended, these equity shares are locked-in upto January 19, 2019.
10. HUMAN RESOURCES
The Company continues to build organisational capability by empowering its employees across all levels. High Potentials Associates were identified through a very transparent assessment mechanism and they underwent a robust Programme with various bespoke initiatives and live projects to make them future ready. To build a service oriented workforce, highly customised training sessions like hosting skills, cashiering excellence, Personal Shopper@ home, are being conducted thus giving the customers a delightful experience and help customer transformation through fashion, in line with the Company’s vision statement. The Company strongly stands against sexual harassment cases and thrusts a lot on various training initiatives pertaining to Prevention of Sexual Harassment (PoSH). Maximising reach and minimising efforts and time is now being made possible through infusion of technology in training initiatives because of which number of training hours have seen a positive traction. The Company has also managed to establish its image as a Retail tech organisation by participating in National level Coding contest. It also focusses on the overall development of the Customer Care Associates (CCAs) and accordingly human resource initiatives are being implemented. As on date of the Balance Sheet, the Company had a total of 7,480 CCAs.
11. CORPORATE SOCIAL RESPONSIBILITY
Pursuant to the provisions of Section 135 of the Companies Act, 2013 read with Companies (Corporate Social Responsibility Policy) Rules, 2014, your Company as part of CSR initiatives has undertaken projects/ Programmes in accordance with CSR Policy. The CSR Policy may be accessed on the Company’s website at the link: https://corporate.shoppersstop.com/uploaded_files/6a821c5-ec98.pdf. The report on CSR is annexed herewith as Annexure III.
The Corporate Social Responsibility Committee comprises of three Directors i.e. Ms. Ameera Shah, as the Chairperson, Mr. Ravi Raheja and Mr. Rajiv Suri as the members.
12. BOARD OF DIRECTORS & KEY MANAGERIAL PERSONNEL
Non-Independent Directors
In accordance with the provisions of Section 152 of the Companies Act, 2013, Mr. Neel C. Raheja (DIN: 00029010) is liable to retire by rotation at the ensuing Annual General Meeting and being eligible, has offered himself for re-appointment. The Board of Directors recommends his re-appointment and the

ST
RA
TE
GIC
RE
PO
RT
ST
AT
UT
OR
Y R
EP
OR
TS
FIN
AN
CIA
L S
TA
TE
ME
NT
S
43
matter is being placed for the approval of members at the ensuing Annual General Meeting of the Company.
Mr. Chandru L. Raheja (DIN: 00027979), Non-Executive Promoter Chairman of the Company resigned as a Director and Chairman of the Company with effect from June 8, 2018, on account of his age, seniority and increasing personal engagements, after having served as Chairman for more than two decades. Your directors would like to place on record their sincere gratitude for the enormous contribution made by Mr. Raheja as the Chairman of the Company since its inception. The Company and the Board benefitted immensely from Mr. Raheja’s vast experience, knowledge and insights.
The Board of Directors in appreciation of Mr. B. S. Nagesh’s (DIN: 00027595) farsighted vision, wisdom and guidance, which have been invaluable to the Company’s growth, has elevated him from his present position of Vice Chairman to the Chairman of the Board of Directors and the Company with effect from June 8, 2018. As the members are aware, prior to his role as Non-Executive Vice Chairman of the Company effective August 18, 2009, Mr. Nagesh was a Managing Director of the Company. During his then administrative & managerial position with a successful association of more than 12 years, he had played a key role in the phenomenal growth and success of the Company. Your directors would like to place on record their sincere appreciation towards the contribution made by Mr. B. S. Nagesh and welcomes him as the Chairman of the Company.
Mr. Govind Shrikhande, Managing Director of the Company, resigned as Managing Director effective from close of business hours of June 30, 2018. He has stepped down to pursue other interest, his personal commitments and other engagements. The Board of Directors place on record their deep appreciation for the contributions made by Mr. Shrikhande during his association of more than 17 years, during which, the Company has grown from 7 stores in the year 2001 to 97 stores (including 13 HomeStop stores) till date.
During the year under review, Mr. Rajiv Suri (DIN: 08124971) was appointed as Chief Executive Officer, one of the Key Managerial Personnel of the Company, under Section 203 of the Companies Act, 2013 & Rules thereunder, effective January 9, 2018. Further, the Board of Directors at its meeting held on June 8, 2018, on the recommendation of the Nomination, Remuneration & Corporate Governance Committee, appointed Mr. Rajiv Suri as an Additional Director and Managing Director, designated as “Managing Director & Chief Executive Officer” of the Company for a period of 3 (three) years commencing from June 8, 2018, subject to the approval of the members of the Company and other regulatory approvals, as may be applicable. The Board of Directors recommends his appointment and the matter is being placed for the approval of members at the ensuing Annual General Meeting of the Company.
Independent Directors
Mr. Gareth Thomas (DIN: 07010320) Independent Director of the Company stepped down from the said position with effect from October 26, 2017, on account of his personal engagements and new commitments. Ms. Abanti Sankaranarayanan (DIN: 01788443), has tendered her resignation as Independent Director of the Company, with effect from June 8, 2018, due to commitments at her work place. The Board places on record its appreciation for contribution made by both of them during their tenure as Independent Directors of the Company.
The Board of Directors at its meeting held on June 8, 2018, on the recommendation of the Nomination, Remuneration & Corporate Governance Committee, appointed Ms. Ameera Shah (DIN: 00208095) as an Additional Director to hold office as Independent Director of the Company for a term of 5 (five) years commencing from June 8, 2018 to June 7, 2023, subject to approval of members of the Company. The Company has received declaration from Ms. Ameera Shah confirming that she meets with the criteria of Independence as prescribed under Section 149(6) of the Companies Act, 2013 and the SEBI (Listing Obligations and Disclosure Requirements) Regulations, 2015. The Board of Directors recommends her appointment and the matter is being placed for the approval of members at the ensuing Annual General Meeting of the Company.
The Company has received declarations from all the Independent Directors of the Company confirming that they meet with the criteria of Independence as prescribed under Section 149(6) of the Companies Act, 2013 and the SEBI (Listing Obligations and Disclosure Requirements) Regulations, 2015.
Key Managerial Personnel
During the year under review, Mr. Salil Nair, Chief Executive Officer of the Company and Mr. Sanjay Chakravarti, Chief Financial Officer of the Company had resigned from the services of the Company with effect from May 31, 2017 and December 22, 2017, respectively. The Board of Directors places on record the contribution made by both of them, during their long association with the Company.
The Board of Directors, effective June 8, 2018, has appointed Mr. Karunakaran Mohanasundaram as Chief Financial Officer (CFO), one of the Key Managerial Personnel of the Company, under Section 203 of the Companies Act, 2013 & Rules thereunder. Consequently, Mr. Vijay Jain stepped down from the position of “Interim Chief Financial Officer” w.e.f. June 8, 2018 and accordingly ceased to be one of the Key Managerial Personnel of the Company. Mr. Vijay Jain, was appointed by the Board of Directors as Interim Chief Financial Officer, designated as Deputy Chief Financial Officer of the Company and one of the Key Managerial Personnel of the Company, effective April 27, 2018, till the time the Company identifies and appoints a suitable candidate for the post of CFO.

Annual Report 2017-201844
13. ANNUAL EVALUATION OF DIRECTORS, COMMITTEES AND BOARD
In compliance with the Companies Act, 2013 and the SEBI (Listing Obligations and Disclosure Requirements) Regulations, 2015, the performance evaluation of the Board, its specified Committees and individual directors was carried out during the year under review. More details on the same are provided in Corporate Governance Report. The Directors expressed their satisfaction with the evaluation process.
14. FAMILIARISATION PROGRAMME FOR INDEPENDENT DIRECTORS
The Familiarisation Programme for Independent Directors which also extends to other Non-Executive Directors, aims to familiarise them with the Company, nature of the retail industry, business model, processes & policies, etc., and also seeks to update them on the roles, responsibilities, rights and duties under the Companies Act, 2013 and other statutes. More details on the same are provided in Corporate Governance Report.
The details of the programme has been posted on the Company’s website at web link: https://corporate. shoppersstop.com/Investors/Training.aspx
15. REMUNERATION POLICY
The Board of Directors on the recommendation of the Nomination, Remuneration & Corporate Governance Committee has framed a policy for selection and appointment of Directors, Senior Management and their remuneration. The said policy is annexed herewith as Annexure IV.
16. DISCLOSURES UNDER THE COMPANIES ACT, 2013
Extract of Annual Return: The details forming part of extract of the annual return in Form MGT 9 is annexed herewith as Annexure V.
Meetings of the Board of Directors: The Board of Directors met 7 (seven) times in the year under review. The details about the board meetings and the attendance of the directors are provided in Corporate Governance Report.
Change in Share Capital: During the year under review, the Company allotted 60,020 equity shares of ` 5/- each on exercise of vested Employee Stock Options under the ESOP Scheme. Further, the Company on January 12, 2018, has allotted 4,395,925 equity shares of ` 5/- each to Amazon.com NV Investment Holdings LLC, Foreign Portfolio Investor, on private placement basis. These equity shares ranks pari passu in all respect. Consequent to the above allotments of equity shares, the paid-up share capital stands increased to ` 439,803,445 divided into 87,960,689 equity shares of ` 5/- each.
Audit Committee: The Audit Committee comprises of four Non-Executive Directors i.e. Mr. Deepak Ghaisas, as the Chairman, Mr. Ravi C. Raheja,
Prof. Nitin Sanghavi, and Mr. Manish Chokhani as the members. The Board of Directors has accepted all the recommendations made by Audit Committee from time to time.
Related Party Transactions: Your Company has formulated a policy on Related Party Transactions including policy for determining material subsidiaries and on materiality of related party transactions which are available on the Company’s website and is accessible at the link: https://corporate.shoppersstop.com/uploaded_files/70ad1c1-7375.pdf. As on date, there is no material subsidiary of the Company.
All contracts, arrangements/transactions entered into during the year under review by the Company with Related Parties were in ordinary course of business and on an arm’s length basis.
During the year under review, the Company had not entered into any contract/ arrangement/ transaction with related parties which could be considered material in accordance with the policy of the Company on materiality of related party transactions. Accordingly, particulars of contracts or arrangements with related parties referred to in Section 188(1) of the Companies Act, 2013 along with the justification for entering into such contract or arrangement in Form AOC-2 does not form part of the report. However, the Directors draw attention of the members to note no. 38 of the Standalone Financial Statement which sets out related party disclosures.
Omnibus approval is obtained for the transactions which are foreseen and repetitive in nature with Related Parties. A statement of all such related party transactions is presented before the Audit Committee on a quarterly basis for its review, specifying the nature and value of these transactions.
Particulars of loans, guarantees or investments: The details of loans, guarantees and investments covered under the provisions of Section 186 of the Companies Act, 2013 are provided in note nos. 4, 5 and 29 (II) b of the Standalone Financial Statement respectively.
Other Disclosures: The Board of Directors state that no disclosure and/or reporting and/or details is required in respect of the following items as there were no transactions on these items during the year under review:
Deposits covered under Section 73 of the Companies Act, 2013 read with Companies (Acceptance of Deposits) Rules, 2014.
Issue of shares (including sweat equity shares) to employees of the Company under any scheme save and except ESOP referred to in this report.
Issue of equity shares with differential rights as to dividend, voting or otherwise.
Managing Director of the Company has not received any remuneration or commission from any of the Company’s subsidiaries.

ST
RA
TE
GIC
RE
PO
RT
ST
AT
UT
OR
Y R
EP
OR
TS
FIN
AN
CIA
L S
TA
TE
ME
NT
S
45
No significant or material orders were passed by the Regulators or Courts or Tribunals which impact the going concern status and Company’s operations in future.
There was no revision in the financial statements.
There was no change in the nature of the business.
The Company has adopted a policy for prevention of sexual harassment at work place, which inter-alia, provides for protection against sexual harassment of women at workplace and for prevention and redressal of such complaints. During the year under review, there were 9 complaints received and the same have been disposed of. The Company has an Internal Complaints Committee (ICC) which is responsible for redressal of these complaints and follows the guidelines as stipulated in the policy. There are training being conducted for sensitising all the CCAs on PoSH.
17. RISK MANAGEMENT
Your Company has established a robust Risk Management system to identify & assess the key risks and ensure smooth and efficient operations of the business. The Company has reviewed the major risks which affects it, from both the external and the internal environment perspective and appropriate actions have been initiated to mitigate, partially mitigate, transfer or accept the risk (if need be) and monitor the risks on a regular basis.
18. INTERNAL FINANCIAL CONTROL
The Company has laid down internal financial control’s, through a combination of entity level controls, process level controls and IT general controls, inter-alia, to ensure orderly and efficient conduct of business, including adherence to the Company’s policies and procedures, accuracy and completeness of accounting records and timely preparation and reporting of reliable financial statements/information, safeguarding of assets, prevention and detection of frauds and errors.
The evaluation of these internal financial controls were done through the internal audit process, established within the Company and also through appointing professional firm to carry out such tests by way of systematic internal audit programme. Based on the review of the reported evaluations, the directors confirm that, for the preparation of financial Statement for the year ended March 31, 2018, the applicable Accounting Standards have been followed and the internal financial controls related to financial Statement are generally found to be adequate and were operating effectively and that no material weaknesses were noticed.
19. WHISTLE BLOWER / VIGIL MECHANISM
The Company has established a Vigil Mechanism and adopted a whistle blower policy for its directors and employees, to report concerns about unethical behaviour, actual or suspected fraud or violation of
the Company’s code of conduct or ethics policy. The mechanism provides adequate safeguards against victimisation of persons who use this mechanism. The brief details about this mechanism has also been posted on the website of the Company.
20. CORPORATE GOVERNANCE
The Company has complied with the requirements of corporate governance as stipulated under the Listing Regulations and accordingly, the Report on Corporate Governance forms part of this Annual Report. The requisite certificate from S R B C & CO LLP, the Statutory Auditors of the Company, regarding the compliance with the conditions of Corporate Governance as stipulated in Regulation 34 of Listing Regulations, is annexed to this Annual Report.
21. MANAGEMENT DISCUSSION AND ANALYSIS
Management Discussion and Analysis for the year under review, as stipulated in terms of Regulation 34 of the Listing Regulations, is presented in a separate section forming part of this Annual Report.
22. BUSINESS RESPONSIBILITY REPORT
Business Responsibility Report for the year under review, as stipulated in terms of Regulation 34 of the Listing Regulations is presented in a separate section forming part of this Annual Report.
23. CODE OF CONDUCT FOR THE PREVENTION OF INSIDER TRADING
The Board of Directors has adopted the Code of Internal Procedures and Conduct for regulating, monitoring and reporting trading by designated persons in accordance with the SEBI (Prohibition of Insider Trading) Regulations, 2015. The said code lays down guidelines and procedures to be followed, and disclosures to be made while dealing with the securities of the Company. The Code of fair disclosure of unpublished price sensitive information is available on website and is accessible at the link http://corporate.shoppersstop.com/uploaded_files/3cd8391-7d65.pdf
24. AUDITORS
Statutory Auditors
S R B C & CO LLP, (Registration No. 324982E/E300003) Chartered Accountants were appointed as Statutory Auditors of the Company by the Members at the 20th Annual General Meeting (AGM) held on July 28, 2017, to hold office from the conclusion of the 20th AGM until the conclusion of the 25th AGM of the Company in accordance with provisions of the Companies Act, 2013 and will continue to be Statutory Auditors of the Company till their term expires.
The Auditors’ Report to the members for the year under review does not contain any qualification, reservation, adverse remark or disclaimer. The Auditors has not reported any matter to the Company

Annual Report 2017-201846
required to be disclosed under Section 143(12) of the Companies Act, 2013.
Secretarial Auditors
Pursuant to the provisions of Section 204 of the Companies Act, 2013 read with the Companies (Appointment and Remuneration of Managerial personnel) Rules, 2014, the Company had appointed Kaushal Dalal & Associates, Practicing Company Secretaries, to undertake the Secretarial Audit of the Company for the year under review. The Secretarial Audit Report issued by them, is annexed herewith as Annexure VI. The said report does not contain any qualification, reservation, adverse remark or disclaimer.
25. ENERGY CONSERVATION, TECHNOLOGY ABSORPTION AND FOREIGN EXCHANGE
The information on conservation of energy, technology absorption and foreign exchange earnings and outgo as stipulated is annexed herewith as Annexure VII. The foreign exchange earnings was ` 7,978.85 lacs and outgo was ` 1,528.42 lacs.
26. TRANSFER OF EQUITY SHARES TO IEPF
During the year under review, 734 Equity shares of 11 Shareholders of the Company, have been transferred/credited to the Demat account of Investor Education and Protection Fund Authority (IEPF Authority) in accordance with Section 124(6) of the Companies Act, 2013 read with Investor Education and Protection Fund Authority (Accounting, Audit, Transfer and Refund) Rules, 2016, as amended, whose dividend has not been encashed on such shares, since last seven consecutive years. The details thereof are available under ‘Investor Section’ on the Website of the Company viz. www.shoppersstop.com. Any person whose shares and/or unclaimed dividend has been transferred to the IEPF Authority may claim the shares and/or apply for refund in respect of unclaimed dividend, as the case may be, under the provisions of the Companies Act, 2013 and rules made thereunder.
27. DEMAT SUSPENSE ACCOUNT FOR UNCLAIMED SHARES
As on date, there are 13 shareholders, holding 700 equity shares of ` 5/- each (post sub-division) allotted in Initial Public Offering of 2005, lying in the escrow account due to non-availability of their correct particulars. Despite various reminders to them by Karvy Computershare Private Limited, Registrar and Share Transfer Agent of the Company, no response has been received. As a result, the said unclaimed shares have been credited to ‘Shoppers Stop Ltd. – Unclaimed Shares Demat Suspense Account’. Such shareholders may approach the Company with their correct particulars and proof of their identity for crediting requisite shares from Demat Suspense Account to their individual Demat Account. During
the year under review, no shares were transferred from the suspense account to any of the aforesaid shareholders.
28. PARTICULARS OF EMPLOYEES
In terms of the provisions of Section 197(12) of the Companies Act, 2013, read with Rules 5(2) and 5(3) of the Companies (Appointment and Remuneration of Managerial Personnel) Rules, 2014, as amended, a statement showing the names and other particulars of the employees drawing remuneration in excess of the limits set out in the said rules forms part of this report.
Further, the disclosures pertaining to remuneration and other details as required under Section 197(12) of the Companies Act, 2013 read with Rule 5(1) of the Companies (Appointment and Remuneration of Managerial Personnel) Rules, 2014, forms part of this Report.
Having regard to the provisions of the second proviso to Section 136(1) of the Act, the Annual Report excluding the aforesaid information is being sent to the members of the Company. The said information is available for inspection at the registered office of the Company during business hours on working days upto the date of ensuing Annual General Meeting. Any member interested in obtaining such information may write to the Company Secretary and the same will be furnished on request. The Annual Report including the aforesaid information is also available on the Company’s website.
29. DIRECTORS’ RESPONSIBILITY STATEMENT
Pursuant to the requirements of Section 134 of the Companies Act, 2013, it is hereby confirmed that:
a) in the preparation of the annual accounts, the applicable accounting standards have been followed along with proper explanation relating to material departures, if any;
b) appropriate accounting policies have been selected and applied them consistently and judgements and estimates have been made that are reasonable and prudent so as to give a true and fair view of the state of affairs of the Company as on March 31, 2018 and of the profit of the Company for the year under review;
c) proper and sufficient care has been taken for the maintenance of adequate accounting records in accordance with the provisions of the Companies Act, 2013 for safeguarding the assets of the Company and for preventing and detecting fraud and other irregularities;
d) the annual accounts have been prepared on a going concern basis;
e) the proper internal financial controls has been laid down and that the internal financial controls were adequate and were operating effectively; and

ST
RA
TE
GIC
RE
PO
RT
ST
AT
UT
OR
Y R
EP
OR
TS
FIN
AN
CIA
L S
TA
TE
ME
NT
S
47
CERTIFICATE OF COMPLIANCE WITH THE CODE OF CONDUCT FOR THE FINANCIAL YEAR 2017-18
We hereby declare that the Company has adopted a Code of Conduct for the Board of Directors and Senior Management of the Company and they have affirmed compliance with the said Code of Conduct.
For Shoppers Stop Limited
April 27, 2018
Govind Shrikhande Customer Care Associate &
Managing Director
Rajiv SuriCustomer Care Associate &
Chief Executive Officer
For and on behalf of the Board of Directors
B. S. Nagesh June 8, 2018 Chairman
f) the systems to ensure compliance with the provisions of all applicable laws are in place and were adequate and operating effectively.
30. SECRETARIAL STANDARDS
During the year under review, the Company has complied with Secretarial Standards on meetings of the Board of Directors and on General Meetings issued by the Institute of Company Secretaries of India in terms of Section 118(10) of the Companies Act, 2013.
31. AWARDS AND ACCOLADES
During the year under review, your Company received many awards and felicitations conferred by reputable organisations, some of them are:
a) Times Ascent – Dream Company to work for in Retail & were also ranked 17th amongst “Times Ascent Dream Companies to work for” across all industries and sectors in India.
b) “Great Place to Work” & also recognised as one of the Top 10 Best Workplaces in Retail by Great Place to Work® Institute – 2018.
c) Economic Times – Excellence in Supply Chain & Logistics Award.
d) ELSC Industry Excellence in Supply Chain – Retail.
e) BT-CSR Excellence award for Energy Conservation from Bureaucracy Today.
f) Winner in the following categories at ‘Kamikaze Customer Loyalty Awards - 2018’
Best Loyalty Programme in Retail Sector: Large/Multi - Brand Format
Best Customer Experience in Retail Sector: Large/Multi - Brand Format
Best Use of Innovation in Loyalty Marketing.
Best Use of Customer and Data Analytics in Loyalty Programme
Best Use of Direct Marketing in a Loyalty Programme
32. MATERIAL CHANGES AND COMMITMENTS
There are no material changes and commitments which could affect the Company’s financial position which have occurred between March 31, 2018 and the date of this Report.
33. ACKNOWLEDGEMENT
Your Directors would like to place on record its sincere appreciation for the support and contribution made by customers, business partners, suppliers, shareholders and all Customer Care Associates across the Country as well as various government departments, banks and financial institutions for the conduct of operations of the Company.
Annual Report 2017-201848
DIVIDEND DISTRIBUTION POLICY
1. Introduction
The Securities and Exchange Board of India on July 8, 2016, has inserted Regulation 43A in the SEBI (Listing Obligations and Disclosure Requirements) Regulations, 2015, which requires top 500 listed entities (based on market capitalisation of every financial year), to formulate a Dividend Distribution Policy.
Shoppers Stop Ltd.; being one of the top 500 listed entities as per market capitalisation as on the last day of immediately preceding financial year, has framed this Dividend Distribution Policy in compliance with this regulation.
2. Objective
The objective of this Policy is to ensure optimum balance between dividend paid to shareholders and profits retained by the Company. The Policy lays down parameters to be considered by the Company for declaration of Dividend. The Company’s commitment to declare dividends is a part of its commitment towards enhancing shareholder value.
3. Definitions
‘Act’ means the Companies Act, 2013 and rules made thereunder and as amended from time to time.
‘Board’ means Board of Directors of the Company.
‘Company’ means Shoppers Stop Limited.
‘Dividend’ means Dividend as defined under the Companies Act, 2013.
‘Listing Regulations’ means the Securities and Exchange Board of India (Listing Obligations and Disclosure Requirements) Regulations, 2015, as amended form time to time.
‘Policy’ means this Dividend Distribution Policy.
4. Parameters for declaration of dividend
The Board of Directors of the Company would consider the following financial parameters and internal & external factors, before declaring or recommending dividend to shareholders.
Financial Parameters/Internal factors
i. Profit earned for the financial year;
ii. Cash flow from operations;
iii. Working capital & capital expenditure requirements;
iv. Liquidity & debt position;
v. Operating performance;
vi. Dividend trends of preceding years;
vii. Provision for contingencies.
External factors
i. Taxation and other regulatory requirements;
ii. Macroeconomic conditions.
Taking into consideration these factors, the Board will endeavour to maintain a dividend payout in the range of 15% to 25% on profit after tax on standalone basis. Further, the Board may amend the payout range, whenever considered appropriate by it.
5. Circumstances under which the shareholders of the Company may or may not expect dividend
Under the following circumstances, the shareholders of the Company may not expect dividend:
i. In the event of inadequacy of profits or of loss;
ii. Non-availability of sufficient cash flow to meet the capital requirements;
iii. Expansion plans, necessitating greater provision of free cash;
iv. Any acquisition or joint venture, requiring allocation of capital.
6. Utilisation of Retained Earnings
The Board may retain its earnings in order to make better use of the available funds for investing in the growth of the Company and increase shareholders value in the long run.
7. Parameters to be adopted with regard to various classes of shares
Presently, the Company has issued only one class of equity shares with equal voting rights. Accordingly, all the shareholders of the Company are entitled to receive the same amount of dividend per share.
8. Dissemination of Policy
The Company shall make appropriate disclosure of this policy as provided under Listing Regulations.
9. Review and amendment
The Board may monitor, review and amend the Policy from time to time as also whenever necessitated due to amendments in any Act, Rules or applicable Regulations.
Annexure - I
ANNEXURE TO THE DIRECTORS’ REPORT
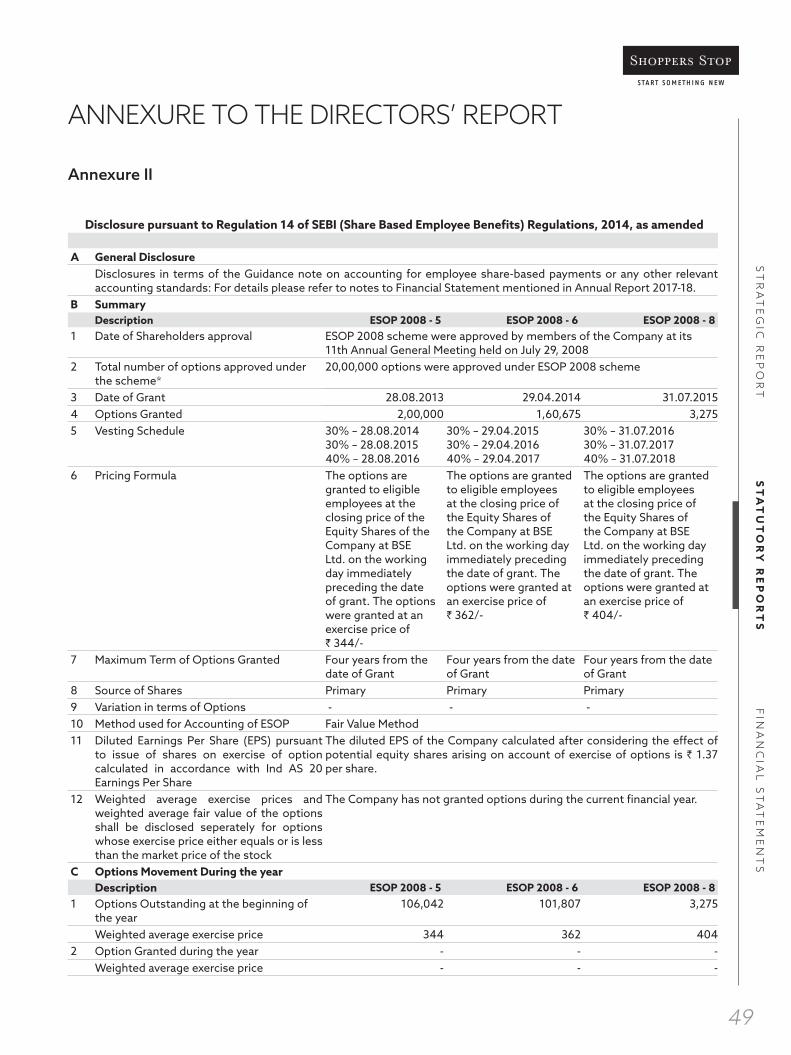
ST
RA
TE
GIC
RE
PO
RT
ST
AT
UT
OR
Y R
EP
OR
TS
FIN
AN
CIA
L S
TA
TE
ME
NT
S
49
Disclosure pursuant to Regulation 14 of SEBI (Share Based Employee Benefits) Regulations, 2014, as amended
A General DisclosureDisclosures in terms of the Guidance note on accounting for employee share-based payments or any other relevant accounting standards: For details please refer to notes to Financial Statement mentioned in Annual Report 2017-18.
B SummaryDescription ESOP 2008 - 5 ESOP 2008 - 6 ESOP 2008 - 8
1 Date of Shareholders approval ESOP 2008 scheme were approved by members of the Company at its 11th Annual General Meeting held on July 29, 2008
2 Total number of options approved under the scheme*
20,00,000 options were approved under ESOP 2008 scheme
3 Date of Grant 28.08.2013 29.04.2014 31.07.20154 Options Granted 2,00,000 1,60,675 3,2755 Vesting Schedule 30% – 28.08.2014
30% – 28.08.2015 40% – 28.08.2016
30% – 29.04.2015 30% – 29.04.2016 40% – 29.04.2017
30% – 31.07.2016 30% – 31.07.2017 40% – 31.07.2018
6 Pricing Formula The options are granted to eligible employees at the closing price of the Equity Shares of the Company at BSE Ltd. on the working day immediately preceding the date of grant. The options were granted at an exercise price of ` 344/-
The options are granted to eligible employees at the closing price of the Equity Shares of the Company at BSE Ltd. on the working day immediately preceding the date of grant. The options were granted at an exercise price of ` 362/-
The options are granted to eligible employees at the closing price of the Equity Shares of the Company at BSE Ltd. on the working day immediately preceding the date of grant. The options were granted at an exercise price of ` 404/-
7 Maximum Term of Options Granted Four years from the date of Grant
Four years from the date of Grant
Four years from the date of Grant
8 Source of Shares Primary Primary Primary9 Variation in terms of Options - - -10 Method used for Accounting of ESOP Fair Value Method11 Diluted Earnings Per Share (EPS) pursuant
to issue of shares on exercise of option calculated in accordance with Ind AS 20 Earnings Per Share
The diluted EPS of the Company calculated after considering the effect of potential equity shares arising on account of exercise of options is ` 1.37 per share.
12 Weighted average exercise prices and weighted average fair value of the options shall be disclosed seperately for options whose exercise price either equals or is less than the market price of the stock
The Company has not granted options during the current financial year.
C Options Movement During the yearDescription ESOP 2008 - 5 ESOP 2008 - 6 ESOP 2008 - 8
1 Options Outstanding at the beginning of the year
106,042 101,807 3,275
Weighted average exercise price 344 362 4042 Option Granted during the year - - -
Weighted average exercise price - - -
Annexure II
ANNEXURE TO THE DIRECTORS’ REPORT
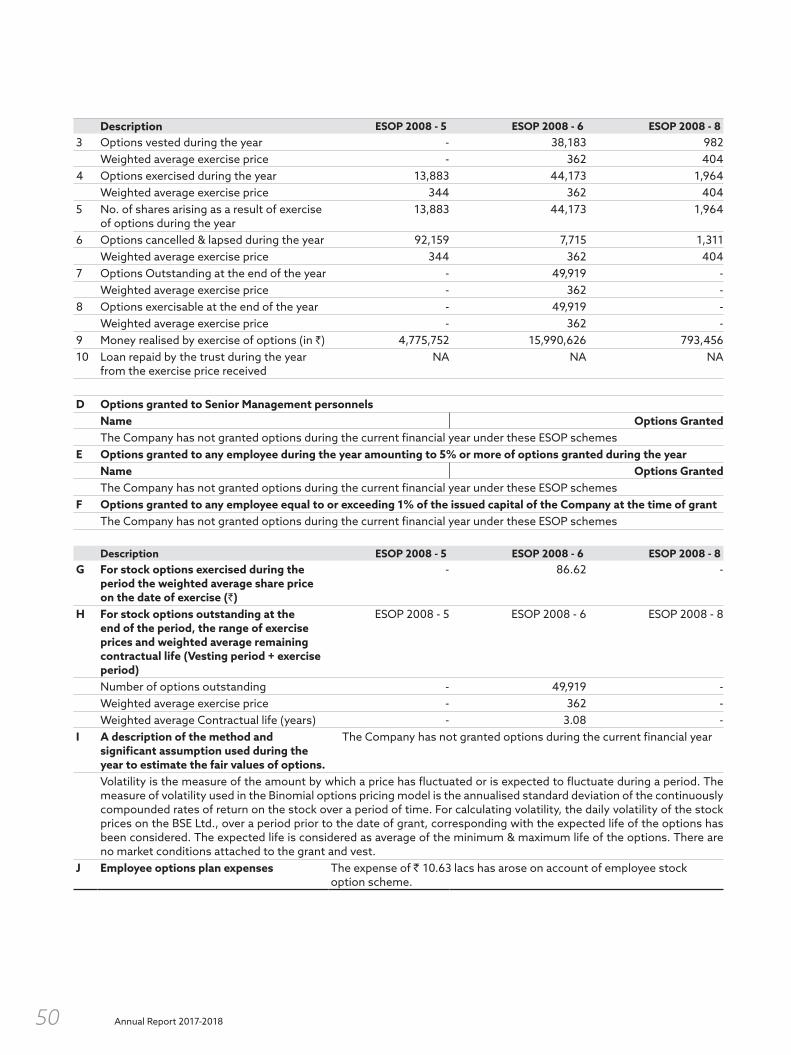
Annual Report 2017-201850
Description ESOP 2008 - 5 ESOP 2008 - 6 ESOP 2008 - 83 Options vested during the year - 38,183 982
Weighted average exercise price - 362 4044 Options exercised during the year 13,883 44,173 1,964
Weighted average exercise price 344 362 4045 No. of shares arising as a result of exercise
of options during the year 13,883 44,173 1,964
6 Options cancelled & lapsed during the year 92,159 7,715 1,311Weighted average exercise price 344 362 404
7 Options Outstanding at the end of the year - 49,919 -Weighted average exercise price - 362 -
8 Options exercisable at the end of the year - 49,919 -Weighted average exercise price - 362 -
9 Money realised by exercise of options (in `) 4,775,752 15,990,626 793,45610 Loan repaid by the trust during the year
from the exercise price receivedNA NA NA
D Options granted to Senior Management personnelsName Options GrantedThe Company has not granted options during the current financial year under these ESOP schemes
E Options granted to any employee during the year amounting to 5% or more of options granted during the yearName Options GrantedThe Company has not granted options during the current financial year under these ESOP schemes
F Options granted to any employee equal to or exceeding 1% of the issued capital of the Company at the time of grantThe Company has not granted options during the current financial year under these ESOP schemes
Description ESOP 2008 - 5 ESOP 2008 - 6 ESOP 2008 - 8G For stock options exercised during the
period the weighted average share price on the date of exercise (`)
- 86.62 -
H For stock options outstanding at the end of the period, the range of exercise prices and weighted average remaining contractual life (Vesting period + exercise period)
ESOP 2008 - 5 ESOP 2008 - 6 ESOP 2008 - 8
Number of options outstanding - 49,919 -Weighted average exercise price - 362 -Weighted average Contractual life (years) - 3.08 -
I A description of the method and significant assumption used during the year to estimate the fair values of options.
The Company has not granted options during the current financial year
Volatility is the measure of the amount by which a price has fluctuated or is expected to fluctuate during a period. The measure of volatility used in the Binomial options pricing model is the annualised standard deviation of the continuously compounded rates of return on the stock over a period of time. For calculating volatility, the daily volatility of the stock prices on the BSE Ltd., over a period prior to the date of grant, corresponding with the expected life of the options has been considered. The expected life is considered as average of the minimum & maximum life of the options. There are no market conditions attached to the grant and vest.
J Employee options plan expenses The expense of ` 10.63 lacs has arose on account of employee stock option scheme.

ST
RA
TE
GIC
RE
PO
RT
ST
AT
UT
OR
Y R
EP
OR
TS
FIN
AN
CIA
L S
TA
TE
ME
NT
S
51
Annexure III
ANNEXURE TO THE DIRECTORS’ REPORT
Annual Report on Corporate Social Responsibility (CSR) activities for the Financial Year 2017-18.
1 A brief outline of the Company’s CSR policy, including overview of projects or programmes proposed to be undertaken and a reference to the web-link to the CSR Policy and projects or programmes
The Company has framed the CSR Policy in compliance with provisions of the Companies Act, 2013. The same is placed on the website of the Company and link for the same ishttps://corporate.shoppersstop.com/uploaded_files/6a821c5-ec98.pdf
2 Composition of the CSR Committee Ms. Abanti Sankaranarayanan, Chairperson–Independent DirectorMr. Ravi C. Raheja, Non-Independent DirectorMr. Govind Shrikhande, Managing DirectorMr. BVM Rao, Head-HR as Secretary
3 Average Net Profit of the Company for last 3 financial years
` 4,200 lacs
4 Prescribed CSR Expenditure(2% of the amount as in item 3 above) ` 84 lacs
5 Details of CSR spent during the financial year:(a) Total Amount to be spent for the financial year;(b) Amount unspent, if any;(c) Manner in which the amount spent during the
financial year is detailed below
` 84 lacs-The Company’s CSR initiative has 3 strategic pillars of Skilling the disabled, Fashion re-cycling and Go Green initiative. Under the skilling initiative, the Company has trained 528 PWDs and of these 380 PWDs were placed in employment. Under the Go Green, the Company has initiated recycling of pet bottles. The brief details thereof are as under:
(` in lacs)(1) (2) (3) (4) (5) (6) (7) (8)S. No.
CSR project or activity identified
Sector in which the Project is covered
Projects or programmes:1. Local area or other2. Specify the state and
district where projects or programmes were undertaken
Amount outlay (budget) project or programmes wise
Amount Spent on the Projects or programmesSub-Heads:(1) Direct
Expenditure(2) Overhead
Cumulative expenditure up to the reporting period
Amount spent:Director through implementing agency
1 Livelihood creation for persons with disabilities (Employment linked training)
Retail Gujarat, Maharashtra, Andhra Pradesh,
KarnatakaPunjab, NCR Delhi
64 64 64 Total amount spent through Implementing
Agency
2 Ensuring Environment sustainability(Swachh Bharat)
Retail Maharashtra 20 20 20Total amount spent directly
by the Company
3 Reasons for not spending the amount NA4 The CSR Committee confirms that the implementation and monitoring of CSR Policy, is in compliance with CSR
objectives and Policy of the Company.
Sd/-Govind Shrikhande
Sd/-Abanti Sankaranarayanan
April 27, 2018 Managing Director Chairperson – CSR Committee
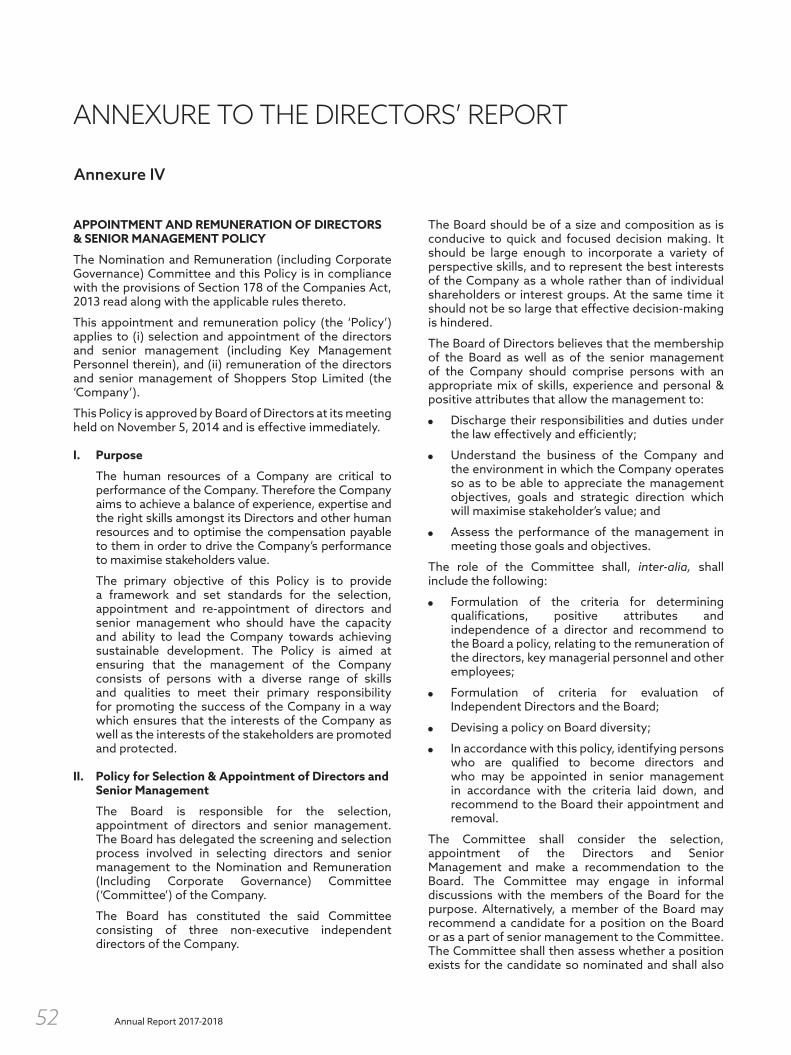
Annual Report 2017-201852
Annexure IV
ANNEXURE TO THE DIRECTORS’ REPORT
APPOINTMENT AND REMUNERATION OF DIRECTORS & SENIOR MANAGEMENT POLICY
The Nomination and Remuneration (including Corporate Governance) Committee and this Policy is in compliance with the provisions of Section 178 of the Companies Act, 2013 read along with the applicable rules thereto.
This appointment and remuneration policy (the ‘Policy’) applies to (i) selection and appointment of the directors and senior management (including Key Management Personnel therein), and (ii) remuneration of the directors and senior management of Shoppers Stop Limited (the ‘Company’).
This Policy is approved by Board of Directors at its meeting held on November 5, 2014 and is effective immediately.
I. Purpose
The human resources of a Company are critical to performance of the Company. Therefore the Company aims to achieve a balance of experience, expertise and the right skills amongst its Directors and other human resources and to optimise the compensation payable to them in order to drive the Company’s performance to maximise stakeholders value.
The primary objective of this Policy is to provide a framework and set standards for the selection, appointment and re-appointment of directors and senior management who should have the capacity and ability to lead the Company towards achieving sustainable development. The Policy is aimed at ensuring that the management of the Company consists of persons with a diverse range of skills and qualities to meet their primary responsibility for promoting the success of the Company in a way which ensures that the interests of the Company as well as the interests of the stakeholders are promoted and protected.
II. Policy for Selection & Appointment of Directors and Senior Management
The Board is responsible for the selection, appointment of directors and senior management. The Board has delegated the screening and selection process involved in selecting directors and senior management to the Nomination and Remuneration (Including Corporate Governance) Committee (‘Committee’) of the Company.
The Board has constituted the said Committee consisting of three non-executive independent directors of the Company.
The Board should be of a size and composition as is conducive to quick and focused decision making. It should be large enough to incorporate a variety of perspective skills, and to represent the best interests of the Company as a whole rather than of individual shareholders or interest groups. At the same time it should not be so large that effective decision-making is hindered.
The Board of Directors believes that the membership of the Board as well as of the senior management of the Company should comprise persons with an appropriate mix of skills, experience and personal & positive attributes that allow the management to:
Discharge their responsibilities and duties under the law effectively and efficiently;
Understand the business of the Company and the environment in which the Company operates so as to be able to appreciate the management objectives, goals and strategic direction which will maximise stakeholder’s value; and
Assess the performance of the management in meeting those goals and objectives.
The role of the Committee shall, inter-alia, shall include the following:
Formulation of the criteria for determining qualifications, positive attributes and independence of a director and recommend to the Board a policy, relating to the remuneration of the directors, key managerial personnel and other employees;
Formulation of criteria for evaluation of Independent Directors and the Board;
Devising a policy on Board diversity;
In accordance with this policy, identifying persons who are qualified to become directors and who may be appointed in senior management in accordance with the criteria laid down, and recommend to the Board their appointment and removal.
The Committee shall consider the selection, appointment of the Directors and Senior Management and make a recommendation to the Board. The Committee may engage in informal discussions with the members of the Board for the purpose. Alternatively, a member of the Board may recommend a candidate for a position on the Board or as a part of senior management to the Committee. The Committee shall then assess whether a position exists for the candidate so nominated and shall also

ST
RA
TE
GIC
RE
PO
RT
ST
AT
UT
OR
Y R
EP
OR
TS
FIN
AN
CIA
L S
TA
TE
ME
NT
S
53
evaluate whether the nominated candidate meets the criteria and is suitable for the position.
In evaluating the necessity to appoint a director on the Board (whether by increasing the strength of the Board or on account of retirement of an existing director or otherwise), or on whether to appoint a person to senior management, due consideration should be given to the following:
Assess the management’s current skills, experience and expertise to identify the skills that may be lacking or the skills that would best increase the effectiveness of the management as well as that of the Company;
Assess the needs of the business currently and going forward. The Board and senior management should be structured in a manner it has proper understanding of and competence to deal with the current and emerging business issues;
The extent to which the candidate is likely to contribute to the overall effectiveness of the Board and senior management; as the case may be and work constructively with the existing management;
The skills and experience that the candidate shall bring to the role and how he will enhance the skill sets and experience of the management as a whole.
Independence of such candidate under the provisions of the Companies Act, 2013 and Listing Agreement, if and as may be applicable.
Accordingly, in selecting and recommending potential new director and member of senior management and analysing renewal of the term of existing directors, the Committee should identity the competencies required to enable the Board and senior management to fulfil their respective responsibilities within the framework of the overall objectives and goals of the Company and wherever applicable, should also have regard to the results of the annual appraisals of the relevant person’s past performance, whether on the Board of the Company or elsewhere.
While any individual person may not necessarily fulfil all criteria, in evaluating and recommending the candidature of a candidate, regard shall be had to the following criteria, skills and personal attributes:
Outstanding in capability with extensive and varied senior commercial experience, preferably with a listed Company engaged in the business of retail;
High level of honesty, personal integrity and probity;
Degree/professional qualification inter-alia in the field of management, finance, accounting, technology or law;
Strategic capability with business vision and track record of achievement;
Entrepreneurial spirit;
Expertise/experience inter-alia in technology, accounting and finance, administration, retail, corporate and strategic planning, human resources etc.;
Ability to be independent and capable of lateral thinking;
Excellent interpersonal, communication and representational skills and established/ demonstrable leadership qualities;
Commitment to the promotion of equal opportunities, community cohesion and health and safety at work place;
Have a reasonable network of contacts relative to the business of the Company;
Availability of time to discharge the duties as a director of the Company including the other commitments of the candidate that require significant time commitments of the candidate.
If the candidate is found suitable, the Committee shall recommend the candidate to the Board for appointment as director or Senior Management, as the case may be.
The re-appointment of directors shall not be automatic. A Director who retires at an annual general meeting may, if willing to act, be re-appointed and is subject to the selection and appointment procedures outlined above. The re-election shall also be dependent upon the evaluation of such directors’ performance by the Board.
The Committee may engage recruitment consultants as and when required to undertake search for new candidates for new positions on the Board or senior management and/or may consult other independent experts where it considers necessary to carry out its duties and responsibilities.
III. Evaluation of Directors and senior management
The performance of each Director (Independent and Non-Independent) and member of senior management shall be reviewed on an annual basis by the Committee, who may use such external support as may be required to undertake such reviews.
The performance of each Director (Whether Independent or Non-Independent) and member of senior management shall be evaluated annually against the Goal Sheet as may be decided by the Board from time to time. The Committee shall discuss the findings of the evaluation and give its recommendation to the Board in this regard. However, the actual evaluation shall remain confidential and shall be a constructive mechanism to improve the effectiveness of the Board.
IV. Policy for remuneration of the directors and members of senior management
The objective of the Company’s remuneration policy is to attract, motivate and retain qualified and
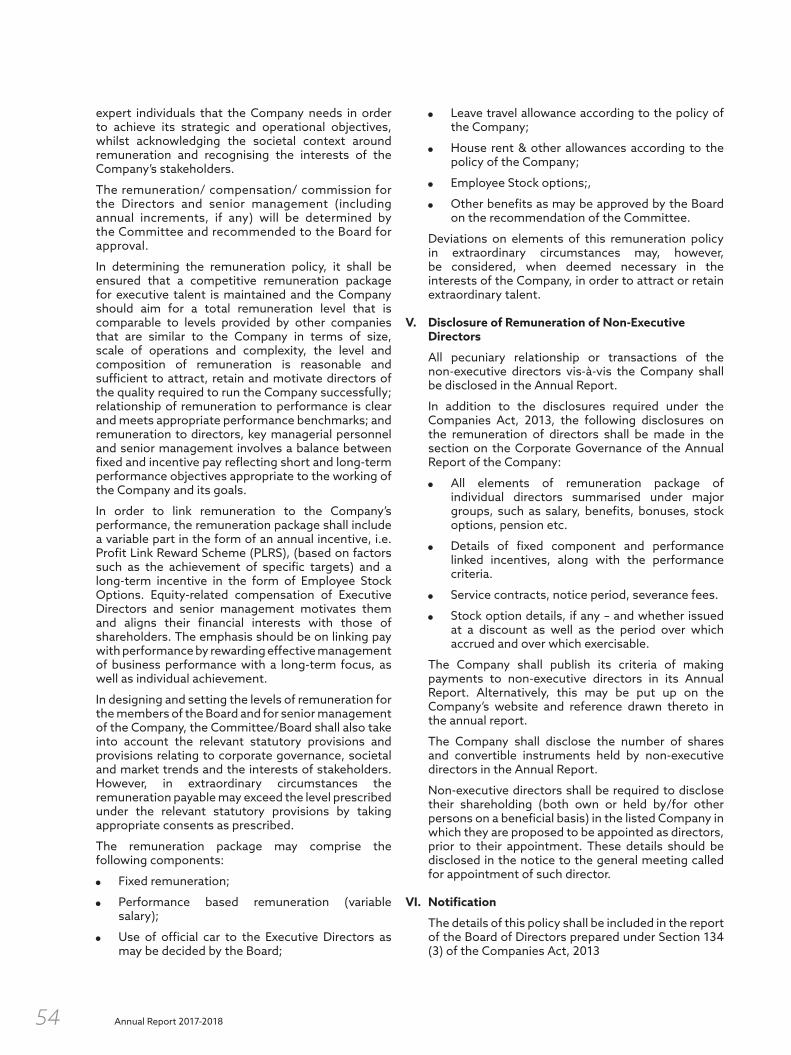
Annual Report 2017-201854
expert individuals that the Company needs in order to achieve its strategic and operational objectives, whilst acknowledging the societal context around remuneration and recognising the interests of the Company’s stakeholders.
The remuneration/ compensation/ commission for the Directors and senior management (including annual increments, if any) will be determined by the Committee and recommended to the Board for approval.
In determining the remuneration policy, it shall be ensured that a competitive remuneration package for executive talent is maintained and the Company should aim for a total remuneration level that is comparable to levels provided by other companies that are similar to the Company in terms of size, scale of operations and complexity, the level and composition of remuneration is reasonable and sufficient to attract, retain and motivate directors of the quality required to run the Company successfully; relationship of remuneration to performance is clear and meets appropriate performance benchmarks; and remuneration to directors, key managerial personnel and senior management involves a balance between fixed and incentive pay reflecting short and long-term performance objectives appropriate to the working of the Company and its goals.
In order to link remuneration to the Company’s performance, the remuneration package shall include a variable part in the form of an annual incentive, i.e. Profit Link Reward Scheme (PLRS), (based on factors such as the achievement of specific targets) and a long-term incentive in the form of Employee Stock Options. Equity-related compensation of Executive Directors and senior management motivates them and aligns their financial interests with those of shareholders. The emphasis should be on linking pay with performance by rewarding effective management of business performance with a long-term focus, as well as individual achievement.
In designing and setting the levels of remuneration for the members of the Board and for senior management of the Company, the Committee/Board shall also take into account the relevant statutory provisions and provisions relating to corporate governance, societal and market trends and the interests of stakeholders. However, in extraordinary circumstances the remuneration payable may exceed the level prescribed under the relevant statutory provisions by taking appropriate consents as prescribed.
The remuneration package may comprise the following components:
Fixed remuneration;
Performance based remuneration (variable salary);
Use of official car to the Executive Directors as may be decided by the Board;
Leave travel allowance according to the policy of the Company;
House rent & other allowances according to the policy of the Company;
Employee Stock options;,
Other benefits as may be approved by the Board on the recommendation of the Committee.
Deviations on elements of this remuneration policy in extraordinary circumstances may, however, be considered, when deemed necessary in the interests of the Company, in order to attract or retain extraordinary talent.
V. Disclosure of Remuneration of Non-Executive Directors
All pecuniary relationship or transactions of the non-executive directors vis-à-vis the Company shall be disclosed in the Annual Report.
In addition to the disclosures required under the Companies Act, 2013, the following disclosures on the remuneration of directors shall be made in the section on the Corporate Governance of the Annual Report of the Company:
All elements of remuneration package of individual directors summarised under major groups, such as salary, benefits, bonuses, stock options, pension etc.
Details of fixed component and performance linked incentives, along with the performance criteria.
Service contracts, notice period, severance fees.
Stock option details, if any – and whether issued at a discount as well as the period over which accrued and over which exercisable.
The Company shall publish its criteria of making payments to non-executive directors in its Annual Report. Alternatively, this may be put up on the Company’s website and reference drawn thereto in the annual report.
The Company shall disclose the number of shares and convertible instruments held by non-executive directors in the Annual Report.
Non-executive directors shall be required to disclose their shareholding (both own or held by/for other persons on a beneficial basis) in the listed Company in which they are proposed to be appointed as directors, prior to their appointment. These details should be disclosed in the notice to the general meeting called for appointment of such director.
VI. Notification
The details of this policy shall be included in the report of the Board of Directors prepared under Section 134 (3) of the Companies Act, 2013

ST
RA
TE
GIC
RE
PO
RT
ST
AT
UT
OR
Y R
EP
OR
TS
FIN
AN
CIA
L S
TA
TE
ME
NT
S
55
EXTRACT OF ANNUAL RETURNAs on the financial year ended on March 31, 2018
[Pursuant to Section 92(3) of the Companies Act, 2013 and Rule 12(1) of the Companies (Management & Administration) Rules, 2014]
FORM MGT-9
I REGISTRATION & OTHER DETAILSi CIN L51900MH1997PLC108798ii Registration Date June 16, 1997iii Name of the Company Shoppers Stop Limitediv Category/Sub-category of the Company Company Limited by Shares/Indian Non-Government Companyv Address of the Registered office & contact details Umang Tower, 5th Floor, Mindspace, Off Link Road,
Malad (West), Mumbai - 400 064.Tel: 022-4249 7000E-mail: [email protected]: www.shoppersstop.com
vi Whether listed company Yesvii Name, Address & Contact details of the Registrar &
Transfer Agent, if anyKarvy Computershare Private LimitedKarvy Selenium, Tower B, Plot 31-32, Gachibowli,Financial District, Nanakramguda, Hyderabad – 500 032.Tel: 040 - 6716 1500E-mail: [email protected]
II PRINCIPAL BUSINESS ACTIVITIES OF THE COMPANY
All the business activities contributing 10% or more of the total turnover of the Company shall be stated:-Sr. No.
Name & Description of main products/services NIC Code of the Product/service* % to total turnover of the Company
1 Apparels 477 63.10%2 Non-Appearels 477 36.90%*As per National Industrial Classification – Ministry of Statistics and Programme implementation.
III PARTICULARS OF HOLDING, SUBSIDIARY & ASSOCIATE COMPANIES
Sr. No.
Name & Address of the Company CINHolding/
Subsidiary/ Associate
% of Shares
heldApplicable Section
1 Crossword Bookstores Ltd.Umang Tower, 2nd Floor, Mindspace, Off Link Road, Malad (West), Mumbai - 400 064.
U52396MH1999PLC122528 Subsidiary Company
100 Section 2(87) of the Companies Act, 2013
2 Shoppers' Stop.Com (India) Ltd.Umang Tower, 5th Floor, Mindspace, Off Link Road, Malad (West), Mumbai - 400 064.
U72900MH2000PLC124178 Subsidiary Company
100 Section 2(87) of the Companies Act, 2013
3 Shopper's Stop Services (India) Ltd.Umang Tower, 5th Floor, Mindspace, Off Link Road, Malad (West), Mumbai - 400 064.
U74999MH2000PLC124945 Subsidiary Company
100 Section 2(87) of the Companies Act, 2013
4 Upasna Trading Ltd.Umang Tower, 5th Floor, Mindspace, Off Link Road, Malad (West), Mumbai - 400 064.
U51900MH1995PLC095115 Subsidiary Company
100 Section 2(87) of the Companies Act, 2013
5 Gateway Multichannel Retail (India) Ltd.Umang Tower, 5th Floor, Mindspace, Off Link Road, Malad (West), Mumbai - 400 064.
U52100MH2007PLC170243 Subsidiary Company
100 Section 2(87) of the Companies Act, 2013
Annexure V
ANNEXURE TO THE DIRECTORS’ REPORT

Annual Report 2017-201856
IV
SHA
REH
OLD
ING
PA
TT
ERN
(EQ
UIT
Y S
HA
RE
CA
PITA
L BR
EAK
UP
AS
% O
F TO
TAL
EQU
ITY
)
(i)
Cat
egor
y-w
ise
Shar
e H
oldi
ng
Cat
egor
y of
Sha
reho
lder
s
No.
of S
hare
s he
ld a
t the
beg
inni
ng o
f the
yea
r (i
.e. a
s on
Apr
il 1,
201
7)N
o. o
f Sha
res
held
at t
he e
nd o
f the
yea
r (i
.e. a
s on
Mar
ch 3
1, 2
018)
% c
hang
e du
ring
the
year
Dem
atPh
ysic
alTo
tal
% o
f Tot
al
Shar
esD
emat
Phys
ical
Tota
l%
of T
otal
Sh
ares
A.
PRO
MO
TER
S(1
) In
dian
a)
Indi
vidu
al/H
UF
3,6
95,0
000
3,6
95,0
004.
43 3
,695
,000
0 3
,695
,000
4.20
(0.2
3)b)
C
entr
al G
over
nmen
t/St
ate
Gov
ernm
ent(
s)0
00
00
00
0.00
0.00
c)
Bodi
es C
orpo
rate
s 5
2,33
4,67
40
52,
334,
674
62.6
7 5
2,33
4,67
40
52,
334,
674
59.5
0(3
.17)
d)
Fina
ncia
l Ins
titut
ions
/Ban
ks0
00
00
00
0.00
0.00
e)
Oth
ers
00
00
00
00.
000.
00SU
B-TO
TAL:
(A) (
1) 5
6,02
9,67
40
56,
029,
674
67.
10 5
6,02
9,67
40
56,
029,
674
63.7
0(3
.40)
(2)
Fore
ign
a)
Indi
vidu
als
(NR
Is/F
orei
gn In
divi
dual
s)0
00
0.00
00
00.
000.
00b)
Bo
dies
Cor
pora
te0
00
0.00
00
00.
000.
00c)
In
stitu
tions
00
00.
000
00
0.00
0.00
d)
Oth
ers
00
00.
000
00
0.00
0.00
SUB-
TOTA
L: (A
) (2)
00
00.
000
00
0.00
0.00
Tota
l Sha
reho
ldin
g of
Pro
mot
er *
(A)=
(A)(
1)+(
A)(
2) 5
6,02
9,67
40
56,
029,
674
67.1
0 5
6,02
9,67
40
56,
029,
674
63.7
0(3
.40)
B.
PUBL
IC S
HA
REH
OLD
ING
(1)
Inst
itut
ions
a)
Mut
ual F
unds
/UTI
11,
159,
066
0 1
1,15
9,06
613
.36
12,
452,
958
0 1
2,45
2,95
814
.16
0.79
b)
Fina
ncia
l Ins
titut
ions
/Ban
ks 2
,461
0 2
,461
0.00
11,
611
0 1
1,61
10.
010.
01c)
C
entr
al G
over
nmen
t/St
ate
Gov
ernm
ent(
s)0
00
0.00
00
00.
000.
00d)
Ve
ntur
e C
apita
l Fun
ds0
00
0.00
00
00.
000.
00e)
In
sura
nce
Com
pani
es0
00
0.00
00
00.
000.
00f)
Fo
reig
n In
stitu
tiona
l Inv
esto
rs/F
orei
gn
Po
rtfo
lio In
vest
ors
3,4
66,9
470
3,4
66,9
474.
15 8
,082
,545
0 8
,082
,545
9.19
5.04
g)
Fore
ign
vent
ure
Cap
ital I
nves
tors
00
00.
000
0 0
0.00
0.00
h)
Oth
ers
00
00.
000
0 0
0.00
0.00
Alte
rnat
e In
vest
men
t Fun
ds0
00
0.00
47,3
000
47,
300
0.05
0.05
SUB-
TOTA
L (B
)(1)
: 1
4,6
28,4
740
14
,628
,474
17.5
1 2
0,59
4,4
140
20,
594
,414
23.4
15.
90

ST
RA
TE
GIC
RE
PO
RT
ST
AT
UT
OR
Y R
EP
OR
TS
FIN
AN
CIA
L S
TA
TE
ME
NT
S
57
Cat
egor
y of
Sha
reho
lder
s
No.
of S
hare
s he
ld a
t the
beg
inni
ng o
f the
yea
r (i
.e. a
s on
Apr
il 1,
201
7)N
o. o
f Sha
res
held
at t
he e
nd o
f the
yea
r (i
.e. a
s on
Mar
ch 3
1, 2
018)
% c
hang
e du
ring
the
year
Dem
atPh
ysic
alTo
tal
% o
f Tot
al
Shar
esD
emat
Phys
ical
Tota
l%
of T
otal
Sh
ares
(2)
Non
-Inst
itut
ions
a)
Bodi
es c
orpo
rate
s 9
,768
,665
0 9
,768
,665
11.7
0 7
,954
,431
0 7
,954
,431
9.04
(2.6
6)b)
In
divi
dual
si)
In
divi
dual
sha
reho
lder
s ho
ldin
g no
min
al
shar
e ca
pita
l upt
o `
1 la
c 1
,041
,179
322
1,0
41,5
011.
25 1
,431
,593
322
1,4
31,9
151.
630.
38
ii)
Indi
vidu
als
shar
ehol
ders
hol
ding
nom
inal
sh
are
capi
tal i
n ex
cess
of `
1 la
c 1
,502
,387
0 1
,502
,387
1.80
1,4
41,9
870
1,4
41,9
871.
64(0
.16)
c)
Oth
ers
Non
-res
iden
t Ind
ians
/For
eign
Nat
iona
ls 4
4,11
00
44,
110
0.05
89,
515
0 8
9,51
50.
100.
05
C
lear
ing
Mem
bers
31,
170
0 3
1,17
00.
04 5
7,59
20
57,
592
0.07
0.03
Trus
ts 3
03,6
360
303
,636
0.36
191
,319
0 1
91,3
190.
22(0
.15)
NBF
Cs
Regi
ster
ed w
ith R
BI 1
40,2
950
140
,295
0.17
128
,728
0 1
28,7
280.
15(0
.02)
H U
F 1
4,83
20
14,
832
0.02
40,
380
0 4
0,38
00.
050.
03
I E
P F
00
00.
00 7
340
734
0.00
0.00
SUB-
TOTA
L (B
)(2)
: 1
2,84
6,27
4 3
22 1
2,84
6,59
615
.39
11,
336,
279
322
11,
336,
601
12.8
9(2
.50)
Tota
l Pub
lic S
hare
hold
ing
(B)=
(B)(
1)+(
B)(2
) 2
7,4
74,7
48
322
27,
475
,070
32.9
0 3
1,93
0,69
3 3
22 3
1,93
1,01
536
.30
3.4
0
C.
Shar
es h
eld
by C
usto
dian
for G
DR
s &
AD
Rs
- -
- -
- -
- -
-G
rand
Tot
al (A
+B+C
)83
,504
,422
322
83,
504
,74
4 1
00.0
0 8
7,96
0,36
7 3
22 8
7,96
0,68
910
0.00
0.00
* Th
ere
is n
o ch
ange
in th
e to
tal n
umbe
r of s
hare
s he
ld b
y th
e pr
omot
ers
of th
e C
ompa
ny. H
owev
er th
e pe
rcen
tage
of t
he s
hare
hold
ing
has
chan
ged
durin
g th
e ye
ar
due
to a
llotm
ent o
f 4,3
95,9
25 e
quity
sha
res
to A
maz
on.c
om N
V In
vest
men
t Hol
ding
s LL
C, a
non
-pro
mot
er e
ntity
on
a pr
ivat
e pl
acem
ent b
asis
and
allo
tmen
t of 6
0,02
0 eq
uity
sha
res
due
to e
xerc
ise
of E
mpl
oyee
Sto
ck O
ptio
ns b
y em
ploy
ees.

Annual Report 2017-201858
(ii)
Sha
re H
oldi
ng o
f Pro
mot
ers
Sr.
No.
Shar
ehol
ders
Nam
e*
Shar
ehol
ding
at t
he b
egin
ning
of t
he y
ear
(i.e.
as
on A
pril
1, 2
017)
Shar
ehol
ding
at t
he e
nd o
f the
yea
r (i.
e. a
s on
Mar
ch 3
1, 2
018)
% c
hang
e in
sha
re
hold
ing
durin
g th
e ye
ar
No.
of
shar
es
% o
f tot
al
shar
es o
f the
C
ompa
ny
No.
of
shar
es
pled
ged
% o
f sha
res
pled
ged/
encu
mbe
red
to to
tal
shar
es
No.
of
shar
es
% o
f tot
al
shar
es o
f the
C
ompa
ny
No.
of
shar
es
pled
ged
% o
f sha
res
pled
ged/
encu
mbe
red
to to
tal
shar
es1
Palm
She
lter E
stat
e D
evel
opm
ent L
LP 1
1,81
3,30
0 1
4.15
00.
00 1
1,81
3,30
0 1
3.43
00.
00 (0
.72)
2Ra
ghuk
ool E
stat
e D
evel
opem
ent L
LP5,
593,
300
6.7
00
0.00
5,59
3,30
0 6
.36
00.
00 (0
.34)
3C
apst
an T
radi
ng L
LP5,
459,
768
6.5
40
0.00
5,45
9,76
8 6
.21
00.
00 (0
.33)
4C
asa
Mar
ia P
rope
rtie
s LL
P5,
253,
300
6.2
90
0.00
5,25
3,30
0 5
.97
00.
00 (0
.32)
5A
nbee
Con
stru
ctio
ns L
LP10
,386
,401
12.
440
0.00
10,3
86,4
01 1
1.81
00.
00 (0
.63)
6C
ape
Trad
ing
LLP
10,3
86,4
01 1
2.44
00.
0010
,386
,401
11.
810
0.00
(0.6
3)7
K Ra
heja
Cor
p Pr
ivat
e Li
mite
d3,
382,
204
4.0
5 3
,382
,204
100.
003,
382,
204
3.8
53,
382,
204
100.
00(0
.20)
8N
eel C
. Rah
eja
1,1
50,0
00 1
.38
1,1
50,0
0010
0.00
1,1
50,0
00 1
.31
1,1
50,0
0010
0.00
(0.0
7)9
Ravi
C. R
ahej
a 1
,100
,000
1.3
2 1
,100
,000
100.
00 1
,100
,000
1.2
5 1
,100
,000
100.
00 (0
.07)
10Jy
oti C
. Rah
eja
747
,500
0.9
0 7
47,5
0010
0.00
747
,500
0.8
5 7
47,5
0010
0.00
(0.0
5)11
Cha
ndru
L. R
ahej
a 6
97,5
00 0
.84
697
,500
100.
00 6
97,5
00 0
.79
697
,500
100.
00 (0
.04)
12In
orbi
t Mal
ls (I
ndia
) Priv
ate
Lim
ited
20,
000
0.0
20
0.00
20,
000
0.0
20
0.00
(0.0
0)13
Ivor
y Pr
oper
ties
and
Hot
els
Pvt.
Ltd
. 2
0,00
0 0
.02
00.
00 2
0,00
0 0
.02
00.
00 (0
.00)
14K.
Rah
eja
Priv
ate
Lim
ited
20,
000
0.0
20
0.00
20,
000
0.0
20
0.00
(0.0
0)To
tal
56,
029,
674
67.
10 7
,077
,204
12.6
3 5
6,02
9,67
4 6
3.70
7,0
77,2
0412
.63
(3.4
0)
* Th
ere
is n
o ch
ange
in th
e to
tal n
umbe
r of s
hare
s he
ld b
y th
e pr
omot
ers
of th
e C
ompa
ny. H
owev
er, t
he p
erce
ntag
e of
the
shar
ehol
ding
has
cha
nged
dur
ing
the
year
du
e to
allo
tmen
t of 4
,395
,925
equ
ity s
hare
s to
Am
azon
.com
NV
Inve
stm
ent H
oldi
ngs
LLC
, a n
on-p
rom
oter
ent
ity, o
n a
priv
ate
plac
emen
t bas
is a
nd a
llotm
ent o
f 60,
020
equi
ty s
hare
s du
e to
exe
rcis
e of
Em
ploy
ee S
tock
Opt
ions
by
empl
oyee
s.

ST
RA
TE
GIC
RE
PO
RT
ST
AT
UT
OR
Y R
EP
OR
TS
FIN
AN
CIA
L S
TA
TE
ME
NT
S
59
(iii) Change in Promoters’ Shareholding
There is no change in the Promoter’s Shareholding. However, the percentage of the shareholding has changed during the year due to allotment of 4,395,925 equity shares to Amazon.com NV Investment Holdings LLC, a non-promoter entity, on a private placement basis and allotment of 60,020 equity shares due to exercise of Employee Stock Options by employees.
(iv) Shareholding Pattern of top ten Shareholders (other than Directors, Promoters & Holders of GDRs& ADRs)
Sr. No.
Name
Shareholding at the beginning of the year
Date-wise Increase/Decrease in Share holding during the year
Cumulative Shareholding during the year
No. of shares
% of total shares of the
CompanyDate Reason
No. of Shares
No. of Shares
% of totalshares of the
Company1 RELIANCE CAPITAL TRUSTEE
CO. LTD. 7,774,905 9.31 01/04/2017 - - 7,774,905 9.31
26/05/2017 Sale -29,200 7,745,705 9.2809/06/2017 Sale -200,000 7,545,705 9.0407/07/2017 Purchase 44,100 7,589,805 9.0914/07/2017 Purchase 30,000 7,619,805 9.1221/07/2017 Sale -14,200 7,605,605 9.1104/08/2017 Purchase 35,000 7,640,605 9.1511/08/2017 Purchase 30,000 7,670,605 9.1918/08/2017 Purchase 10,000 7,680,605 9.2025/08/2017 Purchase 10,000 7,690,605 9.2108/09/2017 Sale -164,212 7,526,393 9.0115/09/2017 Sale -91,543 7,434,850 8.9012/01/2018 Sale -61,347 7,373,503 8.8319/01/2018 Sale -38,444 7,335,059 8.3409/02/2018 Sale -217,000 7,118,059 8.0902/03/2018 Sale -300,000 6,818,059 7.7509/03/2018 Sale -446,600 6,371,459 7.2416/03/2018 Sale -17,069 6,354,390 7.2223/03/2018 Sale -7,899 6,346,491 7.22 31/03/2018 - - 6,346,491 7.22
2 AMAZON.COM NV INVESTMENT HOLDINGS LLC
- - 01/04/2017 - - - -12/01/2018 Preferential
Allotment4,395,925 4,395,925 5.00
31/03/2018 - - 4,395,925 5.003 ICICI PRUDENTIAL LIFE
INSURANCE COMPANY LIMITED
3,718,947 4.45 01/04/2017 - - 3,718,947 4.4507/07/2017 Sale -39,467 3,679,480 4.4114/07/2017 Sale -28,714 3,650,766 4.3704/08/2017 Sale -35,827 3,614,939 4.3301/09/2017 Sale -191,182 3,423,757 4.1008/09/2017 Sale -60,626 3,363,131 4.0322/09/2017 Sale -4,231 3,358,900 4.0229/09/2017 Sale -29,196 3,329,704 3.9906/10/2017 Sale -30,000 3,299,704 3.9513/10/2017 Sale -136,297 3,163,407 3.7920/10/2017 Sale -236,742 2,926,665 3.5027/10/2017 Purchase 42 2,926,707 3.5003/11/2017 Sale -89,402 2,837,305 3.4010/11/2017 Sale -105,721 2,731,584 3.2701/12/2017 Purchase 94 2,731,678 3.2708/12/2017 Sale -3,096 2,728,582 3.2722/12/2017 Sale -50,558 2,678,024 3.2105/01/2018 Sale -529 2,677,495 3.20
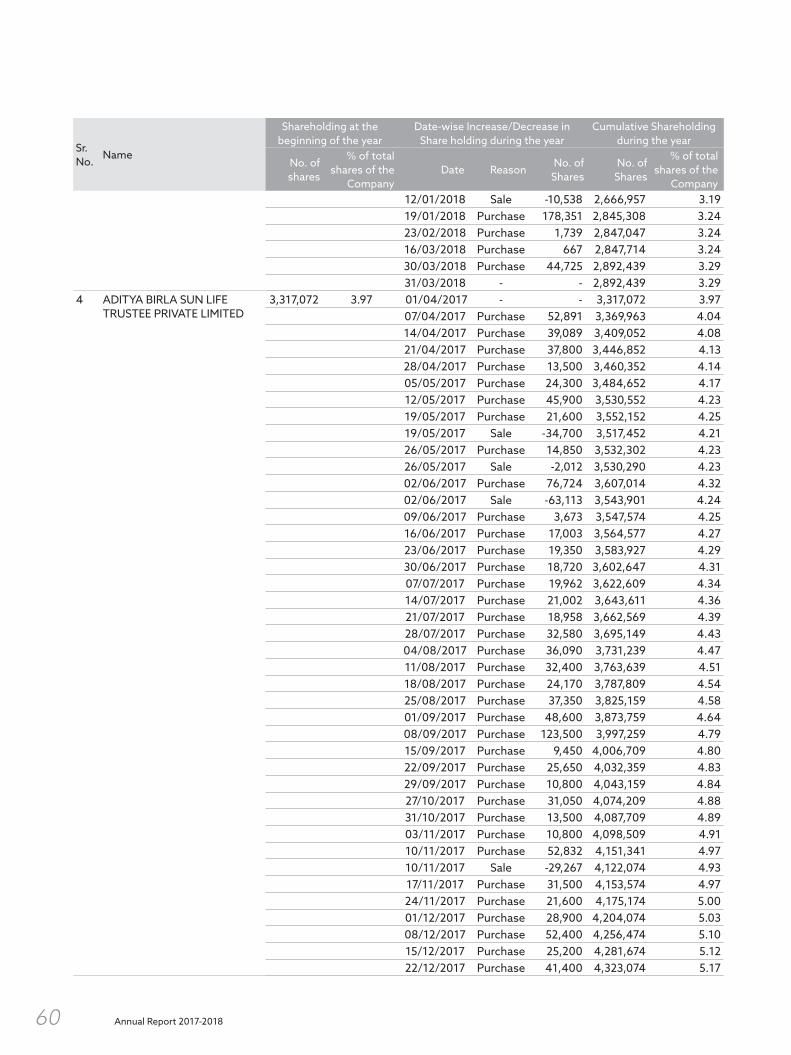
Annual Report 2017-201860
Sr. No.
Name
Shareholding at the beginning of the year
Date-wise Increase/Decrease in Share holding during the year
Cumulative Shareholding during the year
No. of shares
% of total shares of the
CompanyDate Reason
No. of Shares
No. of Shares
% of totalshares of the
Company12/01/2018 Sale -10,538 2,666,957 3.1919/01/2018 Purchase 178,351 2,845,308 3.2423/02/2018 Purchase 1,739 2,847,047 3.2416/03/2018 Purchase 667 2,847,714 3.2430/03/2018 Purchase 44,725 2,892,439 3.2931/03/2018 - - 2,892,439 3.29
4 ADITYA BIRLA SUN LIFE TRUSTEE PRIVATE LIMITED
3,317,072 3.97 01/04/2017 - - 3,317,072 3.9707/04/2017 Purchase 52,891 3,369,963 4.0414/04/2017 Purchase 39,089 3,409,052 4.0821/04/2017 Purchase 37,800 3,446,852 4.1328/04/2017 Purchase 13,500 3,460,352 4.1405/05/2017 Purchase 24,300 3,484,652 4.1712/05/2017 Purchase 45,900 3,530,552 4.2319/05/2017 Purchase 21,600 3,552,152 4.2519/05/2017 Sale -34,700 3,517,452 4.2126/05/2017 Purchase 14,850 3,532,302 4.2326/05/2017 Sale -2,012 3,530,290 4.2302/06/2017 Purchase 76,724 3,607,014 4.3202/06/2017 Sale -63,113 3,543,901 4.2409/06/2017 Purchase 3,673 3,547,574 4.2516/06/2017 Purchase 17,003 3,564,577 4.2723/06/2017 Purchase 19,350 3,583,927 4.2930/06/2017 Purchase 18,720 3,602,647 4.3107/07/2017 Purchase 19,962 3,622,609 4.3414/07/2017 Purchase 21,002 3,643,611 4.3621/07/2017 Purchase 18,958 3,662,569 4.3928/07/2017 Purchase 32,580 3,695,149 4.4304/08/2017 Purchase 36,090 3,731,239 4.4711/08/2017 Purchase 32,400 3,763,639 4.5118/08/2017 Purchase 24,170 3,787,809 4.5425/08/2017 Purchase 37,350 3,825,159 4.5801/09/2017 Purchase 48,600 3,873,759 4.6408/09/2017 Purchase 123,500 3,997,259 4.7915/09/2017 Purchase 9,450 4,006,709 4.8022/09/2017 Purchase 25,650 4,032,359 4.8329/09/2017 Purchase 10,800 4,043,159 4.8427/10/2017 Purchase 31,050 4,074,209 4.8831/10/2017 Purchase 13,500 4,087,709 4.8903/11/2017 Purchase 10,800 4,098,509 4.9110/11/2017 Purchase 52,832 4,151,341 4.9710/11/2017 Sale -29,267 4,122,074 4.9317/11/2017 Purchase 31,500 4,153,574 4.9724/11/2017 Purchase 21,600 4,175,174 5.0001/12/2017 Purchase 28,900 4,204,074 5.0308/12/2017 Purchase 52,400 4,256,474 5.1015/12/2017 Purchase 25,200 4,281,674 5.1222/12/2017 Purchase 41,400 4,323,074 5.17

ST
RA
TE
GIC
RE
PO
RT
ST
AT
UT
OR
Y R
EP
OR
TS
FIN
AN
CIA
L S
TA
TE
ME
NT
S
61
Sr. No.
Name
Shareholding at the beginning of the year
Date-wise Increase/Decrease in Share holding during the year
Cumulative Shareholding during the year
No. of shares
% of total shares of the
CompanyDate Reason
No. of Shares
No. of Shares
% of totalshares of the
Company29/12/2017 Purchase 28,730 4,351,804 5.2105/01/2018 Purchase 48,446 4,400,250 5.2712/01/2018 Purchase 36,000 4,436,250 5.3119/01/2018 Purchase 45,900 4,482,150 5.1026/01/2018 Purchase 47,700 4,529,850 5.1502/02/2018 Purchase 41,580 4,571,430 5.2009/02/2018 Purchase 33,774 4,605,204 5.2416/02/2018 Purchase 23,400 4,628,604 5.2623/02/2018 Purchase 38,453 4,667,057 5.3102/03/2018 Purchase 41,647 4,708,704 5.3509/03/2018 Purchase 24,300 4,733,004 5.3816/03/2018 Purchase 41,559 4,774,563 5.4323/03/2018 Purchase 51,450 4,826,013 5.4930/03/2018 Purchase 27,001 4,853,014 5.5231/03/2018 - - 4,853,014 5.52
5 MIRAJ MARKETING COMPANY LLP
2,305,000 2.76 01/04/2017 - - 2,305,000 2.7622/09/2017 Sale -71,317 2,233,683 2.6729/09/2017 Sale -38,683 2,195,000 2.6313/10/2017 Sale -82,000 2,113,000 2.5320/10/2017 Sale -13,000 2,100,000 2.5105/01/2018 Sale -2,000 2,098,000 2.5131/03/2018 - - 2,098,000 2.39
6 LO FUNDS - EMERGING CONSUMER
1,340,000 1.60 01/04/2017 - - 1,340,000 1.6028/07/2017 Purchase 5,000 1,345,000 1.6104/08/2017 Purchase 5,000 1,350,000 1.6229/09/2017 Sale -442,244 907,756 1.0906/10/2017 Sale -157,756 750,000 0.9020/10/2017 Sale -240,000 510,000 0.6127/10/2017 Sale -510,000 0 0.0031/03/2018 - - - -
7 ZODIAC CLOTHING COMPANY LIMITED
1,261,452 1.51 01/04/2017 - - 1,261,452 1.5107/04/2017 Sale -17,000 1,244,452 1.4914/04/2017 Sale -45,922 1,198,530 1.4421/04/2017 Sale -15,847 1,182,683 1.4228/04/2017 Sale -76 1,182,607 1.4205/05/2017 Sale -12,000 1,170,607 1.4012/05/2017 Sale -17,006 1,153,601 1.3814/07/2017 Sale -4,881 1,148,720 1.3821/07/2017 Sale -5,337 1,143,383 1.3728/07/2017 Sale -60,521 1,082,862 1.3004/08/2017 Sale -73,322 1,009,540 1.2118/08/2017 Sale -650 1,008,890 1.2125/08/2017 Sale -7,219 1,001,671 1.2001/09/2017 Sale -63,495 938,176 1.1208/09/2017 Sale -88,724 849,452 1.0215/09/2017 Sale -5,000 844,452 1.0106/10/2017 Sale -185,000 659,452 0.7913/10/2017 Sale -59,000 600,452 0.72
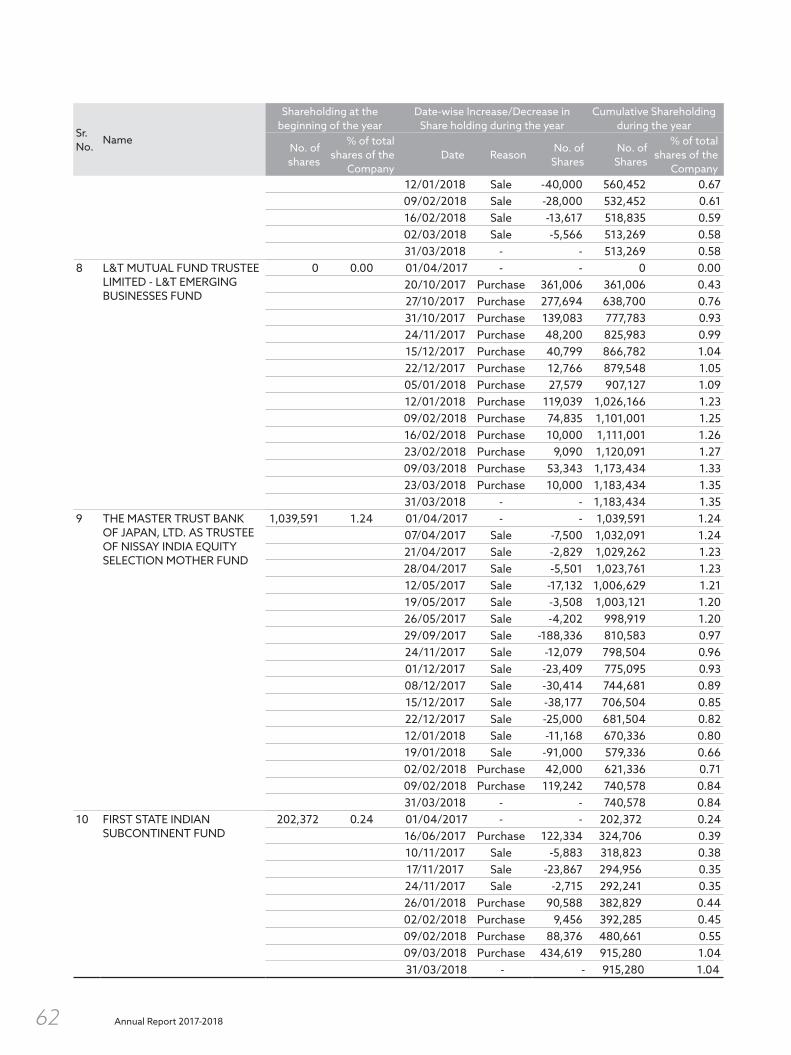
Annual Report 2017-201862
Sr. No.
Name
Shareholding at the beginning of the year
Date-wise Increase/Decrease in Share holding during the year
Cumulative Shareholding during the year
No. of shares
% of total shares of the
CompanyDate Reason
No. of Shares
No. of Shares
% of totalshares of the
Company12/01/2018 Sale -40,000 560,452 0.6709/02/2018 Sale -28,000 532,452 0.6116/02/2018 Sale -13,617 518,835 0.5902/03/2018 Sale -5,566 513,269 0.5831/03/2018 - - 513,269 0.58
8 L&T MUTUAL FUND TRUSTEE LIMITED - L&T EMERGING BUSINESSES FUND
0 0.00 01/04/2017 - - 0 0.0020/10/2017 Purchase 361,006 361,006 0.4327/10/2017 Purchase 277,694 638,700 0.7631/10/2017 Purchase 139,083 777,783 0.9324/11/2017 Purchase 48,200 825,983 0.9915/12/2017 Purchase 40,799 866,782 1.0422/12/2017 Purchase 12,766 879,548 1.0505/01/2018 Purchase 27,579 907,127 1.0912/01/2018 Purchase 119,039 1,026,166 1.2309/02/2018 Purchase 74,835 1,101,001 1.2516/02/2018 Purchase 10,000 1,111,001 1.2623/02/2018 Purchase 9,090 1,120,091 1.2709/03/2018 Purchase 53,343 1,173,434 1.3323/03/2018 Purchase 10,000 1,183,434 1.3531/03/2018 - - 1,183,434 1.35
9 THE MASTER TRUST BANK OF JAPAN, LTD. AS TRUSTEE OF NISSAY INDIA EQUITY SELECTION MOTHER FUND
1,039,591 1.24 01/04/2017 - - 1,039,591 1.2407/04/2017 Sale -7,500 1,032,091 1.2421/04/2017 Sale -2,829 1,029,262 1.2328/04/2017 Sale -5,501 1,023,761 1.2312/05/2017 Sale -17,132 1,006,629 1.2119/05/2017 Sale -3,508 1,003,121 1.2026/05/2017 Sale -4,202 998,919 1.2029/09/2017 Sale -188,336 810,583 0.9724/11/2017 Sale -12,079 798,504 0.9601/12/2017 Sale -23,409 775,095 0.9308/12/2017 Sale -30,414 744,681 0.8915/12/2017 Sale -38,177 706,504 0.8522/12/2017 Sale -25,000 681,504 0.8212/01/2018 Sale -11,168 670,336 0.8019/01/2018 Sale -91,000 579,336 0.6602/02/2018 Purchase 42,000 621,336 0.7109/02/2018 Purchase 119,242 740,578 0.8431/03/2018 - - 740,578 0.84
10 FIRST STATE INDIAN SUBCONTINENT FUND
202,372 0.24 01/04/2017 - - 202,372 0.2416/06/2017 Purchase 122,334 324,706 0.3910/11/2017 Sale -5,883 318,823 0.3817/11/2017 Sale -23,867 294,956 0.3524/11/2017 Sale -2,715 292,241 0.3526/01/2018 Purchase 90,588 382,829 0.4402/02/2018 Purchase 9,456 392,285 0.4509/02/2018 Purchase 88,376 480,661 0.5509/03/2018 Purchase 434,619 915,280 1.0431/03/2018 - - 915,280 1.04

ST
RA
TE
GIC
RE
PO
RT
ST
AT
UT
OR
Y R
EP
OR
TS
FIN
AN
CIA
L S
TA
TE
ME
NT
S
63
(v) Shareholding of Directors and Key Managerial Personnel
Sr. No.
Name
Shareholding at the beginning of the year
Date wise Increase/Decrease in Share holding during the year
Cumulative Shareholding during the year
No. of shares
% of total shares of the
CompanyDate Reason
No. of Shares
No. of Shares
% of totalshares of the
Company1 Mr. Chandru L. Raheja
(Chairman) 697,500 0.84 01.04.2017 - - 697,500 0.84
31.03.2018 - - 697,500 0.792 Mr. Ravi C. Raheja 1,100,000 1.32 01.04.2017 - - 1,100,000 1.32
31.03.2018 - - 1,100,000 1.253 Mr. Neel C. Raheja 1,150,000 1.38 01.04.2017 - - 1,150,000 1.38
31.03.2018 - - 1,150,000 1.314 Mr. B. S. Nagesh 567,685 0.68 01.04.2017 - - 567,685 0.68
31.03.2018 - - 567,685 0.655 Mr. Govind Shrikhande
(Managing Director) 300,019 0.36 01.04.2017 - - 300,019 0.36
17.09.2017 Allotment under ESOP
5,460 305,479 0.37
31.03.2018 - - 305,479 0.356 Mr. Deepak Ghaisas (holds
with his wife as second holder) 7,750 0.01 01.04.2017 - - 7,750 0.01
31.03.2018 - - 7,750 0.017 Prof. Nitin Sanghavi - - 01.04.2017 - - - -
31.03.2018 - - - -8 Mr. Nirvik Singh - - 01.04.2017 - - - -
31.03.2018 - - - -9 Ms. Abanti Sankaranarayanan - - 01.04.2017 - - - -
31.03.2018 - - - -10 Mr. Manish Chokhani - - 01.04.2017 - - - -
31.03.2018 - - - -11 Mr. Gareth Thomas* - - 01.04.2017 - - - -
31.03.2018 N.A. N.A. N.A. N.A.12 Mr. Salil Nair
(Chief Executive Officer)^ 153,250 0.18 01.04.2017 - - 153,250 0.18
31.03.2018 N.A. N.A. N.A. N.A.13 Mr. Sanjay Chakravarti
(Chief Financial Officer)$ 6,807 0.01 01.04.2017 - - 6,807 0.01
17.09.2017 Allotment under ESOP
2,100 8,907 0.01
01.11.2017 Sale -2,308 6,599 0.01 30.11.2017 Allotment
under ESOP1,380 7,979 0.01
31.03.2018 - - N.A. N.A.14 Rajiv Suri (Chief Executive
Officer)# N.A. N.A. 01.04.2017 N.A. N.A. N.A. N.A.
31.03.2018 - - - -15 Mr. Bharat Sanghavi (Company
Secretary) 3,093 0.00 01.04.2017 - - 3,093 0.00
17.09.2017 Allotment under ESOP
788 3,881 0.00
30.11.2017 Allotment under ESOP
474 4,355 0.01
31.03.2018 - - 4,355 0.00* Mr. Gareth Thomas, Independent Director resigned as Director of the Company w.e.f. October 26, 2017.^ Mr. Salil Nair, Chief Executive Officer of the Company resigned from the services of the Company effective May 31, 2017.$ Mr. Sanjay Chakravarti, Chief Financial Officer resigned from the services of the Company effective December 22, 2017.# Mr. Rajiv Suri has been appointed as a Chief Executive Officer of the Company, w.e.f. January 9, 2018.
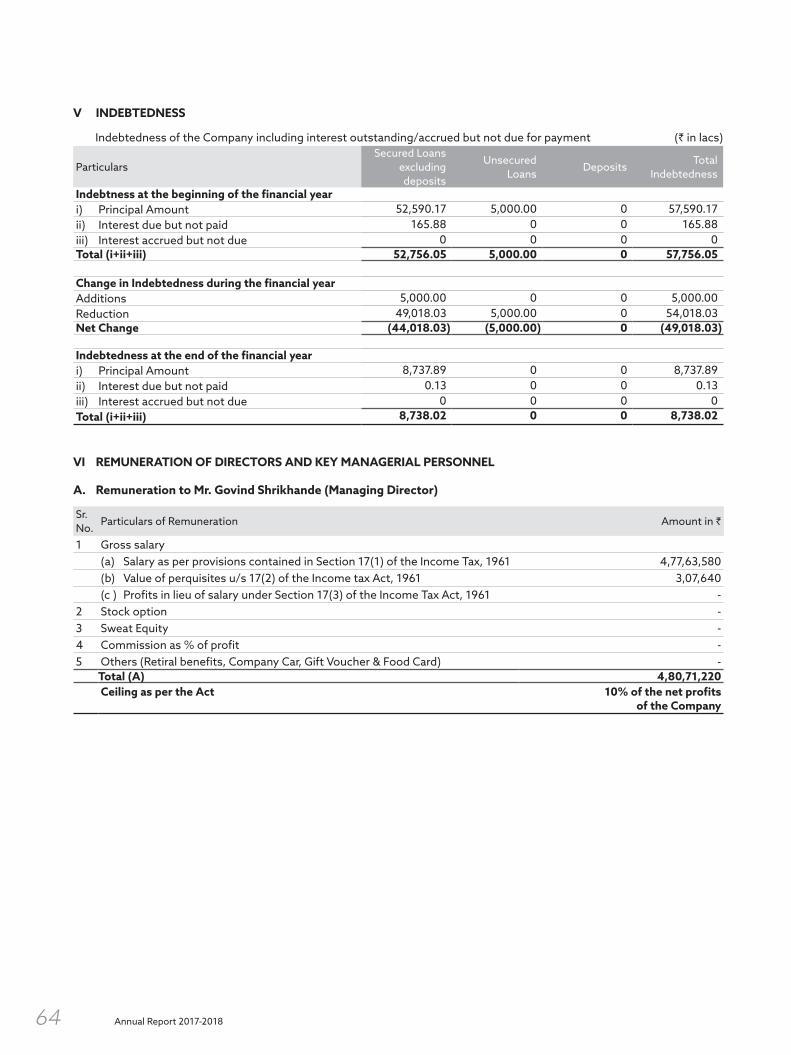
Annual Report 2017-201864
V INDEBTEDNESS
Indebtedness of the Company including interest outstanding/accrued but not due for payment (` in lacs)
ParticularsSecured Loans
excluding deposits
UnsecuredLoans
DepositsTotal
Indebtedness
Indebtness at the beginning of the financial yeari) Principal Amount 52,590.17 5,000.00 0 57,590.17ii) Interest due but not paid 165.88 0 0 165.88iii) Interest accrued but not due 0 0 0 0Total (i+ii+iii) 52,756.05 5,000.00 0 57,756.05
Change in Indebtedness during the financial yearAdditions 5,000.00 0 0 5,000.00Reduction 49,018.03 5,000.00 0 54,018.03Net Change (44,018.03) (5,000.00) 0 (49,018.03)
Indebtedness at the end of the financial yeari) Principal Amount 8,737.89 0 0 8,737.89ii) Interest due but not paid 0.13 0 0 0.13iii) Interest accrued but not due 0 0 0 0Total (i+ii+iii) 8,738.02 0 0 8,738.02
VI REMUNERATION OF DIRECTORS AND KEY MANAGERIAL PERSONNEL
A. Remuneration to Mr. Govind Shrikhande (Managing Director)
Sr. No.
Particulars of Remuneration Amount in `
1 Gross salary(a) Salary as per provisions contained in Section 17(1) of the Income Tax, 1961 4,77,63,580(b) Value of perquisites u/s 17(2) of the Income tax Act, 1961 3,07,640(c ) Profits in lieu of salary under Section 17(3) of the Income Tax Act, 1961 -
2 Stock option -3 Sweat Equity -4 Commission as % of profit -5 Others (Retiral benefits, Company Car, Gift Voucher & Food Card) -
Total (A) 4,80,71,220Ceiling as per the Act 10% of the net profits
of the Company

ST
RA
TE
GIC
RE
PO
RT
ST
AT
UT
OR
Y R
EP
OR
TS
FIN
AN
CIA
L S
TA
TE
ME
NT
S
65
B.
Rem
uner
atio
n to
oth
er d
irec
tors
:
1 In
depe
nden
t D
irec
tors
(Am
ount
in `
)
Sr.
No.
Part
icul
ars
of R
emun
erat
ion
Nam
e of
the
Dire
ctor
sM
r. D
eepa
k G
hais
asPr
of. N
itin
Sang
havi
Mr.
Nirv
ik S
ingh
Ms.
Aba
nti
Sank
aran
aray
anan
Mr.
Man
ish
Cho
khan
iM
r. G
aret
h Th
omas
Tota
l
(a)
Fee
for a
tten
ding
Boa
rd/A
udit
Com
mitt
ee m
eetin
gs 3
70,0
00 5
10,0
00 5
0,00
0 5
0,00
0 3
70,0
00 1
00,0
00 1
,450
,000
(b)
Com
mis
sion
600
,000
300
,000
300
,000
300
,000
300
,000
- 1
,800
,000
(c )
Oth
ers,
ple
ase
spec
ify-
--
--
--
Tota
l B (1
)97
0,00
081
0,00
035
0,00
035
0,00
067
0,00
010
0,00
03,
250,
000
2
Oth
er N
on-E
xecu
tive
Dir
ecto
rsA
mou
nt in
`Sr
. N
o.Pa
rtic
ular
s of
Rem
uner
atio
nN
ame
of th
e D
irect
ors
Mr.
Cha
ndru
L. R
ahej
aM
r. Ra
vi C
. Rah
eja
Mr.
Nee
l C. R
ahej
aM
r. B.
S. N
ages
hTo
tal
(a)
Fee
for a
tten
ding
Boa
rd/A
udit
Com
mitt
ee m
eetin
gs 3
50,0
00 4
60,0
00 3
50,0
00 3
50,0
00 1
,510
,000
(b)
Com
mis
sion
--
- 3
00,0
00 3
00,0
00(c
)O
ther
s, p
leas
e sp
ecify
.-
--
--
Tota
l B (2
)35
0,00
04
60,0
0035
0,00
065
0,00
0 1
,810
,000
Tota
l (B)
=(B1
+B2)
5,06
0,00
0
Cei
ling
as p
er t
he A
ctsi
ttin
g fe
es o
f ` 1
lac
for a
tten
ting
eac
h M
eeti
ng o
f Boa
rd a
nd C
omm
itte
es t
here
of a
nd 1
% o
f the
Net
pro
fit
of t
he
Com
pany
as
Com
mis
sion

Annual Report 2017-201866
C. REMUNERATION TO KEY MANAGERIAL PERSONNEL OTHER THAN MANAGING DIRECTOR
Key Managerial Personnel (Amount in `)
Sr. No.
Particulars of Remuneration
Mr. Salil Nair(Chief Executive
Officer) (upto 31.05.2017)
Mr. Sanjay Chakravarti
(Chief Financial Officer) (upto
22.12.2017)
Mr. Bharat Sanghavi
(Company Secretary)
Mr. Rajiv Suri(Chief Executive
Officer) (w.e.f. 09.01.2018)
Total
1 Gross Salary(a) Salary as per provisions contained in Section 17(1) of the Income Tax Act, 1961
15,022,017 10,034,923 4,230,903 10,011,984 39,299,827
(b) Value of perquisites u/s 17(2) of the Income Tax Act, 1961
15,300 30,437 45,674 9,900 101,311
(c ) Profits in lieu of salary under Section 17(3) of the Income Tax Act, 1961
- - - - -
2 Stock Option 530,681 # 300,978 86,327 - 387,3053 Sweat Equity - - - - -4 Commission as % of profit - - - - -5 Others - - - - -
Total 15,567,998 10,366,338 4,362,904 10,021,884 40,319,124
# On account of allotment of equity shares under ESOP on November 30, 2017.
VII PENALTIES/ PUNISHMENT/ COMPOUNDING OF OFFENCES
TypeSection of the
Companies ActBrief Description
Details of Penalty/
Punishment/Compounding fees imposed
Authority (RD/ NCLT/ Court)
Appeal made if any (give details)
A. COMPANY
Penalty
NilPunishment
Compounding
B. DIRECTORS
Penalty
NilPunishment
Compounding
C. OTHER OFFICERS IN DEFAULT
Penalty
NilPunishment
Compounding
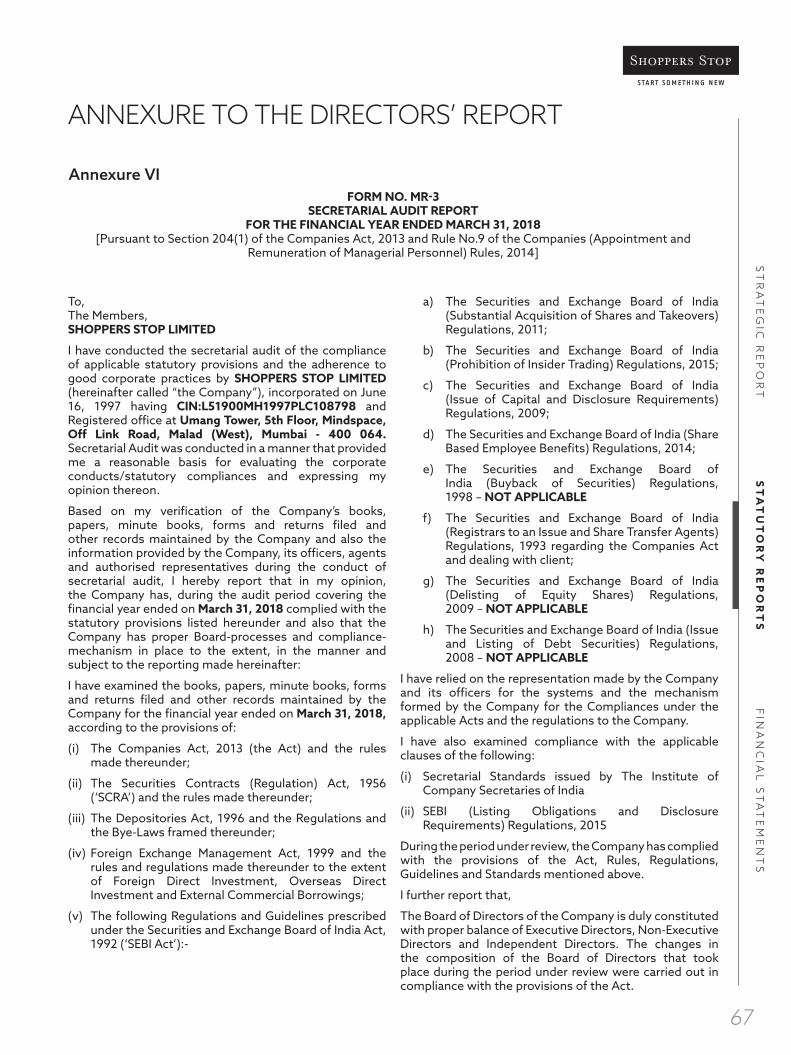
ST
RA
TE
GIC
RE
PO
RT
ST
AT
UT
OR
Y R
EP
OR
TS
FIN
AN
CIA
L S
TA
TE
ME
NT
S
67
To,The Members,SHOPPERS STOP LIMITED
I have conducted the secretarial audit of the compliance of applicable statutory provisions and the adherence to good corporate practices by SHOPPERS STOP LIMITED (hereinafter called “the Company”), incorporated on June 16, 1997 having CIN:L51900MH1997PLC108798 and Registered office at Umang Tower, 5th Floor, Mindspace, Off Link Road, Malad (West), Mumbai - 400 064. Secretarial Audit was conducted in a manner that provided me a reasonable basis for evaluating the corporate conducts/statutory compliances and expressing my opinion thereon.
Based on my verification of the Company’s books, papers, minute books, forms and returns filed and other records maintained by the Company and also the information provided by the Company, its officers, agents and authorised representatives during the conduct of secretarial audit, I hereby report that in my opinion, the Company has, during the audit period covering the financial year ended on March 31, 2018 complied with the statutory provisions listed hereunder and also that the Company has proper Board-processes and compliance-mechanism in place to the extent, in the manner and subject to the reporting made hereinafter:
I have examined the books, papers, minute books, forms and returns filed and other records maintained by the Company for the financial year ended on March 31, 2018, according to the provisions of:
(i) The Companies Act, 2013 (the Act) and the rules made thereunder;
(ii) The Securities Contracts (Regulation) Act, 1956 (‘SCRA’) and the rules made thereunder;
(iii) The Depositories Act, 1996 and the Regulations and the Bye-Laws framed thereunder;
(iv) Foreign Exchange Management Act, 1999 and the rules and regulations made thereunder to the extent of Foreign Direct Investment, Overseas Direct Investment and External Commercial Borrowings;
(v) The following Regulations and Guidelines prescribed under the Securities and Exchange Board of India Act, 1992 (‘SEBI Act’):-
a) The Securities and Exchange Board of India (Substantial Acquisition of Shares and Takeovers) Regulations, 2011;
b) The Securities and Exchange Board of India (Prohibition of Insider Trading) Regulations, 2015;
c) The Securities and Exchange Board of India (Issue of Capital and Disclosure Requirements) Regulations, 2009;
d) The Securities and Exchange Board of India (Share Based Employee Benefits) Regulations, 2014;
e) The Securities and Exchange Board of India (Buyback of Securities) Regulations, 1998 – NOT APPLICABLE
f) The Securities and Exchange Board of India (Registrars to an Issue and Share Transfer Agents) Regulations, 1993 regarding the Companies Act and dealing with client;
g) The Securities and Exchange Board of India (Delisting of Equity Shares) Regulations, 2009 – NOT APPLICABLE
h) The Securities and Exchange Board of India (Issue and Listing of Debt Securities) Regulations, 2008 – NOT APPLICABLE
I have relied on the representation made by the Company and its officers for the systems and the mechanism formed by the Company for the Compliances under the applicable Acts and the regulations to the Company.
I have also examined compliance with the applicable clauses of the following:
(i) Secretarial Standards issued by The Institute of Company Secretaries of India
(ii) SEBI (Listing Obligations and Disclosure Requirements) Regulations, 2015
During the period under review, the Company has complied with the provisions of the Act, Rules, Regulations, Guidelines and Standards mentioned above.
I further report that,
The Board of Directors of the Company is duly constituted with proper balance of Executive Directors, Non-Executive Directors and Independent Directors. The changes in the composition of the Board of Directors that took place during the period under review were carried out in compliance with the provisions of the Act.
Annexure VI
ANNEXURE TO THE DIRECTORS’ REPORT
FORM NO. MR-3SECRETARIAL AUDIT REPORT
FOR THE FINANCIAL YEAR ENDED MARCH 31, 2018[Pursuant to Section 204(1) of the Companies Act, 2013 and Rule No.9 of the Companies (Appointment and
Remuneration of Managerial Personnel) Rules, 2014]
Annual Report 2017-201868
Adequate notice is given to all directors to schedule the Board Meetings, agenda and detailed notes on agenda were sent as per the provisions of the Companies Act, 2013 and the rules made thereunder, and a system exists for seeking and obtaining further information and clarifications on the agenda items before the meeting and for meaningful participation at the meeting including meeting through the video conference.
All decisions are carried through the unanimous consent of all the Board of Directors and recorded as part of the minutes.
I further report that there are adequate systems and processes in the Company commensurate with the size and operations of the Company to monitor and ensure compliance with applicable laws, rules, regulations and guidelines.
I further report that during the audit period:
1. The Board of Directors have approved shifting of Registered Office of the Company from Eureka Towers, B Wing, 9th Floor, Mindspace, Link Road, Malad (West), Mumbai- 400 064 to Umang Tower, 5th Floor, Mindspace, Off Link Road, Malad (West), Mumbai - 400 064 with effect from April 17, 2017.
2. The members of the Company vide postal ballot have approved to (i) give any loans to any person or other body corporate and/or (ii) give any guarantees or to
provide security in connection with a loan to any other body corporate or person and/or (iii) acquire by way of subscription, purchase or otherwise, the securities of any other body corporate, upto (a) maximum amount of ̀ 1,135 crores (Rupees One Thousand One Hundred Thirty Five Crores) or (b) the maximum limits so prescribed under Section 186 of the Companies Act, 2013 as may be and result for the same was declared on June 15, 2017.
3. The members of the Company in its Extra Ordinary General Meeting held on October 18, 2017 have approved the issue, offer and allotment of 43,95,925 Equity shares of the face value of ` 5/- each at a price of ` 407.78/- per equity share to Amazon.com NV Investment Holdings LLC on preferential allotment/Private placement basis.
4. The members of the Company vide postal ballot have approved the sale/ transfer/ disposal of 77,158,778 Equity Shares of the face value of ` 10 each of Hypercity Retail (India) Limited and result for the same was declared on November 14, 2017.
5. The Company have issued and allotted in various tranches 60,020 Equity shares of the face value of ` 5/- each at different exercise price to employees under Employee Stock Option Scheme 2008.
For Kaushal Dalal & Associates Company Secretaries
Kaushal Dalal ProprietorDate: April 27, 2018 M. No.: 7141 CP No.: 7512
To,The Members,SHOPPERS STOP LIMITED
Our report of even date is to read along with this letter.
1. Maintenance of secretarial records is the responsibility of the management of the Company. Our responsibility is to express an opinion on these secretarial records based on our audit.
2. I have followed the audit practices and processes as were appropriate to obtain reasonable assurance about the correctness of the contents of the secretarial records. The verification was done on test check basis to ensure that correct facts are reflected in secretarial records. I believe that the processes and practices I followed, provided a reasonable basis for my opinion.
3. I have not verified the correctness and appropriateness of financial records and books of account of the Company.
4. Whereever required, I have obtained the Management representation about the compliance of laws, rules and regulations and happening of events etc.
5. The compliance of the provisions of Corporate and other applicable laws, rules, regulation, standards is the responsibility of management. My examination was limited to the verification of procedures on the test check basis.
6. The secretarial audit report is neither an assurance as to the future viability of the Company nor of the efficiency or effectiveness with which the management has conducted the affairs of the Company.
For Kaushal Dalal & Associates Company Secretaries
Kaushal Dalal ProprietorDate: April 27, 2018 M. No.: 7141 CP No.: 7512

ST
RA
TE
GIC
RE
PO
RT
ST
AT
UT
OR
Y R
EP
OR
TS
FIN
AN
CIA
L S
TA
TE
ME
NT
S
69
CONSERVATION OF ENERGY & TECHNOLOGY ABSORPTION
The Company is engaged in the continuous process of energy conservation through improved operational and maintenance practices. The brief of the particulars in respect of various steps and initiatives taken regarding conservation of energy and technology absorption is as under:
1. All the Store Unit maintenance head and store managers were made aware about energy consumption of their store as per the connected load. Based on the connected load and operating hours, budgeted energy consumption is given to each stores and practice of taking daily logs and cross-checking the daily consumption with the budgeted units is adopted. This helps in curbing the unwanted consumption, motivates users to take all the possible measures to save the energy and helps in pointing out the discrepancies in the energy consumption pattern and corrective action to eliminate the discrepancies.
2. Controlled the energy consumption of HVAC system by optimising the temperature inside the stores (24˚C). This drive is the major contributor for the energy conservation for the stores in addition to manual optimisation of AHU’s usage installed VFD for the AHU’s at the stores.
3. Optimised lighting consumption by strictly controlling the operating hours as per the usage pattern. Colour coding is followed for distinguishing the different lighting (emergency, show window, signage’s, floor lighting, indirect lighting) switches; so that energy usage can be optimised.
4. Eliminated the unwanted night consumption and restricted usage of the night lighting during night work.
5. Installed capacitor banks to maintain the power factor to reduce the losses and avail PF incentive there by receiving 5% to 7% incentive on the energy bills. This FY we have availed benefit of ` 72 lacs towards PF Incentive till March 2018.
6. These cumulative efforts were resulted in the saving of 6,650,732 Units (which is equivalent to energy cost saving of ` 741 lacs) cumulatively for like to like stores, achieved through consistent monitoring and controlling the consumption at optimum level as compared to the consumption of the last year plus various initiative like LED rollout, etc.
7. Successfully rolled out LED Project (Conversion of lighting from current CDMT to LED) saving roughly 40% to 45% unit consumption towards lighting load at certain stores.
8. Result of the good maintenance practices and energy optimised uses helped the Company to win second prize in ‘Uttar Pradesh State Energy conservation Awards-2017’ conducted by UPNEDA, UP Government, under the State Ministry of Power, for Shoppers Stop Store at Lucknow, among the ‘Shopping Malls’ category.
Annexure - VII
ANNEXURE TO THE DIRECTORS’ REPORT

Annual Report 2017-201870
April 27, 2018
To,The Board of DirectorsShoppers Stop LimitedUmang Tower, 5th Floor,Mindspace, Off Link Road,Malad (West), Mumbai - 400 064.
Dear Sirs,
We hereby certify that:
(a) We have reviewed the financial statements and the cash flow statement for the financial year 2017-18 and that to the best of our knowledge and belief:
(i) these statements do not contain any materially untrue statement or omit any material fact or contain statements that might be misleading;
(ii) these statements together present a true and a fair view of the Company’s affair and are in compliance with existing accounting standards, applicable laws and regulations.
(b) There are, to the best of our knowledge and belief, no transactions entered into by the Company during the year which are fraudulent, illegal or violative of the Company’s code of conduct.
(c) We accept responsibility for establishing and maintaining internal controls for financial reporting and that we have evaluated the effectiveness of the internal control systems of the Company pertaining to financial reporting and we have disclosed to the auditors and the Audit Committee, deficiencies in the design or operation of such internal controls, if any, of which we are aware and the steps we have taken or propose to take to rectify these deficiencies.
(d) We have indicated to the auditors and the Audit Committee:
(i) significant changes in internal control over the financial reporting during the year;
(ii) significant changes in accounting policies during the year and that the same have been disclosed in the notes to the financial statements; and
(iii) instances of significant fraud of which we have become aware and the involvement therein, if any, of the management or an employee having a significant role in the Company’s internal control system over financial reporting.
For Shoppers Stop Limited
Govind ShrikhandeCustomer Care Associate &Managing Director
Rajiv SuriCustomer Care Associate &Chief Executive Officer
Vijay JainCustomer Care Associate & Dy. Chief Financial Officer

ST
RA
TE
GIC
RE
PO
RT
ST
AT
UT
OR
Y R
EP
OR
TS
FIN
AN
CIA
L S
TA
TE
ME
NT
S
71
VISION AND VALUES OF THE COMPANY
The Vision and Values adopted by the Company governs and guides all business activities and stakeholders interactions.
Vision of the Company: “To be an inspirational and trusted brand, transforming customer’s lives through fashion and delightful shopping experience every time.”
Values that help us in achieving our Vision:
Excellence – We will have an environment that encourages development and excellence.
Openness – The obligation to dissent and an environment conducive to openness.
Care – We will have a willingness to apologise and forgive.
Integrity – We will be fair and not take what is not ours.
Innovative – We will have an environment of innovation and growth.
Socially Responsible – We will respect our customer’s rights and be socially responsible.
ABOUT THIS REPORT
Pursuant to Regulation 34(2)(f) of the SEBI (Listing Obligations and Disclosure Requirements) Regulations, 2015, the Board members present herewith Second “Business Responsibility Report” (BRR) of the Company for the financial year 2017-18:
SECTION A: GENERAL INFORMATION ABOUT THE COMPANY
1 Corporate Identity Number (CIN) of the Company L51900MH1997PLC1087982 Name of the Company Shoppers Stop Limited3 Registered Office Address Umang Tower, 5th Floor, Mindspace, Off Link Road,
Malad (West), Mumbai - 400 064. Tel: 022 – 42497000.
4 Website www.shoppersstop.com5 E-mail ID [email protected] Financial Year reported April 1, 2017 to March 31, 20187 Sector(s) that the Company is engaged in
(industrial activity code-wise)Apparels - 477 Non-Apparels – 477
8 List three key products/services that the Company manufactures/provides (as in balance sheet)
Apparels & Non-Apparels
9 Total number of locations where business activity isundertaken by the Company (a) Number of International Locations
(Provide details of major 5)(b) Number of National Locations
(a) Number of International Locations – Nil(b) Number of National Locations – The Company has 83
Shoppers Stop stores (including 6 airport stores) and 13 HomeStop Stores spread across India. Details of these store locations are provided in “General Shareholders Information” section of Corporate Governance Report of the Company. In addition, under the “Beauty segment”, the Company also operates 103 stores under M.A.C, Clinique, Estee Lauder, Bobbi Brown and Smash Box formats.
10 Markets served by the Company – Local/ State/ National/ International
National
BUSINESS RESPONSIBILITY REPORT

Annual Report 2017-201872
SECTION B – FINANCIAL DETAILS OF THE COMPANY
1 Paid-up Capital ` 4,398.03 lacs2 Total Turnover ` 418,631.46 lacs3 Total profit after taxes ` 1,160.38 lacs4 Total Spending on Corporate Social Responsibility (CSR) as percentage
of profit after tax (%)The Company’s spending on CSR for the year ended March 31, 2018 was ` 84 lacs, which is 2% of average net profit for the last 3 financial years.
5 List of activities in which expenditure in 4 above has been incurred Livelihood creation for persons with disabilities (Employment linked training) and ensuring environment sustainability. The details of above CSR activities are provided as Annexure III to the Directors’ Report.
SECTION C – OTHER DETAILS
1 Does the Company have any Subsidiary Company/Companies? Yes2 Do the Subsidiary Company/Companies participate in the BR Initiatives of the parent Company?
If yes, then indicate the number of such subsidiary Company(s)No
3 Do any other entity/entities (e.g. suppliers, distributors etc.) that the Company does business with, participate in the BR initiatives of the Company? If yes, then indicate the percentage of such entity/entities? [Less than 30%, 30-60%, More than 60%]
No
SECTION D – BR INFORMATION
1 Details of Director responsible for BR(a) Details of the Director responsible for implementation of the BR policies
1 DIN Number 000294192 Name Mr. Govind Shrikhande
3 Designation Managing Director
(b) Details of the BR headNo. Particulars Details1 DIN Number (if applicable) 000294192 Name Mr. Govind Shrikhande3 Designation Managing Director4 Telephone number 022-424970005 E-mail ID [email protected]
2 Principle-wise (as per NVGs) BR policies:P1: Ethics, Transparency and AccountabilityP2: Product ResponsibilityP3: Well-being of EmployeesP4: Responsiveness to StakeholdersP5: Human RightsP6: Environmental ResponsibilityP7: Public Policy AdvocacyP8: Inclusive Growth and Equitable DevelopmentP9: Engagement with Customers

ST
RA
TE
GIC
RE
PO
RT
ST
AT
UT
OR
Y R
EP
OR
TS
FIN
AN
CIA
L S
TA
TE
ME
NT
S
73
(a) Details of compliance (Reply in Y/N)No. Questions P1 P2 P3 P4 P5 P6 P7 P8 P91 Do you have policies for Y Y Y Y Y Y N Y Y2 Has the policy being formulated
in consultation with the relevant stakeholders? Note 1
Y Y Y Y Y Y - Y Y
3 Does the policy conform to any national/ international standards? If yes, specify? (50 words)
The spirit and content of the Code of Conduct and the applicable laws are captured in the policies framed by the Company.
4 Has the policy being approved by the Board? If yes, has it been signed by MD/ owner/ CEO/ appropriate Board Director?
Policies mandated under the Companies Act, 2013 (the Act) and the SEBI (Listing Obligations and Disclosure Requirements) Regulations, 2015 (LODR) are approved by the Board and is signed by the Managing Director and other policies are approved by the Managing Director/Functional Heads of the Company as appropriate from time to time.
5 Does the Company have a specified committee of the Board/ Director/ Official to oversee the implementation of the policies? Note 2
Y Y Y Y Y Y - Y Y
6 Indicate the link for the policies to be viewed online?
Policies mandated to be displayed on website of the Company as per the Act and LODR are displayed at https://corporate.shoppersstop.com/Investors/Policies.aspx and all other policies are displayed on our intranet.
7 Has the policy been formally communicated to all relevant internal and external stakeholders?
Y Y Y Y Y Y - Y Y
8 Does the Company have in-house structure to implement the policies
Y Y Y Y Y Y - Y Y
9 Does the Company have a grievance redressal mechanism related to the policies to address stakeholders’ grievances related to the policies?
Y Y Y Y Y - - - Y
10 Has the Company carried out independent audit/ evaluation of the working of this policy by an internal or external agency? Note 3
Y Y Y Y Y Y - Y Y
Note 1: There have been consultation with all stakeholders wherever required and possible and accordingly the relevant policies have evolved over a period of time.
Note 2: The implementation and adherence to the Code of Conduct for Employees is overseen by the Human Resource and GRC respectively. The Corporate Social Responsibility Policy is administered by the CSR Committee in line with the requirements of the Act. The Energy Management Policy is overseen by the Maintenance Function. Resolution of all customer related issues are done by the relevant operating functions. The Nomination, Remuneration & Corporate Governance Committee as well oversees the implementation of certain policies.
Note 3: The internal auditors and GRC function carry out independent audit/evaluation of working of these policies from time to time.

Annual Report 2017-201874
(b) If answer to the question at serial number 1 against any principle, is ‘No’, please explain why: (Tick up to 2 options)No. Questions P1 P2 P3 P4 P5 P6 P7 P8 P91 The Company has not understood the
Principles- - - - - - - - -
2 The Company is not at a stage where it finds itself in a position to formulate and implement the policies on specified principles
- - - - - - - - -
3 The Company does not have financial or manpower resources available for the task
- - - - - - - - -
4 It is planned to be done within next 6 months
- - - - - - - - -
5 It is planned to be done within the next 1 year
- - - - - - - - -
6 Any other reason (please specify)While there is no specific policy outlined for this principle, the Company, through trade bodies and associations, puts forth a number of suggestions with respect to the economy in general and the retail sector in particular.
- - - - - - - -
3 Governance related to BR(a) Indicate the frequency with which the Board
of Directors, Committee of the Board or CEO to assess the BR performance of the Company. Within 3 months, 3-6 months, Annually, More than 1 year
The BR performance is assessed periodically by the Management/ Board of Directors and its Committees.
(b) Does the Company publish a BR or a Sustainability Report? What is the hyperlink for viewing this report? How frequently it is published?
This is second Business Responsibility Report being published for the Financial Year 2017-18 by the Company. It is available on the website of the Company at www.shoppersstop.com
SECTION E – PRINCIPLE-WISE PERFORMANCE
Principle 1: Ethics, Transparency and Accountability
Shoppers Stop Ltd., a pioneer in modern retailing in India has built a reputation over a period of more than 25 years for its high ethical standards. It firmly believes that good governance is a pre-requisite for meeting the needs and aspirations of its stakeholders. The vision and values of the Company are fundamentally based on the principles of Ethics, Transparency and Accountability.
1. Does the policy relating to ethics, bribery and corruption cover only the Company? Yes/No. Does it extend to the Group/ Joint Ventures/ Suppliers/Contractors/ NGOs/ Others?
The Company has formulated Shoppers Stop Unified Code of Conduct, to conduct the business in an ethical manner as well as to create a work environment that is conducive to all stakeholders. It outlines the principles and policies of business integrity, Company assets & financial integrity and workplace integrity which governs the activities of the Company.
Further, the Company has adopted a Whistle Blower Policy through which its directors and employees can report their genuine concerns about unethical behaviour, actual or suspected fraud or violation of the Company’s code of conduct. It also provides adequate safeguards against victimisation of persons who uses such mechanism.
The Company has, developed its Code of Practices and Procedures for Fair Disclosure of Unpublished Price Sensitive Information and Code of Internal Procedures and Conduct for regulating, monitoring and reporting trading by Insiders in such a manner that it not only satisfies the regulatory requirements but also instils a sense of responsibility among the designated persons for making timely and adequate disclosures.
2. How many stakeholder complaints have been received in the past financial year and what percentage was satisfactorily resolved by the management? If so, provide details thereof, in about 50 words or so.

ST
RA
TE
GIC
RE
PO
RT
ST
AT
UT
OR
Y R
EP
OR
TS
FIN
AN
CIA
L S
TA
TE
ME
NT
S
75
The Company has in place different mechanisms for receiving and dealing with complaints from different stakeholder’s viz. shareholders, customers, employees etc. There are dedicated resources to respond to the complaints within a time bound manner. There were 4 complaints/grievances received from shareholders during the year under review, which have been resolved satisfactorily. No complaints, concerns were received by the Company under the whistle blower policy of the Company.
Principle 2: Product Responsibility
At Shoppers Stop “We are responsible for what we sell”. We source our products directly from the brands and our own Private Brands, from the designated suppliers. The Company has a Return Policy, for the Customers in scenarios where the Customer is dissatisfied with the product for any reason.
1. List up to 3 of your products or services whose design has incorporated social or environmental concerns, risks and/or opportunities.
Since majority of the business in the Company is retailing of branded apparels and non-apparels, the Company does not deal with any products or services whose design has incorporated social or environmental concerns, risks and/or opportunities. However, with an emphasis on organic, self-degradable and recyclable products, one of the Company’s Brand – HomeStop houses brands like Back to earth, a brand with natural and earth friendly products.
2. For each such product, provide the following details in respect of resource use (energy, water, raw material etc.) per unit of product (optional):
(a) Reduction during sourcing/ production/ distribution achieved since the previous year throughout the value chain?
(b) Reduction during usage by consumers (energy, water) has been achieved since the previous year?
Considering the nature of business of the Company the said questions are not applicable to the Company.
3. Does the Company have procedures in place for sustainable sourcing (including transportation)?
The Company is putting in place robust procedure for sustainable sourcing of products sold by the Company. We have processes for selecting vendors on their capabilities, machinery standards and workmanship. Over and above this we do have quality procedures to ensure consistency in quality. We also have an effective feedback tracking mechanism called PSI.
4. Has the Company taken any steps to procure goods and services from local & small producers, including communities surrounding their place of work? If yes, what steps have been taken to improve their capacity and capability of local and small vendors?
The Company procures some part of its merchandise from small & medium scale enterprises. The Company procures certain ladies Indian wear products from suppliers who provide employment to local communities, like stitching, embroidery and certain trim works. We also invite them to our annual Partnership for Progress summit to give them exposure to various new initiatives taken in different areas of retailing and align them with our future growth plans.
5. Does the Company have a mechanism to recycle products and waste? If yes what is the percentage of recycling of products and waste (separately as <5%, 5-10%, >10%). Also, provide details thereof, in about 50 words or so.
Considering the nature of business of the Company, the waste generated at its offices and stores are managed as per the internal waste disposal process. At warehouses cartons are reused for packaging and transporting products to stores. The Company has procedures in place to dispose of e-waste through authorised e-waste vendors.
Principle 3: Well-being of employees
The Company constantly strives to create a healthy and nurturing work environment for all its associates. The Company has framed various policies and practices for the overall well-being of its associates and provides a work environment that is free from any discrimination and harassment, promotes health & safety and enhances equal opportunities for men & women. People development continues to be a key emphasis in the Company.
Every year the Annual Employee Engagement Survey is conducted for understanding the overall engagement levels in the organisation, finding out what motivates associates and how these factors vary across different populations in the organisation. The survey has been named ‘COMPASS – Navigating together in the right direction’ in order to convey how valuable the inputs of our associates are in planning our people priorities and actions. For the year under review, the Company saw an excellent participation rate of 87% and engagement score at organisation level was 77%. We have scored higher than the industry bench mark of 72%.
The Company stands strong against any kind of sexual harassment and on a regular basis the employees are asked to write to the different complaint contacts and POSH (Prevention of Sexual Harassment), just action is taken post detailed review of the case. Irrespective of the geography or the culture that we share in the Company, the Company encourages the employees to be safeguarded during times of emergency, being preventive and defensive to any adverse situations. POSH & Urban Defense Training has been conducted across the organisation. Annual training programme for all the committee members of the POSH has been conducted to update the members with the best practices.
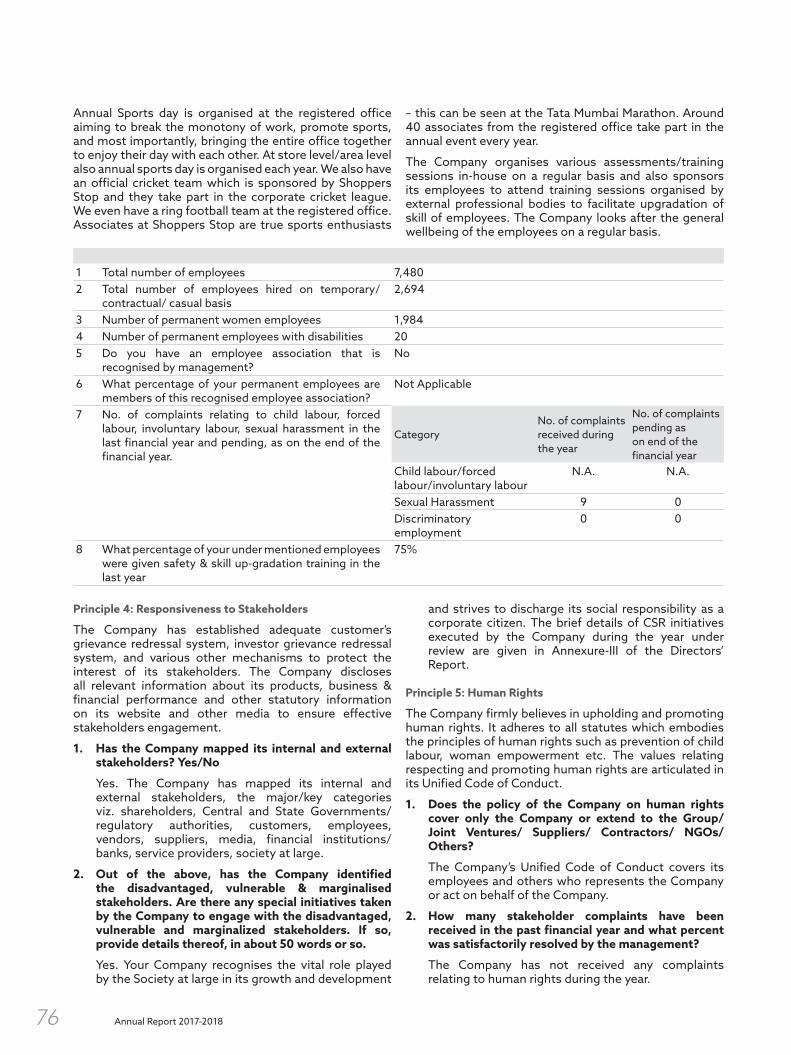
Annual Report 2017-201876
Annual Sports day is organised at the registered office aiming to break the monotony of work, promote sports, and most importantly, bringing the entire office together to enjoy their day with each other. At store level/area level also annual sports day is organised each year. We also have an official cricket team which is sponsored by Shoppers Stop and they take part in the corporate cricket league. We even have a ring football team at the registered office. Associates at Shoppers Stop are true sports enthusiasts
– this can be seen at the Tata Mumbai Marathon. Around 40 associates from the registered office take part in the annual event every year.
The Company organises various assessments/training sessions in-house on a regular basis and also sponsors its employees to attend training sessions organised by external professional bodies to facilitate upgradation of skill of employees. The Company looks after the general wellbeing of the employees on a regular basis.
1 Total number of employees 7,4802 Total number of employees hired on temporary/
contractual/ casual basis2,694
3 Number of permanent women employees 1,9844 Number of permanent employees with disabilities 205 Do you have an employee association that is
recognised by management?No
6 What percentage of your permanent employees are members of this recognised employee association?
Not Applicable
7 No. of complaints relating to child labour, forced labour, involuntary labour, sexual harassment in the last financial year and pending, as on the end of the financial year.
CategoryNo. of complaints received during the year
No. of complaints pending as on end of the financial year
Child labour/forced labour/involuntary labour
N.A. N.A.
Sexual Harassment 9 0Discriminatory employment
0 0
8 What percentage of your under mentioned employees were given safety & skill up-gradation training in the last year
75%
Principle 4: Responsiveness to Stakeholders
The Company has established adequate customer’s grievance redressal system, investor grievance redressal system, and various other mechanisms to protect the interest of its stakeholders. The Company discloses all relevant information about its products, business & financial performance and other statutory information on its website and other media to ensure effective stakeholders engagement.
1. Has the Company mapped its internal and external stakeholders? Yes/No
Yes. The Company has mapped its internal and external stakeholders, the major/key categories viz. shareholders, Central and State Governments/regulatory authorities, customers, employees, vendors, suppliers, media, financial institutions/banks, service providers, society at large.
2. Out of the above, has the Company identified the disadvantaged, vulnerable & marginalised stakeholders. Are there any special initiatives taken by the Company to engage with the disadvantaged, vulnerable and marginalized stakeholders. If so, provide details thereof, in about 50 words or so.
Yes. Your Company recognises the vital role played by the Society at large in its growth and development
and strives to discharge its social responsibility as a corporate citizen. The brief details of CSR initiatives executed by the Company during the year under review are given in Annexure-III of the Directors’ Report.
Principle 5: Human Rights
The Company firmly believes in upholding and promoting human rights. It adheres to all statutes which embodies the principles of human rights such as prevention of child labour, woman empowerment etc. The values relating respecting and promoting human rights are articulated in its Unified Code of Conduct.
1. Does the policy of the Company on human rights cover only the Company or extend to the Group/ Joint Ventures/ Suppliers/ Contractors/ NGOs/ Others?
The Company’s Unified Code of Conduct covers its employees and others who represents the Company or act on behalf of the Company.
2. How many stakeholder complaints have been received in the past financial year and what percent was satisfactorily resolved by the management?
The Company has not received any complaints relating to human rights during the year.

ST
RA
TE
GIC
RE
PO
RT
ST
AT
UT
OR
Y R
EP
OR
TS
FIN
AN
CIA
L S
TA
TE
ME
NT
S
77
Principle 6: Environmental Responsibility
The Company strives to use energy in the most efficient, cost-effective and environmentally responsible manner. Shoppers Stop’s ‘Energy Management Policy’ is built on the tenets of the 3 R’s i.e., REDUCE, REUSE & RECYCLE. The Company seeks to maximise energy performance, reduce operating expenses and increase shareholder value by actively and responsibly managing energy consumption. We also try to demonstrate commitment to our community and leadership in our industry, by reducing environmental impacts associated with energy use.
The Company has taken many energy initiatives such as:
Solar Energy Panels are installed at Andheri - Mumbai store of 30 Kw capacity.
Variable frequency Drives for HVAC units are installed in many stores which help in increasing efficiency of HVAC units while lowering their power consumption.
LED Lighting has been introduced in many Stores which has brought down lighting load by up to 40%.
Eco-Additives in Chillers which help in increasing efficiency of HVAC units while lowering their power consumption.
Rainwater Harvesting being done at Begumpet – Hyderabad store and recycled water is reused for flushing and domestic usage.
Re-Use & Re-Cycle fittings/fixtures from stores that have been closed and redeployed at new locations after minor refurbishment.
Engineered wood was used to Fitout an entire store at BIG Mall Thane. This wood is sourced from man-made forests grown in a sustainable manner.
Eco-friendly recyclable material such as GI & Aluminum framework being used in fit-outs instead of wood framework.
E-waste collection drive: The Company conducts and encourages its associates to dispose of Electronic waste in a responsible manner.
Due to its efforts, the Company has managed to save 28.26 lacs units of power and reduce carbon emission by 2,207 tonnes in FY 2017-18.
The Company has been honoured with The Excellence Award in Energy reduction from Bureaucracy Today Magazine, amongst 100 companies applying for various categories.
1. Does the policy related to Principle 6 cover only the Company or extends to the Group/ Joint Ventures/Suppliers/ Contractors/ NGOs/others.
The Company’s Energy Management policy extends to all its business units, employees and contractors in service to the business of the Company.
2. Does the Company have strategies/ initiatives to address global environmental issues such as climate change, global warming, etc.? Y/N. If yes, please give hyperlink for webpage etc.
The Company has in-house intranet website of Think Green, which discuss environmental issues among employees. Initiatives have been described above in principle 6
3. Does the Company identify and assess potential environmental risks? Y/N
Yes.
4. Does the Company have any project related to Clean Development Mechanism? If so, provide details thereof, in about 50 words or so. Also, if yes, whether any environmental compliance report is filed?
Not applicable, since the Company is in the business of Retail.
5. Has the Company undertaken any other initiatives on – clean technology, energy efficiency, renewable energy, etc. Y/N. If yes, please give hyperlink for web page etc.
The initiatives taken by the Company towards energy conservation during the year under review are given in Annexure - VII of the Directors’ Report. The same is also available on the website of the Company.
6. Are the Emissions/Waste generated by the Company within the permissible limits given by CPCB/ SPCB for the financial year being reported?
Not applicable, since the Company is in the business of Retail.
7. Number of show cause/ legal notices received from CPCB/ SPCB which are pending (i.e. not resolved to satisfaction) as on end of Financial Year.
Not Applicable
Principle 7: Public Policy Advocacy
1. Is your Company a member of any trade and chamber or association? If Yes, Name only those major ones that your business deals with:
The Company generally conveys its policy positions through its membership with Retailers Association of India (RAI). It also holds memberships of other industry associations like Clothing Manufactures Association of India (CMAI), Confederation of Indian Industry (CII) and Federation of Indian Chambers of Commerce & Industry (FICCI). Internationally, the Company is a member of Intercontinental Group of Department Stores (IGDS).
RAI is the unified voice of retailers in India. A not for profit organisation, RAI works with all stakeholders for creating the right environment for the growth of modern retail industry in India. They encourage, develop, facilitate and support retailers to modernise and adopt best practices that will delight customers. RAI is a strong advocate for retailing in India and works with all levels of government and stakeholders.
IGDS is the largest Association for Department Stores worldwide, providing support to the leading Departmental Stores in the world. Shoppers Stop
Annual Report 2017-201878
is the only Indian member of IGDS along with other International Department Stores from all over the world.
2. Have you advocated/lobbied through above associations for the advancement or improvement of public good? Yes/No; if yes specify the broad areas (drop box: Governance and Administration, Economic Reforms, Inclusive Development Policies, Energy security, Water, Food Security, Sustainable Business Principles, Others)
The Company has been actively participating in various seminars, conferences and other forums on issues and policy matters that impact the interest of its stakeholders. Although, the Company is member of the associations, it has not advocated/lobbied in above cases.
Principle 8: Inclusive Growth and Equitable Development.
Corporate Social Responsibility (CSR) is a strategy of a Company to integrate social, environmental and economic concerns in its values and operations to improve the welfare of society and stakeholders. The Company’s philosophy on CSR is not merely donating money for a cause but actively engage the work force in developing best working practices through which we help in building a better community and also by encouraging our associates to take part in voluntary activities and develop firm roots in business as well as in the society.
Our CSR Programme SPARKs executed significant initiatives in 2017-18:
Skilling differently abled is an initiative aimed at increasing social inclusiveness by equipping the differently abled with relevant skills to make them readily employable and self-reliant. With the help of Implementing Agency, the Company has invested ` 64 lacs in skilling 528 PWDs in the year under review, out of which 72% have been successfully employed. The Company has recruited 20 such associates at Shoppers Stop this year. Sign Language certification programme is introduced for effective communication with the associates of differently abled. This training enabled our supervisory staff to communicate with specially abled associates in the stores and make the latter feel more comfortable and included. 44 stores have been covered so far. The various initiatives have been taken and having the vision to create an environment conducive for the physically challenged to overcome their disabilities.
Under the Go Green initiative, the Company has worked on reducing energy consumption, carbon emission, created sustainable energy sourcing and harvested rainwater savings. Three Pet bottle recycling machines have been installed with an investment of ` 20 lacs. We also conducted a drives in Delhi, Gurugram, Chandigarh and Punjab region to increase awareness on ecological well being &
greener tomorrow. Information about saving fuel by switching off engines, ill effects of honking, pollution etc. was spread with help of banners and direct communication with public by our associates.
On Company’s foundation day, we have organized a nationwide blood donation camp covering all the stores across the chain. We have named the event as “Ayushman ho”. We received an amazing response from our associates across 83 stores and collected 2,707 samples of blood resulting in saving 8,121 lives.
For reducing wastage of fashion merchandise by upcycling and recycling merchandise, we have partnered with GOONJ to collect and donate winter wear.
A number of CSR activities are regularly conducted across India, including monetary/non-monetary contribution, volunteering, supporting schools etc.
1. Does the Company have specified programmes/initiatives/ projects in pursuit of the policy related to Principle 8? If yes details thereof.
The Company has identified “Skilling the disabled” and “Inclusiveness of Persons with Disabilities” as one of its core objective. The project has been implemented through PANKH – Wings of Destiny - an initiative by Trust for Retailers & Retail Associates of India. The initiative aims to train people with disabilities and provide them employment opportunities in retail industry. The brief of its impact can be seen from statistics that 62% of such PWDs have been gainfully employed.
2. Are the programmes/ projects undertaken through in-house team/ own foundation/external NGO/government structures/ any other organization?
The Company’s CSR projects are implemented through internal team as well as in partnership with Non-Governmental Organisations (NGOs). Various training & development initiatives are also implemented through internal team as well as with the subject matter experts.
3. Have you done any impact assessment of your initiative?
Periodic review is undertaken on the CSR initiative. Any new initiatives are placed at the CSR Committee meetings for their review and assessment. The response and retention has been very high for these trainees under this initiative.
4. What is your Company’s direct contribution to community development projects - Amount in INR and the details of the projects undertaken?
An amount of ` 84 lacs was spent towards CSR initiatives during the financial year 2017-18. The details thereof are given in Annexure-III of the Directors’ Report.

ST
RA
TE
GIC
RE
PO
RT
ST
AT
UT
OR
Y R
EP
OR
TS
FIN
AN
CIA
L S
TA
TE
ME
NT
S
79
5. Have you taken steps to ensure that this community development initiative is successfully adopted by the community? Please explain.
Yes, the CSR initiative undertaken by the Company does focus on community participation, empowerment and community development.
Principle 9: Engagement with Customers.
The Company follows a policy that is – “We are responsible for what we sell” and always strives to provide the “BEST” value in terms of products and services and adopt best processes for stakeholders, thereby matching global standards of performance. The Company aims to create an environment which is unique and enjoyable for the customer.
WHY SHOP WITH SHOPPERS STOP
a) Shop Anytime & Anywhere: Whether shop online or in store to get the same experience in terms of merchandise, price & service.
b) We curate collections from the best brands, trends, colours, fabrics, patterns to bring a deep fashion selection wide across Men, Women, Kids, Fashion Accessories and Home categories.
c) Return & Exchange at any store.
d) 100% Original Guaranteed: All our products are sourced directly from the brands and carry brand warranty and genuineness certificate.
e) We offer free alteration at any store and for products purchased online as well.
f) Get personalised shopping assistance through our Personal Shoppers Programme.
g) Shoppersstop.com offers a remarkable shopping experience with an assortment of the leading international and national brands.
1. What percentage of customer complaints/consumer cases are pending as on the end of financial year.
Customer Satisfaction is of utmost important for the Company. As on March 31, 2018, there are no customer complaint pending and there are 6 ongoing consumer cases.
2. Does the Company display product information on the product label, over and above what is mandated as per local laws? Yes/No/ N.A./ Remarks (additional information)
Yes. The Company displays all the requisite information on product lables as per the law.
3. Is there any case filed by any stakeholder against the Company regarding unfair trade practices, irresponsible advertising and/or anti-competitive behavior during the last five years and pending as on end of financial year. If so, provide details thereof.
There are no cases pending in relation to unfair trade practices, irresponsible advertising and/or anticompetitive behavior. However, dissatisfied customers of the Company generally file their cases in consumer protection forums for alleged deficiency in expected level of service by the Company, in the normal course of business, which the Company defends appropriately.
4. Did your Company carry out any consumer survey/ consumer satisfaction trends?
Yes. Consumer Satisfaction Surveys are conducted periodically through formal and informal means to access the consumer satisfaction levels and consumer’s trends.
Annual Report 2017-201880
INDEPENDENT AUDITORS’ CERTIFICATEINDEPENDENT AUDITOR’S REPORT ON COMPLIANCE WITH THE CONDITIONS OF CORPORATE GOVERNANCE AS PER PROVISIONS OF CHAPTER IV OF SECURITIES AND EXCHANGE BOARD OF INDIA (LISTING OBLIGATIONS AND DISCLOSURE REQUIREMENTS) REGULATIONS, 2015
To,
The Members of Shoppers Stop Limited
1. The Corporate Governance Report prepared by Shoppers Stop Limited (hereinafter the “Company”), contains details as required by the provisions of Chapter IV of Securities and Exchange Board of India (Listing Obligations and Disclosure Requirements) Regulations, 2015, as amended (“the Listing Regulations”) (‘Applicable criteria’) with respect to Corporate Governance for the year ended March 31, 2018. This report is required by the Company for annual submission to the Stock exchange and to be sent to the Shareholders of the Company.
Management’s Responsibility
2. The preparation of the Corporate Governance Report is the responsibility of the Management of the Company including the preparation and maintenance of all relevant supporting records and documents. This responsibility also includes the design, implementation and maintenance of internal control relevant to the preparation and presentation of the Corporate Governance Report.
3. The Management along with the Board of Directors are also responsible for ensuring that the Company complies with the conditions of Corporate Governance as stipulated in the Listing Regulations, issued by the Securities and Exchange Board of India.
Auditor’s Responsibility
4. Pursuant to the requirements of the Listing Regulations, our responsibility is to express a reasonable assurance in the form of an opinion whether the Company has complied with the specific requirements of the Listing Regulations referred to in paragraph 3 above.
5. We conducted our examination of the Corporate Governance Report in accordance with the Guidance Note on Reports or Certificates for Special Purposes and the Guidance Note on Certification of Corporate Governance, both issued by the Institute of Chartered Accountants of India (“ICAI”). The Guidance Note on Reports or Certificates for Special Purposes requires that we comply with the ethical requirements of the Code of Ethics issued by the Institute of Chartered Accountants of India.
6. We have complied with the relevant applicable requirements of the Standard on Quality Control (SQC) 1, Quality Control for Firms that Perform Audits and Reviews of Historical Financial Information, and Other Assurance and Related Services Engagements.
7. The procedures selected depend on the auditor’s judgement, including the assessment of the risks associated in compliance of the Corporate Governance Report with the applicable criteria. Summary of key procedures performed include:
i. Reading and understanding of the information prepared by the Company and included in its Corporate Governance Report;
ii. Obtained and verified that the composition of the Board of Directors w.r.t executive and non-executive directors has been met throughout the reporting period;
iii. Obtained and read the Directors Register as on March 31, 2018 and verified that at least one women director was on the Board during the year;
iv. Obtained and read the minutes of the following meetings held between May 5, 2017 to January 31, 2018:
(a) Board of Directors meeting;
(b) Audit committee;
(c) Annual General meeting;
(d) Extraordinary General Meeting:
(e) Nomination and remuneration and Corporate Governance committee;
(f) Stakeholders Relationship Committee;
v. Obtained necessary representations and declarations from Directors of the Company including the Independent Directors ; and
vi. Performed necessary inquiries with the management and also obtained necessary specific representations from management.
The above-mentioned procedures include examining evidence supporting the particulars in the Corporate Governance Report on a test basis. Further, our scope of work under this report did not involve us performing audit tests for the purposes of expressing an opinion on the fairness or accuracy of any of the financial information or the financial statements of the Company taken as a whole.
Opinion
8. Based on the procedures performed by us as referred in paragraph 7 above, and according to the information
ST
RA
TE
GIC
RE
PO
RT
ST
AT
UT
OR
Y R
EP
OR
TS
FIN
AN
CIA
L S
TA
TE
ME
NT
S
81
and explanations given to us, we are of the opinion that the Company has complied with the conditions of Corporate Governance as stipulated in the Listing Regulations, as applicable for the year ended March 31, 2018.
Other matters and Restriction on Use
9. This report is neither an assurance as to the future viability of the Company nor the efficiency or effectiveness with which the management has conducted the affairs of the Company.
10. This report is addressed to and provided to the members of the Company solely for the purpose of enabling it to comply with its obligations under the Listing Regulations with reference to compliance with the relevant regulations of Corporate Governance and should not be used by any other person or for any other purpose. Accordingly, we do not accept or assume any liability or any duty of care or for any other purpose or to any other party to whom it is shown or into whose hands it may come without our prior consent in writing. We have no responsibility to update this report for events and circumstances occurring after the date of this report.
For S R B C & CO LLPChartered Accountants
ICAI Firm Registration Number: 324982E/E300003
per Vijay ManiarPartner
Membership Number: 36738Place of Signature: MumbaiDate: April 27, 2018
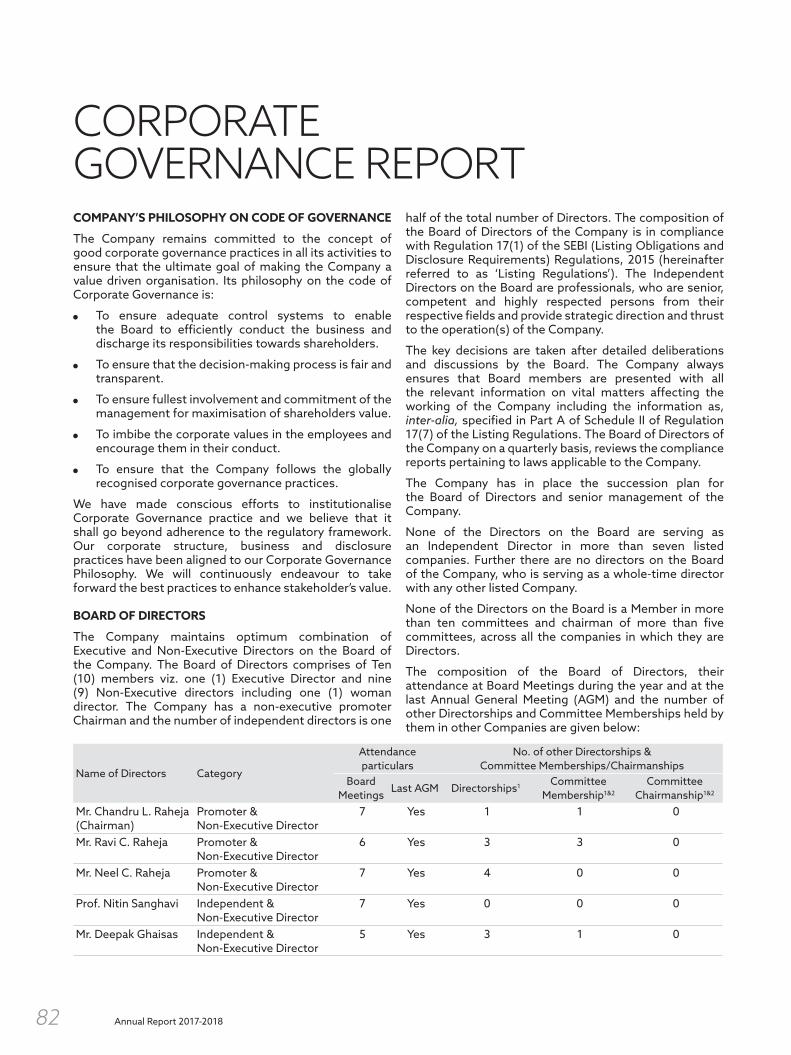
Annual Report 2017-201882
CORPORATE GOVERNANCE REPORTCOMPANY’S PHILOSOPHY ON CODE OF GOVERNANCE
The Company remains committed to the concept of good corporate governance practices in all its activities to ensure that the ultimate goal of making the Company a value driven organisation. Its philosophy on the code of Corporate Governance is:
To ensure adequate control systems to enable the Board to efficiently conduct the business and discharge its responsibilities towards shareholders.
To ensure that the decision-making process is fair and transparent.
To ensure fullest involvement and commitment of the management for maximisation of shareholders value.
To imbibe the corporate values in the employees and encourage them in their conduct.
To ensure that the Company follows the globally recognised corporate governance practices.
We have made conscious efforts to institutionalise Corporate Governance practice and we believe that it shall go beyond adherence to the regulatory framework. Our corporate structure, business and disclosure practices have been aligned to our Corporate Governance Philosophy. We will continuously endeavour to take forward the best practices to enhance stakeholder’s value.
BOARD OF DIRECTORS
The Company maintains optimum combination of Executive and Non-Executive Directors on the Board of the Company. The Board of Directors comprises of Ten (10) members viz. one (1) Executive Director and nine (9) Non-Executive directors including one (1) woman director. The Company has a non-executive promoter Chairman and the number of independent directors is one
half of the total number of Directors. The composition of the Board of Directors of the Company is in compliance with Regulation 17(1) of the SEBI (Listing Obligations and Disclosure Requirements) Regulations, 2015 (hereinafter referred to as ‘Listing Regulations’). The Independent Directors on the Board are professionals, who are senior, competent and highly respected persons from their respective fields and provide strategic direction and thrust to the operation(s) of the Company.
The key decisions are taken after detailed deliberations and discussions by the Board. The Company always ensures that Board members are presented with all the relevant information on vital matters affecting the working of the Company including the information as, inter-alia, specified in Part A of Schedule II of Regulation 17(7) of the Listing Regulations. The Board of Directors of the Company on a quarterly basis, reviews the compliance reports pertaining to laws applicable to the Company.
The Company has in place the succession plan for the Board of Directors and senior management of the Company.
None of the Directors on the Board are serving as an Independent Director in more than seven listed companies. Further there are no directors on the Board of the Company, who is serving as a whole-time director with any other listed Company.
None of the Directors on the Board is a Member in more than ten committees and chairman of more than five committees, across all the companies in which they are Directors.
The composition of the Board of Directors, their attendance at Board Meetings during the year and at the last Annual General Meeting (AGM) and the number of other Directorships and Committee Memberships held by them in other Companies are given below:
Name of Directors Category
Attendance particulars
No. of other Directorships & Committee Memberships/Chairmanships
Board Meetings
Last AGM Directorships1 Committee Membership1&2
Committee Chairmanship1&2
Mr. Chandru L. Raheja(Chairman)
Promoter & Non-Executive Director
7 Yes 1 1 0
Mr. Ravi C. Raheja Promoter & Non-Executive Director
6 Yes 3 3 0
Mr. Neel C. Raheja Promoter & Non-Executive Director
7 Yes 4 0 0
Prof. Nitin Sanghavi Independent & Non-Executive Director
7 Yes 0 0 0
Mr. Deepak Ghaisas Independent & Non-Executive Director
5 Yes 3 1 0

ST
RA
TE
GIC
RE
PO
RT
ST
AT
UT
OR
Y R
EP
OR
TS
FIN
AN
CIA
L S
TA
TE
ME
NT
S
83
Name of Directors Category
Attendance particulars
No. of other Directorships & Committee Memberships/Chairmanships
Board Meetings
Last AGM Directorships1 Committee Membership1&2
Committee Chairmanship1&2
Mr. Nirvik Singh Independent & Non-Executive Director
1 Yes 1 0 1
Ms. Abanti Sankaranarayanan
Independent & Non-Executive Director
1 Yes 1 0 0
Mr. Manish Chokhani Independent & Non-Executive Director
5 No 5 4 0
Mr. Gareth Thomas* Independent & Non-Executive Director
2 Yes 0 0 0
Mr. B. S. Nagesh(Vice Chairman)
Non-Executive Director 7 Yes 2 2 0
Mr. Govind Shrikhande(Managing Director)
Executive Director 7 Yes 5 0 1
Notes:
1. The other Directorships and Chairmanships/Memberships of committees held in foreign companies, private limited companies and companies incorporated u/s 8 of the Companies Act, 2013 are excluded.
2. The Chairmanship and Membership of Audit Committee and Stakeholders Relationship Committee alone are considered.
3. Mr. Ravi C. Raheja and Mr. Neel C. Raheja are sons of Mr. Chandru L. Raheja. No other Director is related to any other Director of the Company.
4. Mr. Gareth Thomas, Independent & Non-Executive Director of the Company stepped down from the Directorship of the Company w.e.f. October 26, 2017.
During the year under review, the Board of Directors met seven times i.e. on May 5, 2017; July 28, 2017; September 23, 2017; October 5, 2017; October 26, 2017; December 19, 2017 and January 31, 2018. The maximum interval between any two Meetings during this period did not exceed one hundred and twenty days as per provisions of Companies Act, 2013 and Listing Regulations.
Dates for the Board Meetings for the ensuing financial year are decided well in advance and communicated to the Directors.
SEPARATE MEETING OF THE INDEPENDENT DIRECTORS
As stipulated under the Companies Act, 2013 and Listing Regulations, a separate meeting of the Independent Directors of the Company was held, without the attendance of Non-Independent Directors and members of the management of the Company.
FAMILIARISATION PROGRAMME FOR INDEPENDENT DIRECTORS
There is a familiarisation programme for Independent Directors which also extends to other Non-Executive Directors. It aims to familiarise them with the Company, nature of the retail industry, business model, processes & policies, etc., and also seeks to update them on the roles, responsibilities, rights and duties under the Companies Act, 2013 and other statutes.
The Presentations are regularly made to the Board of Directors/ Audit Committee/ Nomination and Remuneration & Corporate Governance Committee on various related matters, where Directors interact with Management Committee members of the Company. These Presentations, inter-alia, cover the Company’s strategy, business model, operations, markets, products, finance, risk management framework, financial performance, budget & control process and such other area as may arise from time to time.
The details of the said programme have been posted on the Company’s website at web link: https://corporate.shoppersstop.com/Investors/Training.aspx
PERFORMANCE EVALUATION
During the year, the Board adopted a process for evaluating its performance and effectiveness as well as that of its committees and directors. The exercise was carried out through a structured questionnaire covering various aspects, such as Board composition and quality, strategy and risk management, relation with the management, board meetings and procedures. Further, a separate exercise was carried out to evaluate the performance of individual Directors, based on their participation at Board & Committee meetings and contribution therein.

Annual Report 2017-201884
REMUNERATION OF DIRECTORS
Compensation paid/payable to Non-Executive Directors during the year is as under:
Name of Non-Executive Directors Commission ( ` ) *Sitting Fees ( ` ) Total (`)Mr. Chandru L. Raheja - 350,000 350,000Mr. Ravi C. Raheja - 460,000 460,000Mr. Neel C. Raheja - 350,000 350,000Prof. Nitin Sanghavi 300,000 510,000 810,000Mr. Deepak Ghaisas 600,000 370,000 970,000Mr. Nirvik Singh 300,000 50,000 350,000Ms. Abanti Sankaranarayanan 300,000 50,000 350,000Mr. Manish Chokhani 300,000 370,000 670,000Mr. Gareth Thomas# - 100,000 100,000Mr. B. S. Nagesh 300,000 350,000 650,000Total 21,00,000 2,960,000 5,060,000
* The sitting fees for attending each Board Meeting and Audit Comittee meeting is ` 50,000/- and ` 40,000/-, respectively.# An amount of ` 75,000/- is paid to Mr. Gareth Thomas, for providing training and advisory services to the senior management of the Company.
CRITERIA FOR PAYMENT OF COMMISSION TO NON-EXECUTIVE DIRECTORS
The Nomination and Remuneration & Corporate Governance Committee and the Board of Directors had decided that the criteria for payment of commission to Non-Executive Directors would be on the basis of
collective performance and not individual performance. However, the Chairman of Audit Committee would be paid an additional amount as commission for the year under review. It was also decided that for members who are using their intellectual capabilities and putting additional time and resources with the Management of the Company will be compensated with additional Commission.
REMUNERATION PAID TO MR. GOVIND SHRIKHANDE, MANAGING DIRECTOR Amount in `
Salary* Perquisites Contribution to Fund Total47,763,580 307,640 1,844,712 49,915,932
* Includes Long-Term Incentive of ` 6,909,032/-. Such incentive is linked to the performance of the Company and of the Managing Director and is based on various qualitative and quantitative performance criterion.
ESOPS
Details of stock options held by Mr. Govind Shrikhande, Managing Director under the ESOP Scheme 2008 are as under.Scheme Date of Grant Options Granted Options vested
and exercisedGrant price per
equity share (` )Vesting period Exercise Period
ESOP 2008 - 5 28.08.13 13,650 13,650 344 3 Years 4 yearsESOP 2008 - 6 29.04.14 9,200 2,760 362 3 Years 4 years
SERVICE CONTRACT, SEVERANCE FEES AND NOTICE PERIOD:
Mr. Govind Shrikhande was re-appointed as a Managing Director of the Company for a period of 3 years w.e.f. July 29, 2016. There is no separate provision for payment of any severance fees. There is a notice period of three months from either side.
AUDIT COMMITTEE
The Company has constituted an Audit Committee in the year 2001. The role, powers and functions of the Committee is in accordance with the Listing Regulations and Section 177 of the Companies Act, 2013.
The Audit Committee comprises of four Non-Executive Directors, of which atleast two-third are Independent Directors. The members of the Committee possess sound knowledge of finance & accounts. The composition
of the Committee is in compliance with Regulation 18(1) of the Listing Regulations and the Companies Act, 2013. The Audit Committee invites such of the executives, as it considers appropriate to be present at the meetings of the Committee. The Managing Director, Chief Executive Officer, Chief Financial Officer, Invitees of the Management Committee of the Company, representatives of the Internal Auditors and Statutory Auditors are also present at the Audit Committee Meetings.
During the year under review, the Committee met four times i.e. on May 4, 2017; July 27, 2017; October 25, 2017 and January 31, 2018, wherein which the requisite quorum as prescribed under the Listing Regulations was present.
The Composition of the Audit Committee and the attendance of the members at the meetings held are as follows:

ST
RA
TE
GIC
RE
PO
RT
ST
AT
UT
OR
Y R
EP
OR
TS
FIN
AN
CIA
L S
TA
TE
ME
NT
S
85
Name of Member Status CategoryNo. of
meetings attended
Mr. Deepak Ghaisas
Chairman Independent Director
3
Mr. Ravi C. Raheja
Member Non-Independent Director
4
Prof. Nitin Sanghavi
Member Independent Director
4
Mr. Manish Chokhani
Member Independent Director
3
Mr. Bharat Sanghavi, Company Secretary of the Company acts as the Secretary to the Committee.
The brief description of terms of reference of the Audit Committee, inter-alia, are as under:
1. Oversight of the Company’s financial reporting process and the disclosure of its financial information to ensure that the financial statement is correct, sufficient and credible;
2. Recommendation for appointment, remuneration and terms of appointment of auditors i.e. statutory and internal auditor of the Company;
3. Approval of payment to auditors i.e. Statutory and Internal auditor for any other services rendered by them;
4. Reviewing, with the management, the annual financial statements and auditors report thereon before submission to the board for approval, with particular reference to:
(a) Matters required to be included in the Directors’ Responsibility Statement to be included in the Board’s report in terms of clause (c) of sub-section 3 of Section 134 of the Companies Act, 2013.
(b) Changes, if any, in accounting policies and practices and reasons for the same.
(c) Major accounting entries involving estimates based on the exercise of judgement by management.
(d) Significant adjustments made in the financial statements arising out of audit findings.
(e) Compliance with listing and other legal requirements relating to financial statements.
(f) Disclosure of any related party transactions.
(g) Qualifications in the draft audit report.
5. Reviewing, with the management, the quarterly financial statements before submission to the board for approval;
6. Reviewing, with the management, the statement of uses/application of funds raised through an issue
(public issue, rights issue, preferential issue, etc.), the statement of funds utilised for purposes other than those stated in the offer document/ prospectus/ notice and the report submitted by the monitoring agency monitoring the utilisation of proceeds of a public or rights issue, and making appropriate recommendations to the Board to take up steps in this matter;
7. Review and monitor the auditor’s independence and performance, and effectiveness of audit process;
8. Approval or any subsequent modification of transactions of the Company with related parties;
9. Scrutiny of inter-corporate loans and investments;
10. Valuation of undertakings or assets of the Company, wherever it is necessary;
11. Evaluation of internal financial controls and risk management systems;
12. Reviewing with the management, performance of statutory & internal auditors, adequacy of the internal control systems;
13. Reviewing the adequacy of internal audit function, if any, including the structure of the internal audit department, staffing and seniority of the official heading the department, reporting structure coverage and frequency of internal audit;
14. Discussion with internal auditors of any significant findings and follow up there on;
15. Reviewing the findings of any internal investigations by the internal auditors into matters where there is suspected fraud or irregularity or a failure of internal control systems of a material nature and reporting the matter to the Board;
16. Discussion with statutory auditors before the audit commences, about the nature and scope of audit as well as post-audit discussion to ascertain any area of concern;
17. To look into the reasons for substantial defaults in the payment to the depositors, debenture holders, shareholders (in case of non-payment of declared dividends) and creditors;
18. To review the functioning of the Whistle Blower mechanism;
19. Approval of appointment of CFO (i.e., the whole-time Finance Director or any other person heading the finance function or discharging that function) after assessing the qualifications, experience and background, etc. of the candidate;
20. Carrying out any other function as may be decided by the Board and is mentioned in the terms of reference of the Audit Committee.

Annual Report 2017-201886
NOMINATION, REMUNERATION & CORPORATE GOVERNANCE COMMITTEE
The Company has constituted a Nomination, Remuneration & Corporate Governance Committee in the year 2001. The role of the committee is in accordance with Part D of Schedule II of Regulation 19(4) of the Listing Regulations and Section 178 of the Companies Act, 2013.
The Nomination, Remuneration & Corporate Governance Committee comprises of three Non-Executive Directors, of which more than fifty percent are Independent Directors. The composition of the Committee is in compliance with Regulation 19(1) of the Listing Regulations and Section 178 of the Companies Act, 2013.
During the year under review, the Committee met five times i.e. on May 5, 2017; July 28, 2017; October 26, 2017; December 19, 2017 and January 31, 2018.
The composition of Nomination, Remuneration & Corporate Governance Committee and the attendance of its members at the meetings held are as follows:
Name of Member Status CategoryNo. of
meetings attended
Mr. Nirvik Singh Chairman Independent Director
1
Prof. Nitin Sanghavi Member Independent Director
5
Mr. Neel C. Raheja Member Non-Independent Director
5
Mr. BVM Rao, Head – Human Resources of the Company acts as the Secretary to the Committee.
The broad terms of reference of the Nomination, Remuneration & Corporate Governance Committee, inter-alia, are as under:
1. Formulation of the criteria for determining qualifications, positive attributes and independence of a director and recommend to the Board a policy, relating to the appointment, removal and remuneration of the directors, key managerial personnel and senior management i.e. one level below the Board which includes functional heads of the Company.
In formulating the aforesaid policy, following needs to be considered:
(a) The level and composition of remuneration is reasonable and sufficient to attract, retain and motivate directors of the quality required to run the Company successfully;
(b) Relationship of remuneration to performance is clear and meets appropriate performance benchmarks; and
(c) Remuneration to directors, key managerial personnel and senior management involves a balance between fixed and incentive pay reflecting
short and long-term performance objectives appropriate to the working of the Company and its goals.
2. Formulation of criteria for evaluation of every Director’s performance.
3. Devising a policy on Board’s diversity.
4. Identifying persons who are qualified to become directors and who may be appointed in senior management in accordance with the criteria laid down and recommend to the Board their appointment and removal.
5. To determine and recommend to the Board of Directors of the Company for payment of remuneration to executive directors, sitting fees and commission to Non-Executive Directors of the Company.
6. Allotment of equity shares of the Company on account of exercise of vested Employee Stock Option Schemes (ESOPs) from time to time.
REMUNERATION POLICY
The Board of Directors has on the recommendation of the Nomination and Remuneration & Corporate Governance Committee framed a policy for selection and appointment of Directors, Senior Management and their remuneration. The said policy is provided in Annual Report.
STAKEHOLDERS RELATIONSHIP COMMITTEE
The Company has constituted a Stakeholders Relationship Committee in the year 2004. The role, powers and functions of the committee is in accordance with Part D of Schedule II of Regulation 20(4) of the Listing Regulations and Section 178 of the Companies Act, 2013. The composition of the Committee is in compliance with Regulation 20 of the Listing Regulations and the Companies Act, 2013.
During the year, the Committee met two times i.e. on December 19, 2017 and January 31, 2018.
The composition of Stakeholders Relationship Committee and the attendance of its members at the meetings are as follows:
Name of Member Status CategoryNo. of
meetings attended
Mr. Ravi C. Raheja Chairman Non-Independent Director
2
Mr. Neel C. Raheja Member Non-Independent Director
2
Mr. B. S. Nagesh Member Non-Independent Director
2
Mr. Bharat Sanghavi, Company Secretary is the Compliance Officer of the Company.
The broad terms of reference of the Stakeholders Relationship Committee, inter-alia, are as under:

ST
RA
TE
GIC
RE
PO
RT
ST
AT
UT
OR
Y R
EP
OR
TS
FIN
AN
CIA
L S
TA
TE
ME
NT
S
87
1. Redressal of shareholders grievances.
2. Oversees the performance of the Registrar and Share Transfer Agents of the Company and recommends measures for overall improvement in the quality of investor services.
During the year, the Company has received 4 (Four) Communications/grievances, which were attended and resolved to the satisfaction of the Shareholders. No grievances were pending at the year end.
GENERAL BODY MEETINGS
Details of Annual General Meetings (AGM) held during last three years:
AGM for Financial Year ended
Date & TimeSpecial Resolutionspassed thereat
Location
2016-2017 July 28, 2017 at 3:30 p.m.
No special resolution has been passed. Boundary Hall, First Floor, MCA Recreation Centre, RG-2, G-Block, Bandra-Kurla Complex, Bandra (E), Mumbai - 400 051
2015-2016 July 29, 2016 at 3:30 p.m.
No special resolution has been passed. Boundary Hall, First Floor, MCA Recreation Centre, RG-2, G-Block, Bandra-Kurla Complex, Bandra (E), Mumbai - 400 051
2014-2015 July 31, 2015 at 3:30 p.m.
1. To approve Material Related Party Transactions under Clause 49 of the Listing Agreement.
2. To adopt new Articles of Association of the Company containing regulations in conformity with the Companies Act, 2013.
3. To approve offer or invitation to subscribe to Non-Convertible Debentures on private placement.
National Stock Exchange of India Ltd., situated atExchange Plaza, Dr. R. H. Patil Auditorium, Ground Floor, Bandra-Kurla Complex, Bandra (E), Mumbai - 400 051
During the year under review, an Extra-ordinary General Meeting was held on October 18, 2017 at 5.00 p.m. at Boundary Hall, First Floor, MCA Recreation Centre, RG-2, G-Block, Bandra-Kurla Complex, Bandra (E), Mumbai - 400 051 for seeking approval of members of the Company by way of special resolution for issuance of 43,95,925 equity shares of the Company at a price of ` 407.78/- to Amazon.com NV Investment Holdings LLC on private placement basis.
POSTAL BALLOT
As per Section 110 of the Companies Act, 2013 read with Rule 22 of the Companies (Management and Administration) Rules, 2014, during the year under review, the following special resolutions were passed by members of the Company through Postal Ballot on June 14, 2017 and November 13, 2017. Details of the postal ballot process followed in these regard are as under:
1. Special resolution passed by members of the Company through Postal Ballot on June 14, 2017
Approval of members was sought by way of special resolution authorising the Board of Directors of the Company or Committee thereof to (i) give any loans
to any person or other body corporate and/or (ii) give any guarantees or to provide security in connection
with a loan to any other body corporate or person and/or
(iii) acquire by way of subscription, purchase or otherwise, the securities of any other body corporate,
upto (i) maximum amount of ` 1,135 crores (Rupees One Thousand One Hundred Thirty Five Crores), or (ii) the maximum limits so prescribed under Section
186 of the Act (as may be amended from time to time), whichever is higher.
Voting Pattern and Procedure for Postal Ballot
The Board of Directors of the Company had appointed Mr. Soumitra Mujumdar, Practicing Company Secretary, as a Scrutiniser for conducting the Postal Ballot/e-voting process in a fair and transparent manner.
All postal ballot forms received upto June 14, 2017 and e-votes received upto 5.00 p.m. on the said date were considered for scrutiny. Envelopes/e-votes received after this date were not considered for scrutiny.
The results of the Postal Ballot were announced on June 15, 2017 at the Registered Office of the Company. The details of voting are as follows:
In favour Against
No. of Postal Ballots Received
No. of Votes% of total valid votes
polled
No. of Postal Ballots
ReceivedNo. of Votes
% of total valid votes
polled
150 73,035,154 98.90 36 812,069 1.10

Annual Report 2017-201888
2. Special resolution passed by members of the Company through Postal Ballot on November 13, 2017
Approval of members was sought by way of special resolution for disposing-off of 77,158,778 Equity Shares of ` 10 each of Hypercity Retail (India) Limited, a subsidairy of the Company to Future Retail Limited.
Voting Pattern and Procedure for Postal Ballot
The Board of Directors of the Company had appointed Mr. Kaushal Dalal, Practicing Company Secretary, as a
Scrutiniser for conducting the voting through Postal Ballot/e-voting process in a fair and transparent manner.
All postal ballot forms received upto November 13, 2017 and e-votes received upto 5.00 p.m. on the said date were considered for scrutiny. Envelopes/ e-votes received after this date were not considered for scrutiny.
The results of the Postal Ballot were announced on November 14, 2017 at the Registered Office of the Company. The details of voting are as follows:
In favour Against
No. of Postal Ballots Received
No. of Votes% of total valid votes
polledNo. of Postal Ballots
ReceivedNo. of Votes
% of total valid votes polled
122 77,044,958 99.35 24 501,201 0.65
Further, no special resolution is proposed to be passed through postal ballot on the date of this report.
RELATED PARTY TRANSACTIONS
The Company has formulated a Related Party Transaction Policy including therein the materiality of related party transaction and determination of material subsidiaries, which has been posted on the website of the Company and is accessible at the web link: https://corporate.shoppersstop.com/uploaded_files/70ad1c1-7375.pdf.
During the year under review, all related party transactions were on arm’s length basis and in the ordinary course of business. All Related Party Transactions have been approved by the Audit Committee and the Board of Directors and there were no materially significant related party transactions that may have potential conflict with the interests of the Company at large.
The Audit Committee and the Board of Directors have granted its omnibus approval for transactions which are repetitive in nature and has laid down the criteria of such approval. A statement of related party transactions entered into with related parties through omnibus approval is presented to the Audit Committee and Board of Directors on a quarterly basis.
SUBSIDIARY COMPANIES
Under Listing Regulations, a ‘material subsidiary’ is a subsidiary, whose income or net worth exceeds 20% of the consolidated income or net worth respectively, of the listed entity and its subsidiaries in the immediately preceding accounting year.
In this regard, Hypercity Retail (India) Ltd. (Hypercity); a 51% subsidiary, ceased to be material subsidiary of the Company with effect from November 30, 2017, consequent to sale of entire equity shareholding of Hypercity to Future Retail Limited.
The Audit Committee reviews the financial statement & any investment made by the subsidiaries, if any, on quarterly basis and Board of Directors of the Company, inter-alia, review the annual financial statements of
subsidiaries which are duly consolidated with annual financial statements of the Company.
The Board of Directors of the Company also reviews minutes of the Board Meetings of all subsidiary companies.
DISCLOSURE FROM SENIOR MANAGEMENT
The Company has obtained a certificate from all the senior management personnel of the Company disclosing that they do not have any material, financial and commercial transactions to disclose and there is no potential conflict with the interest of the Company at large during the year under review.
COMPLIANCE REPORT ON CORPORATE GOVERNANCE
The Company submits on quarterly basis a compliance report on corporate governance within fifteen days from the close of the quarter with BSE Limited and National Stock Exchange of India Limited. The said report is placed before the Board of Directors every quarter for their comments/ observations/ advice if any.
WEBSITE
All the information and disclosures required to be disseminated as per Listing Regulations and Companies Act, 2013, are being posted at Company’s website: www.shoppersstop.com.
DISCLOSURE OF ACCOUNTING TREATMENT
The financial statements of the Company comply with the Accounting Standards referred to in the Companies Act, 2013.
RISK MANAGEMENT
The Board of Directors has constituted a Risk Management Committee consisting of Mr. Ravi Raheja as a Chairman, Mr. Manish Chokhani – Director, Mr. Govind Shrikhande – Managing Director, as Members of the Committee.
The Board of Directors of the Company has framed the Risk Management Policy and has laid down the procedures for risk assessment and its minimisation.

ST
RA
TE
GIC
RE
PO
RT
ST
AT
UT
OR
Y R
EP
OR
TS
FIN
AN
CIA
L S
TA
TE
ME
NT
S
89
DETAILS OF NON-COMPLIANCE ON MATTERS RELATING TO CAPITAL MARKET
There have been no instances of non-compliances by the Company and no penalties and/or strictures have been imposed on the Company by Stock Exchanges or SEBI or any statutory authority on any matter related to the capital markets during the last three years.
CODE OF CONDUCT FOR PREVENTION OF INSIDER TRADING PRACTICES
In compliance with the SEBI (Prohibition of Insider Trading) Regulations, 2015, the Company has formulated, adopted and implemented ‘Shoppers Stop Code of Internal Procedures and Conduct for Regulating, Monitoring and Reporting Trading by Insiders’ and ‘Code of Fair Disclosure of Unpublished Price Sensitive Information’ for dealing in the shares of the Company by insiders.
CODE OF CONDUCT FOR ALL BOARD MEMBERS AND SENIOR MANAGEMENT PERSONNEL
The Company has adopted the Code of Conduct for all Board members and senior management personnel of the Company. This Code is posted on the website of the Company. All Board members and senior management personnel have confirmed compliance to the Code of Conduct. A declaration signed by the Managing Director of the Company to this effect is annexed and forms part of the Annual Report.
CODE OF CONDUCT AND ETHICS FOR INDEPENDENT DIRECTORS
The Company has adopted the Code of Conduct and Ethics for Independent Directors which includes the duties of Independent Directors as laid down in the Companies Act, 2013. All Independent Directors have confirmed compliance to the Code of Conduct.
WHISTLE BLOWER POLICY/ VIGIL MECHANISM
The Company has established Vigil Mechanism and adopted whistle blower policy for its directors and employees to report concerns about unethical behaviour, actual or suspected fraud or violation of the Company’s code of conduct or ethics policy. The mechanism provides adequate safeguards against victimisation of persons who use such mechanism. They have direct access to the
Chairman of the Audit Committee and no one has been denied access thereto. The Company has formulated a Whistle Blower Policy, and a brief detail thereof has been posted on the website of the Company and is accessible at the web link http://corporate.shoppersstop.com/uploaded_files/ce848df-1585.pdf.
COMPLIANCE WITH DISCRETIONARY REQUIREMENTS
The Company has voluntarily complied with the discretionary requirements relating to separate position of Chairman and Managing Director/Chief Executive Officer as per Regulation 27(1) of the Listing Regulations.
MANAGEMENT DISCUSSION AND ANALYSIS
Management Discussion and Analysis is given as a separate section in the Annual Report.
MD, CEO & CFO CERTIFICATION
The MD, CEO and the Deputy CFO of the Company has issued certificate pursuant to the provisions of Regulation 17(8) of the Listing Regulations, certifying, inter-alia, that the financial statements do not contain any materially untrue statement and these statements represent a true and fair view of the Company’s affairs. The said certificate is annexed and forms part of this Annual Report.
MEANS OF COMMUNICATION
The quarterly results are published in newspapers within 48 hours of the Board Meeting, generally in Economic Times and Maharashtra Times and the same are also posted on the Company’s website immediately. At the end of each quarter, the Company does a Conference call with the analysts in order to clarify their doubts and queries.
The domain name of the Company’s website is www.shoppersstop.com and upto date financial results, official press releases and the other information about the Company and its business are available on the website.
Presentations made to the institutional investors or to the analysts are immediately posted on Company’s website in order to share the information with public at large.
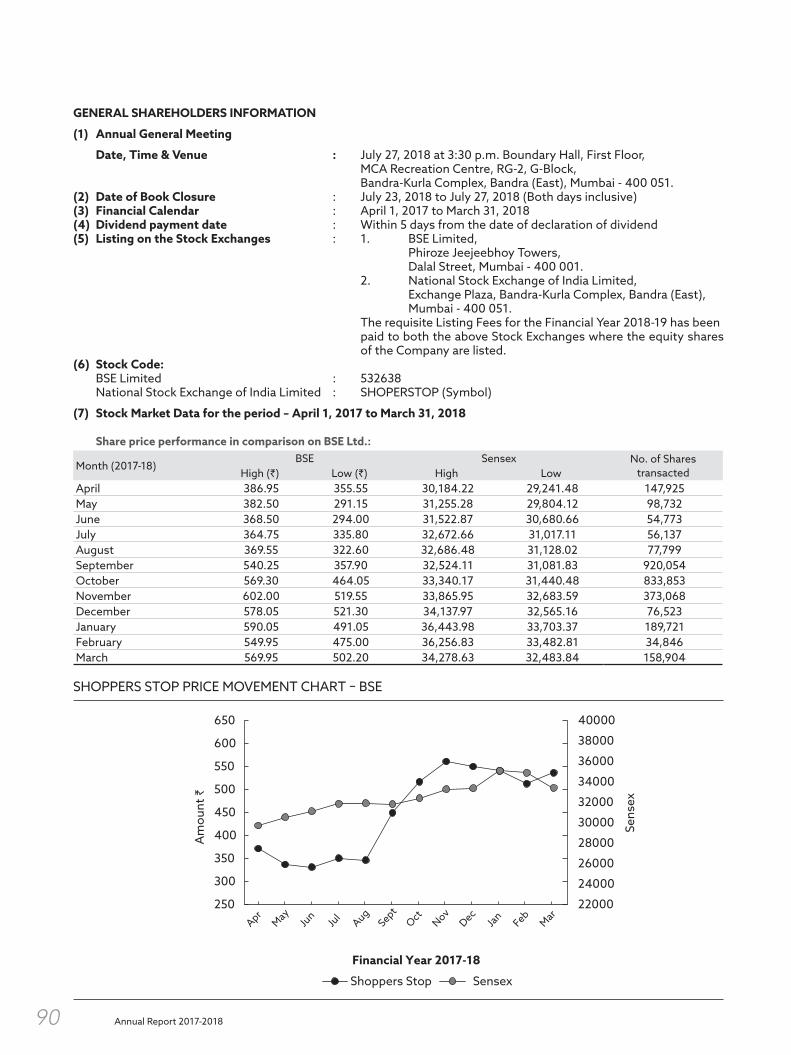
Annual Report 2017-201890
GENERAL SHAREHOLDERS INFORMATION
(1) Annual General Meeting
Date, Time & Venue : July 27, 2018 at 3:30 p.m. Boundary Hall, First Floor, MCA Recreation Centre, RG-2, G-Block, Bandra-Kurla Complex, Bandra (East), Mumbai - 400 051.(2) Date of Book Closure : July 23, 2018 to July 27, 2018 (Both days inclusive)(3) Financial Calendar : April 1, 2017 to March 31, 2018(4) Dividend payment date : Within 5 days from the date of declaration of dividend(5) Listing on the Stock Exchanges : 1. BSE Limited, Phiroze Jeejeebhoy Towers, Dalal Street, Mumbai - 400 001. 2. National Stock Exchange of India Limited, Exchange Plaza, Bandra-Kurla Complex, Bandra (East), Mumbai - 400 051. The requisite Listing Fees for the Financial Year 2018-19 has been
paid to both the above Stock Exchanges where the equity shares of the Company are listed.
(6) Stock Code: BSE Limited : 532638 National Stock Exchange of India Limited : SHOPERSTOP (Symbol)
(7) Stock Market Data for the period – April 1, 2017 to March 31, 2018
Share price performance in comparison on BSE Ltd.:
Month (2017-18)BSE Sensex No. of Shares
transactedHigh (`) Low (`) High Low April 386.95 355.55 30,184.22 29,241.48 147,925May 382.50 291.15 31,255.28 29,804.12 98,732June 368.50 294.00 31,522.87 30,680.66 54,773July 364.75 335.80 32,672.66 31,017.11 56,137August 369.55 322.60 32,686.48 31,128.02 77,799September 540.25 357.90 32,524.11 31,081.83 920,054October 569.30 464.05 33,340.17 31,440.48 833,853November 602.00 519.55 33,865.95 32,683.59 373,068December 578.05 521.30 34,137.97 32,565.16 76,523January 590.05 491.05 36,443.98 33,703.37 189,721February 549.95 475.00 36,256.83 33,482.81 34,846March 569.95 502.20 34,278.63 32,483.84 158,904
SHOPPERS STOP PRICE MOVEMENT CHART – BSE
Financial Year 2017-18
Shoppers Stop Sensex
Sens
ex
Am
ount
`
22000
24000
26000
28000
30000
32000
34000
36000
38000
40000
250
300
350
400
450
500
550
600
650
Apr
May
Jun
Jul
Aug
SeptOct Nov
Dec
Jan
Feb
Mar
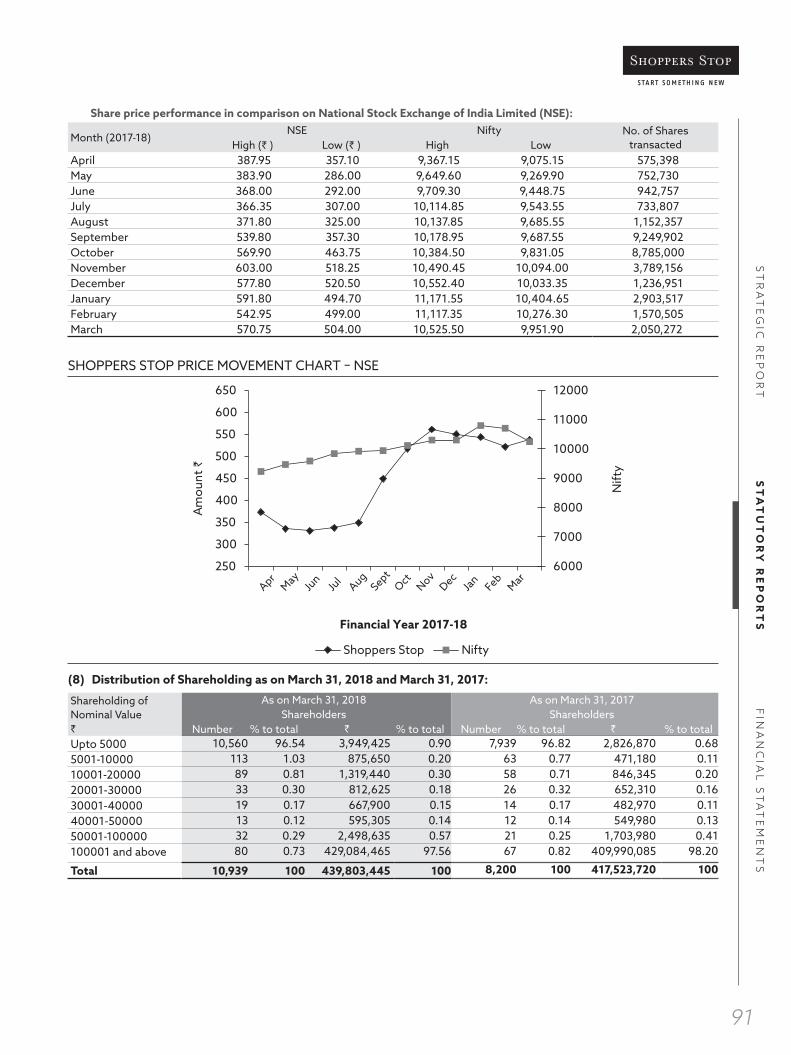
ST
RA
TE
GIC
RE
PO
RT
ST
AT
UT
OR
Y R
EP
OR
TS
FIN
AN
CIA
L S
TA
TE
ME
NT
S
91
Share price performance in comparison on National Stock Exchange of India Limited (NSE):
Month (2017-18)NSE Nifty No. of Shares
transactedHigh (` ) Low (` ) High LowApril 387.95 357.10 9,367.15 9,075.15 575,398May 383.90 286.00 9,649.60 9,269.90 752,730June 368.00 292.00 9,709.30 9,448.75 942,757July 366.35 307.00 10,114.85 9,543.55 733,807August 371.80 325.00 10,137.85 9,685.55 1,152,357September 539.80 357.30 10,178.95 9,687.55 9,249,902October 569.90 463.75 10,384.50 9,831.05 8,785,000November 603.00 518.25 10,490.45 10,094.00 3,789,156December 577.80 520.50 10,552.40 10,033.35 1,236,951January 591.80 494.70 11,171.55 10,404.65 2,903,517February 542.95 499.00 11,117.35 10,276.30 1,570,505March 570.75 504.00 10,525.50 9,951.90 2,050,272
SHOPPERS STOP PRICE MOVEMENT CHART – NSE
(8) Distribution of Shareholding as on March 31, 2018 and March 31, 2017:
Shareholding of Nominal Value
As on March 31, 2018 As on March 31, 2017Shareholders Shareholders
` Number % to total ` % to total Number % to total ` % to totalUpto 5000 10,560 96.54 3,949,425 0.90 7,939 96.82 2,826,870 0.685001-10000 113 1.03 875,650 0.20 63 0.77 471,180 0.1110001-20000 89 0.81 1,319,440 0.30 58 0.71 846,345 0.2020001-30000 33 0.30 812,625 0.18 26 0.32 652,310 0.1630001-40000 19 0.17 667,900 0.15 14 0.17 482,970 0.1140001-50000 13 0.12 595,305 0.14 12 0.14 549,980 0.1350001-100000 32 0.29 2,498,635 0.57 21 0.25 1,703,980 0.41100001 and above 80 0.73 429,084,465 97.56 67 0.82 409,990,085 98.20
Total 10,939 100 439,803,445 100 8,200 100 417,523,720 100
6000
7000
8000
9000
10000
11000
12000
250
300
350
400
450
500
550
600
650
Nift
y
Am
ount
`
Financial Year 2017-18
Shoppers Stop Nifty
AprMayJu
nJu
lAugSeptOct NovDecJa
nFebMar
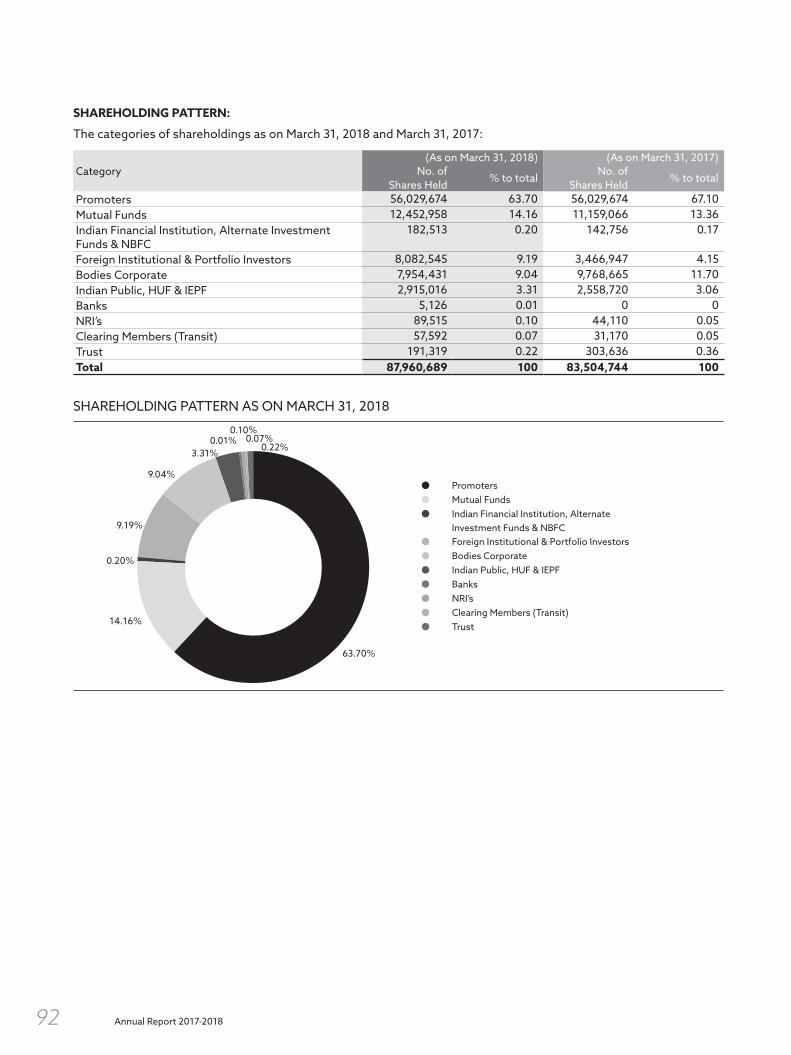
Annual Report 2017-201892
SHAREHOLDING PATTERN:
The categories of shareholdings as on March 31, 2018 and March 31, 2017:
Category(As on March 31, 2018) (As on March 31, 2017)
No. of Shares Held
% to totalNo. of
Shares Held% to total
Promoters 56,029,674 63.70 56,029,674 67.10Mutual Funds 12,452,958 14.16 11,159,066 13.36Indian Financial Institution, Alternate Investment Funds & NBFC
182,513 0.20 142,756 0.17
Foreign Institutional & Portfolio Investors 8,082,545 9.19 3,466,947 4.15Bodies Corporate 7,954,431 9.04 9,768,665 11.70Indian Public, HUF & IEPF 2,915,016 3.31 2,558,720 3.06Banks 5,126 0.01 0 0NRI’s 89,515 0.10 44,110 0.05Clearing Members (Transit) 57,592 0.07 31,170 0.05Trust 191,319 0.22 303,636 0.36Total 87,960,689 100 83,504,744 100
PromotersMutual FundsIndian Financial Institution, Alternate Investment Funds & NBFCForeign Institutional & Portfolio InvestorsBodies CorporateIndian Public, HUF & IEPFBanksNRI’sClearing Members (Transit)Trust
SHAREHOLDING PATTERN AS ON MARCH 31, 2018
63.70%
14.16%
0.20%
9.19%
9.04%
3.31%0.01%
0.10%0.07%
0.22%

ST
RA
TE
GIC
RE
PO
RT
ST
AT
UT
OR
Y R
EP
OR
TS
FIN
AN
CIA
L S
TA
TE
ME
NT
S
93
SHAREHOLDING OF BOARD OF DIRECTORS AS ON MARCH 31, 2018:Name of Director Status No. of Shares
Mr. Chandru L. Raheja Promoter Director 697,500Mr. Ravi C. Raheja Promoter Director 1,100,000Mr. Neel C. Raheja Promoter Director 1,150,000Prof. Nitin Sanghavi Director 0Mr. Deepak Ghaisas* Director 7,750Ms. Abanti Sankaranarayanan Director 0Mr. Nirvik Singh Director 0Mr. Manish Chokhani Director 0Mr. B. S. Nagesh Vice Chairman 567,685Mr. Govind Shrikhande Managing Director 305,479
*Mr. Deepak Ghaisas holds 7,750 equity shares jointly with his wife as second holder.
(9) Registrar and Transfer Agent (RTA) : Karvy Computershare Private Limited Karvy Selenium Tower B, Plot 31-32, Gachibowli, Financial District, Nanakramguda, Hyderabad - 500 032 Tel: (040) 6716 1500 Fax: (040) 2342 0814
(10) Share Transfer System : The shares of the Company are traded on the Stock Exchanges through the Depository System. The ISIN allotted to the equity shares of ` 5/- each of the Company is INE498B01024.
The requests received by the Company/ RTA for dematerialisation/ rematerialisation are disposed of expeditiously.
(11) Dematerialisation of Shares and Liquidity : The trading in Company’s equity shares is compulsorily in dematerialised mode for all investors. As on date, entire share capital of the Company except 322 equity shares are being held in the dematerialised mode.
The shares of the Company are regularly traded at both the Stock Exchanges where they are listed, which ensure the necessary liquidity to shareholders.
(12) Outstanding GDRs/ADRs : The Company has not issued any ADRs or GDRs or warrants or any convertible instruments or any Convertible which has likely impact on equity share capital.
(13) Commodity price risk of foreign exchange risk and hedging activities
: The Company uses foreign currency forward contracts to hedge its risks foreign exchange risk and associated with foreign currency exposures relating to the underlying hedging activities transactions and firm commitments. The Company does not enter into any derivative instruments for trading and speculative purposes.
(14) Address for correspondence : Mr. Bharat Sanghavi – Company Secretary, Umang Tower, 5th Floor, Mindspace, Off Link Road, Malad (West), Mumbai - 400 064. Tel: (022) 4249 7000 E-mail: [email protected] Web Address: www.shoppersstop.com

Annual Report 2017-201894
(15) Store Locations
Western Region1. 211-D, S. V. Road, Andheri (W), Mumbai - 400 058. 15. Opposite Alankar Talkies, Chainsukh Road,
Latur - 413 512.2. Krushal Commercial Complex, G. M. Road,
Chembur (West), Mumbai - 400 089.16. HomeStop, R City, LBS Marg,
Ghatkopar (West), Mumbai - 400 086.3. Suburbia, Old Bandra Talkies, Linking Road,
Bandra (West), Mumbai - 400 050.17. HomeStop, FP No. 216, TP Scheme -1,
Vastrapur, Ahmedabad - 380 054.4. Inorbit Mall, Link Road, Malad (West),
Mumbai - 400 064.18. Metro Junction Mall, Shil Road, Kalyan - 421 306.
5. Dynamix Mall, Sant Dhyaneshwar Marg, JVPD Scheme, Next to Chandan Cinema Hall, Vile Parle (West), Mumbai - 400 049.
19. VR Mall, Near Magdalia Chokdi, Dumas Road, Surat - 395 007.
6. Godrej Eternia, B-Wing, Shivaji Nagar, Mumbai-Pune Road, Pune - 411 005.
20. Viviana Mall, Eastern Express Highway, Thane - 400 062.
7. HomeStop, Inorbit Mall, 2nd Floor, Link Road, Malad (West), Mumbai - 400 064.
21. Alembic Road, Subhanpura, Vadodara - 390 003.
8. Prozone Mall, Plot Sector - C, Chikalthana Ind. Area, Masantpur, Aurangabad - 431 210.
22. First floor, Seasons Mall, South Magarpatta City, Pune - 411 028.
9. Inorbit Mall, Vashi, Navi Mumbai - 400 705. 23. C G Square, C. G. Road, Ahmedabad - 380 009.10. HomeStop, Inorbit Mall, 2nd Floor, Vashi,
Navi Mumbai - 400 705.24. HomeStop, First floor, Seasons Mall, South Magarpatta
City, Pune - 411 028.11. Alpha G, Near Vastrapur Lake, Vastrapur,
Ahmedabad - 380 054.25. D Y Patil Mall, 2104/15, E Ward, Kavda Naka,
Kolhapur - 416 001.12. R City Mall, LBS Marg, Ghatkopar (West),
Mumbai - 400 086.26. Orion Mall, Near Panvel Bus Depot, Panvel – 410 206.
13. Big India Mall, Behind Kasarwadawali Police Station, Godbunder Road, Thane West, Mumbai - 400 607.
27. Unit No. GFN03 & GFS10, West End Mall, Aundh, Taluka Haveli, Pune - 411 007.
14. Pacific Mall, Shankar Seth Road, Pune 411 037. 28. Mall De Goa, situated at Nova Cidade Complex, Alto Porvorim, Goa – 403 521.
Southern Region1. Garuda Star Mall, Magrath Road, Ashok Nagar,
Bengaluru - 560 025.13. HomeStop, Royal Meenakshi Mall, Bannergetta Road,
Bengaluru - 560 076.2. Commerce@Mantri, Ground Floor, N.S. Palya,
Bannerghatta Road, Bengaluru - 560 076.14. LEPL Icon Mall, Vijayawada - 520 008.
3. Mantri Square, Sampige Road, Malleshwaram, Bengaluru - 560 003.
15. OMR, Ground Floor, Gopalan Signature Towers, Opp. RMZ Infinity, Old Madras Road, Bengaluru - 560 096.
4. Salarpuriya Tower – II, Near Forum Mall, Kormangala Indl. Layout, Bengaluru - 560 095.
16. Mall of Mysore, Indira Nagar Extension, Nazarabad Mohalla, M.G. Road, Mysore - 570 010.
5. Plot No. 1-11-251/1, Alladin Mansion, Begumpet, Hyderabad - 500 016.
17. HomeStop, Inorbit Mall, Apiic Software Layout, Hitech City, Cyberabad, Hyderabad - 500 081.
6. Harrington Road, Chetpet, Chennai - 600 031. 18. Inorbit Mall – Whitefield, EPIP Area, Whitefield, Bengaluru - 560 066.
7. GVK One Mall, Road No. 01, Banjara Hills, Hyderabad - 500 034.
19. E-City Mall, Avinash Road, Coimbatore - 641 004.
8. Inorbit Mall, Apiic Software Layout, Hitech City, Madhapur, Hyderabad - 500 081.
20. Soul Space Arena, Outer Ring Road, K R Puram Hubli, Bengaluru - 560 037.
9. Passenger Terminal Building, Shamshabad Airport, Rangareddy, Hyderabad - 500 409.
21. HomeStop, Phoneix Market City, Velachery, Chennai - 600 042.
10. ‘Hyderabad-Next Galleria–Punjagutta Mall’ Punjagutta, Hyderabad
22. The Grand Mall, No. 137, Dr. Seetharam Nagar, Velachery, Chennai - 600 042.
11. Passenger Terminal Building, Bengaluru International Airport, Devanahalli, Bengaluru - 560 300.
23. 28, Velachery Rd, Nagendra Nagar, Anna Garden, Palladium Mall, Phoneix Market City Chennai, Velachery, Chennai, Tamil Nadu - 600 042.
12. HomeStop, Raheja Point No. 17/2, Magrath Road, Bengaluru - 560 025.
24. Manjeera, Trinity Mall, Kukatpally, Hyderabad – 500 072.
ST
RA
TE
GIC
RE
PO
RT
ST
AT
UT
OR
Y R
EP
OR
TS
FIN
AN
CIA
L S
TA
TE
ME
NT
S
95
25. HomeStop, Embassy Paragon, ITPL Main Road, Bengaluru - 560 037.
29. Mangalore International Airport, Domestic Departures, Kenjar, Bajpe, Mangalore - 574 142.
26. SRK Destiny, VIP Road, Near CBM Compound, Visakhapatnam - 530 016.
30. Brigade Mall, Banaswadi Main Road, Banaswadi Layout, Maruthi Sevanagar, Bengaluru - 560 033.
27. Upper, Ground and First Floor Forum Fiza Mall, Pandeshwar Road, Mangalore - 575 001.
31. Orion Mall, Rajajinagar Extension,Malleswaram West, Bengaluru - 560 055.
28. Royal Meenakshi Mall, Ground Floor, Opposite Meenakshi Temple, Bannerghatta Road, Hulimavu, Bengaluru - 560 076.
Northern Region
1. The Metropolitan Mall, Mehrauli-Gurgaon Road, Gurgaon, Haryana - 122 002.
15. MBD Neopolis Mall, Civil Lines, BMC Chowk, GT Road, Jalandar - 144 001.
2. Shipra Mall, Shipra Suncity, 9 Vaibhav Khand, Indirapuram, Ghaziabad -201 012.
16. World Trade Park, South Block, Malviya Nagar, Jaipur - 302 017.
3. HomeStop, Plot No. A/3, Select City Walk, District Centre, Saket, New Delhi - 110 017.
17. Elante Mall, Industrial Area Phase - 1, Chandigarh - 160 002.
4. E-City Mall, Opp. Paryatan Bhavan, Gomti Nagar, Lucknow - 226 010.
18. OMaxe SRK Mall, Nagala Padi, Agra - 280 002.
5. The Great India Palace, New Okhla Industrial Development Area, Noida – 201 301.
19. Jaipur International Airport (Departure - Level 2), Shop No. 201 New Terminal Building T-2, Jaipur - 302 011.
6. Metropolitan Mall, Press Enclave Road, District Centre Saket, Sector II, New Delhi - 110 017.
20. HomeStop, Elante Mall, Industrial Area Phase - 1, Chandigarh - 160 002.
7. Alpha One Mall, MBM Farms, Sultan Wind, Main G. T. Road, Amritsar - 143 010.
21. Gaur Central Mall, Rajnagar, Ghaziabad - 201 002.
8. Ambience Mall, Nelson Mandela Road, Vasant Kunj, New Delhi - 110 070.
22. Pavillion Mall, Old Sessions Court Road, Ludhiana - 141 001.
9. DB City Mall, Arera Hills, Bhopal - 462 011. 23. Shopprix Mall, Sports Good Complex, Major Dhyanchand Nagar, Hapur Bye pass, Delhi-Meerut Highway, Meerut (UP) - 250 001.
10. Spaze I, Tech Park, Gurgaon, Spaze Mall, Sohna Road, Gurgaon - 122 002.
24. Man-Upasna Plaza, C-44, Sardar Patel Marg, C-Scheme, Jaipur, Rajasthan - 302 001.
11. Rohini, Sector - 10, Adjacent to Rithala Metro Station, Rohini, New Delhi - 110 085.
25. Unity One Jankpuri, Janakpuri West, Next to Janakpuri West Metro Station, New Delhi - 110 058.
12. R-Cube, Monad - Third Floor, Najafgarh Rd, Shivaji Place, Rajouri Garden Extension, Rajouri Garden, New Delhi – 110027.
26. Logix City Centre Mall, Noida City Centre Metro Station, Noida, Uttar Pradesh – 201 301.
13. BPK Star Building, Opp. Lig Gurudwara, A.B. Road, Indore - 452 001.
27. Terminal 1D, Indira Gandhi International Airport, New Delhi - 110 037.
14. HomeStop, 2nd Floor, Fun Republic Mall, Gomti Nagar, Lucknow - 226 010.
Eastern Region1. 10/3, Lala Lajpat Rai Sarani (Elgin Road),
Kolkata - 700 020.6. Vidhan Sabha Road, Mowa, Raipur - 492 005.
2. City Centre, DC - 1, Sector-1, Salt Lake, Kolkata - 700 064.
7. New Integrated Terminal Building, Swami Vivekanand Airport, Raipur - 492 001.
3. South City Mall, 375, Prince Anwar Shah Road, Kolkata - 700 068.
8. City Centre 2, Rajarhat, New Town, Major Arterial Road, Action Area IID, Kolkata - 700 156.
4. Junction Mall, Mouza - Faridpur, City Centre, Durgapur - 713 216.
9. Acropolis Mall, Plot No. 1858, Rajdanga Main Road, Near Siemens Corporate Office, Kolkata - 700 107.
5. City Centre, Siliguri Uttorayon Township, NH-31, Matigara, Siliguri - 734 010.
10. Nucleus Mall, Circular Road, Opp. East Jail Road, Ranchi, Jharkhand – 834 001.

Annual Report 2017-201896
INDEPENDENT AUDITOR’S REPORTTO THE MEMBERS OF SHOPPERS STOP LIMITED
Report on the Standalone Ind AS Financial Statements
We have audited the accompanying standalone Ind AS financial statements of Shoppers Stop Limited (“the Company”), which comprise the Balance Sheet as at March 31, 2018, the Statement of Profit and Loss, including the statement of Other Comprehensive Income, the Cash Flow Statement and the Statement of Changes in Equity for the year then ended, and a summary of significant accounting policies and other explanatory information.
Management’s Responsibility for the Standalone Ind AS Financial Statements
The Company’s Board of Directors is responsible for the matters stated in Section 134(5) of the Companies Act, 2013 (“the Act”) with respect to the preparation of these standalone Ind AS financial statements that give a true and fair view of the financial position, financial performance including other comprehensive income, cash flows and changes in equity of the Company in accordance with accounting principles generally accepted in India, including the Indian Accounting Standards (Ind AS) specified under Section 133 of the Act, read with the Companies (Indian Accounting Standards) Rules, 2015, as amended. This responsibility also includes maintenance of adequate accounting records in accordance with the provisions of the Act for safeguarding of the assets of the Company and for preventing and detecting frauds and other irregularities; selection and application of appropriate accounting policies; making judgements and estimates that are reasonable and prudent; and the design, implementation and maintenance of adequate internal financial control that were operating effectively for ensuring the accuracy and completeness of the accounting records, relevant to the preparation and presentation of the Ind AS financial statements that give a true and fair view and are free from material misstatement, whether due to fraud or error.
Auditor’s Responsibility
Our responsibility is to express an opinion on these standalone Ind AS financial statements based on our audit. We have taken into account the provisions of the Act, the accounting and auditing standards and matters which are required to be included in the audit report under the provisions of the Act and the Rules made thereunder. We conducted our audit of the standalone Ind AS financial statements in accordance with the Standards on Auditing, issued by the Institute of Chartered Accountants of India, as specified under Section 143(10) of the Act. Those Standards require that we comply with
ethical requirements and plan and perform the audit to obtain reasonable assurance about whether the financial statements are free from material misstatement.
An audit involves performing procedures to obtain audit evidence about the amounts and disclosures in the financial statements. The procedures selected depend on the auditor’s judgement, including the assessment of the risks of material misstatement of the standalone Ind AS financial statements, whether due to fraud or error. In making those risk assessments, the auditor considers internal financial control relevant to the Company’s preparation of the standalone Ind AS financial statements that give a true and fair view in order to design audit procedures that are appropriate in the circumstances. An audit also includes evaluating the appropriateness of accounting policies used and the reasonableness of the accounting estimates made by the Company’s Directors, as well as evaluating the overall presentation of the standalone Ind AS financial statements. We believe that the audit evidence we have obtained is sufficient and appropriate to provide a basis for our audit opinion on the standalone Ind AS financial statements.
Opinion
In our opinion and to the best of our information and according to the explanations given to us, the standalone Ind AS financial statements give the information required by the Act in the manner so required and give a true and fair view in conformity with the accounting principles generally accepted in India, of the state of affairs of the Company as at March 31, 2018, its profit including other comprehensive income, its cash flows and the changes in equity for the year ended on that date.
Emphasis of Matter
We draw attention to Note 30 to the standalone Ind AS financial statements which, describes the uncertainty related to the outcome of the appeal filed before the Supreme Court regarding non provision of retrospective levy of service tax for the period from June 1, 2007 to March 31, 2010 on renting of immovable properties given for commercial use, aggregating to ` 1,659. 56 lacs.
Our opinion is not qualified in respect of this matter.
Other Matter
The Ind AS financial statements of the Company for the year ended March 31, 2017, included in these standalone Ind AS financial statements, have been audited by the predecessor auditor who expressed an unmodified opinion on those statements on May 4, 2017

ST
RA
TE
GIC
RE
PO
RT
ST
AT
UT
OR
Y R
EP
OR
TS
FIN
AN
CIA
L S
TA
TE
ME
NT
S
97
(f) With respect to the adequacy of the internal financial controls over financial reporting of the Company and the operating effectiveness of such controls, refer to our separate Report in “Annexure 2” to this report;
(g) With respect to the other matters to be included in the Auditor’s Report in accordance with Rule 11 of the Companies (Audit and Auditors) Rules, 2014, in our opinion and to the best of our information and according to the explanations given to us:
i. The Company has disclosed the impact of pending litigations on its financial position in its standalone Ind AS financial statements – Refer Note 29 to the standalone Ind AS financial statements;
ii. The Company did not have any long-term contracts including derivative contracts for which there were any material foreseeable losses.
iii. There has been no delay in transferring amounts, required to be transferred, to the Investor Education and Protection Fund by the Company.
For S R B C & CO LLPChartered AccountantsICAI Firm Registration Number: 324982E/E300003
Vijay ManiarPartnerMembership Number: 36738Place of Signature: MumbaiDate: 27 April 2018
Report on Other Legal and Regulatory Requirements
1. As required by the Companies (Auditor’s report) Order, 2016 (“the Order”) issued by the Central Government of India in terms of sub-section (11) of section 143 of the Act, we give in the Annexure 1 a statement on the matters specified in paragraphs 3 and 4 of the Order.
2. As required by section 143 (3) of the Act, we report that:
(a) We have sought and obtained all the information and explanations which to the best of our knowledge and belief were necessary for the purpose of our audit;
(b) In our opinion, proper books of account as required by law have been kept by the Company so far as it appears from our examination of those books.
(c) The Balance Sheet, Statement of Profit and Loss including the Statement of Other Comprehensive Income, the Cash Flow Statement and Statement of Changes in Equity dealt with by this Report are in agreement with the books of account;
(d) In our opinion, the aforesaid standalone Ind AS financial statements comply with the Accounting Standards specified under section 133 of the Act, read with Companies (Indian Accounting Standards) Rules, 2015, as amended;
(e) On the basis of written representations received from the directors as on March 31, 2018, and taken on record by the Board of Directors, none of the directors is disqualified as on March 31, 2018, from being appointed as a director in terms of section 164 (2) of the Act;

Annual Report 2017-201898
(i) (a) The Company has maintained proper records showing full particulars, including quantitative details and situation of fixed assets.
(b) All fixed assets have not been physically verified by the management during the year but there is a regular programme of verification which, in our opinion, is reasonable having regard to the size of the Company and the nature of its assets. No material discrepancies were noticed on such verification.
(c) According to the information and explanations given by the management, there are no immovable properties, included in property, plant and equipment of the company and accordingly, the requirements under paragraph 3(i)(c) of the Order are not applicable to the Company.
(ii) The management has conducted physical verification of inventory at reasonable intervals during the year and no material discrepancies were noticed on such physical verification.
(iii) (a) The Company has granted loans to three companies covered in the register maintained under section 189 of the Companies Act, 2013. In our opinion and according to the information and explanations given to us, the terms and conditions of the grant of such loans are not prejudicial to the company’s interest.
(b) The Company has granted loans that are re-payable on demand, to a company covered in the register maintained under section 189 of the Companies Act, 2013. We are informed that the Company has not demanded repayment of any such loan during the year, and thus, there has been no default on the part of the parties to whom the money has been lent. The payment of interest has been regular for two companies. Further loan given in an earlier year to one of the Company has been fully provided for and no interest has been received.
(c) There are no amounts of loans granted to companies, firms or other parties listed in the register maintained under section 189 of the Companies Act, 2013 which are overdue for more than ninety days.
(iv) In our opinion and according to the information and explanations given to us, provisions of section 185 and 186 of the Companies Act 2013 in respect of loans to directors including entities in which they are interested and in respect of loans and advances given, investments made and, guarantees, and securities given have been complied with by the Company.
(v) The Company has not accepted any deposits within the meaning of Sections 73 to 76 of the Act and the Companies (Acceptance of Deposits) Rules, 2014 (as amended). Accordingly, the provisions of clause 3(v) of the Order are not applicable.
(vi) To the best of our knowledge and as explained, the Central Government has not specified the maintenance of cost records under clause 148(1) of the Companies Act, 2013, for the products/services of the Company.
(vii) (a) The Company is regular in depositing with appropriate authorities undisputed statutory dues including provident fund, income-tax, sales-tax, service tax, employees’ state insurance, value added tax, goods and service tax, duty of custom, cess and other statutory dues applicable to it. The provisions relating to duty of excise are not applicable to the Company.
(b) According to the information and explanations given to us, no undisputed amounts payable in respect of provident fund, employees’ state insurance, income-tax, service tax, sales-tax, value added tax, goods and service tax, cess and other statutory dues were outstanding, at the year end, for a period of more than six months from the date they became payable.
(c) According to the records of the Company, the dues of income-tax, sales-tax, service tax, duty of custom, value added tax, goods and service tax, and cess on account of any dispute, are as follows:
ANNEXURE 1 referred to in paragraph 1 under the heading “Report on Other Legal and Regulatory Requirements” of our report of even date.

ST
RA
TE
GIC
RE
PO
RT
ST
AT
UT
OR
Y R
EP
OR
TS
FIN
AN
CIA
L S
TA
TE
ME
NT
S
99
** Net of amounts paid.
Name of the statute Nature of the duesAmount**
(`)
Period to which the amount relates
Forum where the dispute is pending
The Income Tax Act, 1961 Income Tax 502.90 2015-16 Appellate Authority- Commissioner Level
Finance Act, 1994 Service Tax 775.97 May 2006 to May 2007 Appellate Authority- Tribunal Level
West Bengal Tax on entry of goods into Local Areas Act, 2012
Entry Tax 4.76 2013-14 Appellate Authority- Commissioner Level
The Customs Act, 1962 Duty of Customs 5.17 2008 to 2012 Appellate Authority- Tribunal Level
The Customs Act, 1962 Duty of Customs 37.44 2008 to 2012 Appellate Authority- Tribunal Level
Maharashtra Central Sales Tax Act
Central Sales Taxes Act, Maharashtra
0.39 2010 to 2011 Joint Commissioner of Sales Tax Appellate
Maharashtra Value Added Tax Act
Value Added Tax 22.27 2012-13 Joint Commissioner of Sales Tax Appellate
(viii) In our opinion and according to the information and explanations given by the management, the Company has not defaulted in repayment of loans or borrowing to a financial institution, bank or government or dues to debenture holders.
(ix) Based on our audit procedures performed for the purpose of reporting the true and fair view of the financial statements and according to the information and explanations given by the management, the Company has not raised any money way of initial public offer/further public offer. The monies raised by way of term loans were applied for the purposes for which those were raised.
(x) Based upon the audit procedures performed for the purpose of reporting the true and fair view of the financial statements and according to the information and explanations given by the management, we report that no fraud by the Company or no material fraud on the Company by the officers and employees of the Company has been noticed or reported during the year.
(xi) Based on our audit procedures performed for the purpose of reporting the true and fair view of the financial statements and according to the information and explanations given by the management, we report that the managerial remuneration has been paid/provided in accordance with the requisite approvals mandated by the provisions of section 197 read with Schedule V to the Companies Act, 2013.
(xii) In our opinion, the Company is not a nidhi company. Therefore, the provisions of clause 3(xii) of the order are not applicable to the Company and hence not commented upon.
(xiii) Based on our audit procedures performed for the purpose of reporting the true and fair view of the financial statements and according to the information and explanations given by the
management, transactions with the related parties are in compliance with Section 177 and 188 of Companies Act, 2013 where applicable and the details have been disclosed in the notes to the financial statements, as required by the applicable accounting standards.
(xiv) According to the information and explanations given by the management, the Company has complied with provisions of section 42 of the Companies Act, 2013 in respect of the private placement of shares during the year. According to the information and explanations given by the management, we report that the amounts raised, have been used for the purposes for which the funds were raised.
(xv) According to the information and explanations given by the management, the Company has not entered into any non-cash transactions with directors or persons connected with him as referred to in section 192 of Companies Act, 2013.
(xvi) According to the information and explanations given to us, the provisions of section 45-IA of the Reserve Bank of India Act, 1934 are not applicable to the Company.
For S R B C & CO LLPChartered AccountantsICAI Firm Registration Number: 324982E/E300003
Vijay ManiarPartnerMembership Number: 36738Place of Signature: MumbaiDate: 27 April 2018

Annual Report 2017-2018100
Report on the Internal Financial Controls under Clause (i) of Sub-section 3 of Section 143 of the Companies Act, 2013 (“the Act”)
We have audited the internal financial controls over financial reporting of Shoppers Stop Limited (“the Company”) as of March 31, 2018 in conjunction with our audit of the standalone financial statements of the Company for the year ended on that date.
Management’s Responsibility for Internal Financial Controls
The Company’s Management is responsible for establishing and maintaining internal financial controls based on the internal control over financial reporting criteria established by the Company considering the essential components of internal control stated in the Guidance Note on Audit of Internal Financial Controls Over Financial Reporting issued by the Institute of Chartered Accountants of India. These responsibilities include the design, implementation and maintenance of adequate internal financial controls that were operating effectively for ensuring the orderly and efficient conduct of its business, including adherence to the Company’s policies, the safeguarding of its assets, the prevention and detection of frauds and errors, the accuracy and completeness of the accounting records, and the timely preparation of reliable financial information, as required under the Companies Act, 2013.
Auditor’s Responsibility
Our responsibility is to express an opinion on the Company’s internal financial controls over financial reporting based on our audit. We conducted our audit in accordance with the Guidance Note on Audit of Internal Financial Controls Over Financial Reporting (the “Guidance Note”) and the Standards on Auditing as specified under section 143(10) of the Companies Act, 2013, to the extent applicable to an audit of internal financial controls and, both issued by the Institute of Chartered Accountants of India. Those Standards and the Guidance Note require that we comply with ethical requirements and plan and perform the audit to obtain reasonable assurance about whether adequate internal financial controls over financial reporting was established and maintained and if such controls operated effectively in all material respects.
Our audit involves performing procedures to obtain audit evidence about the adequacy of the internal financial controls system over financial reporting and their operating effectiveness. Our audit of internal financial controls over financial reporting included obtaining
an understanding of internal financial controls over financial reporting, assessing the risk that a material weakness exists, and testing and evaluating the design and operating effectiveness of internal control based on the assessed risk. The procedures selected depend on the auditor’s judgement, including the assessment of the risks of material misstatement of the financial statements, whether due to fraud or error.
We believe that the audit evidence we have obtained is sufficient and appropriate to provide a basis for our audit opinion on the internal financial controls system over financial reporting.
Meaning of Internal Financial Controls over Financial Reporting
A company’s internal financial control over financial reporting is a process designed to provide reasonable assurance regarding the reliability of financial reporting and the preparation of financial statements for external purposes in accordance with generally accepted accounting principles. A company’s internal financial control over financial reporting includes those policies and procedures that (1) pertain to the maintenance of records that, in reasonable detail, accurately and fairly reflect the transactions and dispositions of the assets of the Company; (2) provide reasonable assurance that transactions are recorded as necessary to permit preparation of financial statements in accordance with generally accepted accounting principles, and that receipts and expenditures of the Company are being made only in accordance with authorisations of management and directors of the Company; and (3) provide reasonable assurance regarding prevention or timely detection of unauthorised acquisition, use, or disposition of the company’s assets that could have a material effect on the financial statements.
Inherent Limitations of Internal Financial Controls over Financial Reporting
Because of the inherent limitations of internal financial controls over financial reporting, including the possibility of collusion or improper management override of controls, material misstatements due to error or fraud may occur and not be detected. Also, projections of any evaluation of the internal financial controls over financial reporting to future periods are subject to the risk that the internal financial control over financial reporting may become inadequate because of changes in conditions, or that the degree of compliance with the policies or procedures may deteriorate.
ANNEXURE 2 To The Independent Auditor’s Report of even date on the Standalone Financial Statements of Shoppers Stop Limited.

ST
RA
TE
GIC
RE
PO
RT
ST
AT
UT
OR
Y R
EP
OR
TS
FIN
AN
CIA
L S
TA
TE
ME
NT
S
101
Opinion
In our opinion, the Company has, in all material respects, an adequate internal financial controls system over financial reporting and such internal financial controls over financial reporting were operating effectively as at March 31, 2018, based on the internal control over financial reporting criteria established by the Company considering the essential components of internal control stated in the Guidance Note on Audit of Internal Financial Controls Over Financial Reporting issued by the Institute of Chartered Accountants of India.
For S R B C & CO LLPChartered AccountantsICAI Firm Registration Number: 324982E/E300003
Vijay ManiarPartnerMembership Number: 36738Place of Signature: MumbaiDate: 27 April 2018

Annual Report 2017-2018102
BALANCE SHEETas at 31 March 2018
(All amounts in ` lacs)
NotesAs at
31 March 2018 As at
31 March 2017Assets Non-current assets Property, plant and equipment 3 58,606.69 57,918.87 Capital work-in-progress 3 1,534.14 1,254.92 Intangible assets 3 6,170.91 5,613.36 Intangible assets under development 3 281.30 433.07 Financial Assets (i) Investments 4 29,757.66 40,800.58 (ii) Loans 5 766.26 10,348.59 (iii) Other financial assets 6 11,426.59 12,985.47 Deferred tax assets (net) 7 1,977.60 429.22 Other non-current assets 8 9,516.21 8,169.03 Total non-current assets 120,037.36 137,953.11 Current assets Inventories 9 32,842.43 35,276.50 Financial assets (i) Investments 4 2,003.55 - (ii) Trade receivables 10 4,372.44 3,574.66 (iii) Cash and cash equivalents 11 457.63 295.03 (iv) Bank balances other than (iii) above 12 65.57 207.67 (v) Other financial assets 6 544.05 3,799.14 Other current assets 8 15,929.16 2,463.63 Total current assets 56,214.83 45,616.63 Total assets 176,252.19 183,569.74 Equity and liabilities Equity Equity share capital 13 4,398.03 4,175.24 Other equity 14 90,938.59 71,900.37 Total equity 95,336.62 76,075.61 Liabilities Non-current liabilities Financial liabilities Borrowings 15 3,976.77 20,996.68 Total non-current liabilities 3,976.77 20,996.68 Current liabilities Financial liabilities (i) Borrowings 15A 761.12 20,295.86 (ii) Trade payables 16 48,861.23 33,019.28 (iii) Other financial liabilities 17 8,030.99 19,727.57 Provisions 18 794.40 716.86 Other current liabilities 19 18,491.06 12,737.88 Total current liabilities 76,938.80 86,497.45 Total liabilities 80,915.57 107,494.13 Total equity and liabilities 176,252.19 183,569.74 The accompanying Notes 1 to 41 are an integral part of the financial statements.In terms of our report of even date For and on Behalf of the Board of Directors
For S R B C & CO LLP C.L. Raheja Ravi Raheja Govind S. ShrikhandeICAI Firm Reg. No. 324982E / E300003 Chairman Director Customer Care Associate &Chartered Accountants DIN: 00027979 DIN: 00028044 Managing Director
DIN: 00029419
Vijay Maniar Vijay Jain Bharat SanghaviPartner Customer Care Associate & Customer Care Associate &Membership No. 36738 Dy. Chief Financial Officer Company Secretary
Mumbai: 27 April 2018 Mumbai: 27 April 2018

ST
RA
TE
GIC
RE
PO
RT
ST
AT
UT
OR
Y R
EP
OR
TS
FIN
AN
CIA
L S
TA
TE
ME
NT
S
103
STATEMENT OF PROFIT AND LOSSfor the year ended 31 March 2018
(All amounts in ` lacs)
NotesFor the year ended
31 March 2018For the year ended
31 March 2017Income Revenue from operations 20 359,148.91 364,804.25 Other income 21 1,602.03 2,956.98 Total income 360,750.94 367,761.23
Expenses Purchase of Stock-in-Trade 22a 218,905.75 225,426.81 Changes in Inventories of stock-in-trade 22b 2,434.07 3,310.61 Employee benefits expense 23 30,134.77 27,350.37 Finance costs 24 3,616.12 5,845.01 Depreciation and amortisation expense 3 11,192.54 11,552.61 Other expenses 25 86,510.72 89,464.30 Total expenses 352,793.97 362,949.71
Profit before exceptional item and tax 7,956.97 4,811.52 Exceptional Items 31 5,040.96 4,780.00 Profit before tax 2,916.01 31.52 Current tax 3,304.01 2,093.79 Deferred tax (1,548.38) (68.42)Income tax expenses 26 1,755.63 2,025.37 Profit/(Loss) for the year [A] 1,160.38 (1,993.85)
Other comprehensive incomeItems that will not be reclassified to profit or loss i) Remeasurement of employee defined benefit obligation (124.91) (40.13) Income tax effect 43.22 13.89 ii) Fair value in the value of investments (696.87) - Income tax effect 72.48 - Other comprehensive income [B] (706.08) (26.24)Total comprehensive income for the year [A] + [B] 1,866.46 (1,967.61)
Earning per equity share Equity shares of face value ` 5 each (2017: ` 5 each) 28 Basic (`) 1.37 (2.39) Diluted (`) 1.37 (2.39)The accompanying Notes 1 to 41 are an integral part of the financial statements.
In terms of our report of even date For and on Behalf of the Board of Directors
For S R B C & CO LLP C.L. Raheja Ravi Raheja Govind S. ShrikhandeICAI Firm Reg. No. 324982E / E300003 Chairman Director Customer Care Associate &Chartered Accountants DIN: 00027979 DIN: 00028044 Managing Director
DIN: 00029419
Vijay Maniar Vijay Jain Bharat SanghaviPartner Customer Care Associate & Customer Care Associate &Membership No. 36738 Dy. Chief Financial Officer Company Secretary
Mumbai: 27 April 2018 Mumbai: 27 April 2018

Annual Report 2017-2018104
CASH FLOWSfor the year ended 31 March 2018
(All amounts in ` Lacs)For the
period ended 31 March 2018
For the year ended
31 March 2017Operating activitiesNet profit after exceptional item and before tax 2,916.01 31.52 Adjustments to reconcile profit before tax to net cashflow
Depreciation and amortisation 11,192.54 11,552.61 Allowance for doubtful debts / advances 240.65 308.00 Share-based payment expense 10.63 65.22 Impairment / loss on sale of investment (Refer note 31) 5,040.96 4,780.00 Finance costs 3,616.12 5,845.01 Loss on sale of property, plant and equipment 54.13 1.49 Refundable deposit considered in measurement of minimum lease payments 796.30 959.36 Interest (time value) recognised on interest free lease deposit (666.71) (780.33)Interest income (865.09) (2,054.54)Operating profit before working capital changes 22,335.54 20,708.34
Working capital adjustment:Decrease in inventories 2,434.07 3,310.61 Increase in trade receivables (797.80) (1,207.36)(Increase) / Decrease in Financial assets (others) (11,724.16) 461.78 Decrease / (Increase) in Lease deposits-net 2,165.28 (986.61)Increase in Short term provisions 77.53 134.14 Increase / (Decrease) in Trade payables and other current liabilities 21,259.03 (4,434.80)Cash generated from operations 35,749.49 17,986.10 Income taxes paid (net of refunds) (3,562.32) (2,372.07)Net cash from operating activities (A) 32,187.17 15,614.03
Investing activitiesPurchase of property, plant and equipment (11,828.42) (10,850.40)Proceeds from disposal of property, plant and equipment 35.43 218.17 Loans given to subsidiaries Companies (11,900.00) (6,719.00)Loans repaid by subsidiaries Companies including interest 21,319.00 11,800.00 Investment in subsidairies (1,530.12) (5,023.33)Net Proceeds from sale of investments in subsidiary (Refer Note 31) 5,224.62 -Proceeds from sale of investment in Joint ventures (Refer Note 31) 2,870.40 - Other investments in mutual funds (2,003.55) - Finance Income (Interest received) 1,034.73 2,037.52 Net cash used in investing activities (B) 3,222.09 (8,537.04)
Cash flows from financing activitiesProceeds from issue of equity shares (Refer Note 13.6) 222.79 1.58 Securities premium on issue of share capital 17,918.50 92.89 Dividend and dividend tax paid (753.81) - Proceeds from long term borrowings - 5,000.00 Repayment of long term borrowings (29,317.53) (12,247.62)Short term borrowings (net) (11,302.25) 1,975.71 Finance costs paid (3,781.87) (5,811.22)
Net cash from / (used in) financing activities (C) (27,014.17) (10,988.66)Net (Decrease) / Increase in cash and cash equivalents (A) + (B) + (C) 8,395.09 (3,911.67)
Cash and cash equivalents as at beginning of the year (8,698.58) (4,786.91)Cash and cash equivalents as at the end of the year (303.49) (8,698.58)
8,395.09 (3,911.67)

ST
RA
TE
GIC
RE
PO
RT
ST
AT
UT
OR
Y R
EP
OR
TS
FIN
AN
CIA
L S
TA
TE
ME
NT
S
105
(All amounts in ` Lacs)For the
period ended 31 March 2018
For the year ended
31 March 2017Note (i)Components of cash and cash equivalentsCash and Cash Equivalents as at March 31, 2018 (Note 11) 457.63 295.03 Add: Bank overdraft / Cash credit (761.12) (8,993.61)Total cash and cash equivalents (303.49) (8,698.58)Note (ii)Reconciliation between the opening and closing balances for liabilities arising from financing activities
Particulars Long - term borrowings
Interest accrued
March 31, 2017 37,294.31 165.88 Cash flow (29,317.53) (3,781.87)Non-Cash Changes Foreign exchange movement - - Classified as current maturity 4,000.00 - Accrual for the period - 3,616.12 March 31, 2018 3,976.77 0.13 The accompanying Notes 1 to 41 are an integral part of the financial statements.
In terms of our report of even date For and on Behalf of the Board of Directors
For S R B C & CO LLP C.L. Raheja Ravi Raheja Govind S. ShrikhandeICAI Firm Reg. No. 324982E / E300003 Chairman Director Customer Care Associate &Chartered Accountants DIN: 00027979 DIN: 00028044 Managing Director
DIN: 00029419
Vijay Maniar Vijay Jain Bharat SanghaviPartner Customer Care Associate & Customer Care Associate &Membership No. 36738 Dy. Chief Financial Officer Company Secretary
Mumbai: 27 April 2018 Mumbai: 27 April 2018

Annual Report 2017-2018106
a. Equity share capital No.of shares (` in lacs) Equity shares of ` 5/- each issued, subscribed and fully paid-up Balance as on 31 March 2016 83,461,946 4,173.10 Issue of equity shares under employee share option plan (note 35) 42,798 2.14 Balance as on 31 March 2017 83,504,744 4,175.24 Issue of equity shares under employee share option plan (note 35) 60,020 3.00 Issued on preferential basis (Refer Note 13.6) 4,395,925 219.79 Balance as on 31 March 2018 87,960,689 4,398.03
b. Other equity
Particulars:Securities premium account
General reserve
Retained earnings
Share Options
outstanding account
Share application
money pending
allotment
Total
Balance as on 31 March 2016 47,400.23 1,909.19 24,097.74 255.12 28.75 73,691.03 Loss for the year - - (1,993.85) - - (1,993.85)Other comprehensive income for the year, net of income tax
- - 26.24 - - 26.24
Total comprehensive income for the year - - (1,967.61) - - (1,967.61)Recognition of share based payments * - - 112.79 (28.17) - 84.62 Received on issue of shares 121.08 - - - - 121.08 Share allotted - - - - (28.75) (28.75)Balance as on 31 March 2017 47,521.31 1,909.19 22,242.92 226.95 - 71,900.37 Profit for the year - - 1,160.38 - 1,160.38 Other comprehensive income for the year, net of income tax
- - (706.08) - (706.08)
Total comprehensive income for the year - - 1,866.46 - 1,866.46 Recognition of share based payments * - - 172.52 (165.45) 7.07 Payment of dividends on equity shares - - (626.31) - (626.31)Payment of tax on dividends on equity shares
- - (127.50) - (127.50)
Received on issue of shares 17,918.50 - - - 17,918.50 Balance as on 31 March 2018 65,439.81 1,909.19 23,528.09 61.50 90,938.59* after transfers to retained earnings for options lapsed/exercised.
STATEMENT OF CHANGES IN EQUITYfor the period ended 31 March 2018
In terms of our report of even date For and on Behalf of the Board of Directors
For S R B C & CO LLP C.L. Raheja Ravi Raheja Govind S. ShrikhandeICAI Firm Reg. No. 324982E / E300003 Chairman Director Customer Care Associate &Chartered Accountants DIN: 00027979 DIN: 00028044 Managing Director
DIN: 00029419
Vijay Maniar Vijay Jain Bharat SanghaviPartner Customer Care Associate & Customer Care Associate &Membership No. 36738 Dy. Chief Financial Officer Company Secretary
Mumbai: 27 April 2018 Mumbai: 27 April 2018
ST
RA
TE
GIC
RE
PO
RT
ST
AT
UT
OR
Y R
EP
OR
TS
FIN
AN
CIA
L S
TA
TE
ME
NT
S
107
NOTES to the financial statements for the year ended 31 March 2018
1. GENERAL BACKGROUND
Shoppers Stop Limited (‘SSL’ or ‘the Company’) is a Company limited by shares and is domiciled in India. The Company was incorporated on 16 June 1997. The Company’s registered office is at Umang Tower, 5th Floor, Mindspace, Off Link Road, Malad (West) Mumbai - 400 064, Maharashtra, India.
The Company is engaged in the business of retailing a variety of household and consumer products through departmental stores. At 31 March 2018, the Company operated through 83 such departmental stores located in different cities of India.
The financial statements were approved for issue by the board of directors on 27 April 2018.
2. SIGNIFICANT ACCOUNTING POLICIES
2.1 Basis of preparation and presentation
2.1.1 Statement of Compliance with Indian Accounting Standards (Ind ASs): The standalone financial statements have been prepared in accordance with Indian Accounting Standards (Ind AS) notified under the Companies (Indian Accounting Standards) Rules, 2015 and other relevant provisions of the Companies Act, 2013 ‘the Act’.
The financial statements are presented in Indian Rupees (`) and all values are rounded to the nearest lakhs, except where otherwise indicated.
2.1.2 These financial statements have been prepared on historical cost basis, except for certain assets and liabilities that are measured at fair values at the end of each reporting period, as explained in the accounting policies below.
Fair Value Measurement
Fair value is the price that would be received to sell an asset or paid to transfer a liability in an orderly transaction between market participants at the measurement date, (regardless of whether that price is directly observable or estimated using another valuation technique). In estimating the fair value of an asset or a liability, the Company takes into account the characteristics of the asset or liability, if market participants would take those characteristics into account when pricing the asset or liability, at the measurement date.
In addition, for financial reporting purposes, fair value measurements are categorised into Level 1, 2 or 3 based on the degree to which inputs to the fair value measurements are observable and the significance of the inputs to the fair value measurement in its entirety, which are described as follows:
Level 1 inputs are quoted prices (unadjusted) in active markets for identical assets or liabilities that the entity can access at the measurement date;
Level 2 inputs are inputs, other than quoted prices included within Level 1, that are observable for the asset or liability, either directly or indirectly; and
Level 3 inputs are unobservable inputs for the asset or liability.
Fair value for measurement and/or disclosure purposes in these financial statements is determined on such a basis, except for share-based payment transactions that are within the scope of Ind AS 102, leasing transactions that are within the scope of Ind AS 17, and measurements that have some similarities to fair value but are not fair value, such as net realizable value in Ind AS 2 or value in use in Ind AS 36.
2.2 Summary of significant accounting policies
The Company presents assets and liabilities in the balance sheet based on current / non-current classification. An asset is treated as current when it is
Expected to be realised or intended to be sold or consumed in normal operating cycle
Held primarily for the purpose of trading
Expected to be realised within twelve months after the reporting period, or
Cash or cash equivalent unless restricted from being exchanged or used to settle a liability for at least twelve months after the reporting period
All other assets are classified as non-current.
A liability is current when:
It is expected to be settled in normal operating cycle
It is held primarily for the purpose of trading

Annual Report 2017-2018108
NOTES to the financial statements for the year ended 31 March 2018
It is due to be settled within twelve months after the reporting period, or
There is no unconditional right to defer the settlement of the liability for at least twelve months after the reporting period
The Company classifies all other liabilities as non-current.
Deferred tax assets and liabilities are classified as non-current assets and liabilities.
The operating cycle is the time between the acquisition of assets for processing and their realisation in cash and cash equivalents. The Company has identified twelve months as its operating cycle.
2.3 Revenue recognition
2.3.1 Revenue is recognised when it is probable that the economic benefits will flow to the Company and the amount of income can be measured reliably.
2.3.2 Retail sale of Merchandise: Revenue from Retail sales is measured at the fair value of the consideration received. Revenue is reduced for discounts and rebates, and, value added tax, sales tax and Goods and Service Tax (GST).
Retail sales are recognised on delivery of the merchandise to the customer, when the property in goods and significant risks and rewards are transferred for a price and no effective ownership control is retained.
Where the Company is the principal in the transaction the Sales are recorded at their gross values. Where the Company is effectively the agent in the transaction the cost of the merchandise is disclosed as a deduction from the gross value. (Refer Note 20)
Point award schemes: The fair value of the consideration on sale of goods that result in award credits for customers, under the Company’s point award schemes, is allocated between the goods supplied and the award credits granted. The consideration allocated to the award credits is measured by reference to fair value from the standpoint of the holder and is
recognised as revenue on redemption and / or expected redemption after breakage.
2.3.3 Gift vouchers: The amount collected on sale of a gift voucher is recognised as a liability and transferred to revenue (sales) when redeemed or to revenue (other retail operating revenue) on expiry.
2.3.4 Other retail operating revenue: Facility management fees are recognised pro-rata over the period of the contract. Revenue from store displays and sponsorships are recognised based on the period for which the products or the sponsors’ advertisements are promoted / displayed.
2.3.5 Dividend and Interest income: Dividend income from investments is recognised when the Company’s right to receive payment has been established. Interest income is accrued on time basis, by reference to the principal outstanding and at the effective interest rate applicable.
2.4 Inventories
Inventories are stated at the lower of cost and net realisable value. Cost of inventories comprise of all cost of purchase and other related costs incurred in bringing the inventories to their present location and condition. Costs of inventories are determined on a weighted average cost basis. Net realisable value represents the estimated selling price for inventories less all estimated costs necessary to make the sale. Provision is made for obsolete/ slow moving inventories.
2.5 Property, Plant and Equipment and Intangible Assets
2.5.1 Property, Plant and Equipment and Intangible Assets are stated at cost less accumulated depreciation or amortisation and accumulated impairment losses. Cost comprises of all cost of purchase, construction and other related costs incurred in bringing the assets to their present location and condition.
2.5.2 Depreciation / amortisation is recognised on a straight-line basis over the estimated useful lives of respective assets as under:

ST
RA
TE
GIC
RE
PO
RT
ST
AT
UT
OR
Y R
EP
OR
TS
FIN
AN
CIA
L S
TA
TE
ME
NT
S
109
NOTES to the financial statements for the year ended 31 March 2018
Property, Plant and Equipment:
Useful Life as Prescribed by
Schedule II of the Companies Act, 2013 (In Years)
Estimated Useful Life (In Years)
Air conditioning and other equipment
5 5 to 17
Furniture, fixtures and other fittings
10 5 to 10
Computer Equipment (other than desktops and laptops) Desktops and laptops
63
5 to 63
Leasehold Improvements
On lease term 5 to 17
Office Equipment 5 2 to 6Vehicles 8 8Intangible assets:Computer Software 6Trademark and Patents
10 10
Useful life of assets different from prescribed in Schedule II has been estimated by management supported by technical assessment.
The estimated useful lives, residual values and depreciation method are reviewed at the end of each reporting period and the effect of any changes in estimate is accounted for prospectively.
2.5.3 Impairment losses: At the end of each reporting period, the Company reviews the carrying amounts of the assets to determine whether there is any indication that those assets have suffered an impairment loss. If any such indication of impairment loss exists, the recoverable amount, (i.e. higher of fair value less costs of disposal and value in use) of the asset is estimated, or, when it is not possible to estimate the recoverable amount of an individual asset, the recoverable amount of the cash-generating unit to which the asset belongs is estimated. If the recoverable amount of an asset (or cash-generating unit) is estimated to be less than its carrying amount, the carrying amount of the asset (or cash-generating unit) is reduced to its recoverable amount and an impairment loss is recognised immediately in profit or loss.
When an impairment loss subsequently reverses, the carrying amount of the asset (or a cash-generating unit) is increased to the revised estimate of its recoverable amount, but so that the increased carrying amount does not exceed the carrying amount that would have been determined had no impairment loss been recognised for the asset (or cash-generating unit) in prior years. A reversal of an impairment loss is recognised immediately in profit or loss.
2.5.4 Deemed cost on transition to Ind AS: The Company has elected to continue with the carrying value of all of its Property, Plant and Equipment and Intangible Assets as of 1 April 2015 (transition date) measured as per the previous GAAP, and use that carrying value as its deemed cost as of the transition date.
2.6 Financial Instruments
Classification: The Company classifies its financial assets in the
following measurement categories: - Those to be measured subsequently at fair value (either through other comprehensive income, or through the Statement of Profit and Loss), and those measured at amortised cost. The classification depends on the Company’s business model for managing the financial assets and the contractual terms of the cash flows. For assets measured at fair value, gains and losses will either be recorded in the Statement of Profit and Loss or other comprehensive income. For investments in debt instruments, this will depend on the business model in which the investment is held. For investments in equity instruments, this will depend on whether the Company has made an irrevocable election at the time of initial recognition to account for the equity investment at fair value through other comprehensive income. The Company reclassifies debt investments when and only when its business model for managing those assets changes.
Measurement: At initial recognition, the Company measures a
financial asset at its fair value plus, in the case of a financial asset not at fair value through the Statement of Profit and Loss, transaction costs that are directly attributable to the acquisition of the financial asset. Transaction costs of financial assets

Annual Report 2017-2018110
NOTES to the financial statements for the year ended 31 March 2018
carried at fair value through the Statement of Profit and Loss are expensed in the Statement of Profit and Loss. Financial assets with embedded derivatives are considered in their entirely when determining whether their cash flows are solely payment of principal and interest.
Debt instruments: Subsequent measurement of debt instruments
depends on the Company’s business model for managing the asset and the cash flow characteristics of the asset. There are three measurement categories into which the Company classifies its debt instruments:
Amortised cost: Assets that are held for collection of contractual
cash flows where those cash flows represent solely payments of principal and interest are measured at amortised cost. A gain or loss on a debt investment that is subsequently measured at amortised cost and is not part of a hedging relationship is recognised in the Statement of Profit and Loss when the asset is derecognised or impaired. Interest income from these financial assets is included in other income using the effective interest rate method.
Fair value through other comprehensive income (FVOCI):
Assets that are held for collection of contractual cash flows and for selling the financial assets, where the assets’ cash flows represent solely payments of principal and interest are measured at fair value through other comprehensive income (FVOCI). Movements in the carrying amount are taken through OCI, except for the recognition of impairment gains or losses, interest revenue and foreign exchange gains and losses which are recognised in the Statement of Profit and Loss. When the financial asset is derecognised, the cumulative gain or loss previously recognised in OCI is reclassified from equity to the Statement of Profit and Loss and recognised in other income/expense. Interest income from these financial assets is included in other income using the effective interest rate method.
Fair value through profit and loss:
Assets that do not meet the criteria for amortised cost or FVOCI are measured at fair value through Statement of Profit and Loss. A gain or loss on a debt investment that is subsequently measured at fair value through Statement of Profit and
Loss and is not part of a hedging relationship is recognised in the Statement of Profit and Loss and presented net in the Statement of Profit and Loss In the period in which it arises. Interest income from these financial assets is included in other income.
Equity instruments:
The Company subsequently measures all equity investments at fair value. Where the Company’s management has elected to present fair value gains and losses on equity investments in other comprehensive income, there is no subsequent reclassification of fair value gains and losses to the Statement of Profit and Loss. Dividends from such investments are recognised in the Statement of Profit and Loss as other income when the Company’s right to receive payments is established. Changes in the fair value of financial assets at fair value through the Statement of Profit and Loss are recognised in other income / other expenses in the Statement of Profit and Loss. Impairment losses (and reversal of impairment losses) on equity investments measured at FVOCI are not reported separately from other changes in fair value.
Impairment of financial assets:
The Company assesses on a forward-looking basis the expected credit losses associated with its assets carried at amortised cost and FVOCI debt instruments. The impairment methodology applied depends on whether there has been a significant increase in credit risk.
Derecognition of financial assets:
A financial asset is derecognised only when -the Company has transferred the rights to receive cash flows from the financial asset or retains the contractual rights to receive the cash flows of the financial asset, but assumes a contractual obligation to pay the cash flows to one or more recipients. Where the Company has transferred an asset, the Company evaluates whether it has transferred substantially all risks and rewards of the financial asset. In such cases, the financial asset is derecognised. Where the Company has not transferred substantially all risks and rewards of ownership of the financial asset, the financial asset is not derecognised. Where the Company has neither transferred a financial asset nor retains substantially all risks and rewards of ownership of the financial asset, the financial

ST
RA
TE
GIC
RE
PO
RT
ST
AT
UT
OR
Y R
EP
OR
TS
FIN
AN
CIA
L S
TA
TE
ME
NT
S
111
NOTES to the financial statements for the year ended 31 March 2018
asset is derecognised if the Company has not retained control of the financial asset. Where the Company retains control of the financial asset, the asset is continued to be recognised to the extent of continuing involvement in the financial asset.
Offsetting financial instruments: Financial assets and liabilities are offset and the net
amount is reported in the balance sheet where there is a legally enforceable right to offset the recognised amounts and there is an intention to settle on a net basis or realise the asset and settle the liability simultaneously. The legally enforceable right must not be contingent on future events and must be enforceable in the normal course of business and in the event of default insolvency or bankruptcy of the Company or the counterparty.
2.6.1 Investments in subsidiaries and joint ventures: The Company has elected to account for its equity investments in subsidiaries and joint ventures under Ind AS 27 on Separate Financial Statements, at cost. At the end of each reporting period the Company assesses whether there are indicators of diminution in the value of its investments and provides for impairment loss, where necessary.
2.6.2 Financial liabilities are initially measured at fair value. Transaction costs that are directly attributable to the issue of financial liabilities are deducted from the fair value of the financial liabilities on initial recognition. After initial recognition, all financial liabilities (other than financial guarantee contracts and derivative instruments – see below) are subsequently measured at amortised cost using the effective interest method. The Company has not designated any financial liability as FVTPL.
2.6.3 Financial guarantee contracts: The Company on a case to case basis elects to account for financial guarantee contracts as a financial instrument or as an insurance contract, as specified in Ind AS 109 on Financial Instruments and Ind AS 104 on Insurance Contracts. The Company has regarded all its financial guarantee contracts as insurance contracts. At the end of each reporting period the Company performs a liability adequacy test, (i.e. it assesses the likelihood of a pay-out based on current undiscounted estimates of
future cash flows), and any deficiency is recognised in profit or loss.
2.6.4 Derivative instruments: The Company enters into foreign exchange forward contracts to manage its exposure to foreign exchange rate risks. These contracts are initially recognised at fair value and subsequently, at the end of each reporting period, re-measured at their fair values on reporting date. The resulting gain or loss is recognised in profit or loss in the same line as the movement in the hedged exchange rate.
2.7 Taxation
Income tax expense represents the sum of the tax currently payable and deferred tax. Current and deferred tax are recognised in profit or loss except when they relate to items that are recognised in other comprehensive income or directly in equity, in which case the current and deferred tax are also recognised in other comprehensive income or directly in equity, respectively.
2.7.1 Current tax: The tax currently payable is based on the estimated taxable profit for the year and is calculated using applicable tax rates and tax laws that have been enacted or substantively enacted.
2.7.2 Deferred tax:
Deferred tax is provided using the liability method on temporary differences between the tax bases of assets and liabilities and their carrying amounts for financial reporting purposes at the reporting date.
Deferred tax assets are recognised for all deductible temporary differences, the carry forward of unused tax credits and any unused tax losses. Deferred tax assets are recognised to the extent that it is probable that taxable profit will be available against which the deductible temporary differences, and the carry forward of unused tax credits and unused tax losses can be utilised, except when the deferred tax asset relating to the deductible temporary difference arises from the initial recognition of an asset or liability in a transaction that is not a business combination and, at the time of the transaction, affects neither the accounting profit nor taxable profit or loss.

Annual Report 2017-2018112
NOTES to the financial statements for the year ended 31 March 2018
The carrying amount of deferred tax assets is reviewed at the end of each reporting period and reduced to the extent that it is no longer probable that sufficient taxable profits will be available to allow all or part of the asset to be utilised. Unrecognised deferred tax assets are re-assessed at each reporting date and are recognised to the extent that it has become probable that future taxable profits will allow the deferred tax asset to be recovered.
Deferred tax liabilities and assets are measured at the tax rates that are expected to apply in the period in which the liability is settled or the asset realised, based on tax rates (and tax laws) that have been enacted or substantively enacted.
Deferred tax assets and deferred tax liabilities are offset if a legally enforceable right exists to set off current tax assets against current tax liabilities and the deferred taxes relate to the same taxable entity and the same taxation authority.
2.8 Employee benefits
2.8.1 Defined Contribution Plan: The Company makes defined contribution to Government Employee Provident Fund, Government Employee Pension Fund, Employee Deposit Linked Insurance and ESI, which are recognised in the statement of profit and loss on accrual basis. The Company recognises contribution payable to the provident fund scheme as an expenditure, when an employee renders the related service. The Company has no obligation, other than the contribution payable to the provident fund.
2.8.2 Retirement benefit costs and termination benefits: Payments to defined benefit plans are recognised as expense when employees have rendered service entitling them to the contributions.
The Company determines the present value of the defined benefit obligation and fair value of plan assets and recognises the net liability or asset in the balance sheet. The net liability or asset represents the deficit or surplus in the Company’s defined benefit plans. (The surplus is limited to the present value of economic benefits
available in the form of refunds from the plans or reductions in future contributions to the plans).
The present value of the obligation is determined using the projected unit credit method, with actuarial valuations being carried out at the end of each year.
Defined benefit costs are composed of:
service cost (including current service cost, past service cost, as well as gains and losses on curtailments and settlements);
net interest expense or income; and
Re-measurement
The first two components are recognised in profit or loss. Re-measurement, comprising actuarial gains and losses, the effect of the changes to the asset ceiling (if applicable) and the return on plan assets (excluding net interest), is reflected in the balance sheet and a charge or credit, (as the case may be), is recognised in other comprehensive income. Re-measurement recognised in other comprehensive income is reflected in retained earnings. Past service cost is recognised in profit or loss in the period of a plan amendment. Net interest is calculated by applying the discount rate at the beginning of the period to the net defined benefit liability or asset.
The retirement benefit liability or asset recognised in the balance sheet represents the actual deficit or surplus in the Company’s defined benefit plans. The surplus is limited to the present value of economic benefits available in the form of refunds from the plans or reductions in future contributions to the plans.
2.8.3 Short-term benefits: A liability is recognised for benefits accruing to employees in respect of wages and salaries, annual leave and other short-term benefits in the period the related service is rendered at the undiscounted amount of the benefits expected to be paid in exchange for that service.
Other long-term benefits: Liabilities recognised in respect of other long-term employee benefits are measured at the present value of the estimated future
ST
RA
TE
GIC
RE
PO
RT
ST
AT
UT
OR
Y R
EP
OR
TS
FIN
AN
CIA
L S
TA
TE
ME
NT
S
113
NOTES to the financial statements for the year ended 31 March 2018
cash outflows expected to be made by the Company in respect of services provided by employees up to the reporting date.
2.9 Share based payment arrangements:
Equity-settled share-based payments to employees of the Company and employees of subsidiary companies are measured at the fair value of the equity instruments at the grant date. Details regarding the determination of the fair value of equity-settled share-based transactions are set out in Note 35. The fair value determined at the grant date of the equity-settled share-based payments to employees of the Company is expensed on a straight-line basis over the vesting period, based on the Company’s estimate of equity instruments that will eventually vest, with a corresponding increase in equity at the end of year. At the end of each year, the Company revisits its estimate of the number of equity instruments expected to vest and recognises any impact in profit or loss, such that the cumulative expense reflects the revised estimate, with a corresponding adjustment to the equity-settled employee benefits reserve.
2.10 Leases
The determination of whether an arrangement is (or contains) a lease is based on the substance of the arrangement at the inception of the lease. The arrangement is, or contains, a lease if fulfilment of the arrangement is dependent on the use of a specific asset or assets and the arrangement conveys a right to use the asset or assets, even if that right is not explicitly specified in an arrangement.
For arrangements entered into prior to 1 April 2015, the Company has determined whether the arrangement contain lease on the basis of facts and circumstances existing on the date of transition.
Where the Company is the lessess:
Operating lease payments are recognised in profit or loss on a straight-line basis over the lease term unless another systematic basis is more representative of the time pattern of the user’s benefit or the lease payments are structured to increase in line with expected general inflation to compensate for the lessor’s expected inflationary cost increases.
Where the Company is the Lessor:
Leases in which the Company does not transfer substantially all the risks and benefits of ownership of the asset are classified as operating leases. Assets subject to operating leases are included in the property, plant and equipment. Lease income on an operating lease is recognised in the statement of profit and loss on a straight-line basis over the lease term. Costs, including depreciation, are recognised as an expense in the statement of profit and loss.
2.11Foreign Currency transactions
The Company’s financial statements are presented in INR which is also its functional currency. Transactions in currencies other than the Company’s functional currency (foreign currencies) are recognised at the rates of exchange prevailing at the dates of the transactions. At the end of each reporting period, monetary items denominated in foreign currencies are retranslated at the rates prevailing at that date. Exchange differences arising on settlement or translation of monetary items are recognised in the profit or loss.
2.12Borrowing Costs
Borrowing Cost includes interest and amortisation of ancillary costs incurred in connection with the arrangement of borrowings.
Borrowing costs directly attributable to the acquisition, construction or production of qualifying assets, as defined in Ind AS 23 are added to the cost of those assets, until such time as the assets are substantially ready for their intended use or sale.
All other borrowing costs are recognised in profit or loss in the period in which they are incurred.
2.13Provisions
Provisions are recognised when the Company has a present obligation (legal or constructive) as a result of a past event, it is probable that the Company will be required to settle the obligation and a reliable estimate can be made of the amount of the obligation.
The amount recognised as a provision is the best estimate of the consideration required to settle the present obligation at the end of the reporting period, taking into account the risks and uncertainties surrounding the obligation.
Annual Report 2017-2018114
NOTES to the financial statements for the year ended 31 March 2018
When a provision is measured using the cash flows estimated to settle the present obligation, its carrying amount is the present value of those cash flows.
2.14 Cash and cash equivalents
Cash and Cash Equivalents in the balance sheet and for the purpose of cash flow statement comprise cash in hand and cash at bank including fixed deposit with original maturity period of three months and short-term highly liquid investments with an original maturity of three months or less net of outstanding bank over drafts as they are considered an integral part of the Company’s cash management.
2.15 Cash dividend and non-cash distribution to equity holders
The Company recognises a liability to make cash or non-cash distributions to equity holders of the company when the distribution is authorised and the distribution is no longer at the discretion of the Company. As per the corporate laws in India, a distribution is authorised when it is approved by the shareholders. A corresponding amount is recognised directly in equity.
Non-cash distributions are measured at the fair value of the assets to be distributed with fair value re-measurement recognised directly in equity.
Upon distribution of non-cash assets, any difference between the carrying amount of the liability and the carrying amount of the assets distributed is recognised in the statement of profit and loss.
2.16 Earnings Per Share
Basic earnings per share are calculated by dividing the net profit or loss for the period attributable to equity shareholders by the weighted average number of equity shares outstanding during the period. The weighted average number of equity shares outstanding during the period and for all periods presented is adjusted for events, such as bonus shares that have changed the number of equity shares outstanding, without a corresponding change in resources.
For the purpose of calculating diluted earnings per share, the net profit or loss for the period attributable to equity shareholders and the weighted average number of shares outstanding during the period is adjusted for the effects of all dilutive potential equity shares.
2.A CRITICAL ACCOUNTING JUDGEMENTS AND KEY SOURCES OF ESTIMATION UNCERTAINTY
The preparation of the financial statements requires management to make Judgements, estimates and assumptions about the reported amounts of assets and liabilities, and income and expenses that are not readily apparent from other sources. Such judgements, estimates and associated assumptions are evaluated based on historical experience and various other factors, including estimation of the effects of uncertain future events, which are believed to be reasonable under the circumstances. Actual results may differ from these estimates. The estimates and underlying assumptions are reviewed on an on-going basis. Revisions to accounting estimates are recognised in the period in which the estimate is revised if the revision affects only that period or in the period of the revision and future periods if the revision affects both current and future periods.
The following are the critical judgements and estimations that have been made by the management in the process of applying the Company’s accounting policies and that have the most significant effect on the amount recognised in the financial statements and/or key sources of estimation uncertainty that may have a significant risk of causing a material adjustment to the carrying amounts of assets and liabilities within the next financial year.
Impairment of equity investment in a subsidiary Company
The accumulated losses of a subsidiary Company viz. Crossword Bookstores Ltd. (‘Crossword’), have eroded its net worth. Crossword is taking ongoing steps to revamp its business operations, including store right sizing and brand positioning.
Based on its future business plans and strategic growth projections, the Company has determined that no impairment is required at this stage. Further, the Company has historically also given guarantees to banks for loans taken by Crossword. Till date, the Company has had no cash outflows against such guarantees and therefore no provision has been considered necessary.
Income Tax
As stated in Note 26, tax expense is calculated using applicable tax rates and tax laws that have been enacted or substantively enacted. In arriving at taxable profit and tax bases of assets and liabilities the Company adjudges taxability of amounts in accordance with tax enactments, case law and opinions of tax counsel, as relevant. Where differences arise on tax assessment,

ST
RA
TE
GIC
RE
PO
RT
ST
AT
UT
OR
Y R
EP
OR
TS
FIN
AN
CIA
L S
TA
TE
ME
NT
S
115
NOTES to the financial statements for the year ended 31 March 2018
these are booked in the period in which they are agreed or on final closure of assessment.
Useful lives of property, plant and equipment and, intangible assets
The Company reviews the estimated useful lives of property, plant and equipment and intangible assets at the end of each reporting period. During financial years ended 31 March 2018, there were no changes in useful lives of property plant and equipment and intangible assets other than those resulting from store closures / shifting of premises.
The Company at the end of each reporting period, based on external and internal sources of information, assesses indicators and mitigating factors of whether a store (cash generating unit) may have suffered an impairment loss. If it is determined that an impairment loss has been suffered, it is recognised in profit or loss.
Point award schemes
Customer award credits having a predetermined life are granted to customers when they make purchases. The fair value of the consideration on sale of goods resulting in such award credits is allocated between the goods supplied and the award credits granted. The consideration allocated to the award credits is measured by reference to fair value from the standpoint of the holder and revenue is deferred. The Company at the end of each reporting period estimates the number of points redeemed and that it expects will be further redeemed, based on
empirical data of redemption / lapses, and revenue is accordingly recognised.
Service tax on renting of immovable properties given for commercial use
As stated in Note 30, the Company has challenged the retrospective levy of service tax on renting of immovable properties given for commercial use and pending the final disposal of the matter, which is presently before the Supreme Court, the Company continues not to provide for the retrospective levy.
Inventories
An inventory provision is recognised for cases where the realisable value is estimated to be lower than the inventory carrying value. The inventory provision is estimated taking into account various factors, including prevailing sales prices of inventory item, the seasonality of the item’s sales profile and losses associated with obsolete/slow-moving inventory items.
Employee Benefits
Provision for employee benefits in the nature of gratuity and unpaid leave balance is estimated on actuarial basis using a number of assumptions which include assumptions for discount rate, future salary increases, mortality rates, attrition rates for employees, return on planned assets etc. Any changes in these assumptions will impact the carrying amount of these provisions. Key assumptions are disclosed in Note 36.
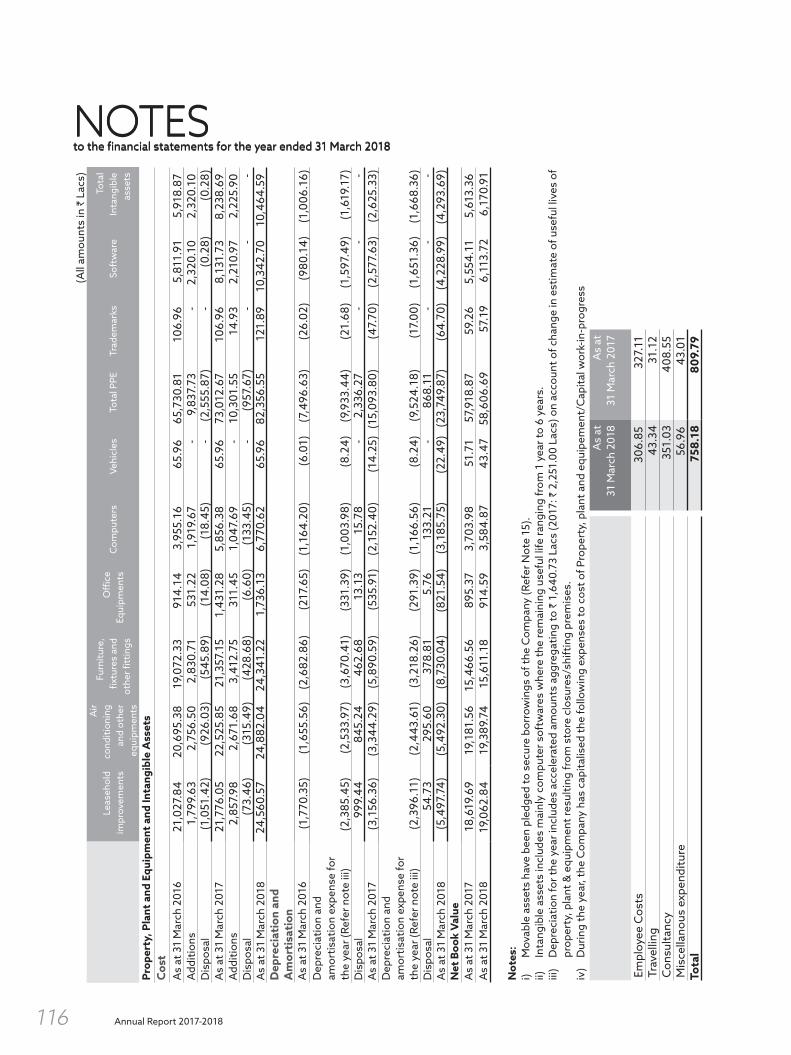
Annual Report 2017-2018116
NOTES to the financial statements for the year ended 31 March 2018
(All
amou
nts
in `
Lac
s)
Leas
ehol
d im
prov
emen
ts
Air
cond
ition
ing
and
othe
r eq
uipm
ents
Furn
iture
, fix
ture
s an
d ot
her fi
ttin
gs
Offi
ce
Equi
pmen
tsC
ompu
ters
Vehi
cles
Tota
l PPE
Trad
emar
ks
Soft
war
eTo
tal
Inta
ngib
le
asse
ts
Prop
erty
, Pla
nt a
nd E
quip
men
t an
d In
tang
ible
Ass
ets
Cos
t A
s at
31
Mar
ch 2
016
21,
027.
84
20,
695.
38
19,
072.
33
914
.14
3,9
55.1
6 6
5.96
6
5,73
0.81
1
06.9
6 5
,811
.91
5,9
18.8
7 A
dditi
ons
1,7
99.6
3 2
,756
.50
2,8
30.7
1 5
31.2
2 1
,919
.67
- 9
,837
.73
- 2
,320
.10
2,3
20.1
0 D
ispo
sal
(1,0
51.4
2) (9
26.0
3) (5
45.8
9) (1
4.08
) (1
8.45
) -
(2,5
55.8
7) -
(0.2
8) (0
.28)
As
at 3
1 M
arch
201
7 2
1,77
6.05
2
2,52
5.85
2
1,35
7.15
1
,431
.28
5,8
56.3
8 6
5.96
7
3,01
2.67
1
06.9
6 8
,131
.73
8,2
38.6
9 A
dditi
ons
2,8
57.9
8 2
,671
.68
3,4
12.7
5 3
11.4
5 1
,047
.69
- 1
0,30
1.55
1
4.93
2
,210
.97
2,2
25.9
0 D
ispo
sal
(73.
46)
(315
.49)
(428
.68)
(6.6
0) (1
33.4
5) -
(957
.67)
--
- A
s at
31
Mar
ch 2
018
24,
560.
57
24,
882.
04
24,
341.
22
1,7
36.1
3 6
,770
.62
65.
96
82,
356.
55
121
.89
10,
342.
70
10,
464.
59
Dep
reci
atio
n an
d A
mor
tisa
tion
As
at 3
1 M
arch
201
6 (1
,770
.35)
(1,6
55.5
6) (2
,682
.86)
(217
.65)
(1,1
64.2
0) (6
.01)
(7,4
96.6
3) (2
6.02
) (9
80.1
4) (1
,006
.16)
Dep
reci
atio
n an
d am
ortis
atio
n ex
pens
e fo
r th
e ye
ar (R
efer
not
e iii
) (2
,385
.45)
(2,5
33.9
7) (3
,670
.41)
(331
.39)
(1,0
03.9
8) (8
.24)
(9,9
33.4
4) (2
1.68
) (1
,597
.49)
(1,6
19.1
7)D
ispo
sal
999
.44
845
.24
462
.68
13.
13
15.
78
- 2
,336
.27
- -
- A
s at
31
Mar
ch 2
017
(3,1
56.3
6) (3
,344
.29)
(5,8
90.5
9) (5
35.9
1) (2
,152
.40)
(14.
25)
(15,
093.
80)
(47.
70)
(2,5
77.6
3) (2
,625
.33)
Dep
reci
atio
n an
d am
ortis
atio
n ex
pens
e fo
r th
e ye
ar (R
efer
not
e iii
) (2
,396
.11)
(2,4
43.6
1) (3
,218
.26)
(291
.39)
(1,1
66.5
6) (8
.24)
(9,5
24.1
8) (1
7.00
) (1
,651
.36)
(1,6
68.3
6)D
ispo
sal
54.
73
295
.60
378
.81
5.7
6 1
33.2
1 -
868
.11
--
- A
s at
31
Mar
ch 2
018
(5,4
97.7
4) (5
,492
.30)
(8,7
30.0
4) (8
21.5
4) (3
,185
.75)
(22.
49)
(23,
749.
87)
(64.
70)
(4,2
28.9
9) (4
,293
.69)
Net
Boo
k Va
lue
As
at 3
1 M
arch
201
7 1
8,61
9.69
1
9,18
1.56
1
5,46
6.56
8
95.3
7 3
,703
.98
51.
71
57,
918.
87
59.
26
5,5
54.1
1 5
,613
.36
As
at 3
1 M
arch
201
819
,062
.84
19,
389.
74
15,
611.
18
914
.59
3,5
84.8
7 4
3.47
5
8,60
6.69
5
7.19
6
,113
.72
6,1
70.9
1
Not
es:
i)
Mov
able
ass
ets
have
bee
n pl
edge
d to
sec
ure
borr
owin
gs o
f the
Com
pany
(Ref
er N
ote
15).
ii)
Inta
ngib
le a
sset
s in
clud
es m
ainl
y co
mpu
ter s
oftw
ares
whe
re th
e re
mai
ning
use
ful l
ife ra
ngin
g fr
om 1
yea
r to
6 ye
ars.
iii)
Dep
reci
atio
n fo
r the
yea
r inc
lude
s ac
cele
rate
d am
ount
s ag
greg
atin
g to
` 1
,640
.73
Lacs
(201
7: `
2,2
51.0
0 La
cs) o
n ac
coun
t of c
hang
e in
est
imat
e of
use
ful l
ives
of
prop
erty
, pla
nt &
equ
ipm
ent r
esul
ting
from
sto
re c
losu
res/
shift
ing
prem
ises
.iv
) D
urin
g th
e ye
ar, t
he C
ompa
ny h
as c
apita
lised
the
follo
win
g ex
pens
es to
cos
t of P
rope
rty,
pla
nt a
nd e
quip
emen
t/C
apita
l wor
k-in
-pro
gres
sA
s at
31
Mar
ch 2
018
As
at
31 M
arch
201
7
Empl
oyee
Cos
ts 3
06.8
5 3
27.1
1 Tr
avel
ling
43.
34
31.
12
Con
sulta
ncy
351
.03
408
.55
Mis
cella
nous
exp
endi
ture
56.
96
43.
01
Tota
l 7
58.1
8 8
09.7
9
NOTES to the financial statements for the year ended 31 March 2018

ST
RA
TE
GIC
RE
PO
RT
ST
AT
UT
OR
Y R
EP
OR
TS
FIN
AN
CIA
L S
TA
TE
ME
NT
S
117
NOTES to the financial statements for the year ended 31 March 2018
(All amounts in ` Lacs)
Capital work in progress
Intangible assets under
developement3. Capital work-in-progress and Intangible assets under development Cost As at 31 March 2016 2,781.81 14.34 Additions 8,637.74 2,508.40 Capitalisation (10,164.63) (2,089.67)As at 31 March 2017 1,254.92 433.07 Additions 9,629.23 1,879.20 Capitalisation (9,350.01) (2,030.97)As at 31 March 2018 1,534.14 281.30
(All amounts in ` Lacs)As at As at
31 March 2018 31 March 20174. Investments – Non-Currenta) (Unquoted at cost unless otherwise stated)
Investments in equity instrumentsi) In subsidiary companies
Shoppers' Stop Services (India) Limited 50,000 (2017: 50,000) Equity Shares of ` 10/- each Fully Paid 5.00 5.00 Less: Impairment in value (5.00) (5.00)
- - Upasna Trading Limited 5,000 (2017: 5,000) Equity Shares of ` 100/- each Fully Paid 5.00 5.00 Less: Impairment in value (5.00) (5.00)
- - Shoppers' Stop.com (India) Limited50,000 (2017: 50,000) Equity shares of ` 10/- each Fully Paid 5.00 5.00 Less: Impairment in value (5.00) (5.00)
- - Gateway Multichannel Retail (India) Limited50,000 (2017: 50,000) Equity shares of ` 10/- each Fully Paid 5.00 5.00 Less: Impairment in value (5.00) (5.00)
- - Crossword Bookstores Limited 1,35,62,500 (2017: 1,35,62,500) Equity shares of ` 10/- each Fully Paid 3,505.93 3,505.93 Hypercity Retail (India) Limited Nil (2017: 7,37,58,511) Equity Shares of ` 10/- each Fully Paid - 37,779.83 Less: Impairment in value (refer note 31) - (3,600.00)
- 34,179.83 ii) In Joint Ventures
Timezone Entertainment Private Limited Nil (2017: 244,46,247) Equity Shares of ` 10/- each Fully Paid (Refer Note 31) - 2,444.62 Less: Impairment in value - -
- 2,444.62 Nuance Group (India) Private Limited Nil (2017: 414,10,000) Equity Shares of ` 10/- each Fully Paid (Refer Note 31) - 4,141.00 Less: Impairment in value - (3,561.00)
- 580.00 iii) Other investments
(At fair value through Profit and Loss)Stargaze Properties Private Limited 1,000 (2017: 1,000) equity shares of ` 10/- each Fully paid 0.10 0.10

Annual Report 2017-2018118
NOTES to the financial statements for the year ended 31 March 2018
(All amounts in ` Lacs)As at As at
31 March 2018 31 March 2017Retailers Association of India 10,000 (2017:10,000) equity shares of ` 10/- each Fully paid 1.00 1.00 Retailers Association's Skill Council of India 0.50 0.50 500 (2017: 500) equity shares of ` 100/- each Fully paidNuance Group Fashion & Luxury Duty Free Private Limited - 0.05Nil (2017: 500) equity shares of ` 10/- each Fully paidAesthetic Realtors Private Limited66 (2017: 66) Equity Shares of ` 10/- each Fully Paid 0.01 0.01 Less: Impairment in value (0.01) (0.01)
(0.00) (0.00)iv) Deemed equity investments in:*
Hypercity Retail (India) Limited - 79.53 Crossword Bookstores Limited 9.12 9.02 * Being share options to employees of subsidiary companies
Total (A) 3,516.65 40,800.58
b) Quoted (fair value through Other Comprehensive Income)Investments in equity instrumentsFuture Retail Limited 47,56,823 (2017: Nil) equity shares of ` 2/- each Fully paid, Refer Note 31 26,241.01 - Total (B) 26,241.01 - Total (A) + (B) 29,757.66 40,800.58
4. Investments – CurrentQuoted (At fair value through Profit and Loss)Investments in mutual fundsL & T Mutual Fund 600.97 - 25,220 (2017: Nil) units in Liquid fund – Direct Growth PlanICICI Prudential Mutual Fund 600.73 - 2,49,970 (2017: Nil) units in Money market fund – Direct Growth PlanJM Financial Mutual Fund High Liquidity fund – Direct – Growth 200.35 - 42,115 (2017: Nil) units in High Liquidity fund – Direct Growth PlanAxis Mutual Fund 601.14 - 31,187 (2017: Nil) units in Liquid fund – Direct Growth planTotal 2,003.55 - Aggregate value of quoted investment 28,244.56 - Aggregate value of unquoted investment 3,516.65 40,800.58 Aggregate amount of impairment in value of investments 20.00 7,181.00
(All amounts in ` Lacs)As at
31 March 2018 As at
31 March 2017
5. LoansNon-current (Unsecured)Loans to subsidiairy companies (Refer note 38)- Considered good 766.26 10,348.59 - Considered doubtful 2,329.10 2,329.10
3,095.36 12,677.69 Less: Allowance for doubtful loans 2,329.10 2,329.10
766.26 10,348.59
5.1 The above loans are given for general corporate and business purposes. They are interest bearing and repayable on demand. The loans are carried at amortised cost.
5.2 These financial assets have been pledged to secured borrowings of the Company (Refer note 15).

ST
RA
TE
GIC
RE
PO
RT
ST
AT
UT
OR
Y R
EP
OR
TS
FIN
AN
CIA
L S
TA
TE
ME
NT
S
119
NOTES to the financial statements for the year ended 31 March 2018
(All amounts in ` Lacs)
As at 31 March 2018
As at 31 March 2017
6. Other Financial Assets(unsecured)Non-currentPremises and other deposits - Considered good 11,312.50 12,985.47 - Considered doubtful 357.38 337.38
11,669.88 13,322.85 Less: Allowance for doubtful deposits 357.38 337.38
11,312.50 12,985.47 Other Bank Balance- Bank deposits more than 12 months maturity from balance sheet date 114.09 -
11,426.59 12,985.47 CurrentAdvances for goods and rendering of services- Considered good - 3,322.95 - Considered doubtful - 731.76
- 4,054.71 Less: Allowance for doubtful advances - 731.76
- 3,322.95 Advances to employees 53.87 247.24 Advances to subsidiary companies (refer note 38) 4.23 228.95 Premises and other deposits (unsecured, considered good) 154.39 - Other receivables- Considered good 331.56 - - Considered doubtful 344.94 -
676.50 - Less: Allowance for doubtful advances 344.94 -
331.56 - 544.05 3,799.14
6.1 These are carried at amortised cost.6.2 These have been pledged to secure borrowings of the Company (Refer note 15).
(All amounts in ` Lacs)As at
31 March 2018 As at
31 March 20177. Deferred tax assets / Liabilities (net)Deferred tax assets 1,987.77 1,168.29 Deferred tax liabilities (10.17) (739.07)
1,977.60 429.22

Annual Report 2017-2018120
NOTES to the financial statements for the year ended 31 March 2018
Balance Sheet Statement of Profit and LossAs at
March 31, 2018As at
March 31, 2017Year ended
March 31, 2018Year ended
March 31, 2017Deferrred tax assets / (liabilities) relates to the following:Deferred tax LiabilitiesProperty, plant and equipment & Intangible assets (10.17) (739.07) (728.90) (31.15)
- Deferred tax Assets - Provision for doubtful debts / advances 437.22 344.21 (93.00) 114.88 Provision for expenses 372.41 145.04 (227.39) 13.07 Employee benefits 358.40 397.17 38.77 144.00 Deferred Revenue on point reward schemes 64.30 151.90 87.61 (234.34)Lease Deposits 176.48 129.97 (46.51) 61.96 MTM on Future Retail Ltd Shares 72.47 - (72.47) - Short-Term Capital Loss 506.49 - (506.49) - Net deferred tax assets / (liabilities) 1,977.60 429.22 (1,548.38) 68.42
(All amounts in ` Lacs)As at
31 March 2018 As at
31 March 20178. Other Assets(Unsecured, considered good)Non-currentCapital Advances 930.14 660.66 Service tax deposited under protest (Note 30) 3,541.34 3,541.34 Advance Income tax (Net of provision) 1,144.84 877.33 Prepaid Expenses 3,899.89 3,089.70
9,516.21 8,169.03 CurrentRecoverables – Statutory dues 10,349.49 1,174.29 Advance for Goods & Services- Considered good 3,584.12 1,289.34 - Considered doubtful 309.69 -
3,893.81 1,289.34 Less: Allowance for doubtful advances 309.69 -
3,584.12 1,289.34 Prepaid Expenses 1,710.02 - Other assets- Considered good 285.53 - - Considered doubtful 236.00 -
521.53 - Less: Allowance for doubtful assets 236.00 -
285.53 - 15,929.16 2,463.63
(All amounts in ` Lacs)As at
31 March 2018 As at
31 March 20179. Inventories(At lower of cost and Net realisable value)Stock-in-trade: Retail merchandise 32,842.43 35,276.50
9.1 Inventories have been pledged as security for borrowings. (Refer note 15)9.2 The mode of valuation of inventories has been stated in Note 2.4.

ST
RA
TE
GIC
RE
PO
RT
ST
AT
UT
OR
Y R
EP
OR
TS
FIN
AN
CIA
L S
TA
TE
ME
NT
S
121
NOTES to the financial statements for the year ended 31 March 2018
(All amounts in ` Lacs)As at
31 March 2018 As at
31 March 201710. Trade receivables – current(Unsecured)Considered good 4,372.44 3,574.66 Considered doubtful 30.47 30.47
4,402.91 3,605.13 (30.47) (30.47)
Less: Impairment allowance for doubtful debts 4,372.44 3,574.66
10.1 Trade receivables are carried at amortised cost.10.2 These financial assets have been pledged to secure borrowings of the Company (Refer note 15).10.3 No trade or other receivables are due from directors or other officials of the Company either severally or jointly with any
other persons. 10.4 For terms and conditions relating to related party receivables, Refer Note No. 38.10.5 Trade receivables are non-interest bearing and are generally on terms of 30 to 120 days.
(All amounts in ` Lacs)As at
31 March 2018 As at
31 March 201711. Cash and cash equivalentsBalance with banks in current accounts 69.57 82.81 Cash on hand 388.06 212.22 Less: Impairment allowance for doubtful debts 457.63 295.03
11.1 These financial assets have been pledged to secure borrowings (Refer note 15).11.2 Short-term deposits are made for varying periods of between one day and three months, depending on the immediate
cash requirements of the Company, and earn interest at the respective short-term deposit rates.11.3 For the purpose of Statement of cash flow,Cash and cash equivalents comprise the followings :
As at 31 March 2018
As at 31 March 2017
Balance with banks in current accounts 69.57 82.81 Cash on hand 388.06 212.22
457.63 295.03 Less : Bank overdraft / Cash credit (Refer Note 15) (761.12) (8,993.61)
(303.49) (8,698.58)
(All amounts in ` Lacs)As at
31 March 2018 As at
31 March 201712. Other bank balancesMargin money accounts (under lien against bank guarantee) 65.18 207.29 Earmarked accounts (for unpaid dividend) 0.38 0.38
65.57 207.67
(All amounts in ` Lacs)As at
31 March 2018 As at
31 March 201713. Share capital13.1 Authorised200,000,000 equity shares of ` 5/- each 10,000.00 10,000.00 13.2 Issued, subscribed and fully paid-up shares87,960,689 (2017: 83,504,744) equity shares of ` 5/- each fully paid-up 4,398.03 4,175.24
4,398.03 4,175.24

Annual Report 2017-2018122
NOTES to the financial statements for the year ended 31 March 2018
Particulars:31 March 2018 31 March 2017
Numbers ` Lacs Numbers ` Lacs13.3 Reconciliation of number of equity shares:Balance at the beginning of the year 835,04,744 4,175.24 834,61,946 4,173.10 Issued during the year (Refer Note 13.6) 44,55,945 222.79 42,798 2.14 Balance at the end of the year 879,60,689 4,398.03 835,04,744 4,175.24
Name of the Shareholder As at 31 March 2018 As at 31 March 2017
Shares held (Nos)
Shares held (%)Shares held
(Nos)Shares held (%)
13.4 Details of shareholders holding more than 5% shares as at 31 March:
Palm Shelter Estate Development LLP 11,813,300 13.43% 11,813,300 14.15%Anbee Construction LLP 10,386,401 11.81% 10,386,401 12.44%Cape Trading LLP 10,386,401 11.81% 10,386,401 12.44%Reliance Capital Trustee Co. Ltd. A/C Reliance Equity Opportunities Fund
6,346,491 7.22% 6,225,905 7.46%
Raghukool Estate Development LLP 5,593,300 6.36% 5,593,300 6.70%Capstan Trading LLP 5,459,768 6.21% 5,459,768 6.54%Casa Maria Properties LLP 5,253,300 5.97% 5,253,300 6.29%
13.5 The Company has one class of equity shares having a par value of ` 5 per share. Each equity shareholder is eligible for one vote per share held. Each equity shareholder is entitled to dividends as and when the Company declares and pays dividend after obtaining shareholders’ approval. In the event of liquidation of the Company, the holders of equity shares will be entitled to receive the remaining assets of the Company, after distribution of all preferential amounts. The distribution will be in proportion to the number of equity shares held by the shareholders.
13.6 The Board of Directors and the shareholders of the Company at their meetings held on 23 September 2017 and 18 October 2017 respectively have approved issue of 43,95,925 equity shares of ̀ 5 each at an issue price of ̀ 407.78 per equity share to Amazon.com NV Investment Holdings LLC, on a preferential basis. On 12 January 2018, the Company has allotted these equity shares, which are pari passu in all respect.
The Company has issued and allotted 60,020 number of shares under Share options schemes to certain employees- Refer Note 35.
(All amounts in ` Lacs)As at
31 March 2018 As at
31 March 201714. Other equitySecurities premium reserve 65,439.81 47,521.31 General reserves 1,909.19 1,909.19 Retained earnings 23,528.09 22,242.92 Share options outstanding account 61.50 226.95
90,938.59 71,900.37
For addition and deductions under each of the above heads see Statement of changes in equity.
14.1 Securities premium reserve Securities premium reserve is used to record the premium received on issue of shares. The securities premium can be
utilised only in accordance with the provisions of the Companies Act 2013.
14.2 General reserve The General Reserve is mainly created/built by the Company from time to time by transferring the profits from retained
earnings. This reserve may be utilised mainly to declare dividend as permitted under the Companies Act 2013.
14.3 Share options outstanding account Share options outstanding account relates to share options granted by the Company to certain employees under share
option plan. Further information about share based payments to employees is set out in Note 35.

ST
RA
TE
GIC
RE
PO
RT
ST
AT
UT
OR
Y R
EP
OR
TS
FIN
AN
CIA
L S
TA
TE
ME
NT
S
123
NOTES to the financial statements for the year ended 31 March 2018
(All amounts in ` Lacs)As at
31 March 2018 As at
31 March 201715. BorrowingsNon-currentTerm Loans (Secured) from banks 7,976.77 37,294.31 Less: Current maturities (Refer note 17) 4,000.00 16,297.63
3,976.77 20,996.68
15.1 Term Loans are secured by a first pari passu charge on stock,book debts, hypothecation charge on credit card/debit card receivables (Escrow account) and all the movable fixed assets of the Company, both present & future except ICICI Bank Term loans which is secured by 1 pari passu charge on the current assets and all the movable fixed assets of the Company both present and future excluding leasehold rights, lease deposits and Shoppers Stop brands.
15.2 Terms of the Facilities:-Loan Balance
Name of the Bank Rate of Interest Repayment Schedule 31 March 2018 31 March 2017Non-current borrowingsHDFC Bank Nil (2017: 10.40%) 12 quarterly equal installments from
10 January 2015. - 1,249.70
HDFC Bank Nil (2017: 10.40%) 14 equal quarterly installments from 01 June 2015.
- 1,070.60
HDFC Bank Nil (2017: 9.50%) 12 equal quarterly installments from 30 June 2017
- 4,993.56
ICICI Bank Nil (2017: 9.70%) 15 equal quarterly installments from 01 September 2014.
- 1,332.69
ICICI Bank Nil (2017: 9.70%) 12 equal quarterly installments from 01 December 2015.
- 5,788.06
IDBI Bank 9.45% (2017: 9.95%) 10 equal quarterly installments from 09 December 2017.
7,976.77 9,992.48
Kotak Mahindra Bank Nil (2017: 10.40%) 12 equal quarterly installments from 08 December 2015
- 2,500.00
Kotak Mahindra Bank Nil (2017: 9.75%) Repayable on 30 September 2017. - 2,000.00 Kotak Mahindra Bank Nil (2017:9.25%) Repayable in 12 equal quarterly
installments from 03 December 2017
- 4,992.22
Abu Dhabi Commercial Bank Nil (2017: 10.25%) 12 equal quarterly installments from 10 September 2016
- 3,375.00
Total Non-current borrowings 7,976.77 37,294.31 Current maturities of long-term borrowingsHDFC Bank Nil (2017: 10.40) 12 quarterly equal installements
from 10 January 2015. - 1,250.01
HDFC Bank Nil (2017: 10.40%) 14 equal quarterly installments from 01 June 2015.
- 714.29
HDFC Bank Nil (2017: 9.50%) 12 equal quarterly installments from 30 June 2017
- 1,666.67
ICICI Bank Nil (2017: 9.70%) 15 equal quarterly installments from 01 September 2014.
- 1,333.33
ICICI Bank Nil (2017: 9.70%) 12 equal quarterly installments from 01 December 2015.
- 3,333.34
IDBI Bank 9.45% (2017: 9.95%) 10 equal quarterly installments from 09 December 2017.
4,000.00 2,000.00
Kotak Mahindra Bank Nil (2017: 10.40%) 12 equal quarterly installments from 08 December 2015
- 1,666.66
Kotak Mahindra Bank Nil (2017: 9.75%) Repayable on 30 September 2017. - 2,000.00 Kotak Mahindra Bank Nil (2017:9.25%) Repayable in 12 equal quarterly
installments from 03 December 2017 - 833.33
Abu Dhabi Commercial Bank Nil (2017: 10.25%) 12 equal quarterly installments from 10 September 2016
- 1,500.00
Total Current borrowings 4,000.00 16,297.63
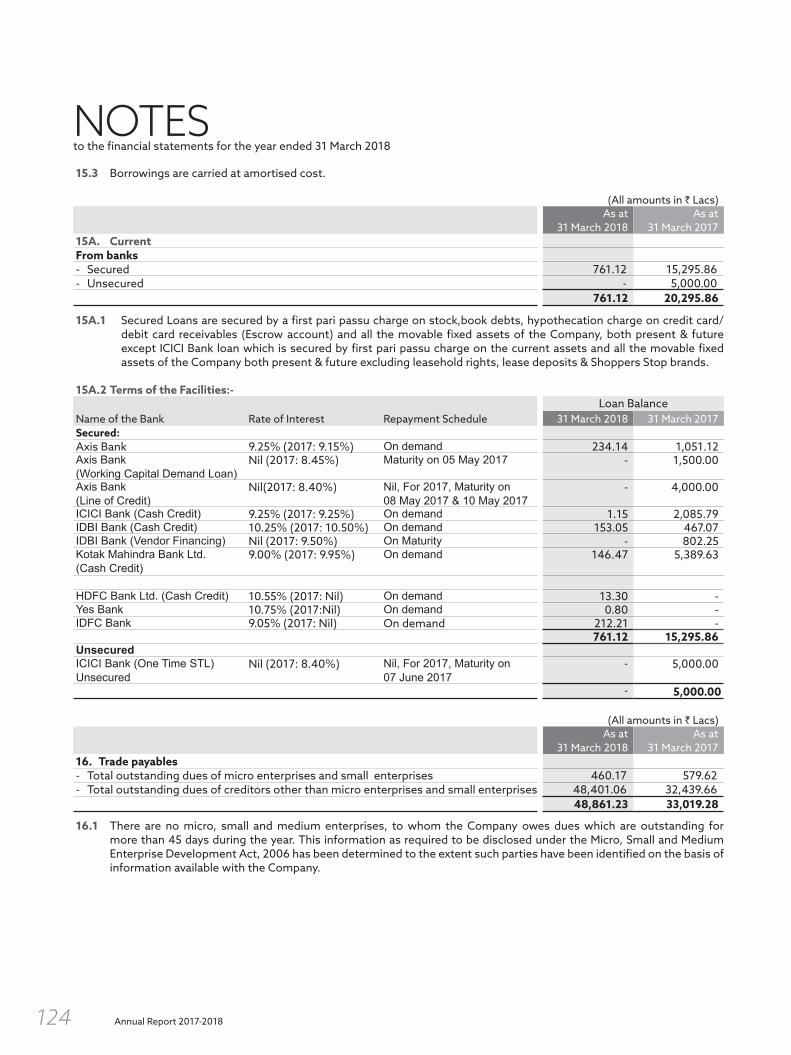
Annual Report 2017-2018124
NOTES to the financial statements for the year ended 31 March 2018
15.3 Borrowings are carried at amortised cost.
(All amounts in ` Lacs)As at
31 March 2018 As at
31 March 201715A. CurrentFrom banks- Secured 761.12 15,295.86 - Unsecured - 5,000.00
761.12 20,295.86
15A.1 Secured Loans are secured by a first pari passu charge on stock,book debts, hypothecation charge on credit card/debit card receivables (Escrow account) and all the movable fixed assets of the Company, both present & future except ICICI Bank loan which is secured by first pari passu charge on the current assets and all the movable fixed assets of the Company both present & future excluding leasehold rights, lease deposits & Shoppers Stop brands.
15A.2 Terms of the Facilities:-Loan Balance
Name of the Bank Rate of Interest Repayment Schedule 31 March 2018 31 March 2017Secured:Axis Bank 9.25% (2017: 9.15%) On demand 234.14 1,051.12 Axis Bank (Working Capital Demand Loan)
Nil (2017: 8.45%) Maturity on 05 May 2017 - 1,500.00
Axis Bank (Line of Credit)
Nil(2017: 8.40%) Nil, For 2017, Maturity on 08 May 2017 & 10 May 2017
- 4,000.00
ICICI Bank (Cash Credit) 9.25% (2017: 9.25%) On demand 1.15 2,085.79 IDBI Bank (Cash Credit) 10.25% (2017: 10.50%) On demand 153.05 467.07 IDBI Bank (Vendor Financing) Nil (2017: 9.50%) On Maturity - 802.25 Kotak Mahindra Bank Ltd. (Cash Credit)
9.00% (2017: 9.95%) On demand 146.47 5,389.63
HDFC Bank Ltd. (Cash Credit) 10.55% (2017: Nil) On demand 13.30 - Yes Bank 10.75% (2017:Nil) On demand 0.80 - IDFC Bank 9.05% (2017: Nil) On demand 212.21 -
761.12 15,295.86 UnsecuredICICI Bank (One Time STL) Unsecured
Nil (2017: 8.40%) Nil, For 2017, Maturity on 07 June 2017
- 5,000.00
- 5,000.00
(All amounts in ` Lacs)As at
31 March 2018 As at
31 March 201716. Trade payables- Total outstanding dues of micro enterprises and small enterprises 460.17 579.62 - Total outstanding dues of creditors other than micro enterprises and small enterprises 48,401.06 32,439.66
48,861.23 33,019.28
16.1 There are no micro, small and medium enterprises, to whom the Company owes dues which are outstanding for more than 45 days during the year. This information as required to be disclosed under the Micro, Small and Medium Enterprise Development Act, 2006 has been determined to the extent such parties have been identified on the basis of information available with the Company.

ST
RA
TE
GIC
RE
PO
RT
ST
AT
UT
OR
Y R
EP
OR
TS
FIN
AN
CIA
L S
TA
TE
ME
NT
S
125
NOTES to the financial statements for the year ended 31 March 2018
(All amounts in ` Lacs)As at
31 March 2018 As at
31 March 201717. Other financial liabilities Other financial liabilities measured at amortised costCurrent maturities of long term borrowings 4,000.00 16,297.63 Interest accrued but not due on borrowings 0.13 165.88 Unpaid dividends 0.38 0.38 Creditors for capital expenditure 2,313.17 1,217.19 Accrued payroll 1,478.82 1,836.32 Security deposits 98.15 100.32 Related parties payables (Refer Note 38) 140.34 109.85
8,030.99 19,727.57
(All amounts in ` Lacs)As at
31 March 2018 As at
31 March 201718. Provisions Provision for employee benefits:Gratuity 193.22 200.82 Leave encashment 601.18 516.04
794.40 716.86
(All amounts in ` Lacs)As at
31 March 2018 As at
31 March 201719. Other current liabilities Statutory liabilities 7,695.12 2,305.15 Award schemes and gift vouchers 10,760.22 10,432.73 Others 35.72 -
18,491.06 12,737.88
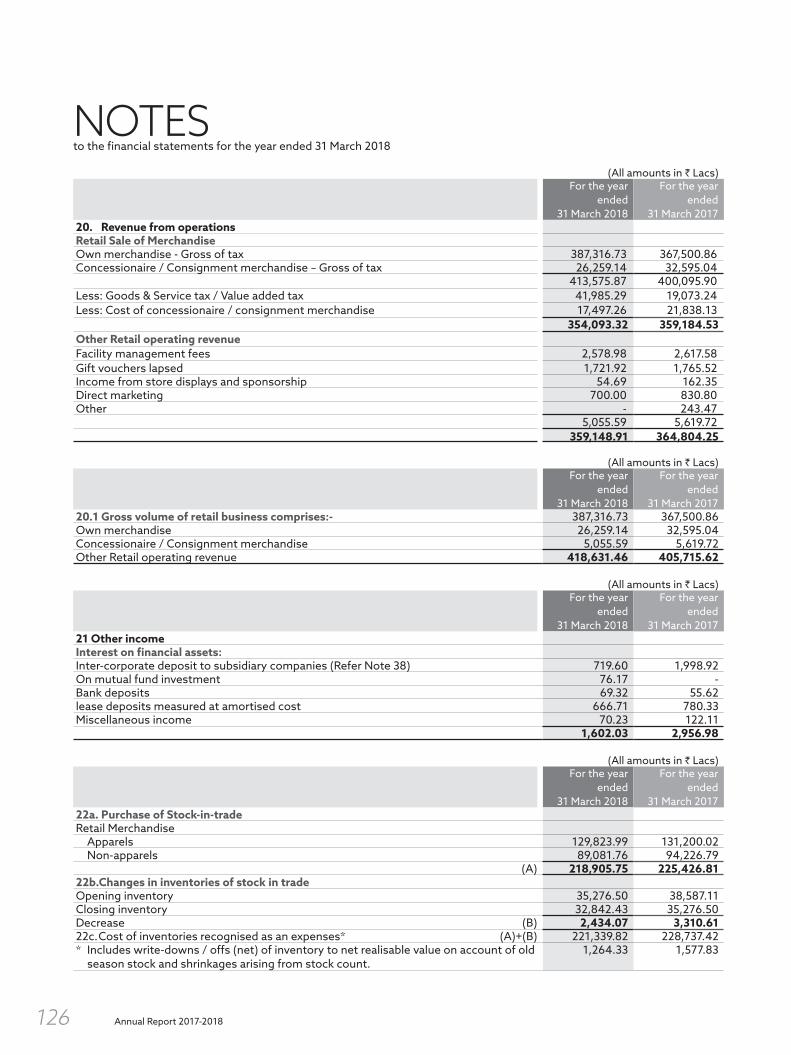
Annual Report 2017-2018126
NOTES to the financial statements for the year ended 31 March 2018
(All amounts in ` Lacs)For the year
ended 31 March 2018
For the year ended
31 March 201720. Revenue from operations Retail Sale of Merchandise Own merchandise - Gross of tax 387,316.73 367,500.86 Concessionaire / Consignment merchandise – Gross of tax 26,259.14 32,595.04
413,575.87 400,095.90 Less: Goods & Service tax / Value added tax 41,985.29 19,073.24 Less: Cost of concessionaire / consignment merchandise 17,497.26 21,838.13
354,093.32 359,184.53 Other Retail operating revenueFacility management fees 2,578.98 2,617.58 Gift vouchers lapsed 1,721.92 1,765.52 Income from store displays and sponsorship 54.69 162.35 Direct marketing 700.00 830.80 Other - 243.47
5,055.59 5,619.72 359,148.91 364,804.25
(All amounts in ` Lacs)For the year
ended 31 March 2018
For the year ended
31 March 201720.1 Gross volume of retail business comprises:- 387,316.73 367,500.86 Own merchandise 26,259.14 32,595.04 Concessionaire / Consignment merchandise 5,055.59 5,619.72 Other Retail operating revenue 418,631.46 405,715.62
(All amounts in ` Lacs)For the year
ended 31 March 2018
For the year ended
31 March 201721 Other income Interest on financial assets:Inter-corporate deposit to subsidiary companies (Refer Note 38) 719.60 1,998.92 On mutual fund investment 76.17 - Bank deposits 69.32 55.62 lease deposits measured at amortised cost 666.71 780.33 Miscellaneous income 70.23 122.11
1,602.03 2,956.98
(All amounts in ` Lacs)For the year
ended 31 March 2018
For the year ended
31 March 201722a. Purchase of Stock-in-trade Retail Merchandise Apparels 129,823.99 131,200.02 Non-apparels 89,081.76 94,226.79
(A) 218,905.75 225,426.81 22b.Changes in inventories of stock in tradeOpening inventory 35,276.50 38,587.11 Closing inventory 32,842.43 35,276.50 Decrease (B) 2,434.07 3,310.61 22c. Cost of inventories recognised as an expenses* (A)+(B) 221,339.82 228,737.42 * Includes write-downs / offs (net) of inventory to net realisable value on account of old
season stock and shrinkages arising from stock count. 1,264.33 1,577.83

ST
RA
TE
GIC
RE
PO
RT
ST
AT
UT
OR
Y R
EP
OR
TS
FIN
AN
CIA
L S
TA
TE
ME
NT
S
127
NOTES to the financial statements for the year ended 31 March 2018
(All amounts in ` Lacs)For the year
ended 31 March 2018
For the year ended
31 March 201723. Employee costsSalaries and Wages 27,272.68 24,991.31 Contribution to provident and other funds (Refer note 36) 1,881.63 1,698.71 Share-based payments cost * 10.63 65.22 Staff welfare expenses 969.83 595.13
30,134.77 27,350.37 * Measured at fair value. For details of share options granted by the Company to the certain employees, Refer Note 35.
(All amounts in ` Lacs)For the year
ended 31 March 2018
For the year ended
31 March 201724. Finance costsInterest on borrowings 3,551.46 5,758.24 Bank charges 64.66 86.77
3,616.12 5,845.01
(All amounts in ` Lacs)For the year
ended 31 March 2018
For the year ended
31 March 201725. Other expensesLease rent and hire charges (Note 27.1) 35,973.06 34,797.41 Business conducting fees 1,441.11 1,442.62 Rates and taxes 2,605.70 8,482.65 Repairs and maintenance- Buildings 8,339.19 7,992.48 - Others 1,007.63 1,222.12 Legal and professional fees (Note 27.2) 1,107.26 738.67 Housekeeping charges 1,798.05 1,703.96 Security charges 2,743.04 2,803.05 Computer expenses 2,492.69 2,596.46 Conveyance and travelling expenses 2,158.20 1,682.74 Electricity charges 9,168.52 9,354.67 Advertisement and publicity 5,554.09 5,788.54 Sales promotion 4,184.97 3,249.50 Charges on credit card transactions 2,656.78 2,558.27 Allowances for bad and doubtful financial assets* 240.65 308.00 Loss on sale of property, plant and equipment (net) 54.13 1.49 Foreign exchange gain / loss (net) (16.27) 48.61 Corporate Social Responsibility expenses 84.08 74.32 Miscellaneous expenses 4,917.83 4,618.74
86,510.72 89,464.30 *excludes exceptional items

Annual Report 2017-2018128
NOTES to the financial statements for the year ended 31 March 2018
(All amounts in ` Lacs)For the year
ended 31 March 2018
For the year ended
31 March 201726. Income tax expense recognised in profit or lossCurrent income tax: 3,897.31 2,641.88 Current income tax charge (593.29) (548.09)Adjustments in respect of current income tax of previous year 3,304.01 2,093.79 TotalDeferred tax: (1,548.38) (594.34)In respect of current year - 525.92 In respect of prior years (1,548.38) (68.42)TotalIncome tax expense reported in the statement of profit and loss 1,755.63 2,025.37
OCI Section - Deferred tax related to items recognised in OCI during in the year:For the year
ended 31 March 2018
For the year ended
31 March 2017Net loss / (gain) on remeasurements of defined benefit plans 43.22 13.89 Net (gain) / loss on revaluation of cash flow hedges - - Unrealised (gain) / loss on MTM - FRL 72.48 - Income tax expense charged to OCI 115.70 13.89
Reconciliation of tax expense and the accounting profit multiplied by India’s domestic tax rate for 31 March 2017 and 31 March 2018:
For the year ended
31 March 2018
For the year ended
31 March 2017Profit before tax (Before exceptional item) 7,956.97 4,811.52 Income tax expense calculated at 34.608 % 2,753.75 1,665.17 Effect of expenses that are not deductible in determining taxable profit 161.20 382.38 Adjustments in respect of current income tax of previous year (593.30) - Others (566.02) (22.17)Income tax expense recognised in profit or loss 1,755.63 2,025.37
(All amounts in ` Lacs)As at
31 March 2018 As at
31 March 201727.1. Leases Operating lease commitment as lesseeExpenses recognised in the statement of profit and lossa) Minimum lease payments 11,487.10 12,236.85 b) Contingent rent 24,485.96 21,526.63 Variable rent for certain stores is payable in accordance with the lease agreement
as the higher of (a) fixed minimum guarantee amount and (b) revenue share percentage.
c) The future minimum rental payments in respect of non cancellable lease for premises are as follows:
Within one year 5,740.86 4,911.46 After one year but not more than five years 7,353.04 4,928.26 More than five years - - The agreements are executed for periods ranging from 24 to 288 months with a non-cancellable period at the beginning of the agreement ranging from 24 to 108 months and having a renewable clause.27.2 Payments to Auditors (excluding taxes):

ST
RA
TE
GIC
RE
PO
RT
ST
AT
UT
OR
Y R
EP
OR
TS
FIN
AN
CIA
L S
TA
TE
ME
NT
S
129
NOTES to the financial statements for the year ended 31 March 2018
(All amounts in ` Lacs)As at
31 March 2018 As at
31 March 2017 i) Audit fees 53.00 50.00 ii) Other matters 11.46 22.37 iii) Out of pocket expenses 2.26 0.90
66.72 73.27 27.3 Expenditure related to corporate social responsibility as per Section 135 of the
Companies Act,2013 read with schedule VIII thereof ` 84.16 Lacs (2017: ` 74.32 Lacs)
a) Gross amount required to be spent by the Company is ` 84.16 Lacs (2017 ` 74.32 lacs)
b) Details of amount spent are as under: Construction/acquisition of an asset - - On purpose other than above – Livelihood creation – 64.08 74.32 For the persons with disabilities (Employment linked training) c) Ensuring environmental sustainability (Swachh Bharat) 20.08 Total 84.16 74.32 d) Details of expenditure paid to related party, in relation to CSR expenditure.
Refer Note 38
28. Earning Per Equity Share
Basic EPS amounts are calculated by dividing the profit / (loss) for the year attributable to equity holders of the Company by weighted average number of equity shares outstanding during the year.
Diluted EPS amounts are calculated by dividing the profit / (loss) attributable to equity holders of the Company by the weighted average number of equity shares outstanding during the year plus the weighted average number of equity shares that would be issued on conversion of all the dilutive potential equity shares into equity shares.
The following reflects the income and share data used in the basic and diluted EPS computations:
As at 31 March 2018
As at 31 March 2017
(a) Profit / (Loss) attributable to equity share holders (` In lacs) 1,160.38 (1,993.85)(b) Weighted Number of equity shares outstanding during the year 84,476,182 83,497,550 (c) Weighted Number of equity shares outstanding during the year after
adjustment for dilution 84,491,999 83,497,550
(d) Nominal value per share (`) 5 5 (e) EPS: Basic (`) 1.37 (2.39) Diluted (`) 1.37 (2.39) Weighted Average number of Equity shares for basic EPS 84,476,182 83,497,550 Effect of dilution: Share options 15,817 -* Weighted average number of Equity shares adjusted for the effect of dilution 84,491,999 83,497,550
* Anti dilutive

Annual Report 2017-2018130
NOTES to the financial statements for the year ended 31 March 2018
(All amounts in ` Lacs)As at
31 March 2018 As at
31 March 201729. Contingent liabilities and commitments: i) Contingent liabilities a) Claims against the Company not acknowledged as debts,comprising of: Income tax claims disputed by the Company relating to disallowances
aggregating 240.00 1,036.41
Indirect tax claims disputed by the Company relating to issues of applicability and classification aggregating
- Service Tax other than on Rent 1,120.42 1,120.42 - Service Tax on Rent (Refer Note 30) 1,659.56 1,659.56 - VAT 5.79 8.23 - Customs Duty 42.61 42.60 Third party claims arising from disputes relating to contracts aggregating - 236.74 b) Other matters 25.00 25.00 Note: Future cash outflows in respect of (a) above are determinable
only on receipt of judgements / decisions pending with various forums /authorities.
c) Bank Guarantees 538.89 538.26 ii) Commitments a) Estimated amount of contracts remaining to be executred on capital
account and not provided for 2,206.80 3,290.56
b) Corporate guarantee given to bank jointly and severally: - With joint venture partner for loans taken by Joint venture entity - 2,325.00 - With the promoter group Company for loans taken by Crossword
Bookstores Ltd. ` 2,340.00 Lacs (2017: Hypercity Retail (India) Ltd. ` 31,583.00 Lacs and Crossword Bookstores Ltd. ` 1,800.00 Lacs)
2,340.00 33,383.00
30. Service tax
Pursuant to levy of service tax on renting of immovable properties given for commercial use, retrospectively with effect from 1 June 2007, the Company has, based on a legal advice, and challenged the said levy and, inter-alia, its retrospective application. Pending the final disposal of the matter, which is presently before the Supreme Court, the Company continues not to provide for the retrospective levy aggregating ` 1,659.56 lacs for the period 1 June, 2007 to 31 March, 2010.
31. Exceptional Items:
i) During the year, In terms of the Share Purchase Agreement executed with Future Retail Limited and approval accorded by the members through postal ballot, the Company disposed of 77,158,778 equity shares of ` 10/- each constituting 51.09% of the share capital of Hypercity Retail (India) Ltd.; its material subsidiary to Future Retail Limited on 30 November 2017. Accordingly, Hypercity ceases to be subsidiary of the Company. The Company was allotted 4,756,823 equity shares of ` 2/- each at an issue price of ` 537/ - per equity share by Future Retail Limited and received cash consideration in terms of the aforesaid Share Purchase Agreement. Accordingly, the Company has recorded a net loss of ` 4,886.75 lacs in the current financial year which has been disclosed as an exceptional item. (31 March 2017 impairment loss of ` 3,600 lacs).
ii) During the year, the Company has disposed off its 40% shareholding in Nuance Group (India) Pvt. Ltd (NGIPL) to The Nuance Group AG, Switzerland, at a consideration of ` 600 lacs on 6 October 2017. With the disposal of this shareholding, the Shareholders Agreement executed with them, stands terminated and accordingly, NGIPL ceases to be an associate Company of the Company.Accordingly, the Company has recorded a net gain of ` 20 lacs in the current financial year which has been disclosed as an exceptional item. (31 March 2017 impairment of ` 1,180 lacs).
iii) During the year, the Company has disposed off its 48.42% shareholding in Timezone Entertainment Private Ltd. (TEPL) to Timezone West Asia Pte. Ltd., at a consideration of ` 2,270.40 lacs on 15 February 2018. With the disposal of this shareholding, the joint venture agreement executed in this regard, stands terminated and accordingly, TEPL ceases to be an associate Company of the Company. Accordingly, the Company has recorded a net loss of ` 174.21 lacs in the current financial year which has been disclosed as an exceptional item.

ST
RA
TE
GIC
RE
PO
RT
ST
AT
UT
OR
Y R
EP
OR
TS
FIN
AN
CIA
L S
TA
TE
ME
NT
S
131
NOTES to the financial statements for the year ended 31 March 2018
32. Segment Reporting
The Company is primarily engaged in the business of retail trade through retail and departmental store facilities, which in the terms of Ind AS 108 on ‘Operating Segments’, constitutes a single reporting segment.
i) The Company operates in a single geographical environment i.e. in india.
ii) No single customer contributed 10% or more to Company’s revenue.
33. Dividends
The Board of Directos has recommended dividend of ` 0.75 per share of ` 5 each for the financial year 2017-18. The payment is subject to the approval of members at the annual general meeting.
34. Derivatives/Forward Foreign Exchange Contracts
a) The Company uses foreign currency forward contracts to hedge its risks associated with foreign currency exposures relating to the underlying transactions and firm commitments. The Company does not enter into any derivative instruments for trading and speculative purposes.
It is the policy of the Company to enter into forward foreign exchange contracts to cover specific foreign currency payments and receipts. The Company also enters into forward foreign exchange contracts to manage the risk associated with anticipated sales and purchase transactions out of 6 months within 40% to 50% of the exposure generated.
Adjustments are made to the initial carrying amounts of non-financial hedged items when the anticipated sale or purchase transaction takes place.
The following are the outstanding Forward Exchange Contracts entered into by the Company as at 31 March 2018.
Particulars 31 March 2018 31 March 2017Number of Contracts 1 1 1 1 1 2Type Buy Buy Buy Buy Buy Buy Foreign currency (in lacs) 0.27 EURO 0.06 GBP 1.86 USD 0.04 AED 0.37 GBP 2.59 USDINR Equivalent (in lacs) 22.20 5.77 121.43 0.64 29.81 168.71
b) Unhedged Foreign Currency exposure
There are no foreign currency exposures that have not been hedged by a derivative instrument or otherwise at the end of the year.
35. Share-Based Payments
The expense recognised for employee services received during the year is shown in the following table:
Year ended 31 March 2018
Year ended 31 March 2017
Expense arising on Employee Stock Option Scheme 10.63 65.22 Total expense arising from share-based payment transactions 10.63 65.22
35.1 Employee share option plan of the Company The Company has a share option scheme for certain employees of the Company and its subsidiaries. In accordance
with the terms of the share option scheme, as approved by shareholders at a previous general meeting, employees with a pre-defined grade and having more than five years of service may be granted options to purchase equity shares. Each share option converts into one equity share of the Company on exercise. No amounts are paid or payable by the recipient on receipt of the option. The options carry neither rights to dividends nor voting rights. Options may be exercised with in four years from the date of grant, as per vesting schedule.The share options vests based on a pre-determined vesting schedule from the date of grant.
The fair value of the share options is estimated at the grant date using a binomial option pricing model, taking into account the terms and conditions upon which the share options are granted. However, the above performance condition is only considered in determining the number of instruments that will ultimately vest.
The Contractual term of each option granted is three years. There are no cash settlement alternatives. The Company does not have a past practice of cash settlement for these share options.

Annual Report 2017-2018132
NOTES to the financial statements for the year ended 31 March 2018
The following share-based payment arrangements were in existence during the current and prior years:
Options series Number Grant date Expiry date Exercise Price (`)Fair value at
grant date (`)
Granted on 9 June 2012 200,000 09.06.2,012 09.06.2,015 297.00 115.70Granted on 28 August 2013 200,000 28.08.2,013 28.08.2,016 344.00 124.00Granted on 29 April 2014 160,675 29.04.2,014 29.04.2,017 362.00 123.21Granted on 31 July 2015 3,275 31.07.2,015 31.07.2,018 404.00 124.35
All options vested based on the pre determined vesting schedule (i.e. three years) from the date of grant and expire after 12 months from the last date of vesting schedule, six months from the date of retirement or twelve months after the resignation of the employee, whichever is the earlier.
35.2 Fair value of share options granted in the year There are no new grants during the F.Y. 2017-18.
35.3 Movements in share options during the year
Number of Employee Stock Option Outstanding:
Number of Options
Weighted average exercise
price
Number of Options
Weighted average exercise
price31 March 2018 31 March 2017
Outstanding at the beginning of the year 211,124 353.61 340,975 339.62Granted during the year - - - -Lapsed/Cancelled during the year 101,185 - 98,298 -Exercised during the year 60,020 345.99 31,553 299.35Surrendered during the year - - - -Outstanding at the end of the year 49,919 363.07 211,124 353.61
Of the above outstanding share options, 49,919 (2017: 1,69,757) shares are exercisable at the end of the respective reporting periods.
Details of year wise grant and exercise:
Year / (date of Grant)
Options granted
Exercised till
Exercised in Exercised till Outstanding Exercised inOutstanding
(net of lapsed)
31.03.2016 2016-17 31.03.2017 31.03.2017 2017-18 31.03.2018
2009-10 (29.04.2009) 958,740 958,740 - 958,740 - - -2009-10 (24.03.2010) 358,200 358,200 - 358,200 - - -2011-12 (29.04.2011) 124,100 124,100 - 124,100 - - -2012-13 (09.06.2012) 101,807 71,829 29,978 101,807 - - -2013-14 (28.08.2013) 42,512 27,054 1,575 28,629 106,042 13,883 -2014-15 (29.04.2014) 104,586 10,494 - 10,494 101,807 44,173 49,9192015-16 (31.07.2015) 1,964 - - - 3,275 1,964 -
31,553 1,581,970 211,124 60,020 49,919
35.4 Share options exercise during the year
The following share options were exercised during the year
Options series Number Exercised Exercise dateWeighted Average
Share price at exercise date (`)
Granted on 28 August 2013 13,883 17.09.2017 344Granted on 29 April 2014 3,938 17.09.2017 362
4,887 26.10.2017 36220,159 30.11.2017 362
5,571 31.01.2018 3629,618 19.03.2018 362
Granted on 31 July 2015 1,964 31.01.2018 404
35.5 The weighted average contractual life of the options outstanding is 3.08 years.

ST
RA
TE
GIC
RE
PO
RT
ST
AT
UT
OR
Y R
EP
OR
TS
FIN
AN
CIA
L S
TA
TE
ME
NT
S
133
NOTES to the financial statements for the year ended 31 March 2018
36. Employee Benefits
36.1 Defined contribution plans The Company operates defined contribution plan (Provident fund) for all qualifying employees of the Company.
The employees of the Company are members of a retirement contribution plan operated by the government. The Company is required to contribute a specified percentage of payroll cost to the retirement contribution scheme to fund the benefits. The only obligation of the Company with respect to the plan is to make the specified contributions.
The Company’s contribution to Provident Fund aggregating ` 1,158.15 Lacs (2017: ` 1,111.81 Lacs) has been recognised in the Statement of Profit and Loss under the head Employee Benefits Expense. Information about the contributions to defined contribution plans for key managerial personnel is disclosed in note 38.
36.2 Defined benefit plan The Company sponsors funded defined benefit (Gratuity) plan for qualifying employees, covered under the
Payment of Gratuity Act, 1972. The defined benefit plan is administered by a third-party insurer (Life Insurance Corporation of India). This third-party insurer is responsible for the investment policy with regard to the assets of the plan.
Under the plan, the employees are entitled to a lump-sum amounting to 15 days’ final basic salary for each year of completed service payable at the time of retirement/resignation provided the employee has completed 5 years of continuous service.
a) The principal actuarial risks to which the Company is exposed are investment risk, interest rate risk, salary risk and longevity risk.
Investment risk The probability or likelihood of occurrence of losses relative to the expected return on any particular investment.
Interest risk The plan exposes the Company to the risk of fall in interest rates. A fall in interest rates will result in an increase in the ultimate cost of providing the above benefit and will thus result in an increase in the value of the liability.
Longevity risk The Company has used certain mortality and attrition assumptions in the valuation of the liability. The Company is exposed to the risk of actual experience turning out to be worse compared to the assumption.
Salary Risk The present value of the defined benefit plan is calculated with the assumption of salary increase rate of plan participants in future. Deviation in the rate of increase of salary in future for plan participants from the rate of increase in salary used to determine the present value of obligation will have a bearing on the plan's liability.
b) The principal assumptions used for the purposes of the actuarial valuations were as follows:
ParticularsAs at
31 March 2018 As at
31 March 2017Discount rate 7.40% p.a. 7.15% p.a. Expected rate of salary increase 4.00% p.a. 4.00% p.a. Average Longevity at retirement age for current beneficiaries of the plan (years)
Indian Assured Lives Mortality 2006-08
Rate of employee turnoverUpto 5 Year 34.00% p.a. 11.00% p.a. Above 5 Year 11.00% p.a. 11.00% p.a.

Annual Report 2017-2018134
NOTES to the financial statements for the year ended 31 March 2018
c) Amount recognised in statement of profit and loss in respect of these defined benefit plan.
ParticularsFor the year
ended 31 March 2018
For the year ended
31 March 2017Current service cost 252.28 221.26 Net interest cost 14.35 11.91 Components of defined benefits costs recognised in profit or loss. 266.63 233.17 Remeasurements on the net defined benefit liability:- Return on plan assets, excluding amount included in interest expense/
(income) (16.14) (14.63)
- Actuarial (gain) / loss from change in demographic assumptions (107.12) - - Actuarial (gain) / loss from change in financial assumptions (22.44) 44.46 - Actuarial (gain) / loss from change in experience adjustments 20.79 (69.96)Total amount recognised in other comprehensive income (124.91) (40.13)Total 141.72 193.04
d) The amount included in the balance sheet arising from Company’s obligation in respect of its defined benefit plan is as follows:
Particulars As at
31 March, 2018 As at
31 March, 2017 Present value of funded defined benefit obligation 1,343.48 1,341.11 Fair value of plan assets 1,150.26 1,140.29 Net asset arising from defined benefit obligation 193.22 200.82
e) Movement in the present value of the defined benefit obligation are as follows:
ParticularsFor the year
ended 31 March 2018
For the year ended
31 March 2017Present value of obligations as at beginning of the year 1,341.10 1,208.01 Current service cost 252.28 221.26 Interest cost 95.82 92.95 Remeasurements (gains) / losses:- Actuarial (gain) / loss from change in demographic assumptions (107.12) - - Actuarial (gain) / loss from change in financial assumptions (22.44) 44.46 - Actuarial (gain) / loss from change in experience adjustments 20.79 (69.96)Benefits paid (236.95) (155.64)Closing defined benefit obligation 1,343.48 1,341.10
f) Movement in the fair value of the plan assets are as follows.
ParticularsFor the year
ended 31 March 2018
For the year ended
31 March 2017Opening fair value of plan assets 1,140.29 1,053.23 Interest income 81.47 81.04 Remeasurement (gains) / losses:- Return on plan assets, excluding amount included in net interest expense 16.14 14.63 Contributions from the employer 149.31 147.03 Benefits paid / transferred (236.95) (155.64)Closing fair value of plan assets 1,150.26 1,140.29

ST
RA
TE
GIC
RE
PO
RT
ST
AT
UT
OR
Y R
EP
OR
TS
FIN
AN
CIA
L S
TA
TE
ME
NT
S
135
NOTES to the financial statements for the year ended 31 March 2018
g) Significant actuarial assumptions for the determination of the defined benefit obligation are discount rate, expected salary increase, attrition rate and mortality. The sensitivity analysis below have been determined based on reasonable possible changes of the assumptions occurring at the end of the reporting period, while holding all other assumptions constant. The results of sensitivity analysis is as follows:
Particulars 31 March 2018 31 March 2017Defined benefit obligation (base) 1,343.48 1,341.11
Particulars 31 March 2018 31 March 2017Decrease Increase Decrease Increase
Discount rate (- / +1%) 1,425.08 1,270.61 1,429.68 1,262.23 % change compared to base due to sensitivity
6.10% -5.40% 6.60% -5.90%
Salary growth rate (- / +1%) 1,267.67 1,427.05 1,259.23 1,431.61 % change compared to base due to sensitivity
-5.60% 6.20% -6.10% -6.70%
Attrition rate (- / +50%) 1,277.24 1,355.65 1,244.52 1,379.02 % change compared to base due to sensitivity
-4.90% 0.90% -7.20% -2.80%
Mortality rate (- / +10%) 1,343.02 1,343.93 1,340.69 1,341.53 % change compared to base due to sensitivity
0.00% 0.00% 0.00% 0.00%
The sensitivity analysis presented above may not be representative of the actual change in the defined benefit obligation as it is unlikely that the change in assumptions would occur in isolation of one another as some of the assumptions may be correlated.
Furthermore, in presenting the above sensitivity analysis, the present value of the defined benefit obligation has been calculated using the projected unit credit method at the end of the reporting period, which is the same as that applied in calculating the defined benefit obligation asset recognised in the balance sheet.
There in no change in the method of valuation for the prior periods in preparing the sensitivity analysis. For change in assumptions refer to note 36.2b above.
h) Asset liability matching strategies:
The Company has purchased insurance policy, which is basically a year-on-year cash accumulation plan in which the interest rate is declared on yearly basis and is guaranteed for a period of one year. The insurance Company, as part of the policy rules, makes payment of all gratuity outgoes happening during the year (subject to sufficiency of funds under the policy). The policy, thus, mitigates the liquidity risk. However, being a cash accumulation plan, the duration of assets is shorter compared to the duration of liabilities. Thus, the Company is exposed to movement in interest rate (in particular, the significant fall in interest rates, which should result in a increase in liability without corresponding increase in the asset).”
i) Effect of plan on entity’s future cash flows.
a) Every year, the insurance Company carries out a funding valuation based on the latest employee data provided by the Company. Any deficit in the assets arising as a result of such valuation is funded by the Company.
b) The Company expects to contribute ` 380.03 lacs to its gratuity plan for the next year.
c) Weighted average duration of the defined benefit obligation is 6 years (based on discounted cashflows).
Expected cash flows over the next (valued on undiscounted basis): ` In lacs1 year 295.41 2 to 5 years 632.02 6 to 10 years 545.64 More than 10 years 814.29

Annual Report 2017-2018136
NOTES to the financial statements for the year ended 31 March 2018
37. Subsidiaries and Joint Ventures.
37.1 Details of the Company’s subsidiaries at the end of the reporting period are as follows:
Sr. No.
Name of subsidiary Principal activityPlace of incorporate
and operation
Proportion of ownership interest and voting rights held
As at 31 March 2018
As at 31 March 2017
1 Hypercity Retail (India) Limited (Refer Note 31)
Retailing a variety of household and consumer products (including food, groceries, fashion and other general merchandise) through departmental stores
India - 51.04%
2 Crossword Bookstores Limited
Retailing in books and other allied items through departmental stores operated by self or by franchisees
India 100% 100%
3 Shoppers’ Stop Services (India) Limited
Services India 100% 100%
4 Upasna Trading Limited Supervising distribution and logistics operations
India 100% 100%
5 Shoppers’ Stop.com (India) Limited
Services India 100% 100%
6 Gateway Multichannel Retail (India) Limited
Catalogue retailing India 100% 100%
37.2 The Company has given corporate guarantee to banks for loans taken by subsidiaries – Refer Note 29 (ii) (b).
37.3 Interest In Joint Ventures: The Company’s interests, as a venturer, in a jointly controlled entities are as follows:
Name Principal activityPlace of incorporate
and operation
Proportion of ownership interest and voting rights held
As at 31 March 2018
As at 31 March 2017
Nuance Group (India) Private Limited (Refer Note 31)
Airport retailing India - 50.00%
Timezone Entertainment Private Limited (Refer Note 31)
Entertainment India - 48.42%

ST
RA
TE
GIC
RE
PO
RT
ST
AT
UT
OR
Y R
EP
OR
TS
FIN
AN
CIA
L S
TA
TE
ME
NT
S
137
NOTES to the financial statements for the year ended 31 March 2018
38. Related Party Disclosures
Names of related parties and description of relationship:
(a) Subsidiaries Hypercity Retail (India) Limited (upto 30 November 2017)Crossword Bookstores LimitedGateway Multi Channel Retail (India) Limited.Upasna Trading Limited.Shoppers Stop Services (India) Limited.Shoppers Stop.com (India) Limited.
(b) Key Management Personnel Executive Director: Govind ShrikhandeNon Executive Directors: Chandru L. Raheja
Ravi RahejaNeel RahejaB.S. NageshNitin SanghaviDeepak GhaisasNirvik SinghAbanti SankaranarayananGareth Thomas (upto 26 October 2017)Manish Chokhani
Chief Executive Officer Rajiv Suri (w.e.f 09 January 2018)Chief Financial Officer Sanjay Chakravarti (upto 22 December 2017)Company Secretary Bharat Sanghavi
(c) Promoter directors C.L. Raheja, Ravi C. Raheja, Neel C. Raheja
(d) Entities in which director is director Ivory Properties and Hotels Private Limited*, K. Raheja Corp. Private Limited*K. Raheja Private Limited*, Inorbit Malls (India) Private Limited*,Avacado Properties and Trading India Private Limited*, Chalet Hotels Private Limited*Trion Properties Private Limited*, Magna Warehousing & Distribution Private Limited*, Retailers Association of India
(e) Entities in which other directors are directors / trustees
Sanghavi Associates Ltd., Trrain Foundation; Trust for Retailers & Retail Association of India
(f) Joint Ventures Nuance Group (India) Private Limited (upto 06 October 2017)Timezone Entertainment Private Limited. (upto 15 February 2018)
Following are the transactions with related parties
Nature Subsidiaries
Entities in which the directors
are directors/trustees (refer d
and e above)
Joint VenturesKey
Management Personnel
Total
Trading transactionsPurchase of Merchandise 14.75 - - - 14.75 Crossword Bookstores Limited 3.11 - - - - Hypercity Retail (India) Limited 11.64 - - - -
(29.26) - - - (29.26)Loan to related partiesLoan Given 11,900.00 - - - 11,900.00 Hypercity Retail (India) Limited 11,900.00 - - - -
(6,719.00) - - - (6,719.00)

Annual Report 2017-2018138
NOTES to the financial statements for the year ended 31 March 2018
Nature Subsidiaries
Entities in which the directors
are directors/trustees (refer d
and e above)
Joint VenturesKey
Management Personnel
Total
Recovery of Loan 21,319.00 - - - 21,319.00 Hypercity Retail (India) Limited 21,319.00 - - - - Gateway Multi Channel Retail (India) Limited
- - - - -
(11,800.00) - - - (11,800.00)Compensation to key management personnel Remuneration to managing director
- - - 499.16 499.16
Short-term benefits - - - 480.71 480.71Post employment benefits - - - 18.45 18.45Share based payments - - -
- - - (453.92) (453.92)Remuneration to Company Secretary
43.63 43.63
Short term benefits - - - 42.31 Post employment benefits - - - 0.46 Share based payments - - - 0.86
(68.23) (68.23)Remuneration to Chief Executive Officer
100.22 100.22
Short term benefits - - - 100.22 Post employment benefits - - - - Share based payments - - - -
(267.43) (267.43)Remuneration to Chief Financial Officer
100.65 100.65
Short term benefits - - - 100.65 Post employment benefits - - - - Share based payments - - - -
- - - (104.72) (104.72)Other related party transactionsPurchase of Assets 10.39 - - - 10.39 Hypercity Retail (India) Limited 0.90 - - - - Crossword Bookstores Ltd 9.49 - - -
- - - - - Payment of conducting fees/ Lease Rent/ Common Area Maintenance Charges
74.14 6,318.50 - - 6,392.64
Ivory Properties and Hotels Private Limited*
- 1,716.44 - - -
Inorbit Malls (India) Private Limited*
- 3,098.49 - - -
Hypercity Retail (India) Limited 74.14 - - - - Chalet Hotels Private Limited* 143.79 Genext Hardware and Parks Private Limited*
172.55
Trion Properties Private Limited*
- 975.83 - - -
(83.64) (6,331.68) (6,415.32)

ST
RA
TE
GIC
RE
PO
RT
ST
AT
UT
OR
Y R
EP
OR
TS
FIN
AN
CIA
L S
TA
TE
ME
NT
S
139
NOTES to the financial statements for the year ended 31 March 2018
Nature Subsidiaries
Entities in which the directors
are directors/trustees (refer d
and e above)
Joint VenturesKey
Management Personnel
Total
Expenses Paid - 95.14 - 0.95 96.09 B. S. Nagesh - - - 0.95 K. Raheja Corp. Pvt. Ltd.* - 1.63 - - Juhu Beach Resorts Limited* - 0.10 - - JW Marriott Sahar Mumbai unit of Chalet Hotels Pvt. Ltd.*
- 5.14 - -
Retailers Association of India - 5.51 - - Sanghavi Associates Ltd. - 10.06 - - Trrain Circle Pvt. Ltd. 0.77 - - CSR – Trust for Retailers & Retail Association of India
- 64.00 - -
Inorbit Malls (India) Private Limited*
- 7.94 - -
(21.84) (83.75) (1.25) (106.84)Share based payment costs - Hypercity Retail (India) Limited - - - - Crossword Bookstores Limited - - - -
(19.40) - - - (19.40)SOH Expenses Paid - - - - - Hypercity Retail (India) Limited - - - -
(40.30) (40.30)Interest Received 719.60 - - - 719.60 Crossword Bookstores Limited 88.12 Hypercity Retail (India) Limited 631.48 - - - -
(1,998.93) - - - (1,998.93)Deposits Paid - 71.03 - - 71.03 Inorbit Malls (India) Private Limited*
- 49.64
Trion Properties Private Limited*
- 0.88 - - -
Genext Hardware and Parks Private Limited*
20.52
- (50.70) - - (50.70)Reimbursement of Expenses paid
38.72 683.13 - - 721.86
Inorbit Malls (India) Private Limited*
- 527.38 - - -
Crossword Bookstores Limited 21.36 - - - Hypercity Retail (India) Limited 17.37 - - - - Trion Properties Private Limited*
- 155.75 - - -
(66.72) (94.19) - - (160.91)Expenses recovered 334.86 - - - 334.86Hypercity Retail (India) Limited 6.34 - - - - Crossword Bookstores Limited 328.62
(521.83) - - - (521.83)Investments made - - - - - Hypercity Retail (India) Limited - Preference Shares
- - - - -
Timezone Entertainment Pvt.Ltd.
- - - - -
(5,023.28) - - - (5,023.28)

Annual Report 2017-2018140
NOTES to the financial statements for the year ended 31 March 2018
Nature Subsidiaries
Entities in which the directors
are directors/trustees (refer d
and e above)
Joint VenturesKey
Management Personnel
Total
Deposit received back - 197.18 - - 197.18 Trion Properties Private Limited*
- 197.18
(116.72) - - - (116.72)
Transfer of Loyalty Points 35.44 - - - 35.44 Hypercity Retail (India) Limited 35.44 - - -
- - - - - Receipt of Loyalty points 20.61 - - - 20.61 Hypercity Retail (India) Limited 20.61 - - -
- - - - - Sharing of Group Loyalty Data (Income)
- - - - -
Crossword Bookstores Limited - - - - - Hypercity Retail (India) Limited - - - - -
(8.60) (8.60)Sharing of Group Loyalty Data (Expenses)
- - - - -
Crossword Bookstores Limited - - - - - Hypercity Retail (India) Limited - - - - -
(2.66) - - - (2.66)Commission and Sitting fees to Non-Executive DirectorsChandru L. Raheja 3.50 Ravi Raheja 4.60 Neel Raheja 3.50 B.S. Nagesh 6.50 Nitin Sanghavi 8.10 Deepak Ghaisas 9.70 Nirvik Singh 3.50 Abanti Sankaranarayanan 3.50 Gareth Thomas 1.00 Manish Chokhani 6.70
- - - (48.80) (48.80)

ST
RA
TE
GIC
RE
PO
RT
ST
AT
UT
OR
Y R
EP
OR
TS
FIN
AN
CIA
L S
TA
TE
ME
NT
S
141
NOTES to the financial statements for the year ended 31 March 2018
Balance outstanding at the year endPayable Upasna Trading Limited 109.37
(109.85) Cr. ReceivablesShoppers Stop Services (India) Limited 1.51
(1.48) Dr. Shoppers Stop.Com (India) Limited 2.72
(2.69) Dr. Hypercity Retail (India) Limited 63.58
(9,653.23) Dr. Ivory Properties and Hotels Private Limited* 1,010.52
(963.47) Dr. Inorbit Malls (India) Private Limited* 846.31
(769.99) Dr. Genext Hardware and Parks Private Limited* 179.55
- Dr. Gateway Multi Channel Retail (India) Limited 2,329.10 #
(2,329.10) Dr. # All the amount is provided for in the booksTimezone Entertainment Private Limited -
- Dr. Trion Properties Private Limited* 285.96
(454.16) Dr. Crossword Bookstores Limited 744.74
(1,000.08) Dr.
The Company has given corporate guarantee to banks for loans taken by subsidiaries – Refer Note 29(ii)(b)The figure in bracket pertain to previous year.
* These parties are not related to Shoppers Stop Ltd. per Ind AS 24 definition. These parties have been reported on the basis of their classification as related party under the Companies Act 2013.
Terms and conditions of transactions with related parties The sales to and purchases from related parties are made on terms equivalent to those that prevail in arm’s length transactions. Outstanding balances at the year-end are unsecured and interest free and settlement occurs in cash. There have been no guarantees provided or received for any related party receivables or payables. For the year ended 31 March 2018, the Company has not recorded any impairment of receivables relating to amounts owed by related parties (31 March 2017: ` Nil). This assessment is undertaken each financial year through examining the financial position of the related party and the market in which the related party operates.
39. Financial Instruments
A. Capital risk management The Company’s objectives when managing capital are to safeguard continuity as a going concern, provide
appropriate return to shareholders and maintain a cost efficient capital structure. The Company determines the amount of capital required on the basis of an annual budget and a five year plan, including, for working capital, capital investment in stores, technology, and strategic investment in subsidiary companies. The Company’s funding requirements are met through internal accruals and a combination of both long-term and short-term borrowings. Majorly Company raise long term loan for it’s CAPEX requirement and based on the working capital requirement utilise the working capital loans.

Annual Report 2017-2018142
NOTES to the financial statements for the year ended 31 March 2018
The Company monitors capital on the basis of total debt to total equity on a periodic basis. The following table summarises the capital of the Company:
CapitalAs at
31 March 2018As at
31 March 2017` in lacs ` in lacs
Long term borrowings (including current maturities) 7,976.77 37,294.31Short term borrowings 761.12 20,295.86Total debt 8,737.89 57,590.17Equity share capital 4,398.03 4,175.24Other equity 90,938.59 71,900.37Total equity 95,336.62 76,075.61Debt Equity Ratio 0.09 0.76
The Company’s objective is to keep the debt equity ratio below 1 which it has achieved in both these years.
B. Financial risk management A wide range of risks may affect the Company’s
business and operational / financial performance. The risks that could have significant influence on the Company are market risk, credit risk and liquidity risk. The Company’s Board of Directors reviews the short term and long term budgets and sets out policies for managing these risks and monitors suitable actions taken by management to minimise potential adverse effects of such risks on the Company’s operational and financial performance.
(a) Market risk:
Market Risk is the risk that changes in market place could affect the future cash flows to the Company. The market risk for the Company arises primarily from product price risk, interest rate risk and, to some extent, foreign currency risk.
Product price risk: In a potentially inflationary economy, the Company expects periodical price increases across its retail product lines. Product price increases which are not in line with the levels of customers’ discretionary spends, may affect the business / retail sales volumes. In such a scenario, the risk is managed by offering judicious product discounts to retail customers to sustain volumes. The Company negotiates with its vendors for purchase price rebates such that the rebates substantially absorb the product discounts offered to the retail customers. This helps the Company protect itself from significant product margin losses. This mechanism also works in case of a downturn in the retail sector, although overall volumes would get affected.
Interest risk: The Company is exposed to interest rate risk primarily due to borrowings having floating interest rates. The Company uses available working capital limits for
availing short-term working capital demand loans with interest rates negotiated from time to time so that the Company has an effective mix of fixed and variable rate borrowings. Interest rate sensitivity analysis shows that an increase / decrease of fifty basis points in floating interest rates would result in decrease / increase in the Company’s profit before tax by approximately ` 188 lacs (2017: ` 283 lacs).
Currency risk: The Company’s significant transactions are in Indian Rupees and therefore there is minimal foreign currency risk. Generally, the Company fully covers the foreign currency risk for transactions in foreign currency which are primarily for import of merchandise, by entering into forward cover contracts to hedge foreign currency exposure. Also Refer Note 34 for the forward cover contracts outstanding at the end of the reporting period.
(b) Credit risk:
Credit risk is a risk that the counterparty will default on its contractual obligation resulting in financial loss to the Company. The credit risk for the Company primarily arises from credit exposures to trade receivables (mainly institutional customers), deposits with landlords for store properties taken on leases and other receivables including balances with banks.
Trade and other receivables: The Company’s retail business is predominantly on ‘cash and carry’ basis which is largely through credit card collections. The credit risk on such collections is minimal, since they are primarily owned by customers’ card issuing banks. The Company has adopted a policy of dealing with only credit worthy counterparties in case of institutional customers and the credit risk exposure for institutional

ST
RA
TE
GIC
RE
PO
RT
ST
AT
UT
OR
Y R
EP
OR
TS
FIN
AN
CIA
L S
TA
TE
ME
NT
S
143
NOTES to the financial statements for the year ended 31 March 2018
customers is managed by the Company by credit worthiness checks. The Company also carries credit risk on lease deposits with landlords for store properties taken on leases, for which agreements are signed and property possessions timely taken for store operations. The risk relating to refunds after store shut down is managed through successful negotiations or appropriate legal actions, where necessary.
The Company’s experience of delinquencies and customer disputes have been minimal. Further, Trade and other receivables consist of a large number of customers, across geographies, hence, the Company is not exposed to concentration risks.
(c) Liquidity Risk:
Liquidity risk is a risk that the Company may not be able to meet its financial obligations on a timely basis through its cash and cash equivalents, and funds available by way of committed credit facilities from banks.
Management manages the liquidity risk by monitoring rolling cash flow forecasts and maturity profiles of financial assets and liabilities. This monitoring includes financial ratios and takes into account the accessibility of cash and cash equivalents and additional undrawn financing facilities.
The table below summarises the maturity profile (remaining period of contractual maturity at the balance sheet date) of the Company’s financial liabilities based on contractual undiscounted cash flows.
Less than 1 yearBetween
1 and 5 yearsCarrying amounts
At 31 March 2017 ` in lacs ` in lacs ` in lacsBorrowings (long term and short term) 36,593.49 20,996.68 57,590.17Interest payable 165.88 165.88Trade payables and other accruals 33,019.28 33,019.28At 31 March 2018Borrowings (long term and short term) 4761.12 3976.77 8,737.89Interest payable 0.13 0.13Trade payables and other accruals 48,861.23 48,861.23
In respect of financial guarantee contracts, no amounts are recognised based on the results of the liability adequacy test for likely deficiency / defaults by the entities on whose behalf the Company has given
guarantees, grounded on the Company’s actual experience.
The Company has access to following financing facilities which were undrawn as at the end of reporting periods mentioned.
Undrawn financing facilityAs at As at
31 March 2018 31 March 2017` in lacs ` in lacs
Secured Working Capital FacilitiesAmount Used 464.14 14,688.58Amount Unused 31,735.86 12,511.42Total 32,200.00 27,200.00Unsecured Working Capital FacilitiesAmount Used - 5,802.25Amount Unused 2,500.00 3,697.75Total 2,500.00 9,500.00

Annual Report 2017-2018144
NOTES to the financial statements for the year ended 31 March 2018
C. Fair Value Measurements (i) Financial assets and liabilities that are measured at amortised cost:
As at31 March 2018
As at31 March 2017
` in lacs ` in lacsFinancial Assets (amortised cost):Loans to subsidiary companies 766.26 10,348.59Trade receivables 4,372.44 3,574.66Cash & Cash equivalents 457.63 295.03Other bank balances 65.57 207.67Other financial assets 11,970.64 16,784.61- Premises and other deposits 11,426.59 12,985.47- Others 544.05 3,799.14Financial Liabilities (amortised cost):Borrowings – long term 3,976.77 20,996.68Borrowings – short term 4,761.12 36,593.49Trade payables 48,861.23 33,019.28Other financial liabilities 4,030.99 3429.94
The fair values of the above financial assets and liabilities approximate their carrying amounts.
(ii) Financial assets and liabilities that are measured at fair value on a recurring basis as at the end of each reporting period:
Financial assets /Financial liabilities
Fair value as at Fair value hierarchy31 March 2018 31 March 2017
Fair Value through Profit and LossForward foreign currency contractsInvestment in Mutual FundsFair Value through OCIInvestment in Future Retail Limited
Assets ` 0.39 lacsAssets ` 2,003.55 lacs
Assets ` 26,241.01lacs
Liabilities ` 0.26 lacsNil
Nil
Level 2Level 1
Level 1
Valuation technique and key input used: Fair value is determined using discounted future cash flows which are estimated based on forward exchange rates at the end of the reporting period, discounted at a rate that reflects the credit risk of the Company.
The fair values of the quoted instruments (Investment in Mutual funds and Future Retail Limited) are based on the price quotations at the reporting date.
40. STANDARDS ISSUED BUT NOT YET EFFECTIVE
IND-AS 115 was notified on 28 March 2018 and is effective for the Company in the first quarter of fiscal 2019. The Company has established an implementation team to implement IND-AS 115 related to the recognition of revenue from contracts with customers and it continues to evaluate the changes to accounting system and processes and additional disclosure requirements that may be necessary. A reliable estimates of the quantitative impact of IND-AS 115 on the financial statements will only be possible once the implementation project has been completed.
41. The previous year figures have been audited by an audit firm other than S R B C & Co LLP. The previous year’s figures have been regrouped / reclassified wherever necessary.
In terms of our report of even date For and on Behalf of the Board of Directors
For S R B C & CO LLP C.L. Raheja Ravi Raheja Govind S. ShrikhandeICAI Firm Reg. No. 324982E / E300003 Chairman Director Customer Care Associate &Chartered Accountants DIN: 00027979 DIN: 00028044 Managing Director
DIN: 00029419
Vijay Maniar Vijay Jain Bharat SanghaviPartner Customer Care Associate & Customer Care Associate &Membership No. 36738 Dy. Chief Financial Officer Company Secretary
Mumbai: 27 April 2018 Mumbai: 27 April 2018
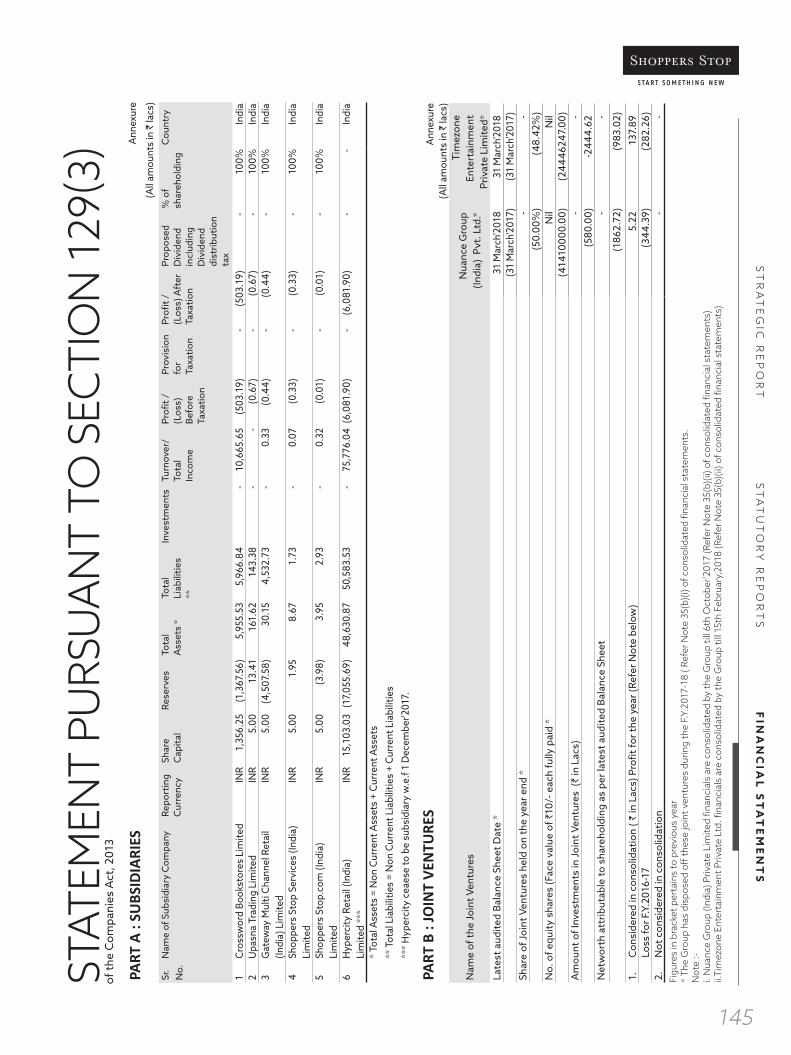
ST
RA
TE
GIC
RE
PO
RT
ST
AT
UT
OR
Y R
EP
OR
TS
FIN
AN
CIA
L S
TA
TE
ME
NT
S
145
STAT
EMEN
T PU
RSU
AN
T TO
SEC
TIO
N 1
29(3
) of
the
Com
pani
es A
ct, 2
013
PART
A :
SUBS
IDIA
RIES
Ann
exur
e
(All
amou
nts
in `
lacs
)Sr
. N
o.N
ame
of S
ubsi
diar
y C
ompa
nyRe
port
ing
Cur
renc
ySh
are
Cap
ital
Rese
rves
Tota
l A
sset
s *
Tota
l Li
abili
ties
**
Inve
stm
ents
Turn
over
/To
tal
Inco
me
Profi
t /
(Los
s)
Befo
re
Taxa
tion
Prov
isio
n fo
r Ta
xatio
n
Profi
t /
(Los
s) A
fter
Ta
xatio
n
Prop
osed
D
ivid
end
incl
udin
g D
ivid
end
dist
ribut
ion
tax
% o
f sh
areh
oldi
ngC
ount
ry
1C
ross
wor
d Bo
okst
ores
Lim
ited
INR
1,3
56.2
5 (1
,367
.56)
5,9
55.5
3 5
,966
.84
- 1
0,66
5.65
(503
.19)
- (5
03.1
9) -
100%
Indi
a2
Upa
sna
Trad
ing
Lim
ited
INR
5.0
0 1
3.41
161
.62
143
.38
- -
(0.6
7) -
(0.6
7) -
100%
Indi
a3
Gat
eway
Mul
ti C
hann
el R
etai
l (In
dia)
Lim
ited
INR
5.0
0 (4
,507
.58)
30.
15 4
,532
.73
-0.
33 (0
.44)
- (0
.44)
-10
0% In
dia
4Sh
oppe
rs S
top
Serv
ices
(Ind
ia)
Lim
ited
INR
5.0
0 1
.95
8.6
7 1
.73
- 0
.07
(0.3
3) -
(0.3
3) -
100%
Indi
a
5Sh
oppe
rs S
top.
com
(Ind
ia)
Lim
ited
INR
5.0
0 (3
.98)
3.9
5 2
.93
- 0
.32
(0.0
1) -
(0.0
1) -
100%
Indi
a
6H
yper
city
Ret
ail (
Indi
a)
Lim
ited
***
INR
15,
103.
03(1
7,05
5.69
) 4
8,63
0.87
50,
583.
53 -
75,
776.
04(6
,081
.90)
- (6
,081
.90)
- -
Indi
a
* To
tal A
sset
s =
Non
Cur
rent
Ass
ets
+ C
urre
nt A
sset
s**
Tot
al L
iabi
litie
s =
Non
Cur
rent
Lia
bilit
ies
+ C
urre
nt L
iabi
litie
s**
* H
yper
city
cea
ese
to b
e su
bsid
iary
w.e
.f 1
Dec
embe
r'201
7.
PART
B :
JOIN
T VE
NTU
RES
A
nnex
ure
(All
amou
nts
in `
lacs
)
Nam
e of
the
Join
t Ven
ture
sN
uanc
e G
roup
(In
dia)
Pvt
. Ltd
.*
Tim
ezon
e En
tert
ainm
ent
Priv
ate
Lim
ited*
Late
st a
udite
d Ba
lanc
e Sh
eet D
ate
*31
Mar
ch'2
018
31 M
arch
'201
8(3
1 M
arch
'201
7)(3
1 M
arch
'201
7)Sh
are
of Jo
int V
entu
res
held
on
the
year
end
* -
-
(5
0.00
%)
(48.
42%
)N
o. o
f equ
ity s
hare
s (F
ace
valu
e of
`10
/- e
ach
fully
pai
d *
Nil
Nil
(414
1000
0.00
)(2
4446
247.
00)
Am
ount
of I
nves
tmen
ts in
Join
t Ven
ture
s (`
in L
acs)
-
-
(580
.00)
-244
4.62
Net
wor
th a
ttrib
utab
le to
sha
reho
ldin
g as
per
late
st a
udite
d Ba
lanc
e Sh
eet
-
-
(186
2.72
)(9
83.0
2)1.
C
onsi
dere
d in
con
solid
atio
n ( `
in L
acs)
Pro
fit fo
r the
yea
r (Re
fer N
ote
belo
w)
5.2
2 1
37.8
9
Lo
ss fo
r F.Y
.201
6-17
(344
.39)
(282
.26)
2.
Not
con
side
red
in c
onso
lidat
ion
-
-
Figu
res
in b
rack
et p
erta
ins
to p
revi
ous
year
* Th
e G
roup
has
dis
pose
d of
f the
se jo
int v
entu
res
durin
g th
e F.
Y.20
17-1
8 ( R
efer
Not
e 35
(b)(
i) of
con
solid
ated
fina
ncia
l sta
tem
ents
.N
ote
:-i.
Nua
nce
Gro
up (I
ndia
) Priv
ate
Lim
ited
finan
cial
s ar
e co
nsol
idat
ed b
y th
e G
roup
till
6th
Oct
ober
’201
7 (R
efer
Not
e 35
(b)(
ii) o
f con
solid
ated
fina
ncia
l sta
tem
ents
)ii.
Tim
ezon
e En
tert
ainm
ent P
rivat
e Lt
d. fi
nanc
ials
are
con
solid
ated
by
the
Gro
up ti
ll 15
th F
ebru
ary,
2018
(Ref
er N
ote
35(b
)(ii)
of c
onso
lidat
ed fi
nanc
ial s
tate
men
ts)

Annual Report 2017-2018146
INDEPENDENT AUDITOR’S REPORTTO THE MEMBERS OF SHOPPERS STOP LIMITED
Report on the Consolidated Financial Statements
We have audited the accompanying consolidated financial statements of Shoppers Stop Limited (hereinafter referred to as ‘the Holding Company’), its subsidiaries (the Holding Company and its subsidiaries together referred to as ‘the Group’) and its jointly controlled entities, comprising of the consolidated Balance Sheet as at 31 March 2018, the consolidated Statement of Profit and Loss and consolidated Cash Flow Statement for the year then ended, and a summary of significant accounting policies and other explanatory information (hereinafter referred to as ‘the consolidated financial statements’).
Management’s Responsibility for the Consolidated Financial Statements
The Holding Company’s Board of Directors is responsible for the preparation of these consolidated financial statements in terms of the requirement of the Companies Act, 2013 (‘the Act’) that give a true and fair view of the consolidated financial position, consolidated financial performance and consolidated cash flows of the Group and jointly controlled entities in accordance with accounting principles generally accepted in India, including the Companies (Accounting Standards) Rules, 2006 (as amended) specified under Section 133 of the Act, read with the Companies (Accounts) Rules, 2014. The respective Board of Directors of the companies included in the Group and its jointly controlled entities are responsible for maintenance of adequate accounting records in accordance with the provisions of the Act for safeguarding of the assets of the Group and its jointly controlled entities and for preventing and detecting frauds and other irregularities; the selection and application of appropriate accounting policies; making judgements and estimates that are reasonable and prudent; and the design, implementation and maintenance of adequate internal financial controls, that were operating effectively for ensuring the accuracy and completeness of the accounting records, relevant to the preparation and presentation of the financial statements that give a true and fair view and are free from material misstatement, whether due to fraud or error, which have been used for the purpose of preparation of the consolidated financial statements by the Directors of the Holding Company, as aforesaid.
Auditor’s Responsibility
Our responsibility is to express an opinion on these consolidated financial statements based on our audit. While conducting the audit, we have taken into account
the provisions of the Act, the accounting and auditing standards and matters which are required to be included in the audit report under the provisions of the Act and the Rules made thereunder. We conducted our audit in accordance with the Standards on Auditing, issued by the Institute of Chartered Accountants of India, as specified under Section 143(10) of the Act. Those Standards require that we comply with ethical requirements and plan and perform the audit to obtain reasonable assurance about whether the financial statements are free from material misstatement.
An audit involves performing procedures to obtain audit evidence about the amounts and disclosures in the consolidated financial statements. The procedures selected depend on the auditor’s judgement, including the assessment of the risks of material misstatement of the consolidated financial statements, whether due to fraud or error. In making those risk assessments, the auditor considers internal financial control relevant to the Holding Company’s preparation of the consolidated financial statements that give a true and fair view in order to design audit procedures that are appropriate in the circumstances. An audit also includes evaluating the appropriateness of accounting policies used and the reasonableness of the accounting estimates made by the Holding Company’s Board of Directors, as well as evaluating the overall presentation of the consolidated financial statements. We believe that the audit evidence obtained by us and the audit evidence obtained by the other auditors in terms of their reports referred to in paragraph (a) of the Other Matters paragraph below, is sufficient and appropriate to provide a basis for our audit opinion on the consolidated financial statements.
Opinion
In our opinion and to the best of our information and according to the explanations given to us, the aforesaid consolidated financial statements give the information required by the Act in the manner so required and give a true and fair view in conformity with the accounting principles generally accepted in India of the consolidated state of affairs of the Group as at 31 March 2018, their consolidated profit, and their consolidated cash flows for the year ended on that date.
Emphasis of Matter
We draw attention to Note 29 to the consolidated financial statements regarding non provision of retrospective levy of service tax for the period from 01 June 2007 to 31 March 2010 on renting of immovable properties given for commercial use, aggregating to ` 2010.90 lacs, pending final disposal of the appeal filed before the Supreme Court.

ST
RA
TE
GIC
RE
PO
RT
ST
AT
UT
OR
Y R
EP
OR
TS
FIN
AN
CIA
L S
TA
TE
ME
NT
S
147
(d) In our opinion, the aforesaid consolidated financial statements comply with the Companies (Accounting Standards) Rules, 2006 (as amended) specified under Section 133 of the Act, read with the Companies (Accounts) Rules, 2014;
(e) On the basis of the written representations received from the directors of the Holding Company as on 31 March 2018 taken on record by the Board of Directors of the Holding Company and the reports of the statutory auditors who are appointed under Section 139 of the Act, of its subsidiary companies incorporated in India, none of the directors of the Group’s companies incorporated in India is disqualified as on 31 March 2018 from being appointed as a director in terms of Section 164 (2) of the Act.
With respect to the adequacy and the operating effectiveness of the internal financial controls over financial reporting with reference to these consolidated financial statements of the Holding Company and its subsidiary companies incorporated in India, refer to our separate report in ‘Annexure 1’ to this report;
(f) With respect to the other matters to be included in the Auditor’s Report in accordance with Rule 11 of the Companies (Audit and Auditors) Rules, 2014, in our opinion and to the best of our information and according to the explanations given to us:
i. The consolidated financial statements disclose the impact of pending litigations on its consolidated financial position of the Group entities – Refer Note 28 to the consolidated financial statements;
ii. The Group did not have any material foreseeable losses in long term contracts including derivative contracts during the year ended 31 March 2018.
iii. There has been no delay in transferring amounts, required to be transferred, to the Investor Education and Protection Fund by the Holding Company, its subsidiaries incorporated in India.
For S R B C & CO LLPChartered AccountantsICAI Firm Registration Number: 324982E/E300003
Vijay ManiarPartnerMembership Number: 36738Place of Signature: MumbaiDate: 27 April 2018
Our opinion is not qualified in respect of this matter.
Other Matter
(a) The consolidated financial statements of the Company for the year ended 31 March 2017, included in these consolidated financial statements, have been audited by the predecessor auditor who expressed an unmodified opinion on those statements on 5 May 2017.
(b) The consolidated financial statements include the Company’s share of net profit of `143.12 for the year ended 31 March 2018, as considered in the consolidated financial statements, in respect of 2 Jointly controlled entities whose financial statements, other financial information have not been audited and whose unaudited financial statements, other unaudited financial information have been furnished to us by the Management. Our opinion, in so far as it relates amounts and disclosures included in respect of these jointly controlled entities, and our report in terms of sub-sections (3) of Section 143 of the Act in so far as it relates to the aforesaid jointly controlled entities, is based solely on such unaudited financial statement and other unaudited financial information. In our opinion and according to the information and explanations given to us by the Management, these financial statements and other financial information are not material to the Group.
Our above opinion on the consolidated financial statements, and our report on Other Legal and Regulatory Requirements below, is not modified in respect of the above matters with respect to our reliance on the financial statements and other financial information certified by the Management.
Report on Other Legal and Regulatory Requirements
As required by Section 143 (3) of the Act, based on our audit and Other matters paragraph above we report, to the extent applicable, that:
(a) We have sought and obtained all the information and explanations which to the best of our knowledge and belief were necessary for the purpose of our audit of the aforesaid consolidated financial statements;
(b) In our opinion proper books of account as required by law relating to preparation of the aforesaid consolidation of the financial statements have been kept so far as it appears from our examination of those books and reports of the other auditors;
(c) The consolidated Balance Sheet, consolidated Statement of Profit and Loss, and consolidated Cash Flow Statement dealt with by this Report are in agreement with the books of account;

Annual Report 2017-2018148
Report on the Internal Financial Controls under Clause (i) of sub-section 3 of Section 143 of the Companies Act, 2013 (‘the Act’)
In conjunction with our audit of the consolidated financial statements of Shoppers Stop Limited as of and for the year ended 31 March 2018, we have audited the internal financial controls over financial reporting of Shoppers Stop Limited (hereinafter referred to as the ‘Holding Company’) and its subsidiary companies, which are companies incorporated in India, as of that date.
Management’s Responsibility for Internal Financial Controls
The respective Board of Directors of the Holding Company, its subsidiary companies, which are companies incorporated in India, are responsible for establishing and maintaining internal financial controls based on the internal control over financial reporting criteria established by the Holding Company considering the essential components of internal control stated in the Guidance Note on Audit of Internal Financial Controls Over Financial Reporting issued by the Institute of Chartered Accountants of India. These responsibilities include the design, implementation and maintenance of adequate internal financial controls that were operating effectively for ensuring the orderly and efficient conduct of its business, including adherence to the respective Company’s policies, the safeguarding of its assets, the prevention and detection of frauds and errors, the accuracy and completeness of the accounting records, and the timely preparation of reliable financial information, as required under the Act.
Auditor’s Responsibility
Our responsibility is to express an opinion on the Company’s internal financial controls over financial reporting with reference to these consolidated financial statements based on our audit. We conducted our audit in accordance with the Guidance Note on Audit of Internal Financial Controls Over Financial Reporting (the ‘Guidance Note’) and the Standards on Auditing, both, issued by Institute of Chartered Accountants of India, and deemed to be prescribed under Section 143(10) of the Act, to the extent applicable to an audit of internal financial controls. Those Standards and the Guidance Note require that we comply with ethical requirements and plan and perform the audit to obtain reasonable assurance about whether adequate internal financial controls over financial reporting with reference to these consolidated financial statements was established and maintained and if such controls operated effectively in all material respects.
Our audit involves performing procedures to obtain audit evidence about the adequacy of the internal financial controls over financial reporting with reference to these consolidated financial statements and their operating effectiveness. Our audit of internal financial controls over financial reporting included obtaining an understanding
of internal financial controls over financial reporting with reference to these consolidated financial statements, assessing the risk that a material weakness exists, and testing and evaluating the design and operating effectiveness of internal control based on the assessed risk. The procedures selected depend on the auditor’s judgement, including the assessment of the risks of material misstatement of the financial statements, whether due to fraud or error.
We believe that the audit evidence we have obtained, is sufficient and appropriate to provide a basis for our audit opinion on the internal financial controls over financial reporting with reference to these consolidated financial statements.
Meaning of Internal Financial Controls Over Financial Reporting with Reference to these Consolidated Financial Statements
A Company’s internal financial control over financial reporting with reference to these consolidated financial statements is a process designed to provide reasonable assurance regarding the reliability of financial reporting and the preparation of financial statements for external purposes in accordance with generally accepted accounting principles. A Company’s internal financial control over financial reporting with reference to these consolidated financial statements includes those policies and procedures that (1) pertain to the maintenance of records that, in reasonable detail, accurately and fairly reflect the transactions and dispositions of the assets of the Company; (2) provide reasonable assurance that transactions are recorded as necessary to permit preparation of financial statements in accordance with generally accepted accounting principles, and that receipts and expenditures of the Company are being made only in accordance with authorisations of management and directors of the Company; and (3) provide reasonable assurance regarding prevention or timely detection of unauthorised acquisition, use, or disposition of the Company’s assets that could have a material effect on the financial statements.
Inherent Limitations of Internal Financial Controls Over Financial Reporting with Reference to these Consolidated Financial Statements
Because of the inherent limitations of internal financial controls over financial reporting with reference to these consolidated financial statements, including the possibility of collusion or improper management override of controls, material misstatements due to error or fraud may occur and not be detected. Also, projections of any evaluation of the internal financial controls over financial reporting with reference to these consolidated financial statements to future periods are subject to the risk that the internal financial control over financial reporting with reference to these consolidated financial statements may
ANNEXURE 1 To the Independent Auditor’s Report of even date on the Consolidated Financial Statements of Shoppers Stop Limited

ST
RA
TE
GIC
RE
PO
RT
ST
AT
UT
OR
Y R
EP
OR
TS
FIN
AN
CIA
L S
TA
TE
ME
NT
S
149
become inadequate because of changes in conditions, or that the degree of compliance with the policies or procedures may deteriorate.
Opinion
In our opinion, the Holding Company, its subsidiary companies which are companies incorporated in India, have, maintained in all material respects, adequate internal financial controls over financial reporting with reference to these consolidated financial statements and such internal financial controls over financial reporting with reference to these consolidated financial statements were operating effectively as at 31 March 2018, based on the internal control over financial reporting criteria established by the
Holding Company considering the essential components of internal control stated in the Guidance Note on Audit of Internal Financial Controls Over Financial Reporting issued by the Institute of Chartered Accountants of India.
For S R B C & CO LLPChartered AccountantsICAI Firm Registration Number: 324982E/E300003
Vijay ManiarPartnerMembership Number: 36738Place of Signature: MumbaiDate: 27 April 2018
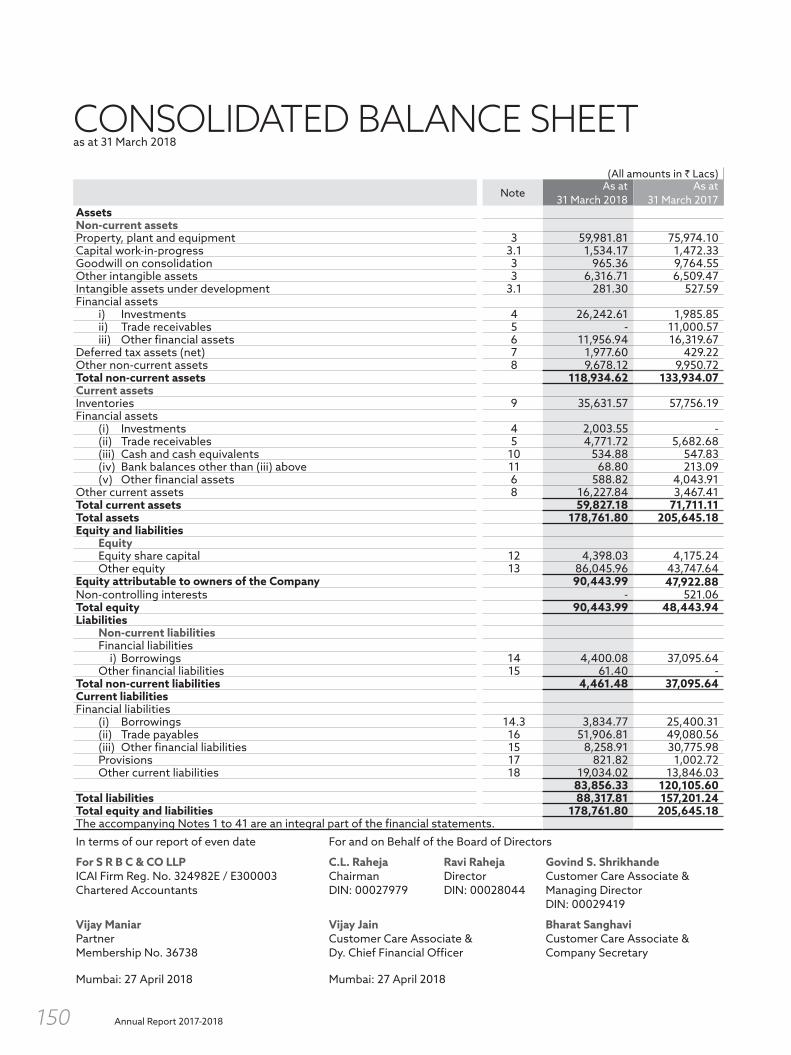
Annual Report 2017-2018150
CONSOLIDATED BALANCE SHEETas at 31 March 2018
(All amounts in ` Lacs)
NoteAs at
31 March 2018 As at
31 March 2017Assets Non-current assets Property, plant and equipment 3 59,981.81 75,974.10 Capital work-in-progress 3.1 1,534.17 1,472.33 Goodwill on consolidation 3 965.36 9,764.55 Other intangible assets 3 6,316.71 6,509.47 Intangible assets under development 3.1 281.30 527.59 Financial assets i) Investments 4 26,242.61 1,985.85 ii) Trade receivables 5 - 11,000.57 iii) Other financial assets 6 11,956.94 16,319.67 Deferred tax assets (net) 7 1,977.60 429.22 Other non-current assets 8 9,678.12 9,950.72 Total non-current assets 118,934.62 133,934.07 Current assets Inventories 9 35,631.57 57,756.19 Financial assets (i) Investments 4 2,003.55 - (ii) Trade receivables 5 4,771.72 5,682.68 (iii) Cash and cash equivalents 10 534.88 547.83 (iv) Bank balances other than (iii) above 11 68.80 213.09 (v) Other financial assets 6 588.82 4,043.91 Other current assets 8 16,227.84 3,467.41 Total current assets 59,827.18 71,711.11 Total assets 178,761.80 205,645.18 Equity and liabilities Equity Equity share capital 12 4,398.03 4,175.24 Other equity 13 86,045.96 43,747.64 Equity attributable to owners of the Company 90,443.99 47,922.88 Non-controlling interests - 521.06 Total equity 90,443.99 48,443.94 Liabilities Non-current liabilities Financial liabilities i) Borrowings 14 4,400.08 37,095.64 Other financial liabilities 15 61.40 - Total non-current liabilities 4,461.48 37,095.64 Current liabilities Financial liabilities (i) Borrowings 14.3 3,834.77 25,400.31 (ii) Trade payables 16 51,906.81 49,080.56 (iii) Other financial liabilities 15 8,258.91 30,775.98 Provisions 17 821.82 1,002.72 Other current liabilities 18 19,034.02 13,846.03
83,856.33 120,105.60 Total liabilities 88,317.81 157,201.24 Total equity and liabilities 178,761.80 205,645.18 The accompanying Notes 1 to 41 are an integral part of the financial statements.
In terms of our report of even date For and on Behalf of the Board of Directors
For S R B C & CO LLP C.L. Raheja Ravi Raheja Govind S. ShrikhandeICAI Firm Reg. No. 324982E / E300003 Chairman Director Customer Care Associate &Chartered Accountants DIN: 00027979 DIN: 00028044 Managing Director
DIN: 00029419
Vijay Maniar Vijay Jain Bharat SanghaviPartner Customer Care Associate & Customer Care Associate &Membership No. 36738 Dy. Chief Financial Officer Company Secretary
Mumbai: 27 April 2018 Mumbai: 27 April 2018

ST
RA
TE
GIC
RE
PO
RT
ST
AT
UT
OR
Y R
EP
OR
TS
FIN
AN
CIA
L S
TA
TE
ME
NT
S
151
CONSOLIDATED STATEMENT OF PROFIT AND LOSS for the year ended 31 March 2018
(All amounts in ` Lacs)
NoteFor the year ended
31 March 2018For the year ended
31 March 2017A) Continuing operationsIncome Revenue from operations 19 3,69,672.43 3,75,690.34 Other income 20 1,653.10 3,126.86 Total income 371,325.53 378,817.20 Expenses Purchase of stock-in-trade 21a 2,24,315.09 2,31,274.10 Changes in inventories of stock-in-trade - (increase) 21b 2,477.91 3,201.22 Employee benefits expense 22 31,566.33 28,726.77 Finance costs 23 3,768.46 5,997.69 Depreciation and amortisation expense 3 11,490.46 11,870.24 Other expenses 24 90,164.22 93,249.75 Total expenses 363,782.47 374,319.77 Profit before exceptional item and tax 7,543.06 4,497.43 Exceptional Items 30 (21,598.69) 1,282.71 Profit before tax 29,141.75 3,214.72 Current tax 25 3,304.01 2,093.82 Deferred tax (1,548.38) (68.42) Income tax expenses 1,755.63 2,025.40 Profit for the year from continuing operations 27,386.12 1,189.32 B) Discontinued operations 33
Loss from discontinued operations (6,082.34) (8,399.75) Share of Profit / (Loss) in joint ventures 143.12 (626.64) Tax expenses of discontinued operations / joint ventures - -
(Loss) for the year from discontinued operations (5,939.22) (9,026.39)C) Profit / (Loss) for the year (A) + (B) 21,446.90 (7,837.07)D) Other comprehensive incomeItems that will not be reclassified to profit or loss i) Remeasurement of employee defined benefit obligation (123.72) 36.09 Income tax effect 43.22 - ii) Fair value in the value of investments (696.87) - Income tax effect 72.48 13.89 Other comprehensive income / (Loss) for the year [D] (704.89) 49.98 Total comprehensive Income / (Loss) for the year [C] + [D] 22,151.79 (7,887.05)Profit / (loss) for the year attributable to: - Owners of the Company 24,421.66 (3,727.95) - Non-controlling interests (2,974.76) (4,109.12)Other comprehensive income for the year attributable to: - Owners of the Company (704.89) 13.58 - Non-controlling interests - 36.40 Total comprehensive income for the year attributable to: - Owners of the Company 25,126.55 (3,741.53) - Non-controlling interests (2,974.76) (4,145.52)Earning per equity share (for continuing operations) 27
Equity shares of face value `5/- each (2017: `5/- each) Basic (`) 32.42 1.42 Diluted (`) 32.42 1.42
Earning per equity share (for discontinued operations) 27 Equity shares of face value `5/- each (2017: `5/- each) Basic (`) (3.51) (5.89) Diluted (`) (3.51) (5.89)
Earning per equity share (for continuing and discontinuing operations) 27 Equity shares of face value `5/- each (2017: `5/- each) Basic (`) 28.91 (4.46) Diluted (`) 28.91 (4.46)
The accompanying Notes 1 to 41 are an integral part of the financial statementsIn terms of our report of even date For and on Behalf of the Board of Directors
For S R B C & CO LLP C.L. Raheja Ravi Raheja Govind S. ShrikhandeICAI Firm Reg. No. 324982E / E300003 Chairman Director Customer Care Associate &Chartered Accountants DIN: 00027979 DIN: 00028044 Managing Director
DIN: 00029419
Vijay Maniar Vijay Jain Bharat SanghaviPartner Customer Care Associate & Customer Care Associate &Membership No. 36738 Dy. Chief Financial Officer Company Secretary
Mumbai: 27 April 2018 Mumbai: 27 April 2018
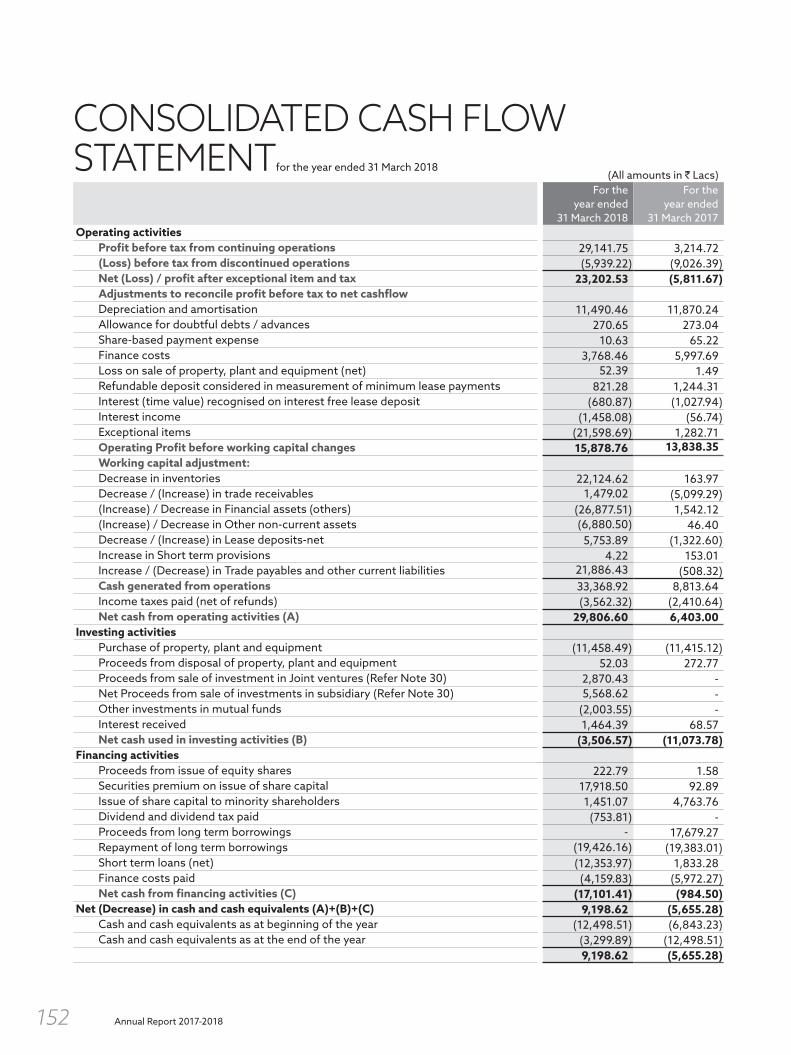
Annual Report 2017-2018152
CONSOLIDATED CASH FLOW STATEMENTfor the year ended 31 March 2018
(All amounts in ` Lacs)For the
year ended 31 March 2018
For the year ended
31 March 2017Operating activities
Profit before tax from continuing operations 29,141.75 3,214.72 (Loss) before tax from discontinued operations (5,939.22) (9,026.39)Net (Loss) / profit after exceptional item and tax 23,202.53 (5,811.67)Adjustments to reconcile profit before tax to net cashflowDepreciation and amortisation 11,490.46 11,870.24 Allowance for doubtful debts / advances 270.65 273.04 Share-based payment expense 10.63 65.22 Finance costs 3,768.46 5,997.69 Loss on sale of property, plant and equipment (net) 52.39 1.49 Refundable deposit considered in measurement of minimum lease payments 821.28 1,244.31 Interest (time value) recognised on interest free lease deposit (680.87) (1,027.94)Interest income (1,458.08) (56.74)Exceptional items (21,598.69) 1,282.71 Operating Profit before working capital changes 15,878.76 13,838.35 Working capital adjustment:Decrease in inventories 22,124.62 163.97 Decrease / (Increase) in trade receivables 1,479.02 (5,099.29)(Increase) / Decrease in Financial assets (others) (26,877.51) 1,542.12 (Increase) / Decrease in Other non-current assets (6,880.50) 46.40 Decrease / (Increase) in Lease deposits-net 5,753.89 (1,322.60)Increase in Short term provisions 4.22 153.01 Increase / (Decrease) in Trade payables and other current liabilities 21,886.43 (508.32)Cash generated from operations 33,368.92 8,813.64 Income taxes paid (net of refunds) (3,562.32) (2,410.64)Net cash from operating activities (A) 29,806.60 6,403.00
Investing activitiesPurchase of property, plant and equipment (11,458.49) (11,415.12)Proceeds from disposal of property, plant and equipment 52.03 272.77 Proceeds from sale of investment in Joint ventures (Refer Note 30) 2,870.43 - Net Proceeds from sale of investments in subsidiary (Refer Note 30) 5,568.62 - Other investments in mutual funds (2,003.55) - Interest received 1,464.39 68.57
Net cash used in investing activities (B) (3,506.57) (11,073.78)Financing activities
Proceeds from issue of equity shares 222.79 1.58 Securities premium on issue of share capital 17,918.50 92.89 Issue of share capital to minority shareholders 1,451.07 4,763.76 Dividend and dividend tax paid (753.81) - Proceeds from long term borrowings - 17,679.27 Repayment of long term borrowings (19,426.16) (19,383.01)Short term loans (net) (12,353.97) 1,833.28 Finance costs paid (4,159.83) (5,972.27)
Net cash from financing activities (C) (17,101.41) (984.50)Net (Decrease) in cash and cash equivalents (A)+(B)+(C) 9,198.62 (5,655.28)
Cash and cash equivalents as at beginning of the year (12,498.51) (6,843.23)Cash and cash equivalents as at the end of the year (3,299.89) (12,498.51)
9,198.62 (5,655.28)
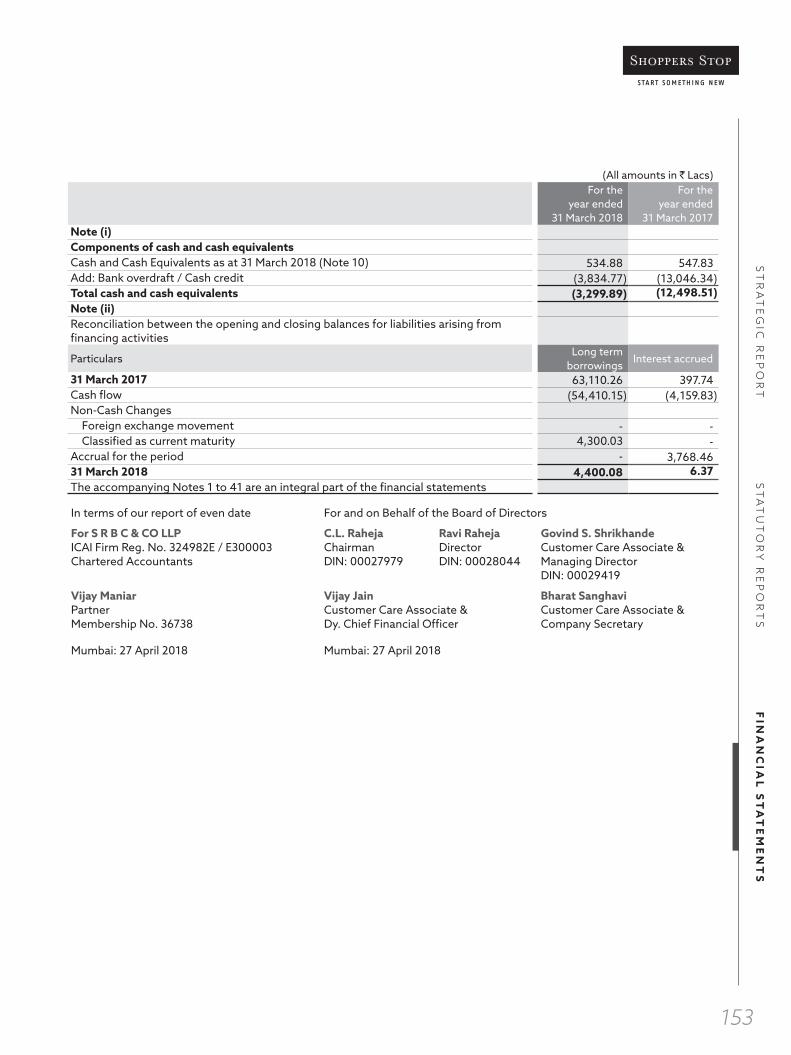
ST
RA
TE
GIC
RE
PO
RT
ST
AT
UT
OR
Y R
EP
OR
TS
FIN
AN
CIA
L S
TA
TE
ME
NT
S
153
(All amounts in ` Lacs)For the
year ended 31 March 2018
For the year ended
31 March 2017Note (i)Components of cash and cash equivalentsCash and Cash Equivalents as at 31 March 2018 (Note 10) 534.88 547.83 Add: Bank overdraft / Cash credit (3,834.77) (13,046.34)Total cash and cash equivalents (3,299.89) (12,498.51)Note (ii)Reconciliation between the opening and closing balances for liabilities arising from financing activities
Particulars Long term borrowings
Interest accrued
31 March 2017 63,110.26 397.74 Cash flow (54,410.15) (4,159.83)Non-Cash Changes Foreign exchange movement - - Classified as current maturity 4,300.03 -Accrual for the period - 3,768.46 31 March 2018 4,400.08 6.37 The accompanying Notes 1 to 41 are an integral part of the financial statements
In terms of our report of even date For and on Behalf of the Board of Directors
For S R B C & CO LLP C.L. Raheja Ravi Raheja Govind S. ShrikhandeICAI Firm Reg. No. 324982E / E300003 Chairman Director Customer Care Associate &Chartered Accountants DIN: 00027979 DIN: 00028044 Managing Director
DIN: 00029419
Vijay Maniar Vijay Jain Bharat SanghaviPartner Customer Care Associate & Customer Care Associate &Membership No. 36738 Dy. Chief Financial Officer Company Secretary
Mumbai: 27 April 2018 Mumbai: 27 April 2018

Annual Report 2017-2018154
a) Equity share capital No.of shares (`in lacs) Equity shares of `5/- each issued, subscribed and fully paid-up Balance as on 31 March 2016 83,461,946 4,173.10 Issue of equity shares under employee share option plan(note 36) 42,798 2.14 Balance as on 1 April 2017 83,504,744 4,175.24 Issue of equity shares under employee share option plan (Note 36) 60,020 3.00 Issued on preferential basis (Refer Note 12.6) 4,395,925 219.79 Balance as on 31 March 2018 87,960,689 4,398.03
b) Other equity
Particulars:Securities Premium Account
General Reserve
Retained earnings
Share Options
Outstanding Account
Debenture Redemption
Reserve
Share application
money pending
allotment
Attributable to owners of
Company
Non controlling
InterestsTotal
Balance as on 31 March 2016 47,400.23 1,909.18 (2,676.01) 255.12 420.00 28.75 47,337.27 (122.21) 47,215.06 Loss for the year - - (3,727.97) - - - (3,727.97) (4,109.12) (7,837.09)Other comprehensive loss for the year, net of income tax - - 13.58 - - - 13.58 36.40 49.98 Total comprehensive income for the year - - (3,741.55) - - - (3,741.55) (4,145.52) (7,887.07)Recognition of share-based payments * - - 112.79 (28.17) - - 84.62 - 84.62 Issue of equity shares to Non-controlling interests - - - - - - - 4,763.76 4,763.76 Change in ownership interests - - (25.03) - - - (25.03) 25.03 - Received on issue of shares 121.08 - - - - - 121.08 - 121.08 Shares allotted - - - - - (28.75) (28.75) - (28.75)Balance as on 31 March 2017 47,521.31 1,909.18 (6,329.80) 226.95 420.00 - 43,747.64 521.06 44,268.71 Profit for the year - - 24,421.66 - - - 24,421.66 (2,974.76) 21,446.90 Other comprehensive Profit for the year,net of income tax - - (704.89) - - - (704.89) - (704.89)Total comprehensive income for the year - - 25,126.55 - - - 25,126.55 (2,974.76) 22,151.79 Recognition of share-based payments * - - 172.52 (165.45) - - 7.07 - 7.07Issue of equity share to Non controlling interests - - - - - - - 1451.07 - Transferred from Debenture redemption reserve - 420.00 - - (420.00) - - - - Payment of dividends on equity shares - - (626.31) - - - (626.31) - (626.31)Payments of tax on dividends on equity shares - - (127.50) - - - (127.50) - (127.50)Received on issue of shares 17,918.50 - - - - - 17,918.50 - 17,918.50 Sale of share in subsidiary companies - - - - - - - 1002.63 1002.63Balance as on 31 March 2018 65,439.81 2,329.18 18,215.46 61.50 - - 86,045.96 - 86,045.96 * after transfers to retained earnings for options lapsed/exercised.
STATEMENT OF CHANGES IN EQUITYfor the year ended 31 March 2018
In terms of our report of even date For and on Behalf of the Board of Directors
For S R B C & CO LLP C.L. Raheja Ravi Raheja Govind S. ShrikhandeICAI Firm Reg. No. 324982E / E300003 Chairman Director Customer Care Associate &Chartered Accountants DIN: 00027979 DIN: 00028044 Managing Director
DIN: 00029419
Vijay Maniar Vijay Jain Bharat SanghaviPartner Customer Care Associate & Customer Care Associate &Membership No. 36738 Dy. Chief Financial Officer Company Secretary
Mumbai: 27 April 2018 Mumbai: 27 April 2018

ST
RA
TE
GIC
RE
PO
RT
ST
AT
UT
OR
Y R
EP
OR
TS
FIN
AN
CIA
L S
TA
TE
ME
NT
S
155
NOTES to the consolidated financial statements for the year ended 31 March 2018
1. GENERAL BACKGROUND
The Company has six subsidiaries which along with the Company constitute ‘the Group’. They are primarily engaged in the following activities:
SN Entity Business activity1 Shoppers Stop
LimitedRetailing a variety of household and consumer products through departmental stores
2 Hypercity Retail (India) Limited *
Retailing a variety of household and consumer products (including food, groceries, fashion and other general merchandise) through departmental stores
3 Crossword Bookstores Limited
Retailing in books and other allied items through departmental stores operated by self or by franchisees
4 Shoppers’ Stop Services (India) Limited
Services
5 Upasna Trading Limited
Supervising distribution and logistics operations
6 Shoppers’ Stop.com (India) Limited
Services
7 Gateway Multichannel Retail (India) Limited
Catalogue retailing business (Discontinued operations)
* Hypercity Retail (India) Limited ceases to be subsidiary with effect from 01 December 2017.
The financial statements were approved for issue by the board of directors on 27 April 2018.
2. SIGNIFICANT ACCOUNTING POLICIES
2.1 Basis of preparation and presentation
2.1.1 Statement of Compliance with Indian Accounting Standards (Ind ASs): The consolidated financial statements have been prepared in accordance with Indian Accounting Standards (Ind ASs) notified under the Companies (Indian Accounting Standards) Rules, 2015 and other relevant provisions of the Companies Act, 2013 ‘the Act’.
The financial statements are presented in Indian Rupees (`) and all values are rounded to the nearest lacs, except where otherwise indicated.
2.1.2 These financial statements have been prepared on historical cost basis, except for certain assets and liabilities that are measured at fair values at the end of each reporting period, as explained in the accounting policies below.
Fair Value Measurement
Fair value is the price that would be received to sell an asset or paid to transfer a liability in an orderly transaction between market participants at the measurement date, (regardless of whether that price is directly observable or estimated using another valuation technique). In estimating the fair value of an asset or a liability, the Group takes into account the characteristics of the asset or liability, if market participants would take those characteristics into account when pricing the asset or liability, at the measurement date.
In addition, for financial reporting purposes, fair value measurements are categorised into Level 1, 2 or 3 based on the degree to which inputs to the fair value measurements are observable and the significance of the inputs to the fair value measurement in its entirety, which are described as follows:
Level 1 inputs are quoted prices (unadjusted) in active markets for identical assets or liabilities that the entity can access at the measurement date;
Level 2 inputs are inputs, other than quoted prices included within Level 1, that are observable for the asset or liability, either directly or indirectly; and
Level 3 inputs are unobservable inputs for the asset or liability.
Fair value for measurement and/or disclosure purposes in these financial statements is determined on such a basis, except for share-based payment transactions that are within the scope of Ind AS 102, leasing transactions that are within the scope of Ind AS 17, and measurements that have some similarities to fair value but are not fair value, such as net realisable value in Ind AS 2 or value in use in Ind AS 36.
2.2 Consolidation of financial statements
The consolidated financial statements of the Group incorporate the assets, liabilities, equity, income, expenses and cash flows of the Company and its subsidiaries and are presented as those
Annual Report 2017-2018156
NOTES to the consolidated financial statements for the year ended 31 March 2018
of a single economic entity. The Company has control of the subsidiaries as it has the rights to variable returns from its involvement and has the ability to affect those returns through its power over the subsidiaries.
The consolidated financial statements are prepared using uniform accounting policies for like transactions and other events in similar circumstances. The consolidation procedures principally followed are: (a) Like items of assets, liabilities, equity, income, expenses and cash flows of the Company and those of its subsidiaries are combined; (b) the carrying amount of the parent’s investment in each subsidiary and the parent’s portion of equity of each subsidiary are eliminated; (c) intragroup assets and liabilities, equity, income, expenses, and cash flows relating to transactions between entities of the Group are eliminated in full.
Goodwill is recognised when a change in the Group’s ownership interest, (or otherwise), results in the Group acquiring control over a Company.
Changes in the Group’s ownership interests in subsidiaries that do not result in the Group losing control over the subsidiaries are accounted for as equity transactions (i.e. transactions with owners in their capacity as owners).
Goodwill arising on consolidation is tested for impairment at each reporting date. If the recoverable amount of cash generating unit to which the goodwill is attributed is less than the carrying amount of the unit, an impairment loss is recognised, first to reduce the carrying amount of goodwill (and thereafter to the balance assets of the unit, pro rata to their carrying amounts).
Non-controlling interests are presented in the consolidated balance sheet within equity, separately from the equity of the owners of the Company. Total comprehensive income of subsidiaries is attributed to the owners and to the non-controlling interests, (even if this results in the non-controlling interests having a deficit balance).
2.2.1 Investments in joint ventures
The Company’s investment in a joint venture is accounted for by the Equity Method. On initial recognition the investment is recorded at cost, and the carrying amount is increased or decreased to recognise the Company’s share of profit or loss and other comprehensive income of the joint venture after the date of acquisition. Distributions received from the joint venture reduce the carrying amount of the investment.
The carrying amount of the investment is tested for impairment at each reporting date.
2.3 Current versus Non-Current Classification
The Group presents assets and liabilities in the balance sheet based on current / non-current classification. An asset is treated as current when it is
Expected to be realised or intended to be sold or consumed in normal operating cycle
Held primarily for the purpose of trading
Expected to be realised within twelve months after the reporting period, or
Cash or cash equivalent unless restricted from being exchanged or used to settle a liability for at least twelve months after the reporting period
All other assets are classified as non-current.
A liability is current when:
It is expected to be settled in normal operating cycle
It is held primarily for the purpose of trading
It is due to be settled within twelve months after the reporting period, or
There is no unconditional right to defer the settlement of the liability for at least twelve months after the reporting period
The Group classifies all other liabilities as non-current.
Deferred tax assets and liabilities are classified as non-current assets and liabilities.
The operating cycle is the time between the acquisition of assets for processing and their realisation in cash and cash equivalents. The Group has identified twelve months as its operating cycle.
2.4 Revenue recognition
2.4.1 Revenue is recognised when it is probable that the economic benefits will flow to the Group and the amount of income can be measured reliably.
2.4.2 Retail Sale of Products:
Revenue from Retail sales is measured at the fair value of the consideration received or receivable. Revenue is reduced for discounts and rebates, and, value added tax, sales tax and Goods and Service Tax (GST).

ST
RA
TE
GIC
RE
PO
RT
ST
AT
UT
OR
Y R
EP
OR
TS
FIN
AN
CIA
L S
TA
TE
ME
NT
S
157
NOTES to the consolidated financial statements for the year ended 31 March 2018
Retail sales are recognised on delivery of the merchandise to the customer, when the property in goods and significant risks and rewards are transferred for a price and no effective ownership control is retained.
Where the Group is the principal in the transaction the Sales are recorded at their gross values. Where the Group is effectively the agent in the transaction the cost of the merchandise is disclosed as a deduction from the gross value. (Refer Note 19)
Point award schemes: The fair value of the consideration received or receivable on sale of goods that result in award credits for customers, under the Group’s point award schemes, is allocated between the goods supplied and the award credits granted. The consideration allocated to the award credits is measured by reference to their fair value from the standpoint of the holder and is recognised as revenue on redemption and / or expected redemption after breakage.
Property option revenue: The Group has acquired the rights to sell flats in a property being constructed by a third party (termed Property Options), which are initially recognised at cost and at each reporting date valued at lower of cost and net realisable value. Sale of option inventory is recognised when there is a transfer of significant risks and rewards in accordance with the terms of the sale contracts. To the extent the transactions contain a significant financing component, it is adjusted from the total consideration using the appropriate discount rate and recognised in profit or loss over the credit period.
2.4.3 Gift vouchers: The amount collected on sale of a gift voucher is recognised as a liability and transferred to revenue (sales) when redeemed or to revenue (other retail operating revenue) on expiry.
2.4.4 Other retail operating revenue:
Facility management fees are recognised pro-rata over the period of the contract. Revenue from store displays and sponsorships are recognised based on the period for which the products or the sponsors’ advertisements are promoted / displayed.
2.4.5 Dividend and Interest income
Dividend income from Investments is recognised when the right to receive the payment has been established. Interest income is accrued on a time basis, by reference to the principal outstanding and at the effective interest rate applicable.
2.5 Inventories
Inventories are stated at the lower of cost and net realisable value. Cost of inventories comprise of all cost of purchase and other related costs incurred in bringing the inventories to their present location and condition. Costs of inventories are determined on a weighted average cost basis. Net realisable value represents the estimated selling price for inventories less all estimated costs necessary to make the sale. Provision is made for obsolete/ slow moving inventories.
2.6 Property, plant and equipment and Intangible Assets
2.6.1 Property, plant and equipment and Intangible Assets are stated at cost less accumulated depreciation and accumulated impairment losses. Cost comprises of all cost of purchase, construction and other related costs incurred in bringing the assets to their present location and condition.
2.6.2 Depreciation / amortisation is recognised on a straight-line basis over the estimated useful lives of respective assets as under:
Property, Plant and Equipment
Useful Life as Prescribed by
Schedule II of the Companies Act,
2013 (In Years)
Estimated Useful Life (In Years)
Air conditioning and other equipment 5 5 to 17Furniture, fixtures and other fittings 10 5 to 10Computer Equipment (other than desktops and laptops) Desktops and laptops
6
3
5 to 6
3Leasehold Improvements On lease term 5 to 17Office Equipment 5 2 to 6Vehicles 8 8Intangible assets:Computer Software 6Trademark and Patents 10 10
Useful life of assets different from prescribed in Schedule II has been estimated by management supported by technical assessment.

Annual Report 2017-2018158
NOTES to the consolidated financial statements for the year ended 31 March 2018
The estimated useful lives, residual values and depreciation method are reviewed at the end of each reporting period and the effect of any changes in estimate is accounted for prospectively.
2.6.3 Impairment losses
At the end of each reporting period, the Group reviews the carrying amounts of its property plant and equipment and intangible assets to determine whether there is any indication that those assets have suffered an impairment loss. If any such indication exists, the recoverable amount, (i.e. higher of fair value less costs of disposal and value in use) of the asset is estimated, or, when it is not possible to estimate the recoverable amount of an individual asset, the recoverable amount of the cash-generating unit to which the asset belongs is estimated. If the recoverable amount of an asset (or cash-generating unit) is estimated to be less than its carrying amount, the carrying amount of the asset (or cash-generating unit) is reduced to its recoverable amount. An impairment loss is recognised immediately in profit or loss.
When an impairment loss subsequently reverses, the carrying amount of the asset (or a cash-generating unit) is increased to the revised estimate of its recoverable amount, but so that the increased carrying amount does not exceed the carrying amount that would have been determined had no impairment loss been recognised for the asset (or cash-generating unit) in prior years. A reversal of an impairment loss is recognised immediately in profit or loss.
2.6.4 Deemed cost on transition to Ind AS
For transition to Ind AS, the Group has elected to continue with the carrying value of all of its property, plant and equipment and intangible assets recognised as of 1 April 2015 (transition date) measured as per the previous GAAP and use that carrying value as its deemed cost as of the transition date.
2.7 Leases
The determination of whether an arrangement is (or contains) a lease is based on the substance of the arrangement at the inception of the lease. The arrangement is, or contains, a lease
if fulfilment of the arrangement is dependent on the use of a specific asset or assets and the arrangement conveys a right to use the asset or assets, even if that right is not explicitly specified in an arrangement.
For arrangements entered into prior to 1 April 2015, the Group has determined whether the arrangement contain lease on the basis of facts and circumstances existing on the date of transition.
Where the Company is the lessee:
Operating lease payments are recognised in profit or loss on a straight-line basis over the lease term unless another systematic basis is more representative of the time pattern of the user’s benefit or the lease payments are structured to increase in line with expected general inflation to compensate for the lessor’s expected inflationary cost increases.
Where the Company is the Lessor:
Leases in which the Company does not transfer substantially all the risks and benefits of ownership of the asset are classified as operating leases. Assets subject to operating leases are included in the property, plant and equipment. Lease income on an operating lease is recognised in the statement of profit and loss on a straight-line basis over the lease term. Costs, including depreciation, are recognised as an expense in the statement of profit and loss.
2.8 Financial Instruments
Classification:
The Group classifies its financial assets in the following measurement categories:- those to be measured subsequently at fair value (either through other comprehensive income, or through the Statement of Profit and Loss), and those measured at amortised cost. The classification depends on the Company’s business model for managing the financial assets and the contractual terms of the cash flows. For assets measured at fair value, gains and losses will either be recorded in the Statement of Profit and Loss or other comprehensive income. For investments in debt instruments, this will depend on the business model in which the investment is held. For investments in equity instruments, this will depend on whether the Group has made an irrevocable election at the time of initial recognition to account for the equity investment at fair value through other comprehensive income. The Group reclassifies debt investments when and only when its business model for managing those assets changes.

ST
RA
TE
GIC
RE
PO
RT
ST
AT
UT
OR
Y R
EP
OR
TS
FIN
AN
CIA
L S
TA
TE
ME
NT
S
159
NOTES to the consolidated financial statements for the year ended 31 March 2018
Measurement:
At initial recognition, the Group measures a financial asset at its fair value plus, in the case of financial asset not at fair value through the Statement of Profit and Loss, transaction costs that are directly attributable to the acquisition of the financial asset. Transaction costs of financial assets carried at fair value through the Statement of Profit and Loss are expensed in the Statement of Profit and Loss. Financial assets with embedded derivatives are considered in their entirely when determining whether their cash flows are solely payment of principal and interest.
Debt instruments:
Subsequent measurement of debt instruments depends on the Group’s business model for managing the asset and the cash flow characteristics of the asset. There are three measurement categories into which the Group classifies its debt instruments:
Amortised cost:
Assets that are held for collection of contractual cash flows where those cash flows represent solely payments of principal and interest are measured at amortised cost. A gain or loss on a debt investment that is subsequently measured at amortised cost and is not part of a hedging relationship is recognised in the Statement of Profit and Loss when the asset is derecognised or impaired. Interest income from these financial assets is included in other income using the effective interest rate method.
Fair value through other comprehensive income (FVOCI):
Assets that are held for collection of contractual cash flows and for selling the financial assets, where the assets’ cash flows represent solely payments of principal and interest are measured at fair value through other comprehensive income (FVOCI). Movements in the carrying amount are taken through OCI, except for the recognition of impairment gains or losses, interest revenue and foreign exchange gains and losses which are recognised in the Statement of Profit and Loss. When the financial asset is derecognised, the cumulative gain or loss previously recognised in OCI is reclassified from equity to the Statement of Profit and Loss and recognised in other income / expense. Interest income from these financial assets is included in other income using the effective interest rate method.
Fair value through profit and loss:
Assets that do not meet the criteria for amortised cost or FVOCI are measured at fair value through Statement of Profit and Loss. A gain or loss on a debt investment that is subsequently measured at fair value through Statement of Profit and Loss and is not part of a hedging relationship is recognised in the Statement of Profit and Loss and presented net in the Statement of Profit and Loss In the period in which it arises. Interest income from these financial assets is included in other income.
Equity instruments:
The Group subsequently measures all equity investments at fair value. Where the Company’s management has elected to present fair value gains and losses on equity investments in other comprehensive income, there is no subsequent reclassification of fair value gains and losses to the Statement of Profit and Loss. Dividends from such investments are recognised in the Statement of Profit and Loss as other income when the Group’s right to receive payments is established. Changes in the fair value of financial assets at fair value through the Statement of Profit and Loss are recognised in other income / other expenses in the Statement of Profit and Loss. Impairment losses (and reversal of impairment losses) on equity investments measured at FVOCI are not reported separately from other changes in fair value.
Impairment of financial assets:
The Group assesses on a forward-looking basis the expected credit losses associated with its assets carried at amortised cost and FVOCI debt instruments. The impairment methodology applied depends on whether there has been a significant increase in credit risk.
Derecognition of financial assets:
A financial asset is derecognised only when the Group has transferred the rights to receive cash flows from the financial asset or retains the contractual rights to receive the cash flows of the financial asset, but assumes a contractual obligation to pay the cash flows to one or more recipients. Where the Group has transferred an asset, the Group evaluates whether it has transferred substantially all risks and rewards of the financial asset. In such cases, the financial asset is derecognised. Where the Group has not transferred substantially all risks and rewards of ownership of the financial asset, the financial asset is not derecognised. Where the Group has neither transferred a financial asset nor retains substantially all risks and rewards of ownership

Annual Report 2017-2018160
NOTES to the consolidated financial statements for the year ended 31 March 2018
of the financial asset, the financial asset is derecognised if the Group has not retained control of the financial asset. Where the Group retains control of the financial asset, the asset is continued to be recognised to the extent of continuing involvement in the financial asset.
Offsetting financial instruments:
Financial assets and liabilities are offset and the net amount is reported in the balance sheet where there is a legally enforceable right to offset the recognised amounts and there is an intention to settle on a net basis or realise the asset and settle the liability simultaneously. The legally enforceable right must not be contingent on future events and must be enforceable in the normal course of business and in the event of default insolvency or bankruptcy of the Group or the counterparty.
2.8.1 Financial liabilities are initially measured at fair value. Transaction costs that are directly attributable to the issue of financial liabilities are deducted from the fair value of the financial liabilities on initial recognition. After initial recognition, all financial liabilities (other than financial guarantee contracts and derivative instruments – see below) are subsequently measured at amortised cost using the effective interest method. The Company has not designated any financial liability as FVTPL.
2.8.2 Financial guarantee contracts: The Group on a case to case basis elects to account for financial guarantee contracts as a financial instrument or as an insurance contract, as specified in Ind AS 109 on Financial Instruments and Ind AS 104 on Insurance Contracts. The Group has regarded all its financial guarantee contracts as insurance contracts. At the end of each reporting period the Group performs a liability adequacy test, (i.e. it assesses the likelihood of a pay-out based on current undiscounted estimates of future cash flows), and any deficiency is recognised in profit or loss.
2.8.3 Derivative instruments: The Group enters into foreign exchange forward contracts to manage its exposure to foreign exchange rate risks. These contracts are initially recognised at fair value and subsequently, at the end of each reporting period, re-measured at their fair values on reporting date. The resulting gain or loss is recognised in profit or loss in the same line as the movement in the hedged exchange rate.
2.9 Taxation
Income tax expense represents the sum of the tax currently payable and deferred tax. Current and deferred tax are recognised in profit or loss, except when they relate to items that are recognised in other comprehensive income or directly in equity, in which case, the current and deferred tax are also recognised in other comprehensive income or directly in equity respectively.
2.9.1 Current tax
The tax currently payable is based on the estimated taxable profit for the year for each entity in the Group and is calculated using applicable tax rates and tax laws that have been enacted or substantively enacted.
2.9.2 Deferred tax
Deferred tax is provided using the liability method on temporary differences between the tax base of assets and liabilities and their carrying amounts for financial reporting purposes at the reporting date.
Deferred tax assets are recognised for all deductible temporary differences, the carry forward of unused tax credits and any unused tax losses. Deferred tax assets are recognised to the extent that it is probable that taxable profit will be available against which the deductible temporary differences, and the carry forward of unused tax credits and unused tax losses can be utilised, except when the deferred tax asset relating to the deductible temporary difference arises from the initial recognition of an asset or liability in a transaction that is not a business combination and, at the time of the transaction, affects neither the accounting profit nor taxable profit or loss.
The carrying amount of deferred tax assets is reviewed at the end of each reporting period and reduced to the extent that it is no longer probable that sufficient taxable profits will be available to allow all or part of the asset to be utilised. Unrecognised deferred tax assets are re-assessed at each reporting date and are recognised to the extent that it has become probable that future taxable profits will allow the deferred tax asset to be recovered.
Deferred tax liabilities and assets are measured at the tax rates that are expected to apply in the period in which the liability is settled or the asset realised, based on tax

ST
RA
TE
GIC
RE
PO
RT
ST
AT
UT
OR
Y R
EP
OR
TS
FIN
AN
CIA
L S
TA
TE
ME
NT
S
161
NOTES to the consolidated financial statements for the year ended 31 March 2018
rates (and tax laws) that have been enacted or substantively enacted.
Deferred tax assets and deferred tax liabilities are offset if a legally enforceable right exists to set off current tax assets against current tax liabilities and the deferred taxes relate to the same taxable entity and the same taxation authority.
2.10 Employee benefits
2.10.1 Defined Contribution Plan: The Group makes defined contribution to Government Employee Provident Fund, Government Employee Pension Fund, Employee Deposit Linked Insurance and ESI, which are recognised in the statement of profit and loss on accrual basis. The Group recognises contribution payable to the provident fund scheme as an expenditure, when an employee renders the related service. The Group has no obligation, other than the contribution payable to the provident fund.
2.10.2 Retirement benefit costs and termination benefits: Payments to defined contribution plans are recognised as expense when employees have rendered service entitling them to the contributions.
The Group determines the present value of the defined benefit obligation and fair value of plan assets and recognises the net liability or asset in the balance sheet. The net liability or asset represents the deficit or surplus in the Group’s defined benefit plans. (The surplus is limited to the present value of economic benefits available in the form of refunds from the plans or reductions in future contributions to the plans).
The present value of the obligation is determined using the projected unit credit method, with actuarial valuations being carried out at the end of each year.
Defined benefit costs are composed of:
service cost (including current service cost, past service cost, as well as gains and losses on curtailments and settlements);
net interest expense or income; and
Re-measurement
The first two components are recognised in profit or loss. Re-measurement, comprising actuarial gains and losses, the effect of the changes to the asset ceiling (if applicable)
and the return on plan assets (excluding net interest), is reflected in the balance sheet and a charge or credit, (as the case may be), is recognised in other comprehensive income. Re-measurement recognised in other comprehensive income is reflected in retained earnings. Past service cost is recognised in profit or loss in the period of a plan amendment. Net interest is calculated by applying the discount rate at the beginning of the period to the net defined benefit liability or asset.
The retirement benefit liability or asset recognised in the balance sheet represents the actual deficit or surplus in the Company’s defined benefit plans. The surplus is limited to the present value of economic benefits available in the form of refunds from the plans or reductions in future contributions to the plans.
2.10.3 Short term benefits:
A liability is recognised for benefits accruing to employees in respect of wages and salaries, annual leave and sick leave and other short term benefits in the period the related service is rendered at the undiscounted amount of the benefits expected to be paid in exchange for that service.
Other long term benefits: Liabilities recognised in respect of other long-term employee benefits are measured at the present value of the estimated future cash outflows expected to be made by the Group in respect of services provided by employees up to the reporting date.
2.10.4 Share-based payment arrangements
Equity-settled share-based payments to employees of the Group are measured at the fair value of the equity instruments at the grant date. Details regarding the determination of the fair value of equity-settled share-based transactions are set out in Note 36. The fair value determined at the grant date of the equity-settled share-based payments to employees of the Group is expensed on a straight-line basis over the vesting period, based on the Company’s estimate of equity instruments that will eventually vest, with a corresponding increase in equity. At the end of each year, the Group revisits its estimate of the number of equity instruments expected to vest and recognises any impact in profit

Annual Report 2017-2018162
NOTES to the consolidated financial statements for the year ended 31 March 2018
or loss, such that the cumulative expense reflects the revised estimate, with a corresponding adjustment to the equity-settled employee benefits reserve.
2.11 Foreign currency transactions
The Group’s financial statements are presented in INR which is also its functional currency. Transactions in currencies other than the Group’s functional currency (foreign currencies) are recognised at the rates of exchange prevailing at the dates of the transactions. At the end of each reporting period, monetary items denominated in foreign currencies are retranslated at the rates prevailing at that date. Exchange differences arising on settlement or translation of monetary items are recognised in the profit or loss.
2.12 Borrowing costs
Borrowing Cost includes interest and amortisation of ancillary costs incurred in connection with the arrangement of borrowings.
Borrowing costs directly attributable to the acquisition or construction of assets that necessarily take a substantial period of time to get ready for their intended use or sale (qualifying assets), are added to the cost of those assets, until such time as the assets are substantially ready for their intended use or sale. All other borrowing costs are recognised in profit or loss in the period in which they are incurred.
2.13 Provisions
Provisions are recognised when the Group has a present obligation (legal or constructive) as a result of a past event, it is probable that the Group will be required to settle the obligation, and a reliable estimate can be made of the amount of the obligation. The amount recognised as a provision is the best estimate of the consideration required to settle the present obligation at the end of the reporting period, taking into account the risks and uncertainties surrounding the obligation. When a provision is measured using the cash flows estimated to settle the present obligation, its carrying amount is the present value of those cash flows.
2.14 Cash and cash equivalents
Cash and cash equivalents in the balance sheet and for the purpose of cash flow statement comprises cash in hand and cash at bank including fixed deposit with original maturity period of three months and short term highly liquid investments with an original maturity of three months or less
net of outstanding bank over drafts as they are considered an integral part of the Group’s cash management.
2.15 Cash dividend and non-cash distribution to equity holders
The Group recognises a liability to make cash or non-cash distributions to equity holders when the distribution is authorised and the distribution is no longer at the discretion of the Company. As per the corporate laws in India, a distribution is authorised when it is approved by the shareholders. A corresponding amount is recognised directly in equity.
Non-cash distributions are measured at the fair value of the assets to be distributed with fair value re-measurement recognised directly in equity.
Upon distribution of non-cash assets, any difference between the carrying amount of the liability and the carrying amount of the assets distributed is recognised in the statement of profit and loss.
2.16 Earnings per Share
Basic earnings per share are calculated by dividing the net profit or loss for the period attributable to equity shareholders by the weighted average number of equity shares outstanding during the period. The weighted average number of equity shares outstanding during the period and for all periods presented is adjusted for events, such as bonus shares that have changed the number of equity shares outstanding, without a corresponding change in resources.
For the purpose of calculating diluted earnings per share, the net profit or loss for the period attributable to equity shareholders and the weighted average number of shares outstanding during the period is adjusted for the effects of all dilutive potential equity shares.
2.A Critical accounting judgements and key sources of estimation uncertainty
The preparation of the financial statements requires management to make judgements, estimates and assumptions about the reported amounts of assets and liabilities, and, income and expenses that are not readily apparent from other sources. Such judgements, estimates and associated assumptions are evaluated based on historical experience and various other factors, including estimation of the effects of uncertain future events, which are believed to be reasonable under the circumstances. Actual results may differ from these estimates. The estimates and underlying assumptions are reviewed on an on-going basis. Revisions to accounting estimates are
ST
RA
TE
GIC
RE
PO
RT
ST
AT
UT
OR
Y R
EP
OR
TS
FIN
AN
CIA
L S
TA
TE
ME
NT
S
163
NOTES to the consolidated financial statements for the year ended 31 March 2018
recognised in the period in which the estimate is revised if the revision affects only that period or in the period of the revision and future periods if the revision affects both current and future periods.
The following are the critical judgements and estimations that have been made by the management in the process of applying the Group’s accounting policies and that have the most significant effect on the amount recognised in the financial statements and / or key sources of estimation uncertainty that may have a significant risk of causing a material adjustment to the carrying amounts of assets and liabilities within the next financial year.
Income Tax
As stated in Note 25, tax expense is calculated using applicable tax rates and tax laws that have been enacted or substantively enacted. In arriving at taxable profit and tax bases of assets and liabilities the Group adjudges taxability of amounts in accordance with tax enactments, case law and opinions of tax counsel, as relevant. Where differences arise on tax assessment, these are booked in the period in which they are agreed or on final closure of assessment.
Useful lives of property, plant and equipment and intangible assets
The Group reviews the estimated useful lives of property, plant and equipment and intangible assets at the end of each reporting period. During financial years ended 31 March 2017, 2016 and 2015 there were no changes in useful lives of property plant and equipment and intangible assets other than those resulting from store closures / shifting of premises.
The Group at the end of each reporting period, based on external and internal sources of information, assesses indicators and mitigating factors of whether a store (cash generating unit) may have suffered an impairment loss. If it is determined that an impairment loss has been suffered, it is recognised in profit or loss.
Point award schemes
Customer award credits having a predetermined life are granted to customers when they make purchases. The fair value of the consideration on sale of goods resulting in such award credits is allocated between the goods supplied and the award credits granted. The consideration allocated to the award credits is measured by reference to fair value from the standpoint of the holder and revenue is deferred. The Group at the end of each reporting period estimates the number of points redeemed and that it expects will be further redeemed, based on empirical data of redemption /lapses, and revenue is accordingly recognised.
Service tax on renting of immovable properties given for commercial use
As stated in Note 29, the Group has challenged the retrospective levy of service tax on renting of immovable properties given for commercial use and pending the final disposal of the matter, which is presently before the Supreme Court, the Group continues not to provide for the retrospective levy.
Inventories
An inventory provision is recognised for cases where the realisable value is estimated to be lower than the inventory carrying value. The inventory provision is estimated taking into account various factors, including prevailing sales prices of inventory item, the seasonality of the item’s sales profile and losses associated with obsolete / slow-moving inventory items.
Employee Benefits
Provision for employee benefits in the nature of gratuity and unpaid leave balance is estimated on actuarial basis using a number of assumptions which include assumptions for discount rate, future salary increases, mortality rates, attrition rates for employees, return on planned assets etc. Any changes in these assumptions will impact the carrying amount of these provisions. Key assumptions are disclosed in Note 31.
Property Options Receivable
In evaluating the allowance for credit loss against Property Options Receivable, the Group assesses the risk or probability that the cash flows that are due in accordance with the contract may not be received. The expected cashflows are recokned with considering a variety of relevant factors, including the age and past due detail of the receivable, credit enhancements (guarantee’s) that are integral to the contractual terms and confirmed by third parties.
Impairment of Goodwill
Goodwill is initially measured at cost, being the excess of the aggregate of the consideration transferred and the amount recognised for non-controlling interests, and any previous interest held, over the net identifiable assets acquired and liabilities assumed. If the fair value of the net assets acquired is in excess of the aggregate consideration transferred, the Group re-assesses whether it has correctly identified all of the assets acquired and all of the liabilities assumed and reviews the procedures used to measure the amounts to be recognised at the acquisition date. If the reassessment still results in an excess of the fair value of net assets acquired over the aggregate consideration transferred, then the gain is recognised in OCI and accumulated in equity as capital reserve.
Annual Report 2017-2018164
NOTES to the consolidated financial statements for the year ended 31 March 2018
However, if there is no clear evidence of bargain purchase, the entity recognises the gain directly in equity as capital reserve, without routing the same through OCI.After initial recognition, goodwill is measured at cost less any accumulated impairment losses. For the purpose of impairment testing, goodwill acquired in a business combination is, from the acquisition date, allocated to each of theGroup’s cash-generating units that are expected to benefit from the combination, irrespective of whether other assets or liabilities of the acquiree are assigned to those units.
A cash generating unit to which goodwill has been allocated is tested for impairment annually, or more frequently when there is an indication that the unit may be impaired. If the recoverable amount of the
cash generating unit is less than its carrying amount, the impairment loss is allocated first to reduce the carrying amount of any goodwill allocated to the unit and then to the other assets of the unit pro rata based on the carrying amount of each asset in the unit. Any impairment loss for goodwill is recognised in profit or loss. An impairment loss recognised for goodwill is not reversed in subsequent periods. Where goodwill has been allocated to a cash-generating unit and part of the operation within that unit is disposed of, the goodwill associated with the disposed operation is included in the carrying amount of the operation when determining the gain or loss on disposal. Goodwill disposed in these circumstances is measured based on the relative values of the disposed operation and the portion of the cash generating unit retained.

ST
RA
TE
GIC
RE
PO
RT
ST
AT
UT
OR
Y R
EP
OR
TS
FIN
AN
CIA
L S
TA
TE
ME
NT
S
165
NOTES to the consolidated financial statements for the year ended 31 March 2018
(All
amou
nts
in `
Lac
s)
Leas
ehol
d im
prov
emen
ts
Air
cond
ition
ing
and
othe
r eq
uipm
ents
Furn
iture
, fix
ture
s an
d ot
her fi
ttin
gs
Offi
ce
Equi
pmen
tsC
ompu
ters
Vehi
cles
Tota
l PPE
Trad
emar
ks
Soft
war
eG
oodw
illTo
tal
Inta
ngib
le
asse
ts
3.
Prop
erty
, Pla
nt a
nd E
quip
men
t an
d In
tang
ible
Ass
ets
Cos
t or
dee
med
cos
tA
s at
1 A
pril
2016
25,
920.
74
27,
646.
41
23,
315.
04
910
.35
4,3
83.9
1 2
2.21
8
2,19
8.66
1
14.5
3 7
,223
.85
9,76
4.55
17,1
02.9
3A
dditi
ons
2,9
28.3
4 4
,405
.71
3,8
25.2
8 6
38.5
5 2
,652
.52
-
14,
450.
40
4.4
9 2
,525
.58
- 2
,530
.07
Dis
posa
l (2
,612
.03)
(2,8
74.0
6) (2
,657
.06)
(127
.08)
(714
.32)
-
(8,9
84.5
5) (0
.09)
(43.
68)
- (4
3.77
)A
s at
31
Mar
ch 2
017
26,
237.
05
29,
178.
06
24
,483
.27
1,4
21.8
2 6
,322
.11
22.
21
87,
664
.51
118
.93
9,7
05.7
5 9,
764
.55
19,5
89.2
3A
dditi
ons
3,1
93.2
4 3
,266
.59
3,7
22.6
0 3
60.2
4 1
,349
.72
-
11,
892.
40
14.
93
2,6
27.8
5 -
2,6
42.7
8 D
ispo
sal
(6,1
24.2
3) (9
,242
.28)
(5,5
78.0
5) (3
04.0
8) (2
,068
.36)
-
(23,
317.
00)
-
(1,8
37.5
5)(8
,799
.19)
(10,
636.
74)
As
at 3
1 M
arch
201
8 2
3,30
6.06
2
3,20
2.37
2
2,62
7.82
1
,477
.98
5,6
03.4
7 2
2.21
7
6,23
9.91
1
33.8
6 1
0,4
96.0
5 96
5.36
11,5
95.2
7A
ccum
ulat
ed D
epre
ciat
ion
As
at 1
Apr
il 20
16 (1
,801
.51)
(1,7
88.3
2) (2
,728
.14)
(163
.63)
(800
.07)
37.
73
(7,2
43.9
4) (2
6.02
) (1
,337
.63)
- (1
,363
.65)
Dep
reci
atio
n an
d am
ortis
atio
n ex
pens
e fo
r the
yea
r (R
efer
not
e iii
, v)
(2,9
14.1
6) (3
,688
.07)
(4,7
14.3
6) (3
88.1
6) (1
,391
.39)
(8.2
4) (1
3,10
4.38
) (2
4.09
) (1
,971
.24)
- (1
,995
.33)
Dis
posa
l 2
,560
.23
2,7
64.6
0 2
,499
.49
123
.83
709
.75
-
8,6
57.9
0 0
.09
43.
68
- 4
3.77
A
s at
31
Mar
ch 2
017
(2,1
55.4
4)
(2,7
11.7
9) (4
,94
3.01
) (4
27.9
6) (1
,481
.71)
29.
49
(11,
690.
42)
(50.
02)
(3,2
65.1
9)-
(3,3
15.2
1)D
epre
ciat
ion
and
amor
tisat
ion
expe
nse
for t
he y
ear
(Ref
er n
ote
iii)
(2,4
88.2
1) (2
,485
.61)
(3,3
22.2
6) (2
98.3
9) (1
,205
.56)
(8.2
4) (9
,808
.26)
(17.
00)
(1,6
65.2
0)-
(1,6
82.2
0)D
ispo
sal
931
.61
1,7
09.7
5 1
,687
.00
94.
45
817
.77
-
5,2
40.5
8 -
6
84.2
1 -
684
.21
As
at 3
1 M
arch
201
8 (3
,712
.04
) (3
,487
.65)
(6,5
78.2
7) (6
31.9
0) (1
,869
.50)
21.
25
(16,
258.
10)
(67.
02)
(4,2
46.
18)
- (4
,313
.20)
Net
Boo
k Va
lue
As
at 3
1 M
arch
201
7 2
4,08
1.62
2
6,46
6.27
1
9,54
0.25
9
93.8
6 4
,840
.41
51.
70
75,
974.
10
68.
91
6,4
40.5
6 9,
764.
55 1
6,27
4.02
As
at 3
1 M
arch
201
8 1
9,59
4.02
1
9,71
4.72
1
6,04
9.55
8
46.0
8 3
,733
.97
43.
46
59,
981.
81
66.
84
6,2
49.8
7 96
5.36
7,28
2.07
Not
e:i)
M
ovab
le a
sset
s ha
ve b
een
pled
ged
to s
ecur
e bo
rrow
ings
of t
he C
ompa
ny (R
efer
Not
e 14
).ii)
In
tang
ible
ass
ets
mai
nly
incl
udes
com
pute
r sof
twar
es w
here
the
rem
aini
ng u
sefu
l life
rang
ing
from
1 y
ear t
o 6
year
s.iii
) D
epre
ciat
ion
for t
he y
ear i
nclu
des
acce
lera
ted
amou
nts
aggr
egat
ing
to `
1,71
2.40
Lac
s (2
017:
`2,
937.
27 L
acs)
on
acco
unt o
f cha
nge
in e
stim
ate
of u
sefu
l liv
es o
f pro
pert
y, p
lant
& e
quip
men
t re
sulti
ng fr
om s
tore
clo
sure
s /
shift
ing
prem
ises
.iv
) D
urin
g th
e C
ompa
ny h
as c
apita
lised
the
follo
win
g ex
pens
es to
cos
t of P
rope
rty,
pla
nt a
nd e
quip
emen
t.
(All
amou
nts
in `
Lac
s)A
s at
31
Mar
ch 2
018
As
at
31 M
arch
201
7Em
ploy
ee C
osts
306.
8532
7.11
Trav
ellin
g43
.34
31.1
2C
onsu
ltanc
y35
1.03
408.
55M
isce
llano
us e
xpen
ditu
re56
.96
43.0
1To
tal
758
.18
809
.79
v)
FY 2
016-
17 in
clud
es d
epre
ciat
ion
of d
isco
ntin
ued
oper
atio
ns a
mou
nt to
`2,
245.
59 la
cs

Annual Report 2017-2018166
NOTES to the consolidated financial statements for the year ended 31 March 2018
(All amounts in ` Lacs)
Capital work-in -progress
Intangible assets under development
3.1 Capital work-in-progress and Intangible assets under development Cost or deemed costAs at 31 March 2016 3,212.64 120.73 Additions 8,837.66 2,508.42 Capitalisation (10,577.97) (2,101.56)As at 31 March 2017 1,472.33 527.59 Additions 9,629.20 1,879.20 Capitalisation* (9,567.36) (2,125.49)As at 31 March 2018 1,534.17 281.30 * Includes Hypercity Retail (India) Ltd. (Refer Note 34)
(All amounts in ` Lacs)As at As at
31 March 2018 31 March 20174. Investments – Non Currenta) (Unquoted at cost unless otherwise stated)
Investments in equity instrumentsi) In Joint Ventures
Nuance Group (India) Private Limited, Refer Note 35(b)(i) - 1,862.71 Nil (2017: 414,10,000) Equity Shares of ` 10/- each Fully PaidLess: Impairment in the value - 1,282.71
- 580.00 Timezone Entertainment Private Limited, Refer Note 35(b)(i) - 1,404.20 Nil (2017: 244,46,247) Equity Shares of ` 10/- each Fully Paid
- 1,404.20 ii) Other investments
(At fair value through Profit and Loss)Stargaze Properties Private Limited 0.10 0.10 1,000 (2017: 1,000) equity shares of ` 10/- each Fully paid Retailers Association of India 1.00 1.00 10,000 (2017:10,000) equity shares of ` 10/- each Fully paidAesthetic Realtors Private Limited66 (2017: 66) Equity Shares of ` 10/- each Fully Paid 0.01 0.01 Less: Provision for diminution in the value of investments (0.01) (0.01)
- - Retailers Association's Skill Council of India 0.50 0.50 500 (2017: 500) equity shares of ` 100/- each Fully paidNuance Group Fashion & Luxury Duty Free Private Limited - 0.05 Nil (2017: 500) equity shares of `10/- each Fully paidTotal (A) 1.60 1,985.85 Aggregate amount of impairment in value of unquoted equity investments 0.01 1,282.72
b) Quoted (fair value through Other Comprehensive Income)Investments in equity instrumentsFuture Retail Limited, Refer Note 35(a)47,56,823 (2017: Nil) equity shares of ` 2/- each Fully paid, Refer Note 30 26,241.01 - Total (B) 26,241.01 - Aggregate amount of impairment in value of quoted equity investments - -Total (A) + (B) 26,242.61 1,985.85

ST
RA
TE
GIC
RE
PO
RT
ST
AT
UT
OR
Y R
EP
OR
TS
FIN
AN
CIA
L S
TA
TE
ME
NT
S
167
NOTES to the consolidated financial statements for the year ended 31 March 2018
(All amounts in ` Lacs)As at As at
31 March 2018 31 March 20174. Investments – Current
Quoted (At fair value through Profit and Loss)Investments in mutual fundsQuotedL & T Mutual Fund 600.97 - 25,220 (2017: Nil) units in Liquid fund – Direct Growth PlanICICI Prudential Mutual Fund 600.73 - 2,49,970 (2017: Nil) units in Money market fund – Direct Growth PlanJM Financial Mutual Fund High Liquidity fund – Direct - Growth 200.35 - 42,115 (2017: Nil) units in High Liquidity fund – Direct Growth PlanAxis Mutual Fund 601.50 - 31,187 (2017: Nil) units in Liquid fund – Direct Growth planTotal 2,003.55 - Aggregate value of quoted investment 26,241.01 - Aggregate value of unquoted investment 2,005.15 1,985.85 Aggregate amount of impairment in value of investments 0.01 1,282.72
(All amounts in ` Lacs)As at
31 March 2018 As at
31 March 20175. Trade receivables(Secured, considered good)Non-current Receivables – property option sold* - 11,000.57
- 11,000.57Current(Unsecured)Considered good 4,771.73 5,682.70 Considered doubtful 60.46 150.64
4,832.19 5,833.34 Less: Impairment allowance for doubtful debts 60.47 150.64
4,771.72 5,682.68 * Guaranteed under contract by a Company of the promoter shareholder group with further assurance from a promoter / director.
5.1 Trade receivables are stated at amortised cost.5.2 These financial assets have been pledged to secure borrowings of the Company (See Note 14).5.3 No trade or other receivables are due from directors or other office of the Company either severally or jointly with any
other persons. 5.4 For terms and conditions relating to related party receivables, Refer Note No. 32.5.5 Trade receivables are non interest bearing and are generally on terms of 30 to 120 days.
(All amounts in ` Lacs)As at
31 March 2018 As at
31 March 20176. Other Financial Assets(unsecured)Non-currentPremises and other deposits - Considered good 11,842.85 16,319.67 - Considered doubtful 357.38 395.35
12,200.23 16,715.02 Less: Allowance for doubtful deposits 357.38 395.35
11,842.85 16,319.67 Other Bank Balance- Bank deposits more than 12 months maturity from balance sheet date 114.09 -
11,956.94 16,319.67

Annual Report 2017-2018168
NOTES to the consolidated financial statements for the year ended 31 March 2018
(All amounts in ` Lacs)As at
31 March 2018 As at
31 March 2017CurrentAdvances for goods and rendering of services to be received:- Considered good - 3,722.42 - Considered doubtful - 795.90
- 4,518.32 Less: Provision for doubtful advances - 795.90
- 3,722.42 Advances to employees 108.99 321.49 Premises and other deposits 154.39 - Other Receivables- Considered good 325.44 - - Considered doubtful 344.94 -
670.38 - Less: Provision for doubtful advances 344.94 -
325.44 - 588.82 4,043.91
6.1 These are carried at amortised cost.6.2 These financial assets have been pledged to secure borrowings of the Company (Refer Note 14).
(All amounts in ` Lacs)As at
31 March 2018 As at
31 March 20177. Deferred tax assets / Liabilities (net)Deferred tax assets 1,987.77 1,168.29 Deferred tax liabilities (10.17) (739.07)
1,977.60 429.22
Balance Sheet Statement of Profit and LossAs at
31 March 2018As at
31 March 2017Year ended
31 March 2018Year ended
31 March 20177.1 Deferrred tax assets / (liabilities) in relation to:Deferred tax LiabilitiesProperty, plant and equipment & Intangible assets (10.17) (739.07) (728.90) (31.15)
Deferred tax AssetsProvision for doubtful debts / advances 437.22 344.21 (93.00) 114.88 Provision for expenses 372.41 145.04 (227.39) 13.07 Employee benefits 358.40 397.17 38.77 144.00 Deferred Revenue on point reward schemes 64.30 151.90 87.61 (234.34)Lease Deposits 176.48 129.97 (46.51) 61.96 MTM on Future Retail Ltd. Shares 72.47 - (72.47) - Short Term Capital Loss 506.49 - (506.49) - Net deferred tax assets / (liabilities) 1,977.60 429.22 (1,548.38) 68.42
Deferred tax (liabilities)/assets in relation to certain subsidiaries:Property, plant and equipment & Intangible assets 124.00 (467.22) - 142.56Unused tax losses# 869.00 467.22 - (142.56)Employee benefits 11.00 - - -Defffered tax assets/ (liabilities) (net)## 1,004.00 - - -
#To the extent of deferred tax liability on Property, plant and requirement & intangibles assets ## In the absence of convincing evidence, the Company has not recognized deferred tax assets (DTA) on timing differences arising on the above mentioned items.

ST
RA
TE
GIC
RE
PO
RT
ST
AT
UT
OR
Y R
EP
OR
TS
FIN
AN
CIA
L S
TA
TE
ME
NT
S
169
NOTES to the consolidated financial statements for the year ended 31 March 2018
Balance SheetAs at
31 March 2018As at
31 March 20177.2 Unrecognised deductible temporaru differences in respect of certain subsidiariesUnused tax losses 869.00 21,015.20
(All amounts in ` Lacs)As at
31 March 2018 As at
31 March 20178. Other Assets(Unsecured, considered good)Non-currentCapital Advances 930.78 843.98Service tax deposited under protest (Note 29) 3,635.03 4,251.23Advance income tax (net of provision) 1,210.52 1,139.78Prepaid Expenses 3,898.04 3,715.73Other receivables 3.75 -
9,678.12 9,950.72CurrentRecoverables – Statutory dues 10,508.43 1,448.96Advance for Goods & Services -- Considered good 3,723.86 2,018.45- Considered doubtful 309.69 -
4,033.55 2,018.45Less: Allowance for doubtful advances 309.69 -
3,723.86 2,018.45Prepaid Expenses 1,710.00 -Other assets- Considered good 285.55 -- Considered doubtful 236.00 -
521.55 -Less: Allowance for doubtful assets 236.00 -
285.55 - 16,227.84 3,467.41
(All amounts in ` Lacs)As at
31 March 2018 As at
31 March 20179. Inventories(At lower of cost and Net realisable value) 35,631.57 51,471.07Stock-in-trade: Retail merchandise - 6,285.12 Property options 35,631.57 57,756.19
9.1 Inventories have been pledged as security for borrowings. (Refer Note 14)9.2 The mode of valuation of inventories has been stated in Note 2.5.
9.3 Stock in tradeContinuing operations 35,631.57 38,109.48Discontinuing options** - 19,646.71
35,631.57 57,756.19
** includes property options

Annual Report 2017-2018170
NOTES to the consolidated financial statements for the year ended 31 March 2018
(All amounts in ` Lacs)As at
31 March 2018 As at
31 March 201710. Cash and cash equivalentsBalance with banks In - Current accounts 120.74 201.31- Deposit accounts 5.22 5.01 Cash on hand 408.92 341.51
534.88 547.83
10.1 These financial assets have been pledged to secure borrowings of the Company (See Note 14).10.2 Short term deposits are made for varying periods of between one day and three months, depending on the
immediate cash requirements of the Company, and earn interest at the respective short term deposit rates.10.3 For the purpose of Statement of cash flow, Cash and cash equivalents comprise the followings:
As at 31 March 2018
As at 31 March 2017
Balance with banks In 120.74 201.31 - Current accounts 5.22 5.01 - Deposit accounts 408.92 341.51 Cash on hand 534.88 547.83
(3,834.77) (13,046.34)Less: Bank overdraft / Cash credit (Refer Note 14.3) (3,299.89) (12,498.51)
(All amounts in ` Lacs)As at
31 March 2018 As at
31 March 201711. Other bank balancesMargin money account (under lien against bank guarantee) 68.42 212.71 Earmarked accounts (for unpaid dividend) 0.38 0.38
68.80 213.09
(All amounts in ` Lacs)As at
31 March 2018 As at
31 March 201712. Share capital12.1 Authorised200,000,000 equity shares of ` 5/- each 10,000.00 10,000.00 12.2 Issued, subscribed and fully paid-up shares87,960,689 (31.3.2017: 83,504,744) equity shares of ` 5/- each fully paid-up 4,398.03 4,175.24
4,398.03 4,175.24
12.3 Reconciliation of number of equity shares:
Particulars:31 March 2018 31 March 2017
Numbers ` Lacs Numbers ` LacsBalance at the beginning of the year 83,504,744 4,175.24 83,461,946 4,173.10 Issued during the year (Refer Note 12.6) 4,455,945 222.79 42,798 2.14 Balance at the end of the year 87,960,689 4,398.03 83,504,744 4,175.24

ST
RA
TE
GIC
RE
PO
RT
ST
AT
UT
OR
Y R
EP
OR
TS
FIN
AN
CIA
L S
TA
TE
ME
NT
S
171
NOTES to the consolidated financial statements for the year ended 31 March 2018
12.4 Details of shareholders holding more than 5% shares as at 31 March:
Name of the Shareholder As at 31 March 2018 As at 31 March 2017
Shares held (Nos)
Shares held (%)Shares held
(Nos)Shares held (%)
Palm Shelter Estate Development LLP 11,813,300 13.43% 11,813,300 14.15%Anbee Construction LLP 10,386,401 11.81% 10,386,401 12.44%Cape Trading LLP 10,386,401 11.81% 10,386,401 12.44%Reliance Capital Trustee Co. Ltd. A/C Reliance Equity Opportunities Fund
6,346,491 7.22% 6,225,905 7.46%
Raghukool Estate Development LLP 5,593,300 6.36% 5,593,300 6.70%Capstan Trading LLP 5,459,768 6.21% 5,459,768 6.54%Casa Maria Properties LLP 5,253,300 5.98% 5,253,300 6.29%
12.5 The Company has one class of equity shares having a par value of `5 per share. Each equity shareholder is eligible for one vote per share held. Each equity shareholder is entitled to dividends as and when the Company declares and pays dividend after obtaining shareholders’ approval. In the event of liquidation of the Company, the holders of equity shares will be entitled to receive the remaining assets of the Company, after distribution of all preferential amounts. The distribution will be in proportion to the number of equity shares held by the shareholders.
12.6 The Board of Directors and the shareholders of the Company at their meetings held on 23 September 2017 and 18 October 2017 respectively have approved issue of 43,95,925 equity shares of `5 each at an issue price of ` 407.78 per equity share to Amazon.com NV Investment Holdings LLC, on a preferential basis. On 12 January, 2018, the Company has allotted these equity shares, which are pari passu in all respect.
The Company has issued and allotted shares under Share options schemes to certain employees-Refer Note 36
(All amounts in ` Lacs)As at
31 March 2018 As at
31 March 201713. Other equitySecurities Premium Account 65,439.81 47,521.31 General Reserves 2,329.18 1,909.18 Retained earnings 18,215.47 (6,329.80)Debenture Redemption Reserve - 420.00 Share options outstanding account 61.50 226.95
86,045.96 43,747.64
For addition and deductions under each of the above heads refer Statement of changes in equity.
13.1 Securities premium account Securities premium account is used to record the premium received on issue of shares. The securities premium can
be utilised only in accordance with the provisions of the Companies Act, 2013.
13.2 General reserve The General Reserve is used from time to time to transfer profits from Retained earnings for appropriate purposes.
As the General Reserve is created by a transfer from one component of equity to another and is not an item of Other comprehensive income, items included in the General Reserve will not be reclassified subsequently to Profit or Loss.
13.3 Share options outstanding account The above reserve relates to Share options granted by the Company to its employees under its employee share option
plan. Further information about share based payments to employees is set out in note 36.
13.4 Debenture Redemption Reserve 2017: Hypercity had issued Non-convertible debentures. Accordingly, the Companies (Share Capital and Debentures)
Rules, 2014 (as amended), require the Company to create Debenture Redemption Reserve (DRR) out of profits of the Company available for payment of dividend. DRR is required to be created @ 25% of the value of Debentures over the life of the Debentures.

Annual Report 2017-2018172
NOTES to the consolidated financial statements for the year ended 31 March 2018
(All amounts in ` Lacs)As at
31 March 2018 As at
31 March 201714. BorrowingsNon-currentNon-Convertible Debentures (secured) - 5,000.00 Term loans (Secured) from banks 8,700.11 55,610.26 Less: Current maturities (Note 15) 4,300.03 26,014.62
4,400.08 34,595.64 Unsecured Loan from Banks - 2,500.00
4,400.08 37,095.64 These are carried at amortised cost.14.1 Term loans are secured by a first Pari Passu charge on stocks, book debts, hypothecaton charge on credit card/debit
card receivables (Escrow account) and all the movable fixed assets of the Company, both Present & Future except ICICI Bank Term loans which is secured by first Pari Passu charge on the current assets and all the movable fixed assets of the Company both Present & Future excluding leasehold rights,lease deposits & Shoppers Stop Brands.
Term loans availed by Crossword Bookstores Ltd. amounting to ̀ 423 Lacs (2017: ̀ 483 Lacs) have corporate guarantees, joint and serveral, given by the Company and promoter group.
Term loans are availed by Hypercity Retail (India) Ltd. amounting to ` 8,115.62 Lacs in previous year are secured by first pari passu charge on movable fixed assets, present and future, second pari passu charge on the current assets of the Company, subservient charge on the receivable and Corporate guarantees of K. Raheja Corp Pvt. Ltd. and Shoppers Stop Limited.
Non-convertible debentures of Hypercity are secured by first pari passu charge on movable fixed assets to the extent of 0.80 times of the issue amount, first pari passu charge on current assets to the extent of 0.20 times of the issue amount and second pari passu charge escrow account for card receivables.
14.2 Terms of the Facilities:-
Name of the Bank Rate of Interest Repayment Schedule 31 March 2018 31 March 2017Non Current BorrowingsHDFC Bank Nil (2017: 10.40%) 12 quarterly equal instalments from
10 January 2015. - 1,249.70
HDFC Bank Nil (2017: 10.40%) 14 equal quarterly instalments from 01 June 2015.
- 1,070.60
HDFC Bank Nil (2017: 9.50%) 12 equal quarterly instalments from 30 June 2017
- 4,993.56
ICICI Bank Nil (2017: 9.70%) 15 equal quarterly instalments from 01 September 2014.
- 1,332.69
ICICI Bank Nil (2017: 9.70%) 12 equal quarterly instalments from 1 December 2015.
- 5,788.06
IDBI Bank 9.45% (2017: 9.95%) 10 equal quarterly instalments from 09 December 2017.
7,976.77 9,992.48
Kotak Mahindra Bank Nil (2017: 10.40%) 12 equal quarterly instalments from 8 December 2015
- 2,500.00
Kotak Mahindra Bank Nil (2017: 9.75%) Repayable on 30 September 2017. - 2,000.00 Kotak Mahindra Bank Nil (2017:9.25%) Repayable in 12 equal quarterly
instalments from 03 December 2017 - 4,992.22
Abu Dhabi Commercial Bank Nil (2017: 10.25%) 12 equal quarterly instalments from 10 September 2016
- 3,375.00
Kotak Mahindra Bank Limited - Term loan
Nil (2017: 11.95%) 04 equal quarterly instalments from 26 June 2017 to 26 March 2018.
- 1,100.00
Kotak Mahindra Bank Limited - Working capital term loan
Nil (2017: 10.50%) 8 equal quarterly instalments from 03 June 2017 to 03 March 2019.
- 2,497.33
ICICI Bank Limited - Term loan
Nil (2017: 12.07%) 5 equal quarterly instalments from 09 June 2017 to 09 June 2018.
- 2,081.02
ICICI Bank Limited - Term loan-II
Nil (2017: 10.85%) 12 equal quarterly instalments from 22 March 2018 to 22 December 2020.
- 2,493.47

ST
RA
TE
GIC
RE
PO
RT
ST
AT
UT
OR
Y R
EP
OR
TS
FIN
AN
CIA
L S
TA
TE
ME
NT
S
173
NOTES to the consolidated financial statements for the year ended 31 March 2018
Name of the Bank Rate of Interest Repayment Schedule 31 March 2018 31 March 2017Non Current BorrowingsICICI Bank Limited - Term loan-III
Nil (2017: 10.30%) 10 equal quarterly installment from 08 March 2018, of `150 lacs till 08 June 2020
- 1,495.53
ICICI Bank Limited - Term loan-IV
Nil (2017: 10.05%) 10 equal quarterly installment from 08 March 2018, of `150 lacs till 08 June 2020
- 1,494.68
ICICI Bank Limited - Term loan-V
Nil (2017: 9.40%) 10 equal quarterly installment from 31 December 2018, of `700 lacs till 31 March 2021.
- 6,985.01
Yes Bank Limited - Term loan-II
Nil (2017: 10.50%) Bullet repayment repayable on 24 April 2018.
- 2,000.00
Non Convertible Debentures Nil (2017: 11.60%) Bullet repayment repayable on 19 September 2017.
- 4,993.91
Kotak Mahindra Bank 10.20% (Previous year: 11.05%)
12 equally quarterly Instalments from 1 August, 2016 to 31 May 2019
208.34 375.00
Kotak Mahindra Bank 9.80% (Previous year: Nil)
Repayable in 12 Equated quarterly Instalments from February, 2018 to November 2020
275.00 300.00
Kotak Mahindra Bank 10% Repayable in 36 Equated quarterly Instalments from November, 2018 to October 2021.
240.00 -
Total Non-current borrowings
8,700.11 63,110.26
Current maturities of long-term borrowingsHDFC Bank Nil (2017: 10.40%) 12 quarterly equal instalments from 10
January 2015. - 1,250.01
HDFC Bank Nil (2017: 10.40%) 14 equal quarterly instalments from 1 June 2015.
- 714.29
HDFC Bank Nil (2017: 9.50%) 12 equal quarterly instalments from 30 June 2017.
- 1,666.67
ICICI Bank Nil (2017: 9.70%) 15 equal quarterly instalments from 01 September 2014.
- 1,333.33
ICICI Bank Nil (2017: 9.70%) 12 equal quarterly instalments from 01 December 2015.
- 3,333.34
IDBI Bank 9.45% (2017: 9.95%) 10 equal quarterly instalments from 09 December 2017.
4,000.00 2,000.00
Kotak Mahindra Bank Nil (2017: 10.40%) 12 equal quarterly instalments from 08 December 2015
- 1,666.66
Kotak Mahindra Bank Nil (2017: 9.75%) Repayable on 30 September 2017. - 2,000.00 Kotak Mahindra Bank Nil (2017:9.25%) Repayable in 12 equal quarterly
instalments from 03 December 2017 - 833.33
Abu Dhabi Commercial Bank Nil (2017: 10.25%) 12 equal quarterly instalments from 10 September 2016
- 1,500.00
Kotak Mahindra Bank 10.20% (Previous year: 11.05%)
12 equal quarterly Instalments from 01 August, 2016 to 31 May 2019
166.68 166.67
Kotak Mahindra Bank 9.80% (Previous year: Nil)
Repayable in 12 equal quarterly Instalments from Feb, 2018 to November 2020
100.00 25.00
Kotak Mahindra Bank 10% (Previous year: Nil)
Repayable in 36 equal quarterly Instalments from Nov, 2018 to October 2021.
33.35 -
Kotak Mahindra Bank Limited - Term loan
Nil (2017: 11.95%) 4 equal quarterly instalments from 26 June 2017 to 26 March 2018.
- 1,100.00
Kotak Mahindra Bank Limited - Working capital term loan (unsecured)
Nil (2017: 10.50%) 8 equal quarterly instalments from 03 June 2017 to 03 March 2019.
- 1,250.00
ICICI Bank Limited - Term loan
Nil (2017: 12.07%) 5 equal quarterly instalments from 09 June 2017 to 09 June 2018.
- 1,667.00
ICICI Bank Limited - Term loan-II
Nil (2017: 10.85%) 12 equal quarterly instalments from 22 March 2018 to 22 December 2020.
- 214.41
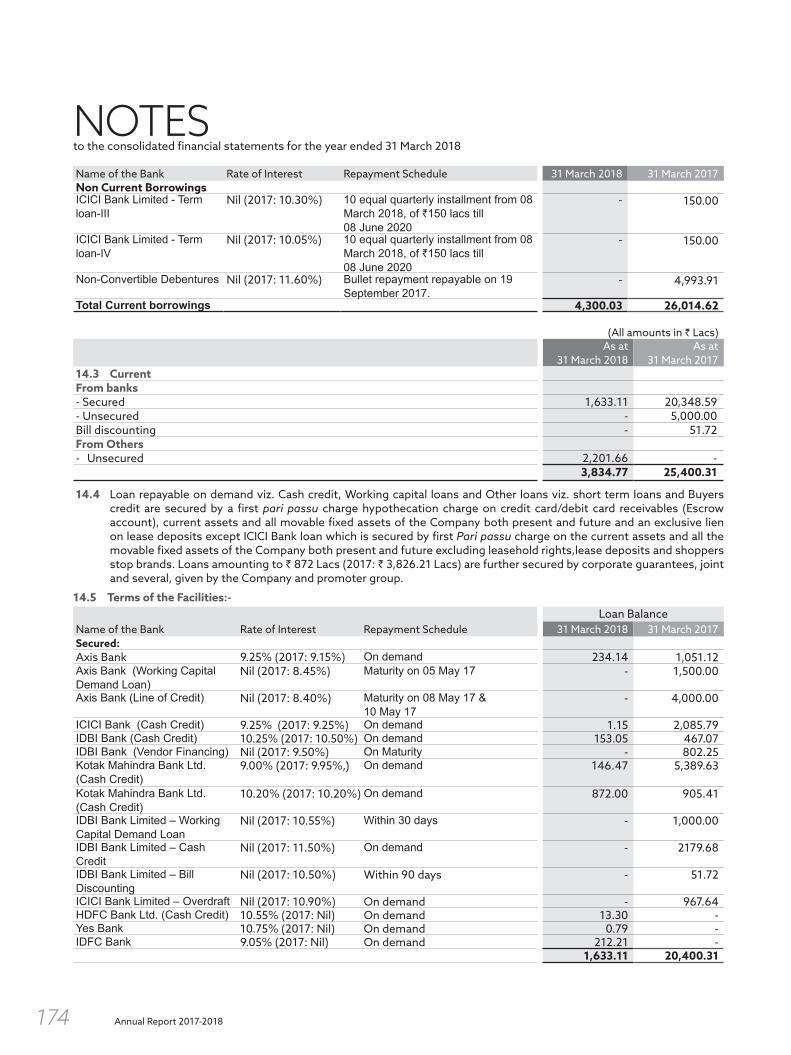
Annual Report 2017-2018174
NOTES to the consolidated financial statements for the year ended 31 March 2018
Name of the Bank Rate of Interest Repayment Schedule 31 March 2018 31 March 2017Non Current BorrowingsICICI Bank Limited - Term loan-III
Nil (2017: 10.30%) 10 equal quarterly installment from 08 March 2018, of `150 lacs till 08 June 2020
- 150.00
ICICI Bank Limited - Term loan-IV
Nil (2017: 10.05%) 10 equal quarterly installment from 08 March 2018, of `150 lacs till 08 June 2020
- 150.00
Non-Convertible Debentures Nil (2017: 11.60%) Bullet repayment repayable on 19 September 2017.
- 4,993.91
Total Current borrowings 4,300.03 26,014.62
(All amounts in ` Lacs)As at
31 March 2018 As at
31 March 201714.3 CurrentFrom banks- Secured 1,633.11 20,348.59 - Unsecured - 5,000.00 Bill discounting - 51.72 From Others - Unsecured 2,201.66 -
3,834.77 25,400.31
14.4 Loan repayable on demand viz. Cash credit, Working capital loans and Other loans viz. short term loans and Buyers credit are secured by a first pari passu charge hypothecation charge on credit card/debit card receivables (Escrow account), current assets and all movable fixed assets of the Company both present and future and an exclusive lien on lease deposits except ICICI Bank loan which is secured by first Pari passu charge on the current assets and all the movable fixed assets of the Company both present and future excluding leasehold rights,lease deposits and shoppers stop brands. Loans amounting to ` 872 Lacs (2017: ` 3,826.21 Lacs) are further secured by corporate guarantees, joint and several, given by the Company and promoter group.
14.5 Terms of the Facilities:- Loan Balance
Name of the Bank Rate of Interest Repayment Schedule 31 March 2018 31 March 2017Secured:Axis Bank 9.25% (2017: 9.15%) On demand 234.14 1,051.12 Axis Bank (Working Capital Demand Loan)
Nil (2017: 8.45%) Maturity on 05 May 17 - 1,500.00
Axis Bank (Line of Credit) Nil (2017: 8.40%) Maturity on 08 May 17 & 10 May 17
- 4,000.00
ICICI Bank (Cash Credit) 9.25% (2017: 9.25%) On demand 1.15 2,085.79 IDBI Bank (Cash Credit) 10.25% (2017: 10.50%) On demand 153.05 467.07 IDBI Bank (Vendor Financing) Nil (2017: 9.50%) On Maturity - 802.25 Kotak Mahindra Bank Ltd. (Cash Credit)
9.00% (2017: 9.95%,) On demand 146.47 5,389.63
Kotak Mahindra Bank Ltd. (Cash Credit)
10.20% (2017: 10.20%) On demand 872.00 905.41
IDBI Bank Limited – Working Capital Demand Loan
Nil (2017: 10.55%) Within 30 days - 1,000.00
IDBI Bank Limited – Cash Credit
Nil (2017: 11.50%) On demand - 2179.68
IDBI Bank Limited – Bill Discounting
Nil (2017: 10.50%) Within 90 days - 51.72
ICICI Bank Limited – Overdraft Nil (2017: 10.90%) On demand - 967.64HDFC Bank Ltd. (Cash Credit) 10.55% (2017: Nil) On demand 13.30 - Yes Bank 10.75% (2017: Nil) On demand 0.79 - IDFC Bank 9.05% (2017: Nil) On demand 212.21 -
1,633.11 20,400.31

ST
RA
TE
GIC
RE
PO
RT
ST
AT
UT
OR
Y R
EP
OR
TS
FIN
AN
CIA
L S
TA
TE
ME
NT
S
175
NOTES to the consolidated financial statements for the year ended 31 March 2018
Loan Balance Name of the Bank Rate of Interest Repayment Schedule 31 March 2018 31 March 2017UnsecuredFrom banks ICICI Bank (One Time STL) Unsecured
Nil (2017: 8.40%) Maturity on 07 June 2017, For 2016 Nil, For 2015 Nil.
- 5,000.00
From other partiesHypercity Retail (India) Limited 10.75% (2017: Nil) On demand 2,201.66 -
2,201.66 5,000.00
(All amounts in ` Lacs)As at
31 March 2018 As at
31 March 201715. Other financial liabilities – Non currentSecurity deposits 61.40 -
61.40 -
(All amounts in ` Lacs)As at
31 March 2018 As at
31 March 201715.1 Other financial liabilities – currentOther financial liabilities measured at amortised costCurrent maturities of long term borrowings 4,300.03 26,014.62 Interest accrued and not due on borrowings 6.37 397.74 Unpaid dividends 0.38 0.38 Creditors for capital expenditure 2,337.84 1,399.57 Accrued payroll 1,516.14 2,463.49 Security deposits 98.15 500.18
8,258.91 30,775.98
(All amounts in ` Lacs)As at
31 March 2018 As at
31 March 201716. Trade payablesRetail Merchandise:- Total outstanding dues of micro enterprises and small enterprises 460.18 713.88 - Total outstanding dues of creditors other than micro enterprises and small enterprises 51,446.63 47,994.40 Property options:- Total outstanding dues of creditors other than micro enterprises and small enterprises - 372.28
51,906.81 49,080.56
16.1 There are no Micro and Small Enterprises, to whom the Company owes dues which are outstanding for more than 45 days during the year. This information as required to be disclosed under the Micro, Small and Medium Enterprise Development Act, 2006 has been determined to the extent such parties have been identified on the basis of information available with the Company.

Annual Report 2017-2018176
NOTES to the consolidated financial statements for the year ended 31 March 2018
(All amounts in ` Lacs)As at
31 March 2018 As at
31 March 201717. Provisions – current Provision for employee benefits:Gratuity 193.22 298.83 Leave Encashment 628.60 703.89
821.82 1,002.72
(All amounts in ` Lacs)As at
31 March 2018 As at
31 March 201718. Other current liabilities Statutory liabilities 7,798.27 2,656.90 Advance from customers 135.74 98.15 Award schemes and gift vouchers 10,973.86 11,090.98 Others 126.15 -
19,034.02 13,846.03
(All amounts in ` Lacs)For the year
ended 31 March 2018
For the year ended
31 March 201719. Revenue from operations Retail Sale of Merchandise Own merchandise – Gross of tax 397,242.81 377,746.02 Concessionaire / Consignment merchandise - Gross of tax 26,259.14 32,595.04
423,501.95 410,341.06 Less: Goods & Service tax / Value added tax 42,536.57 19,451.70 Less: Cost of concessionaire / consignment merchandise 17,497.26 21,838.13
363,468.12 369,051.23 Other Retail operating revenueFacility management fees 2,578.98 2,617.58 Income from store displays and sponsorship 631.69 650.42 Gift Vouchers lapsed 1,721.92 1,765.52 Direct marketing 1,059.72 1,188.69 Income from franchisees 212.00 173.43 Other - 243.47
6,204.31 6,639.11 369,672.43 375,690.34
(All amounts in ` Lacs)For the year
ended 31 March 2018
For the year ended
31 March 201719.1 The gross retail volume of business and operations comprise:- 397,242.81 377,746.02 Own merchandise 26,259.14 32,595.04 Concessionaire / Consignment merchandise 6,204.31 6,639.11 Other Retail operating revenue 429,706.26 416,980.17

ST
RA
TE
GIC
RE
PO
RT
ST
AT
UT
OR
Y R
EP
OR
TS
FIN
AN
CIA
L S
TA
TE
ME
NT
S
177
NOTES to the consolidated financial statements for the year ended 31 March 2018
(All amounts in ` Lacs)For the year
ended 31 March 2018
For the year ended
31 March 201720. Other income Interest on financial assets: On lease deposits measured at amortised cost 1,388.52 2,698.16 Bank deposits 69.56 55.62 On income tax refund - 1.12 Miscellaneous income 193.28 371.03 Profit on sale of fixed assets 1.74 0.93
1,653.10 3,126.86
(All amounts in ` Lacs)For the year
ended 31 March 2018
For the year ended
31 March 201721a. Purchase of Stock-in-trade Retail Merchandise 224,315.09 231,274.10
(A) 224,315.09 231,274.10 21b. Changes in inventories of stock-in-tradeOpening inventory - Retail merchandise 38,109.48 41,310.69 Closing inventory- Retail merchandise 35,631.57 38,109.47 (Increase) (B) 2,477.91 3,201.22 21c. Cost of inventories recognised as an expenses* (A)+(B) 226,793.00 234,475.32 * Includes write-downs / offs (net) of inventory to net realisable value on account of old
season stock and shrinkages. 1,264.33 1,577.83
(All amounts in ` Lacs)For the year
ended 31 March 2018
For the year ended
31 March 201722. Employee Benefits ExpenseSalaries, allowance and bonus 28,582.86 26,250.11 Contribution to Provident and other funds (Refer Note 31) 1,969.05 1,776.27 Share-based payments to employees* 10.63 65.22 Staff welfare expenses 1,003.79 635.17
31,566.33 28,726.77 * Measured at fair value
22.1 For details of share options granted by the Company to the certain employees, Refer Note 36.
(All amounts in ` Lacs)For the year
ended 31 March 2018
For the year ended
31 March 201723. Finance costsInterest on borrowings 3,700.00 5,799.64 Bank charges 68.46 198.05
3,768.46 5,997.69

Annual Report 2017-2018178
NOTES to the consolidated financial statements for the year ended 31 March 2018
(All amounts in ` Lacs)For the year
ended 31 March 2018
For the year ended
31 March 201724. Other expensesLease rent and hire Charges (Note 26) 37,655.89 36,418.54 Business conducting fees 1,441.11 1,442.62 Rates and taxes 2,928.55 8,655.11 Repairs and maintenance- Buildings 8,633.26 8,314.70 - Plant and machinery 3.63 - - Others 1,024.13 1,263.73 Legal and professional fees 1,168.06 792.72 Housekeeping charges 1,914.40 1,810.96 Security charges 2,861.18 2,902.40 Computer expenses 2,582.43 2,685.98 Conveyance and travelling expenses 2,268.90 1,798.39 Electricity charges 9,443.95 9,612.65 Advertisement and publicity 5,725.15 6,192.85 Sales promotion 4,248.36 3,272.37 Charges on credit card transactions 2,715.05 2,621.86 Allowances for bad and doubtful financial assets* 270.65 273.04 Loss on Sale of Fixed Assets (net) 54.13 1.49 Foreign exchange loss (net) (16.27) 48.61 Corporate Social Responsibility Expenses (Note 24.1) 84.08 74.32 Miscellaneous expenses 5,157.58 5,067.41
90,164.22 93,249.75
*excludes exceptional items
24.1 Expenditure related to Corporate Social Responsibility as per Section 135 of the Companies Act,2013 read with Schedule VIII thereof ` 84.16 Lacs (2017: ` 74.32 Lacs)
a. Gross amount required to be spent by the Company towards Corporate Social Responsibility is `84.16 Lacs (2017: ` 74.32 Lacs)
b. Details of amount spent are as under:-Particulars F.Y.2017-18 F.Y.2016-17 Construction / acquisition of an asset - - On purpose other than above – Livelihood creation – 64.08 74.32 For the persons with disabilities (Employment linked training)Ensuring environmental sustainability (Swachh Bharat) 20.08 - Total 84.16 74.32
c. Details of expenditure paid to a related party, in relation to CSR expenditure Refer Note 31. (All amounts in ` Lacs)
For the year ended
31 March 2018
For the year ended
31 March 201725. Income tax expense recognised in profit or lossCurrent income tax:Current income tax charge 3,897.31 2,641.91 Adjustments in respect of current income tax of previous year (593.30) (548.09)Total 3,304.01 2,093.82 Deferred tax:In respect of current year (1,548.38) (594.34)In respect of prior years - 525.92 Total (1,548.38) (68.42)Income tax expense reported in the statement of profit and loss 1,755.63 2,025.40
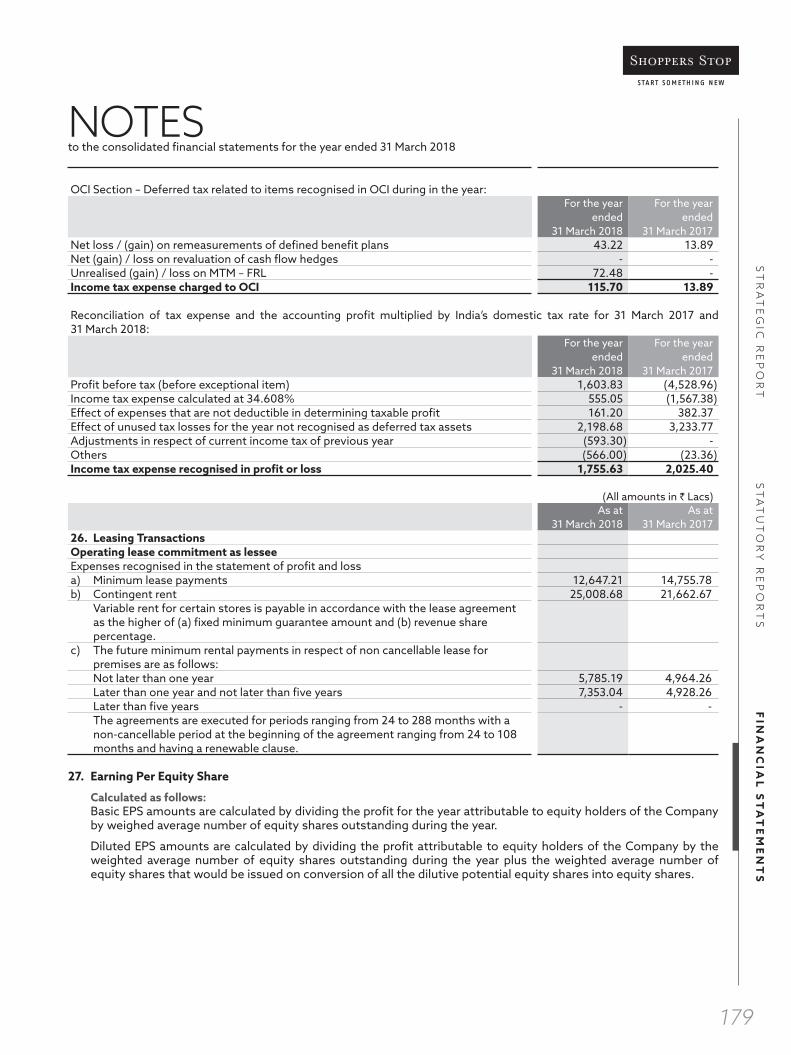
ST
RA
TE
GIC
RE
PO
RT
ST
AT
UT
OR
Y R
EP
OR
TS
FIN
AN
CIA
L S
TA
TE
ME
NT
S
179
NOTES to the consolidated financial statements for the year ended 31 March 2018
OCI Section – Deferred tax related to items recognised in OCI during in the year:For the year
ended 31 March 2018
For the year ended
31 March 2017Net loss / (gain) on remeasurements of defined benefit plans 43.22 13.89 Net (gain) / loss on revaluation of cash flow hedges - - Unrealised (gain) / loss on MTM – FRL 72.48 - Income tax expense charged to OCI 115.70 13.89
Reconciliation of tax expense and the accounting profit multiplied by India’s domestic tax rate for 31 March 2017 and 31 March 2018:
For the year ended
31 March 2018
For the year ended
31 March 2017Profit before tax (before exceptional item) 1,603.83 (4,528.96)Income tax expense calculated at 34.608% 555.05 (1,567.38)Effect of expenses that are not deductible in determining taxable profit 161.20 382.37 Effect of unused tax losses for the year not recognised as deferred tax assets 2,198.68 3,233.77 Adjustments in respect of current income tax of previous year (593.30) - Others (566.00) (23.36)Income tax expense recognised in profit or loss 1,755.63 2,025.40
(All amounts in ` Lacs)As at
31 March 2018 As at
31 March 201726. Leasing Transactions Operating lease commitment as lesseeExpenses recognised in the statement of profit and lossa) Minimum lease payments 12,647.21 14,755.78b) Contingent rent 25,008.68 21,662.67 Variable rent for certain stores is payable in accordance with the lease agreement
as the higher of (a) fixed minimum guarantee amount and (b) revenue share percentage.
c) The future minimum rental payments in respect of non cancellable lease for premises are as follows:
Not later than one year 5,785.19 4,964.26 Later than one year and not later than five years 7,353.04 4,928.26 Later than five years - - The agreements are executed for periods ranging from 24 to 288 months with a
non-cancellable period at the beginning of the agreement ranging from 24 to 108 months and having a renewable clause.
27. Earning Per Equity Share
Calculated as follows: Basic EPS amounts are calculated by dividing the profit for the year attributable to equity holders of the Company
by weighed average number of equity shares outstanding during the year.
Diluted EPS amounts are calculated by dividing the profit attributable to equity holders of the Company by the weighted average number of equity shares outstanding during the year plus the weighted average number of equity shares that would be issued on conversion of all the dilutive potential equity shares into equity shares.

Annual Report 2017-2018180
NOTES to the consolidated financial statements for the year ended 31 March 2018
The following reflects the income and share data used in the basic and diluted EPS computations:
As at 31 March 2018
As at 31 March 2017
(a) Profit attributable to equity share holders from continuing operations (`in lacs) 27,386.12 1,189.32 (b) Loss attributable to equity share holders from discontinued operations (`in lacs) (2,964.46) (4,917.27)(c) Profit / (Loss) attributable to equity share holders (`in lacs) 24,421.66 (3,727.95)(d) Weighted Number of equity shares outstanding during the year 84,476,168 83,497,550 (e) Weighted Number of equity shares outstanding during the year after
adjustment for dilution 84,491,999 83,497,550
(f) Nominal value per share (`) 5.00 5.00 (g) Earning per Share Continuing operations Basic (`) 32.42 1.42 Diluted (`) 32.42 1.42 Discontinued operations Basic (`) (3.51) (5.89)Diluted (`) (3.51) (5.89)Continuing and Discontinued operationsBasic (`) 28.91 (4.46)Diluted (`) 28.91 (4.46)Weighted Average number of Equity shares for basic EPS 84,476,168 83,497,550 Effect of dilution: *Share options 15,831 - Weighted average number of Equity shares adjusted for the effect of dilution 84,491,999 83,497,550
* Anti dilutive
(All amounts in ` Lacs)As at
31 March 2018 As at
31 March 201728. Contingent liabilities and commitments: i) Contingent liabilities a) Claims against the Company not acknowledged as debts comprise of: Income tax claims disputed by the Company relating to disallowances
aggregating 240.00 1,036.41
Indirect tax claims disputed by the Company relating to issues of applicability and classification aggregating
- Service Tax other than on Rent 1,120.42 1,120.42 - Service Tax on Rent (Refer Note 29) 2,010.90 2,010.90 - VAT 6.67 8.23 - Customs Duty 42.61 42.60 Third party claims arising from disputes relating to contracts aggregating - 1,085.18 b) Other matters 25.00 25.00 c) Bank Guarantees 554.80 - Note: Future cash outflows in respect of (a) above are determinable
only on receipt of judgements / decisions pending with various forums /authorities.
ii) Commitments a) Estimated amount of contracts remaining to be executed on capital
account and not provided for 2,220.75 3,970.08
b) Commitments towards Property options - 1,068.75 c) Corporate guarantee given to banks jointly and severally: - with joint venture partner for loans taken by Joint venture entity
(Nuance Group (India) Pvt. Ltd.) - 2,325.00
- with the promoter group Company for loans taken by Subsidiaries, Crossword Bookstores Ltd.
(2017: Hypercity Retail (India) Ltd. ` 31,583.00 Lacs and Crossword Bookstores Ltd. ` 1,800.00 Lacs)
2,340.00 33,383.00

ST
RA
TE
GIC
RE
PO
RT
ST
AT
UT
OR
Y R
EP
OR
TS
FIN
AN
CIA
L S
TA
TE
ME
NT
S
181
NOTES to the consolidated financial statements for the year ended 31 March 2018
29. Service tax
Pursuant to levy of service tax on renting of immovable properties given for commercial use, retrospectively with effect from 1 June 2007, the Company has based on a legal advice, challenged the said levy and, inter-alia, its retrospective application. Pending the final disposal of the matter, which is presently before the Supreme Court, the Company continues not to provide for the retrospective levy aggregating to (Consolidated) `2,010.90 Lacs for the period 01 June 2007 to 31 March, 2010, (fully paid under protest).
30. Exceptional Items:
i) During the year, in terms of the Share Purchase Agreement executed with Future Retail Limited and approval accorded by the members through postal ballot, the Company disposed of 77,158,778 equity shares of ` 10/- each constituting 51.09% of the share capital of Hypercity Retail (India) Ltd.; its material subsidiary to Future Retail Limited on November 30, 2017. Accordingly, Hypercity ceases to be subsidiary of the Company. The Company was allotted 4,756,823 equity shares of `2/- each at an issue price of ` 537/ - per equity share by Future Retail Limited and received cash consideration in terms of the aforesaid Share Purchase Agreement. Accordingly, the Company has recorded a net gain of `20,856.36 lacs in the current financial year which has been disclosed as an exceptional item. (31 March 2017: Nil Lacs)
ii) During the year, the Company has disposed of its 40% shareholding in Nuance Group (India) Pvt. Ltd. (NGIPL) to The Nuance Group AG, Switzerland, at a consideration of ` 600 lacs on October 6, 2017. With the disposal of this shareholding, the Shareholders Agreement executed with them, stands terminated and accordingly, NGIPL ceases to be an associate Company of the Company. Accordingly, the Company has recorded a net gain of `14 lacs in the current financial year which has been disclosed as an exceptional item. (31 March 2017 impairment of `1282.71 lacs)
iii) During the year, the Company has disposed off its 48.42% shareholding in Timezone Entertainment Private Ltd. (TEPL) to Timezone West Asia Pte. Ltd., at a consideration of `2,270.40 lacs on February 15, 2018. With the disposal of this shareholding, the joint venture agreement executed in this regard, stands terminated and accordingly, TEPL ceases to be an associate Company of the Company. Accordingly, the Company has recorded a net gain of `728.33 lacs in the current financial year which has been disclosed as an exceptional item.
iv) Loss up to the date of sale of the above investments have been disclosed under discontinued operations in current financial year.
31. Employee Benefits
31.1 Defined contribution plans
The Company operates defined contribution retirement benefit plans for all qualifying employees of the Company.The assets of the plans are held separately from those of the Company in funds maintained with the government PF authorities. Where employees leave the plans prior to full vesting of the contributions, the contributions payable by the Company are reduced by the amount of forfeited contributions.
The Company’s contribution to Provident Fund and Superannuation Fund aggregating ` 1,215.64 Lacs (2017: ̀ 1,111.81 Lacs) has been recognised in the Statement of Profit and Loss under the head Employee Benefits Expense.
Information about the contributions to defined contribution plans for key managerial personnel is disclosed in note 32.
31.2 Defined benefit plan
The Company sponsors funded defined benefit plan for qualifying employees. The defined benefit plan is administered by a third-party insurer. This third-party insurer is responsible for the investment policy with regard to the assets of the plan.
Under the plan, the employees are entitled to a lump-sum amounting to 15 days’ final basic salary for each year of completed service payable at the time of retirement / resignation provided the employee has completed 5 years of continuous service.

Annual Report 2017-2018182
NOTES to the consolidated financial statements for the year ended 31 March 2018
a) The plan exposes the Company to actuarial risks such as: investment risk, interest rate risk, salary risk and longetivity risk.
Investment risk The probability or likelihood of occurrence of losses relative to the expected return on any particular investment.
Interest risk The plan exposes the Company to the risk of fall in interest rates. A fall in interest rates will result in an increase in the ultimate cost of providing the above benefit and will thus result in an increase in the value of the liability.
Longevity risk The Company has used certain mortality and attrition assumptions in the valuation of the liability. The Company is exposed to the risk of actual experience turning out to be worse compared to the assumption.
Salary Risk The present value of the defined benefit plan is calculated with the assumption of salary increase rate of plan participants in future. Deviation in the rate of increase of salary in future for plan participants from the rate of increase in salary used to determine the present value of obligation will have a bearing on the plan's liability.
b) The principal assumptions used for the purposes of the actuarial valuations were as follows.
Particulars As at
March 31, 2018 As at
31 March 2017Discount rate 7.30%-7.40% p.a. 6.85%-7.50%p.a. Expected rate of salary increase 4.00% p.a. 4.00%-5.00%p.a.
For Crossword :4.00% p.a. for first 3 years and
3% thereafter Average Longevity at retirement age for current beneficiaries of the plan (years)
Indian Assured Lives Mortality 2006-08
Rate of employee turnover Upto 5 Year 34.00% p.a. - 43.00% p.a. 11.00% p.a. Above 5 Year 11.00% p.a. - 12.00%p.a. 11.00% p.a.
c) Amount recognised in statement of profit and loss in respect of these defined benefit plan
Particulars For the year
ended 31 March 2018
For the year ended
31 March 2017Current service cost 260.74 253.79 Net interest cost 14.57 14.36 Components of defined benefits costs recognised in profit or loss. 275.31 268.15 Remeasurements on the net defined benefit liability:- Return on plan assets, excluding amount included in interest expense/
(income) (16.14) (10.44)
- Actuarial (gain)/loss from change in demographic assumptions (99.57) 3.24 - Actuarial (gain)/loss from change in financial assumptions (20.98) 56.69 - Actuarial (gain)/loss from change in experience adjustments 10.58 (13.40)Total amount recognised in other comprehensive income (126.11) 36.09 Total 149.20 304.24
d) The amount included in the balance sheet arising from Company’s obligation in respect of its benefit benefit plan is as follows:
Particulars As at
31 March 2018 As at
31 March 2017 Present value of funded defined benefit obligation 1,398.38 1,577.53 Fair value of plan assets 1,218.76 1,278.70 Net asset arising from defined benefit obligation 179.62 298.83

ST
RA
TE
GIC
RE
PO
RT
ST
AT
UT
OR
Y R
EP
OR
TS
FIN
AN
CIA
L S
TA
TE
ME
NT
S
183
NOTES to the consolidated financial statements for the year ended 31 March 2018
e) Movement in the present value of the defined benefit obligation are as follows:
Particulars For the year
ended 31 March 2018
For the year ended
31 March 2017Opening defined benefit obligation 1,577.53 1,377.39 Current service cost 260.74 253.79 Interest cost 99.29 104.85 Remeasurements (gains) / losses: - - - Actuarial (gain) / loss from change in demographic assumptions (99.57) 3.24 - Actuarial (gain) / loss from change in financial assumptions (20.98) 56.69 - Actuarial (gain) / loss from change in experience adjustments 10.58 (13.40)Movement on A/c of subsidiries (190.16) -Benefits paid (239.04) (205.04)Closing defined benefit obligation 1,398.38 1,577.53
f) Movement in the fair value of the plan assets are as follows.
Particulars For the year
ended 31 March 2018
For the year ended
31 March 2017Opening fair value of plan assets 1,278.70 1,179.27 Interest income 81.47 90.49 Remeasurement (gains) / losses: - - - Return on plan assets, excluding amount included in net interest expense 19.38 10.44 Contributions from the employer 173.39 203.54 Movement on A/c of subsidiries (95.13)Benefits paid/transferred (239.05) (205.04)Closing fair value of plan assets 1,218.76 1,278.70
g) Significant actuarial assumptions for the determination of the defined benefit obligation are discount rate, expected salary increase, attrition rate and mortality. The sensitivity analysis below have been determined based on reasonable possible changes of the assumptions occurring at the end of the reporting period, while holding all other assumptions constant. The results of sensitivity analysis is as follows:
Particulars 31 March 2018 31 March 2017Defined benefit obligation (base) 1,398.39 1,577.53
Particulars 31 March 2018 31 March 2017Decrease Increase Decrease Increase
Discount rate (- / +1%) 1,483.25 1,322.61 1,698.03 1,472.30 % change compared to base due to sensitivity
12.00% -10.70% 20.36% -17.22%
Salary growth rate (- / +1%) 1,319.52 1,485.31 1,468.93 1,699.94 % change compared to base due to sensitivity
-11.20% 12.30% -17.70% 7.18%
Attrition rate (- / +50%) 1,328.01 1,412.06 1,462.97 1,604.78 % change compared to base due to sensitivity
-12.40% 3.60% -14.10% -10.46%
Mortality rate (- / +10%) 1,397.90 1,398.86 1,577.17 1,577.88 % change compared to base due to sensitivity
0.00% 0.00% 0.08% -0.08%
The sensitivity analysis presented above may not be representative of the actual change in the defined benefit obligation as it is unlikely that the change in assumptions would occur in isolation of one another as some of the assumptions may be correlated.
Furthermore, in presenting the above sensitivity analysis, the present value of the defined benefit obligation has been calculated using the projected unit credit method at the end of the reporting period, which is the same as that applied in calculating the defined benefit obligation asset recognised in the balance sheet.
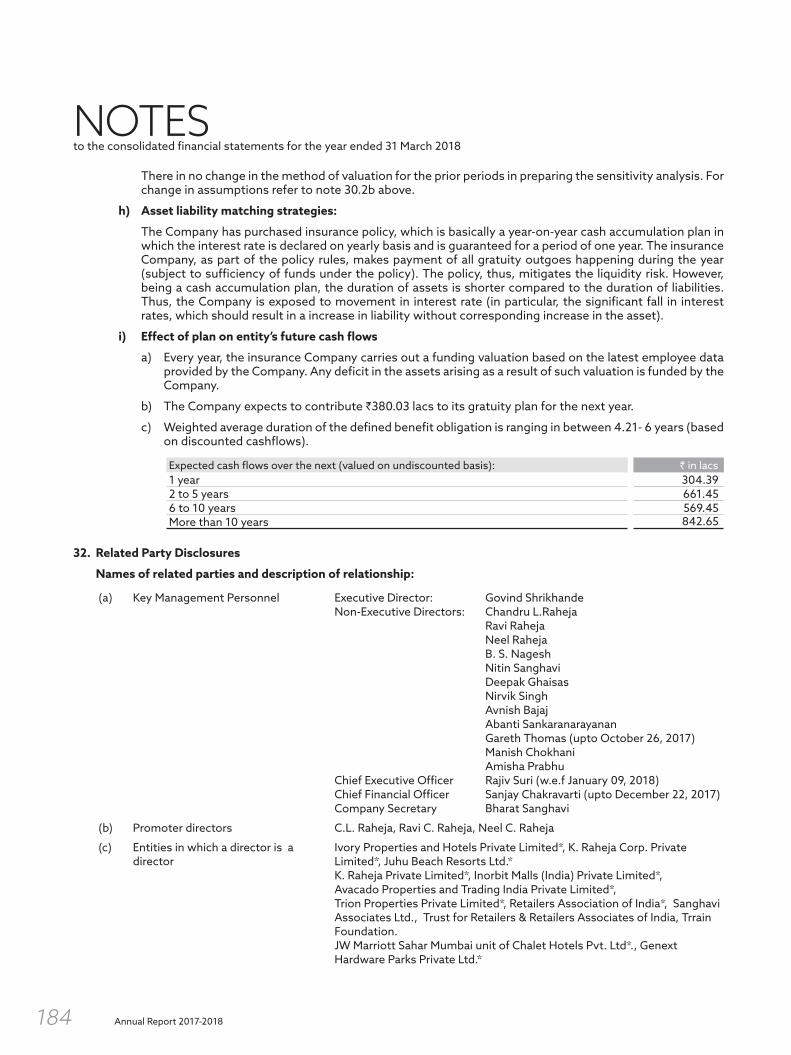
Annual Report 2017-2018184
NOTES to the consolidated financial statements for the year ended 31 March 2018
There in no change in the method of valuation for the prior periods in preparing the sensitivity analysis. For change in assumptions refer to note 30.2b above.
h) Asset liability matching strategies:
The Company has purchased insurance policy, which is basically a year-on-year cash accumulation plan in which the interest rate is declared on yearly basis and is guaranteed for a period of one year. The insurance Company, as part of the policy rules, makes payment of all gratuity outgoes happening during the year (subject to sufficiency of funds under the policy). The policy, thus, mitigates the liquidity risk. However, being a cash accumulation plan, the duration of assets is shorter compared to the duration of liabilities. Thus, the Company is exposed to movement in interest rate (in particular, the significant fall in interest rates, which should result in a increase in liability without corresponding increase in the asset).
i) Effect of plan on entity’s future cash flows
a) Every year, the insurance Company carries out a funding valuation based on the latest employee data provided by the Company. Any deficit in the assets arising as a result of such valuation is funded by the Company.
b) The Company expects to contribute `380.03 lacs to its gratuity plan for the next year.
c) Weighted average duration of the defined benefit obligation is ranging in between 4.21- 6 years (based on discounted cashflows).
Expected cash flows over the next (valued on undiscounted basis): ` in lacs1 year 304.39 2 to 5 years 661.45 6 to 10 years 569.45 More than 10 years 842.65
32. Related Party Disclosures
Names of related parties and description of relationship:
(a) Key Management Personnel Executive Director: Govind ShrikhandeNon-Executive Directors: Chandru L.Raheja
Ravi RahejaNeel RahejaB. S. NageshNitin SanghaviDeepak GhaisasNirvik SinghAvnish BajajAbanti Sankaranarayanan Gareth Thomas (upto October 26, 2017)Manish ChokhaniAmisha Prabhu
Chief Executive Officer Rajiv Suri (w.e.f January 09, 2018)Chief Financial Officer Sanjay Chakravarti (upto December 22, 2017)Company Secretary Bharat Sanghavi
(b) Promoter directors C.L. Raheja, Ravi C. Raheja, Neel C. Raheja
(c) Entities in which a director is a director
Ivory Properties and Hotels Private Limited*, K. Raheja Corp. Private Limited*, Juhu Beach Resorts Ltd.*K. Raheja Private Limited*, Inorbit Malls (India) Private Limited*, Avacado Properties and Trading India Private Limited*, Trion Properties Private Limited*, Retailers Association of India*, Sanghavi Associates Ltd., Trust for Retailers & Retailers Associates of India, Trrain Foundation.JW Marriott Sahar Mumbai unit of Chalet Hotels Pvt. Ltd*., Genext Hardware Parks Private Ltd.*

ST
RA
TE
GIC
RE
PO
RT
ST
AT
UT
OR
Y R
EP
OR
TS
FIN
AN
CIA
L S
TA
TE
ME
NT
S
185
NOTES to the consolidated financial statements for the year ended 31 March 2018
Note 35 provides the information about the group’s structure including the details of the subsidiaries. The following table provides the total amount of transactions that have been entered into with related parties for the relevant financial year:
Nature
Entities in which a director is a
director (refer (c) above)
Related Parties of Joint Ventures
Key Management
PersonnelTotal
Trading transactionsSale of merchandise - - - - Inorbit Malls (India) Private Limited* - K. Raheja Corp. Pvt. Ltd. - Trust for Retailers & Retail Associates of India -
(11.06) - - (11.06)Purchase of Property Options - - K. Raheja Private Limited -
(2,022.08) (2,022.08)Compensation to key management personnelRemuneration to managing director 499.16 499.16 Short term benefits 480.71 Post employment benefits 18.45
(455.92) (455.92)Remuneration to Company Secretary 43.63 Short term benefits 42.31 Post employment benefits 0.46 Share based payments 0.86
(68.23) (68.23)Remuneration to Chief Executive Officer 100.22 Short term benefits 100.22 Post employment benefits - Share based payments -
(267.43) (267.43)Remuneration to Chief Financial Officer 100.65 Short term benefits 100.65 Post employment benefits - Share based payments -
- - (104.72) (104.72)Other related party transactionsPayment of conducting fees / Lease Rent / Common
6,318.50 6,318.50
Area Maintenance ChargesIvory Properties and Hotels Private Limited* 1,716.44 Inorbit Malls (India) Private Limited* 3,098.49 Chalet Hotels Private Limited* 143.79 Genext Hardware And Parks Pvt. Ltd.* 172.55 Trion Properties Private Limited* 975.83
(8,921.14) (8,921.14)Expenses Paid 95.15 - 0.95 96.10 Inorbit Malls (India) Private Limited* 7.94 Trrain Circle Pvt. Ltd. 0.77 Juhu Beach Resorts Limited* 0.10 JW Marriott Sahar Mumbai unit of Chalet Hotels Pvt. Ltd.*
5.14
Sanghavi Associates Limited 10.06 Retailers Association of India 5.51 CSR- Trust for Retailers & Retail Association of India
64.00
K. Raheja Corp.Pvt. Ltd.* 1.63

Annual Report 2017-2018186
NOTES to the consolidated financial statements for the year ended 31 March 2018
Nature
Entities in which a director is a
director (refer (c) above)
Related Parties of Joint Ventures
Key Management
PersonnelTotal
B. S. Nagesh - 0.95 (792.80) (1.75) (794.55)
Deposits Paid 71.04 71.04 Inorbit Malls (India) Private Limited* 49.64 Trion Properties Private Limited* 0.88 Genext Hardware and Parks Private Limited* 20.52
(57.00) (57.00)Advance Rent 29.47 29.47 Genext Hardware and Parks Private Limited* 28.76 Avacado Properties and Trading (India) Private Limited*
0.71
- - Compensation income - - - - Trion Properties Private Limited* -
(240.00) - - (240.00)Deposit Received - - - - Avacado Properties and Trading (India) Private Limited*
-
(464.10) - - (464.10)Expenses recovered - - - - Inorbit Malls (India) Private Limited* -
(0.35) - - (0.35)Deposit received Back 197.18 197.18 Trion Properties Private Limited* 197.18
- - Reimbursement of Expenses 759.77 759.77Inorbit Malls (India) Private Limited 604.02 Trion Properties Private Limited 155.75
(94.19) (94.19)Issue of Equity / Preference Shares - - - -
(4,743.17) - (20.64) (4,763.81)Commission and Sitting fees to non executive Directors
50.83 50.83
Chandru L.Raheja 3.50 Ravi Raheja 4.60 Neel Raheja 3.50 B.S.Nagesh 6.50 Nitin Sanghavi 8.10 Deepak Ghaisas 9.70 Nirvik Singh 3.50 Ameesha Prabhu 0.18 Vidya Hariharan 0.05 Abanti Sankaranarayanan 3.50 Gareth Thomas 1.00 Manish Chokhani 6.70
(64.60) (64.60)

ST
RA
TE
GIC
RE
PO
RT
ST
AT
UT
OR
Y R
EP
OR
TS
FIN
AN
CIA
L S
TA
TE
ME
NT
S
187
NOTES to the consolidated financial statements for the year ended 31 March 2018
Balance outstanding at the year endReceivablesIvory Properties and Hotels Private Limited* 1,010.52
(1,149.91)Inorbit Malls (India) Private Limited* 846.31
(1,049.46)Trion Properties Private Limited * 285.96
(906.34)Genext Hardware And Parks Pvt. Ltd.* 179.55
(24.30)PayablesK. Raheja Private Limited* -
(372.28)The Company has given corporate guarantee to banks for loans taken by subsidiaries – Refer Note 28(ii)(c). The figure in bracket pertain to previous year.
* These parties are not related to Shoppers Stop Ltd. per Ind AS 24 definition. These parties have been reported on the basis of their classification as related party under the Companies Act 2013.
Terms and conditions of transactions with related parties
The sales to and purchases from related parties are made on terms equivalent to those that prevail in arm’s length transactions. Outstanding balances at the year-end are unsecured and interest free and settlement occurs in cash. There have been no guarantees provided or received for any related party receivables or payables. For the year ended 31 March 2018, the Group has not recorded any impairment of receivables relating to amounts owed by related parties (31 March 2017: ` Nil ). This assessment is undertaken each financial year through examining the financial position of the related party and the market in which the related party operates.
33. Segment Reporting
Information about operating segments:
i) The Group is primarily engaged in A) Retail operations i.e. trading of Apparels, Non-apparels such as Cosmetics, Household items, Food products, Books etc. B) Property options which in the terms of IndAS 108 on ‘Operating Segments’ constitute the reporting segment.
ii) The Group operates in a single geographical environment i.e. in India.
iii) No single customer contributed 10% or more to Groups revenue.
(All amounts in ` Lacs)31 March 2018 31 March 2017
33.1Segment revenue from external customersContinuing OperationsRetail Operations 369,672.43 375,690.34 Property Options - -
369,672.43 375,690.34 Discontinued OperationsRetail Operations 73,096.64 109,727.37 Property Options - 5,596.18
73,096.64 115,323.55 Total segment revenue from external customers 442,769.07 491,013.89 Segment operating resultsContinuing OperationsRetail Operations 11,311.51 10,495.12 Property Options - -
11,311.51 10,495.12 Discontinued OperationsRetail Operations (2,915.82) (10,584.97)Property Options - 4,296.15
(2,915.82) (6,288.82)Total segment operating results 8,395.69 4,206.30
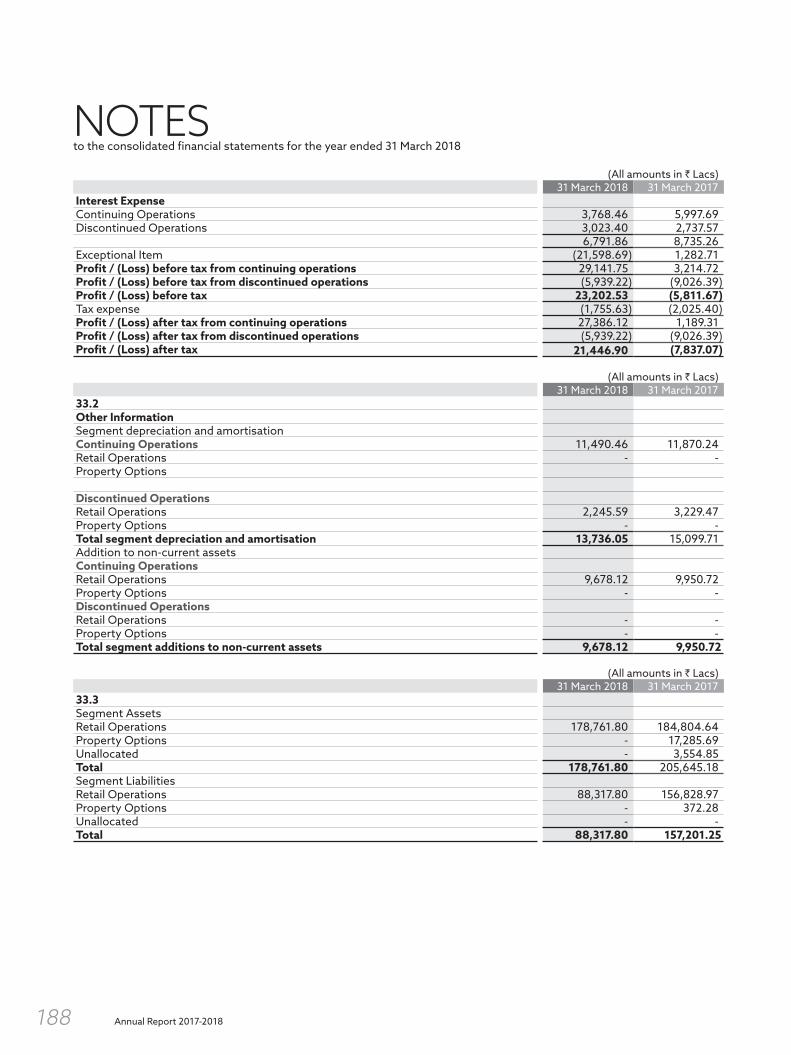
Annual Report 2017-2018188
NOTES to the consolidated financial statements for the year ended 31 March 2018
(All amounts in ` Lacs)31 March 2018 31 March 2017
Interest ExpenseContinuing Operations 3,768.46 5,997.69 Discontinued Operations 3,023.40 2,737.57
6,791.86 8,735.26 Exceptional Item (21,598.69) 1,282.71 Profit / (Loss) before tax from continuing operations 29,141.75 3,214.72 Profit / (Loss) before tax from discontinued operations (5,939.22) (9,026.39)Profit / (Loss) before tax 23,202.53 (5,811.67)Tax expense (1,755.63) (2,025.40)Profit / (Loss) after tax from continuing operations 27,386.12 1,189.31 Profit / (Loss) after tax from discontinued operations (5,939.22) (9,026.39)Profit / (Loss) after tax 21,446.90 (7,837.07)
(All amounts in ` Lacs)31 March 2018 31 March 2017
33.2Other InformationSegment depreciation and amortisation Continuing Operations 11,490.46 11,870.24 Retail Operations - - Property Options
Discontinued OperationsRetail Operations 2,245.59 3,229.47 Property Options - - Total segment depreciation and amortisation 13,736.05 15,099.71 Addition to non-current assets Continuing OperationsRetail Operations 9,678.12 9,950.72 Property Options - - Discontinued OperationsRetail Operations - - Property Options - - Total segment additions to non-current assets 9,678.12 9,950.72
(All amounts in ` Lacs)31 March 2018 31 March 2017
33.3 Segment AssetsRetail Operations 178,761.80 184,804.64 Property Options - 17,285.69 Unallocated - 3,554.85 Total 178,761.80 205,645.18 Segment LiabilitiesRetail Operations 88,317.80 156,828.97 Property Options - 372.28 Unallocated - - Total 88,317.80 157,201.25
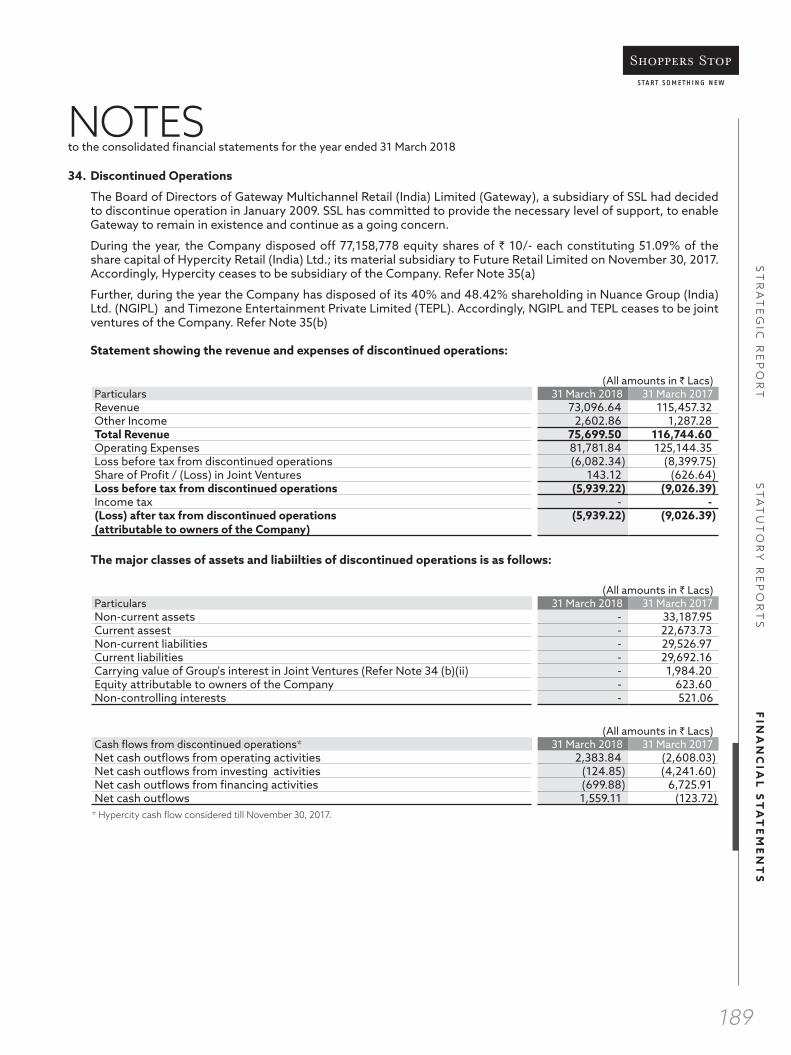
ST
RA
TE
GIC
RE
PO
RT
ST
AT
UT
OR
Y R
EP
OR
TS
FIN
AN
CIA
L S
TA
TE
ME
NT
S
189
NOTES to the consolidated financial statements for the year ended 31 March 2018
34. Discontinued Operations
The Board of Directors of Gateway Multichannel Retail (India) Limited (Gateway), a subsidiary of SSL had decided to discontinue operation in January 2009. SSL has committed to provide the necessary level of support, to enable Gateway to remain in existence and continue as a going concern.
During the year, the Company disposed off 77,158,778 equity shares of ` 10/- each constituting 51.09% of the share capital of Hypercity Retail (India) Ltd.; its material subsidiary to Future Retail Limited on November 30, 2017. Accordingly, Hypercity ceases to be subsidiary of the Company. Refer Note 35(a)
Further, during the year the Company has disposed of its 40% and 48.42% shareholding in Nuance Group (India) Ltd. (NGIPL) and Timezone Entertainment Private Limited (TEPL). Accordingly, NGIPL and TEPL ceases to be joint ventures of the Company. Refer Note 35(b)
Statement showing the revenue and expenses of discontinued operations:
(All amounts in ` Lacs)Particulars 31 March 2018 31 March 2017Revenue 73,096.64 115,457.32 Other Income 2,602.86 1,287.28 Total Revenue 75,699.50 116,744.60 Operating Expenses 81,781.84 125,144.35 Loss before tax from discontinued operations (6,082.34) (8,399.75)Share of Profit / (Loss) in Joint Ventures 143.12 (626.64)Loss before tax from discontinued operations (5,939.22) (9,026.39)Income tax - - (Loss) after tax from discontinued operations (attributable to owners of the Company)
(5,939.22) (9,026.39)
The major classes of assets and liabiilties of discontinued operations is as follows:
(All amounts in ` Lacs)Particulars 31 March 2018 31 March 2017Non-current assets - 33,187.95 Current assest - 22,673.73 Non-current liabilities - 29,526.97 Current liabilities - 29,692.16 Carrying value of Group's interest in Joint Ventures (Refer Note 34 (b)(ii) - 1,984.20 Equity attributable to owners of the Company - 623.60 Non-controlling interests - 521.06
(All amounts in ` Lacs)Cash flows from discontinued operations* 31 March 2018 31 March 2017Net cash outflows from operating activities 2,383.84 (2,608.03)Net cash outflows from investing activities (124.85) (4,241.60)Net cash outflows from financing activities (699.88) 6,725.91 Net cash outflows 1,559.11 (123.72)
* Hypercity cash flow considered till November 30, 2017.

Annual Report 2017-2018190
NOTES to the consolidated financial statements for the year ended 31 March 2018
35. SUBSIDIARIES AND JOINT VENTURE
a) The subsidiaries (which alongwith SSL Limited, the parent, constitute the Group) considered in the preparation of these Consolidated Financial Statements are:
(All amounts in ` Lacs)Name of subsidiary Principal activity Place of
incorporate and operation
Propotion of ownership interest and voting power held by the
Group31 March 2018 31 March 2017
HyperCity Retail (India) Limited *
Retailing a variety of household and consumer products (including food, groceries, fashion and other general merchandise) through departmental stores
India - 51.08%
Crossword Book Stores Limited
Retailing in books and other allied items through departmental stores operated by self or by franchisees
India 100% 100%
Upasna Trading Limited Supervising distribution and logistics operations
India 100% 100%
Shopper’s Stop Services (India) Limited
Services India 100% 100%
Shopper’s Stop.Com (India) Limited
Services India 100% 100%
Gateway Multichannel Retail (India) Limited
Catalogue retailing India 100% 100%
* During the year, In terms of the Share Purchase Agreement executed with Future Retail Limited and approval accorded by the members through postal ballot, the Company disposed of 77,158,778 equity shares of ` 10/- each constituting 51.09% of the share capital of Hypercity Retail (India) Ltd.; its material subsidiary to Future Retail Limited on November 30, 2017. Accordingly, Hypercity ceases to be subsidiary of the Company. The Company was allotted 4,756,823 equity shares of `2/- each at an issue price of ` 537/ - per equity share by Future Retail Limited and received cash consideration in terms of the aforesaid Share Purchase Agreement. Accordingly, the Company has recorded a net gain of `20,856.36 lacs in the current financial year which has been disclosed as an exceptional item. (31 March 2017 impairment loss of ` NIL lacs)
b) Investment in Joint Ventures
The Company’s investment in a joint venture is accounted for by the Equity Method. On initial recognition the investment is recorded at cost, and the carrying amount is increased or decreased to recognise the Company’s share of profit or loss and other comprehensive income of the joint venture after the date of acquisition. Distributions received from the joint venture reduce the carrying amount of the investment.
i) Details and financial information of material Joint ventures
Details of the Group’s Material joint venture at the end of the reporting period is as follows:
(All amounts in ` Lacs)Name of the Joint Venture Principal Activity Place of
Incorporation and Principle place of business
Propotion of ownership interest and voting power held by the
Group
31 March 2018 31 March 2017
Nuance Group (India) Private Limited * Airport Retailing India - 50.00%Timezone Entertainment Private Limited ** Entertainment India - 48.42%
* During the year, the Company has disposed of its 40% shareholding in Nuance Group (India) Pvt. Ltd. (NGIPL) to The Nuance Group AG, Switzerland, at a consideration of ` 600 lacs on October 6, 2017. With the disposal of this shareholding, the Shareholders Agreement executed with them, stands terminated and accordingly, NGIPL ceases to be an associate Company of the Company. Accordingly, the Company has recorded a net gain of `14 lacs in the current financial year which has been disclosed as an exceptional item. (31 March 2017 impairment of `1,282.71 lacs)
** During the year, the Company has disposed off its 48.42% shareholding in Timezone Entertainment Private Ltd. (TEPL) to Timezone West Asia Pte. Ltd., at a consideration of `2,270 lacs on February 15, 2018. With the disposal of this shareholding, the joint venture agreement executed in this regard, stands terminated and accordingly, TEPL ceases to be an associate Company of the Company. Accordingly, the Company has recorded a net gain of `728.33 lacs in the current financial year which has been disclosed as an exceptional item.
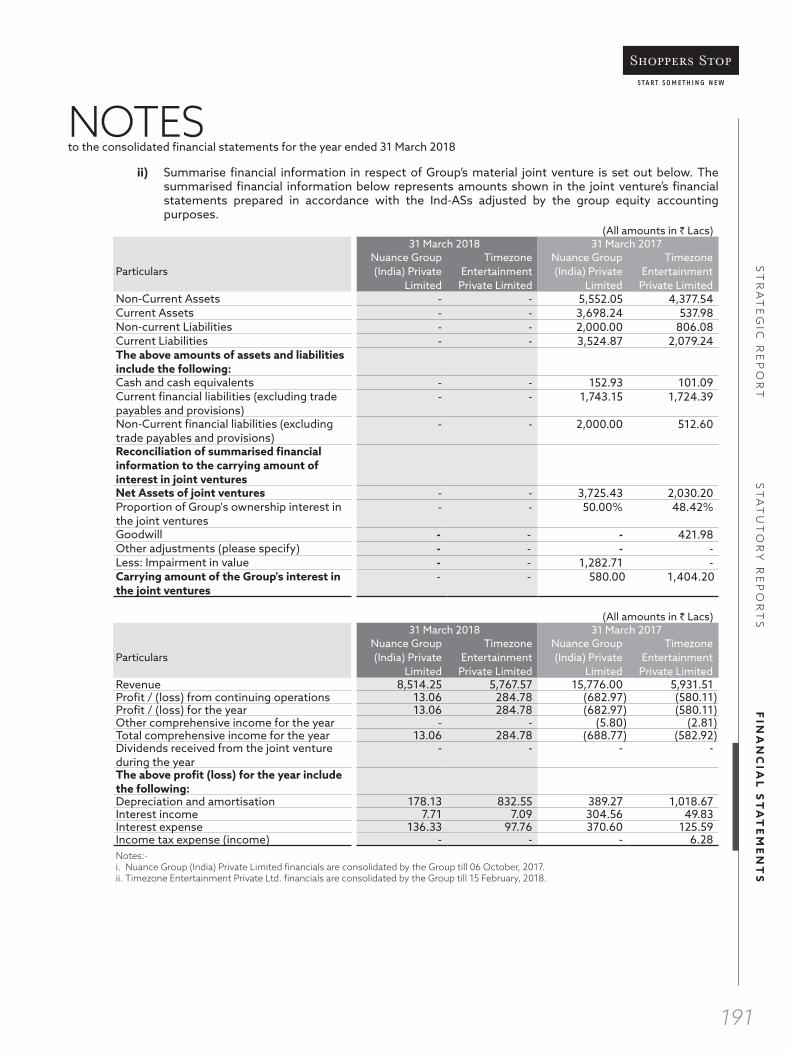
ST
RA
TE
GIC
RE
PO
RT
ST
AT
UT
OR
Y R
EP
OR
TS
FIN
AN
CIA
L S
TA
TE
ME
NT
S
191
NOTES to the consolidated financial statements for the year ended 31 March 2018
ii) Summarise financial information in respect of Group’s material joint venture is set out below. The summarised financial information below represents amounts shown in the joint venture’s financial statements prepared in accordance with the Ind-ASs adjusted by the group equity accounting purposes.
(All amounts in ` Lacs)31 March 2018 31 March 2017
ParticularsNuance Group (India) Private
Limited
Timezone Entertainment
Private Limited
Nuance Group (India) Private
Limited
Timezone Entertainment
Private LimitedNon-Current Assets - - 5,552.05 4,377.54 Current Assets - - 3,698.24 537.98 Non-current Liabilities - - 2,000.00 806.08 Current Liabilities - - 3,524.87 2,079.24 The above amounts of assets and liabilities include the following:Cash and cash equivalents - - 152.93 101.09 Current financial liabilities (excluding trade payables and provisions)
- - 1,743.15 1,724.39
Non-Current financial liabilities (excluding trade payables and provisions)
- - 2,000.00 512.60
Reconciliation of summarised financial information to the carrying amount of interest in joint venturesNet Assets of joint ventures - - 3,725.43 2,030.20 Proportion of Group's ownership interest in the joint ventures
- - 50.00% 48.42%
Goodwill - - - 421.98 Other adjustments (please specify) - - - - Less: Impairment in value - - 1,282.71 - Carrying amount of the Group's interest in the joint ventures
- - 580.00 1,404.20
(All amounts in ` Lacs)31 March 2018 31 March 2017
ParticularsNuance Group (India) Private
Limited
Timezone Entertainment
Private Limited
Nuance Group (India) Private
Limited
Timezone Entertainment
Private LimitedRevenue 8,514.25 5,767.57 15,776.00 5,931.51 Profit / (loss) from continuing operations 13.06 284.78 (682.97) (580.11)Profit / (loss) for the year 13.06 284.78 (682.97) (580.11)Other comprehensive income for the year - - (5.80) (2.81)Total comprehensive income for the year 13.06 284.78 (688.77) (582.92)Dividends received from the joint venture during the year
- - - -
The above profit (loss) for the year include the following:Depreciation and amortisation 178.13 832.55 389.27 1,018.67 Interest income 7.71 7.09 304.56 49.83 Interest expense 136.33 97.76 370.60 125.59 Income tax expense (income) - - - 6.28
Notes:- i. Nuance Group (India) Private Limited financials are consolidated by the Group till 06 October, 2017. ii. Timezone Entertainment Private Ltd. financials are consolidated by the Group till 15 February, 2018.

Annual Report 2017-2018192
NOTES to the consolidated financial statements for the year ended 31 March 2018
c) Disclosure on Non-controlling Interests
i Non-controlling Interests
(All amounts in ` Lacs)
ParticularsYear ended
31 March 2018Year ended
31 March 2017Balance at the beginning of the year 521.06 (122.21)Share of profit/(loss) for the year (2,974.76) (4,145.52)Contribution during the year 1,451.07 4,788.79 Sale of Interest in subsidiary - Hypercity 1,002.63 - Balance at the end of the year - 521.06
ii Details of non-wholly owned subsidiaries that have material non-controlling interests
a. The table below shows details of non-wholly owned subsidiaries of the Group that have material non- controlling interests:
(All amounts in ` Lacs)
Name of subsidiary
Place of incorporation and principal place of business
Proportion of ownership interests and voting rights held by non-controlling interests
Profit/(Loss) allocated to controlling interests
Accumulated non-controlling interests
31 March 2018
31 March 2017
31 March 2018
31 March 2017
31 March 2018
31 March 2017
Hypercity Retail (India) Limited India - 51.08% - 48.92% - 521.06
b. Summarised financial informartion in respect of each of the Group’s subsidiaries that has material non-controlling interests is set out below. The summarised financial information below represents amounts before intragroup eliminations:
ParticularsAs at
31 March 2018As at
31 March 2017Non-current assets - 33,158.09 Current assest - 22,673.32 Non-current liabilities - 25,034.62 Current liabilities - 29,652.13 Equity attributable to owners of the Company - 623.60 Non-controlling interests - 521.06
c. Particulars As at 31 March 2018
As at 31 March 2017
Revenue 75,776.04 116,744.27 Expenses 81,857.94 125,143.49 Profit/(Loss) for the year (6,081.90) (8,399.22)Profit/(Loss) attributable to owners of the Company (3,107.14) (4,290.10)Profit/(Loss) attributable to non-controlling interests (2,974.76) (4,109.12)Profit/(Loss) for the year (6,081.90) (8,399.22)Other comprehensive income attributable to owners of the Company - (38.00)Other comprehensive income attributable to non-controlling interests - (36.40)Other comprehensive income for the period - (74.40)Total comprehensive income attributable to owners of the Company (3,107.14) (4,328.10)Total comprehensive income attributable to non-controlling interests (2,974.76) (4,145.52)Total comprehensive income for the year (6,081.90) (8,473.62)Net cash inflow/(outflow) from operating activities 2,384.34 (1,282.81)Net cash inflow/(outflow) from investing activities (125.18) (2,067.93)Net cash inflow/(outflow) from financing activities (699.88) 3,290.31 Net cash inflow/(outflow) 1,559.28 (60.43)
* Hypercity consolidated from April 1, 2017 till November 30, 2017.

ST
RA
TE
GIC
RE
PO
RT
ST
AT
UT
OR
Y R
EP
OR
TS
FIN
AN
CIA
L S
TA
TE
ME
NT
S
193
NOTES to the consolidated financial statements for the year ended 31 March 2018
36 Share based payments
The expense recognised for employee services received during the year is show in the following table:
ParticularsYear ended
31 March 2018Year ended
31 March 2017Expense arising on Employee Stock Option Scheme 10.63 65.22Total expense arising from share-based payment transactions 10.63 65.22
36.1 Employee share option plan of the Group
The Company has a share option scheme for certain employees of the Company and its subsidiaries. In accordance with the terms of the share option scheme, as approved by shareholders at a previous general meeting, employees with a pre-defined grade and having more than five years of service may be granted options to purchase equity shares. Each share option converts into one equity share of the Company on exercise. No amounts are paid or payable by the recipient on receipt of the option. The options carry neither rights to dividends nor voting rights. Options may be exercised within four years from the date of grant, as per vesting schedule.The share options vests based on a pre-determined vesting schedule from the date of grant.
The fair value of the share options is estimated at the grant date using a binomial option pricing model, taking into account the terms and conditions upon which the share options are granted. However, the above performance condition is only considered in determining the number of instruments that will ultimately vest.
The Contractual term of each option granted is three years. There are no cash settlement alternatives. The Group does not have a past practice of cash settlement for these share options.
The following share-based payment arrangements were in existence during the current and prior years:
Option series Number Grant date Expiry dateExercise Price (`)
Fair value at grant date (`)
Granted on June 9, 2012 200,000 09.06.2012 09.06.2015 297.00 115.70 Granted on August 28, 2013 200,000 28.08.2013 28.08.2016 344.00 124.00 Granted on April 29, 2014 160,675 29.04.2014 29.04.2017 362.00 123.21 Granted on July 31, 2015 3,275 31.07.2015 31.07.2018 404.00 124.35
All options vested based on the pre determined vesting schedule (i.e. three years) from the date of grant and expire after 12 months from the last date of vesting schedule, six months from the date of retirement or twelve months after the resignation of the employee, whichever is the earlier.
36.2 Fair value of share options granted in the year
There are no new grants during the F.Y. 2017-18.
36.3 Movements in share options during the year
Number of Employee Stock Option Outstanding: Number of
Options
Weighted average exercise
price
Number of Options
Weighted average exercise
price 31 March 2018 31 March 2017
Outstanding at the beginning of the year 211,124 353.61 340,975 339.62 Granted during the year - - - -Lapsed / Cancelled during the year 101,185 - 98,298 - Exercised during the year 60,020 345.99 31,553 297.93 Surrendered during the year - - - - Outstanding at the end of the year 49,919 363.07 211,124 353.61
Of the above outstanding share options, ` 49,919 (2017: ` 1,69,757) shares are exercisable at the end of the respective reporting periods.

Annual Report 2017-2018194
NOTES to the consolidated financial statements for the year ended 31 March 2018
Details of yearwise grant and exercise:
Year / (date of Grant)
Options granted(net of lapsed)
Exercised till 31.3.2016
Exercised in 2016-17
Exercised till 31.3.2017
Outstanding 31.3.2017
Exercised in 2017-18
Outstanding 31.3.2018
2009-10 (29.04.2009)
958,740 958,740 - 958,740 - - -
2009-10 (24.03.2010)
358,200 358,200 - 358,200 - - -
2011-12 (29.04.2011)
124,100 124,100 - 124,100 - - -
2012-13 (09.06.2012)
101,807 71,829 29,978 101,807 - - -
2013-14 (28.08.2013)
42,512 27,054 1,575 28,629 106,042 13,883 -
2014-15 (29.04.2014)
104,586 10,494 - 10,494 101,807 44,173 49,919
2014-15 (05.11.2014)
- - - - - - -
2015-16 (31.07.2015)
1,964 - - - 3,275 1,964 -
31,553 1,581,970 211,124 60,020 49,919
36.4 Share options exercise during the year
The following share options were exercised during the year
Option series Number Exercised
Exercise date
Weighted Average Share
price at exercise date (`)
Granted on August 28,2013 13,883 17.09.2017 344Granted on April 29, 2014 3,938 17.09.2017 362
4,887 26.10.2017 36220,159 30.11.2017 362
5,571 31.01.2018 3629,618 19.03.2018 362
Granted on July 31,2015 1,964 31.01.2018 404
36.5 The weighted average contractual life of the options outstanding is 3.08 years.
37. Derivatives / Forward foreign exchange contracts
a) The Group uses foreign currency forward contracts to hedge its risks associated with foreign currency exposures relating to the underlying transactions and firm commitments. The Group does not enter into any derivative instruments for trading and speculative purposes.
It is the policy of the Group to enter into forward foreign exchange contracts to cover specific foreign currency payments and receipts. The Group also enters into forward foreign exchange contracts to manage the risk associated with anticipated sales and purchase transactions out of 6 months within 40% to 50% of the exposure generated.
Adjustments are made to the initial carrying amounts of non-financial hedged items when the anticipated sale or purchase transaction takes place.
The following are the outstanding Forward Exchange Contracts entered into by the Group as at 31 March 2018.
Particulars 31 March 2018 31 March 2017Number of Contracts 1 1 1 1 1 3 1Type Buy Buy Buy Buy Buy Buy Buy Foreign currency (in lacs) 0.27 EURO 0.06 GBP 1.86 USD 0.04 AED 0.37 GBP 3.33 USD 0.82 EUROINR Equivalent (in lacs) 22.20 5.77 121.43 0.64 29.81 217.10 57.04

ST
RA
TE
GIC
RE
PO
RT
ST
AT
UT
OR
Y R
EP
OR
TS
FIN
AN
CIA
L S
TA
TE
ME
NT
S
195
NOTES to the consolidated financial statements for the year ended 31 March 2018
b) Unhedged Foreign Currency exposure
There are no foreign currency exposures that have not been hedged by a derivative instrument or otherwise at the end of the year.
38. Financial Instruments
A. Capital risk management The Group’s objectives when managing capital are to safeguard continuity as a going concern, provide
appropriate return to shareholders and maintain a cost efficient capital structure. The Group determines the amount of capital required for respective companies on the basis of an annual budget and a five year plan, including, for working capital, capital investment in stores, technology. The Group’s funding requirements are met through internal accruals and a combination of both long-term and short-term borrowings. Majorly Group raise long term loan for its CAPEX requirement and based on the working capital requirement utilise the working capital loans.
The Group monitors capital on the basis of consolidated total debt to consolidated total equity on a periodic basis. The following table summarise the capital of the Group:
CapitalAs at
31 March 2018As at
31 March 2017` in lacs ` in lacs
Long term borrowings (including current maturities) 8,700.11 63,110.26Short term borrowings 3,834.77 25,400.31Total debt 12,534.88 88,510.57Equity share capital 4,398.03 4,175.24Other equity (including Non-Controlling Interests, less goodwill on consolidation)
85,080.60 34,504.15
Total Equity 89,478.63 38,679.39Debt to Total Equity Ratio 0.14 2.29
The Group’s objective is to keep the debt to total equity ratio of the holding Company on consolidated basis below 1 which it has achieved in current year.
B. Financial risk management A wide range of risks may affect the Group’s business and operational / financial performance. The risks that
could have significant influence on the Group are market risk, credit risk and liquidity risk. The Board of Directors of respective Companies reviews and sets out policies for managing these risks and monitors suitable actions taken by management to minimise potential adverse effects of such risks on the Group’s operational and financial performance.
(a) Market risk:
Market Risk is the risk that changes in market place could affect the future cash flows to the Group. The market risk for the Group arises primarily from product price risk, interest rate risk and, to some extent, foreign currency risk.
Product price risk: In a potentially inflationary economy, the Group expects periodical price increases across its retail product lines. Product price increases which are not in line with the levels of customers’ discretionary spends, may affect the business/retail sales volumes. In such a scenario, the risk is managed by offering judicious product discounts to retail customers to sustain volumes. The Group negotiates with its vendors for purchase price rebates such that the rebates substantially absorb the product discounts offered to the retail customers. This helps the Group protect itself from significant product margin losses. This mechanism also works in case of a downturn in the retail sector, although overall volumes would get affected.
Interest risk: The Group is exposed to interest rate risk primarily due to borrowings having floating interest rates. The Group uses available working capital limits for availing short term working capital demand loans with interest rates negotiated from time to time so that the Group has an effective mix of fixed and variable rate borrowings. Interest rate sensitivity analysis shows that an increase / decrease of fifty basis points in floating interest rates would result in decrease / increase in the Group ’s profit before tax by approximately `188 lacs (2017: ` 297 lacs).

Annual Report 2017-2018196
NOTES to the consolidated financial statements for the year ended 31 March 2018
Currency risk: The Group’s significant transactions are in Indian Rupees and therefore there is minimal foreign currency risk. Generally, the Group fully covers the foreign currency risk for transactions in foreign currency which are primarily for import of merchandise, by entering into forward foreign exchange contracts. Also Refer Note 37 for the forward foreign currency contracts outstanding at the end of the reporting period.
(b) Credit risk:
Credit risk is a risk that the counterparty will default on its contractual obligation resulting in financial loss to the Group. The credit risk for the Group primarily arises from credit exposures to trade receivables (mainly institutional customers), deposits with landlords for store properties taken on leases and other receivables including balances with banks.
Trade and other receivables: The Group’s retail business is predominantly on ‘cash and carry’ basis which is largely through credit card collections. The credit risk on such collections is minimal, since they are primarily owned by customers’ card issuing banks. The Group has adopted a policy of dealing with only credit worthy counterparties in case of institutional customers and the credit risk exposure for institutional customers is managed by the Group by credit worthiness checks. The Group also carries credit risk on lease deposits with landlords for store properties taken on leases, for which agreements are signed and property possessions timely taken for store operations. The risk relating to refunds after store shut down is managed through successful negotiations or appropriate legal actions, where necessary.
The Group’s experience of delinquencies and customer disputes have been minimal. Further, Trade and other receivables consist of a large number of customers, across geographies, hence, the Group is not exposed to concentration risks.
Property options receivable: The Group considers a variety of relevant factors like age, past due details and credit enhancements (guarantees) in assessing credit risk from property options receivable. The property option receivables are guaranteed under contract by a Company of the promoter shareholder group with further assurance from a promoter director.
(c) Liquidity Risk:
Liquidity risk is a risk that the Group may not be able to meet its financial obligations on a timely basis through its cash and cash equivalents, and funds available by way of committed credit facilities from banks.
Management manages the liquidity risk by monitoring rolling cash flow forecasts and maturity profiles of financial assets and liabilities. This monitoring includes financial ratios and takes into account the accessibility of cash and cash equivalents and additional undrawn financing facilities.
The table below summarises the maturity profile (remaining period of contractual maturity at the balance sheet date) of the Group’s financial liabilities based on contractual undiscounted cash flows.
Less than 1 yearBetween
1 and 5 yearsCarrying amounts
At 31 March 2017 ` in lacs ` in lacs ` in lacsBorrowings (long term and short term) 51,414.93 37,095.64 88,510.57Interest payable 397.74 - 397.74Trade payables and other accruals 49,080.56 - 49,080.56At 31 March 2018Borrowings (long term and short term) 8,134.80 4,400.08 12,534.88Interest payable 6.37 - 6.37Trade payables and other accruals 51,906.81 - 51,906.81
In respect of financial guarantee contracts, no amounts are recognised based on the results of the liability adequacy test for likely deficiency / defaults by the entities on whose behalf the Group has given guarantees, grounded on the Group’s actual experience.

ST
RA
TE
GIC
RE
PO
RT
ST
AT
UT
OR
Y R
EP
OR
TS
FIN
AN
CIA
L S
TA
TE
ME
NT
S
197
NOTES to the consolidated financial statements for the year ended 31 March 2018
The Group has access to following financing facilities which were undrawn as at the end of reporting periods mentioned.
Undrawn financing facilityAs at As at
31 March 2018 31 March 2017` in lacs ` in lacs
Amount Used 1,328.14 18,520.58Amount Unused 32,071.86 14,679.42Total 33,400.00 33,200.00Amount Used - 5,854.25Amount Unused 2,500.00 5,645.75Total 2,500.00 11,500.00
C. Fair Value Measurements
(i) Financial assets and liabilities that are measured at amortised cost:
As at31 March 2018
As at31 March 2017
` in lacs ` in lacsFinancial Assets (amortised cost):Trade receivables 4,771.72 5,682.68Cash & Cash equivalents 534.88 547.83Other bank balances 68.80 213.09Other financial assets 12,545.76 20,363.58- Premises and other deposits 11,956.94 16,319.67- Others 588.82 4,043.91Financial Liabilities (amortised cost):Borrowings - long term 4,400.08 37,095.64Borrowings - short term 3,834.77 25,400.31Trade payables 51,906.81 49,080.56Other financial liabilities 8,320.31 30,775.98
The fair values of the above financial assets and liabilities approximate their carrying amounts
(ii) Financial assets and liabilities that are measured at fair value on a recurring basis as at the end of each reporting period:
Financial assets /Financial liabilities
Fair value as at Fair value hierarchy31 March 2018 31 March 2017
Fair Value through Profit and LossForward foreign currency contractsInvestment in Mutual FundsFair Value through OCIInvestment in Future Retail Limited
Assets ` 0.39 lacsAssets ` 2,003.55 lacs
Assets ` 26,241.01 lacs
Liabilities ` 0.26 lacsNil
Nil
Level 2Level 1
Level 1
Valuation technique and key input used: Fair value is determined using discounted future cash flows which are estimated based on forward exchange rates at the end of the reporting period, discounted at a rate that reflects the credit risk of the Group.

Annual Report 2017-2018198
NOTES to the consolidated financial statements for the year ended 31 March 2018
39. Additional information as required by Paragraph 2 of the General Instructions for Preparation of Consolidated Financial Statements to Schedule III to the Companies Act, 2013.
FOR THE FINANCIAL YEAR ENDED 31 MARCH 2018
ParticularsNet assets, i.e. total
assets minus total liabilities
Share of profit or lossShare in other
comprehensive incomeShare in total
comprehensive income
As % of consolidated
net assets
Amount (` in lacs.)
As % of consolidated profit or loss
Amount (` in lacs.)
As % of consolidated profit or loss
Amount (` in lacs.)
As % of consolidated profit or loss
Amount (` in lacs.)
Holding CompanyShoppers Stop Limited 101% 91,115.98 129% 27,715.62 100% (704.89) 128% 28,420.51 Subsidiaries (Indian)HyperCity Retail (India)Limited
0% - -28% (6,081.90) 0% - -27% (6,081.90)
Crossword Book Stores Limited
2% 1,574.72 -2% (328.26) 0% - -1% (328.26)
Upasna Trading Limited
0% (87.97) 0% (0.50) 0% - 0% (0.50)
Shopper’s Stop Services (India) Limited
0% 8.60 0% (0.35) 0% - 0% (0.35)
Shopper’s Stop.Com (India) Limited
0% 3.67 0% (0.35) 0% - 0% (0.35)
Gateway Multichannel Retail (India) Limited
-2% (2,171.03) 0% (0.44) 0% - 0% (0.44)
Non controlling interest
0% - 0% - 0% - 0% -
Joint Ventures (as per Equity method)Nuance Group (India) Private Limited
0% - 0% 5.22 0% - 0% 5.22
Timezone Entertainment Private Limited
0% - 1% 137.90 0% - 1% 137.90
FOR THE FINANCIAL YEAR ENDED 31 MARCH 2017
ParticularsNet assets, i.e. total
assets minus total liabilities
Share of profit or lossShare in other
comprehensive incomeShare in total
comprehensive income
As % of consolidated
net assets
Amount (` In lacs.)
As % of consolidated profit or loss
Amount (` In lacs.)
As % of consolidated profit or loss
Amount (` In lacs.)
As % of consolidated profit or loss
Amount (` In lacs.)
Holding CompanyShoppers Stop Limited 72% 34,551.32 3% (228.25) 27% (13.58) 3% (241.83)Subsidiaries (Indian)HyperCity Retail (India) Limited
22% 10,726.97 33% (2,576.07) 0% - 33% (2,576.07)
Crossword Book Stores Limited
2% 1,172.84 4% (294.47) 0% - 4% (294.47)
Upasna Trading Limited
0% (31.19) 0% (0.77) 0% - 0% (0.77)
Shopper’s Stop Services (India) Limited
0% 7.43 0% (0.61) 0% - 0% (0.61)
Shopper’s Stop.Com (India) Limited
0% 4.03 0% (0.63) 0% - 0% (0.63)
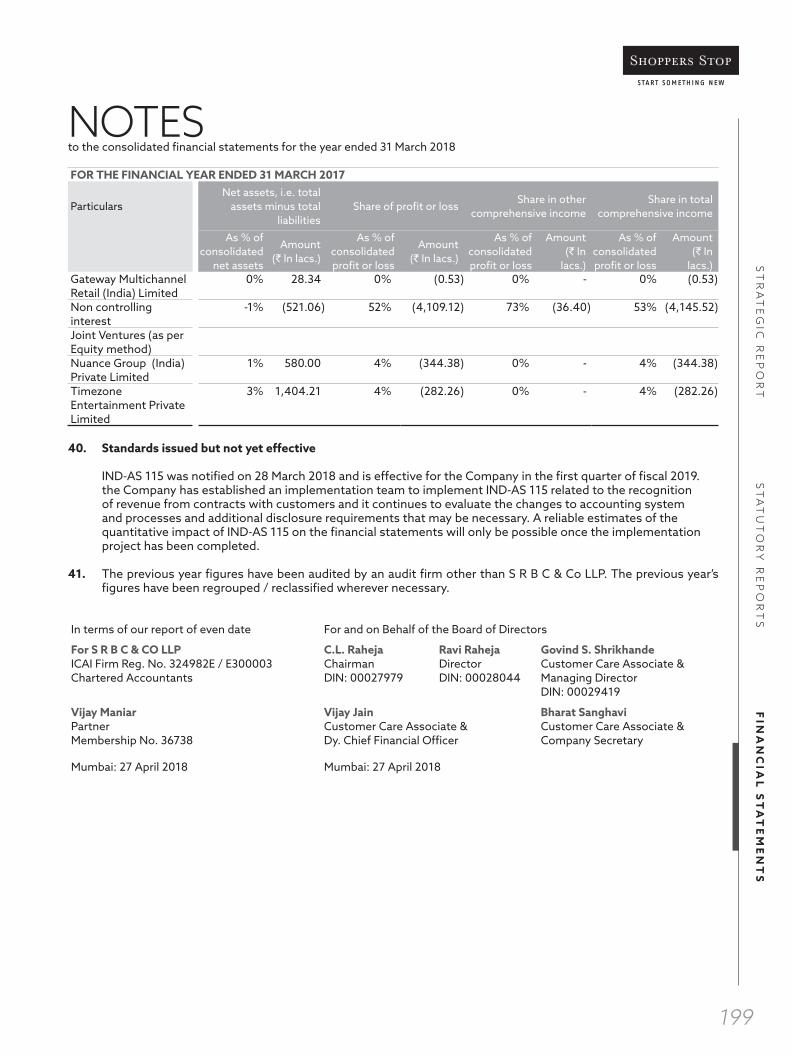
ST
RA
TE
GIC
RE
PO
RT
ST
AT
UT
OR
Y R
EP
OR
TS
FIN
AN
CIA
L S
TA
TE
ME
NT
S
199
NOTES to the consolidated financial statements for the year ended 31 March 2018
FOR THE FINANCIAL YEAR ENDED 31 MARCH 2017
ParticularsNet assets, i.e. total
assets minus total liabilities
Share of profit or lossShare in other
comprehensive incomeShare in total
comprehensive income
As % of consolidated
net assets
Amount (` In lacs.)
As % of consolidated profit or loss
Amount (` In lacs.)
As % of consolidated profit or loss
Amount (` In lacs.)
As % of consolidated profit or loss
Amount (` In lacs.)
Gateway Multichannel Retail (India) Limited
0% 28.34 0% (0.53) 0% - 0% (0.53)
Non controlling interest
-1% (521.06) 52% (4,109.12) 73% (36.40) 53% (4,145.52)
Joint Ventures (as per Equity method)Nuance Group (India) Private Limited
1% 580.00 4% (344.38) 0% - 4% (344.38)
Timezone Entertainment Private Limited
3% 1,404.21 4% (282.26) 0% - 4% (282.26)
40. Standards issued but not yet effective
IND-AS 115 was notified on 28 March 2018 and is effective for the Company in the first quarter of fiscal 2019. the Company has established an implementation team to implement IND-AS 115 related to the recognition of revenue from contracts with customers and it continues to evaluate the changes to accounting system and processes and additional disclosure requirements that may be necessary. A reliable estimates of the quantitative impact of IND-AS 115 on the financial statements will only be possible once the implementation project has been completed.
41. The previous year figures have been audited by an audit firm other than S R B C & Co LLP. The previous year’s figures have been regrouped / reclassified wherever necessary.
In terms of our report of even date For and on Behalf of the Board of Directors
For S R B C & CO LLP C.L. Raheja Ravi Raheja Govind S. ShrikhandeICAI Firm Reg. No. 324982E / E300003 Chairman Director Customer Care Associate &Chartered Accountants DIN: 00027979 DIN: 00028044 Managing Director
DIN: 00029419
Vijay Maniar Vijay Jain Bharat SanghaviPartner Customer Care Associate & Customer Care Associate &Membership No. 36738 Dy. Chief Financial Officer Company Secretary
Mumbai: 27 April 2018 Mumbai: 27 April 2018

ST
RA
TE
GIC
RE
PO
RT
ST
AT
UT
OR
Y R
EP
OR
TS
FIN
AN
CIA
L S
TA
TE
ME
NT
S
STA
TEM
ENT
UN
DER
SEC
TIO
N 1
97 O
F T
HE
CO
MPA
NIE
S A
CT,
201
3 R
EAD
WIT
H R
ULE
5(1
) OF
TH
E C
OM
PAN
IES
(APP
OIN
TM
ENT
AN
D
REM
UN
ERA
TIO
N O
F M
AN
AG
ERIA
L PE
RSO
NN
EL) R
ULE
S, 2
014
.
1.T
HE
RA
TIO
OF
TH
E R
EMU
NER
AT
ION
OF
EAC
H D
IREC
TOR
TO
TH
E M
EDIA
N R
EMU
NER
AT
ION
OF
TH
E EM
PLO
YEE
S O
F T
HE
CO
MPA
NY
FO
R
TH
E FI
NA
NC
IAL
YEA
R 2
017-
18 :
Nam
e of
Dire
ctor
sD
esig
natio
nRa
tio o
f Rem
uner
atio
n of
eac
h D
irect
or to
m
edia
n re
mun
erat
ion
Rem
uner
atio
n
(`)
Mr.
Cha
ndru
L. R
ahej
aC
hairm
an1.
50:1
350
,000
Mr.
Ravi
C. R
ahej
aN
on-e
xecu
tive
Dire
ctor
1.97
:1 4
60,0
00M
r. N
eel C
. Rah
eja
Non
-exe
cutiv
e D
irect
or1.
50:1
350
,000
Prof
. Niti
n Sa
ngha
viN
on-e
xecu
tive
and
Inde
pend
ent D
irect
or3.
47:1
810
,000
Mr.
Dee
pak
Gha
isas
N
on-e
xecu
tive
and
Inde
pend
ent D
irect
or4.
16:1
970
,000
Mr.
Nirv
ik S
ingh
N
on-e
xecu
tive
and
Inde
pend
ent D
irect
or1.
50:1
350
,000
Ms.
Aba
nti S
anka
rana
raya
nan
Non
-exe
cutiv
e an
d In
depe
nden
t Dire
ctor
1.50
:1 3
50,0
00M
r. M
anis
h C
hokh
ani
Non
-exe
cutiv
e an
d In
depe
nden
t Dire
ctor
2.87
:1 6
70,0
00M
r. G
aret
h Th
omas
N
on-e
xecu
tive
and
Inde
pend
ent D
irect
or0.
43:1
100
,000
Mr.
B. S
. Nag
esh
Non
-exe
cutiv
e D
irect
or2.
78:1
650
,000
Mr.
Gov
ind
Shrik
hand
e M
anag
ing
Dire
ctor
205.
96:1
48,
071,
220
Not
es:
1.
The
rem
uner
atio
n of
Non
-Exe
cutiv
e D
irect
ors
cons
ists
of s
ittin
g fe
es &
pay
men
t of C
omm
issi
on, w
here
ver a
pplic
able
.2.
Th
e m
edia
n re
mun
erat
ion
of th
e C
ompa
ny fo
r all
its e
mpl
oyee
s is
` 2
33,3
97 fo
r the
fina
ncia
l yea
r 201
7-18
.
2.T
HE
PER
CEN
TAG
E IN
CR
EASE
IN R
EMU
NER
AT
ION
OF
EAC
H D
IREC
TOR
, CH
IEF
FIN
AN
CIA
L O
FFIC
ER, C
HIE
F EX
ECU
TIV
E O
FFIC
ER, C
OM
PAN
Y
SEC
RET
ARY
IN T
HE
FIN
AN
CIA
L Y
EAR
201
7-18
AS
CO
MPA
RED
TO
FIN
AN
CIA
L Y
EAR
201
6-17
:
Nam
e of
Dire
ctor
s an
d KM
PsD
esig
natio
n%
incr
ease
/ d
ecre
ase
in R
emun
erat
ion
Mr.
Cha
ndru
L. R
ahej
a C
hairm
an75
.00%
Mr.
Ravi
C. R
ahej
a N
on-e
xecu
tive
Dire
ctor
27.7
8%M
r. N
eel C
. Rah
eja
Non
-exe
cutiv
e D
irect
or75
.00%
Prof
. Niti
n Sa
ngha
vi
Non
-exe
cutiv
e an
d In
depe
nden
t Dire
ctor
22.7
3%M
r. D
eepa
k G
hais
as
Non
-exe
cutiv
e an
d In
depe
nden
t Dire
ctor
-3.0
0%M
r. N
irvik
Sin
gh
Non
-exe
cutiv
e an
d In
depe
nden
t Dire
ctor
-22.
22%
Ms.
Aba
nti S
anka
rana
raya
nan
Non
-exe
cutiv
e an
d In
depe
nden
t Dire
ctor
-22.
22%
Mr.
Man
ish
Cho
khan
i N
on-e
xecu
tive
and
Inde
pend
ent D
irect
or9.
84%
Mr.
Gar
eth
Thom
as
Non
-exe
cutiv
e an
d In
depe
nden
t Dire
ctor
(upt
o 26
.10.
2017
)-7
7.78
%

Annual Report 2017-2018
Nam
e of
Dire
ctor
s an
d KM
PsD
esig
natio
n%
incr
ease
/ d
ecre
ase
in R
emun
erat
ion
Mr.
B. S
. Nag
esh
Non
-exe
cutiv
e D
irect
or
30.0
0%M
r. G
ovin
d Sh
rikha
nde
Man
agin
g D
irect
or6.
00%
Mr.
Salil
Nai
r C
hief
Exe
cutiv
e O
ffice
r (up
to 3
1.05
.201
7)N
.A.
Mr.
Sanj
ay C
hakr
avar
ti C
hief
Fin
anci
al O
ffice
r (up
to 2
2.12
.201
7)6.
50%
Mr.
Bhar
at S
angh
avi
Com
pany
Sec
reta
ry
6.50
%M
r. Ra
jiv S
uri
Chi
ef E
xecu
tive
Offi
cer (
w.e
.f. 0
9.01
.201
8)N
.A.
Not
es:
1.
The
varia
tion
in p
erce
ntag
e of
rem
uner
atio
n of
non
-exe
cutiv
e di
rect
ors
is o
n ac
coun
t of
rec
eipt
of
sitt
ing
fees
, dur
ing
the
year
und
er r
evie
w, v
is a
vis
the
pre
cedi
ng
finan
cial
yea
r.2.
M
r. Sa
lil N
air,
Chi
ef E
xecu
tive
Offi
cer o
f the
Com
pany
had
resi
gned
from
the
ser
vice
s of
the
Com
pany
with
eff
ect
from
May
31,
201
7. T
he B
oard
has
app
oint
ed M
r. Ra
jiv
Suri
as C
hief
Exe
cutiv
e O
ffice
r of t
he C
ompa
ny w
.e.f.
Janu
ary
09, 2
018.
Hen
ce p
erce
ntag
e in
crea
se/d
ecre
ase
cann
ot b
e co
mpu
ted
in th
is re
gard
.
3.T
HE
PER
CEN
TAG
E IN
CR
EASE
IN T
HE
MED
IAN
REM
UN
ERA
TIO
N O
F EM
PLO
YEE
S IN
TH
E FI
NA
NC
IAL
YEA
R 2
017-
18:
The
perc
enta
ge in
crea
se in
the
med
ian
rem
uner
atio
n of
all
empl
oyee
s in
the
finan
cial
yea
r was
7.7
5%.
4.
TH
E N
UM
BER
OF
PER
MA
NEN
T E
MPL
OY
EES
ON
TH
E R
OLL
S O
F C
OM
PAN
Y A
S O
N M
AR
CH
31,
201
8:Th
e nu
mbe
r of p
erm
anen
t em
ploy
ees
on th
e ro
lls o
f Com
pany
as
on M
arch
31,
201
8 w
ere
7,48
0 C
CA
s.
5.
AV
ERA
GE
PER
CEN
TIL
E IN
CR
EASE
ALR
EAD
Y M
AD
E IN
TH
E SA
LAR
IES
OF
EMPL
OY
EES
OT
HER
TH
AN
TH
E M
AN
AG
ERIA
L PE
RSO
NN
EL IN
T
HE
LAST
FIN
AN
CIA
L Y
EAR
AN
D IT
S C
OM
PAR
ISO
N W
ITH
TH
E PE
RC
ENT
ILE
INC
REA
SE IN
TH
E M
AN
AG
ERIA
L R
EMU
NER
AT
ION
AN
D
JUST
IFIC
AT
ION
TH
EREO
F A
ND
PO
INT
OU
T IF
TH
ERE
AR
E A
NY
EX
CEP
TIO
NA
L C
IRC
UM
STA
NC
ES F
OR
INC
REA
SE IN
TH
E M
AN
AG
ERIA
L R
EMU
NER
AT
ION
: Th
e av
erag
e pe
rcen
tage
incr
ease
in s
alar
ies
for e
mpl
oyee
s ot
her t
han
man
ager
ial p
erso
nnel
was
7.7
5 %
. The
ave
rage
per
cent
age
incr
ease
in s
alar
ies
for
man
ager
ial p
erso
nnel
was
5%
. The
ben
ch m
ark
for s
alar
y in
crea
se w
as d
one
base
d on
the
com
pens
atio
n su
rvey
con
duct
ed b
y th
e C
ompa
ny.
6. It
is a
ffirm
ed th
at th
e re
mun
erat
ion
paid
to th
e di
rect
ors,
key
man
ager
ial p
erso
nnel
and
mem
bers
of s
enio
r man
agem
ent t
eam
is a
s pe
r the
App
oint
men
t an
d Re
mun
erat
ion
of D
irec
tors
and
Sen
ior M
anag
emen
t Po
licy
of t
he C
ompa
ny.

ST
RA
TE
GIC
RE
PO
RT
ST
AT
UT
OR
Y R
EP
OR
TS
FIN
AN
CIA
L S
TA
TE
ME
NT
S
STA
TEM
ENT
UN
DER
SEC
TIO
N 1
97 O
F T
HE
CO
MPA
NIE
S A
CT,
201
3 R
EAD
WIT
H R
ULE
5(2
) & (3
) OF
TH
E C
OM
PAN
IES
(APP
OIN
TM
ENT
AN
D
REM
UN
ERA
TIO
N O
F M
AN
AG
ERIA
L PE
RSO
NN
EL) R
ULE
S, 2
014
, AS
AM
END
ED, F
OR
TH
E Y
EAR
EN
DED
MA
RC
H 3
1, 2
018.
Sr.
No.
Nam
e &
Qua
lifica
tion
of E
mpl
oyee
sA
ge
(Yea
rs)
Des
igna
tion
Dat
e of
C
omm
ence
men
t of
Em
ploy
men
t
Gro
ss
Rem
uner
atio
n (`)
Expe
rienc
e (Y
ears
)La
st E
mpl
oym
ent h
eld
and
desi
gnat
ion
ther
ein
1M
r. G
ovin
d Sh
rikha
nde
B.Te
ch, M
BA57
Cus
tom
er C
are
Ass
ocia
te &
Man
agin
g D
irect
or
03-0
4-01
48,
071,
220
34Bo
mba
y D
yein
g &
M
anuf
actu
ring
Co.
Ltd
. V
ice
Pres
iden
t -
Reta
il D
ivis
ion
2M
r. A
min
Kas
sam
B.
Sc62
Cus
tom
er C
are
Ass
ocia
te &
Chi
ef o
f Re
tail
Ope
ratio
ns
04-0
1-17
16,
403,
145
41Re
lianc
e Tr
ends
Ltd
. -
Chi
ef O
pera
ting
Offi
cer
3M
r. G
opal
Ast
hana
B.
E, C
FA46
Cus
tom
er C
are
Ass
ocia
te &
Hea
d -
Buyi
ng &
Mer
chan
disi
ng
28-0
1-98
12,
462,
257
21H
R Jo
hnso
n Lt
d. -
Pr
ojec
t Eng
inee
r
4M
r. BV
M R
ao
B.C
om, M
SW56
Cus
tom
er C
are
Ass
ocia
te &
Hea
d -
Hum
an R
esou
rces
08-0
5-08
9,3
03,9
12
28Fo
od E
xpre
ss S
tore
s V
ice
Pres
iden
t -
Hyp
erm
arke
t & O
ps5
Mr.
Dev
adas
C
B.C
om54
Cus
tom
er C
are
Ass
ocia
te &
Hea
d -
Supp
ly c
hain
01-1
2-97
8,3
03,9
71
31Iv
ory
Prop
erty
& H
otel
Pv
t. L
td.
Ass
ista
nt M
anag
er -
Dis
trib
utio
n6
Mr.
Satis
h Sh
arm
a B.
Arc
h, M
BA49
Cus
tom
er C
are
Ass
ocia
te &
Hea
d of
St
ore
Plan
ning
21-0
3-07
7,0
48,9
38
25IT
C L
imite
d M
anag
er -
Proj
ect
7M
r. Sa
chin
Osw
al
B.E
(Ele
ctro
nics
), M
.S.E
.E38
Cus
tom
er C
are
Ass
ocia
te &
Hea
d -
Om
ni C
hann
el R
etai
l
08-0
1-15
6,8
61,4
50
16In
fibea
m.c
om (I
nfibe
am
Inco
rpor
atio
n Lt
d)
Chi
ef O
pera
ting
Offi
cer
8M
r. A
nil S
hank
ar A
rasa
villi
B.
A.,
Dip
lom
a in
RD
BMS
(Ora
cle)
46C
usto
mer
Car
e A
ssoc
iate
& H
ead
- So
lutio
ns &
Tec
hnol
ogy
24-0
5-99
6,7
94,3
86
20St
erlin
g Re
sort
s Se
nior
Exe
cutiv
e - S
yste
ms
9M
r. Sh
amsu
ndar
Kam
at
B.E
, MM
S46
Cus
tom
er C
are
Ass
ocia
te &
Reg
iona
l C
ontr
olle
r
15-0
3-99
6,3
12,8
39
22Io
n Ex
chan
ge (I
)Ltd
Se
nior
Exe
cutiv
e
10M
r. V
ikra
m C
hitn
is
B. T
extil
e, D
iplo
ma
in L
.T.M
53
Cus
tom
er C
are
Ass
ocia
te &
Sr.
Trad
ing
Man
ager
23-1
0-02
6,1
39,1
09
28Eu
ro F
ibre
Indi
a G
ener
al M
anag
er -
Mar
ketin
g

Annual Report 2017-2018
EMPL
OY
ED F
OR
PA
RT
OF
TH
E FI
NA
NC
IAL
YEA
R W
ITH
AN
AV
ERA
GE
SALA
RY A
BOV
E `
8.5
LAC
PER
MO
NT
H
Sr.
No.
Nam
e &
Qua
lifica
tion
of E
mpl
oyee
sA
ge
(Yea
rs)
Des
igna
tion
Dat
e of
C
omm
ence
men
t of
Em
ploy
men
t
Gro
ss
Rem
uner
atio
n (`)
Expe
rienc
e (Y
ears
)La
st E
mpl
oym
ent h
eld
and
desi
gnat
ion
ther
ein
1M
r. Sa
lil N
air
B.Sc
, M.S
c53
Cus
tom
er C
are
Ass
ocia
te &
Chi
ef
Exec
utiv
e O
ffice
r
01-1
2-97
15,
567,
998
30Iv
ory
Prop
erty
& H
otel
Pv
t. L
td.
Seni
or M
anag
er -
Ope
ratio
ns2
Mr.
Sanj
ay C
hakr
avar
ti B.
Com
, C.A
48C
usto
mer
Car
e A
ssoc
iate
& C
hief
Fi
nanc
ial O
ffice
r
17-1
0-05
10,
366,
338
25Tr
inity
Com
pute
r Pro
cess
ing
Indi
a Pv
t. L
td.
Sr. M
anag
er -
US
Acc
ount
ing
3M
s. S
hilp
a G
ulat
ee
B.A
, Fas
hion
Des
igni
ng48
Cus
tom
er C
are
Ass
ocia
te &
Hea
d-
Priv
ate
Bran
d
31-0
8-15
4,5
43,8
86
23Ja
bong
.com
(J
ade
E Se
rvic
es P
vt. L
td.)
V
P - P
rivat
e Br
ands
4M
r. Ra
jiv S
uri
B.C
om, P
GD
- Sa
les
& M
arke
ting
Mgm
t, P
GD
- Bu
sine
ss M
gmt,
St
rate
gic
Reta
il M
gmt
55C
usto
mer
Car
e A
ssoc
iate
& C
hief
Ex
ecut
ive
Offi
cer
09-0
1-18
10,
021,
884
33M
ajid
Al F
utta
im, D
ubai
, UA
E C
hief
Exe
cutiv
e O
ffice
r
Not
es:
1.
The
Gro
ss re
mun
erat
ion
incl
udes
sal
ary,
bon
us, v
ario
us a
llow
ance
s, p
erfo
rman
ace
linke
d in
cent
ives
, tax
able
val
ue o
f per
quis
ites
incl
udin
g ES
OP
and
grat
uity
pai
d bu
t ex
clud
ing
grat
uity
pro
visi
on.
2.
Non
e of
the
empl
oyee
s m
entio
ned
abov
e ar
e re
lativ
e of
any
dire
ctor
s of
the
Com
pany
.3.
N
one
of th
e em
ploy
ees
men
tione
d he
rein
abo
ve h
old
him
self
or a
long
with
spo
use
and
depe
nden
t chi
ldre
n, tw
o pe
rcen
t or m
ore
of th
e eq
uity
sha
res
of th
e C
ompa
ny.
4.
The
natu
re o
f em
ploy
men
t in
all c
ases
are
con
trac
tual
. The
oth
er te
rms
and
cond
ition
s ar
e as
per
Com
pany
’s R
ules
.

NOTES


aicl
.inC
on
cep
t, c
on
ten
t an
d d
esig
n a
t