setting performance objectives using apdexapdex.org/documents/44asevcikperformanceobjectives.pdf ·...
TRANSCRIPT
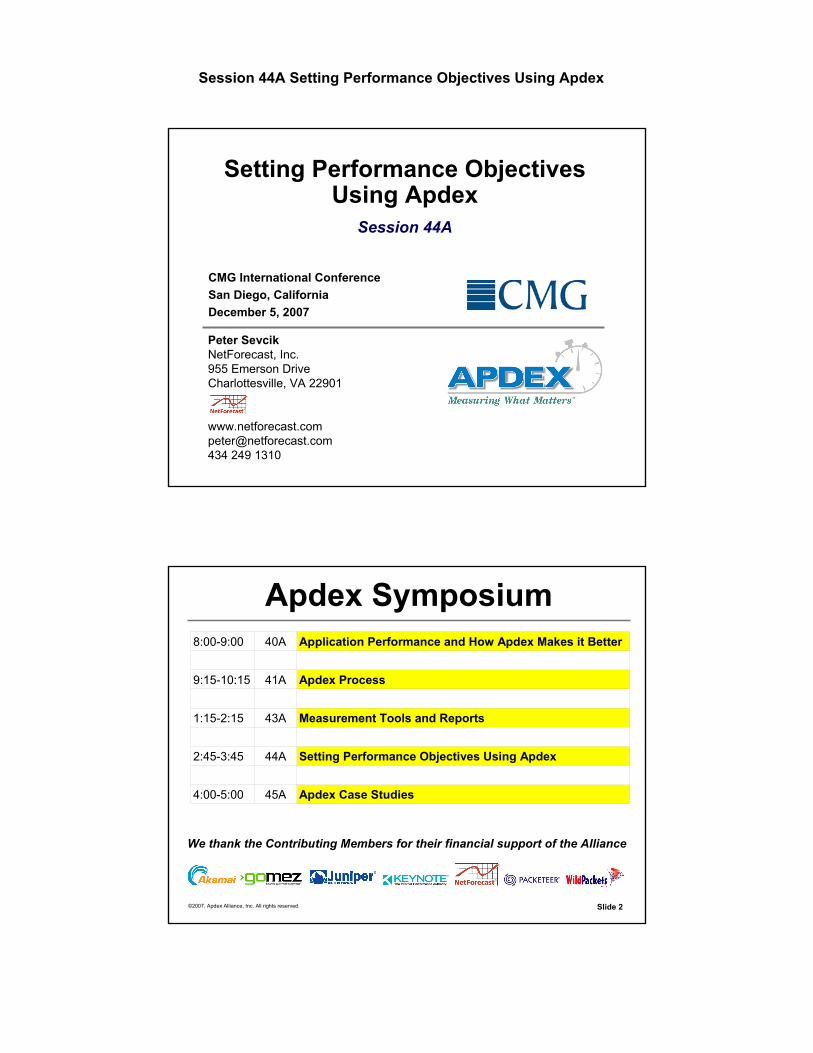
Session 44A Setting Performance Objectives Using Apdex
Setting Performance Objectives Using Apdex
CMG International ConferenceSan Diego, CaliforniaDecember 5, 2007
Peter SevcikNetForecast, Inc.955 Emerson DriveCharlottesville, VA 22901
[email protected] 249 1310
Session 44A
©2007, Apdex Alliance, Inc. All rights reserved. Slide 2
Apdex Symposium
Apdex Case Studies45A4:00-5:00
Setting Performance Objectives Using Apdex44A2:45-3:45
Measurement Tools and Reports43A1:15-2:15
Apdex Process41A9:15-10:15
Application Performance and How Apdex Makes it Better40A8:00-9:00
We thank the Contributing Members for their financial support of the Alliance

Session 44A Setting Performance Objectives Using Apdex
©2007, Apdex Alliance, Inc. All rights reserved. Slide 3
Outline
Setting Apdex TSetting a Turn-Based TGetting to an SLACase Study
© 1990-2007 NetForecast, Inc., All rights reserved.
©2007, Apdex Alliance, Inc. All rights reserved. Slide 4
The Apdex Methodology
Mark Start Validate Deliver Improve
ApdexBusiness
SLA
SLAApdexGoals
Initial Apdex
Score Data
Apdex Goal
SLABusiness
Group
SLAUser
Groups
General User
Population
Observed Users
Report Group
SLAT
SLATsValidated TInitial
TT
MarkersTarget
T
Find earlyindicators
For T
Gather & reportfirst results
Show resultscorrelating tothe Business
Define & trackSLAs
Performquality
improvements
Presented at the 2006 Apdex Symposium and Available on the Apdex Exchange

Session 44A Setting Performance Objectives Using Apdex
©2007, Apdex Alliance, Inc. All rights reserved. Slide 5
Understanding Tasks
T is set by the Apdex report technicianFocus the process
Only need to understand a handful of tasks users perform very frequentlyOnly need to involve a few peopleThe combination of many Tasks and many opinions will sink the process!
Users really do use a few tasks repeatedlyThese are the tasks that will sway user satisfaction
Avoid unusual tasksLogin is a special case that should probably not be studied
©2007, Apdex Alliance, Inc. All rights reserved. Slide 6
What is a T Marker?
A T Marker (TM) is an indicator of the user satisfied-tolerating boundary for an applicationSome T Markers have a greater than or less than propertyMultiple T Markers can be used to converge on an initial T value
T F0
Satisfied Tolerating Frustrated
(F = 4T)
Performance Zone Boundaries
M1 M2
M3

Session 44A Setting Performance Objectives Using Apdex
©2007, Apdex Alliance, Inc. All rights reserved. Slide 7
T Marker Alternatives
1. Default Value2. Empirical Data3. User Behavior Model4. Outside References5. Observing the User6. Controlled Performance Experiment7. Best Time Multiple8. Frustration Indicator9. Interview Stakeholders10.Mathematical Inflection Point
©2007, Apdex Alliance, Inc. All rights reserved. Slide 8
1 – Default Value
The Apdex Alliance has defined a basic starting point for T of 4 seconds
All tools will ship with a default setting of T that will be selected by the tool vendor. The default enables the tool to begin supplying information with minimal set-up by the technician. It is recommended that the default target threshold value, T, be set to 4 seconds. Technicians have the ability to change this default setting as defined above.
– Apdex Technical Specification, V1.1, January 22, 2007
This is generally viewed as a low T valueSo this marker should be viewed as:T is greater than 4

Session 44A Setting Performance Objectives Using Apdex
©2007, Apdex Alliance, Inc. All rights reserved. Slide 9
2 – Empirical Data
Study information already in your organizationFocus on a group of users
Measure task response times at well known locations (e.g., headquarters)– Measure during the business day and study users at these locations
Determine how well performance is meeting business needsFind T that returns the proper Apdex for this well studied group
Look across user groupsDetermine the task response times for different regions of the worldCorrelate help desk calls with response time measurementsAre the users in Asia complaining about a response time of X while users in New York do not complain with their response time of Y?T is between Y and X
©2007, Apdex Alliance, Inc. All rights reserved. Slide 10
3 – User Behavior Model
How users set their performance expectationA user is prepared to invest time to receive information from a computer in direct proportion to the time he or she will spend processing that informationThe user has a preset expectation for their processing time when he or she requests the data
There are two factors that determine how much time the user puts into the preconceived personal data processing budget:
Interest: number of objects, fields, sentences the user will notice or readRepetitiveness of the session or process

Session 44A Setting Performance Objectives Using Apdex
©2007, Apdex Alliance, Inc. All rights reserved. Slide 11
Counting Interest Elements
OneSimple check boxOne data entry field: enter part number
FewSelect among the following optionsExpected few lines: headers of recently arrived email
SeveralType your first name, last name, address, phone numberInformation on product, prices, shipping alternatives, etc.– The user will typically only be interested in a few of these information
fields, do not assume if you present 20, the user will read 20
ManyInteresting report that is readScrolling down the page for more content
©2007, Apdex Alliance, Inc. All rights reserved. Slide 12
Rating Repetitiveness
Very HighThere are many short tasks to the process
HighThere are a few tasks to the process
LowSometimes there are a few tasks, sometimes there is browsing
Very LowThe user is browsing, there is no actual process being performed
Session 44A Setting Performance Objectives Using Apdex
©2007, Apdex Alliance, Inc. All rights reserved. Slide 13
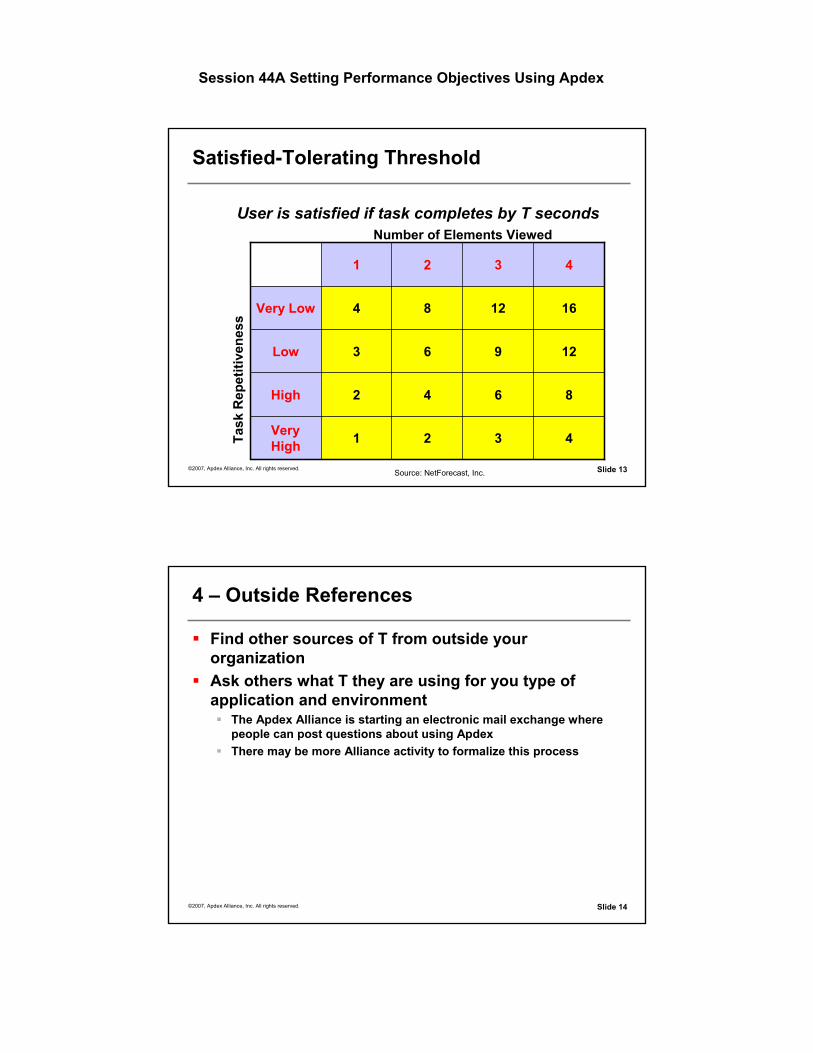
Satisfied-Tolerating Threshold
4321Very High
8642High
12963Low
161284Very Low
4321
Number of Elements ViewedTa
sk R
epet
itive
ness
User is satisfied if task completes by T seconds
Source: NetForecast, Inc.
©2007, Apdex Alliance, Inc. All rights reserved. Slide 14
4 – Outside References
Find other sources of T from outside your organizationAsk others what T they are using for you type of application and environment
The Apdex Alliance is starting an electronic mail exchange wherepeople can post questions about using ApdexThere may be more Alliance activity to formalize this process

Session 44A Setting Performance Objectives Using Apdex
©2007, Apdex Alliance, Inc. All rights reserved. Slide 15
Jupiter Research Study
Detailed survey of Web retail users
572 broadband users in surveyJune 2006
Question: “Typically, how long are you willing to wait for a single Web page to load before leaving the Web site?”Study conclusion is that Web pages should load in less than 4 secondsUser answers to these kind of questions are often misleading
0% 5% 10% 15% 20% 25% 30% 35% 40%
<1 sec
1-2 sec
3-4 sec
5-6 sec
>6 sec
©2007, Apdex Alliance, Inc. All rights reserved. Slide 16
NetForecast Past Cases
4321Very High
8642High
12963Low
161284Very Low
4321
Number of Elements Viewed
Task
Rep
etiti
vene
ss
NetForecast has applied the Apdex methodology in several projectswith the following customer accepted selection of T
CIFS
MAPI
B-B Web
SNA
SAP
eCRM
CRM
SCM
eTrans
eShop
Web Browsing
FTP 2MB10
Source: NetForecast, Inc.

Session 44A Setting Performance Objectives Using Apdex
©2007, Apdex Alliance, Inc. All rights reserved. Slide 17
5 – Observing the User
There is no substitute for understanding your usersFind an experienced user of the applicationAsk them to perform a set of typical tasks they perform daily
The user will often really perform a process with several tasks in a series (task chain)Ask the user to perform each step (task) at a slow pace (lots of time between each step)It is often easy to get the pauses between each step by having the user describe each step (the talking slows them down)
Observe the screenSit along-side the user with a stop watchTime each step (task) from seeing “enter” to “screen refreshed”Keep the watch out of the user’s viewTake notes after each series of tasksOr you can use a packet sniffer (e.g. Ethereal) to get the timings
Observe the userNotice the user’s body language
– Is she fidgeting while waiting for the system to respond?– Is she rolling her eyes?– Does she complain, “See that? It is too slow”
At the end of each process (task chain) ask the user if the system was responding at a typical paceAsk if it ever gets slower of faster
©2007, Apdex Alliance, Inc. All rights reserved. Slide 18
User Observations Summary
At the end of the session with the user, quickly summarize the conclusionsTypical tasks performedTypical response times
What looked like a “good enough” times (<T)– These are often the times where the user stops the narration and just does the
next step (she is focused on the process and jumps to the next step)What looked like a “not focused on the process” times (>T)
– Body language indicatorsWhat looked like a “frustrating” times (>4T)
– Body language or statements of complaints
Integrate several observation sessionsPerform the user observations with more than one userHave more than one person perform the observationsDiscuss the conclusion among the observers Integrate the observations into a single good T Marker (in this case T=TM)
Session 44A Setting Performance Objectives Using Apdex
©2007, Apdex Alliance, Inc. All rights reserved. Slide 19
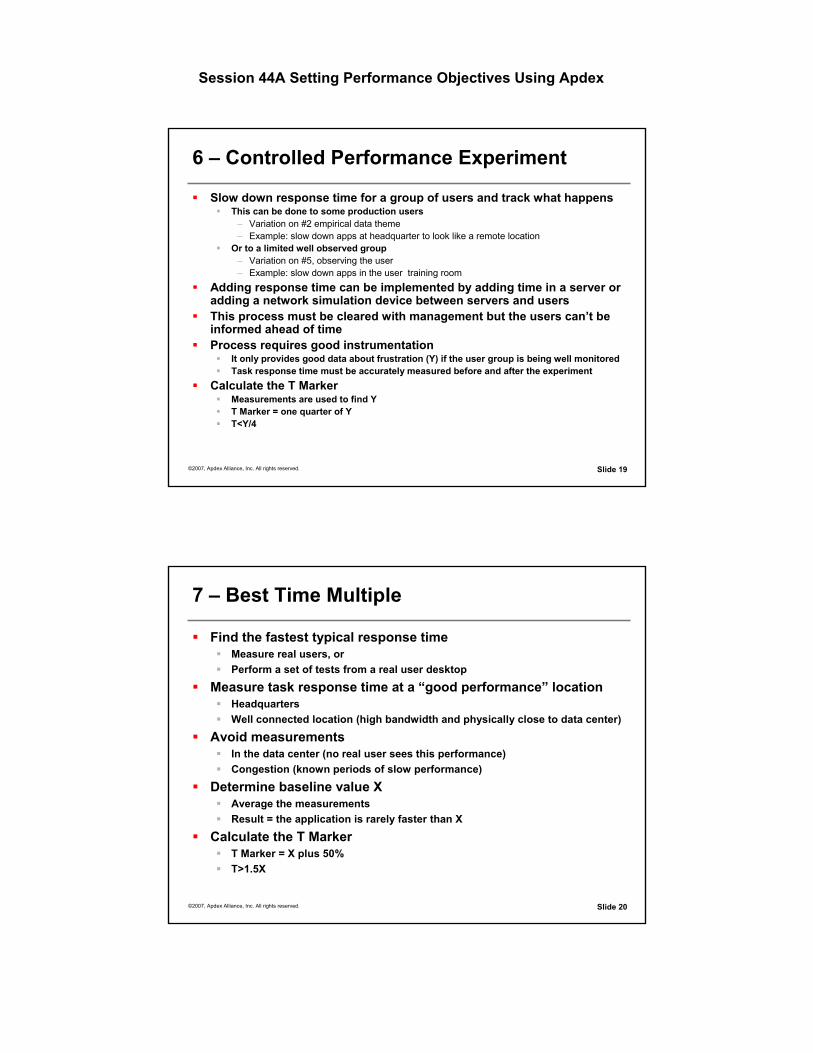
6 – Controlled Performance Experiment
Slow down response time for a group of users and track what happensThis can be done to some production users
– Variation on #2 empirical data theme– Example: slow down apps at headquarter to look like a remote location
Or to a limited well observed group– Variation on #5, observing the user– Example: slow down apps in the user training room
Adding response time can be implemented by adding time in a server or adding a network simulation device between servers and usersThis process must be cleared with management but the users can’t be informed ahead of timeProcess requires good instrumentation
It only provides good data about frustration (Y) if the user group is being well monitoredTask response time must be accurately measured before and after the experiment
Calculate the T MarkerMeasurements are used to find YT Marker = one quarter of YT<Y/4
©2007, Apdex Alliance, Inc. All rights reserved. Slide 20
7 – Best Time Multiple
Find the fastest typical response timeMeasure real users, orPerform a set of tests from a real user desktop
Measure task response time at a “good performance” locationHeadquartersWell connected location (high bandwidth and physically close to data center)
Avoid measurementsIn the data center (no real user sees this performance)Congestion (known periods of slow performance)
Determine baseline value XAverage the measurementsResult = the application is rarely faster than X
Calculate the T MarkerT Marker = X plus 50%T>1.5X

Session 44A Setting Performance Objectives Using Apdex
©2007, Apdex Alliance, Inc. All rights reserved. Slide 21
8 – Frustration Indicator
You may not know how fast is fast enough but you may know how slow is too slowLook for clear indications of too slow
People complain at YA business manager reports, “productivity really slows down at Y seconds response time”Industry survey of user actions at some time periodsFilming user behavior– There are many sources of video observations of users interacting with
the system where Y can be measured– Pumping gasoline– Using an ATM machine
Calculate the T MarkerT Marker = one quarter of YT<Y/4
©2007, Apdex Alliance, Inc. All rights reserved. Slide 22
9 – Interview Stakeholders
Talk to many people that have a stake in the specific application performing well
Business managerUserApplication developer
Ask several questions all dealing with two issues:How fast is fast enough?How slow is too slow?
Calculate T MarkerThe results of the polling will vary greatlyThe values are typically too low compared to the actual value of TIntegrate the results into two values X=fast, Y=slowT Marker = the mid-point between X and YT>(X+Y)/2

Session 44A Setting Performance Objectives Using Apdex
©2007, Apdex Alliance, Inc. All rights reserved. Slide 23
10 – Mathematical Inflection Point
Measure a single application over timeThe application is generally performing wellGather many task response time valuesLimit the data set to the business day
Calculate Apdex for a range of T values across the data setCalculate T Marker
Plot the results of Apdex versus TCalculate the varying slope of the Apdex curveThere will be a few places where the curve has a high slopeT Marker = first inflection point (high slope) nearest the highest TT>TM
©2007, Apdex Alliance, Inc. All rights reserved. Slide 24
Example Set of Measurements
-
500
1,000
1,500
2,000
2,500
3,000
3,500
4,000
- 0.5 1.0 1.5 2.0 2.5 3.0 3.5 4.0 4.5 5.0 5.5 6.0 6.5 7.0 7.5 8.0 8.5 9.0 9.5 10.0 10.5 11.0 11.5 12.0
Time (sec)
Cou
nt

Session 44A Setting Performance Objectives Using Apdex
©2007, Apdex Alliance, Inc. All rights reserved. Slide 25
Apdex Versus T
0.00
0.10
0.20
0.30
0.40
0.50
0.60
0.70
0.80
0.90
1.00
0 1 2 3 4 5 6T
Apdex [ T ]
d(Apdex [ T ])
T Marker = 3.7
Find first peak slopefrom the highest T
©2007, Apdex Alliance, Inc. All rights reserved. Slide 26
Using T Markers to Select Initial T
Collect more than one T MarkerYou may have to throw out a TM that conflicts with all the othersFind a good value that makes sense given the evidence gatheredThis is the Initial T
InitialT0
M1 M2
M3M4

Session 44A Setting Performance Objectives Using Apdex
©2007, Apdex Alliance, Inc. All rights reserved. Slide 27
Validating T
Reporting application performance to management requires some more rigorMeasure the application using the Initial T
Acquire a history of at least a month of dataTrack Apdex resultsTrack user conditionsTrack business conditions
Do the Apdex values really show the user experience performance with the application?
Adjust T across the historic data until you can say yes
©2007, Apdex Alliance, Inc. All rights reserved. Slide 28
Process for Setting the Apdex T
Ongoing Task TimeMeasurements
(at least 1 month)
Asses UserSatisfaction
CalculateApdex Reports
Do Apdexand observations
correlate?No
Adjust T
SelectInitial T
UnderstandApplication Tasks
Observe UserSatisfaction
Yes
Determine SomeT Markers
T
Validated T
Initial ApdexScore Data

Session 44A Setting Performance Objectives Using Apdex
©2007, Apdex Alliance, Inc. All rights reserved. Slide 29
How Apdex T Marker is Set(From Apdex Users Survey)
0% 2% 4% 6% 8% 10% 12% 14% 16% 18% 20%
Controlled Experiment
User Behavior Model
Mathematical Inflection
Outside References
Best Time Multiple
Frustration Indicator
Observing the User
Interview Stakeholders
Empirical Data
Default Value
©2007, Apdex Alliance, Inc. All rights reserved. Slide 30
Range of Apdex T Being Used
0 2 4 6 8 10 12Min-Max Apdex Ts In Use (sec)
73% use a range of Apdex T shown here27% use the default 4 seconds

Session 44A Setting Performance Objectives Using Apdex
©2007, Apdex Alliance, Inc. All rights reserved. Slide 31
Outline
Setting Apdex TSetting a Turn-Based TGetting to an SLACase Study
© 1990-2007 NetForecast, Inc., All rights reserved.
©2007, Apdex Alliance, Inc. All rights reserved. Slide 32
Converting from Task T to Turn T
Tasks are made up of turnsGiven a task time T, we can calculate a turn time T [turn] that represents an equivalent Apdex objectiveA turn-based T is a combination (pairing) of user activity and an application implementation
This requires profiling the application to understand key parameters
Turns per taskPayload per taskMultiplexing factor– Application level multithreading such that some of the turns operate in
parallel
Fortunately, once an application is profiled, the profile is very stable over time
It requires a major architectural change to the application to significantly change the profile

Session 44A Setting Performance Objectives Using Apdex
©2007, Apdex Alliance, Inc. All rights reserved. Slide 33
Typical Target Times
4Supply Chain Management (SCM)
12File Server Access
2Enterprise Resource Planning (ERP)
9eMail
3Customer Relationship Management (CRM)
10Business-to-Consumer (B-to-C)
6Business-to-Business (B-to-B)
T (sec)User Activity
Satisfied Zone Target Task Times
©2007, Apdex Alliance, Inc. All rights reserved. Slide 34
Typical Application Profiles
1
10
100
1,000
Payload per Task (Bytes)
App
licat
ion
Turn
s pe
r Tas
k (c
ount
)
1,000 10K 100K 1M 10M
CIFS
SAPGUI
SAPWeb
MAPI
WEB2002
WEB2007

Session 44A Setting Performance Objectives Using Apdex
©2007, Apdex Alliance, Inc. All rights reserved. Slide 35
Web Page on the Network
Task time = 5 secTurns = 32The application is multi-threaded (performs subtasks in parallel)
This browser-server pair achieved 3But only 2 were effective
The TCP sessions (connections) stayed open after the Task completed
One TCP connection stays open throughout the page load
Two connectionsat the end do not
close
M = 32 threads plus 1 above
This Task took 5 secondsStart End
©2007, Apdex Alliance, Inc. All rights reserved. Slide 36
Turn Conversion Formula
( ) 10001][ xMxTurnsTturnT +⎟
⎠⎞
⎜⎝⎛=
Where:T [turn] is the target time for satisfactory user response time
(milliseconds)T is the task target time for satisfactory user response time
(seconds)Turns is the typical number of turns per task for the
applicationM is the multiplexing factor (multithreading) associated with
the application

Session 44A Setting Performance Objectives Using Apdex
©2007, Apdex Alliance, Inc. All rights reserved. Slide 37
T [turn] Result for Example Applications
400100Supply Chain Management (SCM)
10020File Server Access
500100Enterprise Resource Planning (ERP)
20060eMail
600160Customer Relationship Management (CRM)
300100Business-to-Consumer (B-C)
800150Business-to-Business (B-B)
HighLowUser Activity
T [turn] (msec)
Satisfied Zone T [turn] Example Ranges
©2007, Apdex Alliance, Inc. All rights reserved. Slide 38
Method Will Require Tuning
Start by measuring and calculating Apdex with the suggested TDo this near the users (remote locations)Make sure that the performance at the locations is well understood
– It should be generally good with a few “poor” periods– Not the data center and not the other side of the world
Do this with some granularity (like once per hour)But you must have at least 100 samples per Apdex resultTrack the results over about 2 weeks
If the Apdex score:Is always very high (>0.95) then the T is too shortIs always very low (<0.50) then the T is too longVaries in correlation to other indications of performance issues, then the T is correct
Adjust T until you get good correlation with user conditionsThis can be done retroactively with the already gathered measurement samples

Session 44A Setting Performance Objectives Using Apdex
©2007, Apdex Alliance, Inc. All rights reserved. Slide 39
Outline
Setting Apdex TSetting a Turn-Based TGetting to an SLACase Study
© 1990-2007 NetForecast, Inc., All rights reserved.
©2007, Apdex Alliance, Inc. All rights reserved. Slide 40
Using Apdex in a SLA
Service Level Agreements (SLAs) are an important IT management instrumentAn SLA is a negotiation among two parties
Service providerService consumer
Unfortunately performance goals are often described in terms meaningful to the service provider but not the service consumerApdex can make an SLA really mean something to the businessApdex introduces a new language for the negotiation
and it is an industry standard!

Session 44A Setting Performance Objectives Using Apdex
©2007, Apdex Alliance, Inc. All rights reserved. Slide 41
When to Move to an Apdex SLA?
Do not jump to using Apdex for an SLAThere are several conditions that should be met before moving tothis level
You must be prepared for the SLA negotiationsThe application has undergone the Apdex Validation PhaseYou understand the application very wellYou have hard data on current performance
You must have a cross-functional team participate in the negotiations
Business manager who relies on the applicationRepresentative of the user communityVarious IT infrastructure representatives (data center, servers,network, etc)Finance representative (money always enters the discussions)
©2007, Apdex Alliance, Inc. All rights reserved. Slide 42
Assess Business Goals for Applicability
Service Level Agreements need to be aligned with business goalsDefine how application response time will effect revenue
Better response time, shorter call center calls, fewer agentsFaster inventory process, faster delivery of stockFaster check out, faster check out process, happier customers
Define impacts on productivityUser productivityFactory, back-office processing, etc, efficiencyTransportation efficiencyHelp desk calls

Session 44A Setting Performance Objectives Using Apdex
©2007, Apdex Alliance, Inc. All rights reserved. Slide 43
An SLA is a Contract With Key Terms
StandardThe SLA will define how to measure somethingIt is important to use well defined standards of measure
– Trainer uses a method: dry in shorts and Weight in pounds– APM uses a method: Apdex and Time in seconds
ObjectiveThe SLA defines an objective functionThe objective function requires performance thresholdsService at or better than the threshold meets business objectivesApdex defines this threshold as the target response time, “T”
– You need to lose 10 pounds– You must deliver this application task within the Apdex T of 4 seconds
RecordOngoing documentation that describes how well the system is performingThe Apdex standard describes this as the Apdex score (results of the Apdex formula) over time (Apdex report)
– The daily record of your morning weight relative to the objective– The daily Apdex report showing the Apdex score for each hour
©2007, Apdex Alliance, Inc. All rights reserved. Slide 44
SLA Contract Terms Continued
GoalThe SLA has goals relative to the objective
– You must lose 10 pounds in 3 months– You must maintain an Apdex score of greater than 0.90 [T]
ConditionsThere are terms and conditions regarding when and how the goals are met
– OK, if there is a wedding during the period you have another month to burn it off– OK, if you have a scheduled system down time you can discount that period
ConsequencesWithout consequences the SLA is meaninglessNeed penalties for falling short of the objectiveNeed bonuses for exceeding the objective
Note: An Apdex SLA can encompass all of these termsBut the SLA is NOT the Apdex T!

Session 44A Setting Performance Objectives Using Apdex
©2007, Apdex Alliance, Inc. All rights reserved. Slide 45
Delivering Service to the Apdex SLA
All members of cross functional team need to understand reason for negotiated SLA and sign offFormal Apdex SLA Reports
You must be prepared to produce appropriate Apdex reports immediately after term negotiationYou must stay objective in how and what you report
Points to PonderConsider the possibility that there could be modifications to the SLA in the futureIt may be wise to produce Apdex reports with other Ts or other Report GroupsApdex SLA information prepares you for future re-negotiations
©2007, Apdex Alliance, Inc. All rights reserved. Slide 46
Managing Above the Water Line

Session 44A Setting Performance Objectives Using Apdex
©2007, Apdex Alliance, Inc. All rights reserved. Slide 47
Outline
Setting Apdex TSetting a Turn-Based TGetting to an SLACase Study
© 1990-2007 NetForecast, Inc., All rights reserved.
©2007, Apdex Alliance, Inc. All rights reserved. Slide 48
Case Study Measurements
Synthetic agents measure the response time of Apdex Contributing Member’s web sites
From five “user” locations where the agents are located– California, Colorado, Florida, Minnesota, and New York
Measurement every 15 minutes
We generated three different reports of performanceEach report uses the exact same measurement dataThese are three different views of the same raw numbersThey represent three levels of APM sophistication

Session 44A Setting Performance Objectives Using Apdex
©2007, Apdex Alliance, Inc. All rights reserved. Slide 49
Deviation From Normal
Simplest approachNo conversation with the application users or managementLet the data report on itself
How it worksRolling average per region plus 50% to define an automated threshold– This is the default reporting method in many tools
Show each region-day average as the delta to the threshold– Negative means that the day was below the threshold which is desired
©2007, Apdex Alliance, Inc. All rights reserved. Slide 50
Deviation From Normal
(5)
0
5
10
15
20
2/25 2/26 2/27 2/28 3/1 3/2 3/3 3/4 3/5 3/6 3/7 3/8 3/9 3/10 3/11 3/12 3/13 3/14 3/15 3/16 3/17
Dev
iatio
n Fr
omN
orm
al (s
ec)
StayStayBelowBelow
California Colorado Florida Minnesota New York
Source: NetForecast

Session 44A Setting Performance Objectives Using Apdex
©2007, Apdex Alliance, Inc. All rights reserved. Slide 51
Average With Threshold
More proactive APMEngage some corporate management in the processFigure out a specific threshold that represents the good/poor performance boundary
How it worksIn this case, we define a business-to-business response time threshold of 4 seconds– Many sources point to a B-to-B target of 4 seconds
Track the region-day averages against the target– Below the threshold is good
©2007, Apdex Alliance, Inc. All rights reserved. Slide 52
Average With Threshold
0
4
8
12
16
20
24
2/25 2/26 2/27 2/28 3/1 3/2 3/3 3/4 3/5 3/6 3/7 3/8 3/9 3/10 3/11 3/12 3/13 3/14 3/15 3/16 3/17
Ave
rage
(sec
)
StayStayBelowBelow
California Colorado Florida Minnesota New York
Source: NetForecast

Session 44A Setting Performance Objectives Using Apdex
©2007, Apdex Alliance, Inc. All rights reserved. Slide 53
Apdex With Objective
Apdex-based SLARequires a two-part management dialog: T and service objective
How it worksDefine Apdex T– In this case, the same 4 seconds is used
Define the Apdex performance service objective– How high on the Apdex scale of 0 to 1 should we deliver?– In this case, 0.90 was chosen– Track the region-day Apdex scores against the objective
• Above is good
©2007, Apdex Alliance, Inc. All rights reserved. Slide 54
Apdex With Objective
0.55
0.60
0.65
0.70
0.75
0.80
0.85
0.90
0.95
1.00
2/25 2/26 2/27 2/28 3/1 3/2 3/3 3/4 3/5 3/6 3/7 3/8 3/9 3/10 3/11 3/12 3/13 3/14 3/15 3/16 3/17
California Colorado Florida Minnesota New York
Apd
ex [T
= 4
sec
]
StayStayAboveAbove
Source: NetForecast

Session 44A Setting Performance Objectives Using Apdex
©2007, Apdex Alliance, Inc. All rights reserved. Slide 55
What the Three Views Say
Which regions are chronically in trouble?Deviation From Normal: NoneAverage With Threshold: NoneApdex With Objective: California– This explains conditions like:
“The California users are constantlycomplaining while all the dashboardssay everything is fine.”
What was the worst performance?Both averaging methods say that the worst event was Florida on 3/12But Apdex shows that the California 3/8 incident actually impacted users the worst
Big New Insight!
Worst Problem Seen
©2007, Apdex Alliance, Inc. All rights reserved. Slide 56
Region-Days Meeting Their SLA by Week
50%
55%
60%
65%
70%
75%
80%
85%
90%
95%
100%
2/17/2007 2/24/2007 3/3/2007 3/10/2007 3/17/2007 3/24/2007 3/31/2007 4/7/2007 4/14/2007 4/21/2007
SLA: Less than 50% Deviation from Normal
SLA: Better that 0.9 on Apdex [4]
Source: NetForecast

Session 44A Setting Performance Objectives Using Apdex
©2007, Apdex Alliance, Inc. All rights reserved. Slide 57
Averages Under-ReportActual Performance
50%
55%
60%
65%
70%
75%
80%
85%
90%
95%
100%
2/17/2007 2/24/2007 3/3/2007 3/10/2007 3/17/2007 3/24/2007 3/31/2007 4/7/2007 4/14/2007 4/21/2007
SLA: Better than 0.9 on Apdex [4]
SLA: Less than 50% Deviation from Normal
The Reporting GapThe Reporting Gap
Source: NetForecast
©2007, Apdex Alliance, Inc. All rights reserved. Slide 58
Value of Apdex
1. Apdex enables ITIL for applications = APMApdex is a structure process with a strong methodologyOpen standardLeverages a community of practitioners through the Apdex Alliance
2. Apdex facilitates APM best practicesUnderstand: Setting Apdex T forces a dialog with the usersMeasure: Apdex defines proper measurement techniquesCommunicate: Best application performance reports for non-IT staffLink: Business managers define service objective as Apdex score
3. Apdex is the foundation of application SLAsThe true view of end-user performanceUncovers problems hidden in averaging reportsNormalizes performance data across many applications

Session 44A Setting Performance Objectives Using Apdex
©2007, Apdex Alliance, Inc. All rights reserved. Slide 59
Summary
ManageAsset
Efficiency
TSMTSM
APMAPMDeliverUserValue
Thank You
Articles and reports on performance measurement, analysis, and management are available for free at www.netforecast.com
Information about Apdex and joining the Apdex Alliance is at www.apdex.org