setting & assessing conservation objectives for highly...
TRANSCRIPT
Setting & Assessing Conservation
Objectives for Highly Mobile Species
Peter G.H. Evans
Sea Watch Foundation & University of Wales Bangor
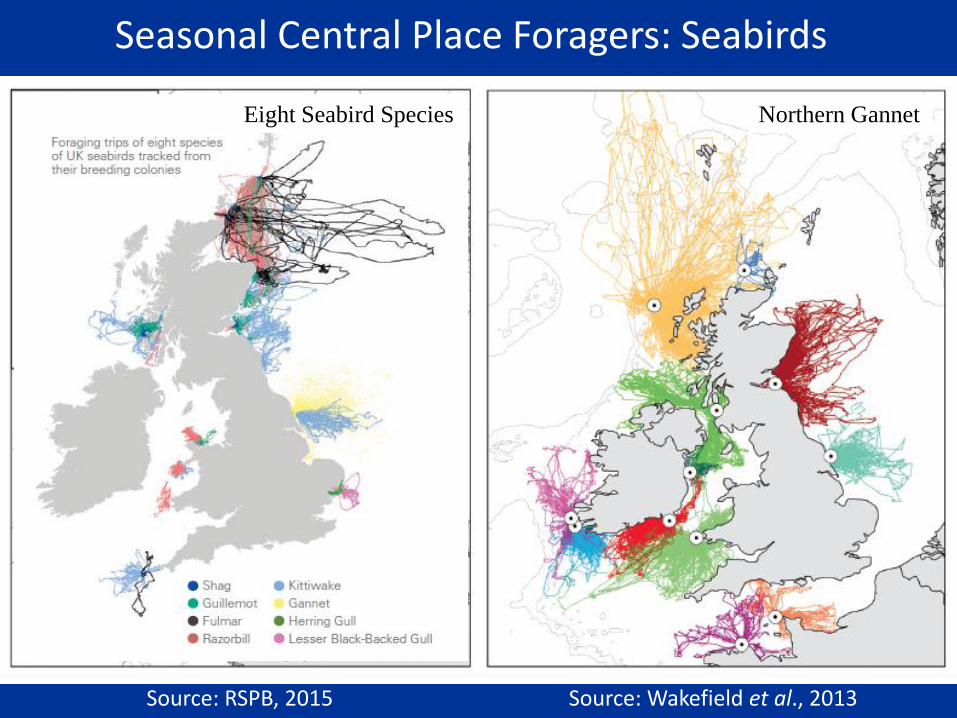
Seasonal Central Place Foragers: Seabirds
Northern Gannet Eight Seabird Species
Source: RSPB, 2015 Source: Wakefield et al., 2013
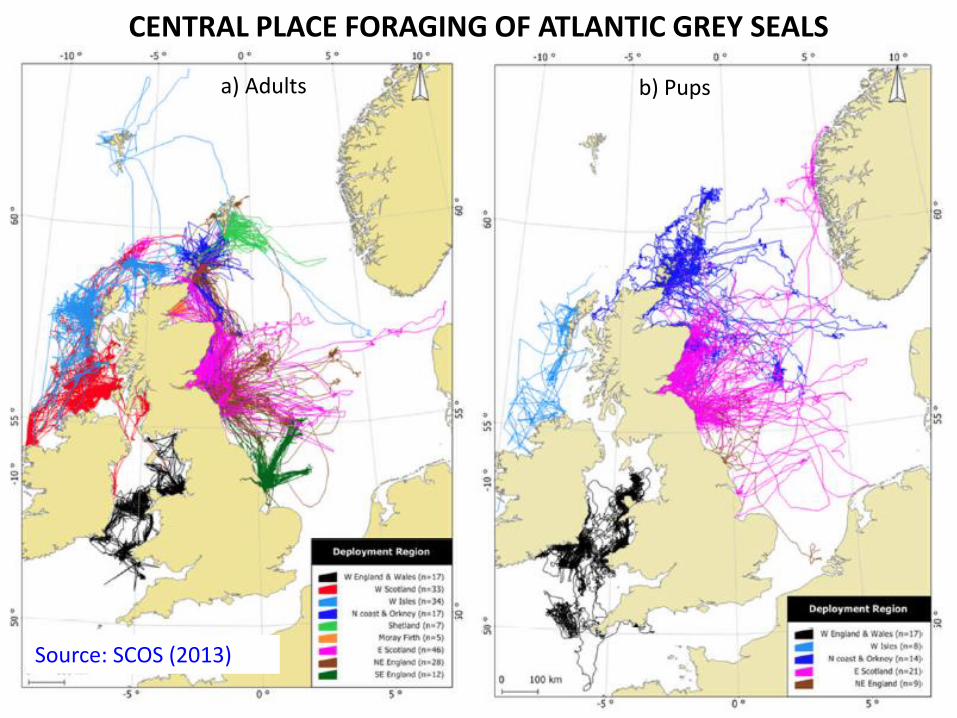
a) Adults b) Pups
CENTRAL PLACE FORAGING OF ATLANTIC GREY SEALS
Source: SCOS (2013)

a) Grey seal usage b) Harbour seal usage
Source: SCOS (2013)

MARINE PROTECTED AREAS FOR TURTLES
Source: Scott et al, 2012;
Stokes et al., 2015
• Post-nesting green turtle
satellite tracks
• Ten main foraging
grounds
• Effectiveness of location of
IUCN MPAs in capturing
foraging locations
• Significantly more turtles
were observed (white bars) to
be foraging in MPAs than
expected (black bars) at both
global and regional scales for
all ocean basins

PORPOISE MOVEMENTS AS REVEALED BY SATELLITE TELEMETRY
Source: Sveegaard & Teilmann, 2007; Teilmann et al., 2008
No. tagged = 62 harbour porpoises; Period of tagging: 1992-2007

>300km
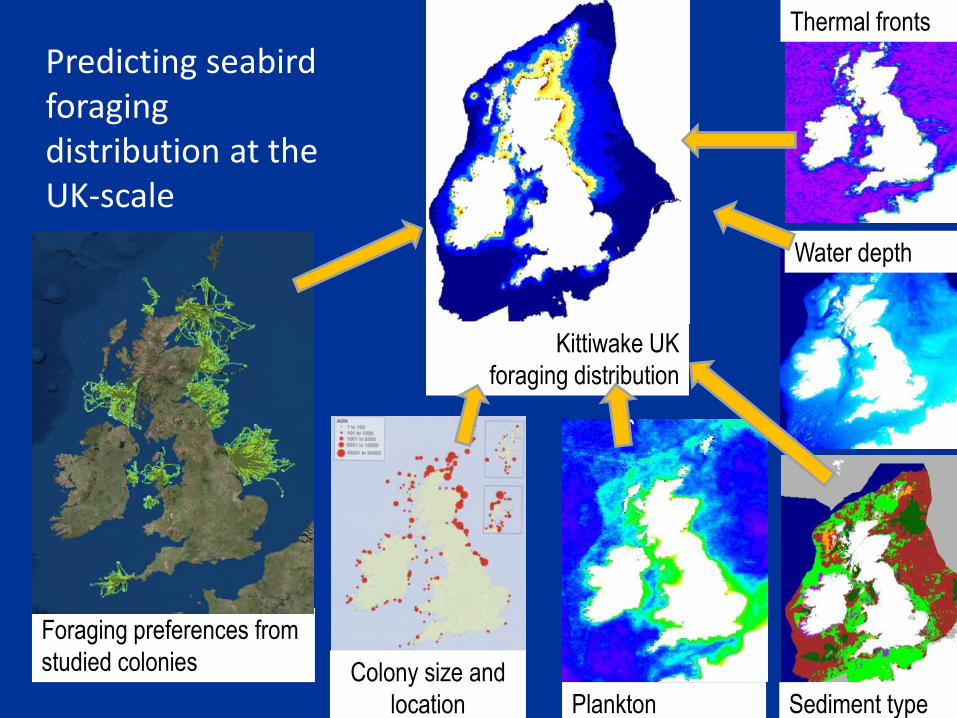
Predicting seabird foraging distribution at the UK-scale
Kittiwake UK
foraging distribution
Foraging preferences from
studied colonies
Sediment type
Thermal fronts
Water depth
Plankton
Colony size and
location
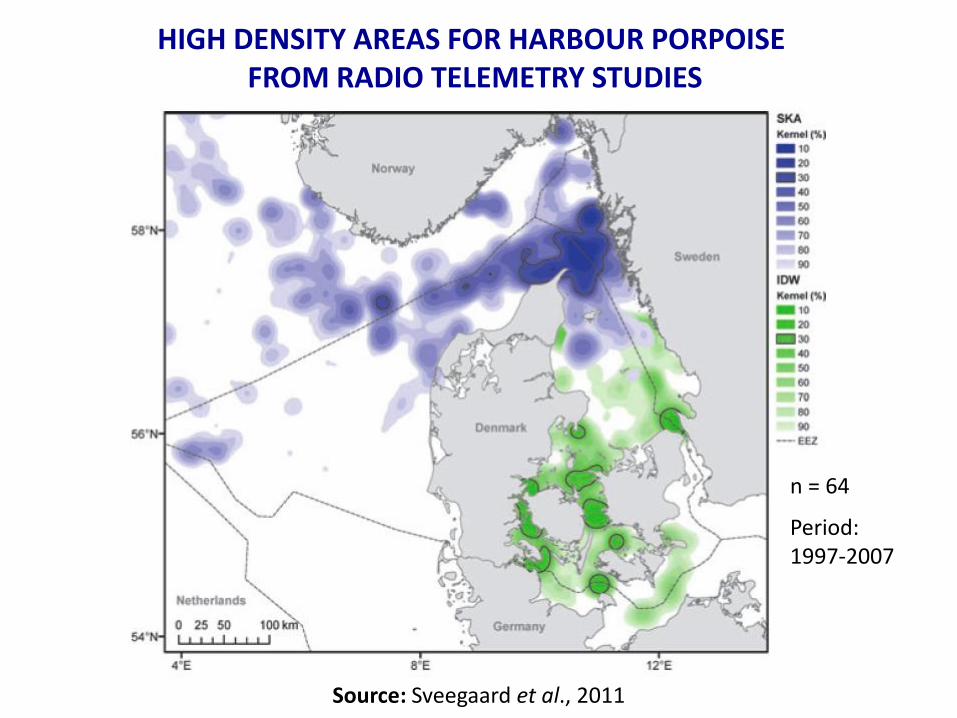
HIGH DENSITY AREAS FOR HARBOUR PORPOISE FROM RADIO TELEMETRY STUDIES
Source: Sveegaard et al., 2011
n = 64
Period: 1997-2007

DESIGNATED SACs CONTAINING HARBOUR PORPOISE
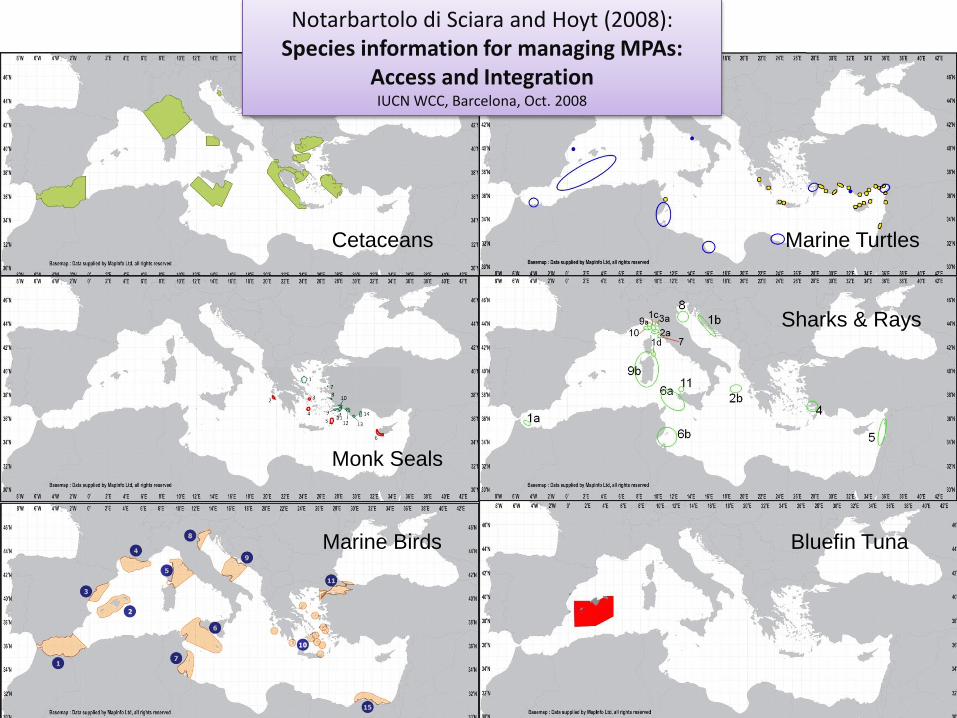
Cetaceans
Monk Seals
Marine Birds
Marine Turtles
Sharks & Rays
Bluefin Tuna
Notarbartolo di Sciara and Hoyt (2008): Species information for managing MPAs:
Access and Integration IUCN WCC, Barcelona, Oct. 2008

cetaceans + monk seal + birds + turtles + sharks + bluefin tuna
ECOLOGICALLY OR BIOLOGICALLY SIGNIFICANT AREAS (EBSAs)
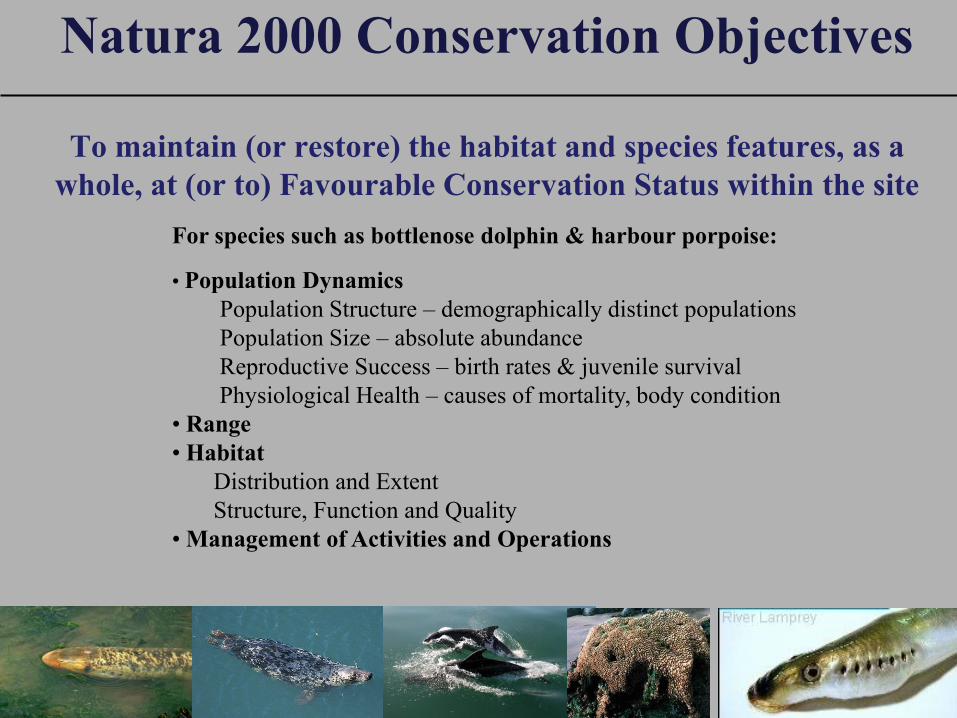
Natura 2000 Conservation Objectives
To maintain (or restore) the habitat and species features, as a
whole, at (or to) Favourable Conservation Status within the site
For species such as bottlenose dolphin & harbour porpoise:
• Population Dynamics
Population Structure – demographically distinct populations
Population Size – absolute abundance
Reproductive Success – birth rates & juvenile survival
Physiological Health – causes of mortality, body condition
• Range
• Habitat
Distribution and Extent
Structure, Function and Quality
• Management of Activities and Operations
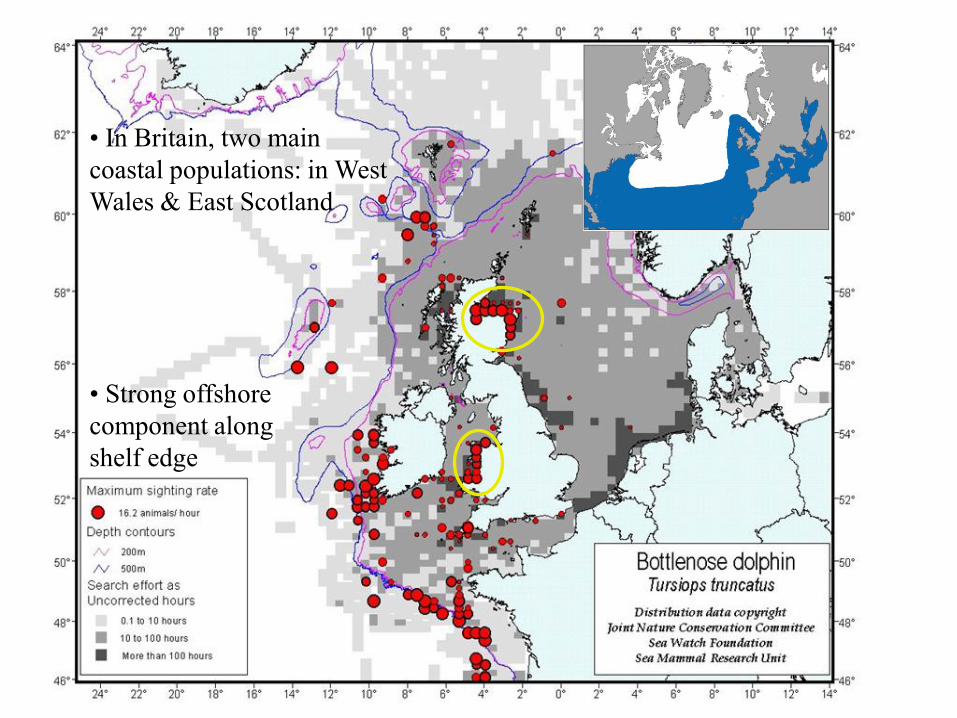
• Strong offshore
component along
shelf edge
• In Britain, two main
coastal populations: in West
Wales & East Scotland

Source: Veneruso & Evans, 2012

THE CHALLENGE OF AREA-BASED PROTECTION
Source: Veneruso & Evans, 2012
• 64% (141/221) of individuals recorded in both Cardigan Bay SAC and unprotected areas in North Wales
Bottlenose Dolphin Photo-ID in Wales
• 78% (172/221) of individuals recorded in one or both SACs also occurred in North Wales
• 15% (33/221) of individuals recorded only in Cardigan Bay SAC
Cardigan Bay SAC
Pen Llyn a’r Sarnau SAC
Winter
Summer

Monitoring methods
Line-transect design for abundance & distribution
Source: Feingold & Evans, 2014
• Vary survey effort between areas
• Select transects at random

Line-transect surveys in Cardigan Bay SAC
Source: Veneruso & Evans, 2012; Feingold & Evans, 2014
CVs vary from 0.27-0.41
Monitoring methods
Bottlenose Dolphin Harbour Porpoise
CVs vary from 0.15-0.46

BOTTLENOSE DOLPHIN POPULATION TRENDS IN CARDIGAN BAY, 2001-14
a) Within SAC
b) Over wider Cardigan Bay
Blue line = whole population estimate Black line = moving average trend Red line = polynomial trend
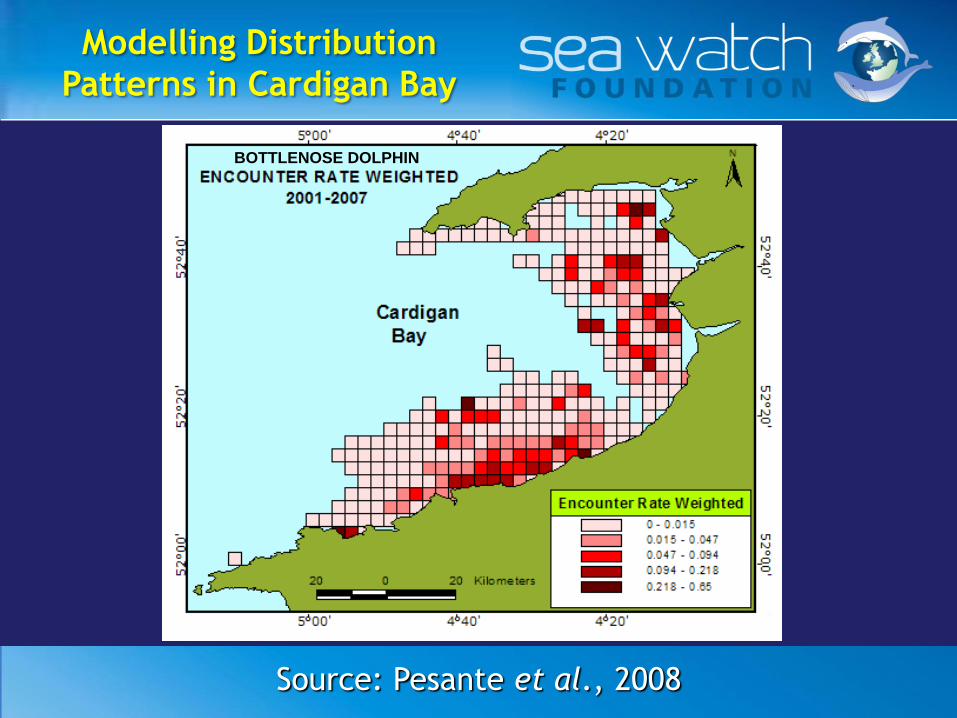
Modelling Distribution
Patterns in Cardigan Bay
Source: Pesante et al., 2008
BOTTLENOSE DOLPHIN

PERIOD 1
PERIOD 2
ZONING APPROACH TO AREA PROTECTION
Source: Pesante et al., 2008; Baines & Evans, 2012; Feingold & Evans, 2014
The bottlenose dolphin in Wales
Summer
Winter

ANNUAL CYCLE & LIFE HISTORY
PARAMETERS OF THE HARBOUR PORPOISE
IN EUROPE
J F M A M J J A S O N D
Gestation Period : 10-11 months
Lactation Period: 4-10 months
Calving Interval: 1-2 years
MATING PERIOD
BIRTH PERIOD
Life span: c. 12; max. 24 years
Age at sex. maturity: 3-5 years
Dispersal: male biased
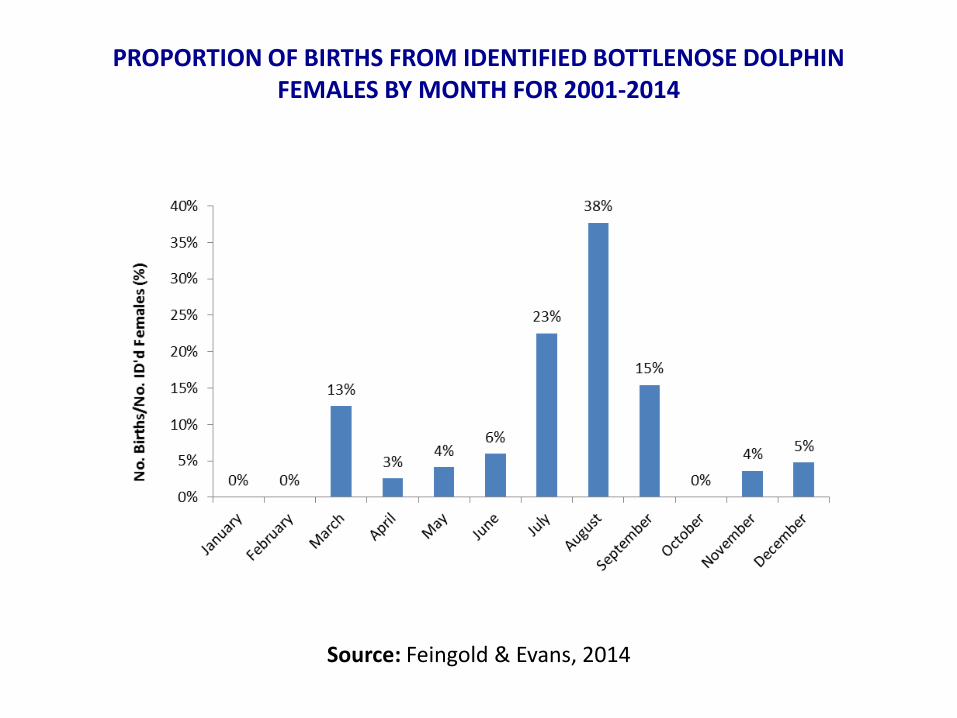
PROPORTION OF BIRTHS FROM IDENTIFIED BOTTLENOSE DOLPHIN FEMALES BY MONTH FOR 2001-2014
Source: Feingold & Evans, 2014

NUMBER OF NEWBORNS IN CARDIGAN BAY SAC (top) AND WIDER CARDIGAN BAY (bottom), 2001-14
Source: Feingold & Evans, 2014

UK HARBOUR PORPOISE TRENDS IN CAUSES OF DEATH, 1991-2010
Source: UK Cetacean Strandings Investigation Programme

• Potting • Scallop Dredging • Sailing • Water Sports • Dolphin Watching
Human Activities
in Cardigan Bay

Wind farm
construction -
disturbance
from pile driving
Industrial
activities in
Liverpool Bay -
high levels of
PCBs, mercury
and lead
Human Activities in North Wales

Monitoring Human Activities
In Cardigan Bay
Source: Evans & Hintner, 2010; Lohrengel et al., 2012
Recreational
Vessels
Scallop
Dredging

KEY LESSONS LEARNED
• Make SACs/SPAs large for mobile species, taking account of
population structure
• Be prepared to zone activities within them
• Don’t be too restrictive, but ensure that the areas most
important for life functions (e.g. feeding, breeding & nursery
grounds) are well protected; consider areas that are hotspots
across taxa
• Monitor species populations beyond protected area boundaries
• Operate flexible management within protected areas,
responding in a timely fashion to change
• Provide adequate resources for monitoring and management;
without those, SACs/SPAs are little more than “paper parks”

ACKNOWLEDGEMENTS
Funding for Past Monitoring
• Countryside Council for Wales/Natural Resources Wales
Sources of Information Used
• Sea Watch staff
• Mark Bolton, RSPB
• UK Special Committee on Seals
• Brendan Godley, University of Exeter
• Giuseppe Notarbartolo di Sciara, Milano, Italy
• UK Cetacean Strandings Investigation Programme
• Signe Sveegaard, National Environmental Research Institute, Denmark


Max max Thaxter et al. 2012
Max max in FAME/STAR
Mean max Thaxter et al. 2012 max
Mean max in FAME/STAR
Shag 17km 24km 15km 14km
Kittiwake 120km 228km 60km 122km
Guillemot 135km 339km 84km 65km
Razorbill 95km 313km 49km 86km
Variation in foraging range across species

FAME data show massive variation in foraging range among colonies
Fair Isle longest trip = 313 km
Colonsay longest trip = 34 km
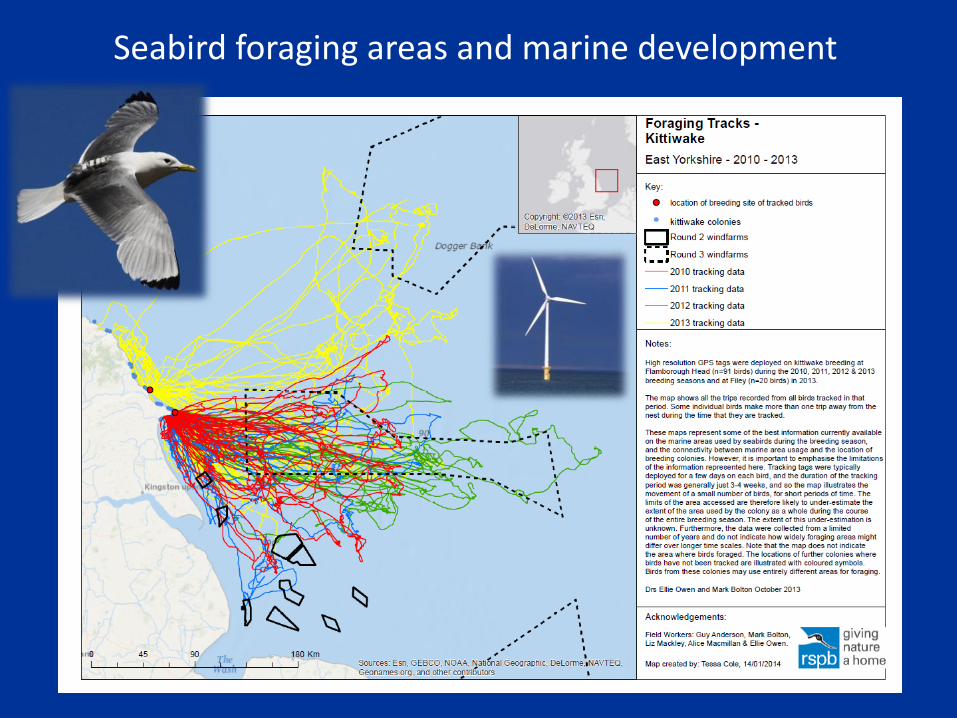
Seabird foraging areas and marine development
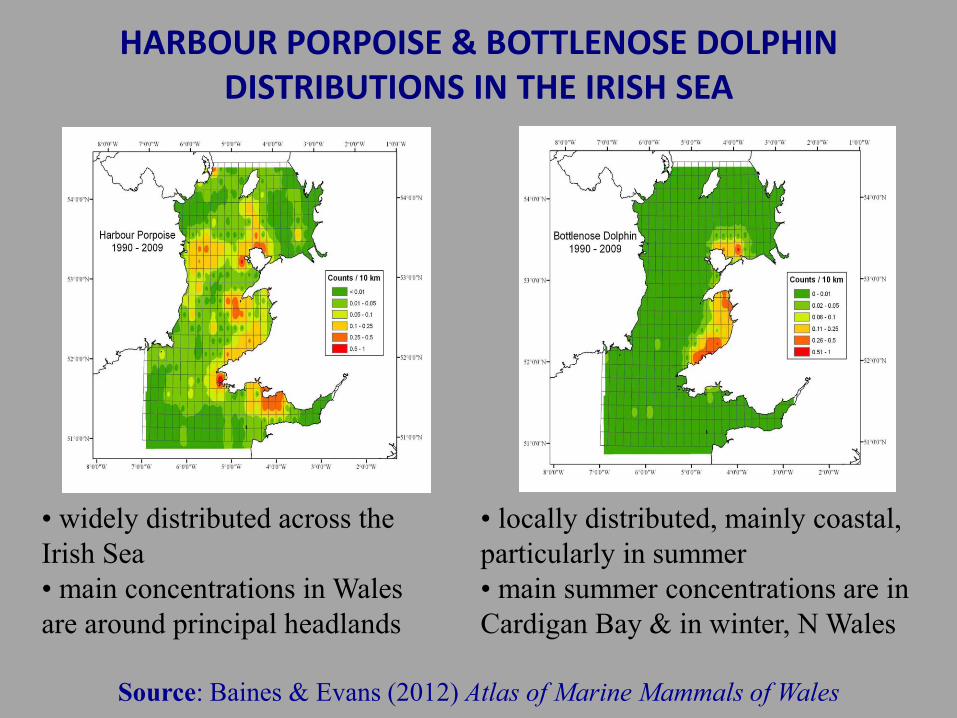
• widely distributed across the
Irish Sea
• main concentrations in Wales
are around principal headlands
• locally distributed, mainly coastal,
particularly in summer
• main summer concentrations are in
Cardigan Bay & in winter, N Wales
Source: Baines & Evans (2012) Atlas of Marine Mammals of Wales
HARBOUR PORPOISE & BOTTLENOSE DOLPHIN DISTRIBUTIONS IN THE IRISH SEA

1995-1999
2000-2004
2005-2009
HARBOUR PORPOISE DENSITIES IN THE IRISH SEA
Source: Baines & Evans (2012) Atlas of Marine Mammals of Wales

Line-transect surveys in Cardigan Bay SAC
Source: Veneruso & Evans, 2012; Feingold & Evans, 2014
Monitoring methods
Harbour Porpoise
CVs vary from 0.15-0.46

a) Cardigan Bay SAC
b) Entire Cardigan Bay
BIRTH RATES IN CARDIGAN BAY SAC (top) AND CARDIGAN BAY (bottom), 2001-14

The Relative Abundance of Bottlenose Dolphins at different levels
of Boat Traffic at New Quay, Cardigan Bay SAC
Source: Pierpoint et al., 2009
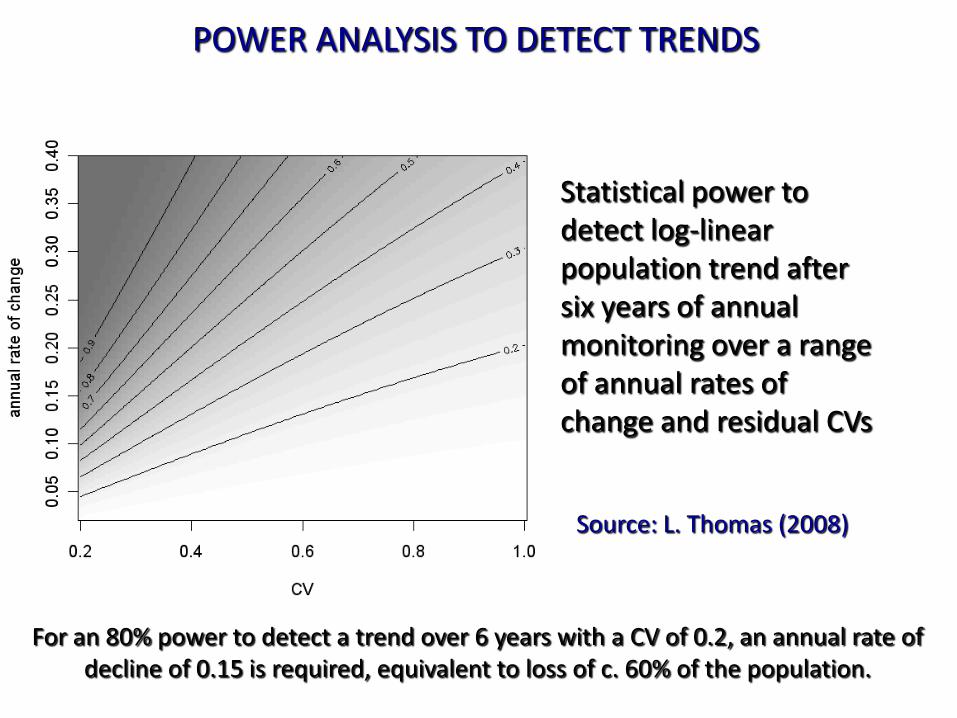
Statistical power to detect log-linear population trend after six years of annual monitoring over a range of annual rates of change and residual CVs
Source: L. Thomas (2008)
POWER ANALYSIS TO DETECT TRENDS
For an 80% power to detect a trend over 6 years with a CV of 0.2, an annual rate of decline of 0.15 is required, equivalent to loss of c. 60% of the population.

Source: Reid, Evans & Northridge (2003)
CETACEAN CANDIDATES FOR ANNEX II

TYPICAL LOGGERHEAD TURTLE TRACKS

LOGGERHEAD TURTLE TRACKS IN THE N ATLANTIC

THE SCOPE OF PROTECTIVE MEASURES
IN LIMITING IMPACTS
103
104
105
106
ACCOBAM
S
pollution
resource
depletion
bycatch
vessel
disturb.
MARPOL
MPA’s
OSPAR
ASCOBAN
S
IMPACTS PROTECTIVE MEASURES
103 103
103
104
104 104 105 105 106 106 ha
105
106