session 7– tech trend-watching for health insurance and how to … · 9/7/2016 tech...
TRANSCRIPT
Session 7 – Tech Trend-Watching for Health Insurance and How to React
Alain Peddle, FIA, FASSA
9/7/2016
Tech trend-watching for health insurance (and how to react)ALAIN PEDDLE (FIA)Ping An Health Deputy General Manager1 / 2 September 2016
2
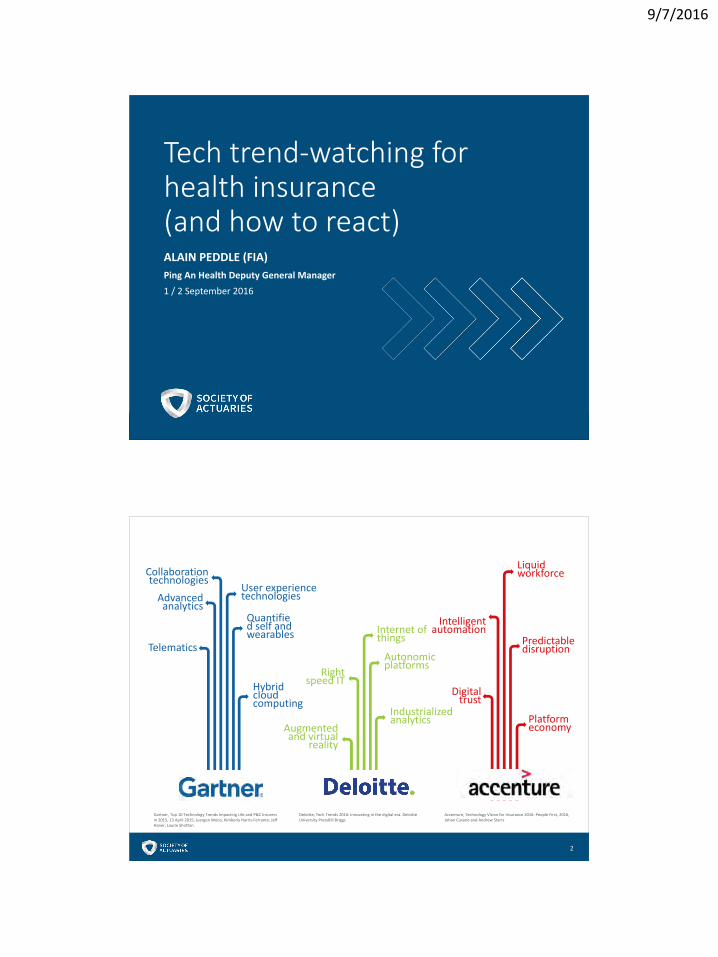
Advanced analytics
Hybrid cloud computing
Quantified self and wearables
Collaboration technologies
Telematics
User experience technologies
Right speed IT
Autonomic platforms
Augmented and virtual
reality
Internet of things
Industrialized analytics
Liquid workforce
Intelligent automation
Digital trust
Platform economy
Predictable disruption
Gartner, Top 10 Technology Trends Impacting Life and P&C Insurers in 2015, 13 April 2015; Juergen Weiss, Kimberly Harris-Ferrante, Jeff Haner, Laurie Shotton
Deloitte, Tech Trends 2016: Innovating in the digital era. Deloitte University PressBill Briggs
Accenture, Technology Vision for Insurance 2016: People First, 2016, Johan Cusano and Andrew Starrs

9/7/2016
3
4
9/7/2016
5
6
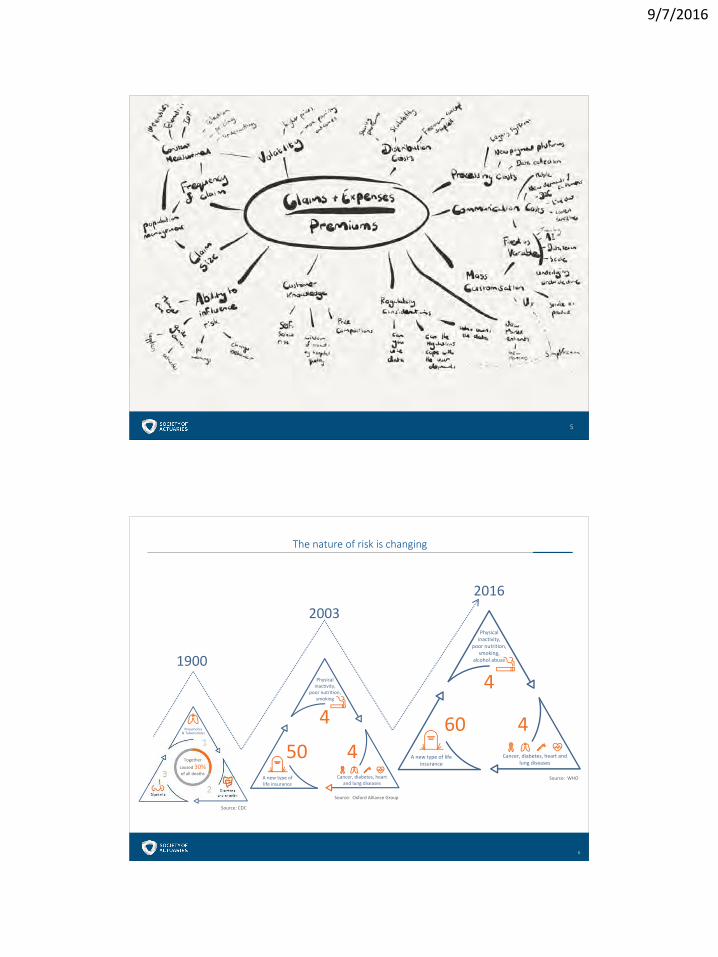
Source: CDC
Source: WHO
Source: Oxford Alliance Group
Physical inactivity,
poor nutrition, smoking,
alcohol abuse
Cancer, diabetes, heart and lung diseases
A new type of life insurance
4
460
Physical inactivity,
poor nutrition, smoking
Cancer, diabetes, heart and lung diseases
A new type of life insurance
4
450Pneumonia
& Tuberculosis
Diarrhoeaand enteritisDiptheria
1
2
3
Together
caused 30% of all deaths
1900
20032016
The nature of risk is changing
9/7/2016
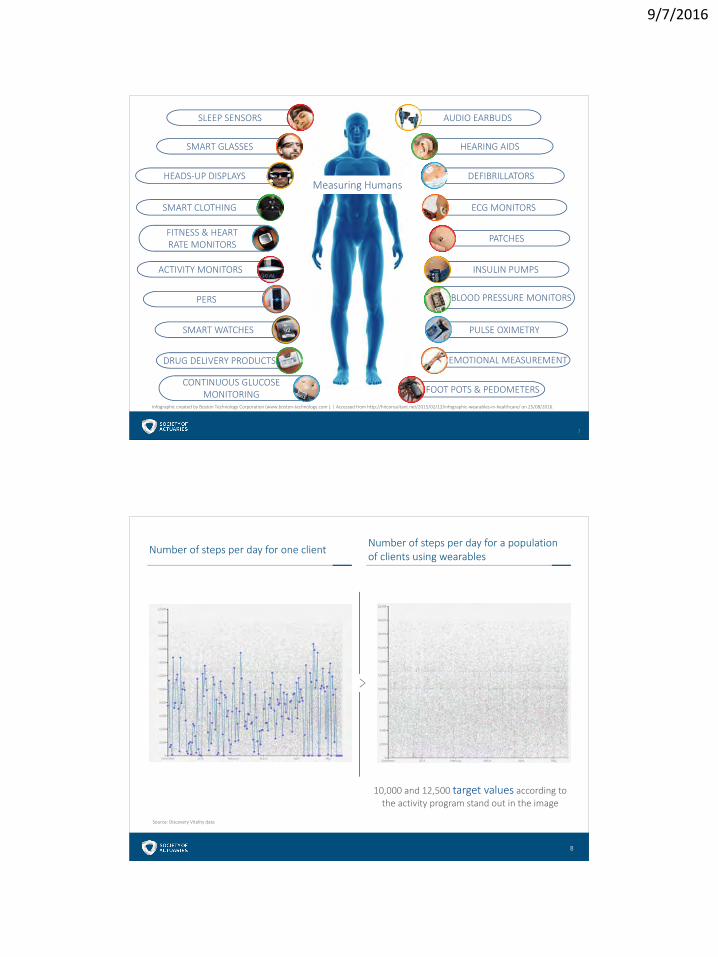
SLEEP SENSORS
SMART GLASSES
HEADS-UP DISPLAYS
SMART CLOTHING
FITNESS & HEARTRATE MONITORS
ACTIVITY MONITORS
DRUG DELIVERY PRODUCTS
CONTINUOUS GLUCOSE MONITORING
PERS
SMART WATCHES
7
PATCHES
ECG MONITORS
AUDIO EARBUDS
HEARING AIDS
DEFIBRILLATORS
FOOT POTS & PEDOMETERS
EMOTIONAL MEASUREMENT
INSULIN PUMPS
BLOOD PRESSURE MONITORS
PULSE OXIMETRY
Infographic created by Boston Technology Corporation (www.boston-technology.com ). | Accessed from http://hitconsultant.net/2015/02/13/infographic-wearables-in-healthcare/ on 25/08/2016.
Measuring Humans
8
Number of steps per day for one client Number of steps per day for a population of clients using wearables
10,000 and 12,500 target values according to the activity program stand out in the image
Source: Discovery Vitality data
9/7/2016
9
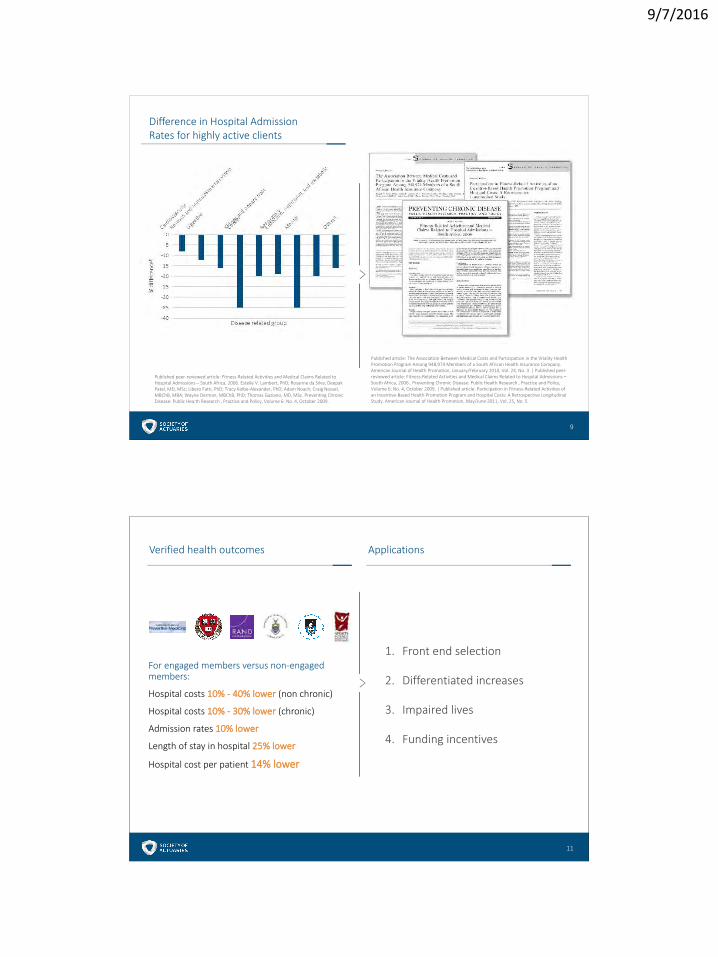
Published peer-reviewed article: Fitness-Related Activities and Medical Claims Related to Hospital Admissions – South Africa, 2006. Estelle V. Lambert, PhD; Rosanne da Silva; Deepak Patel, MD, MSc; Libero Fatti, PhD; Tracy Kolbe-Alexander, PhD; Adam Noach; Craig Nossel, MBChB, MBA; Wayne Derman, MBChB, PhD; Thomas Gaziano, MD, MSc. Preventing Chronic Disease: Public Hea;th Research , Practice and Policy, Volume 6: No. 4, October 2009.
Difference in Hospital Admission Rates for highly active clients
Published article: The Association Between Medical Costs and Participation in the Vitality Health Promotion Program Among 948,974 Members of a South African Health Insurance Company. American Journal of Health Promotion, January/February 2010, Vol. 24, No. 3 | Published peer-reviewed article: Fitness-Related Activities and Medical Claims Related to Hospital Admissions – South Africa, 2006.. Preventing Chronic Disease: Public Health Research , Practice and Policy, Volume 6: No. 4, October 2009. | Published article: Participation in Fitness-Related Activities of an Incentive-Based Health Promotion Program and Hospital Costs: A Retrospective Longitudinal Study. American Journal of Health Promotion, May/June 2011, Vol. 25, No. 5.
11
Verified health outcomes Applications
For engaged members versus non-engaged members:
Hospital costs 10% - 40% lower (non chronic)
Hospital costs 10% - 30% lower (chronic)
Admission rates 10% lower
Length of stay in hospital 25% lower
Hospital cost per patient 14% lower
1. Front end selection
2. Differentiated increases
3. Impaired lives
4. Funding incentives
9/7/2016
12
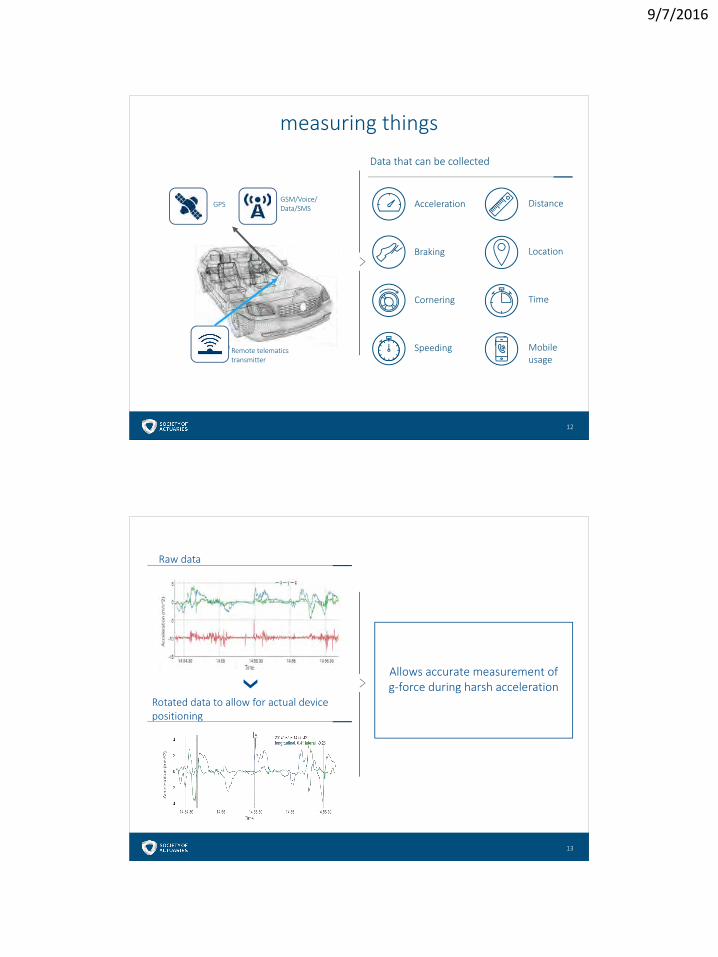
measuring things
Acceleration
Braking
Cornering
Speeding
Distance
Location
Time
Mobile usage
Data that can be collected
GPSGSM/Voice/ Data/SMS
Remote telematics transmitter
13
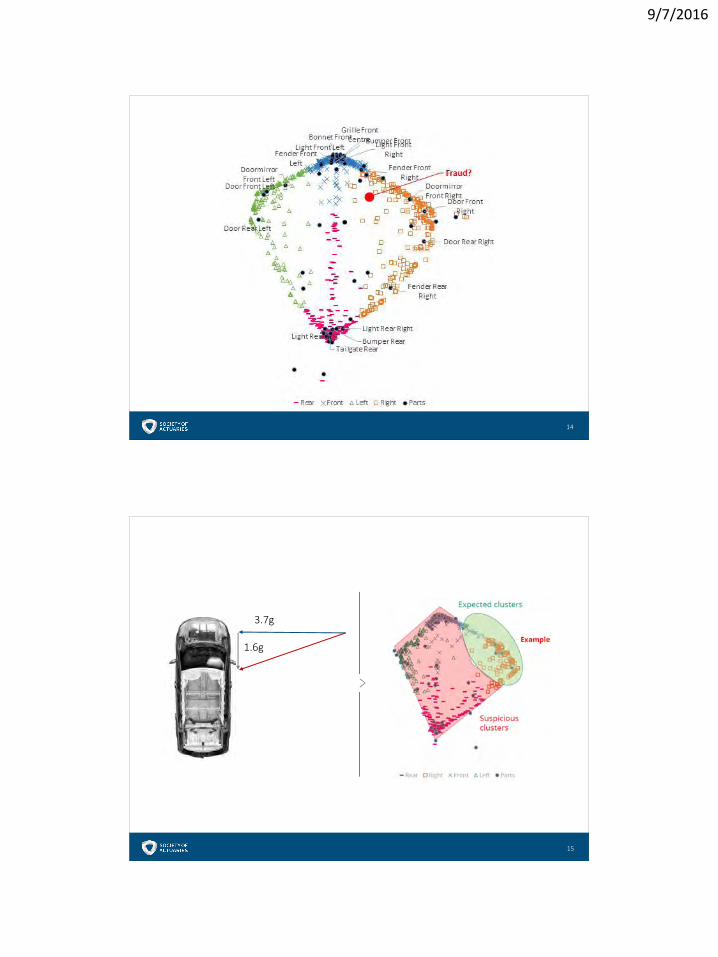
Allows accurate measurement ofg-force during harsh acceleration
Raw data
Rotated data to allow for actual device positioning
9/7/2016
14
15
3.7g
1.6g
9/7/2016
16
part 2 changing outcomes
17
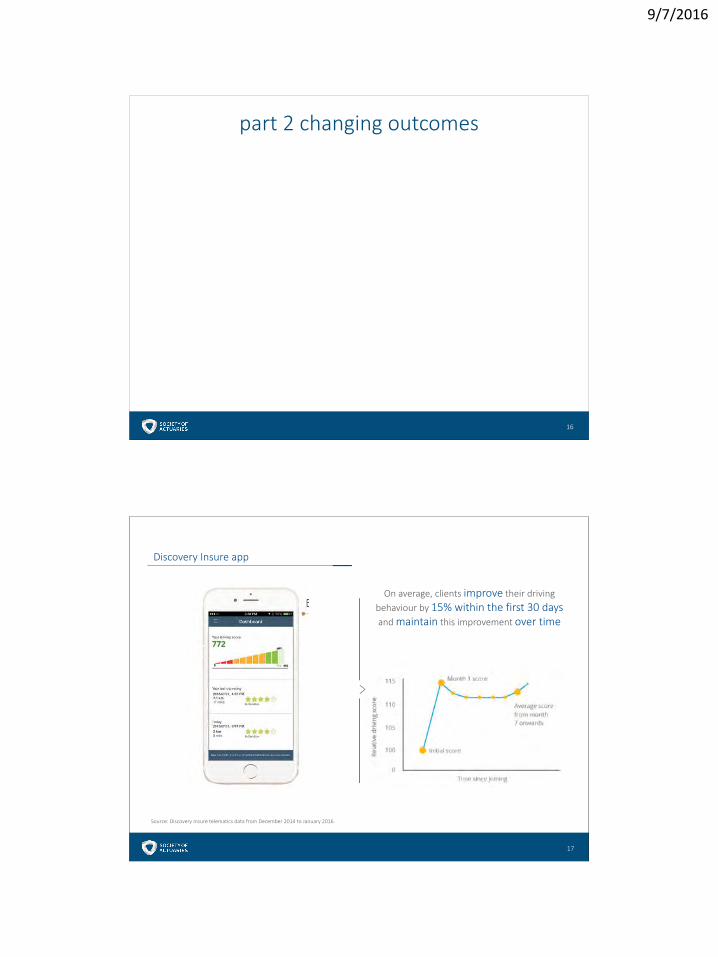
On average, clients improve their driving behaviour by 15% within the first 30 days and maintain this improvement over time
Source: Discovery Insure telematics data from December 2014 to January 2016.
Discovery Insure app
9/7/2016
18
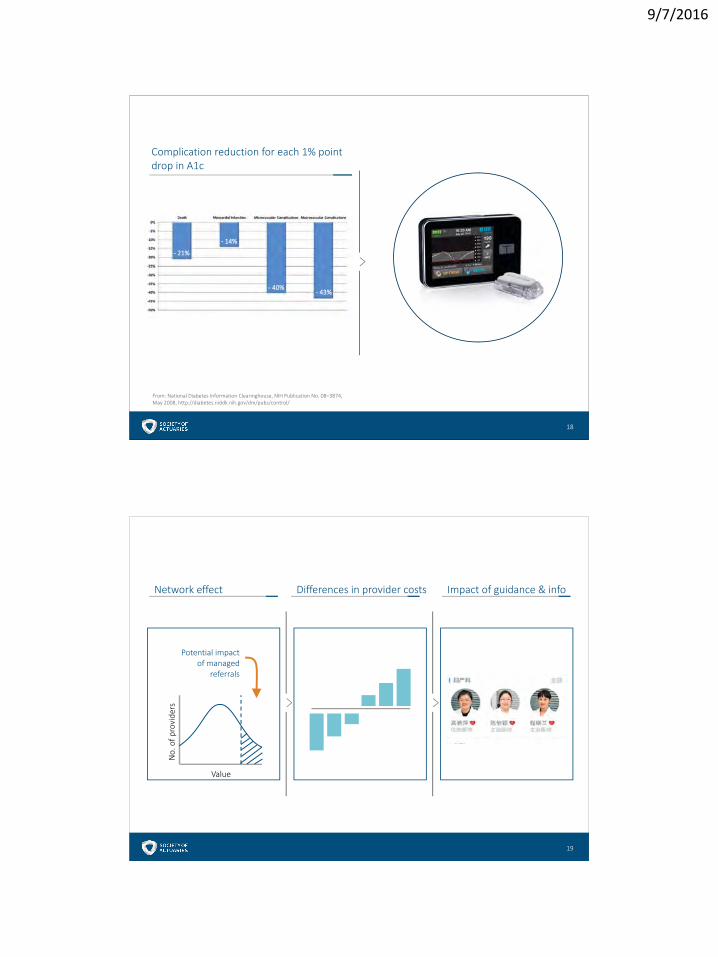
Complication reduction for each 1% point drop in A1c
From: National Diabetes Information Clearinghouse, NIH Publication No. 08–3874, May 2008, http://diabetes.niddk.nih.gov/dm/pubs/control/
- 21%
- 14%
- 40%- 43%
19
Value
No.
of p
rovi
ders
Potential impact of managed
referrals
Network effect Differences in provider costs Impact of guidance & info
9/7/2016
21
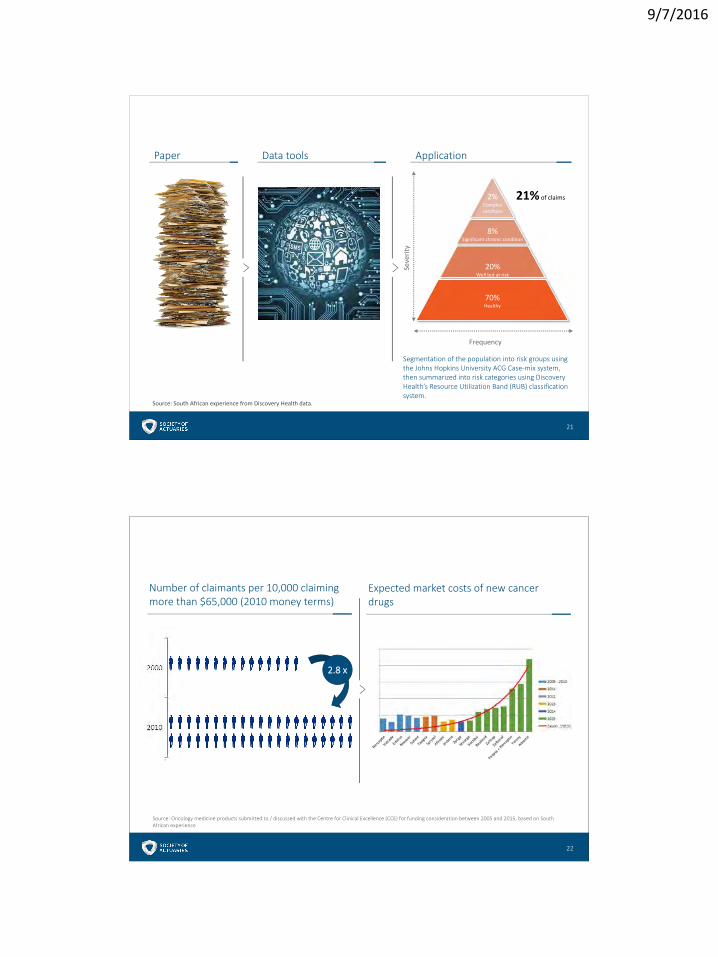
70%Healthy
Frequency
Seve
rity
20%Well but at risk
8%Significant chronic condition
2%Complex condition
21% of claims
Source: South African experience from Discovery Health data.
Segmentation of the population into risk groups using the Johns Hopkins University ACG Case-mix system, then summarized into risk categories using Discovery Health’s Resource Utilization Band (RUB) classification system.
Paper Data tools Application
22
2.8 x
Number of claimants per 10,000 claiming more than $65,000 (2010 money terms)
Expected market costs of new cancer drugs
Source: Oncology medicine products submitted to / discussed with the Centre for Clinical Excellence (CCE) for funding consideration between 2005 and 2015, based on South African experience
9/7/2016
24
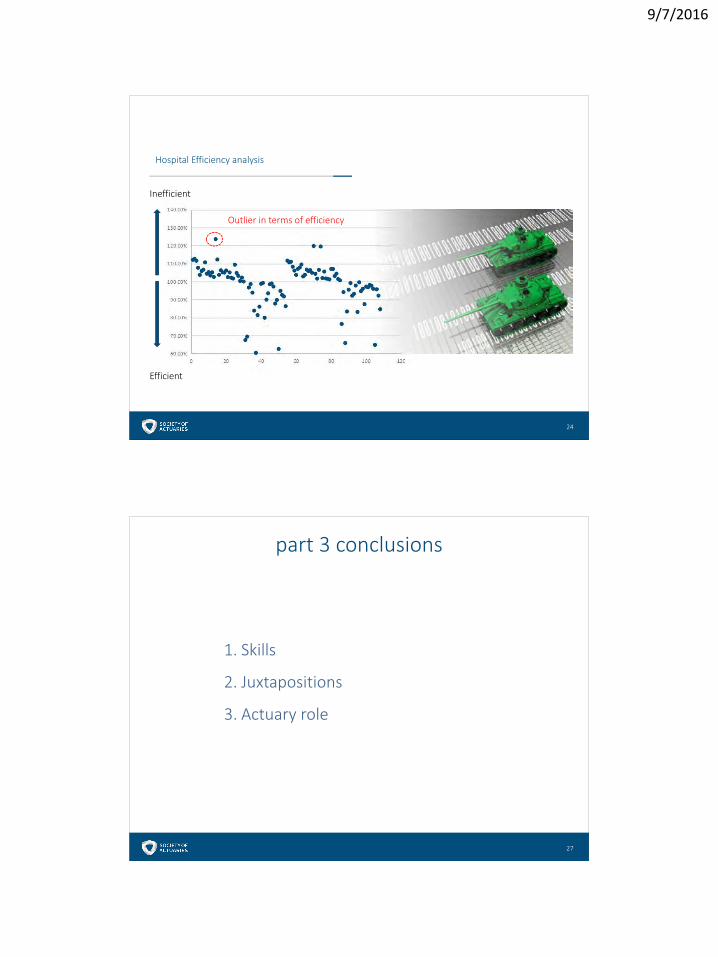
Efficient
Inefficient
Outlier in terms of efficiency
Hospital Efficiency analysis
27
part 3 conclusions
1. Skills
2. Juxtapositions
3. Actuary role

9/7/2016
28