declining trend of urban health expenditures: a case of
TRANSCRIPT

DOI: 10.21276/sjhss
744
Saudi Journal of Humanities and Social Sciences ISSN 2415-6256 (Print) Scholars Middle East Publishers ISSN 2415-6248 (Online)
Dubai, United Arab Emirates
Website: http://scholarsmepub.com/
Declining Trend of Urban Health Expenditures: A Case of Urban Local Bodies
Health Expenditure Budget Analysis K. Prabhakar
Assistant Professor, Centre for Good Governance & Policy Analysis (CGG&PA), NIRD&PR, Hyderabad-500030,
INDIA.
*Corresponding Author: K. Prabhakar
Email: [email protected]
Abstract: Good governance has in recent times appeared as the new intonation to address the failures of public systems,
especially in the arena of public health. Health is a state subject and the primary responsibility of providing health care is
with state governments. Majority of states' expenditure accounts of ail public expenditure on the health sector. State-
level variations on expenditure on health over the years show a proportion to total government expenditure it shows a
declining trend after 1985-86. This article examined the allocations of health budget for the light of commitments made
in municipal governance of budget. The present study was carried out to assess the budget allocation and expenditure
pattern for health including private and public health. The findings revealed that the budget allocation for total health care
was less, compared to that of maternity home and child care budgets. The study focused on trends in BBMP spending on
Health Sector. The results conveyed that the BBMP spending on health sector as per state Real GDP for BBMP
Budgetary allocation was low compared to real allocation. These figures indicate the status of ignorance of urban public
health sector. The study suggested that the prime importance of health care both at micro and macro levels needs to be
attentive at budget allocation and at management strategic decisions to regulate the health care policy to achieve this
sectors as one of the millennium development goals which is most vital for growing urban population through both
public and private partnership interventions.
Keywords: Health, Urban Health Care, Municipal Heath budget, Child Care, Maternity Services, Budget Allocations,
Public Health Budget. JEL classification: I11, I18, J13 and G31
INTRODUCTION This year, the World Health Day theme focuses on
urbanization and health – addressing health issues of
increasing urban population. Over half of the world‘s
population lives in cities. By 2050, seven out of ten
people would be city dwellers. India is a part of this
global trend. Nearly, 28 percent of India‘s population
lives in cities and is expected to increase to 41 percent
by the year 2020. This rapid increase in urban
population worldwide plays an important factor in
global health issues of the 21st century.
Health expenditure is unequal across the globe. As
is to be expected, developed countries spend the most
on personal health. OECD countries accounted for less
than 20 per cent of the world's population in 2000 but
are responsible for 90 per cent of the world's health
expenditure. Inversely, 80 percent of world's population
spent only 10 per cent of the total expenditure on
health. This includes people in Asia-Pacific, Africa and
Latin America. Africa accounts for about 25 per cent of
the global burden of disease but only about 2 per cent of
global health spending (World Health Report, 2003).
Similarly, health expenditure, both in terms of
percentage of GDP spent on health and per capita health
expenditure, is high in developed countries. The share
of GDP spent on health ranges from a low of 1.6 per
cent in Azerbaijan to 13.9 per cent in the US. Similarly,
there is a wide variation of per capita health expenditure
across countries, which is low in developing countries
compared with developed countries - from $14 in
Ethiopia and Bangladesh, $19 in Indonesia, $23 in India
to $4,877 in the US1.
In India, there is growth in GDP but there has been
no increase in healthcare expenditure. This inadequate
public health expenditure has forced the public to
depend on private sector. India is ranked at 171 out of
the 175 counties in the world in public health
expenditure. For a country of more than one billion,
India spends 5.2% of the GDP on healthcare. While
4.3% is spent by the private sector, the government
continues to spend only 0.9% on public health. This is
at a time when India ranks among the top 10 countries
1
http://www.thehindubusinessline.com/2006/09/19/storie
s/2006091901451100.htm)

Prabhakar K.; Saudi J. Humanities Soc. Sci.; Vol-2, Iss-8(Aug, 2017):744-757
Available Online: http://scholarsmepub.com/sjhss/ 745
for communicable disease; today a world leader of
chronic diseases like diabetes, hypertension and
coronary artery diseases. Dr.Sudarshan who was part of
the WHO commission on Macro Economics and Health
said ―There has been marginal increase in public health
spending with the National Rural Health Mission
(NRHM), but there is need for increasing health budget
and also simultaneously building the capacity of the
state to spend the allocated budget efficiently in public
health‖. India‘s health scenario currently presents a
contrasting picture. While health tourism and private
healthcare are being promoted, a large section of Indian
population reels under the risk of curable diseases that
do not receive attention of policymakers. Studies have
indicated that while economic growth index moves
forward, the wellness index dips, in fact our
neighboring China ranks among leading developing
countries in public spending on health (6% of its GDP).
PUBLIC HEALTH EXPENDITURE IN INDIA
Estimates suggest that the role of households in
healthcare spending has increased substantially in the
recent period. According to the Report of the National
Commission on Macroeconomics and Health, 2005,
health spending in India is estimated to be in the range
of 4.55 to 6 percent and households undertook nearly
three-fourth of health spending in the country. Public
spending was only 22 percent, and all other sources
accounted for less than 5 percent. The exceptionally
high burden placed upon households in the Indian
context reflects inadequate quantity and quality of
public health service delivery. According to the
National Sample Survey Organisation (NSSO) 55th
Consumer Expenditure Survey (CES) for the year 2001-
02, household out-of-pocket spending is estimated to be
Rs. 72,759 crore which accounts for 3.2 per cent of
GDP at current market price. If we look at state–wise
health expenditure, Tamil Nadu‘s public expenditure on
health is high, household spending is among the lowest,
but in Kerala, which is a leading state in terms of health
indicators also accounts for the highest household
spending in India.
There is clear evidence that expenditure on health
programs is declining in real terms and its benefits are
accruing to fewer people. For instance, GoI budget
expenditure on health declined from 19.8 percent of
GDP in 1990-91 to 16.6 percent in 1993-94 [16] and
has been steadily but rapidly declining further to less
than 1 percent. The State‘s commitment to provide
health care for its citizens is reflected not only in the
inadequacy of health infrastructure and low levels of
financing but also in declining support to various health
care demands of people. In spite of the fact that health
care is a state subject under the constitution [4] there is
increasing disinterest of the state in allocating resources
for health sector which is also reflected in the
investment expenditure where there was a large decline
in capital expenditures during the 1990s. At all levels –
central, state and district, the administration has
reflected weak staff capacity as well as financial
capacity [13]. In case of the city municipal
corporations, health spending forms only 2.2 per cent of
their total budgets; Mumbai BMC spends over 12% for
instance and many other corporations spend over 5% of
their budget the proportion spent by the BBMP or the
Bruhat Bengaluru Mahanagara Palike (Greater
Bangalore Municipal Corporation) is much less than
even this average!
THE BRUHAT BENGALURU MAHANAGARA
PALIKE (BBMP)
The history of municipal governance of Bangalore
dates back to March 27, 1862, when nine leading
citizens of the city formed a Municipal Board under the
Improvement of Towns Act of 1850. Later, a similar
Municipal Board was also formed in the Cantonment
area of the city. The two boards were legalised in 1881,
and functioned as two independent bodies called the
Bangalore City Municipality and the Bangalore Civil
and Military Station Municipality. The following year,
the concept of elected representatives has come into
being and also has seen the introduction of property
tax.
After independence, the two Municipal Boards
have merged to form the Corporation of the City of
Bangalore in 1949, under the Bangalore City
Corporation Act. The corporation then consisted of 70
elected representatives and 50 electoral divisions. The
name of the council has changed — first to Bangalore
City Corporation (BCC) and then to Bangalore
Mahanagara Palike (BMP).
With the formation of Bruhat Bengaluru
MahanagaraPalike in 2007 by integrating the areas of
erstwhile BMP with those of 8 Municipalities and 110
urbanized Villages around it, the jurisdiction of BBMP
has been extended to nearly 800 Sq. Km from the
erstwhile 226 Square Kms. And the numbers of wards
have also increased from 100 to 198. Now a great
responsibility of providing all 198 wards with basic
infrastructure facilities and good environment lies on all
198 Corporates and other elected legislators.
The BBMP represents the third level of
government, Bruhat Bengaluru MahanagaraPalike is
run by a city council. The city council comprises
elected representatives, called "corporators", one from
each of the wards (localities) of the city. Elections to
the council are held once every 5 years, with results
being decided by popular vote. Members contesting
elections to council represent one of more of the state's
political parties. A first election to the newly-created
body was held on 28th
of March 2010, after the delays
due to delimitation of wards and finalising voter lists.
It has been observed that the municipalities (local
government) are spending only 2.2% of total health
budgets; however the BBMP or the Bruhat Bengaluru

Prabhakar K.; Saudi J. Humanities Soc. Sci.; Vol-2, Iss-8(Aug, 2017):744-757
Available Online: http://scholarsmepub.com/sjhss/ 746
MahanagaraPalike (Greater Bangalroe Municipal
Corporation) is spending less than even this average.
82% of increase in BBMP population (projected
population 2010) over 2001 census population i.e.
almost double over a period of 10 years (2001 – 2010),
in 1999 there are 30 maternity homes and urban family
welfare centres, but today there are 24 Centres off that
only 20 centres are functioning. Through our shocking
research findings, real budgetary allocations for Health
by BBMP in 2009- 2010 over 2006-2007 it is -67%,
this itself shows the real picture of how BBMP
concerned about urban health. Looking at table given
below, it is observed that there is decreasing trend of
deliveries as against ANC registered form BBMP is
maternity hospitals. One more interesting findings from
table given below, trend of ANC registration and
deliveries have gradually decreased, and only OPD
service has increased, it means Maternity homes center
function like first aid centers.
Table 1: Major services by BBMP Maternity homes from 2005-06 to 2009-10
Sl ALL 24 MHS' 2005-06 2006-07 2007-08 2008-09 2009-10
1 ANC Registered 24.5 20.2 22.1 21.7 15.2
2 Deliveries 10.5 9.0 9.2 8.9 6.0
3 OPD 58.6 66.2 60.9 63.2 74.5
4 % of Deliveries as
against ANC Regd
48.8 47.0 46.3 44.3 35.5
Based on secondary data collected all 24 maternity
homes of BBMP, in 2009-10, 9090 deliveries have
taken place, at the same time 2009-10 budgetary
allocations(payments) show that allocation for
maternity homes is ` 470 lakhs (salaries are not part of
this budgetary allocations), this is part of Health
medical budgetary allocations. So, on an average every
delivery gets Rs.5170/- worth service, In reality, does
the urban poor get Rs. 5170/- worth service?
2015-16 BBMP Health Budget Highlights:
The Health infrastructure in BBMP has a
strong base. BBMP runs 6 referral hospitals,
24 maternity homes, 19 family welfare centers,
29 health care centers and 17 dispensaries.
Every year an average of 25,000 institutional
deliveries are being conducted in the centers.
Following health programs have been taken up
during the current year for improvement in the
health of urban poor.
Action has been taken to set up dialysis centers
in every constituency of BBMP.
The programs of issuing ―Thayi Madilu Kit‖
has been continued for all class of women who
awhile dilevery services in the referral and
Maternity hospital in the BBMP. An amount of
Rs.1.00 cr is reserved for this purpose.
National Urban Health Mission: This
programme has been implemented in
association with the Central Government. A
day care centre has been started in each ward
in the first stage.
Modern facilities have been provided at BBMP
General Hospitals, Maternity Hospitals and 6
Referral Hospitals participation of Private
Medical Colleges on PPP.
Hygiene Kits have been provided girl students
studying in BBMP schools and colleges.
Dialysis Centers have been already functioning
in 3 referral hospitals. An amount of Rs.4.00
Crores is earmarked for starting Dialysis
Centers in the remaining 3 referral hospitals.
Free Ultrasound Scanning facility has been
provided at all Maternity and Referral
Hospitals for pregnant women.
Key Objectives of Health Department of BBMP:
1. To improve intrapersonal & inter personal
qualities, cognitive task specific skill,
communication skills of dept official of BBMP
and to improve governance of Health
promotion.
2. To build alliances and partnership with public
private Non-Government, international
organizations and civil policies to create
sustainable actions.
3. To interact & request W.H.O. & U.M.O in
collaboration with BBMP to allocate resource
for health promotion, initiate action plan and
monitor performance.
BBMP Establishment for Public Health: There are
29- Health Centres (IPP), 19- Urban Family Welfare
Centres, 17- Dispensaries, 3- Mobile Dispensaries, 1-
Ayurvedic and 2-Unani centres are functioning to take
care urban health.
Major responsibilities of BBMP Public Health Care: Major Service covered/discharged by BBMP Health
department are Maternity Child Health (Immunization
& Family Welfare), Revised National Tuberculosis
Control Programme (RNTCP),Treatment for Dog Bites,
Pulse Polio Immunization, HIV AIDS programme,
Family Health Awareness Campaign, Cancer Screening
Programme, and Malaria Screening Programme.

Prabhakar K.; Saudi J. Humanities Soc. Sci.; Vol-2, Iss-8(Aug, 2017):744-757
Available Online: http://scholarsmepub.com/sjhss/ 747
Services in Maternity Home & Referral Hospitals: From the table given below services covered by BBMP
Health department may be analyzed.
Table-2: BBMP health services at Maternity Home & Referral Hospitals
At Referral Hospitals: At Maternity Homes -
Outpatient Service
At Maternity Homes - Inpatient
services.
• Normal deliveries.
• Sterilization- Tubectomy.
Laparoscopic sterilization.
No scalpel vasectomy.
Medical termination of pregnancy.
• Prevention of mother to child
transmission of HIV during labor.
• Management of High risk pregnancies.
• Caesarian sections.
• Gynecological surgery.
• Advance endoscopic surgery/Infertility work up.
• Sonography and colposcopy in Referral
hospitals.
• Hosahalli RH &H.Siddaiah Road RH are two
Karnataka Govt. Recognized
Laparoscopic Training Centres and MTP Training
centres so for 214
doctors training lap to at 139 for MTP.
• Issue of one free copy of Birth Certificate to all
Babies Born in Referral
Hospitals.
• Training of Nursing students
• Training Centre for LSAS (Life saving anesthetic
skills) Posted from
Directorate.
• RCH programme :
Antenatal care.
Postnatal care.
FW programme.
• Immunization (7 preventable
diseases).
• HIV / AIDS screening.
• Cancer detection/Screening.
• Family planning counseling
and procedures ,MTP‘s
• School health Programme and
Immunization.
• Tuberculosis screening and
Dots.
• Lab facilities.
• Dog bite cases treated with
tissue culture vaccine.
• Treatment of RTI/STD Cases.
• Treatment of ARI & GE Cases.
• Drawing Blood Malarial
¸smear and Treatment.
• H1N1, Dengue, ChikunGuniya,
Disease awareness and
Treatment.
• Normal deliveries.
• Sterilization- Tubectomy.
• Laparoscopic sterilization.
• No scalpel vasectomy.
• Medical termination of
pregnancy.
• Prevention of mother to child
transmission of HIV during
labor.
• NST.
• Issue of one Free copy of Birth
Certificate to all Babies born in
Maternity Homes.
• Immunization
• CDC.
• DOTS and Counseling.
• HIV Screening and Treatment.
Stores and Inventory: • All vaccines are supplied free of cost by the
government of Karnataka.
• Essential drugs are supplied free of cost under
Remodish and child health Programme.
• Basic drugs are available in stores.
• Other requirements (equipments,linen,etc...) are being
procured through tender.
• Rs 10,000 is available for Referral hospital, 5000 for
MH/HC/Dispensary to buy drugs from GMS /KTTP
Act
RESULTS:
ANALYSIS OF BBMP BUDGET RECEIPTS AND
PAYMENTS: Looking at BBMP Budget documents from
2002- 2010 period, there are 32 departments maintained
by BBMP. Looking at Receipts for BBMP, majority of
receipts from Revenue (ranges from 20% to 40.2%),
followed by Engineering Projects (ranges from 3.7% to
22.8%), finance and accounts (9.45 to 39.25), Town
planning (1.4% to 4.5%) departments. While looking at
Receipts for Health department, together both Health
General and health medical receipts, % of receipts vary
from 0.93% in 2008-2009 to 2.06 in 2002-2003 and if
we look heist receipts from different departments,
Health department stands at 7- 10 place over period of
2002-2010 BBMP budget receipts. While looking at
Health General and health Medical receipts separately,
share of Health General receipts vary from 0.8%(2008-
2009) to 1.8% (2002-2003), and stands at 7th
place as
receipts, at the same time, Health Medical receipts are
very low, 0.1% from 2006-2007 to 2009-2010 and 0.2%
from 2002-2003 to 2005-2006.
While looking at BBMP Budgetary allocation form
2002 to 2010, Engineering –public works and
Engineering –project departments are taking a lion
share of BBMP budgetary allocation by 20.7% (32.4%
in 2007-2008, and 14.6% in 2003-2004)and 16.8%
(33.4% in 2004-2005 and 12.1% in 2007-2008) in
2009-2010 budgets. Department of welfare follows next
to these two departments with 13.5% in 2009-2010
budgets, interestingly there is huge increasing trend for
welfare department, it moves from 1.4% in 2008-2009
to 13.5% in 2009-2010.
Looking at Health sector budgetary allocation
including both Health General and Health medical, it is
just 1.6% in 2009-2010 (13.8% in 2005-2006) and it
stands as 12th priority sector for BBMP budgetary
allocations. From 2008-09, BBMP has introduced new
department Named ―Public Health Engineering‖ which
took 5.6% and 5.3% in 2008-2009 and 2009-2010

Prabhakar K.; Saudi J. Humanities Soc. Sci.; Vol-2, Iss-8(Aug, 2017):744-757
Available Online: http://scholarsmepub.com/sjhss/ 748
respectively and this department priorities as 6thplace
for budgetary allocation, major work under this
department was to provide Health
infrastructure(purchase of push carts, Bins, Uniform to
health inspector with shoes &Socks, media publication,
cleaning & Transportation of Garbage, Toilets &
Urinals, Mechanized sweeping etc..) in the newly added
area and construction of maternity homes in each of the
new zones will be undertaken.
While looking at Health General and Health
Medical budgetary allocations separately, Health
General budgetary allocation was 0.9% in 2009-2010
(3.61 in 2008-2009 and 11.65 in 2007-2008), and for
Health Medical it was 0.7% in 2009-2010 (1.6% in
2006-2007), while looking at Budgetary priority for
these two departments will stand at 14th and 17th
places respectively. Details of BBMP Receipts and
Payments (percentages) we can see given below table
Table 3: BBMP Budget Receipts and Payments (percentages) 20020—03 to 2009-10
FY Year 2002-2003 2003-2004 2004-2005 2005-2006 2006-2007 2007-2008 2008 -2009 2009 -2010
RECEIPTS/PAYMENTS Rec Pay Rec Pay Rec Pay Rec Pay Rec Pay Rec Pay Rec Pay Rec Pay
1- Council 0.0 0.9 0.0 1.4 0.0 1.2 0.0 0.8 0.0 1.1 0.0 1.2 0.0 0.2 0.0 0.4
2 - GAD - Management 0.2 7.7 0.2 6.1 0.7 6.2 2.2 11.5 1.7 6.1 1.7 5.6 0.8 5.4 0.7 3.5
3 - Finance & Accounts 27.8 11.6 22.3 8.4 9.4 6.5 17.4 3.5 21.2 2.0 31.1 2.6 39.2 1.8 17.4 0.8
4- Public Relations Cell 0.0 0.2 0.0 0.2 0.0 0.2 0.0 0.2 0.0 0.3 0.0 0.4 0.0 0.3 0.0 0.1
5 - Legal Cell 0.0 0.1 0.0 0.1 0.0 0.1 0.0 0.1 0.0 0.0 0.0 0.1 0.0 0.1 0.0 0.0
6 - Estates & Asset Management
0.0 0.5 0.0 1.2 0.3 0.9 0.1 0.4 0.0 0.2 0.0 0.5 0.1 10.3 0.0 0.3
7 - Statistics 0.0 0.0 0.0 0.0 0.0 0.0 0.0 0.0 0.0 0.0 0.0 0.0 0.0 0.0 0.0 0.0
8 - Revenue 39.6 3.1 32.9 7.7 30.9 3.6 39.7 2.8 36.7 2.1 30.1 2.4 20.3 1.2 40.2 2.7
9- Market 1.0 0.1 1.0 0.3 23.1 0.3 0.9 0.2 1.3 0.1 1.0 0.3 2.1 0.1 1.5 0.4
10 - Advertisement 1.0 0.0 0.9 0.0 0.5 0.0 0.4 0.0 0.5 0.0 2.8 0.0 2.0 0.2 1.6 0.1
11 - Horticulture & Environmental
Management
0.2 2.5 0.2 1.9 0.3 2.0 0.2 2.5 0.2 2.8 0.1 3.8 0.1 2.5 0.0 3.5
12 - Urbane &
Environmental Management
0.0 0.0 0.0 0.0 0.0 0.0 0.0 0.0 0.0 0.0 0.0 0.0 0.0 0.6 0.2 2.7
13 - Health - General 1.8 11.4 1.6 11.4 1.7 11.3 1.5 12.4 1.1 11.4 1.4 11.6 0.8 3.6 1.7 1.0
14- Health - Medical 0.2 1.4 0.2 1.2 0.2 1.1 0.2 1.4 0.1 1.6 0.1 1.2 0.1 1.1 0.1 0.6
Health -total 2.0 12.8 1.8 12.6 1.9 12.4 1.7 13.8 1.2 13.0 1.5 12.8 0.9 4.7 1.8 1.6
15 - India Population
Project 0.1 0.1 0.2 0.2 0.0 0.0 0.0 0.0 0.0 0.0 0.0 0.0 0.0 0.0 0.0 0.0
16 - Town Planning 1.4 0.0 1.6 0.1 1.5 0.0 3.1 0.0 1.8 0.0 3.6 0.0 4.4 0.0 4.5 0.1
17 - Engineering - Solid
Waste Management 0.0 0.3 0.0 0.3 0.0 0.2 0.0 0.3 0.0 0.5 0.0 0.2 0.0 0.6 0.5 0.6
18 - Engineering - Public Works 12onal3
5.4 20.5 3.8 14.6 9.3 18.7 22.3 23.2 4.3 27.1 4.3 32.4 4.0 27.0 2.8 20.7
20 - Engineering - Water
Supply 0.0 0.0 0.0 0.0 0.0 1.6 0.0 0.0
21 - Engineering - Multipurpose Engg
Division Works
0.0 0.6 0.0 0.7 0.0 0.6 0.1 1.2 0.1 1.3 0.1 0.5 0.1 0.1 0.0 0.2
22- Engineering - Pro5ects 6.1 17.7 15.6 25.4 8.7 33.7 7.6 21.9 5.5 18.9 3.7 12.1 21.4 17.5 22.8 16.8
23 - Engineering - Road
Related infrastructure 3.6 8.6 4.8 6.4 0.8 2.9 1.1 8.6 18.8 7.8 14.3 9.4 2.1 8.5 0.9 12.3
24 - Engineering - Storm Water Drains
0.0 0.4 1.0 0.5 0.4 0.8 2.5 1.5 6.0 9.2 4.2 4.9 0.0 3.9 3.7 4.8
25 - Engineering - Traffic
Engineering Cell 1.2 0.4 0.6 1.5 0.1 0.3 0.0 0.3 0.0 0.3 0.1 0.6 0.1 0.5 0.0 1.3
26 - Stores & Workshop 0.3 1.7 0.1 0.3 0.4 0.4 0.0 0.0 0.0 0.0 0.0 0.0 0.0 0.0 0.0 0.0
27 - Engineering -
Electrical 0.2 1.9 0.1 1.5 0.3 1.9 0.3 2.2 0.4 3.3 0.2 4.8 0.3 5.5 0.2 6.3
28 - Culture & Sports 0.0 0.0 0.0 0.0 0.0 0.0 0.0 0.0 0.0 0.0 0.0 0.9 0.1 0.8 0.1 1.2
29 - Comprehensive
Development Plan 9.4 5.4 12.4 6.1 11.0 4.2 0.0 1.3 0.0 0.5 0.0 0.0 0.0 0.0 0.0 0.0

Prabhakar K.; Saudi J. Humanities Soc. Sci.; Vol-2, Iss-8(Aug, 2017):744-757
Available Online: http://scholarsmepub.com/sjhss/ 749
FY Year 2002-2003 2003-2004 2004-2005 2005-2006 2006-2007 2007-2008 2008 -2009 2009 -2010
RECEIPTS/PAYMENTS Rec Pay Rec Pay Rec Pay Rec Pay Rec Pay Rec Pay Rec Pay Rec Pay
30 - Education 0.4 2.3 0.3 2.1 0.3 1.9 0.3 2.2 0.2 1.8 0.1 1.5 0.0 1.2 0.0 0.8
31 - Welfare 0.0 0.6 0.0 0.3 0.0 1.0 0.0 1.5 0.0 1.3 0.7 1.4 2.0 1.4 0.9 13.5
32 - Public Health Engineering - Zonal
0.0 0.0 0.0 0.0 0.0 0.0 0.0 0.0 0.0 0.0 0.0 0.0 0.0 5.6 0.0 5.3
Total
Receipts/Payments 100 100 100 100 100 100 100 100 100 100 100 100 100 100 100 100
BMP Real Budgetary allocations Vs Actual
Allocations for Different sectors against 2006-2007
and 2009-2010 period: To know the real allocation in
2009-2010 to Real allocations in 2006-2007,
(calculations made for real allocation in 2006-2007
based on 2010 CPI 173), looking at the table given
below we can find how budgetary allocations vary from
department to department and how Health department is
being neglected by the BBMP to provide health services
to the urban poor.
Table 4: BBMP Budget Real Allocations Vs Actual Allocations
( Real allocation in 2009-2010 to Real allocations in 2006-2007)
BUDGETARY ALLOCATIONS
2006-2007
Actual
Allocations
2006 -2007 real
allocations as per
2010 CPI
2009 -2010 Actual
Allocations
Real increase
from 2006-2010
% of Real
increase in
2009-10
Welfare 1,518.72 2,136.09 57,331.12 55,195.03 2,583.93
Town Planning 21.59 30.37 583.57 553.20 1,821.76
Engineering - Traffic Engineering
Cell
381.76 536.95 5,702.25 5,165.30 961.98
Advertisement 15.99 22.49 214.35 191.86 853.09
Market 150.15 211.19 1,543.11 1,331.92 630.69
Engineering - Electrical 3,767.97 5,299.67 26,786.75 21,487.08 405.44
Engineering - Road Related Infrastructure
8,928.41 12,557.84 52,016.36 39,458.52 314.21
Education 2,100.97 2,955.02 3,299.33 344.31 11.65
Health total 14,745.54 20,739.66 6,851.36 -13,888.30 -66.96
When comparing the 2006-2007 real allocation
with 2009-2010 actual allocations, among the all
departments, the welfare department takes top chair in
Town planning, Engineering –Traffic management cell,
advertisement, Market are following next.
Unfortunately, basic facilities like Health and education
gets least portion of budgetary allocation and shocking
findings reveal that the Health sector is allocated
negatively from 2006 and 2010, these two basic
services are fundamental rights of every citizen of
India.
Graph 1: % of Actual increase in 2009-10 Over 2006-2007
From the above graph, it can be observed that the
% of increase of real budgetary allocations in 2009-
2010 and 2006-2007. Real allocation for welfare
department is 2583.9%, followed by Town planning
(1821.8%) and so on from 200. Even in case of
Education, it is very minimal i.e. 11.7% of real growth
we found,however in the case of Health over 2006-2007
to 2009-2010, it is really poor, real budgetary
2,583.9
1,821.8
962.0 853.1
630.7 405.4 314.2
11.7 -67.0
Welfare Town Planning Engineering -Traffic
Engineering Cell
Advertisement Market Engineering -Electrical
Engineering -Road Related6nfrastructure
Education Health total

Prabhakar K.; Saudi J. Humanities Soc. Sci.; Vol-2, Iss-8(Aug, 2017):744-757
Available Online: http://scholarsmepub.com/sjhss/ 750
allocations are -67 %, is this acceptable one? But this is
the truth, and this evidence shows how health sector
was neglected that over a period of time by the BBMP
through their budgetary allocations.
Table 4: Priority/Rank of BBMP payments for top sectors
BBMP BUDGETARY ALLOCATIONS
% of Real increase
in 2009-10 Over
2006-2007
Priority/Rank of BBMP payments
Welfare 2,583.9 1
Town Planning 1,821.8 2
Engineering - Traffic Engineering Cell 962.0 3
Advertisement 853.1 4
Market 630.7 5
Engineering - Electrical 405.4 6
Engineering - Road Related 6nfrastructure 314.2 7
Education 11.7 19
Health total -67.0 23
From the above table it is observed that, the
priority for BBMP budgetary allocations for Health
takes 23rd
place and shockingly, it is the last one other
than all departments of BBMP. Even education also
stands at 19th
priority of Budgetary allocations, but most
of the money is spent on construction, welfare scheme
(which are not reaching properly) and is allocated
for short run spending and temporary problem solution
of service delivery, minimum accountable sections get
lion share from BBMP budgetary allocations. The
detailed actual increase in all departments we can be
seen in the table given below.
Table 5: BBMP Budget Real Allocations Vs Actual Allocations for all the sectors
(Real allocation in 2009-2010 to Real allocations in 2006-2007)
BBMP BUDGETARY
ALLOCATIONS 2006-2007
2006 ACTUAL
as per 2010 CPI 2009 -2010 Actual increase
% of actual
increase in
2009-10
1Council 1,292.05 1,817.27 1,753.48 -63.79 -3.51
2 GAD - Management 6,937.07 9,757.02 15,010.76 5,253.74 53.85
3 Finance & Accounts 2,333.28 3,281.77 3,354.00 72.23 2.20
4 Public Relations Cell 322.43 453.50 542.49 88.99 19.62
5 Legal Cell 50.91 71.61 173.88 102.27 142.83
6 Estates & Asset Management 254.36 357.76 1,144.69 786.93 219.96
7 Statistics 7.92 11.14 39.64 28.50 255.85
8 Revenue 2,407.35 3,385.95 11,306.30 7,920.35 233.92
9 Market 150.15 211.19 1,543.11 1,331.92 630.69
10 Advertisement 15.99 22.49 214.35 191.86 853.09
11 Horticulture & Environmental
Management
3,227.40 4,539.35 14,849.95 10,310.60 227.14
11 Urban & Environmental
Management
0.00 11,316.60 11,316.60
Health total 14,745.54 20,739.66 6,851.36 -13,888.30 -66.96
India Population Project 0.00 0.00
14 Town Planning 21.59 30.37 583.57 553.20 1,821.76
15 Engineering - Solid Waste
Management
526.92 741.12 2,593.15 1,852.03 249.90
16 Engineering - Public Works 12onal3
30,954.45 43,537.56 87,684.10 44,146.54 101.40
17 Engineering - Water Suppl8 0.00 0.00
18 Engineering - Multipurpose Engg
Division Works
1,437.22 2,021.46 805.14 -1,216.32 -60.17
19 Engineering - Pro5ects 21,590.31 30,366.86 71,162.72 40,795.86 134.34
20 Engineering - Road Related
6nfrastructure
8,928.41 12,557.84 52,016.36 39,458.52 314.21
21 Engineering - Storm Water Drains
10,556.47 14,847.72 20,323.49 5,475.77 36.88
22 Engineering - Traffic Engineering
Cell
381.76 536.95 5,702.25 5,165.30 961.98
23 Stores & Workshop 11.61 16.33 -16.33 -100.00
24 Engineering - Electrical 3,767.97 5,299.67 26,786.75 21,487.08 405.44
25 Culture & Sports 599.38 843.03 -843.03 -100.00
Comprehensive Development Plan 0.00 5,088.10 5,088.10
26 Education 2,100.97 2,955.02 3,299.33 344.31 11.65
27 Welfare 1,518.72 2,136.09 57,331.12 55,195.03 2,583.93
Public Health Engineering - Zonal 0.00 22,365.27 22,365.27
Total PAYMENTS 114,140.21 160,538.67 423,841.96 263,303.29 164.01

Prabhakar K.; Saudi J. Humanities Soc. Sci.; Vol-2, Iss-8(Aug, 2017):744-757
Available Online: http://scholarsmepub.com/sjhss/ 751
Trends in BBMP expenditure on Health Sector
(GDP is at Market prices, Central & State level)
BBMP spending on health has slightly
increased from 0.27% in 2002-2003 to 0.28% in
2004-05 as per Karnataka state Real GDP for BBMP
Budgetary allocation, but for the above same period the
actual/nominal allocation is very low compared to the
real allocations, but interestingly after 2004-2005 ,
from 2005-2006, there is a reverse trend (opposite to
2005-2006 before period) between real and actual
allocation till 2008-2009 , i.e. from 2005-2006 real
allocations are less than the actual allocation, it signifies
how Health sector is neglected by the BBMP from past
five years. We can observe detailed real and actual
allocations by BBMP for Health sector in the table
given below.
Table 6: BBMP health spending with GDP at Nominal and Real at Central and state level
Budget Period GDP Nominal-
India GDP Real-India
GDP Nominal-
Karnataka
GDP Real-
Karnataka
2008-09 0.0025 0.0023 0.047 0.043
2007-08 0.0051 0.0042 0.096 0.079
2006-07 0.0037 0.0028 0.072 0.055
2005-06 0.0042 0.0030 0.082 0.058
2004-05 0.0045 0.0140 0.090 0.281
2003-04 0.0044 0.0132 0.101 0.302
2002-03 0.0042 0.0120 0.093 0.266
Note: GDP at Current prices
BBMP Health Budgets Analysis in detail:
According to BBMP budget documents, there
are two heads for Health department, Heath –General
and Health Medical. Administration, maintenance of
the hospitals, providing infrastructure facilities, Health
and sanitation, public health, prevention of food
adulteration and swachha Bangalore project expenses
are the major sub line items in Health general. Under
Health Medical, General expenses like disposal of
hospital waste, information, Education like publicity,
staff salaries, family welfare expenses, health scheme
expenses and Maternity Homes & child welfare
expenses are the major sub line items, overall Health –
Medical will take Medical care of public and Health -
General will take care of supporting and administration
of Health department.
As whole of Health department budget trends, we
can observe Health department receipts and
payments(Budgetary allocation) from 2002-2009 from
below given graph, which explains that there is a clear
cut evidence that health department receipts are very
minimal and it ranges from 0.9% to 2.06%, but
payments are quite high rather than their receipts. From
2008-2009 to budgetary allocation s for payments are
suddenly decreased and in 2009-2010 budgetary
allocations (1.62%) are less than the heath sector
receipts (1.84%). Reasons for sudden decrease in
payments, from this period BBMP has added one more
department named ―Public Health Engineering –zonal,
these department taking care of major works like to
providing Health infrastructure(purchase of push carts,
Bins, Uniform to health inspector with shoes &Socks,
media publication, cleaning & Transportation of
Garbage, Toilets & Urinals, Mechanized sweeping etc..)
in the newly added area and construction of maternity
homes in each of the new zones will be undertaken,
even if these department‘s payments are combined, it is
very lower (10.2% in 2008-2009 and 6.9% in 2009-
2010) than the previous year‘s budgetary allocations.
Graph 2: % of BBMP Health Receipts and Payments from 2002-03 To 2009-10
0.002.004.006.008.00
10.0012.0014.00
Re
ceip
ts
Pay
me
nts
Re
ceip
ts
Pay
me
nts
Re
ceip
ts
Pay
me
nts
Re
ceip
ts
Pay
me
nts
Re
ceip
ts
Pay
me
nts
Re
ceip
ts
Pay
me
nts
Re
ceip
ts
Pay
me
nts
Re
ceip
ts
Pay
me
nts
2002-2003 2003-2004 2004-2005 2005-2006 2006-2007 2007-2008 2008 -2009
2009 -2010
2.06
12.77
1.79
12.67
1.90
12.38
1.67
13.77
1.23
12.92
1.52
12.80
0.93
4.68
1.84 1.62

Prabhakar K.; Saudi J. Humanities Soc. Sci.; Vol-2, Iss-8(Aug, 2017):744-757
Available Online: http://scholarsmepub.com/sjhss/ 752
BBMP spending priority (Budgetary allocations) for
Health:
Based on BBMP budgetary allocations, to
know priority of allocation to health, Rank/priority
number based on higher allocation to lower allocations
are assigned, with findings, priority of health from
given below chart can be seen, from 2002-2003 to
2006-2007, budgetary allocation Health department is
fourth priority/Rank, and in 2007-2008 it is third
priority, But from 2008-2009 it is 9th
priory of
Budgetary allocations and for last year 2009-2010
budgetary allocation it is 13th
priority, this one shows
how past two years allocations were declining for health
department.
Graph 3: BBMP - Health priorities (Rank) for spending from 2002 to 2010
BBMP Health Budgets (Health General and Health
Medical) Analysis: In this section we can see the
BBMP Budgetary Receipts for Health General and
Health Medical separately and finally
payments/Expenditure (budgetary allocations) for both
Health General and Health Medical can be observed.
Table 7: Health General Budget Trend Analysis:
2002-2003 2003-2004 2004-2005 2005-2006 2006-2007 2007-2008 2008-2009 2009-2010
Health –
General-
Receipts 1.8 1.6 1.7 1.5 1.1 1.4 0.8 1.7
Health –
General-
Payments 11.38 11.42 11.29 12.36 11.35 11.65 3.61 0.98
From the above table it is observe that Health
General Receipts are very low, it can be found from
total health receipts also. Till 2006-2007, health
general payment (budgetary allocations) are high, but
from 2008-2009, it is decreasing and in last year BBMP
budget it is less than 1 percent (see given below graph).
In the last year payments it can be obseverd that
payments are lesser than receipts. Usually, allocations
will be re-estimated and real spending will be less than
50% of actual allocation, i.e. in real time BBMP is
going to spend 0.5 or less than that on Health general,
with these kind of allocation it can be imagined how
Bangalore metro city urban poor will get health
services.
4 4 4 4 4 3
9
13
2002-2003 2003-2004 2004-2005 2005-2006 2006-2007 2007-2008 2008 -2009 2009 -2010

Prabhakar K.; Saudi J. Humanities Soc. Sci.; Vol-2, Iss-8(Aug, 2017):744-757
Available Online: http://scholarsmepub.com/sjhss/ 753
Graph 4: BBMP - Health General Receipts and Payments (%) from 2002 To 2010
Health Medical Budget Trend Analysis: The real
medical careis taken by Health Medical only, looking at
BBMP Health Medical budget trends, it is seen how the
urban poor health is neglected by the BBMP.
However,it is observed that receipts are very low for
health departments. But payments (budgetary
allocations) are very minimum, especially for Health
Medical comparing to Health general, same time we
should keep in mind real medical care is taken by
Health medical only. From given below table and graph
real picture of budgetary allocations for Health Medical
can be seen. With 1.5% (is the highest) of spending it is
known how well the BBMP is concerned about the
urban poor peoples‘ health.
Table 8: Health Medical Budget Trend Analysis:
2002-2003 2003-2004 2004-2005 2005-2006 2006-2007 2007-2008 2008-2009 2009-2010
Health -
Medical -
Receipts 0.2 0.2 0.2 0.2 0.1 0.1 0.1 0.1
Health -
Medical
–
Payments 1.39 1.24 1.09 1.41 1.56 1.16 1.07 0.64
BBMP spending priority (Budgetary allocations) for
Health General and Health Medical: Based on
payments (Budgetary allocations) from highest
allocation to lowest for all departments, from given
below table we can see the budgetary allocation priority
for Health General and Health Medical. For health,
General spending priority was third until 2007-2008,
after that the priority was very low i.e., ninth in 2008-
2009 and 14th
in last year budget. Interestingly, on
ground where real medical care is taken, i.e. Health
Medical budgetary allocation priority is always
neglected, till 2005-2006 it is varieties between 12th
,
13th
and 14th
priority, from 2008-2009 it is 15th
priority
and in last year 2009-2010 it is 17th
priority of
allocation to health medical. Given below graph shows
clear vision on payments (Budgetary allocation) for
both Health General and Health Medical.
Table 9: Health General and payment priority (Ranking):
PAYMENT
PRIORITY
2002-
2003
2003-
2004
2004-
2005
2005-
2006
2006-
2007
2007-
2008
2008 -
2009
2009 -
2010
Health - General 4 3 3 3 3 3 9 14
Health - Medical 13 14 13 13 12 15 15 17
1.8 1.6 1.7 1.5 1.1
1.4 0.8
1.7
11.38 11.42 11.29
12.36
11.35 11.65
3.61
0.98
2003 2004 2005 2006 2007 2008 2009 2010
Health - General-Receipts Health - General-Payments
Prabhakar K.; Saudi J. Humanities Soc. Sci.; Vol-2, Iss-8(Aug, 2017):744-757
Available Online: http://scholarsmepub.com/sjhss/ 754
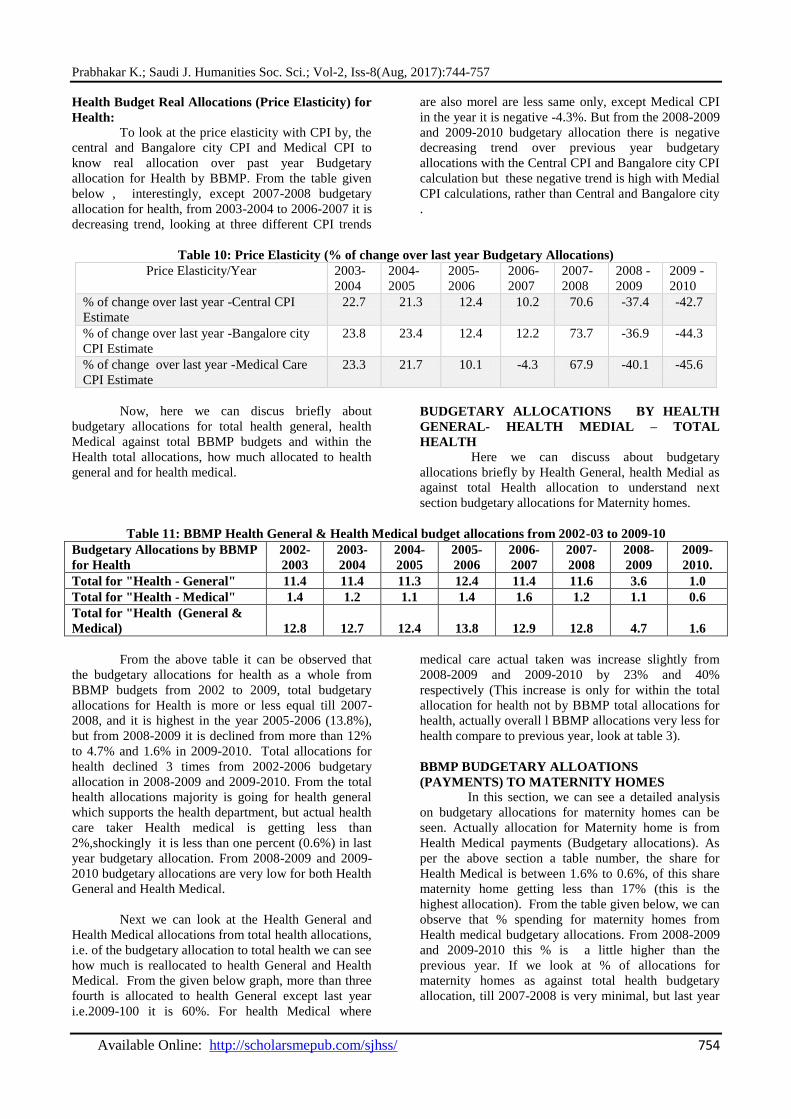
Health Budget Real Allocations (Price Elasticity) for
Health:
To look at the price elasticity with CPI by, the
central and Bangalore city CPI and Medical CPI to
know real allocation over past year Budgetary
allocation for Health by BBMP. From the table given
below , interestingly, except 2007-2008 budgetary
allocation for health, from 2003-2004 to 2006-2007 it is
decreasing trend, looking at three different CPI trends
are also morel are less same only, except Medical CPI
in the year it is negative -4.3%. But from the 2008-2009
and 2009-2010 budgetary allocation there is negative
decreasing trend over previous year budgetary
allocations with the Central CPI and Bangalore city CPI
calculation but these negative trend is high with Medial
CPI calculations, rather than Central and Bangalore city
.
Table 10: Price Elasticity (% of change over last year Budgetary Allocations)
Price Elasticity/Year 2003-
2004
2004-
2005
2005-
2006
2006-
2007
2007-
2008
2008 -
2009
2009 -
2010
% of change over last year -Central CPI
Estimate
22.7 21.3 12.4 10.2 70.6 -37.4 -42.7
% of change over last year -Bangalore city
CPI Estimate
23.8 23.4 12.4 12.2 73.7 -36.9 -44.3
% of change over last year -Medical Care
CPI Estimate
23.3 21.7 10.1 -4.3 67.9 -40.1 -45.6
Now, here we can discus briefly about
budgetary allocations for total health general, health
Medical against total BBMP budgets and within the
Health total allocations, how much allocated to health
general and for health medical.
BUDGETARY ALLOCATIONS BY HEALTH
GENERAL- HEALTH MEDIAL – TOTAL
HEALTH
Here we can discuss about budgetary
allocations briefly by Health General, health Medial as
against total Health allocation to understand next
section budgetary allocations for Maternity homes.
Table 11: BBMP Health General & Health Medical budget allocations from 2002-03 to 2009-10
Budgetary Allocations by BBMP
for Health
2002-
2003
2003-
2004
2004-
2005
2005-
2006
2006-
2007
2007-
2008
2008-
2009
2009-
2010.
Total for "Health - General" 11.4 11.4 11.3 12.4 11.4 11.6 3.6 1.0
Total for "Health - Medical" 1.4 1.2 1.1 1.4 1.6 1.2 1.1 0.6
Total for "Health (General &
Medical) 12.8 12.7 12.4 13.8 12.9 12.8 4.7 1.6
From the above table it can be observed that
the budgetary allocations for health as a whole from
BBMP budgets from 2002 to 2009, total budgetary
allocations for Health is more or less equal till 2007-
2008, and it is highest in the year 2005-2006 (13.8%),
but from 2008-2009 it is declined from more than 12%
to 4.7% and 1.6% in 2009-2010. Total allocations for
health declined 3 times from 2002-2006 budgetary
allocation in 2008-2009 and 2009-2010. From the total
health allocations majority is going for health general
which supports the health department, but actual health
care taker Health medical is getting less than
2%,shockingly it is less than one percent (0.6%) in last
year budgetary allocation. From 2008-2009 and 2009-
2010 budgetary allocations are very low for both Health
General and Health Medical.
Next we can look at the Health General and
Health Medical allocations from total health allocations,
i.e. of the budgetary allocation to total health we can see
how much is reallocated to health General and Health
Medical. From the given below graph, more than three
fourth is allocated to health General except last year
i.e.2009-100 it is 60%. For health Medical where
medical care actual taken was increase slightly from
2008-2009 and 2009-2010 by 23% and 40%
respectively (This increase is only for within the total
allocation for health not by BBMP total allocations for
health, actually overall l BBMP allocations very less for
health compare to previous year, look at table 3).
BBMP BUDGETARY ALLOATIONS
(PAYMENTS) TO MATERNITY HOMES
In this section, we can see a detailed analysis
on budgetary allocations for maternity homes can be
seen. Actually allocation for Maternity home is from
Health Medical payments (Budgetary allocations). As
per the above section a table number, the share for
Health Medical is between 1.6% to 0.6%, of this share
maternity home getting less than 17% (this is the
highest allocation). From the table given below, we can
observe that % spending for maternity homes from
Health medical budgetary allocations. From 2008-2009
and 2009-2010 this % is a little higher than the
previous year. If we look at % of allocations for
maternity homes as against total health budgetary
allocation, till 2007-2008 is very minimal, but last year

Prabhakar K.; Saudi J. Humanities Soc. Sci.; Vol-2, Iss-8(Aug, 2017):744-757
Available Online: http://scholarsmepub.com/sjhss/ 755
budgetary allocation looks better (7%) than to previous year budgetary allocations.
Table 11: Allocations to Maternity Homes by BBMP from Health General & Health Medical from 2002-03 to
2009-10
SPENDING FOR MATERNITY HOMES 2002-
2003
2003-
2004
2004-
2005
2005-
2006
2006-
2007
2007-
2008
2008-
2009
2009-
2010
% of spending for Maternity Homes
from Health -Medical budget 5.5 12.4 9.4 5.5 11.0 2.3 12.3 17.3
% of spending for Maternity Homes as
against total Health Budget 0.6 1.2 0.8 0.6 1.3 0.2 2.8 6.9
Where money is going so far: To know budgetary
allocations under these two departments i.e. Health
General and Health Medical, how is it allocated and on
what basis is it allocated, a small exercise is done and
the findings are given in below table (separate for
Health General and Health Medical).
Table 12: BBMP Health General Payments (%) by item wise from 2002-03 to 2009-10
PAYMENTS -GENERAL
2002-
2003
2003-
2004
2004-
2005
2005-
2006
2006-
2007
2007-
2008
2008-
2009
2009-
2010
Salaries 52.3 50.6 43.9 44.8 43.4 33.7 79.9 53.8
Public Health 33.1 33.4 38.5 39.6 42.1 52.4 4.1 3.6
Current Assets/Liabilities
(Statutory Deductions -
Salary Deductions)
12.7 10.4 10.0 9.6 9.4 4.8 8.8 23.7
Running & Maintenance
charges 0.0 2.3 2.7 2.9 3.0 2.5 0.0 0.0
Animal population control
Expenses (street Dog
Management & Cattle
Catching Vehicle)
0.9 1.2 1.2 0.8 1.3 1.7 4.9 15.2
From the above table, almost half of the Health
General allocations are going to salaries except (2007-
2008) and interestingly spending for public Health is
decaling from 2008-2009 and 2009-2010 budget
allocation, but share of spending on public health was
more than one third and it is more than fifty per cent
(52% in 2007-2008 ); Under the public health head
major activities like Cleaning & transportation of
garbage, Toilets, Decentralized composting, purchase of
MC Equipments & Larvicides, Co-ordination of
Mosquito Control programme etc are taken care.
Interestingly spending on Animal population control is
increasing, every year more money is spent on this
programme, it is 15% in 2009-2010 budgetary
allocation. Even though spending money on stray dog
control from 2002, year by year allocations for this head
also increasing, then where is the control of stray dog
population? In actual fact, if controlling of the stray dog
population was put into practice, the allocations should
have come down under this head. However, it is found
to be unsatisfying.
Table 13: BBMP Health Medical payments (%) by item wise from 2002-03 to 2009-10
PAYMENTS -MEDICAL 2002-
2003
2003-
2004
2004-
2005
2005-
2006
2006-
2007
2007-
2008
2008-
2009
2009-
2010
Salaries 81.7 72.7 67.1 66.1 56.5 51.2 41.3 38.6
General Expenses 0.0 0.0 0.0 0.0 0.0 22.3 23.2 17.5
Maternity Homes & Child
Welfare Expenses 5.5 12.4 9.4 5.5 11.0 2.3 12.3 17.3
Health Scheme Expenses 3.1 7.1 9.5 11.5 8.9 9.9 13.5 16.5
Family Welfare Expenses 1.2 1.4 1.4 1.4 4.7 0.9 2.3 4.2
Office Infrastructure 0.0 0.0 0.0 0.0 0.0 0.2 3.3 3.7
Till 2007-2008, spending for salaries are more
than half from Health Medical budgetary allocations,
but from last two years it is 41% and 39% respectively.
This will reflects on shortage of vacant posts. Under
the Health scheme expense ( under this head
programmes covered are AIDS programme,
ArogyaMela, Baby show, Health city programme, pulse
polio programme, purchase of Anti-Rabies Vaccine) is
increasing form last two years only. Same kind of trend
can be seen for budgetary allocations for Maternity
Homes & child welfare.

Prabhakar K.; Saudi J. Humanities Soc. Sci.; Vol-2, Iss-8(Aug, 2017):744-757
Available Online: http://scholarsmepub.com/sjhss/ 756
CONCLUSION
The study points out that the private health
care sector is very systematic with respective to both
budget allocation and maternity care services and
accessibility of health services which plays an
important role in providing health services, however in
case of urban health the budget allocation and the
services are less when compare to service rendered by
the private health care services in municipalities and
metro‘s. The findings suggest that the overall BBMP
budget allocation was declining when compared to its
previous year which has to be regulated to improve the
health programmes and also women health in particular.
The study concludes that the budget allocation for urban
health was very less when compared to other sectors
such as welfare, town planning, markets etc., it was
fascinating to note that major part of expenditure was
absorbed to paying salaries which accounts for nearly
60% of total health allocations. The study also conveys
that among 24 priority ranks of BBMP Budgetary
allocations for health was 23rd priority, which clearly
indicates the ignorance and this has to been taken as
prime significance area of health sectors. Further, the
study also makes a significant evident that is needed for
higher budget allocation for both public and private
health in municipalities health budget allocations and
its services especially for inclusion of modern and best
qualified practitioners in the field of medicine for public
health services especially for pregnant women and
childcare services. In this connection, there is a need
to bridge the gap between municipalities and the state
budget allocation to minimize the health services
especially for urban poor women.
Finally, the study revealed that the trends of
deliveries against ANC registered from BBMP
maternity hospital was declining over the years and
many urban people were preferring to avail private
health care hospital for their better health. This situation
indirectly propels the urban people to trap out of pocket
spending‘s expenditure on health (OOPS). Hence,
budget allocation for health services is prime important
which directly influences the mortality rate of both
pregnant women and child in long run.
REFERENCES:
1. A.R.Johnson, B.Rock, N.Catherin, Sr.Berlin,
R.Rupini and A.Kasthuri,( 2015). Awareness of
Government Maternity Benefit Schemes among
women attending antenatal clinic in a rural hospital
in Karnataka, India, International Journal of
Current Research and Academic Review, 3(1),
137-143.
2. Chatterjee, Meera, 1990, Indian Women: Their
Health and Economic Productivity, World Bank
Discussion Papers 109, Washington, DC.
3. Desai, Sonalde, (1994). Gender Inequalities and
Demographic Behavior, India, New York.
4. Duggal Ravi (1997): ‗Health Care Budgets In A
Changing political Economy, EPW, May 17-24pp.
1197-1200.
5. Duggal Ravi, S Nandraj and AVadair (1995):
‗Health Expenditure Across States‘
(SpecialStatistics), EPW, April 15 and 22.
6. Economic research foundation New Delhi, (2006)
‗Government Health Expenditure in India‘ A
Benchmark study undertaken for the MacArthur
foundation, India.
7. GOI (1997): Economic Survey 1996-97, Ministry
of Finance, Government of India, New Delhi.
8. Jayashree Satput, (2010). Legal intervention to
strengthen accountability for maternal health and
reproductive rights. The white ribbon alliance for
safe motherhood, 2010 Sep, 32: 93-96.
9. Kalra,S.K. (1979), Some aspects of Childhood
Socialization of High achievers. In K.Srinivasan,
P.C.Saxena & T.Kantikar (Eds.), Demographic and
Socio-Economic aspects of the Child in India, New
Delhi, Himalaya Publications.
10. Kranti S Vora,Dileep V Mavalankar,Ramani K.V.
,MuditaUpadhyaya and Bharati Sharma (2008): ―
Maternal Health situation in India – a case study‘
Indian Institute of Management, Ahmedabad, India
.
11. Measham, Anthony R. and Richard A. Heaver
(eds.). 1996, India‘s Family Welfare Program:
Moving to a Reproductive and Child Health
Approach. Washington, DC: The World Bank.
12. Parul, S., Surekha, K., Sanjeev, K.G., Jayanti, S.
2012. Effects of Janani suraksha Yojana (a
maternity benefit scheme) up-on the utilization of
ante-natal care services in rural &urban-slum
communities of Dehradun. National Journal of
Community Medicine. Vol. 3(1): 129 139.
13. Rao Sujatha K, Selvarau S, Nagpalsomil and
Sakthivel S (2005) : ‗ financing and Delivery of
Health Care Services in India‘ Section IV,
Background paper of the National commission on
macro economics and Health, Ministry of Health
and family welfare, Government of India.
14. Sheth J K Shah U P Joshi Bhavin A Bala DV,
2015, Assessment of access and utilization of basic
maternity health services in the East Zone of
Ahmedabad Municipal Corporation, Indian Journal
of Maternal and Child Health, Volume 15 (1),
2013.
15. The World Bank, 1996, Improving Women‘s
Health in India, Washington, DC.
16. Tulasidhar V (1993): ‗Structural Adjustment
Program - Its Impact on the Health Sector‘,NIPFP,
Delhi.
17. World Bank (1996) : India - A Comparative
Review of Health Sector Reform in Four States: An
Operational Perspective‘, Report No.15753-IN
(Draft Version), Washington.

Prabhakar K.; Saudi J. Humanities Soc. Sci.; Vol-2, Iss-8(Aug, 2017):744-757
Available Online: http://scholarsmepub.com/sjhss/ 757
SECONDARY DATA SOURCES:
1. BBMP budget documents are collected form
BBMP office as well as recent documents are
downloaded from BBMP website
http://bbmp.gov.in/budjet
2. Data on Consumer price Index source is
http://labourbureau.nic.in/indtab.html#LB1
3. Data on GDP source is
http://vishalmishra.com/statewise-gdp.html and
http://en.wikipedia.org/wiki/List_of_Indian_states_
by_GDP
4. http://timesofindia.indiatimes.com/india/India-
ranks-171-out-of-175-in-public-health-spending-
says-WHO-study/articleshow/4879566.cms
5. http://whoindia.org/EN/Section210/Section267/Sec
tion454.htm
6. http://www.thehindubusinessline.com/2006/09/19/s
tories/2006091901451100.htm