serveur académique lausannois serval serval.unilbib_73f3460c24d9.p001/ref.pdf · bandinelli s ,...
TRANSCRIPT
Serveur Académique Lausannois SERVAL serval.unil.ch
Author Manuscript Faculty of Biology and Medicine Publication
This paper has been peer-reviewed but dos not include the final publisher
proof-corrections or journal pagination.
Published in final edited form as:
In the absence of a copyright statement, users should assume that standard copyright protection applies, unless the article contains
an explicit statement to the contrary. In case of doubt, contact the journal publisher to verify the copyright status of an article.
Title: A genome-wide approach accounting for body mass index
identifies genetic variants influencing fasting glycemic traits and
insulin resistance.
Authors: Manning AK, Hivert MF, Scott RA, Grimsby JL, Bouatia-Naji N,
Chen H, Rybin D, Liu CT, Bielak LF, Prokopenko I, Amin N, Barnes D,
Cadby G, Hottenga JJ, Ingelsson E, Jackson AU, Johnson T, Kanoni S,
Ladenvall C, Lagou V, Lahti J, Lecoeur C, Liu Y, Martinez-Larrad MT,
Montasser ME, Navarro P, Perry JR, Rasmussen-Torvik LJ, Salo P, Sattar
N, Shungin D, Strawbridge RJ, Tanaka T, van Duijn CM, An P, de
Andrade M, Andrews JS, Aspelund T, Atalay M, Aulchenko Y, Balkau B,
Bandinelli S, Beckmann JS, Beilby JP, Bellis C, Bergman RN, Blangero J,
Boban M, Boehnke M, Boerwinkle E, Bonnycastle LL, Boomsma DI,
Borecki IB, Böttcher Y, Bouchard C, Brunner E, Budimir D, Campbell H,
Carlson O, Chines PS, Clarke R, Collins FS, Corbatón-Anchuelo A,
Couper D, de Faire U, Dedoussis GV, Deloukas P, Dimitriou M, Egan
JM, Eiriksdottir G, Erdos MR, Eriksson JG, Eury E, Ferrucci L, Ford I,
Forouhi NG, Fox CS, Franzosi MG, Franks PW, Frayling TM, Froguel P,
Galan P, de Geus E, Gigante B, Glazer NL, Goel A, Groop L, Gudnason
V, Hallmans G, Hamsten A, Hansson O, Harris TB, Hayward C, Heath S,
Hercberg S, Hicks AA, Hingorani A, Hofman A, Hui J, Hung J, Jarvelin
MR, Jhun MA, Johnson PC, Jukema JW, Jula A, Kao WH, Kaprio J,
A genome-wide approach accounting for body mass indexidentifies genetic variants influencing fasting glycemic traits andinsulin resistance
Alisa K. Manning1,2,3,4,*, Marie-France Hivert5,6,*, Robert A. Scott7,*, Jonna L. Grimsby5,8,Nabila Bouatia-Naji9,10, Han Chen1, Denis Rybin11, Ching-Ti Liu1, Lawrence F. Bielak12,Inga Prokopenko13,14, Najaf Amin15, Daniel Barnes7, Gemma Cadby16,17, Jouke-JanHottenga18, Erik Ingelsson19, Anne U. Jackson20, Toby Johnson21, Stavroula Kanoni22,Claes Ladenvall23,24, Vasiliki Lagou13,14, Jari Lahti25, Cecile Lecoeur9,10, Yongmei Liu26,Maria Teresa Martinez-Larrad27, May E. Montasser28, Pau Navarro29, John R. B.Perry14,30,31, Laura J. Rasmussen-Torvik32, Perttu Salo33, Naveed Sattar34, DmitryShungin23,24,35,36, Rona J. Strawbridge37, Toshiko Tanaka38, Cornelia M. van Duijn15,39,40,Ping An41, Mariza de Andrade42, Jeanette S. Andrews43, Thor Aspelund44,45, MustafaAtalay46, Yurii Aulchenko15, Beverley Balkau47,48, Stefania Bandinelli49, Jacques S.Beckmann50,51, John P. Beilby52,53,54, Claire Bellis55, Richard N. Bergman56, JohnBlangero55, Mladen Boban57, Michael Boehnke20, Eric Boerwinkle58, Lori L. Bonnycastle59,Dorret I. Boomsma18, Ingrid B. Borecki41, Yvonne Böttcher60, Claude Bouchard61, EricBrunner62, Danijela Budimir57, Harry Campbell63, Olga Carlson64, Peter S. Chines59, RobertClarke65, Francis S. Collins66, Arturo Corbatón-Anchuelo27, David Couper67, Ulf de Faire68,George V Dedoussis69, Panos Deloukas22, Maria Dimitriou69, Josephine M Egan64, GudnyEiriksdottir44, Michael R. Erdos59, Johan G. Eriksson70,71,72,73,74, Elodie Eury9,10, LuigiFerrucci75, Ian Ford76, Nita G. Forouhi7, Caroline S Fox77,78, Maria Grazia Franzosi79, PaulW Franks23,24,35,80,81, Timothy M Frayling30, Philippe Froguel9,10,82, Pilar Galan83, Eco deGeus18, Bruna Gigante68, Nicole L. Glazer84,85, Anuj Goel86, Leif Groop23,24, VilmundurGudnason44,45, Göran Hallmans87, Anders Hamsten37, Ola Hansson23,24, Tamara B.Harris88, Caroline Hayward29, Simon Heath89, Serge Hercberg83, Andrew A. Hicks90, AroonHingorani91, Albert Hofman15,40, Jennie Hui52,53,54,92, Joseph Hung54,93, Marjo RiittaJarvelin94,95,96,97, Min A. Jhun12, Paul C.D. Johnson76, J Wouter Jukema98,99, Antti Jula33,W.H. Kao100, Jaakko Kaprio74,101,102, Sharon L. R. Kardia12, Sirkka Keinanen-Kiukaanniemi103,104, Mika Kivimaki62, Ivana Kolcic105, Peter Kovacs106, Meena Kumari91,Johanna Kuusisto107, Kirsten Ohm Kyvik108, Markku Laakso107, Timo Lakka46,109, LarsLannfelt110, G Mark Lathrop89, Lenore J. Launer88, Karin Leander68, Guo Li111, LarsLind112, Jaana Lindstrom113, Stéphane Lobbens9,10, Ruth J. F. Loos7, Jian’an Luan7,Valeriya Lyssenko23,24, Reedik Mägi13,14,114, Patrik K. E. Magnusson19, Michael Marmot62,Pierre Meneton115, Karen L. Mohlke116, Vincent Mooser117, Mario A. Morken59, IvaMiljkovic118, Narisu Narisu59, Jeff O’Connell28, Ken K. Ong7, Ben A. Oostra119, Lyle J.
†Co-corresponding Authors: James B. Meigs, Harvard Medical School, General Medicine Division, Massachusetts General Hospital,50 Staniford St 9th Floor, Boston MA 02114, Tel. 617-724-3203, Fax. 617-724-3544, [email protected], Claudia Langenberg,MRC Epidemiology Unit, Institute of Metabolic Science, Addenbrooke’s Hospital, Cambridge CB2 0QQ, United Kingdom, Tel. +44(0)1223 769137, Fax. +44 (0)1223 330316, [email protected] full list of members is provided in the Supplementary Note*These authors contributed equally to this work†These authors jointly directed the work**Deceased
AUTHOR CONTRIBUTIONSAKM, JD and JBM conceived of the study, AKM and RAS performed the analysis, AKM, MFH and RAS wrote the manuscript, JBMand CL directed the work, and JLG, NBN, HC, DR, CTL, LFB, IP, RMW, JCF JD, JBM and CL provided analytical advice andrevised the manuscript. A full list of author contributions is provided in the Supplementary Note.
NIH Public AccessAuthor ManuscriptNat Genet. Author manuscript; available in PMC 2013 April 01.
Published in final edited form as:Nat Genet. ; 44(6): 659–669. doi:10.1038/ng.2274.
NIH
-PA Author Manuscript
NIH
-PA Author Manuscript
NIH
-PA Author Manuscript
Palmer16,17, Aarno Palotie2,22,101,120, James S. Pankow121, John F. Peden86, Nancy L.Pedersen19, Marina Pehlic122, Leena Peltonen22,101,**, Brenda Penninx123,124,125, MarijanaPericic126, Markus Perola33, Louis Perusse127, Patricia A Peyser12, Ozren Polasek105, PeterP. Pramstaller90, Michael A. Province41, Katri Räikkönen25, Rainer Rauramaa109,128, EmilRehnberg19, Ken Rice129, Jerome I. Rotter130, Igor Rudan63,131, Aimo Ruokonen132, TimoSaaristo133,134, Maria Sabater-Lleal37, Veikko Salomaa33, David B. Savage135, RichaSaxena2,136, Peter Schwarz137, Udo Seedorf138, Bengt Sennblad37, Manuel Serrano-Rios27,Alan R. Shuldiner28,139, Eric J.G. Sijbrands140, David S. Siscovick111,141,142, Johannes H.Smit143, Kerrin S. Small31, Nicholas L. Smith141,142,144,145, Albert Vernon Smith44,45, AlenaStančáková107, Kathleen Stirrups22, Michael Stumvoll60,146, Yan V. Sun147, Amy J. Swift59,Anke Tönjes60,146, Jaakko Tuomilehto148,149,150,151, Stella Trompet98, Andre G.Uitterlinden15,40,140, Matti Uusitupa152,153, Max Vikström68, Veronique Vitart29, Marie-Claude Vohl154, Benjamin F. Voight2, Peter Vollenweider155, Gerard Waeber155, Dawn MWaterworth117, Hugh Watkins86, Eleanor Wheeler156, Elisabeth Widen157, Sarah H. Wild63,Sara M. Willems15, Gonneke Willemsen18, James F. Wilson63, Jacqueline C.M.Witteman15,40, Alan F. Wright29, Hanieh Yaghootkar30, Diana Zelenika89, TatijanaZemunik122, Lina Zgaga63,158, DIAGRAM Consortium159, The MUTHER Consortium159,Nicholas J. Wareham7, Mark I. McCarthy13,14,160, Ines Barroso156,161, Richard M.Watanabe56,162, Jose C. Florez2,8,136,163, Josée Dupuis1,77, James B. Meigs5,8,†, andClaudia Langenberg7,†
1Department of Biostatistics, Boston University School of Public Health, Boston, Massachusetts,USA 2Program in Medical and Population Genetics, Broad Institute, Cambridge, Massachusetts,USA 3Department of Molecular Biology, Massachusetts General Hospital, Boston,Massachusetts, USA 4Harvard Medical School, Boston, Massachusetts 5General MedicineDivision, Massachusetts General Hospital, Boston, Massachusetts, USA 6Department ofMedicine, Universite de Sherbrooke, Sherbrooke, Québec, Canada 7MRC Epidemiology Unit,Institute of Metabolic Science, Addenbrooke’s Hospital, Cambridge, UK 8Department of Medicine,Harvard Medical School, Boston, Massachusetts, USA 9Institut Pasteur de Lille, Lille, France10Lille Nord de France University, Lille, France 11Boston University Data Coordinating Center,Boston, Massachusetts, USA 12Department of Epidemiology, University of Michigan, Ann Arbor,Michigan, USA 13Oxford Centre for Diabetes, Endocrinology and Metabolism, University ofOxford, Oxford, UK 14Wellcome Trust Centre for Human Genetics, University of Oxford, Oxford,UK 15Department of Epidemiology, Erasmus MC, Rotterdam, The Netherlands 16GeneticEpidemiology and Biostatistics Platform, Ontario Institute for Cancer Research. Toronto, Canada17Prosserman Centre for Health Research, Samuel Lunenfeld Research Institute, Toronto,Canada 18Netherlands Twin Register, Department of Biological Psychology, VU University,Amsterdam, The Netherlands 19Department of Medical Epidemiology and Biostatistics, KarolinskaInstitutet, Stockholm, Sweden 20Department of Biostatistics and Center for Statistical Genetics,University of Michigan School of Public Health, Ann Arbor, Michigan, USA 21ClinicalPharmacology and The Genome Centre, William Harvey Research Institute, Barts and TheLondon School of Medicine and Dentistry, Queen Mary University of London, London, UK22Wellcome Trust Sanger Institute, Wellcome Trust Genome Campus, Hixton, Cambridge, UK23Department of Clinical Sciences, Diabetes and Endocrinology, Lund University, Malmö, Sweden24Lund University Diabetes Centre, Malmö, Sweden 25Institute of Behavioural Sciences,University of Helsinki, Helsinki, Finland 26Department of Epidemiology and Prevention, Division ofPublic Health Sciences, Wake Forest School of Medicine, Winston-Salem, North Carolina, USA27Spanish Biomedical Research Centre in Diabetes and Associated Metabolic Disorders, Institutode Investigación Sanitaria del Hospital Clínico San Carlos, Madrid, Spain 28Division ofEndocrinology, Diabetes, and Nutrition, Department of Medicine, University of Maryland, Schoolof Medicine, Baltimore, Maryland, USA 29MRC Human Genetics Unit, MRC IGMM, University ofEdinburgh, Edinburgh, UK 30Genetics of Complex Traits, Peninsula College of Medicine and
Manning et al. Page 2
Nat Genet. Author manuscript; available in PMC 2013 April 01.
NIH
-PA Author Manuscript
NIH
-PA Author Manuscript
NIH
-PA Author Manuscript
Dentistry, University of Exeter, Exeter, UK 31Department of Twin Research and GeneticEpidemiology, King’s College London, London, UK 32Department of Preventive Medicine,Northwestern University Feinberg School of Medicine, Chicago, Illinois, USA 33Department ofChronic Disease Prevention, National Institute for Health and Welfare, Helsinki, Finland 34Instituteof Cardiovascular and Medical Sciences, University of Glasgow, UK 35Department of PublicHealth & Clinical Medicine, Genetic Epidemiology & Clinical Research Group, Umeå UniversityHospital, Umeå, Sweden 36Department of Odontology, Umeå University, Sweden37Atherosclerosis Research Unit, Department of Medicine Solna, Karolinska Institutet, Stockholm,Sweden 38Clinical Research Branch, National Institute on Aging, Baltimore, Maryland, USA39Centre for medical systems biology, Netherlands Genomics Initiative, The Hague 40NetherlandsGenomics Initiative and the Netherlands Consortium for Healthy Aging, Rotterdam, TheNetherlands 41Department of Genetics Division of Statistical Genomics, Washington UniversitySchool of Medicine, St. Louis, Missouri, USA 42Department of Health Sciences Research, MayoClinic, Rochester, Minnesota, USA 43Department of Biostatistical Sciences, Division of PublicHealth Sciences, Wake Forest School of Medicine, Winston-Salem, North Carolina, USA44Icelandic Heart Association, Kopavogur, Iceland 45University of Iceland, Reykjavik, Iceland46Institute of Biomedicine/Physiology, University of Eastern Finland, Kuopio Campus, Kuopio,Finland 47Inserm, CESP Centre for research in Epidemiology and Population Health, Villejuif,France 48University Paris Sud 11, Villejuif, France 49Geriatric Unit, Azienda Sanitaria di Firenze,Florence, Italy 50Department of Medical Genetics, University of Lausanne, Lausanne, Switzerland51Service of Medical Genetics, Centre Hospitalier Universitaire Vaudois, Lausanne, Switzerland52PathWest Laboratory Medicine of WA, J Block, QEII Medical Centre, Nedlands, Australia53School of Pathology and Laboratory Medicine, The University of Western Australia, Nedlands,Australia 54Busselton Population Medical Research Foundation, B Block, QEII Medical Centre,Nedlands, Australia 55Texas Biomedical Research Institute, San Antonio, Texas, USA56Department of Physiology & Biophysics, Keck School of Medicine of the University of SouthernCalifornia, Los Angeles, California, USA 57Department of Pharmacology, Faculty of Medicine,University of Split, Croatia 58Human Genetics Center, University of Texas Health Science Centerat Houston, Houston, Texas, USA 59Genome Technology Branch, National Human GenomeResearch Institute, Bethesda, Maryland, USA 60IFB Adiposity Diseases, University of Leipzig,Leipzig, Germany 61Pennington Biomedical Research Center, Baton Rouge, Louisiana, USA62University College London, Department of Epidemiology & Public Health, London, UK 63Centrefor Population Health Sciences, University of Edinburgh, Edinburgh, UK 64Laboratory of ClinicalInvestigation, National Institute of Aging, Baltimore, Maryland, USA 65Clinical Trial Service Unit,University of Oxford, Oxford, UK 66Genome Technology Branch, National Human GenomeResearch Institute, National Institutes of Health, Bethesda, Maryland, USA 67Department ofBiostatistics, University of North Carolina Gillings School of Global Public Health, Chapel Hill,North Carolina, USA 68Division of Cardiovascular Epidemiology, Institute of EnvironmentalMedicine, Karolinska Institutet, Stockholm, Sweden 69Department of Nutrition - Dietetics,Harokopio University, Athens, Greece 70Department of General Practice and Primary healthCare, University of Helsinki, Finland 71Helsinki University Central Hospital, Unit of GeneralPractice, Helsinki, Finland 72Folkhalsan Research Centre, Helsinki, Finland 73Vaasa CentralHospital, Vaasa, Finland 74National Institute for Health and Welfare, Helsinki, Finland75Longitudinal Studies Section, Clinical Research Branch, National Institute on Aging, Baltimore,Maryland, USA 76Robertson Centre for Biostatistics, University of Glasgow, UK 77National Heart,Lung, and Blood Institute’s Framingham Heart Study, Framingham, Massachusetts, USA78Division of Endocrinology, Diabetes, and Hypertension, Brigham and Women’s Hospital,Harvard Medical School, Boston, Massachusetts, USA 79Department of CardiovascularResearch, Mario Negri Institute for Pharmacological Research, Milan, Italy 80Department ofNutrition, Harvard School of Public Health, Boston, Massachusetts, USA 81Institut National de laRecherche Agronomique, Université Paris, Bobigny Cedex, France 82Genomic Medicine,
Manning et al. Page 3
Nat Genet. Author manuscript; available in PMC 2013 April 01.
NIH
-PA Author Manuscript
NIH
-PA Author Manuscript
NIH
-PA Author Manuscript
Hammersmith Hospital, Imperial College London, London, UK 83Institut National de la Santé et dela Recherche Médicale, Université Paris, Bobigny Cedex, France 84Department of Medicine,Section of Preventive Medicine and Epidemiology, BU School of Medicine, Boston,Massachusetts, USA 85Department of Epidemiology, BU School of Public Health, Boston,Massachusetts, USA 86Department of Cardiovascular Medicine and Wellcome Trust Centre forHuman Genetics, University of Oxford, Oxford, UK 87Department of Public Health & ClinicalMedicine, Nutrition Research, Umeå University, Sweden 88Intramural Research Program,Laboratory of Epidemiology, Demography, and Biometry, National Institute on Aging, Bethesda,Maryland, USA 89Centre National de Génotypage, Commissariat à L’Energie Atomique, Institutde Génomique, Evry, France 90Center for Biomedicine, European Academy Bozen/Bolzano,Bolzano, Italy - Affiliated Institute of the University of Lübeck, Lübeck, Germany 91Geneticepidemiology group, University College London, Department of Epidemiology & Public Health,London, UK 92School of Population Health, The University of Western Australia, Nedlands,Australia 93Sir Charles Gairdner Hospital Unit, School of Medicine & Pharmacology, University ofWestern Australia, Australia 94Department of Epidemiology and Biostatistics, School of PublicHealth, MRC-HPA Centre for Environment and Health, Faculty of Medicine, Imperial CollegeLondon, UK 95Institute of Health Sciences, University of Oulu, Oulu, Finland 96Biocenter Oulu,University of Oulu, Oulu, Finland 97National Institute of Health and Welfare, Oulu, Finland98Department of Cardiology C5-P, Leiden University Medical Center, Leiden, the Netherlands99Durrer Center for Cardiogenetic Research, Amsterdam, The Netherlands 100Division ofEpidemiology, Johns Hopkins School of Public Health, Baltimore, Maryland, USA 101Institute forMolecular Medicine Finland, University of Helsinki, Helsinki, Finland 102Hjelt Institute, Dept ofPublic Health, University of Helsinki, Finland 103Faculty of Medicine, Institute of Health Sciences,University of Oulu, Oulu, Finland 104Unit of General Practice, Oulu University Hospital, Oulu,Finland 105Department of Public Health, Faculty of Medicine, University of Split, Croatia106Interdisciplinary Centre for Clinical Research, University of Leipzig, Leipzig, Germany107Department of Medicine, University of Eastern Finland and Kuopio University Hospital, Kuopio,Finland 108Institute of Regional Health Services Research and Professor Odense Patient dataExplorative Network (OPEN) 109Kuopio Research Institute of Exercise Medicine, Kuopio, Finland110Department of Public Health and Caring Sciences, Uppsala University, Rudbecklaboratoriet,Uppsala, Sweden 111Cardiovascular Health Research Unit, University of Washington, Seattle,Washington, USA 112Department of Medical Sciences, University Hospital, Uppsala University,Uppsala, Sweden 113Diabetes Prevention Unit, Department of Chronic Disease Prevention,National Institute for Health and Welfare, Helsinki, Finland 114Estonian Genome Center,University of Tartu, Tartu, Estonia 115Institut National de la Santé et de la Recherche Médicale,Centre de Recherche des Cordeliers, Paris, France 116Department of Genetics, University ofNorth Carolina, Chapel Hill, North Carolina, USA 117Division of Genetics, GlaxoSmithKline,Philadelphia, Pennsylvania, USA 118Department of Epidemiology, Center for Aging andPopulation Health, University of Pittsburgh, Pittsburgh, Pennsylvania, USA 119Department ofClinical Genetics, Erasmus MC, Rotterdam, The Netherlands 120Department of Medical Genetics,University of Helsinki and Helsinki University Central Hospital, Finland 121Division ofEpidemiology and Community Health, University of Minnesota School of Public Health,Minneapolis, Minnesota, USA 122Department of Biology, Faculty of Medicine, University of Split,Croatia 123Department of Psychiatry, Leiden University Medical Center, Leiden, The Netherlands124Department of Psychiatry, University Medical Center Groningen, University of Groningen,Groningen, The Netherlands 125Department Psychiatry, EMGO Institute for Health and CareResearch and Institute for Neurosciences, VU University Medical Center, Amsterdam, TheNetherlands 126Institute for Anthropological Research, Zagreb, Croatia 127Department ofPreventive Medicine, Laval University, Quebec, Canada 128Department of Clinical Physiology andNuclear Medicine, Kuopio University Hospital, Kuopio, Finland 129Department of Biostatistics,University of Washington, Seattle, Washington, USA 130Medical Genetics Institute, Cedars-Sinai
Manning et al. Page 4
Nat Genet. Author manuscript; available in PMC 2013 April 01.
NIH
-PA Author Manuscript
NIH
-PA Author Manuscript
NIH
-PA Author Manuscript
Medical Center 131Centre for Global Health, University of Split, Croatia 132Institute of ClinicalMedicine, University of Oulu, Finland 133Finnish Diabetes Association, Tampere, Finland134Pirkanmaa Hospital District, Tampere, Finland 135Metabolic Research Laboratories, Institute ofMetabolic Science, University of Cambridge, Addenbrooke’s Hospital, Cambridge, UK 136Centerfor Human Genetic Research, Massachusetts General Hospital, Boston, Massachusetts, USA137Department of Medicine, Division Prevention and Care of Diabetes, University of Dresden,Dresden, Germany 138Leibniz Institute for Arteriosclerosis Research, University of Munster,Germany 139Geriatric Research and Education Clinical Center, Veterans Administration MedicalCenter, Baltimore, Maryland, USA 140Department of Internal Medicine, Erasmus MC, Rotterdam,The Netherlands 141Department of Medicine, University of Washington, Seattle, Washington, USA142Department of Epidemiology, University of Washington, Seattle, Washington, USA143Department of Psychiatry, Neuroscience Campus Amsterdam, VU University Medical Centre,Amsterdam, The Netherlands 144Group Health Research Institute, Group Health Cooperative,Seattle, Washington, USA 145Seattle Epidemiologic Research and Information Center, VeteransAffairs Office of Research and Development, Seattle, WA, USA 146Department of Medicine,University of Leipzig, Division of Endocrinology and Diabetes, Leipzig, Germany 147Department ofEpidemiology, Emory University, Atlanta, Georgia, US 148Diabetes Prevention Unit, NationalInstitute for Health and Welfare, Helsinki, Finland 149South Ostrobothnia Central Hospital,Seinäjoki, Finland 150Hospital Universitario La Paz, Madrid, Spain 151Centre for VascularPrevention, Danube-University Krems, Krems, Austria 152Institute of Public Health and ClinicalNutrition, University of Easten Finland, Kuopio, Finland 153Research Unit, Kuopio UniversityHospital, Kuopio, Finland 154Department of Food Science and Nutrition, Laval University, Quebec,Canada 155Department of Internal Medicine, Centre Hospitalier Universitaire Vaudois, Lausanne,Switzerland 156Metabolic Disease Group, Wellcome Trust Sanger Institute, Hinxton, UK157Institute for Molecular Medicine Finland, University of Helsinki, Finland 158Department ofmedical statistics, epidemiology and medical informatics, University of Zagreb, Zagreb, Croatia160Oxford NIHR Biomedical Research Centre, Churchill Hospital, Oxford, UK 161University ofCambridge, Metabolic Research Laboratories, Institute of Metabolic Science, Addenbrooke’sHospital, Cambridge, UK 162Department of Preventive Medicine, Keck School of Medicine of theUniversity of Southern California, Los Angeles, California, USA 163Diabetes Research Center,Diabetes Unit, Massachusetts General Hospital, Boston, Massachusetts, USA
AbstractRecent genome-wide association studies have described many loci implicated in type 2 diabetes(T2D) pathophysiology and beta-cell dysfunction, but contributed little to our understanding of thegenetic basis of insulin resistance. We hypothesized that genes implicated in insulin resistancepathways may be uncovered by accounting for differences in body mass index (BMI) andpotential interaction between BMI and genetic variants. We applied a novel joint meta-analyticalapproach to test associations with fasting insulin (FI) and glucose (FG) on a genome-wide scale.We present six previously unknown FI loci at P<5×10⁻⁸ in combined discovery and follow-upanalyses of 52 studies comprising up to 96,496non-diabetic individuals. Risk variants wereassociated with higher triglyceride and lower HDL cholesterol levels, suggestive of a role for theseFI loci in insulin resistance pathways. The localization of these additional loci will aid furthercharacterization of the role of insulin resistance in T2D pathophysiology.
IntroductionIn contrast to the recent progress in the discovery of genetic variants underlying type 2diabetes (T2D) pathophysiology and beta-cell function, our understanding of the geneticbasis of insulin resistance remains limited1. Partly because early case-control studies of T2D
Manning et al. Page 5
Nat Genet. Author manuscript; available in PMC 2013 April 01.
NIH
-PA Author Manuscript
NIH
-PA Author Manuscript
NIH
-PA Author Manuscript
were designed to maximize the likelihood of detecting variants increasing T2D risk directlyrather than through mediation of adiposity, most of the associated loci discovered in thesestudies uncovered genes related to beta cell dysfunction2. More recently, we have shownthat the genetic architecture of quantitative indices of beta-cell function and of insulinresistance differs markedly: given the same individuals, sample sizes and biochemicalmeasurements, we described a larger number of signals for beta cell function than for insulinresistance3,4. While this observation is consistent with the higher reported heritability ofinsulin secretion compared to resistance, overall heritability estimates of insulin resistance inindividuals of European ancestry of 25%–44% suggest that many loci remain to bediscovered and that novel strategies are required for their localization5.
Obesity is an important determinant of insulin resistance6. It was postulated that adipositymight modulate the genetic determinants of insulin resistance and contribute to theheterogeneity of T2D etiology. Wang et al. demonstrated that heritability of insulinresistance increases with higher body mass index (BMI)7, while some candidate gene studieshave observed that genetic effect size varies with adiposity level8–10: findings compatiblewith the presence of underlying interaction between BMI and genetic variants for insulinresistance. Furthermore, hormones, adipokines and proinflammatory cytokines produced byadipose tissue can influence insulin signaling via diverse mechanisms11,12, which mayinteract with genetic variants influencing insulin resistance pathways. Therefore, to localizevariants associated with insulin resistance it may also be important to account for genevariant by BMI interaction, which would allow for the potential of adiposity levels toperturb the physiological milieu in which genetic variants in insulin signaling pathwaysoperate. Adiposity may also hinder the localization of genetic variants influencing insulinresistance by introducing extra variance in the outcome that is not attributable to geneticvariation5, suggesting that adjustment for adiposity per se may be necessary.
Kraft et al. proposed a joint test that investigates the association between an outcome and agenetic variant, while allowing for possible effect modification by an environmentalvariable13. Manning et al. developed a statistical method that extends this joint test to ameta-analysis context14. This enabled us to simultaneously test both the genetic main effect,adjusted for BMI, and potential interaction between each genetic variant and BMI. This jointmeta-analysis (JMA) approach can provide increased power for detecting the genetic lociwhen underlying interaction effects are suspected but unknown13 and importantly, asdemonstrated in simulation studies, does not lose power to detect genetic main effects in theabsence of interaction14. Within the Meta-Analyses of Glucose- and Insulin-related traitsConsortium (MAGIC), we implemented this approach and performed a genome-wide JMAto search for SNPs significantly associated with glycemic traits while simultaneouslyadjusting for BMI and allowing for interaction with BMI. Using this method, wesuccessfully identify loci that are associated with fasting insulin at genome-wide levels ofsignificance.
ResultsAs a first phase, we conducted discovery genome-wide JMA of SNP main effects and SNPby BMI (SNP×BMI) interaction for four diabetes-related quantitative traits: fasting insulin,fasting glucose, and surrogate measures of beta-cell function (HOMA-B) and insulinresistance (HOMA-IR)15; fasting insulin, HOMA-B and HOMA-IR were log transformed.
The fasting insulin discovery-stage JMA of approximately 2.4 million SNPs in 51,750 non-diabetic individuals from 29 studies (Supplementary Table 1) showed previously reportedassociations of variants in IGF1 and GCKR with fasting insulin at genome-wide significance(Figure 1a, Supplementary Table 2), and revealed 31 previously unreported loci tentatively
Manning et al. Page 6
Nat Genet. Author manuscript; available in PMC 2013 April 01.
NIH
-PA Author Manuscript
NIH
-PA Author Manuscript
NIH
-PA Author Manuscript
associated (P<10−5) with fasting insulin (Figure 1a, Supplementary Table 3a;Supplementary Figure 1)3. The fasting glucose discovery JMA in 58,074 individuals showedassociation of 16 loci previously described in MAGIC meta-analyses of fasting glucose(Figure 1b, Supplementary Table 2; Supplementary Figure 1), and revealed 20 previouslyunreported loci tentatively associated with fasting glucose (P<10−5) (Figure 1b,Supplementary Table 3b). The JMA approach revealed an excess of previously undetectedsignals relative to the number expected by chance (Supplementary Figure 1). The SNPs thatshowed association P<10−5 in the discovery JMA for HOMA-IR and HOMA-B largelyoverlapped with those localized for fasting insulin and fasting glucose, without describingadditional loci. We therefore focused all subsequent analyses on fasting insulin and fastingglucose. Results for associations with HOMA-IR and HOMA-B are available inSupplementary Table 4.
At each locus that reached P<10−5 in the discovery JMA, an index SNP was chosen torepresent the association signal in the genomic region. A total of 50 SNPs (30 SNPsassociated with fasting insulin, 19 SNPs associated with fasting glucose, and 1 SNPassociated with both) were taken forward to the second phase follow-up analysis. Thefollow-up analysis included 23 studies with fasting glucose data, 22 of which also hadmeasurements of fasting insulin, and comprised up to 38,422 and 33,823 individuals forfasting glucose and fasting insulin, respectively (Supplementary Table 1). We combinedstudy-specific results from both the discovery (phase 1) and the follow-up (phase 2) studiesfor the 50 index SNPs (Supplementary Table 3), for total sample sizes of 96,496 for fastingglucose and 85,573for fasting insulin. In the combined JMA, we describe six loci associatedwith fasting insulin and seven loci associated with fasting glucose at genome-wide levels ofsignificance (P<5×10⁻⁸), including PPP1R3B, which was associated with both fastinginsulin and fasting glucose (Table 1; Figure 1; Supplementary Table 3). Descriptions ofinteresting genes around each association signal appear in Box 1 and Box 2 and to facilitatediscussion of the quantitative trait loci, gene names are used as labels in the text, tables andfigures.
BOX 1
Genes of biological interest within 500kb of Fasting Insulin index SNPs
COBLL1-GRB14
The index SNP (rs7607980) identifies a missense mutation that induces a change inamino acid (N [Asn] ®D [Asp]) in position 939 of cordon-bleu protein-like 1, encodedby COBBL1. Cordon-bleu is a protein involved in neural tube development31. The FI-raising allele at the index SNP was associated with higher expression of COBLL1 (P =0.02) in skeletal muscle in the Malmo Exercise Study (personal communication, O.Hansson). A SNP at this locus (rs10195252) is associated with waist-hip-ratio17 but is inlow LD with the index SNP (r2=0.148). GRB14 encodes growth factor receptor-boundprotein 14, which inhibits signaling of the insulin receptor(OMIM number: 601524) 32.In addition to being associated with triglyceride levels33, rs10195252 is reported to havea cis acting association with transcript level of GRB14 in omental fat (p= 1.0×10⁻¹³)18.
IRS1
IRS1 encodes insulin receptor substrate 1, a critical docking protein in the insulinsignaling cascade, which, when phosphorylated by the insulin receptor, activatesdownstream signaling pathways34. SNPs in or near IRS1 are associated with T2D,HOMA-IR, FI and CAD3,35,36 but have not previously been shown to be associated withFI at the genome-wide level of significance. The index SNP reported here (rs2943634) isthe same intergenic SNP associated with CAD36 and is in LD with the nearby insulin
Manning et al. Page 7
Nat Genet. Author manuscript; available in PMC 2013 April 01.
NIH
-PA Author Manuscript
NIH
-PA Author Manuscript
NIH
-PA Author Manuscript
resistance and T2D SNP rs29436413 (r2 = 0.782) and T2D SNP rs75783264 (r2=0.815).The variant identified by the lipid GWAS (rs2972146; associated with both TG andHDL) is also reported to have a cis acting association with transcript level of IRS1 inomental adipose tissue (p =2.0 × 10⁻⁸)17 and this SNP is in strong LD with the indexSNP (r2=0.751). Furthermore, the index SNP (rs2943634) is in moderate LD (r2=0.438)with three SNPs (rs1849878, rs2673148, rs2713547) that tag a known CNV(CNVR1152.1) (r2= 0.51, 0.52, 0.51, respectively).
PPP1R3B-TNKS
This locus is associated with both FI and FG in the present study. PPP1R3B encodesprotein phosphatase 1 regulatory (inhibitor) subunit 3B, which prevents glycogenbreakdown by regulating the interaction of phosphorylase protein 1 (PP1) with glycogenmetabolism enzymes (OMIM number: 610541)32. Two SNPs in/near PPP1R3B are alsoassociated with lipids (rs998728918 and rs212625937) and C-reactive protein(rs998728921) and these are both in strong LD with the index SNP [r2 = 1.0 (rs9987289)and r2= 0.803 (rs2126259), respectively]. SNP rs9987289 is also reported to have a cisacting association with transcript level of PPP1R3B in human liver (p = 1 × 10⁻¹⁴)18. Inthe present study, we observed that SNP rs19334, associated with expression ofPPP1R3B (p= 2.34 × 10⁻¹²) in the liver eQTL dataset38, is in low LD with the index SNP(r2= 0.001) but showed moderate association with fasting insulin in the discovery sample(p = 2.87 × 10⁻⁴). TNKS encodes TRF1-interacting, ankyrin-related ADP-ribosepolymerase which interacts with TRF1 (telomeric repeat binding factor 1) to regulatetelomere length39 and also interacts with insulin-responsive amino peptidase (IRAP) inGLUT4 vesicles (OMIM number: 603303)40. Tankyrases are also thought be involved inthe wnt signaling pathway41.
PEPD-CEBPA-KCTD15
PEPD encodes peptidase D, an enzyme responsible for the recycling of proline and likelyessential for collagen production (OMIM number: 613230)42. A SNP in PEPD(rs731839) is associated with adiponectin levels (personal communication, B. Richards)and is in strong LD with the index SNP (r2 = 0.77). The index SNP is associated withPEPD expression in the adipocyte eQTL dataset (p =9.96 × 10⁻¹⁰)43, but most likely thisassociation is driven by the association between rs17226118 and PEPD expression (p=2.2 × 10−55) despite the weak LD between the index SNP and rs17226118 (r2=0.145).CEBPA encodes CCAAT/enhancer binding protein (C/EBP), alpha, which may controlthe expression of leptin, an adipokine implicated in weight regulation (OMIN number:116897)44. KCTD15 encodes potassium channel tetramerisation domain containing 15. ASNP in/near this gene (rs29941) is associated with BMI16, but is in very low LD with theindex SNP (r2=0.015).
UHRF1BP1-PPARD
UHRF1BP1 encodes Ubiquitin-like containing PHD and RING finger domains 1(UHRF1)-binding protein 1. UHRF1 is a protein necessary for DNA methylation (OMIMnumber: 607990)45. The index SNP in UHRF1BP1 (rs4646949) is in strong LD(r2=0.724) with a SNP (rs2293242) that causes a nonsense change in ANKS1A. Thesame index SNP is in moderate LD (r2 = 0.363) with a coding SNP that results in amissense change (M1098T) in UHRF1BP1 that is considered damaging based onanalysis of homologous sequences46 (Supplementary Table 6). Index SNP rs4646949 inUHRF1BP1 is in strong LD (r2 = 0.95) with two perfect proxies (rs2477508 andrs2814922) for a known CNV (CNVR2857.1). A liver tissue eQTL dataset revealed thatSNP rs12173920 is associated with UHRF1BP1 and STEAP4 (six transmembraneepithelial antigen of prostate 4) expression levels (P=9.56×10⁻⁶ and P= 2.91×10⁻⁸,
Manning et al. Page 8
Nat Genet. Author manuscript; available in PMC 2013 April 01.
NIH
-PA Author Manuscript
NIH
-PA Author Manuscript
NIH
-PA Author Manuscript
respectively) and is in moderate LD (r2= 0.334) with the index SNP38. Another SNP inthe region, rs2814944, is associated with HDL levels and is reported to have a cis actingassociation with transcript level of UHRF1BP1 in both omental (p =3.0 × 10⁻²⁵) andsubcutaneous (p=2.0 × 10⁻¹⁸) adipose tissues18. PPARD encodes peroxisomeproliferator-activated receptor-delta, a protein involved in the breakdown of fat(OMIMnumber: 600409)47.
PDGFC-GLRB
PDGFC encodes platelet derived growth factor C, a ligand that binds to specific PDGFreceptors (alphaalpha and alphabeta) and has a growth factor domain homologous toVEGF (OMIM number: 608452)48. Tyrosine phosphorylation is activated by the bindingof these growth factors to receptors. GLRB encodes glycine receptor, beta, a subunit ofglycine receptors (neurotransmitter-gated ion channels) likely involved in glycinereceptor structure (OMIM number: 138492)49.
LYPLAL1- SLC30A10
LYPLAL1 encodes lysophospholipase-like 1, a protein that may be involved in adiposityand fat distribution17,50−52. A SNP near LYPLAL1 (rs4846567) is associated with waist-hip-ratio and is in strong LD with the index SNP (r2= 0.796). Furthermore, a variant inthis vicinity (rs3001032) is associated with adiponectin levels (personal communication,B. Richards) and is in strong LD with the index SNP (r2=0.828). SLC30A10 encodessolute carrier family 30, member 10 of the zinc transporter subfamily of cation-diffusionfacilitators that allows for the outward flow of zinc from cells (OMIM number:611146)53.
BOX 2
Genes of biological interest within 500kb of Fasting Glucose index SNPs
PCSK1
PCSK1 encodes proprotein convertase, subtilisin/kexin-type, 1. This protein initiatesproinsulin processing to insulin. The expression of this protein is regulated by glucose(OMIM number: 162150)54. The nonsynonymous variant rs6232, which encodes N221D,and rs6234-rs6235, a pair of variants that encode Q665E-S690T, have been shown to beassociated with obesity in children and adults55. The index SNP is in strong LD withrs6234 (r2 =0.814). A report from MAGIC demonstrated that rs6235 in PCSK1 isassociated with proinsulin levels at a genome-wide level of significance29.
OR4S1-PTPRJ
OR4S1 encodes olfactory receptor, family 4, subfamily S, member 1. These receptors setoff neuronal responses for smell perception. PTPRJ encodes protein tyrosinephosphatase (PTP), receptor type, J. By hindering phosphorylation, this protein is thoughtto inhibit T cell receptor signaling.
ARAP1-INPPL1-STARD10
A SNP in this region, rs1552224 is associated with T2D4 and is in perfect LD with theindex SNP (r2 =1.0). The genetic variant associated with increased risk of T2D is alsoassociated with lower fasting proinsulin (adjusted for insulin levels) suggesting that thevariant might cause a defect in the early steps of insulin production29. ARAP1 encodesankyrin repeat, and pleckstrin homology domains-containing protein 1 that controlsARF-, RHO-, and CDC42-dependent cell functions56. INPPL1 encodes inositolpolyphosphate phosphatase like−1. In vivo mouse studies indicate that this protein is a
Manning et al. Page 9
Nat Genet. Author manuscript; available in PMC 2013 April 01.
NIH
-PA Author Manuscript
NIH
-PA Author Manuscript
NIH
-PA Author Manuscript
negative regulator of insulin signaling and sensitivity (OMIM number: 600829)57.STARD10 encodes StAR-related lipid transfer (START) domain containing 10, a proteinthought to be involved in sperm cell maturation but highly expressed in liver andpancreas tissues58 (NF Expression Atlas 2 Data from U133A and GNF1H Chips). Levelsof STARD10 expression are stronger in pancreatic and islet tissue than in any otherhuman tissue type29.
FOXA2
FOXA2 encodes forkhead box A2, a DNA-binding protein which regulates theexpression of key genes active in glucose sensing in beta cells (OMIM number: 600288).When FOXA2 was continually activated in mice, this led to increases in neuronal MCHand orexin expression, insulin sensitivity, food consumption and metabolism59. It haspreviously been suggested that mutations in FOXA2 may affect glucose homeostasis79.
GRB10
GRB10 encodes growth factor receptor-bound protein 10 (OMIM number: 601523). Thisprotein forms a complex with insulin receptors and inhibits their signaling60. This proteinalso interacts with GIGYFs (Grb10 interacting GYF proteins) to regulate insulin-likegrowth factor receptor 1 signaling61. The risk allele at rs2237457 showed an associationwith T2D (P=1.1×10⁻⁵) and glucose excursion during OGTT (P=0.001) in the Old OrderAmish Study19.
DPYSL5-KHK-PPM1G
DPYSL5 encodes dihydropyrimidinase-like 5 and is thought to be involved in directingneuronal growth cones in development(OMIM number 608383). KHK encodesketohexokinase and is the first enzyme acting in the breakdown of fructose(OMIMnumber: 229800). PPM1G encodes protein phosphatase, magnesium-dependent, 1 whichcarries out a dephosphorylation event essential for forming the spliceosome (OMIMnumber: 605119)62. There is moderate LD (r2 = 0.404) between the index SNP inDPYSL5 (rs1371614) and a SNP (rs2384572) that causes a missense change (I116I orI20I [depending on transcript]) in CGREF1 (cell growth regulator with EF-hand domain1) that is considered damaging based on analysis of homologous and orthologoussequences46 (Supplementary Table 6).
PDX1
PDX1 encodes pancreatic and duodenal homeobox 1 and is responsible for thedevelopment of the pancreas, determining maturation and differentiation of commonpancreatic precursor cells (OMIM number: 600733). As pancreatic morphogenesisproceeds, PDX1 action is eventually restricted to beta and delta cells of the islets, whereit appears to regulate expression of the insulin and somatostatin genes, respectively. Adeletion (FS123TER) and missense changes (Glu164Asp, Glu178Lys) in PDX1 areassociated with pancreas agenesis63. While the deletion FS123TER causes pancreasagenesis in homozygotes, heterozygosity is associated with MODY464. The variantGlu224Lys (E224K) was also shown to cause MODY465. Other variants were suspectedin increased risk of T2D in some family studies.
PPP1R3B/TNKS
see summary in Box 1
As the JMA simultaneously tests both genetic main effects and interaction effects, in orderto further characterize the association signals observed using the JMA, we performedadditional analyses to examine main effects and interaction effects separately. These
Manning et al. Page 10
Nat Genet. Author manuscript; available in PMC 2013 April 01.
NIH
-PA Author Manuscript
NIH
-PA Author Manuscript
NIH
-PA Author Manuscript
additional analyses included meta-analyzed regression models of main effects, with andwithout adjustment for BMI, univariate meta-analysis of interaction effects using continuousBMI, and SNP main effects meta-analyses in strata defined by a BMI cut-off of 28 kg/m2,chosen based on the median BMI of the largest cohorts included in our discovery stage JMA(BMI strata are categorized as “leaner” where BMI < 28 kg/m2 and “heavier” where BMI ≥28 kg/m2).
Associations with fasting insulinThe follow-up loci associated with fasting insulin (natural log transformed) at genome-widelevels of significance in the combined JMA are presented in Table 1 and described in Box 1.SNP rs7607980 located near COBLL1-GRB14 provided the strongest signal for fastinginsulin, with a JMA P value of 4.3×10⁻²⁰. Analyses performed to characterize thisassociation further revealed that the significant association of rs7607980 with fasting insulinwas driven primarily by a BMI-adjusted genetic main effect (P = 1.7×10⁻¹⁶), and showedsome suggestion of interaction with BMI (P for interaction = 1.6×10⁻⁴; Figure 2;Supplementary Table 3a). Modeled from the combined JMA, the estimated effect size of thegenetic variant was greater at a BMI of 30 kg/m2 (JMA β=0.039) compared a BMI of 25 kg/m2 (JMA β=0.023; Table 1). These estimates were supported by BMI-stratified analyses: thegenetic effect was larger in heavier (main genetic effect β=0.041, P=2.98×10⁻¹⁰) than inleaner individuals (main genetic effect β= 0.018, P=1.77×10⁻⁵; P value for differencebetween strata = 0.02; Figure 2).
In addition to COBLL1-GRB14, the combined JMA showed five loci to be associated withfasting insulin (IRS1, PPP1R3B, PDGFC, LYPLAL1, UHRF1BP1) at genome-widesignificance levels (Table 1; Supplementary Figure 2). For these loci, the additional modelsto characterize the association demonstrated that the JMA association signals were largelydriven by their main genetic effects, adjusted for BMI (P < 5.5×10⁻⁹), and showed littleevidence of interaction (P > 0.02; Supplementary Table 3a). Additionally, the combinedJMA at the PEPD locus showed evidence suggestive of association, albeit just below theconventional significance threshold (P=8.69×10⁻⁸). The results of the JMA and theadditional meta-analyses for all loci included in the follow-up (phase 2) are presented inSupplementary Table 3a.
As we were interested in identifying loci associated with insulin resistance, we investigatedassociations between genome-wide significant variants and other traits related to insulinresistance in genome-wide meta-analysis results provided by other consortia: the DiabetesGenetics Replication And Meta-analysis Consortium (DIAGRAM)4, the GenomewideInvestigation of ANThropometric measures (GIANT)16,17 consortium, and the Global LipidGenetic Consortium (GLGC)18 (Table 2). At five out of six loci associated with fastinginsulin, the insulin-raising allele was associated with both lower HDL cholesterol and highertriglycerides – a dyslipidemic profile typical of insulin resistance. The insulin-raising allelesnear COBLL1-GRB14, LYPLAL1 and PPP1R3B were also associated with a greater waist-hip ratio (WHR adjusted for BMI). Individuals carrying insulin-raising alleles at the indexSNP in or near COBLL1-GRB14, LYPLAL1, IRS1 or PDGFC were at increased risk ofT2D, albeit with relatively small odds ratios (Table 2).
Associations with fasting glucoseGenetic variants associated with fasting glucose at genome-wide significance in thecombined JMA are presented in Table 1 and described in Box 2: index SNPs were in or nearARAP1, PCSK1, FOXA2, DPYSL5, OR4S1, PDX1, and PPP1R3B. The combined JMAresults for the index SNP near GRB10 demonstrated a suggestive association with fastingglucose, but the P value did not reach genome-wide significance (P=8.3×10⁻⁸).
Manning et al. Page 11
Nat Genet. Author manuscript; available in PMC 2013 April 01.
NIH
-PA Author Manuscript
NIH
-PA Author Manuscript
NIH
-PA Author Manuscript
Interestingly, a SNP in GRB10 (rs2237457) was previously found to be associated with T2D(P=1.1×10⁻⁵) in the Old Order Amish19.
Additional characterization analyses revealed that genetic main effects were the maincontributors to these associations (P<3.6×10⁻⁸) (Supplementary Table 3b), with littleevidence observed for interaction at these loci (P values for interaction>0.06). The combinedresults of the JMA and the additional meta-analyses for all loci included in the follow-up(phase 2) are presented in Supplementary Table 3b.
In contrast to associations observed at fasting insulin loci, fasting glucose index SNPs didnot show compelling associations with insulin resistance related metabolic traits (Table 2),but fasting glucose-raising alleles near PCSK1 and PPP1R3B showed nominal associationswith lower 2-hour glucose levels; see Supplementary Table 4.
Functional exploration, the results of expression and eQTL lookups, and conditionalanalyses based on available databases are presented in the Supplementary Note.
DiscussionOur study demonstrates that insulin resistance loci exist and can be localized whenappropriate analysis methods are used to control for the influence of adiposity on insulinresistance. In a discovery dataset that was approximately 35% larger than our previous meta-analysis, we describe six loci not previously known to be associated with fasting insulin,adding substantially to the two loci that were observed using standard association analyseswithout adjustment for BMI. We also describe seven additional loci associated with fastingglucose. In addition, we detected all previously reported associations for fasting glucose (16loci) and insulin (2 loci) (Supplementary Table 2)3. With the initial explosion in the numberof loci found to be associated with T2D1, we expected to discover similar numbers of lociimplicated in insulin resistance and insulin secretion, which has not been the case until now.Our approach was successful at revealing loci implicated in insulin resistance in numbersproportional to those implicated in insulin secretion. Our results underline the importance oftaking adiposity into account to understand the heterogeneity of T2D etiology.
The association of fasting insulin with the genetic variant located at the COBLL1-GRB14locus is of particular interest, based on its concomitant and directionally consistentassociation with insulin resistance-related traits and its plausible mechanism of action.GRB14 is a tissue-specific negative regulator of insulin receptor signaling (see also Box 1).The risk allele at the index SNP rs7607980 is associated with higher triglycerides and lowerHDL cholesterol levels, a dyslipidemic profile characteristic of the insulin resistant state,advocating for a putative role in insulin resistance pathways. Furthermore, this pattern ofassociation was observed for nearly all index SNPs associated with fasting insulin,increasing our confidence that our approach localized genetic loci involved in insulinresistance pathogenesis. As shown in a previous GIANT report17, risk alleles at COBLL1-GRB14 and LYPLAL1 were also associated with increased waist-hip ratio (WHR) adjustedfor BMI (Table 2), suggesting that they could be influencing the regulation of adipose tissuedistribution to induce insulin resistance. In line with plausible biological actions in adiposetissue, eQTL results in omental adipose tissue demonstrated that expression of GRB14 isassociated with SNP rs10195252 (r 2=0.17 with the index SNP rs7607980) in the reportfrom GLGC18.
Our results suggest a SNP×BMI interaction with fasting insulin at COBLL1-GRB14, with alarger genetic effect estimate in heavier individuals, compatible with the notion that somegenetic variants implicated in insulin resistance pathways are more likely to be found whenstudying genetic effects in an ‘obesogenic’ environment. Our observation supports the
Manning et al. Page 12
Nat Genet. Author manuscript; available in PMC 2013 April 01.
NIH
-PA Author Manuscript
NIH
-PA Author Manuscript
NIH
-PA Author Manuscript
analyses in the TwinsUK study reporting greater heritability estimates for insulin resistancetraits at higher levels of BMI7. Moreover, some candidate gene studies demonstrated thatgenetic variants implicated in insulin signaling pathways are more readily observable inheavier populations20. Prudente et al. proposed that higher BMI potentiates the effect ofgenetic variants on insulin resistance pathways and suggested that this effect could be due totissue specific response to the obesogenic environment5. It is currently unknown how agenetic variant could influence a different response to an obesogenic exposure withinspecific tissues – liver, muscles, adipose or even central nervous system – but our data addto the current literature by identifying one potential example and arguing for functionalstudies to pursue the hypothesis proposed by Prudente et al.5.
Among the other loci, PPP1R3B is likely to act via hepatic metabolism to influence fastinginsulin and glucose, as well as lipid profile (HDL, LDL, total cholesterol) and CRP levels21.PEPD encodes peptidase D and is likely to have a role in adipokine biology supported byeQTL data in adipose tissue (Supplementary Table 5) and an observed association withadiponectin levels (ADIPOgen consortium, B. Richards, personal communication).Adiponectin is suspected to act as an insulin sensitizer with low levels conferring T2D riskonly among individuals who are also insulin resistant22; the independent PEPD associationswith this adipokine are supportive of a direct role in insulin resistance. Additionally, othergenes located near the loci reported in Table 1 also represent plausible biologic candidates tobe involved in various processes related to insulin resistance (see Box 1).
The JMA approach has the potential to reveal genetic variants whose effects differdepending on levels of adiposity, with interactions being tested in either direction. Aspointed out previously, a search for T2D genes in leaner populations is more likely to revealgenes implicated in beta-cell function by focusing on pathophysiologic mechanismsindependent of adiposity and insulin resistance23. As a corollary of this observation, insofaras adiposity and insulin resistance have a stronger environmental component, main effectsizes for beta-cell function loci may tend to be larger in leaner individuals, although this wasequivocal in our findings (Supplementary Table 2).
There have been few previous efforts investigating SNP×BMI interaction and its impact onthe risk of T2D or related glycemic traits at a genome-wide level. Timpson et al.investigated genetic variants associated with T2D in the Wellcome Trust Case ControlConsortium by dividing the cases into strata of obese and non-obese individuals: in additionto TCF7L2 (of larger effect in non-obese cases), the only other signal they detected andreplicated was the well-known obesity-mediated FTO association with T2D in the obesestrata24. As expected, we did not detect an association between FTO and fasting insulin orglucose because the JMA approach includes an intrinsic adjustment for BMI.
Strengths and potential limitationsThe major strengths of our study are the large sample size, that all cohorts were composed ofindividuals from European descent, and importantly, that we used a validated statisticalapproach and successfully applied it at genome-wide level for the first time. Importantly, weidentify all previously described associations with fasting insulin and fasting glucose, whichhighlights the utility of the JMA approach even in the absence of underlying gene-environment interaction.
We used a two-phase analytical approach, using the conventional P<5.0×10⁻⁸ significancethreshold in combined analyses to determine genome-wide significance for the identifiedSNPs. This approach has been shown to have greater power when the size of the follow-upsample is smaller than the discovery phase25,26 and has previously been successful appliedby our group27–29 and others30. All 12 loci described in Table 1 show consistent directions
Manning et al. Page 13
Nat Genet. Author manuscript; available in PMC 2013 April 01.
NIH
-PA Author Manuscript
NIH
-PA Author Manuscript
NIH
-PA Author Manuscript
of effect in the follow-up phase. However, employing a replication strategy that declaresstatistical significance on the basis of the follow-up phase alone, only 4 of the 12 loci wouldreach conventional statistical significance accounting for multiple testing(P<0.05/51=0.00098; with significance threshold α/N1, where N1 is the number of SNPstaken forward for replication and one SNP is identified for both fasting glucose and fastinginsulin).
Only 12 significant loci were identified after the second stage, despite the fact that 50 lociwere taken forward from the discovery stage and only 2 or 3 associations at P<0.00001would be expected per trait under the hypothesis of no association. Among the reasons forthe fewer than expected significant associations is most importantly the size of the follow-upsample. To maximize sample size we took advantage of studies that offered either de novogenotyping, access to genome-wide SNP arrays or had performed genotyping on theMetabochip. While our study represents the largest effort of its kind, it should beacknowledged that the follow-up sample size is still approximately one half of the size of thediscovery sample and that false negatives may remain amongst those loci not reachinggenome-wide significance.
We used the JMA as the primary model and further characterized only those loci inadditional models that reached genome-wide significance. However, consideration of resultsfrom the follow-up stage alone showed that the interaction term at the COBBL1-GRB14locus did not reach statistical significance in additional models, although we observedconsistency in direction and effect size in phases 1 and 2.
Our main JMA model assumes a linear interaction, where the per allele effect of a SNPchanges across the continuous spectrum of BMI. If the interaction effect is nonlinear, or athreshold effect exists, in which case the association would only be present in one extremeof the BMI distribution, the interaction test with continuous BMI might not agree with thatof dichotomous BMI. This could explain the inconsistencies of the interaction results withIRS1, PCSK1 and OR4S1, where we do observe some suggestion of interactions in thestratified models not supported by models including BMI as a continuous variable.
We used the JMA approach to test for SNP main effects adjusted for BMI and to allow forinteraction between BMI and SNPs, but the results we observed might be due to one ofmany factors correlated with BMI, including lifestyle. Additionally, although we identifygenes that highlight potential new pathways to insulin resistance and T2D development, werecognize that we have not localized the associations to specific genes.
ConclusionPrevious attempts to identify loci associated with insulin resistance have been hinderedpartly by methodological limitations. In the present study, by using the newly developedJMA approach, we observed six additional loci associated with fasting insulin and otherinsulin resistance-associated traits. We used the JMA approach because we hypothesizedthat the degree of adiposity may mask, positively confound, or modify the associationbetween genetic variants and insulin resistance traits. While the associations we observedresulted mainly from adjustment for BMI, the JMA method allowed the flexibility andpower to observe these main effect-driven associations, whilst allowing us to simultaneouslytest our hypothesis of interaction. The identification of these loci offers the potential tofurther characterize the etiology and causality of T2D and the role of insulin resistance inthat process.
Manning et al. Page 14
Nat Genet. Author manuscript; available in PMC 2013 April 01.
NIH
-PA Author Manuscript
NIH
-PA Author Manuscript
NIH
-PA Author Manuscript
Online MethodsCohorts
We recruited 29 studies involved in MAGIC (Meta-Analysis of Glucose and Insulin relatedtraits Consortium) for the first phase of discovery analysis, totaling up to 58,070 individualsof European ancestry. Many of these studies were involved in the previous MAGIC effort onfasting glucose and fasting insulin3. In the second phase, follow-up included 23 cohorts withfasting glucose data and 22 cohorts with fasting insulin data, comprising up to 38,422and33,823 non-diabetic individuals of European ancestry, respectively (detailed discovery andfollow-up cohort characteristics are presented in Supplementary Table 1). We excludedindividuals with T2D on the basis of known T2D or anti-diabetic treatment, and/or a fastingglucose ≥7 mmol/L so as to remove their influence on misclassification of trait levels66.Local research ethic committees approved all studies and all participants gave informedconsent to each original study.
Phenotypes/Quantitative TraitsFasting glucose and fasting insulin were measured from whole blood, plasma or serum usingassays specific for each cohort (Supplementary Table 1). Homeostatic model assessmentindices of beta-cell function (HOMA-B) and insulin resistance (HOMA-IR) were derivedfrom fasting glucose and fasting insulin15. Fasting insulin, HOMA-B, and HOMA-IR werelog transformed for analyses. Anthropometric measurements such as body mass index (BMI,kg/m2) were obtained in each cohort following standardized procedures. Trait values werenot imputed and outliers were not excluded.
Phase 1: Discovery GenotypingAll cohorts included in the discovery phase had genome-wide arrays performed, details ofwhich are specified in Supplementary Table 1. We implemented the following qualitycontrol inclusion criteria for the SNPs in all cohorts: 1) Hardy-Weinberg equilibriumP>10−6, 2) minor allele frequency >1%, and 3) SNP call rate >95%. Imputation wasperformed using MACH67,68 (r2 >0.3) or IMPUTE69,70 (proper_info>0.3) based on theHapMap CEU population (build 36). Both genotyped and imputed SNPs were used in theanalysis, with priority given to genotyped SNPs when both were available. Consequently, upto 2.4 million SNPs (genotyped or imputed) were included in the discovery phase meta-analyses.
Phase 2: Follow-up GenotypingStudies were invited to participate in the follow-up phase of the analysis through either insilico lookups with existing genotype data or de novo genotyping. A large percentage of thefollow-up cohorts used the Illumina Cardio-Metabo Chip. Study-specific details for follow-up genotyping are described in Supplementary Table 1.
Statistical ModelsEach study submitted regression summary statistics for the meta-analyses, all of whichassumed an additive genetic effect and were adjusted for age, sex and study-level covariatesat a minimum (Supplementary Table 1). The first regression model included SNP, BMI andSNP×BMI product terms to allow for SNP×BMI interaction effects (Model 1). Thisregression model was used in the JMA, which is described below, and is considered theprimary analysis. Additional regression models were meta-analyzed, solely to characterizethe associations observed in the JMA as being driven by either SNP main effects or by SNPby BMI interactions. Main effects models estimating the effect of each SNP on thedependent variables were performed, both with (Model 2) and without (Model 3) adjustment
Manning et al. Page 15
Nat Genet. Author manuscript; available in PMC 2013 April 01.
NIH
-PA Author Manuscript
NIH
-PA Author Manuscript
NIH
-PA Author Manuscript
for BMI. Additionally, the continuous BMI measure was dichotomized at 28 kg/m2; this cut-off was chosen based on the median BMI in of the largest cohorts included in our discoveryanalysis. An interaction model using the dichotomized BMI was fit (Model 4) and stratifiedmodels were used to obtain stratum specific estimates in leaner (BMI <28 kg/m2, Model 5)and heavier individuals (BMI ≥28 kg/m2, Model 6). For Models 1 and 4, both the SNP andSNP×BMI regression coefficients and their covariance matrix were reported by each studyand robust variance estimates were used to correct the observed inflation of the falsepositive rate observed for the interaction P-value71.
In phase 1, models 1, 2 and 3 were performed genome-wide, while models 4, 5 and 6 wereperformed on SNPs with discovery JMA P values less than 10−5. For phase 2, models 1–6were performed using SNPs taken forward to the follow-up. Regression statistics wereobtained with R, SAS, Quicktest (http://toby.freeshell.org/software/quicktest.shtml) orProbABEL72 (Supplementary Table 1).
The models were fit as:
Model 1. Y = β0 + βC × Cov + βSNP × SNP + βBMI × BMI + βSNP×BMI × SNP×BMI +ε. (BMI as continuous variable)
Model 2. Y = β0 + βC × Cov + βSNP × SNP + ε.
Model 3. Y = β0 + βC × Cov + βSNP × SNP + βBMI × BMI + ε.
Model 4. Y = β0 + βC × Cov + βSNP × SNP + βBMI-di × BMI + βSNP×BMI-di ×SNP×BMI + ε. (BMI as a dichotomous variable)
Model 5. Y = β0 + βC × Cov + βSNP × SNP + ε. (in individuals of BMI < 28)
Model 6. Y = β0 + βC × Cov + βSNP × SNP + ε. (in individuals of BMI ≥ 28)
Phase 1 and 2 Meta-analysesOur objective was to identify genetic loci associated with fasting insulin, as a surrogate forinsulin resistance, which may be masked by variation in, or interaction with, BMI. In theprimary analysis we performed a joint meta-analysis (JMA) of both the SNP effect and theSNP×BMI interaction effect from Model 1, using a recently developed method14. The JMAis an effective screening tool when the underlying interaction model is unknown and,importantly, retains power when there is no interaction effect. The JMA provides estimatesof βSNP and βSNP×BMI and allows for a 2 degree of freedom joint test of the null hypothesisH0: βSNP =βSNP×BMI =0, as well as a test of heterogeneity of regression coefficients.Additionally, the JMA detects association in the presence of either a significant SNP effect,adjusted for BMI, or a SNP×BMI interaction effect. We implemented the JMA method inMETAL (v. 2010-02-08 http://www.sph.umich.edu/csg/abecasis/Metal/ with patch providedby Manning et al.14). SNPs that reached a discovery threshold in the JMA of P<10−5 withPheterogeneity >0.001 and were available in at least one third of the total sample size weretaken forward to follow-up analyses. In order to characterize the association signalsobserved in the JMA, additional meta-analyses were performed that examined main effectsand interaction effects separately. The inverse-variance weighted meta-analyses73 approachand heterogeneity test74 were used in the univariate meta-analyses of the SNP main effectsin Models 2, 3, 5 and 6 and the SNP×BMI interaction effect from models 1 and 4.
In each genomic region identified from the JMA, the index SNP was chosen as the SNP withthe strongest association (lowest P value) unless the region contained a SNP known to beassociated with a metabolic condition or trait (and with P<10−5), in which case the latterSNP was selected. In case a follow-up cohort was not able to provide results for an indexSNP, several proxy SNPs were chosen using LD information from HapMap (http://
Manning et al. Page 16
Nat Genet. Author manuscript; available in PMC 2013 April 01.
NIH
-PA Author Manuscript
NIH
-PA Author Manuscript
NIH
-PA Author Manuscript
hapmap.ncbi.nlm.nih.gov) and the 1000 Genomes project75. SNPs identified by the JMA,but which had previously reported associations with diabetes and/or diabetes-relatedquantitative traits in MAGIC were not selected for follow-up and are reported inSupplementary Table 2.
Models 1–6 were performed within each follow-up study and the SNPs were meta-analyzedwithin the follow-up cohorts and in a combined meta-analysis with the discovery cohortsusing the methods detailed above. Meta-analyses were performed with proxy SNPs if theindex SNP was not available. A SNP was considered significant if the JMA in the combinedsample yielded a P value less than 5×10⁻⁸. Effect estimates described in the results anddisplayed in Supplementary Table 3 were obtained from a combined meta-analysis thatexcluded proxy SNPs.
Two of the index SNPs (near CHL1 and TUBA3C) showed significant associations in thediscovery JMA. We excluded these loci from the combined analysis because we observedlow heterogeneity P values and because neither the main effects nor interaction modelssupported the associations observed in the JMA at these loci.
Conditional AnalysesWe conducted conditional analyses for index SNPs that were within approximately 1 Mb ofestablished SNPs (known associations with T2D or glycemic traits). We conditioned on theestablished SNPs for a chromosome-specific analysis in the Framingham Heart Study, oneof the largest cohorts in the meta-analyses in which the associations of both the establishedSNPs and the index SNP were observed. If the SNP retained nominal significance in theconditional analysis, we considered the association signal to be not solely caused by LDwith the established SNPs. Because only one study was involved in this conditional analysis,to account for the limited power we used a significance threshold of 0.05.
Associations with related metabolic traitsAs we were interested in the effect of the index SNPs on insulin resistance-related traits,associations of each index SNP with related glycemic traits and T2D were sought usingresults from previous DIAGRAM and MAGIC meta-analyses: T2D4, 2-hour glucose27, andglycated hemoglobin28. We also performed lookups of these SNPs in publicly available datafrom previous meta-analyses of lipid quantitative traits18. Associations with BMI16 andWHR adjusted for BMI17 were also sought from published GIANT meta-analyses.
Functional ExplorationTo determine if any index SNPs were in LD with nearby functional coding variants, we usedSNPper76 (http://snpper.chip.org/) to extract all SNPs that fell within 500 kb of the indexSNP (1 Mb total). From this list we chose all coding SNPs and used SNAP (http://www.broadinstitute.org/mpg/snap/ldsearch.php) to determine if any of these coding SNPswere in LD (CEPH (Utah residents with ancestry from northern and western Europe) (CEU),1000 Genomes Project, 500 kb distance) with the index SNP. We used the online tool SIFTdbSNP (http://sift.jcvi.org/www/SIFT_dbSNP.html) to predict potential damage to theprotein.
To establish whether index SNPs are in LD with known copy number variants (CNVs), weused a database of 7,411 SNPs that tag 3,188 CNVs from the Wellcome Trust Case ControlConsortium (WTCCC)77 in addition to a list of 422 SNPs tagging 261 deletions78. Allknown SNPs in LD with these tagging SNPs were retrieved using the SNAP tool (http://www.broadinstitute.org/mpg/snap/ldsearch.php) (CEU, 1000 Genomes, within 500 kb). Wedetermined if any index SNPs are in LD with those SNPs tagging CNVs.
Manning et al. Page 17
Nat Genet. Author manuscript; available in PMC 2013 April 01.
NIH
-PA Author Manuscript
NIH
-PA Author Manuscript
NIH
-PA Author Manuscript
Expression Studies and EQTLWe searched for genes potentially implicated in glycemic regulation and insulin resistancein the region flanking 500 kb on each side of index SNPs (1 Mb total). Functions of thesegenes were investigated using online resources such as OMIM (http://www.ncbi.nlm.nih.gov/omim) or GeneCards V3 (http://www.genecards.org/).
We examined expression levels of candidate genes nearest the index SNP and within 500 kbof the index SNP using available online micro-array expression data (GNF Expression Atlas2 Data from U133A and GNF1H Chips, http://genome.ucsc.edu). Potential fasting insulincandidates were further pursued with eQTL studies in available datasets.
We queried all SNPs in the 1 Mb region surrounding the fasting insulin index SNPs to see ifthey were associated with expression levels of any genes in a liver tissue gene expressiondatabase38, which used a sample size of 427 subjects of European ancestry and where SNPswith association p-values less than 0.003 were listed. We used the SNAP tool (http://www.broadinstitute.org/mpg/snap/ldsearch.php) to determine if eQTLs were in LD withfasting insulin index SNPs. Fasting insulin index SNPs were also queried in the MuTHER(Multiple Tissue Human Expression Resource) expression database43 to determine if anywere eQTLs in subcutaneous adipose tissue (N=776). Further eQTL look-ups wereperformed searching for top eQTL findings for any SNPs located within 1 Mb of each indexSNP (P values <10−3). Data were analyzed in genABEL and probABEL72. A genome-wideFDR of 1% corresponded to a P-value threshold of 5.1×10⁻⁵ and data were corrected formultiple testing.
Supplementary MaterialRefer to Web version on PubMed Central for supplementary material.
AcknowledgmentsA full list of acknowledgments is provided in the Supplementary Note.
References1. Billings LK, Florez JC. The genetics of type 2 diabetes: what have we learned from GWAS? Ann N
Y Acad Sci. 2010; 1212:59–77. [PubMed: 21091714]
2. Sladek R, et al. A genome-wide association study identifies novel risk loci for type 2 diabetes.Nature. 2007; 445:881–885. [PubMed: 17293876]
3. Dupuis J, et al. New genetic loci implicated in fasting glucose homeostasis and their impact on type2 diabetes risk. Nature genetics. 2010; 42:105–116. [PubMed: 20081858]
4. Voight BF, et al. Twelve type 2 diabetes susceptibility loci identified through large-scale associationanalysis. Nat Genet. 2010; 42:579–89. [PubMed: 20581827]
5. Prudente S, Morini E, Trischitta V. Insulin signaling regulating genes: effect on T2DM andcardiovascular risk. Nat Rev Endocrinol. 2009; 5:682–93. [PubMed: 19924153]
6. Kahn SE, Hull RL, Utzschneider KM. Mechanisms linking obesity to insulin resistance and type 2diabetes. Nature. 2006; 444:840–846. [PubMed: 17167471]
7. Wang X, et al. Heritability of insulin sensitivity and lipid profile depend on BMI: evidence for gene-obesity interaction. Diabetologia. 2009; 52:2578–84. [PubMed: 19820914]
8. Florez JC, et al. Effects of the type 2 diabetes-associated PPARG P12A polymorphism onprogression to diabetes and response to troglitazone. The Journal of clinical endocrinology andmetabolism. 2007; 92:1502–1509. [PubMed: 17213274]
9. Ludovico O, et al. Heterogeneous effect of peroxisome proliferator-activated receptor gamma2Ala12 variant on type 2 diabetes risk. Obesity (Silver Spring, Md ). 2007; 15:1076–1081.
Manning et al. Page 18
Nat Genet. Author manuscript; available in PMC 2013 April 01.
NIH
-PA Author Manuscript
NIH
-PA Author Manuscript
NIH
-PA Author Manuscript
10. Cauchi S, et al. The genetic susceptibility to type 2 diabetes may be modulated by obesity status:implications for association studies. BMC medical genetics. 2008; 9:45. [PubMed: 18498634]
11. Trujillo ME, Scherer PE. Adipose tissue-derived factors: impact on health and disease. Endocrinereviews. 2006; 27:762–778. [PubMed: 17056740]
12. Shoelson SE, Lee J, Goldfine AB. Inflammation and insulin resistance. The Journal of clinicalinvestigation. 2006; 116:1793–1801. [PubMed: 16823477]
13. Kraft P, Yen YC, Stram DO, Morrison J, Gauderman WJ. Exploiting gene-environment interactionto detect genetic associations. Human heredity. 2007; 63:111–119. [PubMed: 17283440]
14. Manning AK, et al. Meta-analysis of gene-environment interaction: joint estimation of SNP andSNP x environment regression coefficients. Genetic epidemiology. 2011; 35:11–18. [PubMed:21181894]
15. Matthews DR, et al. Homeostasis model assessment: insulin resistance and beta-cell function fromfasting plasma glucose and insulin concentrations in man. Diabetologia. 1985; 28:412–419.[PubMed: 3899825]
16. Speliotes EK, et al. Association analyses of 249,796 individuals reveal 18 new loci associated withbody mass index. Nat Genet. 2010; 42:937–48. [PubMed: 20935630]
17. Heid IM, et al. Meta-analysis identifies 13 new loci associated with waist-hip ratio and revealssexual dimorphism in the genetic basis of fat distribution. Nat Genet. 2010; 42:949–60. [PubMed:20935629]
18. Teslovich TM, et al. Biological, clinical and population relevance of 95 loci for blood lipids.Nature. 2010; 466:707–13. [PubMed: 20686565]
19. Rampersaud E, et al. Identification of novel candidate genes for type 2 diabetes from a genome-wide association scan in the Old Order Amish: evidence for replication from diabetes-relatedquantitative traits and from independent populations. Diabetes. 2007; 56:3053–3062. [PubMed:17846126]
20. Stolerman ES, et al. Haplotype structure of the ENPP1 Gene and Nominal Association of theK121Q missense single nucleotide polymorphism with glycemic traits in the Framingham HeartStudy. Diabetes. 2008; 57:1971–1977. [PubMed: 18426862]
21. Dehghan A, et al. Meta-analysis of genome-wide association studies in >80 000 subjects identifiesmultiple loci for C-reactive protein levels. Circulation. 2011; 123:731–8. [PubMed: 21300955]
22. Hivert MF, et al. Insulin resistance influences the association of adiponectin levels with diabetesincidence in two population-based cohorts: the Cooperative Health Research in the Region ofAugsburg (KORA) S4/F4 study and the Framingham Offspring Study. Diabetologia. 2011;54:1019–1024. [PubMed: 21336532]
23. Florez JC. Newly identified loci highlight beta cell dysfunction as a key cause of type 2 diabetes:where are the insulin resistance genes? Diabetologia. 2008; 51:1100–1110. [PubMed: 18504548]
24. Timpson NJ, et al. Adiposity-related heterogeneity in patterns of type 2 diabetes susceptibilityobserved in genome-wide association data. Diabetes. 2009; 58:505–510. [PubMed: 19056611]
25. Skol AD, Scott LJ, Abecasis GR, Boehnke M. Optimal designs for two-stage genome-wideassociation studies. Genetic epidemiology. 2007; 31:776–788. [PubMed: 17549752]
26. Skol AD, Scott LJ, Abecasis GR, Boehnke M. Joint analysis is more efficient than replication-based analysis for two-stage genome-wide association studies. Nature genetics. 2006; 38:209–213.[PubMed: 16415888]
27. Saxena R, et al. Genetic variation in GIPR influences the glucose and insulin responses to an oralglucose challenge. Nature genetics. 2010; 42:142–148. [PubMed: 20081857]
28. Soranzo N, et al. Common variants at 10 genomic loci influence hemoglobin A(C) levels viaglycemic and nonglycemic pathways. Diabetes. 2010; 59:3229–3239. [PubMed: 20858683]
29. Strawbridge RJ, et al. Genome-wide association identifies nine common variants associated withfasting proinsulin levels and provides new insights into the pathophysiology of type 2 diabetes.Diabetes. 2011; 60:2624–34. [PubMed: 21873549]
30. Lango Allen H, et al. Hundreds of variants clustered in genomic loci and biological pathwaysaffect human height. Nature. 2010; 467:832–838. [PubMed: 20881960]
31. Carroll EA, et al. Cordon-bleu is a conserved gene involved in neural tube formation. Dev Biol.2003; 262:16–31. [PubMed: 14512015]
Manning et al. Page 19
Nat Genet. Author manuscript; available in PMC 2013 April 01.
NIH
-PA Author Manuscript
NIH
-PA Author Manuscript
NIH
-PA Author Manuscript
32. Depetris RS, et al. Structural basis for inhibition of the insulin receptor by the adaptor proteinGrb14. Mol Cell. 2005; 20:325–33. [PubMed: 16246733]
33. Ridker PM, et al. Polymorphism in the CETP gene region, HDL cholesterol, and risk of futuremyocardial infarction: Genomewide analysis among 18 245 initially healthy women from theWomen’s Genome Health Study. Circulation Cardiovascular genetics. 2009; 2:26–33. [PubMed:20031564]
34. White MF. The IRS-signalling system: a network of docking proteins that mediate insulin action.Mol Cell Biochem. 1998; 182:3–11. [PubMed: 9609109]
35. Rung J, et al. Genetic variant near IRS1 is associated with type 2 diabetes, insulin resistance andhyperinsulinemia. Nat Genet. 2009; 41:1110–5. [PubMed: 19734900]
36. Samani NJ, et al. Genomewide association analysis of coronary artery disease. N Engl J Med.2007; 357:443–53. [PubMed: 17634449]
37. Waterworth DM, et al. Genetic variants influencing circulating lipid levels and risk of coronaryartery disease. Arterioscler Thromb Vasc Biol. 2010; 30:2264–76. [PubMed: 20864672]
38. Schadt EE, et al. Mapping the genetic architecture of gene expression in human liver. PLoS Biol.2008; 6:e107. [PubMed: 18462017]
39. Smith S, Giriat I, Schmitt A, de Lange T. Tankyrase, a poly(ADP-ribose) polymerase at humantelomeres. Science. 1998; 282:1484–7. [PubMed: 9822378]
40. Chi NW, Lodish HF. Tankyrase is a golgi-associated mitogen-activated protein kinase substratethat interacts with IRAP in GLUT4 vesicles. J Biol Chem. 2000; 275:38437–44. [PubMed:10988299]
41. Huang SM, et al. Tankyrase inhibition stabilizes axin and antagonizes Wnt signalling. Nature.2009; 461:614–20. [PubMed: 19759537]
42. Royce, PM.; Steinmann, B. Prolidase deficiency. Wiley-Liss; New York: 2002. p. 727-738.
43. Nica AC, et al. The architecture of gene regulatory variation across multiple human tissues: theMuTHER study. PLoS Genet. 2011; 7:e1002003. [PubMed: 21304890]
44. The ARIC investigators. The Atherosclerosis Risk in Communities (ARIC) Study: design andobjectives. American Journal of Epidemiology. 1989; 129:687–702. [PubMed: 2646917]
45. Bostick M, et al. UHRF1 plays a role in maintaining DNA methylation in mammalian cells.Science. 2007; 317:1760–4. [PubMed: 17673620]
46. Ng PC, Henikoff S. Predicting deleterious amino acid substitutions. Genome Res. 2001; 11:863–74. [PubMed: 11337480]
47. Evans RM, Barish GD, Wang YX. PPARs and the complex journey to obesity. Nat Med. 2004;10:355–61. [PubMed: 15057233]
48. Reigstad LJ, et al. Platelet-derived growth factor (PDGF)-C, a PDGF family member with avascular endothelial growth factor-like structure. J Biol Chem. 2003; 278:17114–20. [PubMed:12598536]
49. Handford CA, et al. The human glycine receptor beta subunit: primary structure, functionalcharacterisation and chromosomal localisation of the human and murine genes. Brain Res MolBrain Res. 1996; 35:211–9. [PubMed: 8717357]
50. den Hoed M, et al. Genetic susceptibility to obesity and related traits in childhood and adolescence:influence of loci identified by genome-wide association studies. Diabetes. 2010; 59:2980–8.[PubMed: 20724581]
51. Hotta K, et al. Polymorphisms in NRXN3, TFAP2B, MSRA, LYPLAL1, FTO and MC4R andtheir effect on visceral fat area in the Japanese population. J Hum Genet. 2010; 55:738–42.[PubMed: 20703240]
52. Lindgren CM, et al. Genome-wide association scan meta-analysis identifies three Loci influencingadiposity and fat distribution. PLoS genetics. 2009; 5:e1000508. [PubMed: 19557161]
53. Seve M, Chimienti F, Devergnas S, Favier A. In silico identification and expression of SLC30family genes: an expressed sequence tag data mining strategy for the characterization of zinctransporters’ tissue expression. BMC Genomics. 2004; 5:32. [PubMed: 15154973]
Manning et al. Page 20
Nat Genet. Author manuscript; available in PMC 2013 April 01.
NIH
-PA Author Manuscript
NIH
-PA Author Manuscript
NIH
-PA Author Manuscript
54. Ohagi S, et al. Human prohormone convertase 3 gene: exon-intron organization and molecularscanning for mutations in Japanese subjects with NIDDM. Diabetes. 1996; 45:897–901. [PubMed:8666140]
55. Benzinou M, et al. Common nonsynonymous variants in PCSK1 confer risk of obesity. Nat Genet.2008; 40:943–5. [PubMed: 18604207]
56. Miura K, et al. ARAP1: a point of convergence for Arf and Rho signaling. Mol Cell. 2002; 9:109–19. [PubMed: 11804590]
57. Clement S, et al. The lipid phosphatase SHIP2 controls insulin sensitivity. Nature. 2001; 409:92–7.[PubMed: 11343120]
58. Kent WJ, et al. The human genome browser at UCSC. Genome Res. 2002; 12:996–1006.[PubMed: 12045153]
59. Silva JP, et al. Regulation of adaptive behaviour during fasting by hypothalamic Foxa2. Nature.2009; 462:646–50. [PubMed: 19956259]
60. Liu F, Roth RA. Grb-IR: a SH2-domain-containing protein that binds to the insulin receptor andinhibits its function. Proc Natl Acad Sci U S A. 1995; 92:10287–91. [PubMed: 7479769]
61. Giovannone B, et al. Two novel proteins that are linked to insulin-like growth factor (IGF-I)receptors by the Grb10 adapter and modulate IGF-I signaling. J Biol Chem. 2003; 278:31564–73.[PubMed: 12771153]
62. Murray MV, Kobayashi R, Krainer AR. The type 2C Ser/Thr phosphatase PP2Cgamma is a pre-mRNA splicing factor. Genes Dev. 1999; 13:87–97. [PubMed: 9887102]
63. Schwitzgebel VM, et al. Agenesis of human pancreas due to decreased half-life of insulin promoterfactor 1. The Journal of clinical endocrinology and metabolism. 2003; 88:4398–4406. [PubMed:12970316]
64. Stoffers DA, Ferrer J, Clarke WL, Habener JF. Early-onset type-II diabetes mellitus (MODY4)linked to IPF1. Nature genetics. 1997; 17:138–139. [PubMed: 9326926]
65. Cockburn BN, et al. Insulin promoter factor-1 mutations and diabetes in Trinidad: identification ofa novel diabetes-associated mutation (E224K) in an Indo-Trinidadian family. The Journal ofclinical endocrinology and metabolism. 2004; 89:971–978. [PubMed: 14764823]
66. Rasmussen-Torvik LJ, et al. Impact of repeated measures and sample selection on genome-wideassociation studies of fasting glucose. Genet Epidemiol. 2010; 34:665–73. [PubMed: 20839289]
67. Li Y, Willer C, Sanna S, Abecasis G. Genotype imputation. Annual review of genomics andhuman genetics. 2009; 10:387–406.
68. Li Y, Willer CJ, Ding J, Scheet P, Abecasis GR. MaCH: using sequence and genotype data toestimate haplotypes and unobserved genotypes. Genetic epidemiology. 2010; 34:816–834.[PubMed: 21058334]
69. Howie BN, Donnelly P, Marchini J. A flexible and accurate genotype imputation method for thenext generation of genome-wide association studies. PLoS genetics. 2009; 5:e1000529. [PubMed:19543373]
70. Marchini J, Howie B, Myers S, McVean G, Donnelly P. A new multipoint method for genome-wide association studies by imputation of genotypes. Nature genetics. 2007; 39:906–913.[PubMed: 17572673]
71. Voorman A, Lumley T, McKnight B, Rice K. Behavior of QQ-Plots and Genomic Control inStudies of Gene-Environment Interaction. PloS one. 2011; 6:e19416. [PubMed: 21589913]
72. Aulchenko YS, Struchalin MV, van Duijn CM. ProbABEL package for genome-wide associationanalysis of imputed data. BMC bioinformatics. 2010; 11:134. [PubMed: 20233392]
73. Petitti, DB. Meta-analysis, Decision Analysis, and Cost-effectiveness Analysis. Vol. 2. OxfordUniversity Press; New York: 2000. Statistical Methods in meta-analysis; p. 94-118.
74. Higgins JP, Thompson SG. Quantifying heterogeneity in a meta-analysis. Statistics in medicine.2002; 21:1539–1558. [PubMed: 12111919]
75. Genomes Project C etal. A map of human genome variation from population-scale sequencing.Nature. 2010; 467:1061–1073. [PubMed: 20981092]
76. Riva A, Kohane IS. A SNP-centric database for the investigation of the human genome. BMCbioinformatics. 2004; 5:33. [PubMed: 15046636]
Manning et al. Page 21
Nat Genet. Author manuscript; available in PMC 2013 April 01.
NIH
-PA Author Manuscript
NIH
-PA Author Manuscript
NIH
-PA Author Manuscript

77. Wellcome Trust Case Control C et al. Genome-wide association study of CNVs in 16,000 cases ofeight common diseases and 3,000 shared controls. Nature. 2010; 464:713–720. [PubMed:20360734]
78. McCarroll SA, et al. Common deletion polymorphisms in the human genome. Nat Genet. 2006;38:86–92. [PubMed: 16468122]
Manning et al. Page 22
Nat Genet. Author manuscript; available in PMC 2013 April 01.
NIH
-PA Author Manuscript
NIH
-PA Author Manuscript
NIH
-PA Author Manuscript
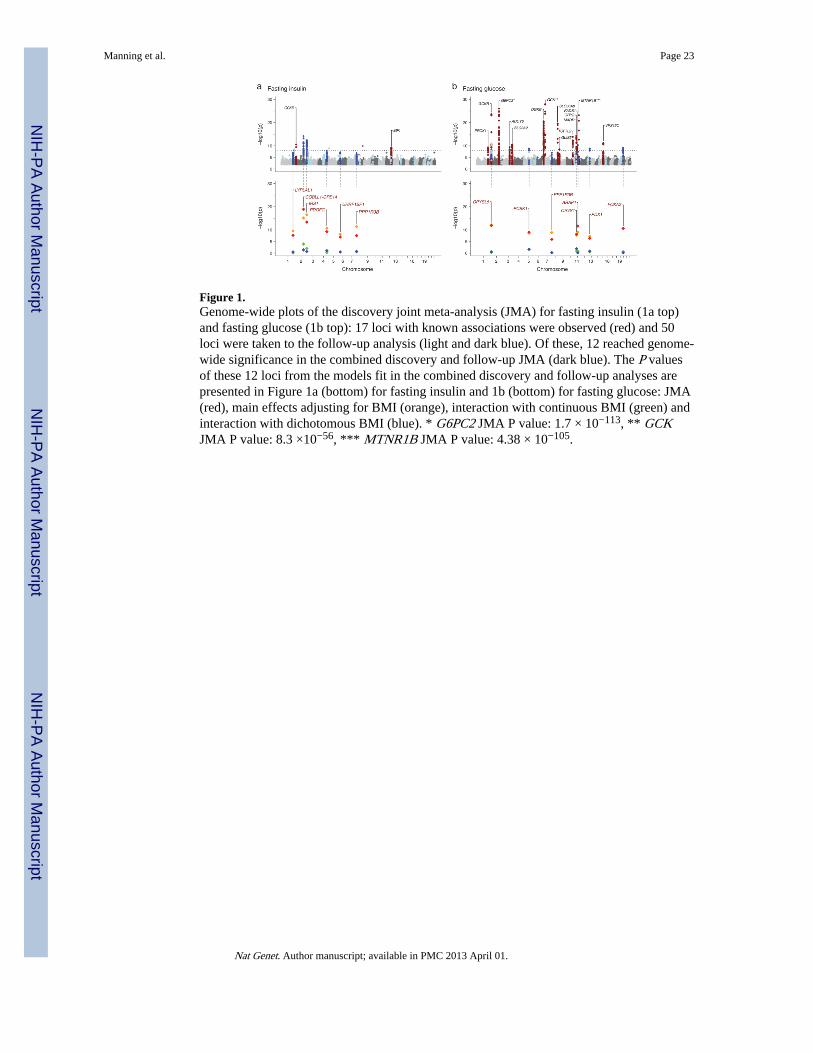
Figure 1.Genome-wide plots of the discovery joint meta-analysis (JMA) for fasting insulin (1a top)and fasting glucose (1b top): 17 loci with known associations were observed (red) and 50loci were taken to the follow-up analysis (light and dark blue). Of these, 12 reached genome-wide significance in the combined discovery and follow-up JMA (dark blue). The P valuesof these 12 loci from the models fit in the combined discovery and follow-up analyses arepresented in Figure 1a (bottom) for fasting insulin and 1b (bottom) for fasting glucose: JMA(red), main effects adjusting for BMI (orange), interaction with continuous BMI (green) andinteraction with dichotomous BMI (blue). * G6PC2 JMA P value: 1.7 × 10−113, ** GCKJMA P value: 8.3 ×10−56, *** MTNR1B JMA P value: 4.38 × 10−105.
Manning et al. Page 23
Nat Genet. Author manuscript; available in PMC 2013 April 01.
NIH
-PA Author Manuscript
NIH
-PA Author Manuscript
NIH
-PA Author Manuscript
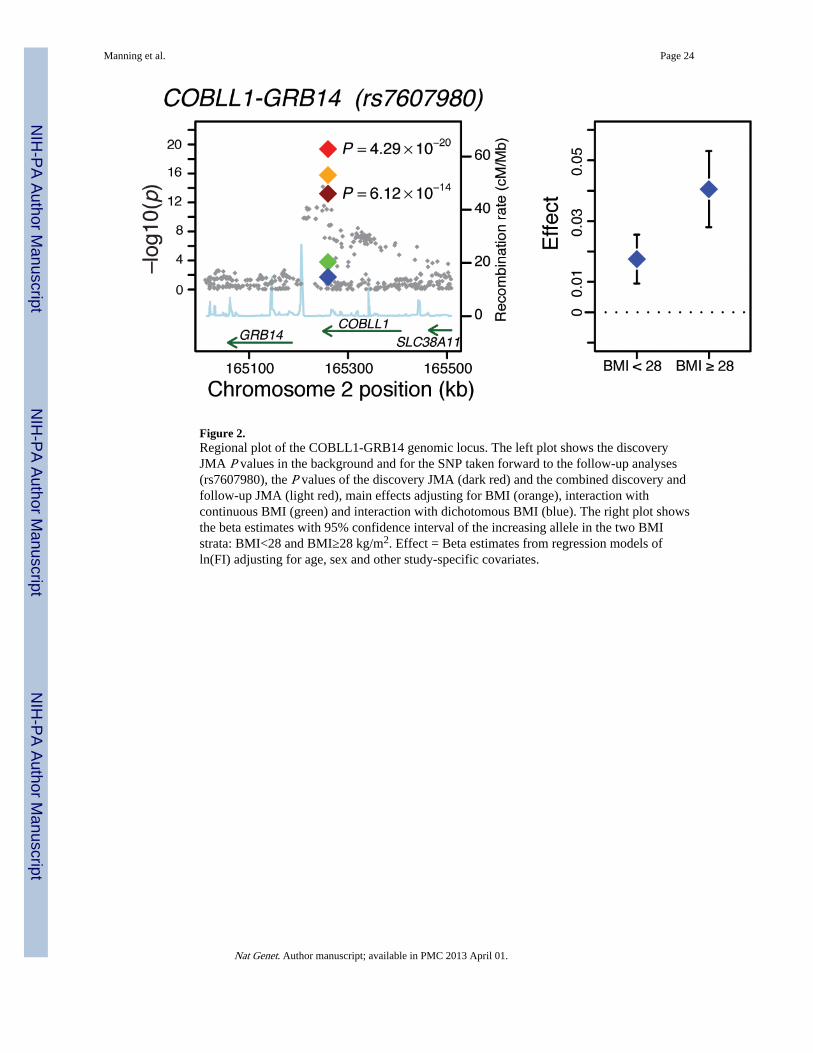
Figure 2.Regional plot of the COBLL1-GRB14 genomic locus. The left plot shows the discoveryJMA P values in the background and for the SNP taken forward to the follow-up analyses(rs7607980), the P values of the discovery JMA (dark red) and the combined discovery andfollow-up JMA (light red), main effects adjusting for BMI (orange), interaction withcontinuous BMI (green) and interaction with dichotomous BMI (blue). The right plot showsthe beta estimates with 95% confidence interval of the increasing allele in the two BMIstrata: BMI<28 and BMI≥28 kg/m2. Effect = Beta estimates from regression models ofln(FI) adjusting for age, sex and other study-specific covariates.
Manning et al. Page 24
Nat Genet. Author manuscript; available in PMC 2013 April 01.
NIH
-PA Author Manuscript
NIH
-PA Author Manuscript
NIH
-PA Author Manuscript
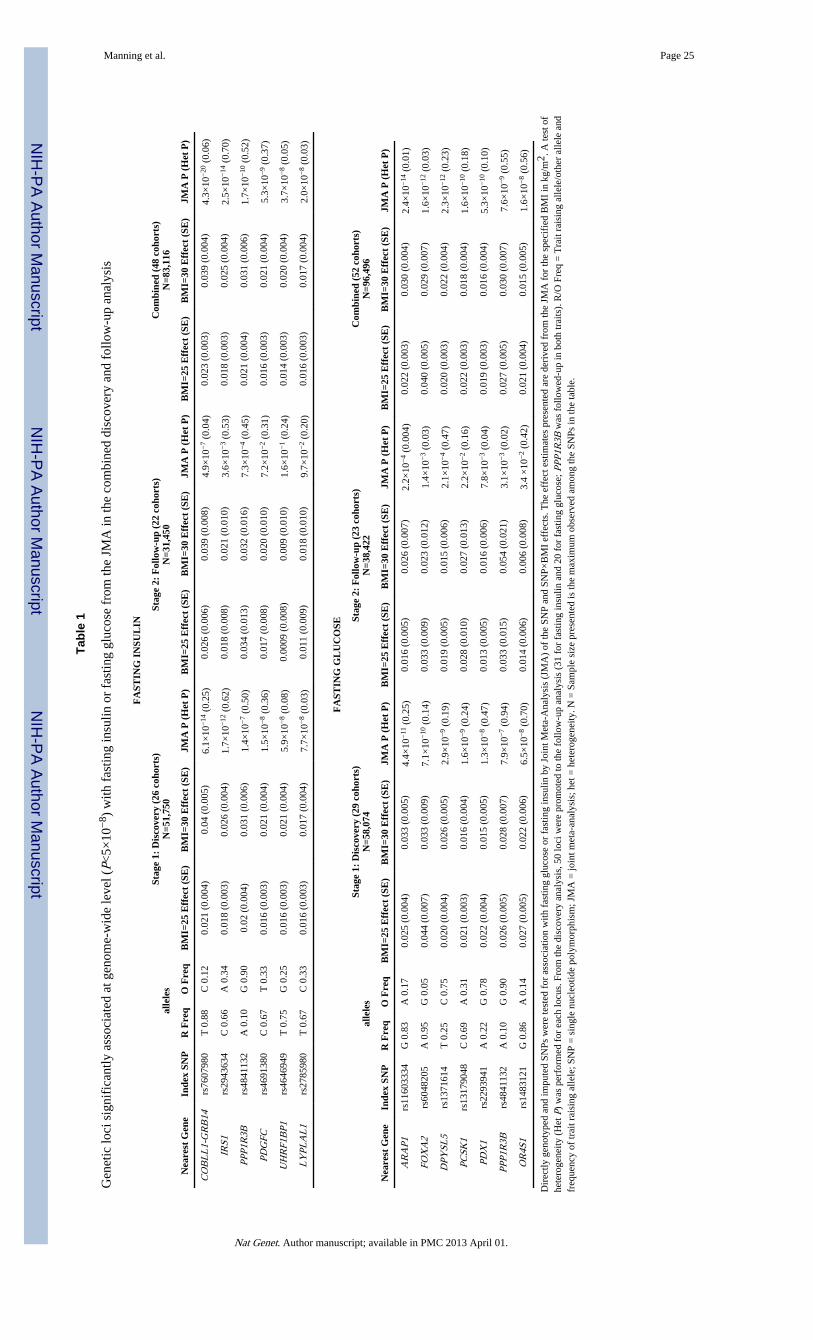
NIH
-PA Author Manuscript
NIH
-PA Author Manuscript
NIH
-PA Author Manuscript
Manning et al. Page 25
Tabl
e 1
Gen
etic
loci
sig
nifi
cant
ly a
ssoc
iate
d at
gen
ome-
wid
e le
vel (
P<5×
10−
8 ) w
ith f
astin
g in
sulin
or
fast
ing
gluc
ose
from
the
JMA
in th
e co
mbi
ned
disc
over
y an
d fo
llow
-up
anal
ysis
FA
STIN
G I
NSU
LIN
alle
les
Stag
e 1:
Dis
cove
ry (
26 c
ohor
ts)
N=5
1,75
0St
age
2: F
ollo
w-u
p (2
2 co
hort
s)N
=31,
450
Com
bine
d (4
8 co
hort
s)N
=83,
116
Nea
rest
Gen
eIn
dex
SNP
R F
req
O F
req
BM
I=25
Eff
ect
(SE
)B
MI=
30 E
ffec
t (S
E)
JMA
P (
Het
P)
BM
I=25
Eff
ect
(SE
)B
MI=
30 E
ffec
t (S
E)
JMA
P (
Het
P)
BM
I=25
Eff
ect
(SE
)B
MI=
30 E
ffec
t (S
E)
JMA
P (
Het
P)
CO
BL
L1-
GR
B14
rs76
0798
0T
0.8
8C
0.1
20.
021
(0.0
04)
0.04
(0.
005)
6.1×
10−
14 (
0.25
)0.
026
(0.0
06)
0.03
9 (0
.008
)4.
9×10
−7
(0.0
4)0.
023
(0.0
03)
0.03
9 (0
.004
)4.
3×10
−20
(0.
06)
IRS1
rs29
4363
4C
0.6
6A
0.3
40.
018
(0.0
03)
0.02
6 (0
.004
)1.
7×10
−12
(0.
62)
0.01
8 (0
.008
)0.
021
(0.0
10)
3.6×
10−
3 (0
.53)
0.01
8 (0
.003
)0.
025
(0.0
04)
2.5×
10−
14 (
0.70
)
PPP1
R3B
rs48
4113
2A
0.1
0G
0.9
00.
02 (
0.00
4)0.
031
(0.0
06)
1.4×
10−
7 (0
.50)
0.03
4 (0
.013
)0.
032
(0.0
16)
7.3×
10−
4 (0
.45)
0.02
1 (0
.004
)0.
031
(0.0
06)
1.7×
10−
10 (
0.52
)
PDG
FCrs
4691
380
C 0
.67
T 0
.33
0.01
6 (0
.003
)0.
021
(0.0
04)
1.5×
10−
8 (0
.36)
0.01
7 (0
.008
)0.
020
(0.0
10)
7.2×
10−
2 (0
.31)
0.01
6 (0
.003
)0.
021
(0.0
04)
5.3×
10−
9 (0
.37)
UH
RF1
BP1
rs46
4694
9T
0.7
5G
0.2
50.
016
(0.0
03)
0.02
1 (0
.004
)5.
9×10
−8
(0.0
8)0.
0009
(0.
008)
0.00
9 (0
.010
)1.
6×10
−1
(0.2
4)0.
014
(0.0
03)
0.02
0 (0
.004
)3.
7×10
−8
(0.0
5)
LY
PLA
L1
rs27
8598
0T
0.6
7C
0.3
30.
016
(0.0
03)
0.01
7 (0
.004
)7.
7×10
−8
(0.0
3)0.
011
(0.0
09)
0.01
8 (0
.010
)9.
7×10
−2
(0.2
0)0.
016
(0.0
03)
0.01
7 (0
.004
)2.
0×10
−8
(0.0
3)
FA
STIN
G G
LU
CO
SE
alle
les
Stag
e 1:
Dis
cove
ry (
29 c
ohor
ts)
N=5
8,07
4St
age
2: F
ollo
w-u
p (2
3 co
hort
s)N
=38,
422
Com
bine
d (5
2 co
hort
s)N
=96,
496
Nea
rest
Gen
eIn
dex
SNP
R F
req
O F
req
BM
I=25
Eff
ect
(SE
)B
MI=
30 E
ffec
t (S
E)
JMA
P (
Het
P)
BM
I=25
Eff
ect
(SE
)B
MI=
30 E
ffec
t (S
E)
JMA
P (
Het
P)
BM
I=25
Eff
ect
(SE
)B
MI=
30 E
ffec
t (S
E)
JMA
P (
Het
P)
AR
AP1
rs11
6033
34G
0.8
3A
0.1
70.
025
(0.0
04)
0.03
3 (0
.005
)4.
4×10
−11
(0.
25)
0.01
6 (0
.005
)0.
026
(0.0
07)
2.2×
10−
4 (0
.004
)0.
022
(0.0
03)
0.03
0 (0
.004
)2.
4×10
−14
(0.
01)
FOX
A2
rs60
4820
5A
0.9
5G
0.0
50.
044
(0.0
07)
0.03
3 (0
.009
)7.
1×10
−10
(0.
14)
0.03
3 (0
.009
)0.
023
(0.0
12)
1.4×
10−
3 (0
.03)
0.04
0 (0
.005
)0.
029
(0.0
07)
1.6×
10−
12 (
0.03
)
DPY
SL5
rs13
7161
4T
0.2
5C
0.7
50.
020
(0.0
04)
0.02
6 (0
.005
)2.
9×10
−9
(0.1
9)0.
019
(0.0
05)
0.01
5 (0
.006
)2.
1×10
−4
(0.4
7)0.
020
(0.0
03)
0.02
2 (0
.004
)2.
3×10
−12
(0.
23)
PCSK
1rs
1317
9048
C 0
.69
A 0
.31
0.02
1 (0
.003
)0.
016
(0.0
04)
1.6×
10−
9 (0
.24)
0.02
8 (0
.010
)0.
027
(0.0
13)
2.2×
10−
2 (0
.16)
0.02
2 (0
.003
)0.
018
(0.0
04)
1.6×
10−
10 (
0.18
)
PDX
1rs
2293
941
A 0
.22
G 0
.78
0.02
2 (0
.004
)0.
015
(0.0
05)
1.3×
10−
8 (0
.47)
0.01
3 (0
.005
)0.
016
(0.0
06)
7.8×
10−
3 (0
.04)
0.01
9 (0
.003
)0.
016
(0.0
04)
5.3×
10−
10 (
0.10
)
PPP1
R3B
rs48
4113
2A
0.1
0G
0.9
00.
026
(0.0
05)
0.02
8 (0
.007
)7.
9×10
−7
(0.9
4)0.
033
(0.0
15)
0.05
4 (0
.021
)3.
1×10
−3
(0.0
2)0.
027
(0.0
05)
0.03
0 (0
.007
)7.
6×10
−9
(0.5
5)
OR
4S1
rs14
8312
1G
0.8
6A
0.1
40.
027
(0.0
05)
0.02
2 (0
.006
)6.
5×10
−8
(0.7
0)0.
014
(0.0
06)
0.00
6 (0
.008
)3.
4 ×
10−
2 (0
.42)
0.02
1 (0
.004
)0.
015
(0.0
05)
1.6×
10−
8 (0
.56)
Dir
ectly
gen
otyp
ed a
nd im
pute
d SN
Ps w
ere
test
ed f
or a
ssoc
iatio
n w
ith f
astin
g gl
ucos
e or
fas
ting
insu
lin b
y Jo
int M
eta-
Ana
lysi
s (J
MA
) of
the
SNP
and
SNP×
BM
I ef
fect
s. T
he e
ffec
t est
imat
es p
rese
nted
are
der
ived
fro
m th
e JM
A f
or th
e sp
ecif
ied
BM
I in
kg/
m2 .
A te
st o
fhe
tero
gene
ity (
Het
P)
was
per
form
ed f
or e
ach
locu
s. F
rom
the
disc
over
y an
alys
is, 5
0 lo
ci w
ere
prom
oted
to th
e fo
llow
-up
anal
ysis
(31
for
fas
ting
insu
lin a
nd 2
0 fo
r fa
stin
g gl
ucos
e; P
PP1R
3B w
as f
ollo
wed
-up
in b
oth
trai
ts).
R/O
Fre
q =
Tra
it ra
isin
g al
lele
/oth
er a
llele
and
freq
uenc
y of
trai
t rai
sing
alle
le; S
NP
= s
ingl
e nu
cleo
tide
poly
mor
phis
m; J
MA
= jo
int m
eta-
anal
ysis
; het
= h
eter
ogen
eity
. N =
Sam
ple
size
pre
sent
ed is
the
max
imum
obs
erve
d am
ong
the
SNPs
in th
e ta
ble.
Nat Genet. Author manuscript; available in PMC 2013 April 01.
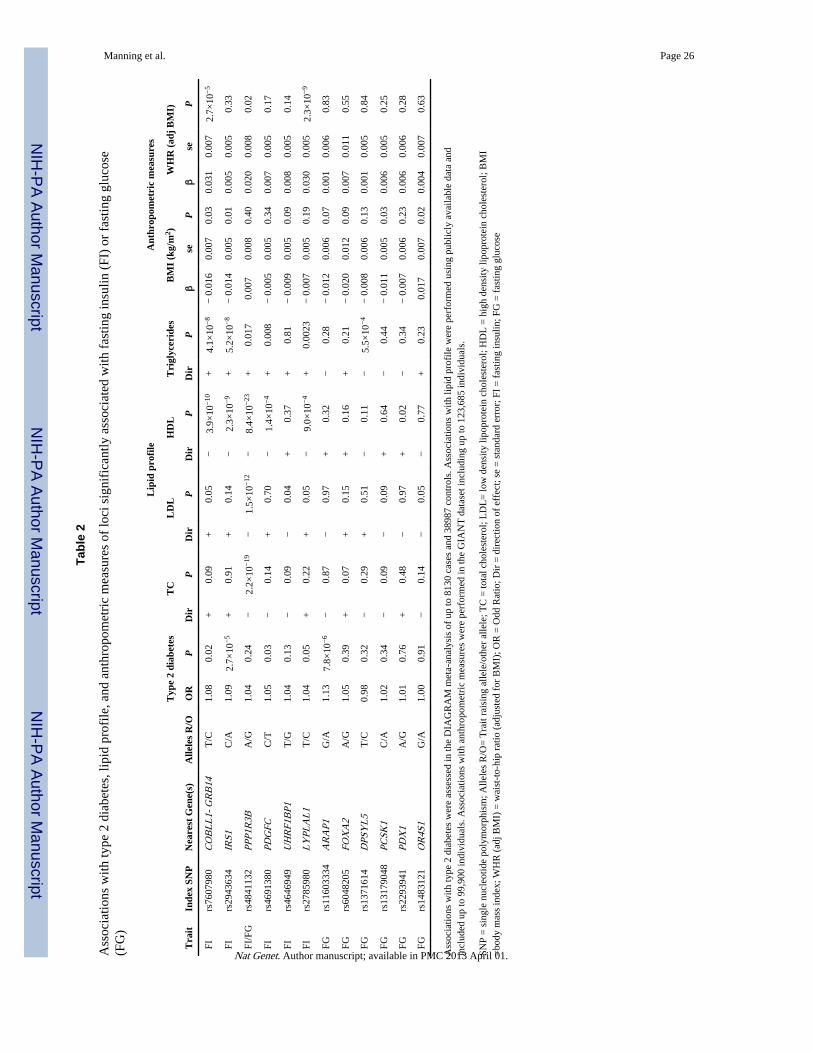
NIH
-PA Author Manuscript
NIH
-PA Author Manuscript
NIH
-PA Author Manuscript
Manning et al. Page 26
Tabl
e 2
Ass
ocia
tions
with
type
2 d
iabe
tes,
lipi
d pr
ofile
, and
ant
hrop
omet
ric
mea
sure
s of
loci
sig
nifi
cant
ly a
ssoc
iate
d w
ith f
astin
g in
sulin
(FI
) or
fas
ting
gluc
ose
(FG
)
Lip
id p
rofi
leA
nthr
opom
etri
c m
easu
res
Typ
e 2
diab
etes
TC
LD
LH
DL
Tri
glyc
erid
esB
MI
(kg/
m2 )
WH
R (
adj
BM
I)
Tra
itIn
dex
SNP
Nea
rest
Gen
e(s)
Alle
les
R/O
OR
PD
irP
Dir
PD
irP
Dir
Pβ
seP
βse
P
FIrs
7607
980
CO
BL
L1-
GR
B14
T/C
1.08
0.02
+0.
09+
0.05
−3.
9×10
−10
+4.
1×10
−8
− 0
.016
0.00
70.
030.
031
0.00
72.
7×10
−5
FIrs
2943
634
IRS1
C/A
1.09
2.7×
10−
5+
0.91
+0.
14−
2.3×
10−
9+
5.2×
10−
8−
0.0
140.
005
0.01
0.00
50.
005
0.33
FI/F
Grs
4841
132
PPP1
R3B
A/G
1.04
0.24
−2.
2×10
−19
−1.
5×10
−12
−8.
4×10
−23
+0.
017
0.00
70.
008
0.40
0.02
00.
008
0.02
FIrs
4691
380
PDG
FCC
/T1.
050.
03−
0.14
+0.
70−
1.4×
10−
4+
0.00
8−
0.0
050.
005
0.34
0.00
70.
005
0.17
FIrs
4646
949
UH
RF1
BP1
T/G
1.04
0.13
−0.
09−
0.04
+0.
37+
0.81
− 0
.009
0.00
50.
090.
008
0.00
50.
14
FIrs
2785
980
LY
PLA
L1
T/C
1.04
0.05
+0.
22+
0.05
−9.
0×10
−4
+0.
0023
− 0
.007
0.00
50.
190.
030
0.00
52.
3×10
−9
FGrs
1160
3334
AR
AP1
G/A
1.13
7.8×
10−
6−
0.87
−0.
97+
0.32
−0.
28−
0.0
120.
006
0.07
0.00
10.
006
0.83
FGrs
6048
205
FOX
A2
A/G
1.05
0.39
+0.
07+
0.15
+0.
16+
0.21
− 0
.020
0.01
20.
090.
007
0.01
10.
55
FGrs
1371
614
DPS
YL
5T
/C0.
980.
32−
0.29
+0.
51−
0.11
−5.
5×10
−4
− 0
.008
0.00
60.
130.
001
0.00
50.
84
FGrs
1317
9048
PCSK
1C
/A1.
020.
34−
0.09
−0.
09+
0.64
−0.
44−
0.0
110.
005
0.03
0.00
60.
005
0.25
FGrs
2293
941
PDX
1A
/G1.
010.
76+
0.48
−0.
97+
0.02
−0.
34−
0.0
070.
006
0.23
0.00
60.
006
0.28
FGrs
1483
121
OR
4S1
G/A
1.00
0.91
−0.
14−
0.05
−0.
77+
0.23
0.01
70.
007
0.02
0.00
40.
007
0.63
Ass
ocia
tions
with
type
2 d
iabe
tes
wer
e as
sess
ed in
the
DIA
GR
AM
met
a-an
alys
is o
f up
to 8
130
case
s an
d 38
987
cont
rols
. Ass
ocia
tions
with
lipi
d pr
ofile
wer
e pe
rfor
med
usi
ng p
ublic
ly a
vaila
ble
data
and
incl
uded
up
to 9
9,90
0 in
divi
dual
s. A
ssoc
iatio
ns w
ith a
nthr
opom
etri
c m
easu
res
wer
e pe
rfor
med
in th
e G
IAN
T d
atas
et in
clud
ing
up to
123
,685
indi
vidu
als.
SNP
= s
ingl
e nu
cleo
tide
poly
mor
phis
m; A
llele
s R
/O=
Tra
it ra
isin
g al
lele
/oth
er a
llele
; TC
= to
tal c
hole
ster
ol; L
DL
= lo
w d
ensi
ty li
popr
otei
n ch
oles
tero
l; H
DL
= h
igh
dens
ity li
popr
otei
n ch
oles
tero
l; B
MI
=bo
dy m
ass
inde
x; W
HR
(ad
j BM
I) =
wai
st-t
o-hi
p ra
tio (
adju
sted
for
BM
I); O
R =
Odd
Rat
io; D
ir =
dir
ectio
n of
eff
ect;
se =
sta
ndar
d er
ror;
FI
= f
astin
g in
sulin
; FG
= f
astin
g gl
ucos
e
Nat Genet. Author manuscript; available in PMC 2013 April 01.