second quarter 2010 report - swiss reswiss re second quarter 2010 report 3 letter to shareholders...
TRANSCRIPT

Second Quarter 2010 Report

USD millions, unless otherwise stated 2009 2010 Change in %
Property & Casualty Premiums earned 3 178 2 510 –21Combined ratio, traditional business in % 89.4 102.0
Life & HealthPremiums earned 2 389 2 175 –9Benefit ratio in % 78.6 93.5
Asset ManagementOperating income 472 1 229 160Return on investments in % (annualised) 0.5 5.8
LegacyOperating income/loss 65 –54 –
GroupPremiums earned 5 578 4 679 –16Net income/loss attributable to common shareholders –342 812 –Earnings per share in CHF –1.13 2.56 –Shareholders’ equity (31.12.2009/30.06.2010) 25 344 27 517 9Return on equity1 in % (annualised) –7.4 13.4 –Number of employees2 (31.12.2009/30.06.2010) 10 552 10 374 –2
1 Return on equity is calculated by dividing annualised net income attributable to common shareholders by average common shareholders’ equity.
2 Regular staff
Key information
Corporate highlights Strong net income of USD 812 million
despite challenging market conditions
Excellent performance in Asset Management with operating income of USD 1.2 billion; annualised return on investments of 5.8%
July 2010 renewals demonstrate continued focus on disciplined cycle management
Good progress in de-risking with sale of all remaining former Structured CDS positions and commutation of USD 1.0 billion of notional exposure related to the discontinued Financial Guarantee Re business
Financial strength ratingsas of 30 July 2010 S&P Moody’s A.M. Best
Rating A+ A1 AOutlook stable stable stable
Share informationas of 30 July 2010
Share price in CHF 47.98Market capitalisation in CHF millions 17 786
Share performancein % 1 January 2005–30 July 2010 (p.a.) Year to 30 July 2010
Swiss Re –9.0 –3.9Swiss Market Index 1.5 –5.3Dow Jones STOXX 600 Insurance –3.7 0.2
Financial highlights (unaudited)For the three months ended 30 June
Share price (CHF)
20
40
60
80
100
120
140
160
0
201020092008200720062005 Swiss Re Swiss Market Index Dow Jones STOXX 600 Insurance
Swiss Re Second Quarter 2010 Report 1
Letter to shareholders 2
Key events 4
Group 5 Group results
8 Property & Casualty
9 Life & Health
10 Asset Management
11 Legacy
11 Outlook
Financial statements 13 Income statement
14 Balance sheet
16 Statement of equity
18 Statement of comprehensive income
19 Statement of cash flow
Notes to the Group financial statements:
21 Note 1 Organisation and summary of significant accounting policies
23 Note 2 Investments
29 Note 3 Fair value disclosures
40 Note 4 Derivative financial instruments
46 Note 5 Deferred acquisition costs (DAC) and acquired present value
of future profits (PVFP)
47 Note 6 Debt
48 Note 7 Reinsurance information
52 Note 8 Earnings per share
53 Note 9 Benefit plans
54 Note 10 Contingent liabilities
55 Note 11 Information on business segments
65 Note 12 Variable interest entities
General information 70 Note on risk factors
76 Cautionary note on forward-looking statements

2 Swiss Re Second Quarter 2010 Report
Letter to shareholders
Walter B. Kielholz Chairman of the Board of Directors
Stefan Lippe Chief Executive Officer
Dear shareholders
Swiss Re’s business performed strongly in the second quarter of 2010. Net income was USD 812 million and earnings per share were CHF 2.56 (USD 2.37). Annualised return on equity for the second quarter of 2010 was 13.4%. The result was supported by an excellent performance in Asset Management, and was achieved despite a number of large losses, such as the Deepwater Horizon oil rig loss and an increase in our loss estimate for the earthquake that hit Chile in February of this year.
For the past two years, Swiss Re has positioned its (re)insurance portfolio for the softening market. We have maintained our discipline in managing the cycle with a clear focus on profitability. Despite underlying market softening estimated at 3% in the July 2010 renewals, Swiss Re has succeeded in maintaining the long-term price adequacy of its portfolio.
Resilient performance in challenging market conditionsSwiss Re’s underlying business proved its ability to generate sustainable, strong earnings in a challenging market environment.
Our Property & Casualty business reported operating income of USD 455 million in the second quarter of 2010, maintaining profitability despite natural catastrophes and man-made losses that were above expectations in the reporting period. Estimated claims from the Deepwater Horizon oil rig explosion of approximately USD 200 million as well as the USD 130 million increase in the loss estimate to USD 630 million for the Chile earthquake in February 2010 increased the combined ratio to 102.0%, or 100.2% excluding unwind of discount.
Life & Health posted operating income of USD 142 million. The benefit ratio rose to 93.5%. The improved operating income is the result of significantly improved results in variable annuities, partly offset by lower investment return.
We are well placed to meet client demands in a changing market environment, and aspire to be the leading player in the wholesale (re)insurance industry

Swiss Re Second Quarter 2010 Report 3
Letter to shareholders
Asset Management achieved an excellent result with operating income of USD 1.2 billion, based on a prudent investment approach in response to the ongoing financial market volatility. The annualised return on investments was 5.8% for the quarter. Total return on investments was excellent at 13.2%.
In the second quarter of 2010, we further reduced risks in Legacy with the sale of the entire remaining positions from the former Structured CDS and the commutation of USD 1.0 billion of notional exposure in Financial Guarantee Re. At the same time, exposure was reduced in former Portfolio CDS, securitised products and other former trading activities.
Our capital strength and expertise enabled us to support our clients with a number of innovative transactions. In June 2010, Swiss Re pioneered a public sector agreement with a US state, structuring a multi-year parametric wind cover for the Alabama State Insurance Fund (SIF) to hedge insurance price volatility after a major storm. This is the first time a governmental body from an industrialised country has used a parametric solution to transfer public catastrophe exposure to the private sector.
Swiss Re set to benefit from industry developments Looking ahead, we continue to build on our strengths. The reinsurance industry is expected to experience moderate but stable growth over the coming years – we anticipate that the property and casualty market will grow on average by 6.5% and the life and health market by 3.7% annually during the decade ahead.
Capital will remain a key industry issue. Higher solvency requirements, low investment returns and an increased focus on the economic costs of risk have the potential to fuel demand for (re)insurance capacity. Changes in rating, regulatory and accounting standards impose increasing constraints on investment strategies, often requiring insurers to hold additional capital. Consolidation among insurers is likely to stimulate demand for reinsurance.
Interest in longevity risk transfer will increase substantially as pension funds try to cope with an ageing population. Our ambition is to become a significant and influential longevity risk solution provider. We believe that this business can increase and diversify our earnings.
Swiss Re is well placed to meet the demand in these markets. We aspire to be the leading player in the wholesale (re)insurance industry. This means being the partner of choice for our reinsurance clients, as well as being the leading innovator in the industry.
Zurich, 5 August 2010
Walter B. Kielholz Stefan LippeChairman of the Chief Executive Officer Board of Directors

4 Swiss Re Second Quarter 2010 Report
Key events
6 May 2010Net income of USD 158 million for the first quarter 2010Swiss Re reported net income of USD 158 million for the first quarter of 2010. The company continued to deliver strong underlying performance, even though the Property & Casualty result was affected by high natural catastrophe losses in the first quarter. The estimated excess capital position at the AA level increased to more than USD 12 billion.
18 May 2010Swiss Re report shows how risk managers can shape insurers’ risk management culture in line with Solvency IISwiss Re presented its new publication, entitled “Establishing a pro-active risk management culture”. The company outlined its recommendations for risk management in relation to each of the main elements of the Solvency II framework directive: risk and capital modelling, governance as well as disclosure and transparency.
27 May 2010USD 150 million natural catastrophe risk for Allianz through Blue Fin LtdSwiss Re Capital Markets structured and successfully placed USD 150 million of insurance-linked securities issued by Blue Fin Ltd, covering US hurricane and earthquake risk. The Blue Fin shelf programme provides Allianz with a flexible, multi-peril risk management platform to access protection capacity from the capital markets.
11 June 2010Investors’ Day conference – focus on Asset Management and the Swiss Solvency TestSwiss Re’s Investors’ Day conference provided insights into the company’s Asset Management function and the Swiss Solvency Test framework. The Group also updated its estimated claims from the earthquake in Chile, net of retrocession, to be approximately USD 630 million before tax.
27 July 2010Alabama State Insurance Fund transaction marks first parametric insurance solution on behalf of US state governmentSwiss Re announced an agreement with the Alabama State Insurance Fund (“SIF”) to provide a three-year parametric insurance cover for SIF’s primary catastrophic hurricane exposure. This is the first time a US state government has utilised such an innovative solution to transfer its financial exposure from natural catastrophes to the private sector.
Swiss Re Second Quarter 2010 Report 5
Group
Group results
Swiss Re reported net income attributable to common shareholders of USD 812 million in the second quarter of 2010, compared to a net loss of USD 342 million in the second quarter of 2009. Earnings per share were CHF 2.56 (USD 2.37), compared to CHF –1.13 (USD –1.01) in the same period of the previous year.
During the quarter, the US dollar appreciated 3% against the British pound and 1% against the euro, compared to average rates in the second quarter of 2009.
Premiums earned decreased 21% to USD 2.5 billion for Property & Casualty, compared to the prior-year period. The reduction reflects lower volumes, driven by the Group’s active cycle management and selective underwriting, particularly in the January renewals. The decrease includes the effect of adjustments to premium earning patterns for natural catastrophe exposures. Life & Health premiums decreased 9%, mainly as a result of the US individual life retrocession agreement announced earlier this year.
The Group’s investment income and net realised gains include the investment result from assets backing unit-linked and unitised with-profit policies. These returns are credited to policyholders’ accounts and are therefore excluded from the following comments on the investment performance of the Group.
Proprietary net investment income was USD 1.1 billion, a 26% decrease compared to the prior-year period, primarily driven by lower levels of corporate bonds and securitised products. Fixed income running yield was 4.4%, slightly lower compared to the same period of the prior year.
The Group reported proprietary net realised investment gains of USD 992 million in the second quarter of 2010, compared to a loss of USD 1.5 billion in the second quarter of 2009. The improvement in the
reporting period was primarily due to lower impairments and foreign exchange gains, compared to the same period of the prior year.
Other revenues decreased 74% to USD 11 million in the second quarter of 2010 as a result of the disposal of non-core fee business in the Property & Casualty and Asset Management segments in the course of 2009.
Property & Casualty claims and claim adjustment expenses decreased 12% to USD 1.8 billion. This reflects the increase in the loss estimate for the earthquake in Chile. Comparatively higher man-made losses, including the impact from the Deepwater Horizon loss, also affected the second quarter of 2010. The same period in 2009 was impacted by high claims activity in aviation and space. The combined ratio increased to 102.0% in the second quarter of 2010 from 89.4% in the prior-year period, reflecting the impact of higher natural catastrophe experience and man-made losses.
Life and health benefits decreased 4% to USD 2.0 billion in the second quarter of 2010, compared to the prior-year quarter. The prior-year period included a significant one-off gain from an arbitration award on a rescinded disability income reinsurance agreement in the traditional health line of business that did not repeat in the reporting period. In the second quarter of 2010, Life traditional benefits reflect the impact of the life retrocession agreement entered into in January 2010, partially offset by increasing reserves for the Group’s guaranteed minimum death benefits (GMDB) products, driven by the volatility of the underlying financial markets. The decline in the benefit expense of Admin Re® reflects the impact of financial markets on the with-profits products, although it was offset by the change in unrealised gains/losses. The benefit ratio increased to 93.5%, compared to 78.6% in the second quarter of 2009.
Swiss Re reported an excellent result of USD 812 million for the second quarter of 2010. Property & Casualty reported a solid result, despite a relatively high claim burden in the quarter. The Life & Health result in the second quarter was USD 142 million. Asset Management delivered an excellent performance with a return on investments of 5.8%. Shareholders’ equity, excluding non-controlling interests, increased to USD 27.5 billion.

Group
6 Swiss Re Second Quarter 2010 Report
Return credited to policyholders reflects the investment performance on the underlying assets, mainly backing unit-linked and unitised with-profit policies, which is passed through to policyholders. In the second quarter of 2010, an investment loss of USD 1.6 billion was passed through to policyholders, mainly driven by the investment losses in the reporting period, compared to a gain of USD 1.5 billion in the prior-year period.
Acquisition costs were stable at USD 1.0 billion. Decreasing acquisition costs in the property and specialty lines of business as well as the favourable impact of a commutation of a non-traditional Property & Casualty transaction were offset by the impact of unfavourable investment performance in Admin Re® which accelerated the amortisation of present value of future profits (PVFP). As a result, the acquisition cost ratio increased to 22.2% in the second quarter of 2010, compared to 18.5% in the same period of the previous year.
Administrative expenses were stable at USD 543 million.
Other expenses decreased 73% to USD 59 million. The same period of the prior year was impacted by the restructuring plan the Group initiated in April 2009.
Interest expenses increased 17% to USD 259 million. The impact of new borrowings was partially offset by the positive impact of interest rate hedges that the Group entered into in prior quarters.
For the second quarter of 2010, the Group reported a tax charge of USD 193 million, compared to a tax benefit of USD 139 million in the same period of the previous year. The tax charge generally reflects the tax at the statutory tax rate offset by the reduction in the valuation allowance on unrealised losses.
Total equity, including non-controlling interests, increased USD 1.4 billion to USD 28.9 billion at the end of June 2010, compared to the end of the prior quarter.
Income statementUSD millions, for the three months ended 30 June 2009 2010 Change in %
RevenuesPremiums earned 5 578 4 679 –16Fee income from policyholders 198 221 12Proprietary net investment income 1 555 1 147 –26Net investment income from unit-linked and with-profit business 255 213 –16Proprietary net realised investment gains/losses –1 531 992 –Net realised investment gains/losses from unit-linked and with-profit business 1 263 –2 009 –Other revenues 43 11 –74Total revenues 7 361 5 254 –29
ExpensesClaims and claim adjustment expenses –2 201 –1 820 –17Life and health benefits –2 114 –2 023 –4Return credited to policyholders –1 452 1 614 –Acquisition costs –1 032 –1 041 1Administrative expenses –540 –543 1Other expenses –219 –59 –73Interest expenses –222 –259 17Total expenses –7 780 –4 131 –47
Income/loss before income tax expense –419 1 123 –Income tax expense 139 –193 –Net income/loss before attribution of non-controlling interests –280 930 –
Income attributable to non-controlling interests 0 –53 –Net income/loss after attribution of non-controlling interests –280 877 –
Interest on convertible perpetual capital instrument –62 –65 5Net income/loss attributable to common shareholders –342 812 –

Group
Swiss Re Second Quarter 2010 Report 7
Non-controlling interests reflect interests attributable to non-controlling owners of Swiss Re's subsidiaries. They relate to a modified co-insurance treaty and the management company of private equity funds acquired in the first quarter of 2010, which resulted in the consolidation of all the investees’ assets and liabilities even though the Group does not own the majority of the equity. Swiss Re presents non-controlling interests as separate components of net income and total equity. Minority interests were classified as liabilities under the previous guidance. As of 30 June 2010, non-controlling interests totalled USD 1.4 billion.
Shareholders’ equity, which excludes non-controlling interests, increased USD 1.3 billion, compared to the end of the prior quarter. Interest rate movements resulted in net unrealised investment gains of USD 2.4 billion, mostly on government bonds and securitised products. These gains and the net income for the reporting period were partially offset by unfavourable foreign exchange movements.
Basic book value per share was CHF 78.44 or USD 72.51 at the end of June 2010, compared to CHF 72.23 or USD 68.62 at the end of March 2010. Book value per share is based on shareholders’ equity and excludes the impact of the convertible perpetual capital instrument issued to Berkshire Hathaway and non-controlling interests.
For the second quarter of 2010, annualised return on equity was 13.4%, compared to 2.3% for the full year of 2009 and –7.4% (annualised) for the second quarter of 2009.
Income reconciliationThe income reconciliation table below reconciles the income from the business segments and the operations of the Corporate Centre with the Group’s consolidated net income/loss before tax. Net realised gains or losses on certain financial instruments, certain foreign exchange gains and losses, and other income and expenses – such as indirect taxes, capital taxes and interest charges – have been excluded from the assessment of each segment’s performance.
Income reconciliationUSD millions, for the three months ended 30 June 2009 2010 Change in %
Operating incomeProperty & Casualty 896 455 –49Life & Health –8 142 –Asset Management 472 1 229 160Legacy 65 –54 –Allocation –1 011 –844 –17Total operating income 414 928 124
Corporate Centre expenses –57 –55 –4Items excluded from the segments:
Net investment income 55 37 –33Net realised investment gains/losses –227 217 –Foreign exchange gains/losses –246 332 –Financing costs –222 –259 17Other income/expenses –136 –77 –43
Income before tax –419 1 123 –

Group
8 Swiss Re Second Quarter 2010 Report
Property & Casualty
Property & Casualty operating income decreased 49% to USD 455 million in the second quarter of 2010, compared to USD 896 million in the second quarter of 2009. Foreign exchange movements had no material impact on the Property & Casualty operating income.
The lower operating income in the second quarter of 2010 was driven by the reduction in the underwriting result of USD 276 million, as well as the decrease in investment income of USD 184 million due to lower interest rates and a reduction in the level of reserves. The underwriting result suffered from unfavourable natural catastrophe experience, notably the increase in the estimate for the earthquake in Chile, and from comparatively higher man-made losses, including the impact of the estimated Deepwater Horizon loss.
Net premiums earned decreased 21% to USD 2.5 billion in the second quarter of 2010, compared to USD 3.2 billion in the same period of 2009, driven by Swiss Re’s active cycle management and portfolio steering in a challenging soft price market environment. The decrease also includes the effect of adjustments to premium earning patterns for natural catastrophe exposures.
At constant foreign exchange rates, net premiums earned decreased 22% quarter on quarter.
The combined ratio increased to 102.0% in the second quarter of 2010 from 89.4% in the comparative period, mainly as a result of the unfavourable net claims experience in the second quarter of 2010. Excluding the unwind of discount, the combined ratio was 100.2% in the second quarter of 2010.
The net impact from natural catastrophes on the combined ratio in the second quarter of 2010 was 7 percentage points, which is 2 percentage points above the expected level. This includes the increases in loss estimates for natural catastrophe events in the first quarter of 2010.
The property combined ratio increased to 94.1% in the second quarter of 2010, compared to 67.7% in the second quarter of 2009, which benefited from favourable natural catastrophe experience.
The casualty combined ratio was 124.8% in the second quarter of 2010, compared to 103.8% in the second quarter of 2009. The increase was mainly due to liability claims, including those arising from the Deepwater Horizon loss.
The other specialty combined ratio decreased to 94.0% in the second quarter of 2010, compared to 96.3% in the second quarter of 2009. The improvement was largely driven by lower expenses in the second quarter of 2010.
The credit combined ratio improved to 54.2% in the second quarter of 2010, which is 58 percentage points better than in the same period of 2009. This is largely attributable to positive retained development. The 2010 portfolio changes have also had a positive effect.
Although premiums earned decreased year on year, the expense ratio remained stable at 10.8% in the second quarter of 2010, compared to 10.6% in the prior-year period.
Group
Swiss Re Second Quarter 2010 Report 9
Life & Health
Life & Health reported operating income of USD 142 million in the second quarter of 2010, compared to an operating loss of USD 8 million in the prior-year period. Excluding the effect of foreign exchange movements, operating income rose USD 152 million.
Premiums and fee income declined to USD 2.4 billion in the second quarter of 2010 from USD 2.6 billion in the same quarter of 2009. The decrease was largely due to the US individual life retrocession transaction announced in January 2010. Excluding this and the effect of foreign exchange movements, premiums and fee income rose 7%.
The overall Life & Health benefit ratio increased to 93.5% in the second quarter of 2010, compared to 78.6% in the same quarter of 2009. The change was primarily due to an increase in the benefit reserves underlying certain guaranteed minimum death benefits (GMDB) products, driven by the underlying financial market performance, as well as a prior-year benefit derived from the rescission of a disability contract together with the impact of certain commutations. In addition, morbidity was slightly unfavourable in the reporting period, compared to favourable experience in the prior year.
The management expense ratio increased to 6.5% in the second quarter of 2010, compared to 5.7% in the prior-year period. The increase is mainly due to the decline in operating revenues associated with the life retrocession agreement.
The life business reported operating income of USD 62 million in the second quarter of 2010. Mortality results were better than expectations but were offset by higher reported lapses on certain US term life insurance products, changes in cedent reporting estimates, lower allocated net
investment income due to declining risk free rates and unrealised losses related to an increase in the fair value of embedded derivatives associated with certain treaties ceded by Swiss Re on a funds-withheld basis. The variable annuity and pre-2000 GMDB result was USD 74 million in the quarter, driven mainly by changes in Swiss Re’s own credit spreads.
The health business operating income was USD 63 million in the second quarter of 2010, compared to USD 466 million in the same quarter of 2009. The prior-year period included several one-time items, including the gain from an arbitration award related to the rescinded disability income reinsurance agreement, as well as gains from the commutation of certain personal accident treaties. Morbidity was slightly unfavourable compared to the favourable experience in the prior-year period.
Admin Re® reported operating income of USD 17 million in the second quarter of 2010. This was primarily due to favourable mortality experience and unrealised gains related to an increase in the fair value of embedded derivatives associated with certain treaties ceded by Swiss Re on a funds-withheld basis. This was partially offset by lower allocated net investment income due to declining risk free rates, lower fee income and higher amortisation of the present value of future profits (PVFP) as a result of declining equity markets during the quarter, compared to the same period in 2009.

Group
10 Swiss Re Second Quarter 2010 Report
Asset Management
The annualised return on investments was 5.8% in the second quarter of 2010, compared to 0.5% for the same period of the previous year. This was driven mainly by realised gains and lower impairments. Operating income for the second quarter of 2010 was USD 1.2 billion, compared to USD 472 million in the second quarter of 2009. The annualised total return on investments was 13.2% in the second quarter of 2010, compared to 2.4% in the same period of the previous year. The increase was driven mainly by mark-to-market gains on government bonds as a result of lower interest rates. Total return on investments includes changes in unrealised gains or losses.
Net investment income for Asset Management was USD 0.9 billion in the second quarter of 2010, compared to USD 1.3 billion in the prior-year period. Net investment income on the credit and rates portfolio decreased USD 0.3 billion, compared to the second quarter of 2009, as a result of reducing the investment risk profile.
Net realised gains on investments in Asset Management were USD 325 million in the second quarter of 2010, compared to net realised investment losses of USD 734 million in the same period of the previous year. Net realised investment gains in the second quarter of 2010 mainly reflected net realised and unrealised gains of USD 430 million, partially offset by impairments of USD 75 million.
Asset Management’s investment portfolio decreased to USD 141.3 billion at the end of June 2010, excluding unit-linked and with-profit businesses, compared to USD 142.5 billion at the end of March 2010. Swiss Re’s credit and rates investment portfolio decreased to USD 78.2 billion at the end of June 2010 from USD 79.6 billion at the end of March 2010. The decrease in the portfolio was mainly due to continued de-risking of securitised products and a reduction in hedges on the corporate bond portfolio, partially offset by mark-to-market gains.
Mark-to-market gains in the credit and rates portfolio in the second quarter of 2010 increased shareholders’ equity by USD 2.4 billion, mainly as a result of lower interest rates.

Group
Swiss Re Second Quarter 2010 Report 11
Legacy
Legacy generated a net operating loss of USD 54 million in the second quarter of 2010, compared to net operating income of USD 65 million in the same period of 2009. Net investment income, mainly from securitised products, was more than offset by realised losses and impairments.
The de-risking of the Legacy activities continued in the second quarter of 2010 with the sale of all of the remaining positions from the former Structured CDS and the commutation of USD 1 billion of notional exposure in Financial Guarantee Re (FG Re). Swiss Re also reduced exposure in the former Portfolio CDS, securitised products, and other former trading activities during the quarter.
Former trading activities generated an operating loss of USD 50 million in the second quarter of 2010, versus operating income of USD 181 million in the second quarter of 2009. The operating loss was driven by realised losses from exiting the remaining positions from the former Structured CDS and impairments in securitised products, although they were significantly lower than in the second quarter of 2009.
FG Re reported an operating loss of USD 4 million in the second quarter of 2010, compared to a loss of USD 116 million in the same period of 2009. The main driver was the expense associated with the commutation of approximately USD 1 billion of exposure.
Total expenses were USD 30 million in the second quarter of 2010, compared to USD 18 million in the prior-year period, due to an increase in investment expenses.
Outlook
Swiss Re continues to have a strong focus on active cycle management and portfolio steering to drive sustainable economic returns. Our capital strength, expertise and track record of continued innovation mean we are well positioned to support our clients.
We continue to make significant progress in optimising the Asset Management portfolio and in winding down the Legacy positions, and we expect to have addressed all the significant exposures in Legacy by the end of 2010.

12 Swiss Re Second Quarter 2010 Report
This page intentionally left blank

� Swiss�Re Second Quarter 2010 Report 13
The accompanying notes are an integral part of the Group financial statements.
Income statement (unaudited)
Three months ended 30 June Six months ended 30 JuneUSD millions Note 20091 2010 20091 2010
RevenuesPremiums earned 7, 11 5 578 4�679 11 258 9�647Fee income from policyholders 7, 11 198 221 385 442Net investment income 2, 11 1 810 1�360 3 117 2�839Net realised investment gains/losses (total impairments for the three months ended 30 June were 1 007 in 2009 and 206 in 2010, of which 535 and 128, respectively, were recognised in earnings)2 2, 11 –268 –1�017 –2 292 363Other revenues 11 43 11 81 29Total�revenues 7 361 5�254 12 549 13�320
ExpensesClaims and claim adjustment expenses 7, 11 –2 201 –1�820 –4 501 –4�172Life and health benefits 7, 11 –2 114 –2�023 –3 954 –4�048Return credited to policyholders 11 –1 452 1�614 –271 4Acquisition costs 7, 11 –1 032 –1�041 –2 221 –1�932Other expenses 11 –759 –602 –1 333 –1�172Interest expenses 11 –222 –259 –466 –537Total�expenses –7 780 –4�131 –12 746 –11�857
Income/loss�before�income�tax�expense –419 1�123 –197 1�463Income tax expense 139 –193 53 –260Net�income/loss�before�attribution�of��non-controlling�interests –280 930 –144 1�203
Income attributable to non-controlling interests 0 –53 0 –100Net�income/loss�after�attribution�of��non-controlling�interests –280 877 –144 1�103
Interest on convertible perpetual capital instrument –62 –65 –68 –133Net�income/loss�attributable�to�common�shareholders –342 812 –212 970
Earnings�per�share�in�USDBasic 8 –1.01 2.37 –0.63 2.83Diluted 8 –1.01 1.85 –0.63 2.33Earnings�per�share�in�CHF3Basic 8 –1.13 2.56 –0.69 3.06Diluted 8 –1.13 1.99 –0.69 2.50
1 The Group changed its reporting currency from CHF to USD. Please refer to Note 1. 2 Total impairments were USD 2 253 million and USD 469 million for the six months ended 30 June 2009 and 2010, respectively, of which USD 1 225 million and USD 254 million,
respectively, were recognised in earnings.3 The translation from USD to CHF is shown for informational purposes only and has been calculated at the Group’s average exchange rates for the three and six months ended
30 June 2009 and 2010, respectively.

�
14 Swiss�Re Second Quarter 2010
Assets
The accompanying notes are an integral part of the Group financial statements.
USD millions Note 31.12.20091 30.06.2010
Investments 2, 3, 4Fixed income securities:
Available-for-sale, at fair value (incl. 9 011 in 2009 and 5 373 in 2010 subject to securities lending and repurchase agreements) (amortised cost: 2009: 89 031; 2010: 72 679) 87 182 74�780Trading (incl. 518 in 2009 and 2 118 in 2010 subject to securities lending and repurchase agreements) 11 562 9�947
Equity securities: Available-for-sale, at fair value (cost: 2009: 392; 2010: 359) 554 494Trading 19 591 16�711
Policy loans, mortgages and other loans 5 606 5�370Investment real estate 2 052 2�043Short-term investments, at amortised cost which approximates fair value (incl. 673 in 2009 and 2 250 in 2010 subject to securities lending and repurchase agreements) 10 144 17�051Other invested assets 14 650 11�214Total�investments 151 341 137�610
Cash and cash equivalents (incl. 4 314 in 2009 and 4 852 in 2010 subject to securities lending) 27 810 31�946Accrued investment income 1 565 1�213Premiums and other receivables 11 773 11�384Reinsurance recoverable on unpaid claims and policy benefits 7 11 251 12�563Funds held by ceding companies 9 605 9�170Deferred acquisition costs 5, 7 3 894 3�538Acquired present value of future profits 5 6 054 4�292Goodwill 4 134 3�943Income taxes recoverable 601 579Other assets 4 720 7�632
Total�assets 232 748 223�870
1 The Group changed its reporting currency from CHF to USD. Please refer to Note 1.
Balance sheet (unaudited)
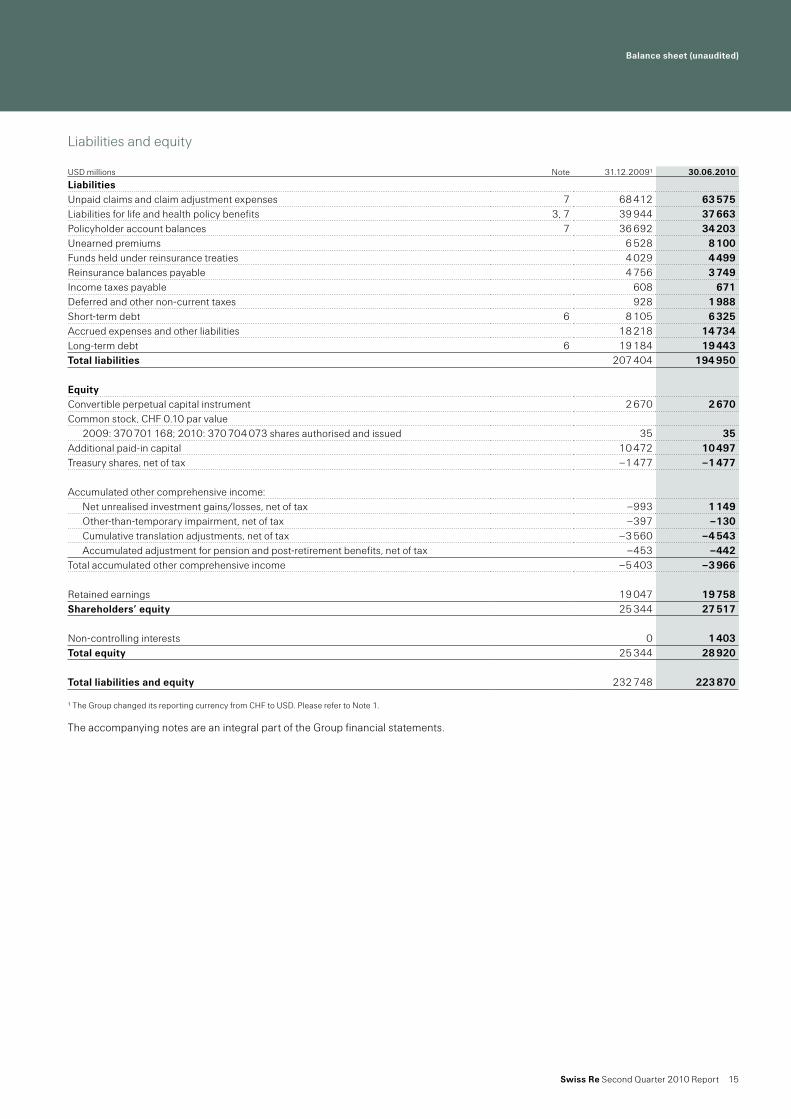
Balance�sheet�(unaudited)
� Swiss�Re Second Quarter 2010 Report 15
Liabilities and equity
The accompanying notes are an integral part of the Group financial statements.
USD millions Note 31.12.20091 30.06.2010
LiabilitiesUnpaid claims and claim adjustment expenses 7 68 412 63�575Liabilities for life and health policy benefits 3, 7 39 944 37�663Policyholder account balances 7 36 692 34�203Unearned premiums 6 528 8�100Funds held under reinsurance treaties 4 029 4�499Reinsurance balances payable 4 756 3�749Income taxes payable 608 671Deferred and other non-current taxes 928 1�988Short-term debt 6 8 105 6�325Accrued expenses and other liabilities 18 218 14�734Long-term debt 6 19 184 19�443Total�liabilities 207 404 194�950
EquityConvertible perpetual capital instrument 2 670 2�670Common stock, CHF 0.10 par value
2009: 370 701 168; 2010: 370 704 073 shares authorised and issued 35 35Additional paid-in capital 10 472 10�497Treasury shares, net of tax –1 477 –1�477
Accumulated other comprehensive income:Net unrealised investment gains/losses, net of tax –993 1�149Other-than-temporary impairment, net of tax –397 –130Cumulative translation adjustments, net of tax –3 560 –4�543Accumulated adjustment for pension and post-retirement benefits, net of tax –453 –442
Total accumulated other comprehensive income –5 403 –3�966
Retained earnings 19 047 19�758Shareholders’�equity 25 344 27�517
Non-controlling interests 0 1�403Total�equity 25 344 28�920
Total�liabilities�and�equity 232 748 223�870
1 The Group changed its reporting currency from CHF to USD. Please refer to Note 1.

16 Swiss�Re Second Quarter 2010
For the twelve months ended 31 December 2009 and the six months ended 30 June 2010
Statement of equity (unaudited)
USD millions 20091 2010
Convertible�perpetual�capital�instrumentBalance as of 1 January 0 2�670Issued 2 670Balance as of period end 2 670 2�670
Common�sharesBalance as of 1 January 34 35Issue of common shares 1Balance as of period end 35 35
Additional�paid-in�capitalBalance as of 1 January 10 125 10�472Issue of common shares2 311Convertible perpetual capital instrument issuance costs –9Share-based compensation –10 15Realised gains/losses on treasury shares 55 10Balance as of period end 10 472 10�497
Treasury�shares,�net�of�taxBalance as of 1 January –1 540 –1�477Cumulative effect of adoption of EITF 07-53 60Purchase of treasury shares –54 –41Sales of treasury shares 57 41Balance as of period end –1 477 –1�477
Net�unrealised�gains/losses,�net�of�taxBalance as of 1 January –2 262 –993Other changes during the period 1 269 2�177Cumulative effect of adoption of ASU No. 2009-175 –35Balance as of period end –993 1�149
Other-than-temporary�impairment,�net�of�taxBalance as of 1 January4 –263 –397Other changes during the period –134 267Balance as of period end –397 –130
Foreign�currency�translation,�net�of�taxBalance as of 1 January –4 709 –3�560Other changes during the period 1 149 –983Balance as of period end –3 560 –4�543
Adjustment�for�pension�and�other�post-retirement�benefits,�net�of�taxBalance as of 1 January –497 –453Change during the period 44 11Balance as of period end –453 –442
Retained�earningsBalance as of 1 January 18 069 19�047Net income after non-controlling interests 699 1�103Interest on convertible perpetual capital instrument –203 –133Dividends on common shares –30 –319Cumulative effect of adoption of FSP SFAS 115-24 334Cumulative effect of adoption of EITF 07-53 178Cumulative effect of adoption of ASU No. 2009-175 60Balance as of period end 19 047 19�758
Shareholders’�equity� 25 344 27�517Non-controlling�interests6
Balance as of 1 January 0 0Change during the period 1�303Income attributable to non-controlling interests 100Balance as of period end 0 1�403
Total�equity� 25 344 28�920

Statement�of�equity�(unaudited)
� Swiss�Re Second Quarter 2010 Report 17
1 The Group changed its reporting currency from CHF to USD.2 The balance represents the premium from the conversion of mandatory convertible bonds that matured in June 2009.3 The Group adopted a new accounting pronouncement, EITF 07-5, as of 1 January 2009, which resulted in a change in accounting principle for some types of instruments
and embedded features linked to Swiss Re’s own shares. The cumulative impact upon adoption resulted in a net increase in retained earnings of USD 178 million, a decrease in treasury shares of USD 60 million, an increase in other invested assets of USD 285 million and a tax income of USD 47 million.
4 Retained earnings as of 31 December 2008 were increased by USD 71 million to reflect the release of a valuation allowance against deferred tax assets associated with investment impairment losses.
5 The Group adopted a new accounting pronouncement, ASU No. 2009-17 (FAS167), an update to Topic 810 – Consolidation, as of 1 January 2010, which resulted in the full consolidation of certain VIEs. This resulted in a transition impact to retained earnings of USD 60 million and to net unrealised gains/losses of USD –35 million, and other balance sheet items. Please refer to note 12 for more details.
6 Non-controlling interests relate to a modified co-insurance treaty and the acquisition of the management company of private equity funds, resulting in the consolidation of all the investees’ assets and liabilities even though the Group does not own the majority of the equity.
The accompanying notes are an integral part of the Group financial statements.

18 Swiss�Re Second Quarter 2010
Statement of comprehensive income (unaudited)
The accompanying notes are an integral part of the Group financial statements.
Three months ended 30 June Six months ended 30 JuneUSD millions 2009 2010 2009 2010
Net income/loss before attribution of non-controlling interests1 –342 865 –212 1�070Other comprehensive income, net of tax:
Change in unrealised gains/losses 820 1�253 –222 2�142Change in other-than-temporary impairment –307 95 –960 267Change in foreign currency translation 759 –503 548 –983Change in adjustment for pension benefits –59 –2 –35 11
Total comprehensive income/loss before attribution of non-controlling interests 871 1�708 –881 2�507Comprehensive income/loss attributable to non-controlling interests –53 –100Total comprehensive income/loss attributable to common shareholders 871 1�655 –881 2�407
1 After interest on convertible perpetual capital instrument.

� Swiss�Re Second Quarter 2010 Report 19
Statement of cash flow (unaudited)
For the six months ended 30 June
Interest paid was USD 505 million and USD 635 million for the six months ended 30 June 2009 and 2010, respectively. Tax paid was USD 177 million and USD 219 million for the six months ended 30 June 2009 and 2010, respectively.
The accompanying notes are an integral part of the Group financial statements.
USD millions 2009 2010
Cash�flows�from�operating�activitiesNet income/loss attributable to common shareholders –212 970Add net income attributable to non-controlling interests 100
Adjustments to reconcile net income to net cash provided/used by operating activities:Depreciation, amortisation and other non-cash items 297 63Net realised investment gains/losses 2 292 –363Change in:
Technical provisions, net –2 620 274Funds held by ceding companies and other reinsurance balances –1 025 –953Reinsurance recoverable on unpaid claims and policy benefits –1 641 –1�579Other assets and liabilities, net –352 –1�917Income taxes payable/recoverable –281 –106Income from equity-accounted investees, net of dividends received 190 –186Trading positions, net –569 121Securities purchased/sold under agreement to resell/repurchase, net 669 1�490
Net�cash�provided/used�by�operating�activities –3 252 –2�086
Cash�flows�from�investing�activitiesFixed income securities:
Sales and maturities 104 350 81�333Purchases –94 476 –67�371Net purchase/sale/maturities of short-term investments –3 290 –6�197
Equity securities:Sales 184 26Purchases –18 1
Net purchases/sales/maturities of other investments 875 624Net�cash�provided/used�by�investing�activities 7 625 8�416
Cash�flows�from�financing�activitiesIssuance/repayment of long-term debt 2 791 1�276Issuance/repayment of short-term debt –2 071 –2�654Equity issued 1Proceeds from the issuance of convertible perpetual capital instrument, net of issuance cost 2 659Purchase/sale of treasury shares –9Interest on convertible perpetual capital instrument –55 –166Dividends paid to shareholders –30 –319Net�cash�provided/used�by�financing�activities 3 286 –1�863
Total�net�cash�provided/used 7 659 4�467Effect of foreign currency translation 538 –1�124Change�in�cash�and�cash�equivalents� 8 197 3�343Cash and cash equivalents as of 1 January 16 225 27�810Impact of adoption of ASU No. 2009-17 793Cash�and�cash�equivalents�as�of�30�June 24 422 31�946

20 Swiss�Re Second Quarter 2010
This page intentionally left blank

Swiss Re Second Quarter 2010 Report 21
Notes to the Group financial statements (unaudited)
1 Organisation and summary of significant accounting policies
Nature of operationsThe Swiss Re Group, which is headquartered in Zurich, Switzerland, comprises Swiss Reinsurance Company Ltd (the parent company, referred to as “Swiss Re Zurich”) and its subsidiaries (collectively, the “Swiss Re Group” or the “Group”). The Group provides reinsurance and other related products and services to insurance companies, direct clients and others worldwide through reinsurance brokers and a network of offices in over 20 countries.
Basis of presentationThe accompanying consolidated financial statements have been prepared in accordance with accounting principles generally accepted in the United States of America (US GAAP) and comply with Swiss law. All significant inter-company transactions and balances have been eliminated on consolidation.
From 1 January 2010, Swiss Re changed its presentation currency from Swiss francs (CHF) to US dollars (USD). US dollar is the currency in which a significant part of the reinsurance business of the Group is written and assets are invested in. Comparative periods have been retranslated at the closing rates for balance sheet items and at average rates for income statement items.
Following the acquisition of some private equity funds in the first quarter 2010, the Group presents interests attributable to non-controlling owners of its subsidiaries in its statement of equity as a separate component. The income attributable to the non-controlling interests is presented as a deduction from net income on the face of the income statement.
These interim financial statements should be read in conjunction with the Swiss Re Group’s financial statements for the year ended 31 December 2009.
Use of estimates in the preparation of financial statementsThe preparation of financial statements requires management to make significant estimates and assumptions that affect the reported amounts of assets, liabilities, revenues and expenses as well as the related disclosure including contingent assets and liabilities. The Swiss Re Group’s liabilities for unpaid claims and claim adjustment expenses and policy benefits for life and health include estimates for premium, claim and benefit data not received from ceding companies at the date of the financial statements. In addition, the Group uses certain financial instruments and invests in securities of certain entities for which exchange trading does not exist. The Group determines these estimates based on historical information, actuarial analyses, financial modelling, and other analytical techniques. Actual results could differ significantly from the estimates described above.
Valuation of financial assetsThe fair value of the majority of the Group’s financial instruments is based on quoted prices in active markets or observable inputs. These instruments include government and agency securities, commercial paper, most investment-grade corporate debt, most high-yield debt securities, exchange traded derivative instruments, most mortgage-backed and asset-backed securities and listed equity securities. In markets with reduced or no liquidity, spreads between bid and offer prices are normally wider compared to spreads in highly liquid markets. Such market conditions affect the valuation of certain asset classes of the Group, such as some asset-backed securities as well as certain derivative structures referencing such asset classes.
The Group considers both the credit risk of its counterparties, and own risk of non-performance in the valuation of certain financial instruments. In determining the fair value of the financial instruments, the assessment of the Group’s exposure to the credit risk of our counterparties incorporates consideration of existing collateral and netting arrangements entered into with each counterparty. The measure of the counter-party credit risk is estimated for derivative instruments and other over-the-counter financial assets with incorporation of the observable credit spreads, where available, or credit spread estimates derived based on the benchmarking techniques where market data is not available. The impact of the Group’s own risk of non-performance is analysed in the manner consistent with the aforementioned approach; with consideration of the Group’s observable credit spreads. The value representing such risk is incorporated into the fair value of the financial instruments (primarily derivatives), in a liability position as of the measurement date. The change in this adjustment from period to period is reflected in realised gains and losses in the income statement.

Notes to the Group financial statements (unaudited)
22 Swiss Re Second Quarter 2010 Report
There can also be differences between the market values implied by collateral requested by counterparties and the prices observed in the markets. The Group has not provided any collateral on financial instruments in excess of the market value estimate. For these assets or derivative structures, the Group uses market prices or inputs derived from market prices. A separate internal price verification process, independent of the trading function, provides an additional control over the market prices or market input used to determine the fair values of such assets. Whilst management considers that appropriate values have been ascribed to such assets, current market conditions increase the level of uncertainty and judgement over these valuations. Subsequent valuations could differ significantly from the results of the process described above. The Group may become aware of counterparty valuations, either directly through the exchange of information or indirectly, for example, through collateral demands. Any implied differences are considered in the independent price verification process and may result in adjustments to initially indicated valuations.
Subsequent eventsSubsequent events for the current reporting period have been evaluated up to 4 August 2010. This is the date on which the financial statements are available to be issued.
Recent accounting guidanceIn June 2009, the FASB issued “Improvements to Financial Reporting by Enterprises Involved with Variable Interest Entities (VIEs)” (ASU No. 2009-17), an update to Topic 810 – Consolidation. This ASU requires companies to assess VIEs under a new method for consolidation. The Group adopted this new standard as of 1 January 2010. Refer to Note 12 for further information.
Also in June 2009, the FASB issued “Accounting for Transfers of Financial Assets” (ASU No. 2009-16), an update to Topic 860 – Transfers and Servicing. This ASU requires additional disclosures about transfer of financial assets and continuing exposure to the risks related to transferred assets. It also changes the requirements for derecognising financial assets. The Group adopted this new standard as of 1 January 2010. The adoption did not have a material impact on the Group’s financial statements.
In January 2010, the FASB issued “Improving Disclosures about Fair Value Measurements” (ASU No. 2010-06), an update to Topic 820 – Fair Value Measurements and Disclosures. This new standard implements additional disclosure requirements for the three fair value levels. The requirements, which are applicable from 1 January 2010 on, are disclosed in Note 3.
Notes to the Group financial statements (unaudited)
Swiss Re Second Quarter 2010 Report 23
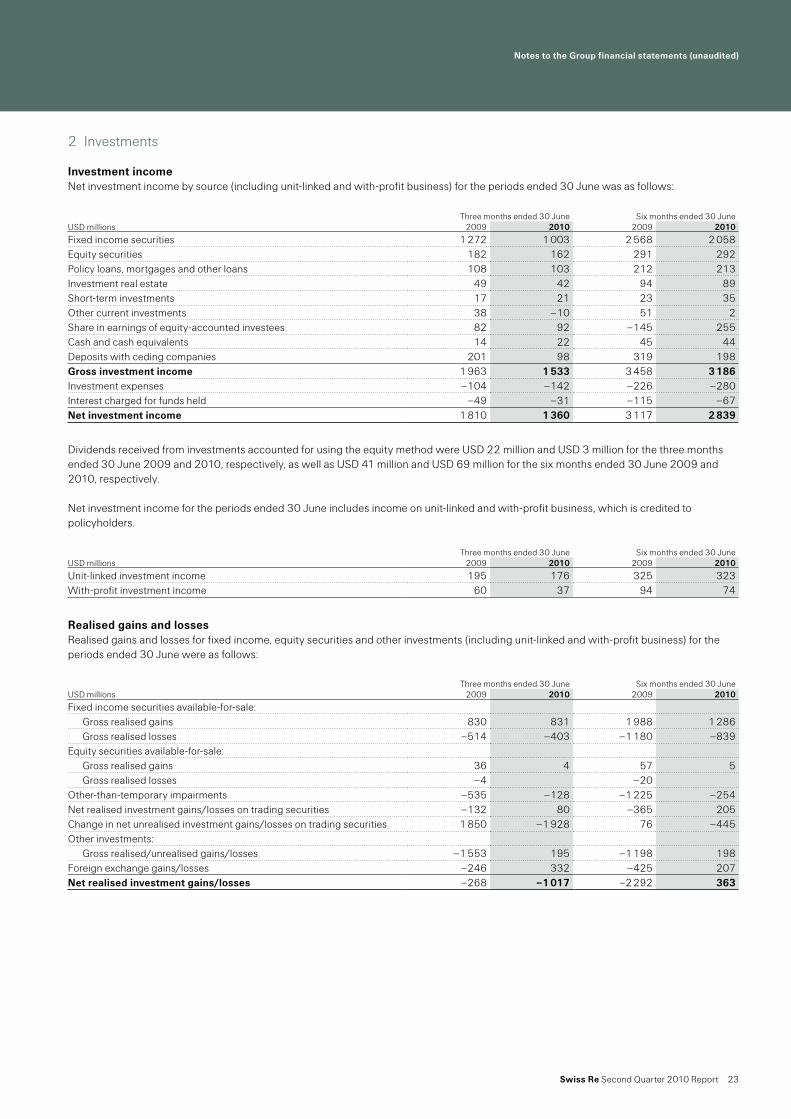
2 Investments
Investment incomeNet investment income by source (including unit-linked and with-profit business) for the periods ended 30 June was as follows:
Dividends received from investments accounted for using the equity method were USD 22 million and USD 3 million for the three months ended 30 June 2009 and 2010, respectively, as well as USD 41 million and USD 69 million for the six months ended 30 June 2009 and 2010, respectively.
Net investment income for the periods ended 30 June includes income on unit-linked and with-profit business, which is credited to policyholders.
Realised gains and lossesRealised gains and losses for fixed income, equity securities and other investments (including unit-linked and with-profit business) for the periods ended 30 June were as follows:
Three months ended 30 June Six months ended 30 JuneUSD millions 2009 2010 2009 2010
Fixed income securities 1 272 1 003 2 568 2 058Equity securities 182 162 291 292Policy loans, mortgages and other loans 108 103 212 213Investment real estate 49 42 94 89Short-term investments 17 21 23 35Other current investments 38 –10 51 2Share in earnings of equity-accounted investees 82 92 –145 255Cash and cash equivalents 14 22 45 44Deposits with ceding companies 201 98 319 198Gross investment income 1 963 1 533 3 458 3 186Investment expenses –104 –142 –226 –280Interest charged for funds held –49 –31 –115 –67Net investment income 1 810 1 360 3 117 2 839
Three months ended 30 June Six months ended 30 JuneUSD millions 2009 2010 2009 2010
Unit-linked investment income 195 176 325 323With-profit investment income 60 37 94 74
Three months ended 30 June Six months ended 30 JuneUSD millions 2009 2010 2009 2010
Fixed income securities available-for-sale:Gross realised gains 830 831 1 988 1 286Gross realised losses –514 –403 –1 180 –839
Equity securities available-for-sale:Gross realised gains 36 4 57 5Gross realised losses –4 –20
Other-than-temporary impairments –535 –128 –1 225 –254Net realised investment gains/losses on trading securities –132 80 –365 205Change in net unrealised investment gains/losses on trading securities 1 850 –1 928 76 –445Other investments:
Gross realised/unrealised gains/losses –1 553 195 –1 198 198Foreign exchange gains/losses –246 332 –425 207Net realised investment gains/losses –268 –1 017 –2 292 363

Notes to the Group financial statements (unaudited)
24 Swiss Re Second Quarter 2010 Report
Proceeds from sales of fixed income securities available for sale amounted to USD 55 912 million and USD 38 194 million for the three months ended 30 June 2009 and 2010, respectively, and USD 97 769 million and USD 75 222 million for the six months ended 30 June 2009 and 2010, respectively. Sales of equity securities available for sale were USD 115 million and USD 20 million for the three months ended 30 June 2009 and 2010, respectively, and USD 194 million and USD 26 million for the six months ended 30 June 2009 and 2010, respectively.
Net realised investment gains/losses for the periods ended 30 June include income on unit-linked and with-profit business, which is credited to policyholders.
Impairment on fixed income securities relating to credit lossesOther-than-temporary impairments for debt securities are bifurcated between credit and non-credit components, with the credit component recognised through earnings and the non-credit component recognised in other comprehensive income. The credit component of other-than-temporary impairments is defined as the difference between a security’s amortised cost basis and expected cash flows. Methodologies for measuring the credit component of impairment are aligned to market observer forecasts of credit performance drivers which management believes are representative of median market expectations.
For securitised products, cash flow projection analysis is conducted integrating forward-looking evaluation of collateral performance drivers, including default rates, prepayment rates and loss severities, and deal-level features, such as credit enhancement and prioritisation among tranches for payments of principal and interest. Analytics are differentiated by asset class, product type and security-level differences in historical and expected performance. For corporate bonds and similar hybrid debt instruments, an expected loss approach based on default probabilities and loss severities expected in the current and forecast economic environment is used for securities identified as credit-impaired to project probability-weighted cash flows. Expected cash flows resulting from these analyses are discounted, and net present value is compared to the amortised cost basis to determine the credit component of other-than-temporary impairments.
A reconciliation of the other-than-temporary impairment related to credit losses recognised in earnings for the six months ended 30 June was as follows:
Three months ended 30 June Six months ended 30 JuneUSD millions 2009 2010 2009 2010
Unit-linked realised gains/losses 1 131 –1 926 –298 –671With-profit realised gains/losses 132 –83 –58 20
USD millions 2009 2010
Balance as of 1 January 551 1 409Credit losses for which an other-than-temporary impairment was not previously recognised 592 108Reductions for securities sold during the period –153 –482Increase of credit losses for which an other-than-temporary impairment has been recognised previously, when the Group does not intend to sell, or more likely than not will not be required to sell before recovery 280 71Impact of increase in cash flows expected to be collected –17 –22Impact of foreign exchange movements 9 –61
Balance as of 30 June 1 262 1 023

Notes to the Group financial statements (unaudited)
Swiss Re Second Quarter 2010 Report 25
Investments available-for-saleAmortised cost or cost, estimated fair values and other-than-temporary impairments of fixed income securities classified as available-for-sale as of 31 December 2009 and 30 June 2010 were as follows:
Other-than-temporary impairments recognised in other comprehensive income column only include securities with a credit related loss recognised in earnings. Subsequent recovery in fair value of securities previously impaired in other comprehensive income is presented in the other-than-temporary impairments column.
2010USD millions
Amortised cost or cost
Gross unrealised
gains
Grossunrealised
losses
Other-than-temporary impairment
recognised in other comprehensive
incomeEstimated fair value
Debt securities issued by governments and government agencies:
US Treasury and other US government corporations and agencies 18 171 815 –167 18 819States of the United States and political subdivisions of the states 172 5 –3 174United Kingdom 10 683 333 –162 10 854Canada 2 594 313 –15 2 892Germany 2 482 90 –13 2 559France 1 912 86 –28 1 970Other 4 046 306 –104 4 248
Total 40 060 1 948 –492 41 516Corporate debt securities 17 446 1 501 –252 –11 18 684Residential mortgage-backed securities 5 055 181 –449 –148 4 639Commercial mortgage-backed securities 4 675 98 –369 –26 4 378Agency securitised products 2 670 164 –7 2 827Other asset-backed securities 2 773 88 –115 –10 2 736Fixed income securities available-for-sale 72 679 3 980 –1 684 –195 74 780Equity securities available-for-sale 359 167 –32 494
2009USD millions
Amortised cost or cost
Gross unrealised
gains
Grossunrealised
losses
Other-than-temporary impairment
recognised in other comprehensive
incomeEstimated fair value
Debt securities issued by governments and government agencies:
US Treasury and other US government corporations and agencies 25 951 263 –933 25 281States of the United States and political subdivisions of the states 57 2 –4 55United Kingdom 11 833 276 –476 11 633Canada 2 300 232 –70 2 462Germany 2 911 23 –20 2 914France 2 211 24 –12 2 223Other 5 909 209 –136 5 982
Total 51 172 1 029 –1 651 50 550Corporate debt securities 17 419 1 107 –383 –24 18 119Residential mortgage-backed securities 5 677 115 –713 –359 4 720Commercial mortgage-backed securities 6 281 49 –871 –119 5 340Agency securitised products 4 197 162 –7 –8 4 344Other asset-backed securities 4 285 106 –190 –92 4 109Fixed income securities available-for-sale 89 031 2 568 –3 815 –602 87 182Equity securities available-for-sale 392 188 –26 554
Notes to the Group financial statements (unaudited)
26 Swiss Re Second Quarter 2010 Report
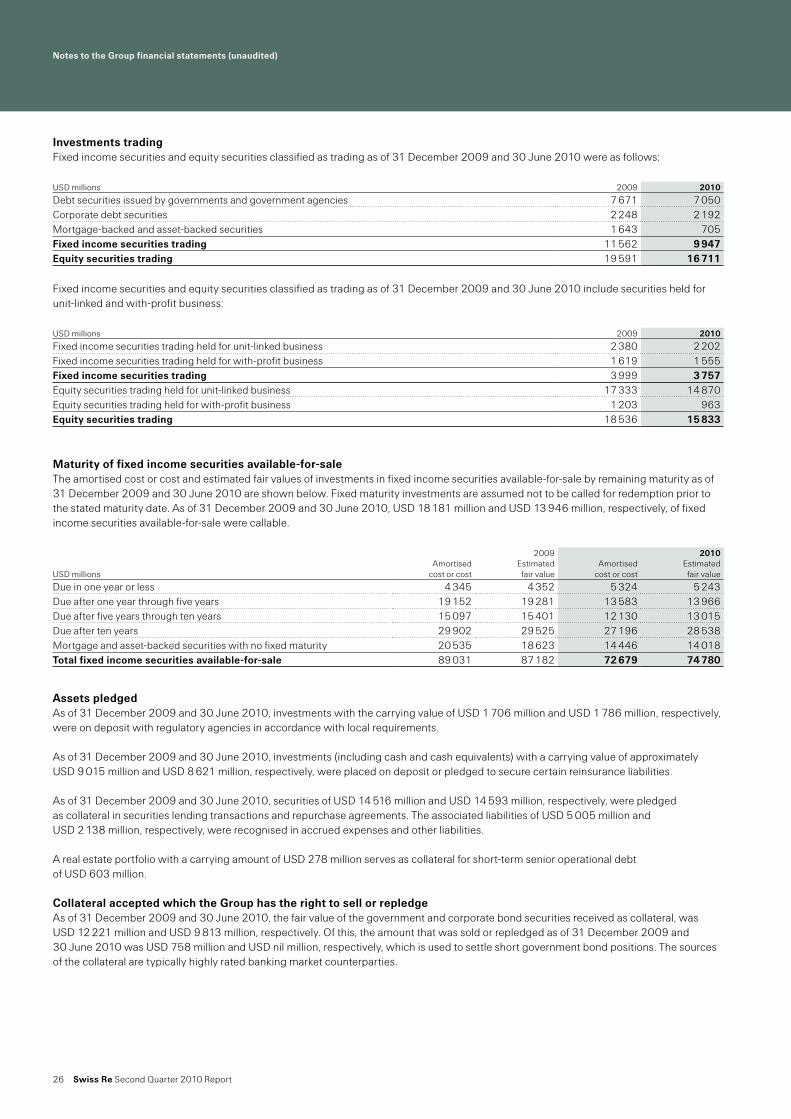
Investments tradingFixed income securities and equity securities classified as trading as of 31 December 2009 and 30 June 2010 were as follows:
Fixed income securities and equity securities classified as trading as of 31 December 2009 and 30 June 2010 include securities held for unit-linked and with-profit business:
Maturity of fixed income securities available-for-saleThe amortised cost or cost and estimated fair values of investments in fixed income securities available-for-sale by remaining maturity as of 31 December 2009 and 30 June 2010 are shown below. Fixed maturity investments are assumed not to be called for redemption prior to the stated maturity date. As of 31 December 2009 and 30 June 2010, USD 18 181 million and USD 13 946 million, respectively, of fixed income securities available-for-sale were callable.
Assets pledgedAs of 31 December 2009 and 30 June 2010, investments with the carrying value of USD 1 706 million and USD 1 786 million, respectively, were on deposit with regulatory agencies in accordance with local requirements.
As of 31 December 2009 and 30 June 2010, investments (including cash and cash equivalents) with a carrying value of approximately USD 9 015 million and USD 8 621 million, respectively, were placed on deposit or pledged to secure certain reinsurance liabilities.
As of 31 December 2009 and 30 June 2010, securities of USD 14 516 million and USD 14 593 million, respectively, were pledged as collateral in securities lending transactions and repurchase agreements. The associated liabilities of USD 5 005 million and USD 2 138 million, respectively, were recognised in accrued expenses and other liabilities.
A real estate portfolio with a carrying amount of USD 278 million serves as collateral for short-term senior operational debt of USD 603 million.
Collateral accepted which the Group has the right to sell or repledgeAs of 31 December 2009 and 30 June 2010, the fair value of the government and corporate bond securities received as collateral, was USD 12 221 million and USD 9 813 million, respectively. Of this, the amount that was sold or repledged as of 31 December 2009 and 30 June 2010 was USD 758 million and USD nil million, respectively, which is used to settle short government bond positions. The sources of the collateral are typically highly rated banking market counterparties.
USD millions 2009 2010
Debt securities issued by governments and government agencies 7 671 7 050Corporate debt securities 2 248 2 192Mortgage-backed and asset-backed securities 1 643 705Fixed income securities trading 11 562 9 947Equity securities trading 19 591 16 711
USD millions 2009 2010
Fixed income securities trading held for unit-linked business 2 380 2 202Fixed income securities trading held for with-profit business 1 619 1 555Fixed income securities trading 3 999 3 757Equity securities trading held for unit-linked business 17 333 14 870Equity securities trading held for with-profit business 1 203 963Equity securities trading 18 536 15 833
2009 2010
USD millionsAmortised
cost or costEstimated
fair valueAmortised
cost or costEstimated
fair value
Due in one year or less 4 345 4 352 5 324 5 243Due after one year through five years 19 152 19 281 13 583 13 966Due after five years through ten years 15 097 15 401 12 130 13 015Due after ten years 29 902 29 525 27 196 28 538Mortgage and asset-backed securities with no fixed maturity 20 535 18 623 14 446 14 018Total fixed income securities available-for-sale 89 031 87 182 72 679 74 780

Notes to the Group financial statements (unaudited)
Swiss Re Second Quarter 2010 Report 27
Unrealised losses on securities available-for-saleThe following table shows the fair value and unrealised losses of the Group’s fixed income securities, aggregated by investment category and length of time that individual securities were in a continuous unrealised loss position as of 31 December 2009 and 30 June 2010. As of 31 December 2009 and 30 June 2010, USD 15 million and USD 32 million, respectively, of the gross unrealised loss on equity securities available-for-sale relates to declines in value for less than 12 months and USD 11 million and USD nil million, respectively, to declines in value for more than 12 months.
As of 31 December 2009 Less than 12 months 12 months or more TotalUSD millions Fair value Unrealised losses Fair value Unrealised losses Fair value Unrealised losses
Debt securities issued by governments and government agencies:
US Treasury and other US government corporations and agencies 17 622 933 129 17 751 933States of the United States and political subdivisions of the states 26 1 16 3 42 4United Kingdom 6 396 395 700 81 7 096 476Canada 944 70 64 1 008 70Germany 1 291 20 1 291 20France 769 12 769 12Other 2 166 132 53 4 2 219 136
Total 29 214 1 563 962 88 30 176 1 651Corporate debt 3 529 294 1 015 113 4 544 407Residential mortgage-backed securities 2 727 795 1 244 277 3 971 1 072Commercial mortgage-backed securities 3 281 640 1 365 350 4 646 990Agency securitised products 416 12 113 3 529 15Other asset-backed securities 1 780 246 212 36 1 992 282Total 40 947 3 550 4 911 867 45 858 4 417
As of 30 June 2010 Less than 12 months 12 months or more TotalUSD millions Fair value Unrealised losses Fair value Unrealised losses Fair value Unrealised losses
Debt securities issued by governments and government agencies:
US Treasury and other US government corporations and agencies 1 768 167 1 768 167States of the United States and political subdivisions of the states 60 3 60 3United Kingdom 1 934 153 29 9 1 963 162Canada 191 10 5 191 15Germany 201 13 201 13France 281 28 281 28Other 899 104 899 104
Total 5 334 478 29 14 5 363 492Corporate debt 2 811 261 76 2 2 887 263Residential mortgage-backed securities 3 521 597 3 521 597Commercial mortgage-backed securities 2 180 395 2 180 395Agency securitised products 53 7 53 7Other asset-backed securities 1 193 125 1 193 125Total 15 092 1 863 105 16 15 197 1 879
Notes to the Group financial statements (unaudited)
28 Swiss Re Second Quarter 2010 Report
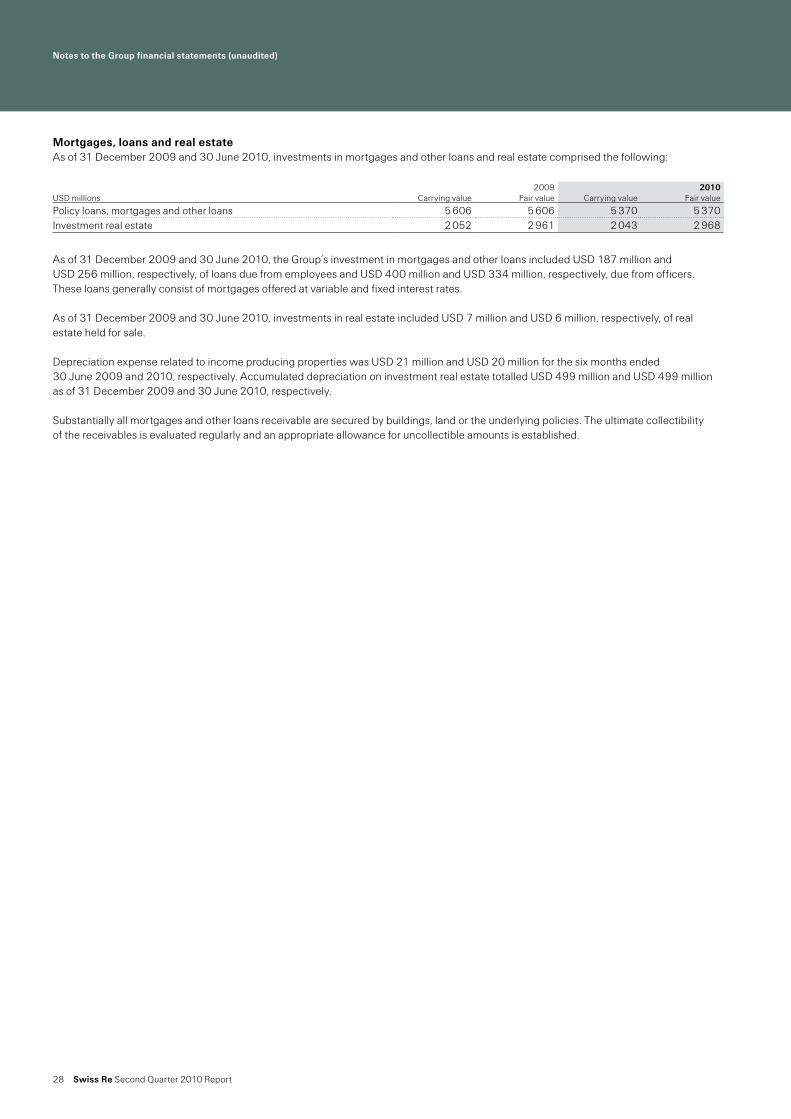
Mortgages, loans and real estateAs of 31 December 2009 and 30 June 2010, investments in mortgages and other loans and real estate comprised the following:
As of 31 December 2009 and 30 June 2010, the Group’s investment in mortgages and other loans included USD 187 million and USD 256 million, respectively, of loans due from employees and USD 400 million and USD 334 million, respectively, due from officers. These loans generally consist of mortgages offered at variable and fixed interest rates.
As of 31 December 2009 and 30 June 2010, investments in real estate included USD 7 million and USD 6 million, respectively, of real estate held for sale.
Depreciation expense related to income producing properties was USD 21 million and USD 20 million for the six months ended 30 June 2009 and 2010, respectively. Accumulated depreciation on investment real estate totalled USD 499 million and USD 499 million as of 31 December 2009 and 30 June 2010, respectively.
Substantially all mortgages and other loans receivable are secured by buildings, land or the underlying policies. The ultimate collectibility of the receivables is evaluated regularly and an appropriate allowance for uncollectible amounts is established.
2009 2010USD millions Carrying value Fair value Carrying value Fair value
Policy loans, mortgages and other loans 5 606 5 606 5 370 5 370Investment real estate 2 052 2 961 2 043 2 968
Notes to the Group financial statements (unaudited)
Swiss Re Second Quarter 2010 Report 29
3 Fair value disclosures
Fair value, as defined by the Fair Value Measurements and Disclosures Topic, is the price that would be received to sell an asset or paid to transfer a liability in an orderly transaction between market participants at the measurement date.
The Fair Value Measurements and Disclosures Topic requires all assets and liabilities that are measured at fair value to be categorised within the fair value hierarchy. This three-level hierarchy is based on the observability of the inputs used in the fair value measurement. The levels of the fair value hierarchy are defined as follows:
Level 1 inputs are quoted prices in active markets for identical assets or liabilities that the Group has the ability to access. Level 1 inputs are the most persuasive evidence of fair value and are to be used whenever possible.
Level 2 inputs are market based inputs that are directly or indirectly observable but not considered level 1 quoted prices. Level 2 inputs consist of (i) quoted prices for similar assets or liabilities in active markets; (ii) quoted prices for identical assets or liabilities in non-active markets (e.g. markets which have few transactions and where prices are not current or price quotations vary substantially); (iii) inputs other than quoted prices that are observable (e.g. interest rates, yield curves, volatilities, prepayment speeds, credit risks and default rates); and (iv) inputs derived from, or corroborated by, observable market data.
Level 3 inputs are unobservable inputs. These inputs reflect the Group’s own assumptions about market pricing using the best internal and external information available.
The types of instruments valued, based on quoted market prices in active markets, include most US government and sovereign obligations, active listed equities and most money market securities. Such instruments are generally classified within level 1 of the fair value hierarchy. The Group does not adjust the quoted price for such instruments, even in situations where it holds a large position and a sale could reasonably impact the quoted price.
The types of instruments that trade in markets that are not considered to be active, but are valued based on quoted market prices, broker or dealer quotations, or alternative pricing sources with reasonable levels of price transparency include most government agency securities, investment-grade corporate bonds, certain mortgage- and asset-backed products, less liquid listed equities, and state, municipal and provincial obligations. Such instruments are generally classified within level 2 of the fair value hierarchy.
Exchange-traded derivative instruments typically fall within level 1 or level 2 of the fair value hierarchy depending on whether they are considered to be actively traded or not.
Certain financial instruments are classified within level 3 of the fair value hierarchy, because they trade infrequently and therefore have little or no price transparency. Such instruments include private equity, less liquid corporate debt securities and certain asset-backed securities. Certain over-the-counter derivatives trade in less liquid markets with limited pricing information, and the determination of fair value for these derivatives is inherently more difficult. Such instruments are classified within level 3 of the fair value hierarchy. Pursuant to the election of the fair value option, the Group classifies certain Life & Health policy reserves to level 3 of the fair value hierarchy. When appropriate, valuations are adjusted for various factors such as liquidity, bid/offer spreads and credit considerations. Such adjustments are generally based on available market evidence. In the absence of such evidence, management’s best estimate is used.
Notes to the Group financial statements (unaudited)
30 Swiss Re Second Quarter 2010 Report
The fair values of assets are adjusted to incorporate the counterparty risk of non-performance. Similarly, the fair values of liabilities reflect the risk of non-performance of the Group, captured by the Group’s credit spread. These valuation adjustments from assets and liabilities measured at fair value using significant unobservable inputs are recognised in net realised gains and losses. In the second quarter of 2010, these adjustments were non-material. Whenever the underlying assets or liabilities are reported in a specific business segment, the valuation adjustment is allocated accordingly. Valuation adjustments not attributable to any business segment are reported in Group items.
In certain situations, the Group uses inputs to measure the fair value of asset or liability positions that fall into different levels of the fair value hierarchy. In these situations, the Group will determine the level in which the fair value falls based upon the lowest level input that is significant to the determination of the fair value.
Valuation techniquesUS government securities typically have quoted market prices in active markets and are categorised as level 1 instruments in the fair value hierarchy. Non-US government holdings are generally classified as level 2 instruments and are valued on the basis of the quotes provided by pricing services, which are subject to the Group’s pricing validation reviews and pricing vendor challenge process. Valuations provided by pricing vendors are generally based on the actual trade information as substantially all of the Group’s non-US government holdings are traded in a transparent and liquid market.
Corporate debt securities mainly include US and European investment grade positions, which are priced on the basis of quotes provided by third-party pricing vendors and first utilise valuation inputs from actively traded securities, such as bid prices, bid spreads to Treasury securities, Treasury curves, and same or comparable issuer curves and spreads. Issuer spreads are determined from actual quotes and traded prices and incorporate considerations of credit/default, sector composition, and liquidity and call features. Where market data is not available valuations are developed based on the modelling techniques that utilise observable inputs and option adjusted spreads and incorporate considerations of the security’s seniority, maturity and the issuer’s corporate structure.
Values of residential mortgage-backed securities (RMBS), commercial mortgage-backed securities (CMBS) and other asset-backed securities (Other ABS) are obtained both from third-party pricing vendors and through quoted prices, some of which may be based on the prices of comparable securities with similar structural and collateral features. Values of certain ABS for which there are no significant observable inputs are developed using benchmarks to similar transactions or indices. For both CMBS and RMBS, cash flows are derived based on the transaction-specific information which incorporates priority in the capital structure and are generally adjusted to reflect benchmark yields, market prepayment data, collateral performance (default rates and loss severity) for specific vintage and geography, credit enhancements, and ratings. For certain RMBS and CMBS with low levels of market liquidity, judgments may be required to determine comparable securities based on the loan type and deal-specific performance. CMBS terms may also incorporate lock-out periods that restrict borrowers from prepaying the loans or provide disincentives to prepay and therefore reduce prepayment risk of these securities, as compared to RMBS. The factors specifically considered in valuation of CMBS include borrower-specific statistics in a specific region, such as debt service coverage and loan-to-value ratios, as well as the type of commercial property.
Notes to the Group financial statements (unaudited)
Swiss Re Second Quarter 2010 Report 31
The category Other ABS primarily includes debt securitised by credit card, student loan and auto loan receivables. Pricing inputs for these securities also focus on capturing, where relevant, collateral quality and performance, payment patterns, and delinquencies.
The Group uses third-party pricing vendor data to value agency securitised products, which mainly include collateralised mortgage obligations (CMOs) and MBS government agency securities. The valuations generally utilise observable inputs consistent with those noted above for RMBS and CMBS.
Equity securities held by the Group for proprietary investment purposes are mainly classified in levels 1 and 2. Securities classified in level 1 are traded on public stock exchanges for which quoted prices are readily available. Level 2 equities include equity investments fair valued pursuant to the fair value option election and certain hedge fund positions; all valued based on primarily observable inputs.
The category Other assets mainly includes the Group’s private equity and hedge fund investments which are made directly or via ownership of funds. Substantially all these investments are classified as level 3 due to the lack of observable prices and significant judgment required in valuation. Valuation of direct private equity investments requires significant management judgment due to the absence of quoted market prices and the lack of liquidity. Initial valuation is based on the acquisition cost, and is further refined based on the available market information for the public companies that are considered comparable to the Group’s holdings in the private companies being valued, and the private company-specific performance indicators; both historic and projected. Subsequent valuations also reflect business or asset appraisals, as well as market transaction data for private and public benchmark companies and the actual companies being valued, such as financing rounds and merger and acquisitions activity. The Group’s holdings in the private equity and hedge funds are generally valued utilising net asset values (NAV), subject to adjustments, as deemed necessary, for restrictions on redemption (lock-up periods and amount limitations on redemptions).
The Group holds both exchange traded and over-the-counter (OTC) interest rate, foreign exchange, credit and equity derivative contracts for hedging and trading purposes. The fair values of exchange-traded derivatives measured using observable exchange prices are classified in level 1. Long-dated contracts may require adjustments to the exchange traded prices which would trigger reclassification to level 2 in the fair value hierarchy. OTC derivatives are generally valued by the Group based on the internal models, which are consistent with industry standards and practices, and use both observable (dealer, broker or market consensus prices, spot and forward rates, interest rate and credit curves and volatility indices) and unobservable inputs (adjustments for liquidity, inputs derived from the observable data based on the Group’s judgments and assumptions).
Notes to the Group financial statements (unaudited)
32 Swiss Re Second Quarter 2010 Report
The Group’s OTC interest rate derivatives primarily include interest rate swaps, futures, options, caps and floors, and are valued based on the cash flow discounting models which generally utilise as inputs observable market yield curves and volatility assumptions.
The Group’s OTC foreign exchange derivatives primarily include forward, spot and option contracts and are generally valued based on the cash flow discounting models utilising as main inputs observable foreign exchange forward curves.
The Group’s investments in equity derivatives primarily include OTC equity option contracts on single or baskets of market indices and equity options on individual or baskets of equity securities, which are valued using internally developed models (such as Black Scholes option pricing model, various simulation models) calibrated with the inputs, which include underlying spot prices, dividend curves, volatility surfaces, yield curves, and correlations between underlying assets.
The Group’s OTC credit derivatives include index and single name credit default swaps, as well as more complex structured credit derivatives. “Plain vanilla” credit derivatives, such as index and single-name credit default swaps, are valued by the Group based on the models consistent with the industry valuation standards for these credit contracts, and primarily utilising observable inputs published by market data sources, such as credit spreads and recovery rates. These valuation techniques warrant classification of “plain vanilla” OTC derivatives as level 2 financial instruments in the fair value hierarchy.
The Group also holds complex structured credit contracts, such as collateralised debt securities (CDS) referencing MBS, certain types of CDO transactions, and the products sensitive to correlation between two or more underlying parameters (CDO-squared); all of which are classified within level 3 of the fair value hierarchy. A CDO is a debt instrument collateralised by various debt obligations, including bonds, loans and CDS of differing credit profiles. In a CDO-squared transaction both the primary instrument and the underlying instruments are represented by CDOs. Generally, for CDO and CDO-squared transactions the observable inputs such as CDS spreads and recovery rates are modified to adjust for correlation between the underlying debt instruments. The correlation levels are modelled at the portfolio level and calibrated at a transaction level to liquid benchmark rates.
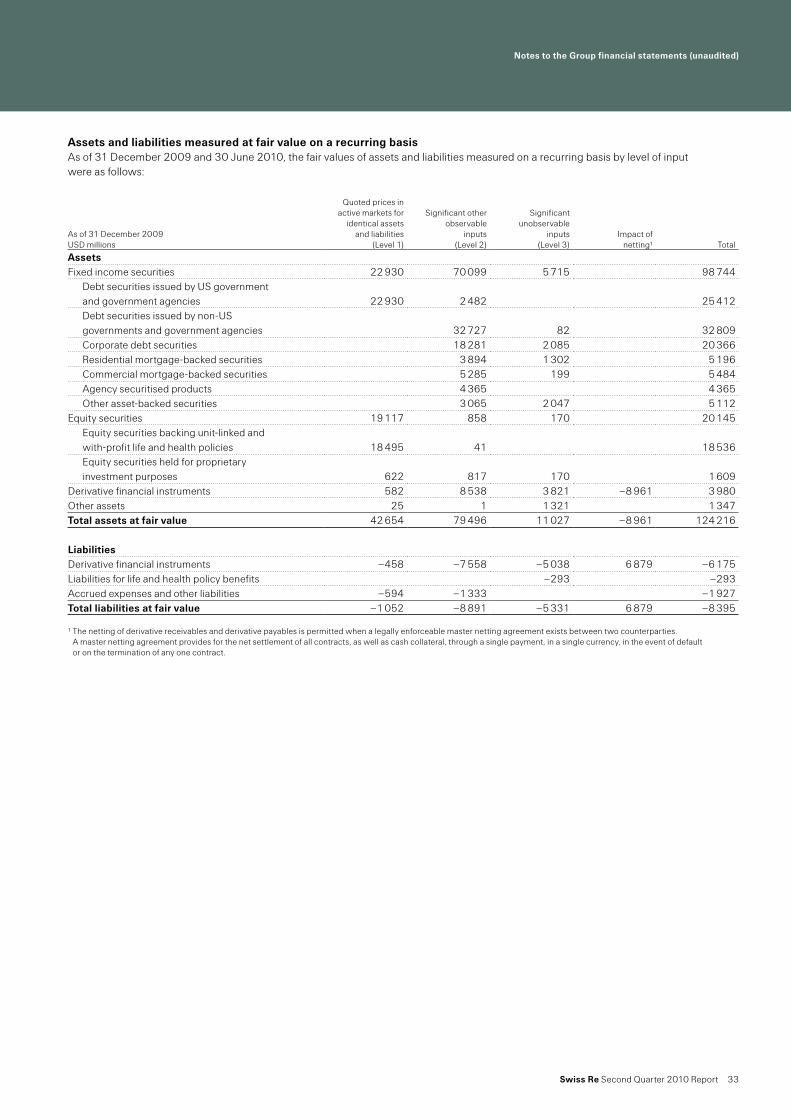
Notes to the Group financial statements (unaudited)
Swiss Re Second Quarter 2010 Report 33
Assets and liabilities measured at fair value on a recurring basisAs of 31 December 2009 and 30 June 2010, the fair values of assets and liabilities measured on a recurring basis by level of input were as follows:
As of 31 December 2009USD millions
Quoted prices in active markets for
identical assetsand liabilities
(Level 1)
Significant otherobservable
inputs (Level 2)
Significant unobservable
inputs (Level 3)
Impact of netting1 Total
AssetsFixed income securities 22 930 70 099 5 715 98 744
Debt securities issued by US government and government agencies 22 930 2 482 25 412Debt securities issued by non-US governments and government agencies 32 727 82 32 809Corporate debt securities 18 281 2 085 20 366Residential mortgage-backed securities 3 894 1 302 5 196Commercial mortgage-backed securities 5 285 199 5 484Agency securitised products 4 365 4 365Other asset-backed securities 3 065 2 047 5 112
Equity securities 19 117 858 170 20 145Equity securities backing unit-linked and with-profit life and health policies 18 495 41 18 536Equity securities held for proprietary investment purposes 622 817 170 1 609
Derivative financial instruments 582 8 538 3 821 –8 961 3 980Other assets 25 1 1 321 1 347Total assets at fair value 42 654 79 496 11 027 –8 961 124 216
LiabilitiesDerivative financial instruments –458 –7 558 –5 038 6 879 –6 175Liabilities for life and health policy benefits –293 –293Accrued expenses and other liabilities –594 –1 333 –1 927Total liabilities at fair value –1 052 –8 891 –5 331 6 879 –8 395
1 The netting of derivative receivables and derivative payables is permitted when a legally enforceable master netting agreement exists between two counterparties. A master netting agreement provides for the net settlement of all contracts, as well as cash collateral, through a single payment, in a single currency, in the event of default or on the termination of any one contract.
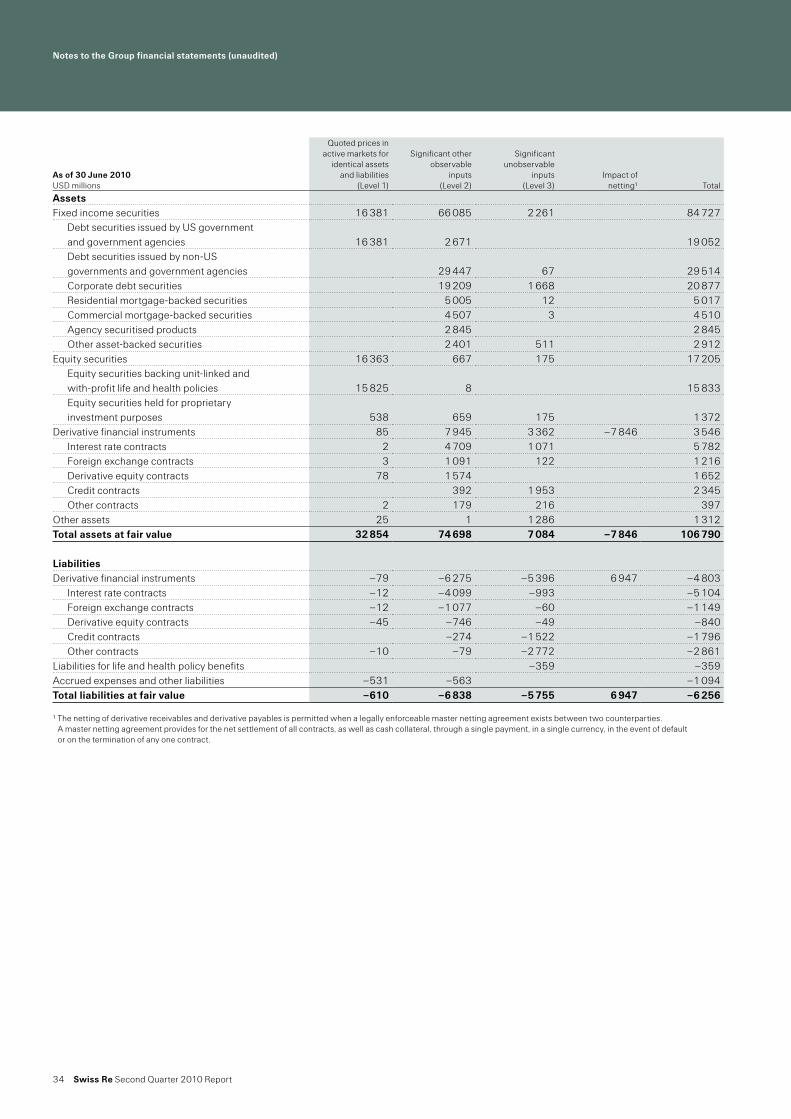
Notes to the Group financial statements (unaudited)
34 Swiss Re Second Quarter 2010 Report
As of 30 June 2010USD millions
Quoted prices inactive markets for
identical assetsand liabilities
(Level 1)
Significant otherobservable
inputs(Level 2)
Significant unobservable
inputs (Level 3)
Impact of netting1 Total
AssetsFixed income securities 16 381 66 085 2 261 84 727
Debt securities issued by US government and government agencies 16 381 2 671 19 052Debt securities issued by non-US governments and government agencies 29 447 67 29 514Corporate debt securities 19 209 1 668 20 877Residential mortgage-backed securities 5 005 12 5 017Commercial mortgage-backed securities 4 507 3 4 510Agency securitised products 2 845 2 845Other asset-backed securities 2 401 511 2 912
Equity securities 16 363 667 175 17 205Equity securities backing unit-linked and with-profit life and health policies 15 825 8 15 833Equity securities held for proprietary investment purposes 538 659 175 1 372
Derivative financial instruments 85 7 945 3 362 –7 846 3 546Interest rate contracts 2 4 709 1 071 5 782Foreign exchange contracts 3 1 091 122 1 216Derivative equity contracts 78 1 574 1 652Credit contracts 392 1 953 2 345Other contracts 2 179 216 397
Other assets 25 1 1 286 1 312Total assets at fair value 32 854 74 698 7 084 –7 846 106 790
LiabilitiesDerivative financial instruments –79 –6 275 –5 396 6 947 –4 803
Interest rate contracts –12 –4 099 –993 –5 104Foreign exchange contracts –12 –1 077 –60 –1 149Derivative equity contracts –45 –746 –49 –840Credit contracts –274 –1 522 –1 796Other contracts –10 –79 –2 772 –2 861
Liabilities for life and health policy benefits –359 –359Accrued expenses and other liabilities –531 –563 –1 094Total liabilities at fair value –610 –6 838 –5 755 6 947 –6 256
1 The netting of derivative receivables and derivative payables is permitted when a legally enforceable master netting agreement exists between two counterparties. A master netting agreement provides for the net settlement of all contracts, as well as cash collateral, through a single payment, in a single currency, in the event of default or on the termination of any one contract.

Notes to the Group financial statements (unaudited)
Swiss Re Second Quarter 2010 Report 35
Assets and liabilities measured at fair value on a recurring basis using significant unobservable inputs (level 3)As of 31 December 2009 and 30 June 2010, the reconciliation of the fair values of assets and liabilities measured on a recurring basis using significant unobservable inputs were as follows:
2009USD millions
Debt securitiesissued by non-
US governments and government
agencies
Corporatedebt
securities
Residential mortgage-
backedsecurities
Commercial mortgage-
backedsecurities
Agencysecuritised
products
Otherasset-backed
securities
Equity securitiesheld for
proprietaryinvestment
purposes
Derivativefinancial
instrumentsOther
assets Total
AssetsBalance as of 1 January 2009 144 6 084 1 687 458 0 2 451 207 13 422 1 484 25 937
Realised/unrealised gains/losses:
Included in net income –10 290 –206 –23 –7 77 111 –10 673 –200 –10 641Included in other comprehensive income –15 293 181 16 –3 189 –25 39 675
Purchases, issuances, and settlements –35 –1 035 163 –69 23 –885 –188 1 662 8 –356Transfers in and/or out of level 3 –59 –3 482 –965 –245 –13 497 81 –641 –59 –4 886Impact of foreign exchange movements 57 –65 442 62 –282 –16 51 49 298
Closing balance as of 31 December 2009 82 2 085 1 302 199 0 2 047 170 3 821 1 321 11 027
Liabilities for life and health
policy benefits
Derivativefinancial
instruments Total
LiabilitiesBalance as of 1 January 2009 –464 –16 833 –17 297
Realised/unrealised gains/losses:
Included in net income 172 10 699 10 871Included in other comprehensive income
Purchases, issuances, and settlements 237 237Transfers in and/or out of level 3 877 877Impact of foreign exchange movements –1 –18 –19
Closing balance as of 31 December 2009 –293 –5 038 –5 331

Notes to the Group financial statements (unaudited)
36 Swiss Re Second Quarter 2010 Report
2010USD millions
Debt securitiesissued by non-US governments and
government agenciesCorporate debt
securities
Residential mortgage-backed
securities
Commercial mortgage-backed
securities Other asset-backed
securities
Equity securities heldfor proprietary
investment purposesDerivative interest
rate contractsDerivative foreign
exchange contractsDerivative equity
contractsDerivative credit
contractsOther derivative
contracts Other assets Total
AssetsBalance as of 1 January 2010 82 2 085 1 302 199 2 047 170 1 162 3 57 2 316 283 1 321 11 027Cumulative effect of adoption of ASU No. 2009-17 –84 –84
Realised/unrealised gains/losses:Included in net income –12 –3 –73 –2 254 25 16 –219 14 –44 –44Included in other comprehensive income 9 92 28 2 50 –1 26 206
Purchases, issuances, and settlements –20 –128 –73 –4 –1 131 14 –288 40 –83 –145 –16 58 –1 776Transfers into level 31 102 71 61 11 28 55 10 2 49 389Transfers out of level 31 –99 –368 -1 2982 –205 –313 –1 –57 –1 –49 –91 –2 482Impact of foreign exchange movements –7 –72 –5 –13 –5 1 –18 –33 –152
Closing balance as of 30 June 2010 67 1 668 12 3 511 175 1 071 122 0 1 953 216 1 286 7 084
Liabilities for life andhealth policy benefits
Derivative interest rate contracts
Derivative foreign exchange contracts
Derivative equity contracts
Derivative credit contracts
Other derivative contracts Total
LiabilitiesBalance as of 1 January 2010 –293 –948 –41 –54 –1 738 –2 257 –5 331
Realised/unrealised gains/losses:Included in net income –66 –46 –19 5 216 –417 –327Included in other comprehensive income
Purchases, issuances, and settlements –97 –97Transfers into level 3 0Transfers out of level 3 0Impact of foreign exchange movements 1 –1 0
Closing balance as of 30 June 2010 –359 –993 –60 –49 –1 522 –2 772 –5 755
1 Transfers are recognised at the date of the event or change in circumstances that caused the transfer.2 The Group has mainly transferred residential mortgage-backed securities with a maturity longer than 20 years from level 3 to level 2 as the valuation of those products is based
on observable inputs.
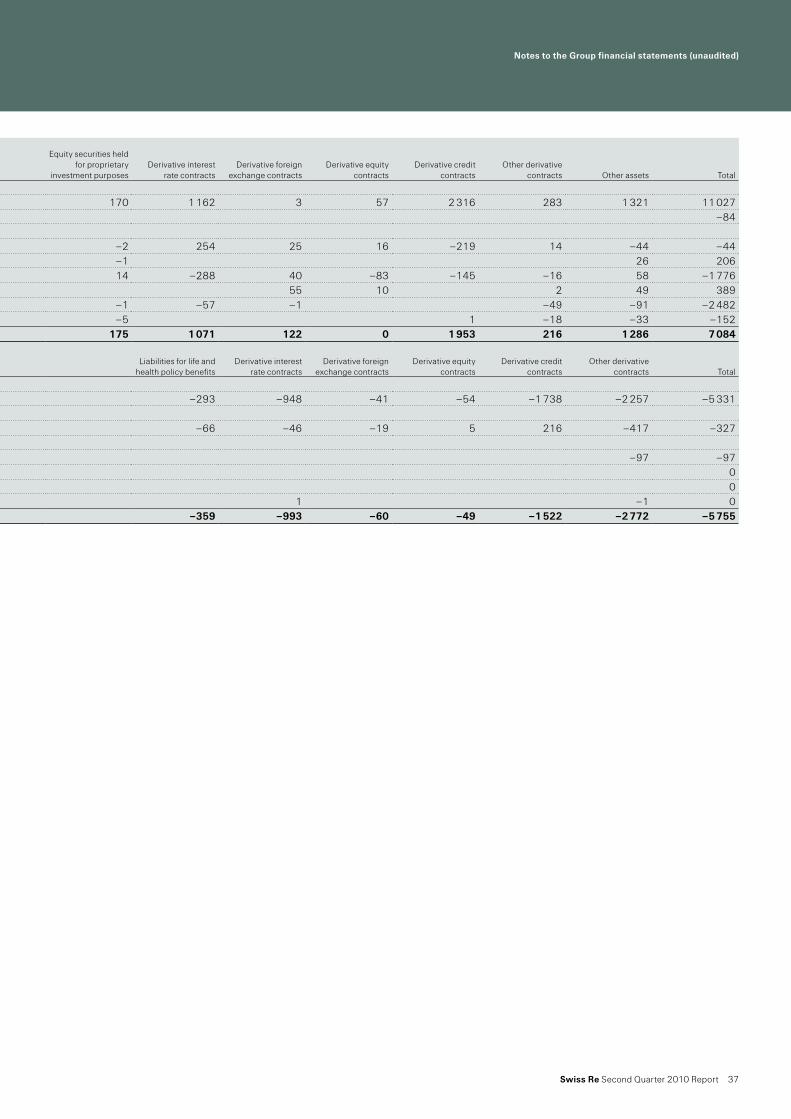
Notes to the Group financial statements (unaudited)
Swiss Re Second Quarter 2010 Report 37
2010USD millions
Debt securitiesissued by non-US governments and
government agenciesCorporate debt
securities
Residential mortgage-backed
securities
Commercial mortgage-backed
securities Other asset-backed
securities
Equity securities heldfor proprietary
investment purposesDerivative interest
rate contractsDerivative foreign
exchange contractsDerivative equity
contractsDerivative credit
contractsOther derivative
contracts Other assets Total
AssetsBalance as of 1 January 2010 82 2 085 1 302 199 2 047 170 1 162 3 57 2 316 283 1 321 11 027Cumulative effect of adoption of ASU No. 2009-17 –84 –84
Realised/unrealised gains/losses:Included in net income –12 –3 –73 –2 254 25 16 –219 14 –44 –44Included in other comprehensive income 9 92 28 2 50 –1 26 206
Purchases, issuances, and settlements –20 –128 –73 –4 –1 131 14 –288 40 –83 –145 –16 58 –1 776Transfers into level 31 102 71 61 11 28 55 10 2 49 389Transfers out of level 31 –99 –368 -1 2982 –205 –313 –1 –57 –1 –49 –91 –2 482Impact of foreign exchange movements –7 –72 –5 –13 –5 1 –18 –33 –152
Closing balance as of 30 June 2010 67 1 668 12 3 511 175 1 071 122 0 1 953 216 1 286 7 084
Liabilities for life andhealth policy benefits
Derivative interest rate contracts
Derivative foreign exchange contracts
Derivative equity contracts
Derivative credit contracts
Other derivative contracts Total
LiabilitiesBalance as of 1 January 2010 –293 –948 –41 –54 –1 738 –2 257 –5 331
Realised/unrealised gains/losses:Included in net income –66 –46 –19 5 216 –417 –327Included in other comprehensive income
Purchases, issuances, and settlements –97 –97Transfers into level 3 0Transfers out of level 3 0Impact of foreign exchange movements 1 –1 0
Closing balance as of 30 June 2010 –359 –993 –60 –49 –1 522 –2 772 –5 755
1 Transfers are recognised at the date of the event or change in circumstances that caused the transfer.2 The Group has mainly transferred residential mortgage-backed securities with a maturity longer than 20 years from level 3 to level 2 as the valuation of those products is based
on observable inputs.

Notes to the Group financial statements (unaudited)
38 Swiss Re Second Quarter 2010 Report
Gains and losses on assets and liabilities measured at fair value on a recurring basis using significant unobservable inputs (level 3)The gains and losses relating to the assets and liabilities measured at fair value using significant unobservable inputs (level 3) for the six months ended 30 June 2009 and 2010 were as follows:
Other assets measured at net asset valueOther assets measured at net asset value as of 31 December 2009 and 30 June 2010, respectively, were as follows:
The hedge fund investments employ a variety of strategies including global macro, relative value, and event driven strategies across various asset classes including long/short equity and credit investments.
The private equity direct portfolio consists of equity and equity-like investments directly in other companies. These investments have no contractual term and are generally held based on financial or strategic intent.
Private equity and real estate funds generally have limitations imposed on the amount of redemptions from the fund during the redemption period due to illiquidity of the underlying investments. Fees may apply for redemptions or transferring of interest to other parties. Distributions are expected to be received from these funds as the underlying assets are liquidated over the life of the fund, which is generally from ten to twelve years.
The redemption frequency of hedge funds varies depending upon the manager as well as the nature of the underlying product. Additionally, certain funds may impose lock-up periods and redemption gates as defined in the terms of the individual investment agreement.
Fair value optionThe fair value option under the Financial Instruments Topic permits the choice to measure specified financial assets and liabilities at fair value on an instrument-by-instrument basis.
The Group elected the fair value option for positions in the following line items in the balance sheet:
Fixed income securities tradingThe Group elected the fair value option for the specific investments acquired within a transaction. These securities are classified as debt securities under the Group’s accounting policies. Upon election of the fair value option the securities are classified as trading, with changes in fair value recorded in earnings. The primary reason for electing the fair value option is to mitigate volatility in earnings as a result of using different measurement attributes. In the second quarter of 2010, these fixed income securities matured.
USD millions2009
Fair value2010
Fair valueUnfunded
commitmentsRedemption frequency
(if currently eligible)Redemption
notice period
Private equity funds 492 535 495 non-redeemable na
Hedge funds 356 344 redeemable1 90–120 days2
Private equity direct 236 218 non-redeemable na
Real estate funds 132 153 70 non-redeemable3 na
Total 1 216 1 250 565
1 The redemption frequency varies from monthly to up to three years.2 Cash distribution can be delayed for up to three years depending on the sale of the underlyings.3 One exception is a real estate fund that can be redeemed annually based on a 90-day notice period. This redeemable fund had a fair value of USD 16.8 million as of 30 June 2010.
USD millions 2009 2010
Gains/losses included in net income for the period –328 –371Whereof change in unrealised gains/losses relating to assets and liabilities still held at the reporting date 1 548 –773

Notes to the Group financial statements (unaudited)
Swiss Re Second Quarter 2010 Report 39
Equity securities tradingThe Group elected the fair value option for an investment previously classified as available-for-sale within other invested assets in the balance sheet. The Group economically hedges the investment with derivative instruments that offset this exposure. The changes in fair value of the derivatives are recorded in earnings. Electing the fair value option eliminates the mismatch previously caused by the economic hedging of the investment and reduces the volatility in the income statement.
Liabilities for life and health policy benefitsThe Group elected the fair value option for existing guaranteed minimum death benefit (GMDB) reserves related to certain variable annuity contracts which are classified as universal life-type contracts. The Group has applied the fair value option as the equity risk associated with those contracts is managed on a fair value basis, and it is economically hedged with derivative options in the market.
Assets and liabilities measured at fair value pursuant to election of the fair value optionPursuant to the election of the fair value option for the items described, the balances as of 31 December 2009 and 30 June 2010 were as follows:
Changes in fair values for items measured at fair value pursuant to election of the fair value optionTotal gains/losses included in earnings for the six months ended 30 June 2009 and 2010, including foreign exchange impact, were USD 370 million and USD –175 million, respectively. Fair value changes from fixed income securities trading (USD –23 million) and equity securities trading (USD –85 million) are reported in net realised investment gains/losses. Fair value changes from the GMDB reserves (USD –67 million) are shown in life and health benefits.
USD millions 2009 2010
AssetsFixed income securities trading 11 562 9 947
of which at fair value pursuant to the fair value option 782 01Equity securities trading 19 591 16 711
of which at fair value pursuant to the fair value option 492 407LiabilitiesLiabilities for life and health policy benefits –39 944 –37 663
of which at fair value pursuant to the fair value option –293 –359
1 These fixed income securities matured in the second quarter of 2010

Notes to the Group financial statements (unaudited)
40 Swiss Re Second Quarter 2010 Report
4 Derivative financial instruments
The Group uses a variety of derivative financial instruments including swaps, options, forwards, credit derivatives and exchange-traded financial futures in its trading and hedging strategies, in line with the Group’s overall risk management strategy. The objectives include managing exposure to price, foreign currency and/or interest rate risk on planned or anticipated investment purchases, existing assets or liabilities, as well as locking in attractive investment conditions for future available funds.
The fair values represent the gross carrying value amounts at the reporting date for each class of derivative contract held or issued by the Group. The gross fair values are not an indication of credit risk, as many over-the-counter transactions are contracted and documented under ISDA master agreements or their equivalent. Management believes that such agreements provide for legally enforceable setoff in the event of default, which substantially reduces credit exposure.
Fair values of derivative financial instrumentsAs of 31 December 2009 and 30 June 2010, the fair values and notional amounts of the derivatives outstanding were as follows:
As of 31 December 2009USD millions
Notional amount assets/liabilities
Fair value assets
Fair value liabilities
Carrying value assets/liabilities
Derivatives not designated as hedging instrumentsInterest rate contracts 370 280 4 702 –4 529 173Foreign exchange contracts 43 398 1 107 –2 155 –1 048Equity contracts 23 612 2 855 –1 297 1 558Credit contracts 70 427 2 673 –2 181 492Other contracts 42 711 1 059 –2 892 –1 833Total 550 428 12 396 –13 054 –658
Derivatives designated as hedging instrumentsInterest rate contracts 5 0711 402 402Foreign exchange contracts 2 3391 143 143Total 7 410 545 0 545
Total derivative financial instruments 557 838 12 941 –13 054 –113
Amount offsetWhere a right of setoff exists –6 475 6 475Due to cash collateral –2 486 404
Total net amount of derivative financial instruments 3 980 –6 175 –2 195
1 The Group has revised its classification of hedging contracts and as a result the notionals of some contracts that were previously classified as foreign exchange contracts are now classified as interest rate contracts.
As of 30 June 2010USD millions
Notional amount assets/liabilities
Fair value assets
Fair value liabilities
Carrying value assets/liabilities
Derivatives not designated as hedging instrumentsInterest rate contracts 409 675 5 083 –5 104 –21Foreign exchange contracts 35 555 1 216 –972 244Equity contracts 15 461 1 652 –840 812Credit contracts 51 910 2 345 –1 796 549Other contracts 38 760 397 –2 861 –2 464Total 551 361 10 693 –11 573 –880
Derivatives designated as hedging instrumentsInterest rate contracts 4 6831 699 699Foreign exchange contracts 1 9651 –177 –177Total 6 648 699 –177 522
Total derivative financial instruments 558 009 11 392 –11 750 –358
Amount offsetWhere a right of setoff exists –6 720 6 720Due to cash collateral –1 126 227
Total net amount of derivative financial instruments 3 546 –4 803 –1 257
1 The Group has revised its classification of hedging contracts and as a result the notionals of some contracts that were previously classified as foreign exchange contracts are now classified as interest rate contracts.

Notes to the Group financial statements (unaudited)
Swiss Re Second Quarter 2010 Report 41
The notional amounts of derivative financial instruments give an indication of the Group’s volume of derivative activity. The fair value assets are included in other invested assets and the fair value liabilities are included in accrued expenses and other liabilities. The fair value amounts that were not offset were nil as of 31 December 2009 and 30 June 2010, respectively.
Non-hedging activitiesThe Group primarily uses derivative financial instruments for risk management and trading strategies. Gains and losses of derivative financial instruments not designated as hedging instruments are recorded in net realised investment gains/losses in the income statement. Gains and losses of derivative financial instruments not designated as hedging instruments were as follows:
Hedging activitiesThe Group designates certain derivative financial instruments as hedging instruments. The designation of derivative financial instruments is primarily used for overall portfolio and risk management strategies. As of 30 June 2009 and 2010, the following hedging relationships were outstanding:
Fair value hedgesThe Group enters into interest rate and foreign exchange swaps to reduce the exposure to interest rate and foreign exchange volatility for certain of its issued debt positions. These derivative instruments are designated as hedging instruments in qualifying fair value hedges. Gains and losses on derivative financial instruments designated as fair value hedging instruments are recorded in net realised investment gains/losses in the income statement. The gains and losses attributable to the hedged risks were as follows:
For the three months ended 30 June For the six months ended 30 JuneUSD millions 2009 2010 2009 2010
Derivatives not designated as hedging instrumentsInterest rate contracts –91 20 –183 41Foreign exchange contracts 276 –157 31 –84Equity contracts –717 556 –536 292Credit contracts –1 278 118 –1 282 –9Other contracts 212 –375 372 –47Total gain/loss recognised in income –1 598 162 –1 598 193
For the three months ended 30 June For the six months ended 30 June
2009USD millions
Gains/losses on derivatives
Gains/losses on hedged items
Gains/losses on derivatives
Gains/losses on hedged items
Fair value hedging relationshipsInterest rate contracts –291 324 –421 493Total gain/loss recognised in income –291 324 –421 493
For the three months ended 30 June For the six months ended 30 June
2010USD millions
Gains/losses on derivatives
Gains/losses on hedged items
Gains/losses on derivatives
Gains/losses on hedged items
Fair value hedging relationshipsInterest rate contracts 279 –251 310 –270Foreign exchange contracts –227 249 –359 389Total gain/loss recognised in income 52 –2 –49 119

Notes to the Group financial statements (unaudited)
42 Swiss Re Second Quarter 2010 Report
Hedges of the net investment in foreign operationsThe Group designates non-derivative monetary financial instruments as hedging the foreign currency exposure of its net investment in certain foreign operations.
For the year ended 31 December 2009 and the six months ended 30 June 2010, the Group recorded an accumulated net unrealised foreign currency remeasurement loss of USD 44 million and a gain of USD 405 million, respectively, in shareholders’ equity. These offset translation gains and losses on the hedged net investment.
Maximum potential lossIn consideration of the rights of setoff and the qualifying master netting arrangements with various counterparties, the maximum potential loss as of 31 December 2009 and 30 June 2010 was approximately USD 6 466 million and USD 4 672 million, respectively. The maximum potential loss is based on the positive market replacement cost assuming non-performance of all counterparties, net of cash collateral.
Credit-risk-related contingent featuresCertain derivative instruments held by the Group contain provisions that require its debt to maintain an investment grade credit rating. If the Group’s credit rating were downgraded or no longer rated, the counterparties could request immediate payment, guarantee or an ongoing full overnight collateralisation on derivative instruments in net liability positions.
The total fair value of derivative financial instruments containing credit-risk-related contingent features amounted to USD 3 970 million and USD 1 869 million as of 31 December 2009 and 30 June 2010, respectively. For derivative financial instruments containing credit-risk-related contingent features the Group posted collateral of USD 403 million and USD 228 million as of 31 December 2009 and 30 June 2010, respectively. In the event of a reduction of the Group’s credit rating to below investment grade, additional collateral would need to be posted with a fair value of USD 3 567 million and USD 1 641 million as of 31 December 2009 and 30 June 2010, respectively. The total equals the amount needed to settle the instruments immediately as of 31 December 2009 and 30 June 2010, respectively.

Notes to the Group financial statements (unaudited)
Swiss Re Second Quarter 2010 Report 43
Credit derivatives written/soldThe Group writes/sells credit derivatives, including credit default swaps, credit spread options and credit index products, and total return swaps. The total return swaps, for which the Group assumes asset risk mainly of variable interest entities, qualify as guarantees under FASB ASC Topic 460. These activities are part of the Group’s overall portfolio and risk management strategies. The events that could require the Group to perform include bankruptcy, default, obligation acceleration or moratorium of the credit derivative’s underlying.
The following tables show the fair values and the maximum potential payout of the credit derivatives written/sold as of 31 December 2009 and 30 June 2010, categorised by the type of credit derivative and credit spreads, which were based on external market data. The fair values represent the gross carrying values, excluding the effects of netting under ISDA master agreements and cash collateral netting. The maximum potential payout is based on the notional values of the derivatives and represents the gross undiscounted future payments the Group would be required to make, assuming the default of all credit derivatives’ underlyings.
The fair values of the credit derivatives written/sold do not represent the Group’s effective net exposure as the ISDA master agreement and the cash collateral netting are excluded.
The Group has purchased protection to manage the performance/payment risks related to credit derivatives. As of 31 December 2009 and 30 June 2010, the total purchased credit protection based on notional values was USD 45 462 million and USD 29 296 million, respectively. Thereof USD 14 091 million and USD 12 262 million, respectively, were related to identical underlyings for which the Group sold credit protection. For tranched indexes and baskets, only matching tranches of the respective index were determined as identical. In addition to the purchased credit protection, the Group manages the performance/payment risks through a correlation hedge, which is established with non-identical offsetting positions.
The maximum potential payout is based on notional values of the credit derivatives. The Group enters into total return swaps mainly with VIEs which issue insurance-linked and credit-linked securities.

Notes to the Group financial statements (unaudited)
44 Swiss Re Second Quarter 2010 Report
As of 31 December 2009 and 30 June 2010, the fair values and maximum potential payout of the written credit derivatives outstanding were as follows:
Total fair values of credit
derivatives written/sold
Maximum potential payout (time to maturity)
Total maximumpotential payout
As of 31 December 2009USD millions 0–5 years 5–10 years Over 10 years
Credit Default SwapsCredit spread in basis points
0 – 250 18 7 429 1 8361 131 9 396251 – 500 –33 17 188 205501 – 1 000 –30 24 90 114Greater than 1 000 –631 392 8382 1 230No credit spread available 1 033 1 033
Total –676 8 895 1 836 1 247 11 978
Credit Index ProductsCredit spread in basis points
0 – 250 –386 3 920 8 080 194 12 194251 – 500 44 95 138 233501 – 1 000 –3 422 29 451Greater than 1 000 –78 109 109
Total –423 4 546 8 247 194 12 987
Total Return SwapsCredit spread in basis points
No credit spread available 82 5 414 581 5 995Total 82 5 414 581 0 5 995
Total credit derivatives written/sold –1 017 18 855 10 664 1 441 30 960
1 The Group terminated substantially all Portfolio CDS in the second quarter of 2009.2 The Group settled substantially all Structured CDS in the first quarter of 2009.
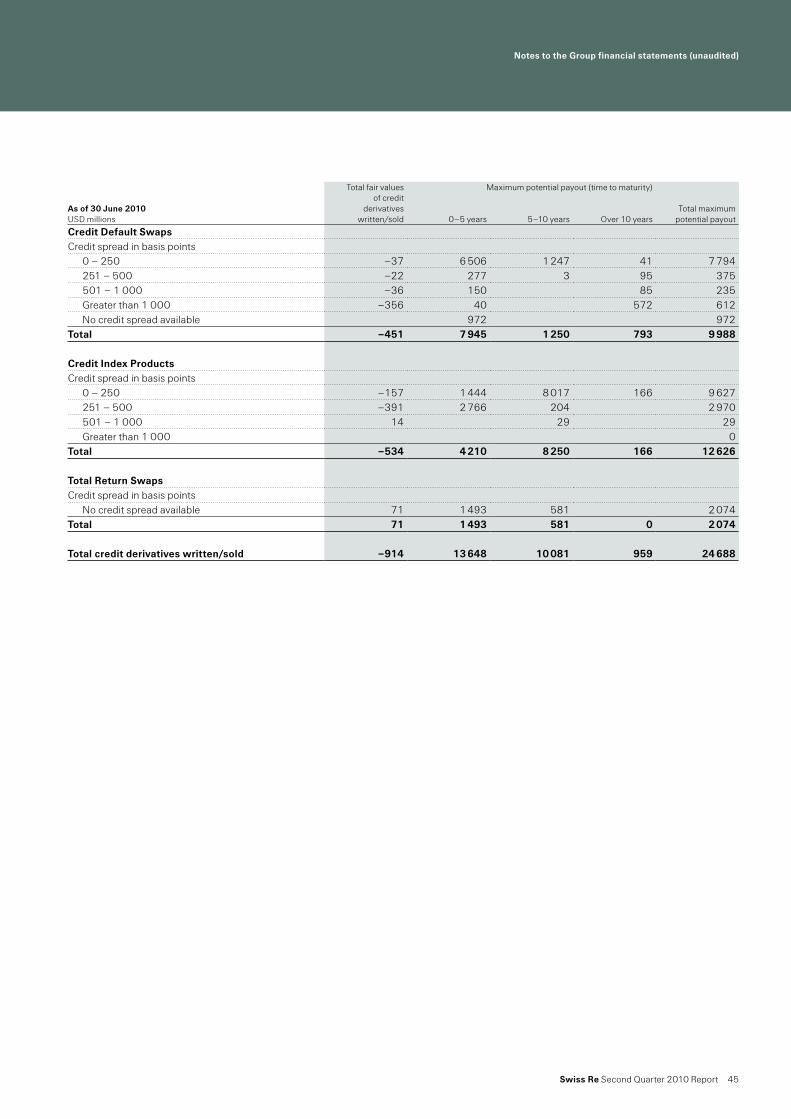
Notes to the Group financial statements (unaudited)
Swiss Re Second Quarter 2010 Report 45
Total fair values of credit
derivatives written/sold
Maximum potential payout (time to maturity)
Total maximumpotential payout
As of 30 June 2010USD millions 0–5 years 5–10 years Over 10 years
Credit Default SwapsCredit spread in basis points
0 – 250 –37 6 506 1 247 41 7 794251 – 500 –22 277 3 95 375501 – 1 000 –36 150 85 235Greater than 1 000 –356 40 572 612No credit spread available 972 972
Total –451 7 945 1 250 793 9 988
Credit Index ProductsCredit spread in basis points
0 – 250 –157 1 444 8 017 166 9 627251 – 500 –391 2 766 204 2 970501 – 1 000 14 29 29Greater than 1 000 0
Total –534 4 210 8 250 166 12 626
Total Return SwapsCredit spread in basis points
No credit spread available 71 1 493 581 2 074Total 71 1 493 581 0 2 074
Total credit derivatives written/sold –914 13 648 10 081 959 24 688

Notes to the Group financial statements (unaudited)
46 Swiss Re Second Quarter 2010 Report
5 Deferred acquisition costs (DAC) and acquired present value of future profits (PVFP)
For the twelve months ended 31 December 2009 and the six months ended 30 June 2010, the DAC and PVFP were as follows:
The amortisation of DAC for the full year 2009 was USD 2 153 million for Property & Casualty and USD 287 million for Life & Health. In the first six months of 2010, the DAC amortisation represented USD 915 million and USD 167 million for the Property & Casualty and Life & Health business segments, respectively.
Retroceded DAC and PVFP may arise on retrocession of reinsurance portfolios, including reinsurance undertaken as part of a securitisation. The associated potential retrocession recoveries are determined by the nature of the retrocession agreements and by the terms of the securitisation.
2009 2010USD millions DAC PVFP DAC PVFP
Opening balance as of 1 January 4 050 5 768 3 894 6 054Cumulative effect of adoption of FSP SFAS 115-2 5Cumulative effect of adoption of SFAS 163 –23Deferred 2 074 1 066Effect of acquisitions/disposals and retrocessions 372 –212 –1 206Amortisation –2 440 –483 –1 082 –306Interest accrued on unamortised PVFP 119 64Effect of foreign currency translation 233 267 –128 –192Effect of change in unrealised gains/losses 6 –122Closing balance as of period end 3 894 6 054 3 538 4 292

Notes to the Group financial statements (unaudited)
Swiss Re Second Quarter 2010 Report 47
6 Debt
The Group enters into long and short-term debt arrangements to obtain funds for general corporate use and specific transaction financing. The Group defines short-term debt as debt having a maturity at the balance sheet date of less than one year and long-term debt as having a maturity of greater than one year. Interest expense is classified accordingly.
As of 1 January 2010, the Group adopted ASU No.2009-17 relating to consolidation of variable interest entities. For more information on the transition impact on debt, please refer to Note 12.
The Group’s debt as of 31 December 2009 and 30 June 2010 was as follows:
The Group uses debt for general corporate purposes and to fund discrete pools of operational leverage and financial intermediation assets. Operational leverage and financial intermediation are subject to asset and liability matching resulting in little to no risk that the assets will be insufficient to service and settle the liabilities. Debt used for operational leverage and financial intermediation is treated as operational debt and excluded by the rating agencies from financial leverage calculations. Certain debt positions are limited recourse, meaning the debtors’ claims are limited to assets underlying the financing. As of 31 December 2009 and 30 June 2010, debt related to operational leverage and financial intermediation amounted to USD 20.4 billion (thereof USD 6.0 billion limited recourse) and USD 18.7 billion (thereof USD 7.1 billion limited recourse), respectively.
Interest expense on long-term debtInterest expense on long-term debt for the periods ended 30 June 2009 and 2010 was as follows:
Long-term debt issued in 2010In June 2010, the Group issued CHF 500 million under the EMTN programme with a five-year maturity and a coupon of 2% and CHF 250 million, due in 2012, bearing interest of three-month CHF Libor plus 45 basis points.
USD millions 2009 2010
Senior operational debt 8 024 5 770Subordinated financial debt 81 555Short-term debt – financial and operational debt 8 105 6 325
Senior financial debt 1 487 2 115Senior operational debt 7 005 7 907Subordinated financial debt 5 370 4 401Subordinated operational debt 5 322 5 020Long-term debt – financial and operational debt 19 184 19 443
Total carrying value 27 289 25 768Total fair value 25 391 24 176
Three months ended 30 June Six months ended 30 JuneUSD millions 2009 2010 2009 2010
Senior financial debt 3 16 8 36Senior operational debt1 64 93 115 179Subordinated financial debt 65 66 132 136Subordinated operational debt 61 59 118 121Total 193 234 373 472
1 In the Group’s 2009 annual financial statements, certain debt positions and the related interest expense were reclassified from senior operational long-term debt to senior operational short-term debt as they are unconditionally callable by the creditor at short notice.

Notes to the Group financial statements (unaudited)
48 Swiss Re Second Quarter 2010 Report
7 Reinsurance information
For the three months ended 30 June
Premiums written, premiums earned and fees assessed against policyholders
Claims and claim adjustment expenses
Acquisition costs
2009 2010USD millions Non-Life Life & Health Total Non-Life Life & Health Total
Premiums writtenDirect 487 315 802 434 332 766Assumed 2 970 2 249 5 219 2 520 2 337 4 857Ceded –880 –164 –1 044 –763 –530 –1 293Total premiums written 2 577 2 400 4 977 2 191 2 139 4 330
Premiums earnedDirect 465 315 780 412 336 748Assumed 3 634 2 233 5 867 2 723 2 371 5 094Ceded –910 –159 –1 069 –631 –532 –1 163Total premiums earned 3 189 2 389 5 578 2 504 2 175 4 679
Fee income frompolicyholdersDirect 164 164 161 161Assumed 58 58 64 64Ceded –24 –24 –4 –4Total fee income from policyholders 198 198 221 221
2009 2010USD millions Non-Life Life & Health Total Non-Life Life & Health Total
ClaimsClaims paid, gross –3 734 –3 404 –7 138 –3 593 –2 673 –6 266Claims paid, retro 626 195 821 600 590 1 190Claims paid, net –3 108 –3 209 –6 317 –2 993 –2 083 –5 076
Change in unpaid claims and claim adjustment expenses; life and health benefits, gross 1 176 1 105 2 281 1 503 74 1 577Change in unpaid claims and claim adjustment expenses; life and health benefits, retro –269 –10 –279 –330 –14 –344Change in unpaid claims and claim adjustment expenses; life and health benefits, net 907 1 095 2 002 1 173 60 1 233
Claims and claim adjustment expenses; life and health benefits –2 201 –2 114 –4 315 –1 820 –2 023 –3 843
2009 2010USD millions Non-Life Life & Health Total Non-Life Life & Health Total
Acquisition costsAcquisition costs, gross –764 –548 –1 312 –659 –646 –1 305Acquisition costs, retro 249 31 280 211 53 264
Acquisition costs, net –515 –517 –1 032 –448 –593 –1 041
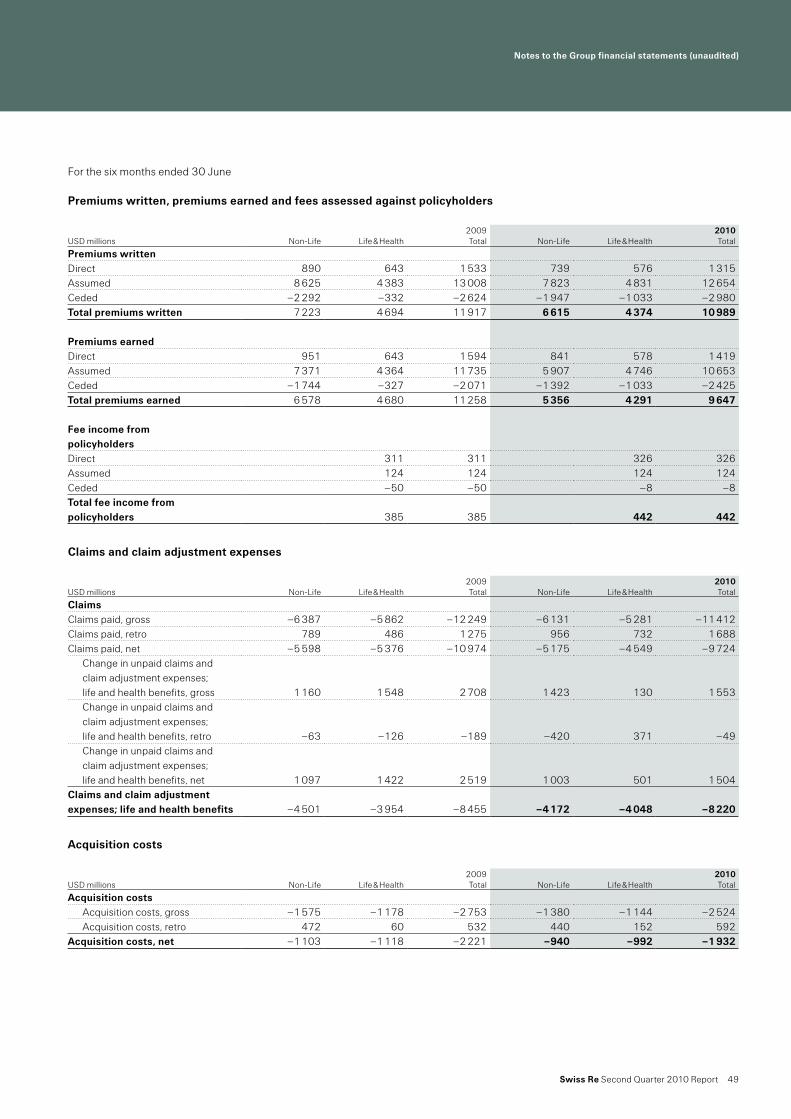
Notes to the Group financial statements (unaudited)
Swiss Re Second Quarter 2010 Report 49
For the six months ended 30 June
Premiums written, premiums earned and fees assessed against policyholders
Claims and claim adjustment expenses
Acquisition costs
2009 2010USD millions Non-Life Life & Health Total Non-Life Life & Health Total
Premiums writtenDirect 890 643 1 533 739 576 1 315Assumed 8 625 4 383 13 008 7 823 4 831 12 654Ceded –2 292 –332 –2 624 –1 947 –1 033 –2 980Total premiums written 7 223 4 694 11 917 6 615 4 374 10 989
Premiums earnedDirect 951 643 1 594 841 578 1 419Assumed 7 371 4 364 11 735 5 907 4 746 10 653Ceded –1 744 –327 –2 071 –1 392 –1 033 –2 425Total premiums earned 6 578 4 680 11 258 5 356 4 291 9 647
Fee income frompolicyholdersDirect 311 311 326 326Assumed 124 124 124 124Ceded –50 –50 –8 –8Total fee income from policyholders 385 385 442 442
2009 2010USD millions Non-Life Life & Health Total Non-Life Life & Health Total
ClaimsClaims paid, gross –6 387 –5 862 –12 249 –6 131 –5 281 –11 412Claims paid, retro 789 486 1 275 956 732 1 688Claims paid, net –5 598 –5 376 –10 974 –5 175 –4 549 –9 724
Change in unpaid claims and claim adjustment expenses; life and health benefits, gross 1 160 1 548 2 708 1 423 130 1 553Change in unpaid claims and claim adjustment expenses; life and health benefits, retro –63 –126 –189 –420 371 –49Change in unpaid claims and claim adjustment expenses; life and health benefits, net 1 097 1 422 2 519 1 003 501 1 504
Claims and claim adjustment expenses; life and health benefits –4 501 –3 954 –8 455 –4 172 –4 048 –8 220
2009 2010USD millions Non-Life Life & Health Total Non-Life Life & Health Total
Acquisition costsAcquisition costs, gross –1 575 –1 178 –2 753 –1 380 –1 144 –2 524Acquisition costs, retro 472 60 532 440 152 592
Acquisition costs, net –1 103 –1 118 –2 221 –940 –992 –1 932
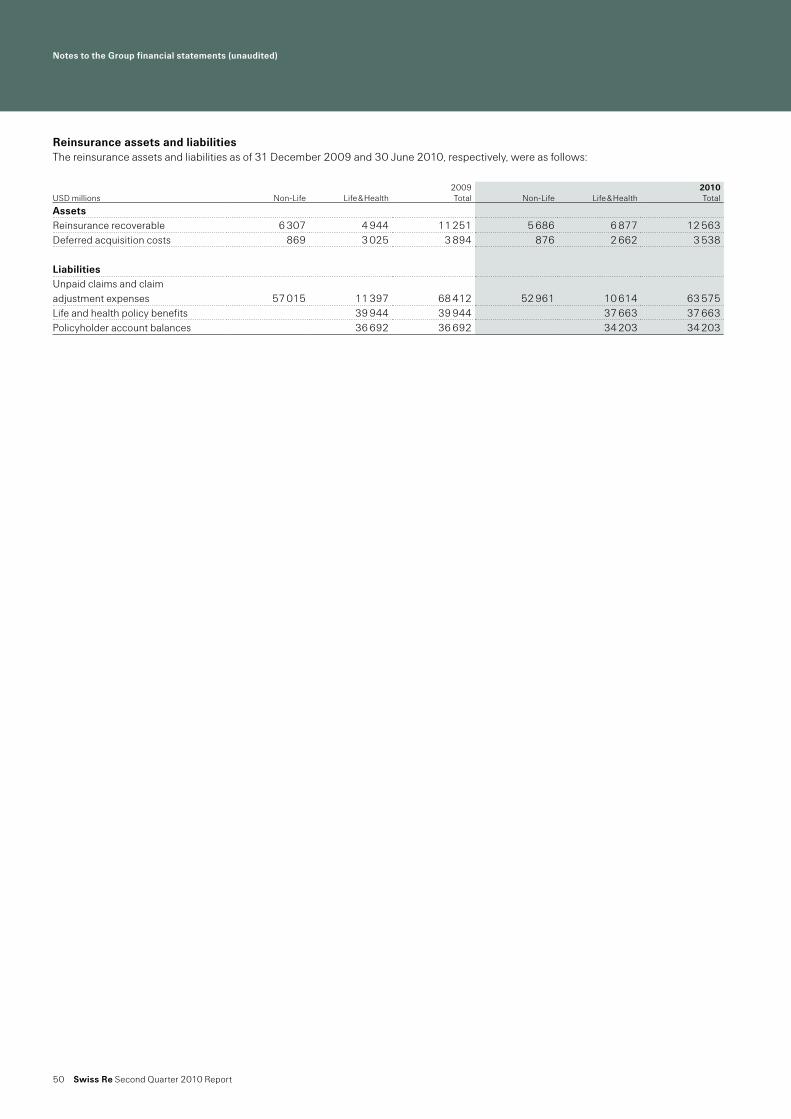
Notes to the Group financial statements (unaudited)
50 Swiss Re Second Quarter 2010 Report
Reinsurance assets and liabilitiesThe reinsurance assets and liabilities as of 31 December 2009 and 30 June 2010, respectively, were as follows:
2009 2010USD millions Non-Life Life & Health Total Non-Life Life & Health Total
AssetsReinsurance recoverable 6 307 4 944 11 251 5 686 6 877 12 563Deferred acquisition costs 869 3 025 3 894 876 2 662 3 538
LiabilitiesUnpaid claims and claimadjustment expenses 57 015 11 397 68 412 52 961 10 614 63 575Life and health policy benefits 39 944 39 944 37 663 37 663Policyholder account balances 36 692 36 692 34 203 34 203

Notes to the Group financial statements (unaudited)
Swiss Re Second Quarter 2010 Report 51
This page intentionally left blank
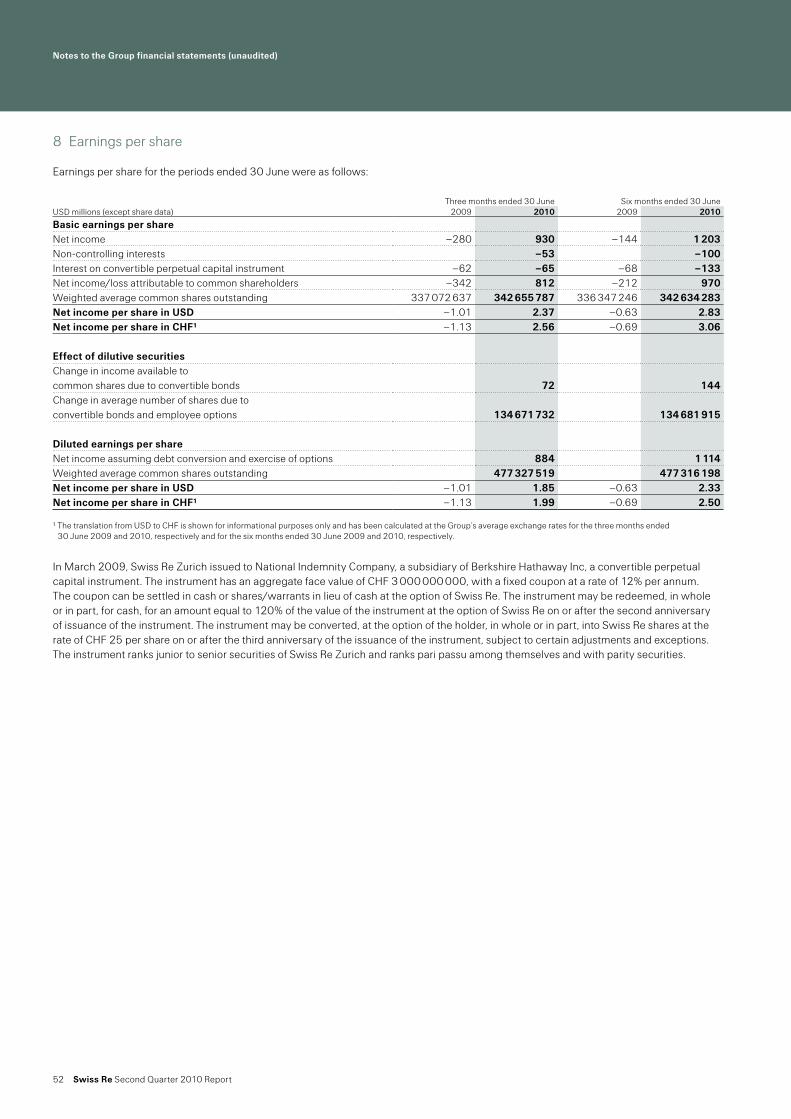
Notes to the Group financial statements (unaudited)
52 Swiss Re Second Quarter 2010 Report
8 Earnings per share
Earnings per share for the periods ended 30 June were as follows:
In March 2009, Swiss Re Zurich issued to National Indemnity Company, a subsidiary of Berkshire Hathaway Inc, a convertible perpetual capital instrument. The instrument has an aggregate face value of CHF 3 000 000 000, with a fixed coupon at a rate of 12% per annum. The coupon can be settled in cash or shares/warrants in lieu of cash at the option of Swiss Re. The instrument may be redeemed, in whole or in part, for cash, for an amount equal to 120% of the value of the instrument at the option of Swiss Re on or after the second anniversary of issuance of the instrument. The instrument may be converted, at the option of the holder, in whole or in part, into Swiss Re shares at the rate of CHF 25 per share on or after the third anniversary of the issuance of the instrument, subject to certain adjustments and exceptions. The instrument ranks junior to senior securities of Swiss Re Zurich and ranks pari passu among themselves and with parity securities.
Three months ended 30 June Six months ended 30 JuneUSD millions (except share data) 2009 2010 2009 2010
Basic earnings per shareNet income –280 930 –144 1 203Non-controlling interests –53 –100Interest on convertible perpetual capital instrument –62 –65 –68 –133Net income/loss attributable to common shareholders –342 812 –212 970Weighted average common shares outstanding 337 072 637 342 655 787 336 347 246 342 634 283Net income per share in USD –1.01 2.37 –0.63 2.83Net income per share in CHF1 –1.13 2.56 –0.69 3.06
Effect of dilutive securitiesChange in income available to common shares due to convertible bonds 72 144Change in average number of shares due toconvertible bonds and employee options 134 671 732 134 681 915
Diluted earnings per shareNet income assuming debt conversion and exercise of options 884 1 114Weighted average common shares outstanding 477 327 519 477 316 198Net income per share in USD –1.01 1.85 –0.63 2.33Net income per share in CHF1 –1.13 1.99 –0.69 2.50
1 The translation from USD to CHF is shown for informational purposes only and has been calculated at the Group’s average exchange rates for the three months ended 30 June 2009 and 2010, respectively and for the six months ended 30 June 2009 and 2010, respectively.

Notes to the Group financial statements (unaudited)
Swiss Re Second Quarter 2010 Report 53
9 Benefit plans
Defined benefit pension plans and post-retirement benefitsThe Group sponsors various funded defined benefit pension plans. Employer contributions to the plans are charged to income on a basis which recognises the costs of pensions over the expected service lives of employees covered by the plans. The Group’s funding policy for these plans is to contribute annually at a rate that is intended to maintain a level percentage of compensation for the employees covered. A full valuation is prepared at least every three years.
The Group also provides certain healthcare and life insurance benefits for retired employees and their dependants. Employees become eligible for these benefits when they become eligible for pension benefits.
Components of net periodic benefit costThe components of pension and post-retirement cost for the six months ended 30 June 2009 and 2010, respectively, were as follows:
Employer’s contributions for 2010As of 30 June 2010, the Group contributed USD 76 million to its defined benefit pension plans and USD 7 million to other post-retirement plans, compared to USD 135 million and USD 6 million, respectively, in the same period of 2009.
The expected 2010 contributions to the defined benefit pension plans and to the post-retirement benefit plans, revised as of 30 June 2010 for latest information, amount to USD 122 million (30 June 2009: USD 187 million) and USD 14 million (30 June 2009: USD 13 million), respectively.
Swiss plans pension benefits
Foreign plans pension benefits Other benefits
USD millions 2009 2010 2009 2010 2009 2010
Service cost (net of participant contributions) 45 40 20 6 4 3Interest cost 41 41 45 51 6 7Expected return on assets –66 –61 –49 –53Amortisation of: Net gain/loss 4 5 3 7 –6 –6 Prior service cost 4 3 –6 –5Effect of settlement, curtailment and termination 3 1Net periodic benefit cost 31 29 19 11 –2 –1
Notes to the Group financial statements (unaudited)
54 Swiss Re Second Quarter 2010 Report
10 Contingent liabilities
Federal securities class action lawsuitOn 14 August 2009, Plumbers’ Union Local No. 12 Pension Fund, a Swiss Re shareholder, filed a second amended complaint in the federal securities class action lawsuit against Swiss Re, Swiss Re’s former Chief Executive Officer and Swiss Re’s Chief Financial Officer arising out of Swiss Re’s announcement, on 19 November 2007, that it would report a USD 1 billion mark-to-market loss on two credit default swaps. The lawsuit is pending in New York federal court. Plaintiff alleges that defendants violated the anti-fraud provisions of the U.S. federal securities laws. Specifically, it contends that Swiss Re made false and misleading statements about its financial condition between March and November 2007, and that it failed to disclose that the Credit Solutions division had engaged in two credit default swaps that exposed the company to financial risk. Plaintiff seeks to certify a class of all U.S. residents or citizens that purchased Swiss Re stock between 1 March 2007 and 19 November 2007. Swiss Re plans to vigorously defend the lawsuit. On 4 September 2009, Swiss Re filed a motion to dismiss and requested oral argument. Plaintiff filed an opposition to that motion on 25 September 2009, to which Swiss Re submitted a reply brief on 9 October 2009. A further hearing on the motion to dismiss was held on 29 July 2010. The parties are awaiting the court’s decision.
Notes to the Group financial statements (unaudited)
Swiss Re Second Quarter 2010 Report 55
11 Information on business segments
The Group provides reinsurance, insurance and capital market solutions for clients that complement our (re)insurance offering throughout the world through its business segments. The business segments are determined by the organisational structure and by the way in which management reviews the operating result of the Group.
The Group presents four operating business segments: Property & Casualty, Life & Health, Asset Management and Legacy. Items not allocated to these four business segments are included in the “Group items” column.
The Property & Casualty segment consists of the following sub-segments: Property traditional, Casualty traditional, Specialty traditional and Non-traditional business. The Property & Casualty business segment includes Property & Casualty insurance-linked securities, Environmental & Commodity Markets business and, in the Specialty traditional sub-segment, Credit Reinsurance, Bank Trade Finance, and Credit securitisations.
The Life & Health segment continues to consist of the following sub-segments: Life traditional, Health traditional and Admin Re®. The Life & Health business segment includes variable annuity business and Life & Health insurance-linked securities.
The Asset Management business segment includes two separate sub-segments Credit & Rates and Equity & Alternative Investments resulting from the aggregation of Asset Management Risk Stripes. The Asset Management business segment includes proprietary returns on the Group’s invested fixed income securities, equity securities and alternative investments.
The Legacy business segment encompasses non-core activities, which have been in run-off since November 2007 and are managed separately from the Asset Management division. Legacy includes Financial Guarantee Re business, and assets in the Group’s former trading book, including credit correlation, collateralised fund obligations and other non-core activities.
Group items include certain costs of Corporate Centre functions not allocated to the business segments, certain foreign exchange items, interest expenses on operating and financial debt and other items not considered for the performance of the operating segments.
Certain investment results, including investment income and realised gains on unit-linked business, with-profit business and reinsurance derivatives, are excluded from the performance of the Asset Management business segment and directly allocated to the Property & Casualty and Life & Health business segments.
The allocation of investment result to Property & Casualty and Life & Health is determined based on US GAAP (re)insurance liabilities. The allocation methodology applies a risk-free return to the nominal net reserves at the end of the prior quarter. The risk-free interest rate applied to the reserves is determined by currency and duration of the underlying Property & Casualty and Life & Health reserves. The Allocation column eliminates the calculated investment result allocated to either the Property & Casualty or the Life & Health business segments.
The accounting policies of the business segments are in line with those described in the summary of significant accounting policies (see Note 1 in our annual consolidated financial statements).

Notes to the Group financial statements (unaudited)
56 Swiss Re Second Quarter 2010 Report
a) Business segment resultsFor the three months ended 30 June
The allocation is based on technical reserves and other information, including duration of the underlying liabilities, and was allocated in the three months ended 30 June of 2009 and 2010 as follows:
2009USD millions
Property &Casualty Life & Health
AssetManagement Legacy Group items Allocation Total
RevenuesPremiums earned 3 178 2 389 11 5 578Fee income from policyholders 198 198Net investment income/loss 619 850 1 191 88 55 –993 1 810Net realised investment gains/losses 25 819 –734 95 –473 –268Other revenues 10 15 18 43Total revenues 3 832 4 256 472 194 –400 –993 7 361
ExpensesClaims and claim adjustment expenses; life and health benefits –2 073 –2 114 –128 –4 315Return credited to policyholders –1 452 –1 452Acquisition costs –514 –517 –1 –1 032Other expenses –349 –181 –211 –18 –759Interest expenses –222 –222Total expenses –2 936 –4 264 0 –129 –433 –18 –7 780
Operating income/loss 896 –8 472 65 –833 –1 011 –419
2010USD millions
Property & Casualty Life & Health
Asset Management Legacy Group items Allocation Total
RevenuesPremiums earned 2 510 2 175 –6 4 679Fee income from policyholders 221 221Net investment income/loss 435 781 896 55 37 –844 1 360Net realised investment gains/losses 56 –1 840 325 –107 549 –1 017Other revenues –2 8 5 11Total revenues 2 999 1 337 1 229 –58 591 –844 5 254
ExpensesClaims and claim adjustment expenses;life and health benefits –1 821 –2 023 1 –3 843Return credited to policyholders 1 614 1 614Acquisition costs –451 –593 3 –1 041Other expenses –272 –193 –137 –602Interest expenses –259 –259Total expenses –2 544 –1 195 0 4 –396 0 –4 131
Operating income/loss 455 142 1 229 –54 195 –844 1 123
USD millions, for the three months ended 30 June 2009 Property & Casualty Life & Health Asset Management Allocation
Net investment income/loss 517 494 –18 –993
USD millions, for the three months ended 30 June 2010 Property & Casualty Life & Health Asset Management Allocation
Net investment income/loss 411 433 0 –844

Notes to the Group financial statements (unaudited)
Swiss Re Second Quarter 2010 Report 57
Business segment resultsFor the six months ended 30 June
The allocation is based on technical reserves and other information, including duration of the underlying liabilities, and was allocated in the six months ended 30 June of 2009 and 2010 as follows:
2009USD millions
Property &Casualty Life & Health
AssetManagement Legacy Group items Allocation Total
RevenuesPremiums earned 6 557 4 680 21 11 258Fee income from policyholders 385 385Net investment income/loss 1 174 1 608 2 036 148 144 –1 993 3 117Net realised investment gains/losses 62 –738 –617 58 –1 057 –2 292Other revenues 21 31 1 28 81Total revenues 7 814 5 935 1 450 228 –885 –1 993 12 549
ExpensesClaims and claim adjustment expenses; life and health benefits –4 353 –3 954 –148 –8 455Return credited to policyholders –271 –271Acquisition costs –1 098 –1 118 –5 –2 221Other expenses –621 –356 –319 –37 –1 333Interest expenses –466 –466Total expenses –6 072 –5 699 0 –153 –785 –37 –12 746
Operating income/loss 1 742 236 1 450 75 –1 670 –2 030 –197
2010USD millions
Property & Casualty Life & Health
Asset Management Legacy Group items Allocation Total
RevenuesPremiums earned 5 361 4 291 –5 9 647Fee income from policyholders 442 442Net investment income/loss 907 1 533 1 918 133 73 –1 725 2 839Net realised investment gains/losses 108 –465 234 –155 641 363Other revenues –2 14 17 29Total revenues 6 374 5 801 2 166 –27 731 –1 725 13 320
ExpensesClaims and claim adjustment expenses;life and health benefits –4 173 –4 048 1 –8 220Return credited to policyholders 4 4Acquisition costs –945 –992 5 –1 932Other expenses –542 –378 –252 –1 172Interest expenses –537 –537Total expenses –5 660 –5 414 0 6 –789 0 –11 857
Operating income/loss 714 387 2 166 –21 –58 –1 725 1 463
USD millions, for the six months ended 30 June 2009 Property & Casualty Life & Health Asset Management Allocation
Net investment income/loss 1 046 984 –37 –1 993
USD millions, for the six months ended 30 June 2010 Property & Casualty Life & Health Asset Management Allocation
Net investment income/loss 838 887 0 –1 725

Notes to the Group financial statements (unaudited)
58 Swiss Re Second Quarter 2010 Report
b) Property & Casualty business segment – by line of businessFor the three months ended 30 June
2009USD millions
Property traditional
Casualty traditional
Specialty traditional Total traditional Non-traditional Total
RevenuesPremiums earned 1 163 1 009 903 3 075 103 3 178Net investment income 53 368 81 502 117 619Net realised investment gains/losses 16 –1 15 10 25Other revenues –2 –2 12 10Total revenues 1 232 1 377 981 3 590 242 3 832
ExpensesClaims and claim adjustment expenses –524 –742 –640 –1 906 –167 –2 073Acquisition costs –165 –164 –182 –511 –3 –514Other expenses –97 –140 –90 –327 –22 –349Total expenses –786 –1 046 –912 –2 744 –192 –2 936
Operating income 446 331 69 846 50 896
Claims ratio in % 45.1 73.6 70.8 62.0Expense ratio in % 22.6 30.2 30.3 27.4Combined ratio in % 67.7 103.8 101.1 89.4
2010USD millions
Property traditional
Casualty traditional
Specialty traditional Total traditional Non-traditional Total
RevenuesPremiums earned 953 823 650 2 426 84 2 510Net investment income 28 313 62 403 32 435Net realised investment gains/losses –2 37 35 21 56Other revenues –1 –1 –1 –2Total revenues 978 1 136 749 2 863 136 2 999
ExpensesClaims and claim adjustment expenses –624 –758 –356 –1 738 –83 –1 821Acquisition costs –149 –186 –140 –475 24 –451Other expenses –124 –83 –54 –261 –11 –272Total expenses –897 –1 027 –550 –2 474 –70 –2 544
Operating income 81 109 199 389 66 455
Claims ratio in % 65.5 92.1 54.8 71.7Expense ratio in % 28.6 32.7 29.8 30.3Combined ratio in % 94.1 124.8 84.6 102.0

Notes to the Group financial statements (unaudited)
Swiss Re Second Quarter 2010 Report 59
Property & Casualty business segment – by line of businessFor the six months ended 30 June
2009USD millions
Property traditional
Casualty traditional
Specialty traditional Total traditional Non-traditional Total
RevenuesPremiums earned 2 387 2 143 1 775 6 305 252 6 557Net investment income 114 728 170 1 012 162 1 174Net realised investment gains/losses 48 48 14 62Other revenues 21 21Total revenues 2 549 2 871 1 945 7 365 449 7 814
ExpensesClaims and claim adjustment expenses –1 196 –1 584 –1 215 –3 995 –358 –4 353Acquisition costs –382 –347 –366 –1 095 –3 –1 098Other expenses –152 –258 –158 –568 –53 –621Total expenses –1 730 –2 189 –1 739 –5 658 –414 –6 072
Operating income 819 682 206 1 707 35 1 742
Claims ratio in % 50.3 73.9 68.4 63.4Expense ratio in % 22.4 28.2 29.6 26.4Combined ratio in % 72.7 102.1 98.0 89.8
2010USD millions
Property traditional
Casualty traditional
Specialty traditional Total traditional Non-traditional Total
RevenuesPremiums earned 2 098 1 686 1 382 5 166 195 5 361Net investment income 67 621 137 825 82 907Net realised investment gains/losses –5 35 30 78 108Other revenues –1 –1 –1 –2Total revenues 2 159 2 307 1 554 6 020 354 6 374
ExpensesClaims and claim adjustment expenses –1 773 –1 468 –792 –4 033 –140 –4 173Acquisition costs –292 –352 –275 –919 –26 –945Other expenses –233 –185 –101 –519 –23 –542Total expenses –2 298 –2 005 –1 168 –5 471 –189 –5 660
Operating income/loss –139 302 386 549 165 714
Claims ratio in % 84.5 87.0 57.3 78.1Expense ratio in % 25.0 31.9 27.2 27.8Combined ratio in % 109.5 118.9 84.5 105.9

Notes to the Group financial statements (unaudited)
60 Swiss Re Second Quarter 2010 Report
c) Life & Health business segment – by line of business For the three months ended 30 June
2009USD millions Life traditional Health traditional Admin Re® Total
RevenuesPremiums earned 1 718 451 220 2 389Fee income from policyholders 12 186 198Net investment income 188 102 560 850Net realised investment gains/losses –208 180 847 819Other revenuesTotal revenues 1 710 733 1 813 4 256
ExpensesClaims and claim adjustment expenses; life and health benefits –1 316 –143 –655 –2 114Return credited to policyholders –305 –1 147 –1 452Acquisition costs –353 –102 –62 –517Other expenses –95 –22 –64 –181Total expenses –2 069 –267 –1 928 –4 264
Operating income/loss –359 466 –115 –8
Operating result, excluding non-participating net realised investment gains/losses 154 286 –4 436
Net investment income – unit-linked 11 184 195Net investment income – with-profit business 60 60Net investment income – non-participating 177 102 316 595Net realised investment gains/losses – unit-linked 305 826 1 131Net realised investment gains/losses – with-profit business 132 132Net realised investment gains/losses – non-participating –513 180 –111 –444
Operating revenues1 1 907 553 722 3 182
Management expense ratio in % 5.0 4.0 8.9 5.7Benefit ratio2 in % 78.6
1 Operating revenues exclude net investment income and net realised investment gains/losses from unit-linked and with-profit business as these are passed through to contract holders and therefore do not have an impact on the operating result. Operating revenues also exclude net realised investment gains/losses from non-participating business.
2 The benefit ratio is calculated as claims divided by premiums earned, both of which exclude unit-linked and with-profit business.

Notes to the Group financial statements (unaudited)
Swiss Re Second Quarter 2010 Report 61
Life & Health business segment – by line of business For the three months ended 30 June
2010USD millions Life traditional Health traditional Admin Re® Total
RevenuesPremiums earned 1 411 519 245 2 175Fee income from policyholders 17 204 221Net investment income 150 77 554 781Net realised investment gains/losses –5 –1 835 –1 840Other revenuesTotal revenues 1 578 591 –832 1 337
ExpensesClaims and claim adjustment expenses; life and health benefits –1 253 –370 –400 –2 023Return credited to policyholders 140 1 474 1 614Acquisition costs –315 –121 –157 –593Other expenses –88 –37 –68 –193Total expenses –1 516 –528 849 –1 195
Operating income 62 63 17 142
Operating result, excluding non-participating net realised investment gains/losses –97 68 2 –27
Net investment income – unit-linked 13 163 176Net investment income – with-profit business 37 37Net investment income – non-participating 137 77 354 568Net realised investment gains/losses – unit-linked –159 –1 767 –1 926Net realised investment gains/losses – with-profit business –83 –83Net realised investment gains/losses – non-participating 159 –5 15 169
Operating revenues1 1 565 596 803 2 964
Management expense ratio in % 5.6 6.2 8.5 6.5Benefit ratio2 in % 93.5
1 Operating revenues exclude net investment income and net realised investment gains/losses from unit-linked and with-profit business as these are passed through to contract holders and therefore do not have an impact on the operating result. Operating revenues also exclude net realised investment gains/losses from non-participating business.
2 The benefit ratio is calculated as claims divided by premiums earned, both of which exclude unit-linked and with-profit business.

Notes to the Group financial statements (unaudited)
62 Swiss Re Second Quarter 2010 Report
Life & Health business segment – by line of business For the six months ended 30 June
2009USD millions Life traditional Health traditional Admin Re® Total
RevenuesPremiums earned 3 383 867 430 4 680Fee income from policyholders 29 356 385Net investment income 367 190 1 051 1 608Net realised investment gains/losses –292 177 –623 –738Other revenuesTotal revenues 3 487 1 234 1 214 5 935
ExpensesClaims and claim adjustment expenses; life and health benefits –2 571 –502 –881 –3 954Return credited to policyholders –162 –109 –271Acquisition costs –698 –183 –237 –1 118Other expenses –172 –59 –125 –356Total expenses –3 603 –744 –1 352 –5 699
Operating income/loss –116 490 –138 236
Operating result, excluding non-participating net realised investment gains/losses 317 313 –12 618
Net investment income – unit-linked 16 309 325Net investment income – with-profit business 94 94Net investment income – non-participating 351 190 648 1 189Net realised investment gains/losses – unit-linked 141 –439 –298Net realised investment gains/losses – with-profit business –58 –58Net realised investment gains/losses – non-participating –433 177 –126 –382
Operating revenues1 3 763 1 057 1 434 6 254
Management expense ratio in % 4.6 5.6 8.7 5.7Benefit ratio2 in % 82.6
1 Operating revenues exclude net investment income and net realised investment gains/losses from unit-linked and with-profit business as these are passed through to contract holders and therefore do not have an impact on the operating result. Operating revenues also exclude net realised investment gains/losses from non-participating business.
2 The benefit ratio is calculated as claims divided by premiums earned, both of which exclude unit-linked and with-profit business.

Notes to the Group financial statements (unaudited)
Swiss Re Second Quarter 2010 Report 63
Life & Health business segment – by line of business For the six months ended 30 June
2010USD millions Life traditional Health traditional Admin Re® Total
RevenuesPremiums earned 2 886 1 000 405 4 291Fee income from policyholders 32 410 442Net investment income 311 156 1 066 1 533Net realised investment gains/losses 114 –7 –572 –465Other revenuesTotal revenues 3 343 1 149 1 309 5 801
ExpensesClaims and claim adjustment expenses; life and health benefits –2 274 –780 –994 –4 048Return credited to policyholders 21 –17 4Acquisition costs –622 –190 –180 –992Other expenses –168 –68 –142 –378Total expenses –3 043 –1 038 –1 333 –5 414
Operating income/loss 300 111 –24 387
Operating result, excluding non-participating net realised investment gains/losses 120 118 –37 201
Net investment income – unit-linked 23 300 323Net investment income – with-profit business 74 74Net investment income – non-participating 288 156 692 1 136Net realised investment gains/losses – unit-linked –66 –605 –671Net realised investment gains/losses – with-profit business 20 20Net realised investment gains/losses – non-participating 180 –7 13 186
Operating revenues1 3 206 1 156 1 507 5 869
Management expense ratio in % 5.2 5.9 9.4 6.4Benefit ratio2 in % 90.4
1 Operating revenues exclude net investment income and net realised investment gains/losses from unit-linked and with-profit business as these are passed through to contract holders and therefore do not have an impact on the operating result. Operating revenues also exclude net realised investment gains/losses from non-participating business.
2 The benefit ratio is calculated as claims divided by premiums earned, both of which exclude unit-linked and with-profit business.

Notes to the Group financial statements (unaudited)
64 Swiss Re Second Quarter 2010 Report
d) Asset ManagementFor the three months ended 30 June
For the six months ended 30 June
2009USD millions Credit & Rates
Equity & Alternative Investments Total
RevenuesNet investment income/loss 1 102 89 1 191Net realised investment gains/losses –637 –97 –734Other revenues 16 –1 15Total revenues 481 –9 472
Operating income/loss 481 –9 472
2010USD millions Credit & Rates
Equity & Alternative Investments Total
RevenuesNet investment income 810 86 896Net realised investment gains/losses 280 45 325Other revenues 2 6 8Total revenues 1 092 137 1 229
Operating income 1 092 137 1 229
2009USD millions Credit & Rates
Equity & Alternative Investments Total
RevenuesNet investment income/loss 2 213 –177 2 036Net realised investment gains/losses –535 –82 –617Other revenues 31 31Total revenues 1 709 –259 1 450
Operating income/loss 1 709 –259 1 450
2010USD millions Credit & Rates
Equity & Alternative Investments Total
RevenuesNet investment income 1 669 249 1 918Net realised investment gains/losses 234 234Other revenues 2 12 14Total revenues 1 905 261 2 166
Operating income 1 905 261 2 166

Notes to the Group financial statements (unaudited)
Swiss Re Second Quarter 2010 Report 65
12 Variable interest entities
Swiss Re Group enters into arrangements with variable interest entities (VIEs) in the normal course of business. The involvement ranges from being a passive investor to designing, structuring, and managing the VIEs. The variable interests held by the Group arise as a result of the Group’s involvement in a modified coinsurance agreement, certain insurance-linked and credit-linked securitisations, swaps in trusts, debt financing and other entities, which meet the definition of a VIE.
When analysing the status of an entity, the Group mainly assesses if (1) the equity is sufficient to finance the entity’s activities without additional subordinated financial support, (2) the equity holders have the right to make significant decisions affecting the entity’s operations, and (3) the holders of the voting rights substantively participate in the gains and losses of the entity. When one of these criteria is not met, the entity is considered a VIE and needs to be assessed for consolidation under the VIE section of the Consolidation Topic. This section was amended by ASU No. 2009-17 “Improvements to Financial Reporting by Enterprises Involved with Variable Interest Entities” which is applicable to Swiss Re as of 1 January 2010.
According to the amendment, the party that has a controlling financial interest is called the primary beneficiary and consolidates the VIE. An enterprise is deemed to have a controlling financial interest if it has both of the following: the power to direct the activities of the VIE that most significantly impact the entity’s economic performance; and the obligation to absorb losses of the entity that could potentially be significant to the VIE or the right to receive benefits from the entity
that could potentially be significant to the VIE.
The Group assesses for all its variable interests in VIEs whether it has a controlling financial interest in these entities and, thus, is the primary beneficiary. For this, the Group identifies the activities that most significantly impact the entity’s performance and determines whether the Group has the power to direct those activities. In conducting the analysis, the Group considers the purpose, the design, and the risks that the entity was designed to create and pass through to its variable interest holders. In a second step, the Group assesses if it has the obligation to absorb losses or if it has the right to receive benefits of the VIE that could potentially be significant to the entity. If both criteria are met, the Group has a controlling financial interest in the VIE and consolidates the entity.
Whenever facts and circumstances change, a review is undertaken of the impact these changes could have on the consolidation assessment previously performed. When the assessment might be impacted, a reassessment to determine the primary beneficiary is performed.

Notes to the Group financial statements (unaudited)
66 Swiss Re Second Quarter 2010 Report
Modified coinsurance agreementThe Group assumes insurance risk via a modified coinsurance agreement from a direct insurer, which qualifies as a VIE. The Group assumes the majority of the mortality and investment risk in the VIE. In addition, the Group has the power over the investment management and policy holder administration. As these are the activities that most significantly impact the entity’s economic performance, the Group qualifies as the primary beneficiary and consolidates the entity. The Group will incur losses if mortality risk or the investment returns of the entity develop unfavourably.
Insurance-linked and credit-linked securitisationsThe insurance-linked and credit-linked securitisations transfer pre-existing insurance or credit risk to the capital markets through the issuance of insurance-linked or credit-linked securities. In insurance-linked securitisations, the securitisation vehicle assumes the insurance risk through insurance or derivative contracts. In credit-linked securitisations, the securitisation vehicle assumes the credit risk through credit default swaps. The securitisation vehicle generally retains the issuance proceeds as collateral. The collateral held predominantly consists of investment grade securities.
Typically, the variable interests held by the Group arise through ownership of insurance-linked and credit-linked securities, or through protection provided under a total return swap for the principle of the collateral held by the securitisation vehicle.
Generally, the activities of a securitisation vehicle are pre-determined at formation. There are substantially no ongoing activities during the life of the VIE that could significantly impact the economic performance of the vehicle. Consequently, the main focus to identify the primary beneficiary is on the activities performed and decisions made when the VIE was designed. Typically, the Group is considered the primary beneficiary of a securitisation vehicle when the Group acts as a sponsor of risk passed to the VIE and enters at the same time in a total return swap with the VIE to protect the VIE’s assets from market risk. Under the total return swap, the Group would incur losses when some or all of the securities held as collateral in the securitisation vehicle decline in value or default. Therefore the Group’s maximum exposure to loss equals the principal amount of the collateral protected under the total return swap.
The total assets of the insurance-linked and credit-linked securitisation vehicles, in which the Group holds variable interests but is not the primary beneficiary, was USD 4 111 million as of 30 June 2010.
Swaps in trustsThrough the Legacy segment, the Group provides risk management services to certain asset securitisation trusts which qualify as VIEs. As the involvement of the Group is limited to interest rate and foreign exchange derivatives, Swiss Re does not have power to direct any activities of the trusts and therefore does not qualify as primary beneficiary of any of these trusts.
Debt financing vehiclesDebt financing vehicles issue preference shares or loan notes to provide the Group with funding. The Group is partially exposed to the asset risk by holding equity rights or by protecting some of the assets held by the VIEs via guarantees or derivative contracts. The assets held by the VIEs consist of investment grade securities, structured products, hedge fund units, derivatives and others.
Certain debt financing vehicles are consolidated as the Group has the power over the investment management which is considered the activity that most significantly impacts the entity’s economic performance. In addition, the Group absorbs the variability of the investment return so that both criteria for a controlling financial interest are met.
The total assets of the debt financing vehicles in which the Group holds variable interests but is not the primary beneficiary was USD 5 072 million as of 30 June 2010.
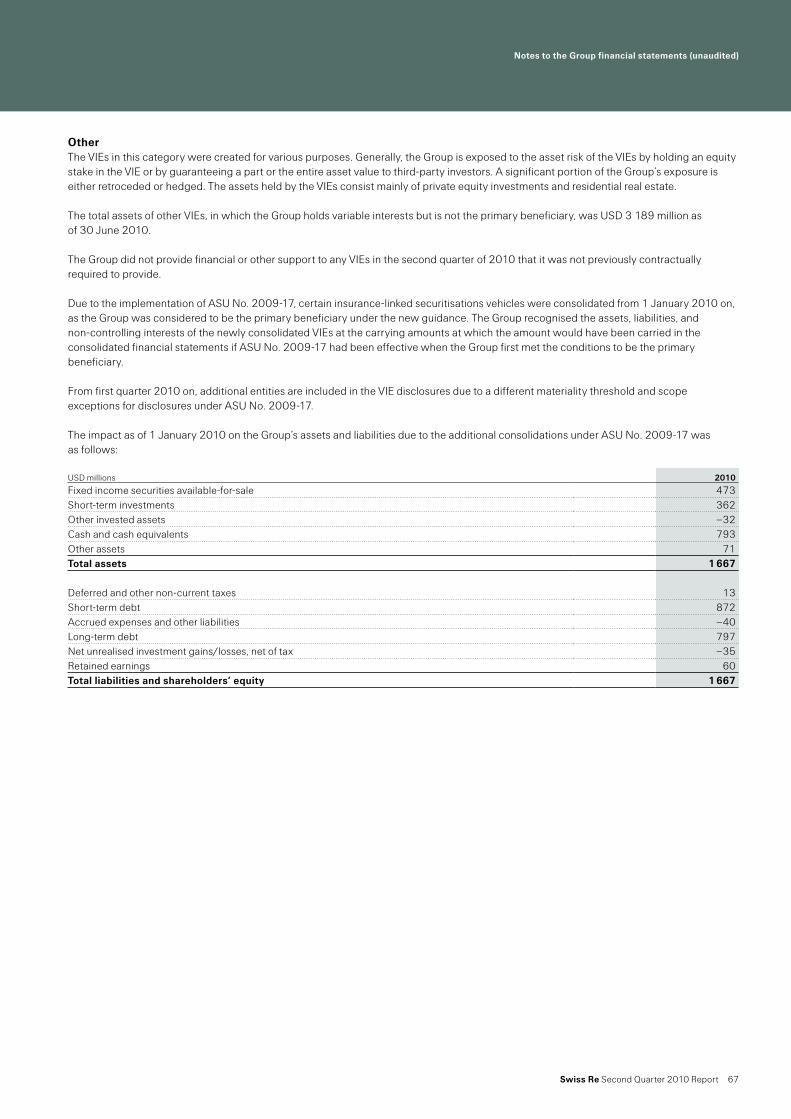
Notes to the Group financial statements (unaudited)
Swiss Re Second Quarter 2010 Report 67
OtherThe VIEs in this category were created for various purposes. Generally, the Group is exposed to the asset risk of the VIEs by holding an equity stake in the VIE or by guaranteeing a part or the entire asset value to third-party investors. A significant portion of the Group’s exposure is either retroceded or hedged. The assets held by the VIEs consist mainly of private equity investments and residential real estate.
The total assets of other VIEs, in which the Group holds variable interests but is not the primary beneficiary, was USD 3 189 million as of 30 June 2010.
The Group did not provide financial or other support to any VIEs in the second quarter of 2010 that it was not previously contractually required to provide.
Due to the implementation of ASU No. 2009-17, certain insurance-linked securitisations vehicles were consolidated from 1 January 2010 on, as the Group was considered to be the primary beneficiary under the new guidance. The Group recognised the assets, liabilities, and non-controlling interests of the newly consolidated VIEs at the carrying amounts at which the amount would have been carried in the consolidated financial statements if ASU No. 2009-17 had been effective when the Group first met the conditions to be the primary beneficiary.
From first quarter 2010 on, additional entities are included in the VIE disclosures due to a different materiality threshold and scope exceptions for disclosures under ASU No. 2009-17.
The impact as of 1 January 2010 on the Group’s assets and liabilities due to the additional consolidations under ASU No. 2009-17 was as follows:
USD millions 2010
Fixed income securities available-for-sale 473Short-term investments 362Other invested assets –32Cash and cash equivalents 793Other assets 71Total assets 1 667
Deferred and other non-current taxes 13Short-term debt 872Accrued expenses and other liabilities –40Long-term debt 797Net unrealised investment gains/losses, net of tax –35Retained earnings 60Total liabilities and shareholders’ equity 1 667

Notes to the Group financial statements (unaudited)
68 Swiss Re Second Quarter 2010 Report
The following table shows the total assets and liabilities on the Group’s balance sheet relating to VIEs of which the Group is the primary beneficiary as of 31 December 2009 and 30 June 2010.
As of 30 June 2010, the consolidation of the VIEs resulted in non-controlling interests in the balance sheet of USD 395 million (31 December 2009: USD 394 million). The net non-controlling interests in income were USD 11 million and USD –1 million net of tax for the periods ended 30 June 2009 and 2010, respectively.
The following table shows the total assets of VIEs of which the Group is the primary beneficiary for the periods ended 31 December 2009 and 30 June 2010.
USD millions 2009 2010
Insurance-linked/Credit-linked securitisations 158 1 817Debt financing 6 077 8 187Modified coinsurance agreement 3 242 3 363Other 26 26Total 9 503 13 393
USD millions 2009 2010
Fixed income securities:Available-for-sale (whereof restricted: 2009: 5 447; 2010: 8 090) 7 443 8 090Trading (whereof restricted: 2009: 988; 2010: 0) 1 132 20
Policy loans, mortgages and other loans (whereof restricted: 2010: 206) 217 566Short-term investments (whereof restricted: 2010: 1 194) 1 194Other invested assets 104 1 858Cash and cash equivalents (whereof restricted: 2009: 136; 2010: 810) 302 816Accrued investment income (whereof restricted: 2009: 42; 2010: 75) 73 75Premiums and other receivables (whereof restricted: 2010: 11) 15 11Reinsurance recoverable on unpaid claims and policy benefits (whereof restricted: 2010: 10) 10 10Income taxes recoverable (whereof restricted: 2010: 19) 19Acquired present value of future profits (whereof restricted: 2010: 15) 74 15Other assets (whereof restricted: 2009: 27; 2010: 707) 27 719Total assets 9 397 13 393
Unpaid claims and claim adjustment expenses (whereof limited recourse: 2010: 18) 19 18Liabilities for life and health policy benefits (whereof limited recourse: 2010: 1 196) 1 218 1 196Policyholder account balances (whereof limited recourse: 2010: 1 475) 1 515 1 475Reinsurance balances payable (whereof limited recourse: 2010: 4) 10 4Deferred and other non-current taxes (whereof limited recourse: 2010: 85) 40 85Short-term debt (whereof limited recourse: 2010: 641) 2 356Accrued expenses and other liabilities (whereof limited recourse: 2010: 184) 486 184Long-term debt (whereof limited recourse: 2010: 5 871) 5 377 5 871Total liabilities 8 665 11 189

Notes to the Group financial statements (unaudited)
Swiss Re Second Quarter 2010 Report 69
The following table shows the Group’s assets as of 30 June 2010, liabilities and maximum exposure to loss as of 31 December 2009 and 30 June 2010 which are related to VIEs in which the Group holds a variable interest but is not the primary beneficiary.
The liabilities of USD 87 million as of 30 June 2010 for insurance-linked and credit-linked securitisations represent mainly the negative fair value of the total return swaps the Group has entered into with the securitisation vehicles. The negative fair value is caused by a decrease in value of some of the assets held as collateral by the vehicles.
The assets and liabilities for the swaps in trusts category represent the positive and negative fair values of the derivatives the Group has entered into with the trusts.
Liabilities are recognised for certain debt financing VIEs when losses occur. To date the respective debt financing VIEs have not incurred any losses. Liabilities of USD 214 million recognised for the ‘Other’ category reflect the decline in value of the VIEs’ assets which are guaranteed by the Group.
2009 2010
USD millions Total liabilities Maximum exposure
to loss
Difference between exposure
and liabilities Total assets Total liabilitiesMaximum exposure
to loss
Difference between exposure
and liabilities
Insurance-linked/Credit-linkedsecuritisations 173 5 042 4 869 37 87 2 115 2 028Swaps in trusts 479 439 –1 –Debt financing 201 201 1 081 207 207Other 422 1 222 800 224 214 1 059 845Total 595 6 465 5 870 1 821 740 –1 –
1 The maximum exposure to loss for swaps in trusts cannot be meaningfully quantified due to their derivative character.
70 Swiss Re Second Quarter 2010 Report
Note on risk factors
General impact of adverse market conditionsBeginning in 2007, the global financial markets experienced extreme volatility and disruption, due in large part to turmoil affecting the liquidity of the banking system and the market reaction thereto. The impact of the turmoil in the financial markets was exacerbated by adverse macroeconomic trends affecting a number of the principal economies. Volatility and disruption reached unprecedented levels. It is difficult to predict what the impact of market and economic conditions would be on the Group from a general business perspective or from a capital or liquidity perspective were conditions to again deteriorate.
Swiss Re and its subsidiaries are regulated in a number of jurisdictions in which they conduct business. New legislation as well as changes to existing legislation have been proposed in a number of jurisdictions that seek to alter, in a variety of ways, the manner in which the financial services industry is regulated. Although it is difficult to predict which proposals will become law, it is likely that aspects of existing regulatory regimes governing financial services will change. These may include changes as to which governmental bodies regulate financial institutions, changes in the way financial institutions generally are regulated, enhanced governmental authority to take control over operations of financial institutions, restrictions on the conduct of certain lines of business, changes in the way financial institutions account for transactions and securities positions, changes in disclosure obligations and changes in the way rating agencies rate the creditworthiness and financial strength of financial institutions. Changes, for example, could impact capital requirements or have other direct or indirect effects on the Group. Changes may also occur in areas of broader application, such as competition policy and tax laws. Any number of these changes could apply to the Group and its operations. These changes could increase the costs of doing business, limit the scope of business or affect the competitive balance, or could make reinsurance less attractive to primary insurers.
Market riskVolatility and disruption in the global financial markets can expose the Group to significant financial and capital markets risk, including changes in interest rates, credit spreads, equity prices and foreign currency exchange rates, which may adversely impact the Group’s financial condition, results of operations and liquidity. The Group’s exposure to interest rate risk is primarily related to the market price and cash flow variability associated with changes in interest rates. Exposure to credit spreads primarily relates to market price and cash flow variability associated with changes in credit spreads. When credit spreads widen, the net unrealised loss position of the Group’s investment portfolio can increase, as could other-than-temporary impairments. With respect to equity prices, the Group is exposed to changes in the level and volatility of equity prices, as they affect the value of equity securities themselves as well as the value of securities or instruments that derive their value from a particular equity security, a basket of equity securities or a stock index. The Group is also subject to equity price risk to the extent that the value of life-related benefits under certain life contracts, most notably variable annuity business, are tied to financial market values; to the extent market values fall, the financial exposure on guarantees related to these contracts would increase to the extent this exposure is not hedged. While the Group has an extensive hedging programme for variable annuities, certain risks cannot be hedged, including actuarial risks, basis risk and correlation risk. Exposure to foreign exchange risk arises from exposures to changes in spot prices, forward prices and volatile movements in exchange rates.
These risks can have a significant effect on investment returns, which in turn may affect both the Group’s results of operations and financial condition. The Group is focused on asset-liability management for its investment portfolio, but pursuing even this strategy has its risks, including possible mismatch, that in turn can lead to reinvestment risk. The Group seeks to manage the risks inherent in its investment portfolio by repositioning the portfolio from time to time, as needed, and to reduce risk and fluctuations through the use of hedges and other risk management tools. The Group has moved to reduce risk to the portfolio by repositioning the components of the portfolio and, as a result, profitability will potentially be impacted, and, unless offset by underwriting returns, will be reduced.

Note on risk factors
Swiss Re Second Quarter 2010 Report 71
Credit riskLike other financial institutions, the Group was adversely impacted by the deterioration in the credit markets beginning in 2007. During this period, the unprecedented and severe ratings downgrades that the Group and others experienced, and the absence of a liquid market for credit-related and other securities, resulted in a significant and material reduction in the value of the underlying assets. Although the Group has taken significant steps to de-risk its portfolio and reposition its assets, if the credit markets were again to deteriorate, the Group could experience further losses. Changes in the market value of the underlying securities and other factors impacting their price could give rise to market value losses. If the credit markets were to deteriorate again, the Group could face further write-downs in other areas of its portfolio, including other structured instruments, and the Group and its counterparties could once again face difficulties in valuing credit-related instruments.
Valuation processes can produce significantly different outcomes, which could create additional uncertainty and differences of opinion among counterparties to swaps and other similar instruments as to obligations in respect of collateral and other terms of such instruments. These differences in opinion, in turn, could result in legal disputes among counterparties as to their respective obligations, the outcomes of which are difficult to predict and could be material.
The Group becomes aware of counterparty valuations either directly, through the exchange of information, or indirectly, for example, through demands to post collateral. These valuations may differ significantly from the Group’s estimates. Counterparty valuation estimates for collateral purposes are considered during the independent price verification process and may result in adjustments to initially indicated valuations. Resolution of any dispute in relation to asset valuation in which the Group may become involved with counterparties, in a manner adverse to it could have a material adverse effect on the Group’s financial condition and results of operations.
Liquidity risksThe Group’s business requires, and its clients expect, that it has sufficient capital and sufficient liquidity to meet its reinsurance obligations, and that that would continue to be the case following the occurrence of any event or series of events, including extreme catastrophes, that would trigger insurance or reinsurance coverage obligations. The Group’s uses of funds include obligations arising in its reinsurance business (including claims and other payments as well as insurance provision repayments due to portfolio transfers, securitisations and commutations), which may include large and unpredictable claims (including catastrophe claims), funding of capital requirements and operating costs, payment of principal and interest on outstanding indebtedness and funding of acquisitions. The Group also enters into contracts or trading arrangements that could give rise to significant short-term funding obligations and, in connection with the Group’s trading operations, it could be subject to unexpected calls to deliver collateral or unwind trading positions at a net cost to it. The Group also has unfunded capital commitments in its private equity and hedge fund investments, which could result in funding obligations at a time when it is subject to liquidity constraints.

Note on risk factors
72 Swiss Re Second Quarter 2010 Report
The Group manages liquidity and funding risks by focusing on the liquidity stress that is likely to result from extreme capital markets scenarios or from extreme insurance events or combinations of the two. Generally, the ability to meet liquidity needs could be adversely impacted by factors that the Group cannot control, such as market dislocations or interruptions, the economic downturn, continued severe disruption in the financial and worldwide credit markets and the related increased constraints on the availability of credit, changes in interest rates and credit spreads, or by perceptions among market participants of the extent of the Group’s liquidity needs.
The Group may not be able to secure new sources of liquidity or funding, should projected or actual liquidity fall below levels it requires. The ability to meet liquidity needs through asset sales may be constrained by market conditions and the related stress on valuations and through third-party funding may be limited by constraints on the general availability of credit and willingness of lenders to lend. In addition, the Group’s ability to meet liquidity needs may also be constrained by regulatory requirements that require regulated entities to maintain regulatory capital or that restrict intra-group transactions, the timing of dividend payments from subsidiaries or the fact that certain assets may be encumbered or otherwise non-tradeable. Finally, any adverse ratings action could trigger a need for further liquidity (for example, by triggering termination provisions or collateral delivery requirements in contracts to which the Group is a party) at a time when the Group’s ability to obtain liquidity from external sources is limited by such ratings action.
Counterparty risksThe Group’s general exposure to counterparty risk was heightened during the credit crisis, and this risk could still be exacerbated to the extent defaults, or concerns about possible defaults, by certain market participants trigger more systemic concerns about liquidity. Losses due to defaults by counterparties, including issuers of investment securities (which include structured securities) or derivative instrument counterparties, could adversely affect the Group. In addition, trading counterparties, counterparties under swaps and other derivative contracts and financial intermediaries may default on their obligations due to bankruptcy, insolvency, lack of liquidity, adverse economic conditions, operational failure, fraud or other reasons, which could also have a material adverse impact on the Group.
The Group could also be adversely affected by the insolvency of, or other credit constraints affecting, counterparties in its reinsurance operations. Moreover, the Group could be adversely affected by liquidity issues at ceding companies or at third parties to whom the Group has retroceded risk, and such risk could be exacerbated to the extent any such exposures are concentrated. The Group’s most significant single counterparty risk is in respect of Berkshire Hathaway Inc., with which it has a quota share arrangement, an adverse development cover and a retrocession arrangement in respect of a closed block of US individual life reinsurance business.

Note on risk factors
Swiss Re Second Quarter 2010 Report 73
Risks relating to credit rating downgradesRatings are an important factor in establishing the competitive position of reinsurance companies, and market conditions could increase the risk of downgrade. Third-party rating agencies assess and rate the financial strength of reinsurers and insurers, such as Swiss Re. These ratings are intended to measure a company’s ability to repay its obligations and are based upon criteria established by the rating agencies. The Group’s ratings came under pressure due to the additional asset write-downs it recorded for the fourth quarter of 2008 and the resulting impact on the Group’s capital position.
The Group’s ratings reflect the current opinion of the relevant rating agencies. One or more of its ratings could be downgraded or withdrawn in the future. Rating agencies may heighten their scrutiny of rated companies, increase the frequency and scope of ratings reviews, revise their criteria or take other actions that may negatively impact the Group’s ratings, which cannot be predicted. In addition, the occurrence of any of the foregoing on the part of rating agencies, or the occurrence of events or developments affecting the Group, could make it more difficult for the Group to achieve improved ratings which it would otherwise have expected.
As claims paying and financial strength ratings are key factors in establishing the competitive position of reinsurers, a decline in ratings alone could make reinsurance provided by the Group less attractive to clients relative to reinsurance from competitors with similar or stronger ratings. A decline in ratings could also cause the loss of clients who are required by either policy or regulation to purchase reinsurance only from reinsurers with certain ratings. A further decline in ratings could also impact the availability of unsecured financing and obligate the Group to provide collateral or other guarantees in the course of its reinsurance business or trigger early termination of funding arrangements. Any rating downgrades could also have a material adverse impact on the Group’s costs of borrowing and limit its access to the capital markets. Further negative ratings action could also impact reinsurance contracts.
Legal and regulatory risksThe Group has been named, from time to time, as a defendant in various legal actions in connection with its operations. The Group is also involved, from time to time, in investigations and regulatory proceedings, certain of which could result in adverse judgments, settlements, fines and other outcomes. The number of these investigations and proceedings involving the financial services industry has increased in recent years. The Group could also be subject to risk from potential employee misconduct, including non-compliance with internal policies and procedures. Substantial legal liability could materially adversely affect the Group’s business, financial condition or results of operations or could cause significant reputational harm, which could seriously harm its business.
A number of lawsuits have been filed against financial service firms raising claims tied to the unprecedented market turmoil. Swiss Re is subject to one such action, which is a putative securities class action filed in the United States District Court for the Southern District of New York in February 2008 against it and certain of its executive officers alleging false and misleading statements in connection with the mark-to-market loss, announced on 19 November 2007. Plaintiff seeks to certify a class of all U.S. residents or citizens that purchased Swiss Re stock between 1 March 2007 and 19 November 2007. Swiss Re plans to vigorously defend the lawsuit. On 4 September 2009, Swiss Re filed a motion to dismiss and requested oral argument. Plaintiff filed an opposition to that motion on 25 September 2009, to which Swiss Re submitted a reply brief on 9 October 2009. A further hearing on the motion to dismiss was held on 29 July 2010. The parties are awaiting the court’s decision. The Group cannot predict whether it could be subject to further claims arising out of the market turmoil.

Note on risk factors
74 Swiss Re Second Quarter 2010 Report
Insurance, operational and other risksAs part of the Group’s ordinary course operations, the Group is subject to a variety of risks, including risks that reserves may not adequately cover future claims and benefits, risks that catastrophic events (including hurricanes, windstorms, floods, earthquakes, explosions, fires and pandemics) may expose the Group to unexpected large losses, competitive conditions, cyclicality of the industry, risks related to emerging claims and coverage issues, risks arising from the Group’s dependence on policies, procedures and expertise of ceding companies, and risks related to the failure of operational systems and infrastructure. In addition, the occurrence of future risks that the Group’s risk management procedures fail to identity or anticipate could have a material adverse effect on the Group.
Use of models; accounting mattersThe Group is subject to risks relating to the preparation of estimates and assumptions that management uses, for example, as part of its risk models as well as those that affect the reported amounts of assets, liabilities, revenues and expenses in the Group’s financial statements, including assumed and ceded business. For example, the Group estimates premiums pending receipt of actual data from ceding companies, which actual data could deviate from the estimates. To the extent that management’s estimates or assumptions prove to be incorrect, it could have a material impact on underwriting results (in the case of risk models) or on reported financial condition or results of operations, and such impact could be material.
The Group’s results may be impacted by changes in standards, or changes in the interpretation of standards, in respect of fair value accounting or impairments. Its results may also be impacted if regulatory authorities take issue with any conclusions the Group may reach on fair value accounting or other accounting matters.
The Group uses non-GAAP financial measures in its external reporting, including in this report. These measures are not prepared in accordance with US GAAP or any other comprehensive set of accounting rules or principles, and should not be viewed as a substitute for measures prepared in accordance with US GAAP. Moreover, these may be different from or otherwise inconsistent with non-GAAP financial measures used by other companies. These measures have inherent limitations, are not required to be uniformly applied and are not audited.

Swiss Re Second Quarter 2010 Report 75
This page intentionally left blank

76 Swiss Re Second Quarter 2010 Report
Cautionary note on forward-looking statements
Certain statements and illustrations contained herein are forward-looking. These statements and illustrations provide current expectations of future events based on certain assumptions and include any statement that does not directly relate to a historical fact or current fact.
Forward-looking statements typically are identified by words or phrases such as “anticipate“, “assume“, “believe“, “continue“, “estimate“, “expect“, “foresee“, “intend“, “may increase“ and “may fluctuate“ and similar expressions or by future or conditional verbs such as “will“, “should“, “would“ and “could“. These forward-looking statements involve known and unknown risks, uncertainties and other factors, which may cause Swiss Re’s actual results, performance, achievements or prospects to be materially different from any future results, performance, achievements or prospects expressed or implied by such statements. Such factors include, among others: further instability affecting the global financial system and developments related thereto; changes in global economic conditions; Swiss Re’s ability to maintain sufficient liquidity and access to capital markets, including
sufficient liquidity to cover potential recapture of reinsurance agreements, early calls of debt or debt-like arrangements and collateral calls under derivative contracts due to actual or perceived deterioration of Swiss Re’s financial strength;
the effect of market conditions, including the global equity and credit markets, and the level and volatility of equity prices, interest rates, credit spreads, currency values and other market indices, on Swiss Re’s investment assets;
changes in Swiss Re’s investment result as a result of changes in its investment policy or the changed composition of its investment assets, and the impact of the timing of any such changes relative to changes in market conditions;
uncertainties in valuing credit default swaps and other credit-related instruments; possible inability to realise amounts on sales of securities on Swiss Re’s balance sheet
equivalent to its mark-to-market values recorded for accounting purposes; the outcome of tax audits, the ability to realise tax loss carryforwards and the ability to
realise deferred tax assets (including by reason of the mix of earnings in a jurisdiction or deemed change of control), which could negatively impact future earnings;
the possibility that hedging arrangements may not be effective; the lowering or loss of financial strength or other ratings of one or more of the companies
in the Group or developments adversely affecting the ability to achieve improved ratings; the cyclicality of the reinsurance industry; uncertainties in estimating reserves; the frequency, severity and development of insured claim events; acts of terrorism and acts of war; mortality and morbidity experience; policy renewal and lapse rates; extraordinary events affecting Swiss Re’s clients and other counterparties, such as
bankruptcies, liquidations and other credit-related events; current, pending and future legislation and regulation affecting Swiss Re or its ceding
companies, and regulatory or legal actions; changes in accounting standards; significant investments, acquisitions or dispositions, and any delays, unexpected costs or
other issues experienced in connection with any such transactions, including, in the case of acquisitions, issues arising in connection with integrating acquired operations;
changing levels of competition; and operational factors, including the efficacy of risk management and other internal
procedures in managing the foregoing risks.
These factors are not exhaustive. Swiss Re operates in a continually changing environment and new risks emerge continually. Readers are cautioned not to place undue reliance on forward-looking statements. Swiss Re undertakes no obligation to publicly revise or update any forward-looking statements, whether as a result of new information, future events or otherwise.
© 2010 Swiss Re. All rights reserved.
Title:Second Quarter 2010 Report
Original version in English
The Second Quarter 2010 Report is also available in German.
The web version of the Second Quarter 2010 Report is available at: www.swissre.com /investors
Order no: 1492019_10_en
CCHCC, 08 /10, 1 500 en
Corporate calendar and contact information
Corporate calendar4 November 2010Third quarter 2010 results
17 February 20112010 annual results
15 April 2011147th Annual General Meeting
5 May 2011 First quarter 2011 results
4 August 2011 Second quarter 2011 results
3 November 2011 Third quarter 2011 results
Contact informationInvestor RelationsSusan HollidayTelephone +41 43 285 4444Fax +41 43 282 [email protected]
Media RelationsSimone LauperTelephone +41 43 285 7171Fax +41 43 282 [email protected]
Share RegisterKarl HaasTelephone +41 43 285 3294Fax +41 43 282 [email protected]

Swiss Reinsurance Company Ltd Mythenquai 50/60 P.O. Box 8022 Zurich Switzerland
Telephone +41 43 285 2121 Fax +41 43 285 2999 www.swissre.com