summary of consolidated second quarter results …english translation) summary of consolidated...
TRANSCRIPT
(English Translation)
Summary of Consolidated Second Quarter Results for 2010 30 July 2010 Listed Company Name: Showa Shell Sekiyu K. K. Listed Stock Exchange: Tokyo Stock Exchange 1st Section Code Number: 5002 URL http://www.showa-shell.co.jpDelegate: Title: President, Representative Director Name: Jun Arai Contact: Title: Controller, Corporate Officer Name: Kiyotaka Yamada Phone: (03) 5531-5591
Expected date of quarterly report submission: 12 August 2010 Expected date of dividend payment: 8 September 2010 Supporting material for Quarter results: Applicable Quarter results briefing: Applicable (For analysts and institutional investors)
(Note) Fractions of one million yen are rounded off.
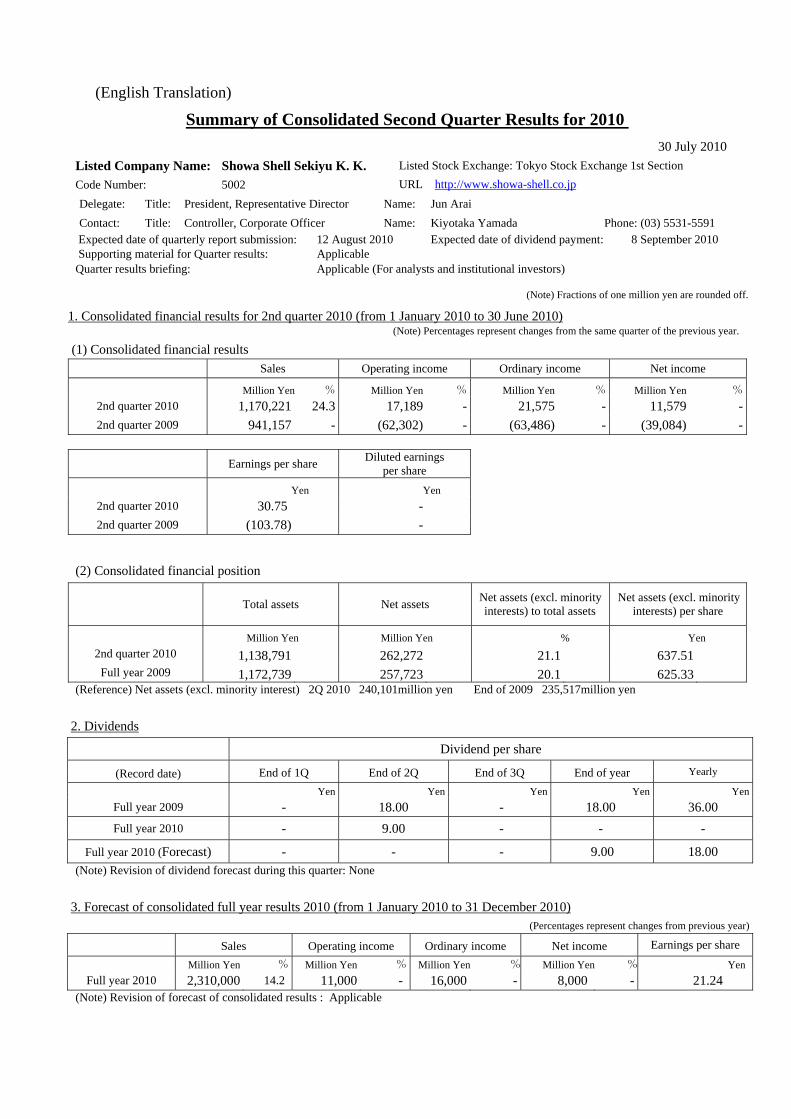
1. Consolidated financial results for 2nd quarter 2010 (from 1 January 2010 to 30 June 2010)(Note) Percentages represent changes from the same quarter of the previous year.
(1) Consolidated financial results
Sales Operating income Ordinary income Net income
Million Yen % Million Yen % Million Yen % Million Yen %
2nd quarter 2010 1,170,221 24.3 17,189 - 21,575 - 11,579 -2nd quarter 2009 941,157 - (62,302) - (63,486) - (39,084) -
Earnings per share Diluted earnings per share
Yen Yen 2nd quarter 2010 30.75 - 2nd quarter 2009 (103.78) -
(2) Consolidated financial position
Total assets Net assets Net assets (excl. minority interests) to total assets
Net assets (excl. minorityinterests) per share
Million Yen Million Yen % Yen 2nd quarter 2010 1,138,791 262,272 21.1 637.51Full year 2009 1,172,739 257,723 20.1 625.33
(Reference) Net assets (excl. minority interest) 2Q 2010 240,101million yen End of 2009 235,517million yen
2. Dividends
Dividend per share
(Record date) End of 1Q End of 2Q End of 3Q End of year Yearly
Yen Yen Yen Yen YenFull year 2009 - 18.00 - 18.00 36.00 Full year 2010 - 9.00 - - -
Full year 2010 (Forecast) - - - 9.00 18.00 (Note) Revision of dividend forecast during this quarter: None
3. Forecast of consolidated full year results 2010 (from 1 January 2010 to 31 December 2010) (Percentages represent changes from previous year)
Sales Operating income Ordinary income Net income Earnings per share
Million Yen % Million Yen % Million Yen % Million Yen % YenFull year 2010 2,310,000 14.2 11,000 - 16,000 - 8,000 - 21.24
(Note) Revision of forecast of consolidated results : Applicable
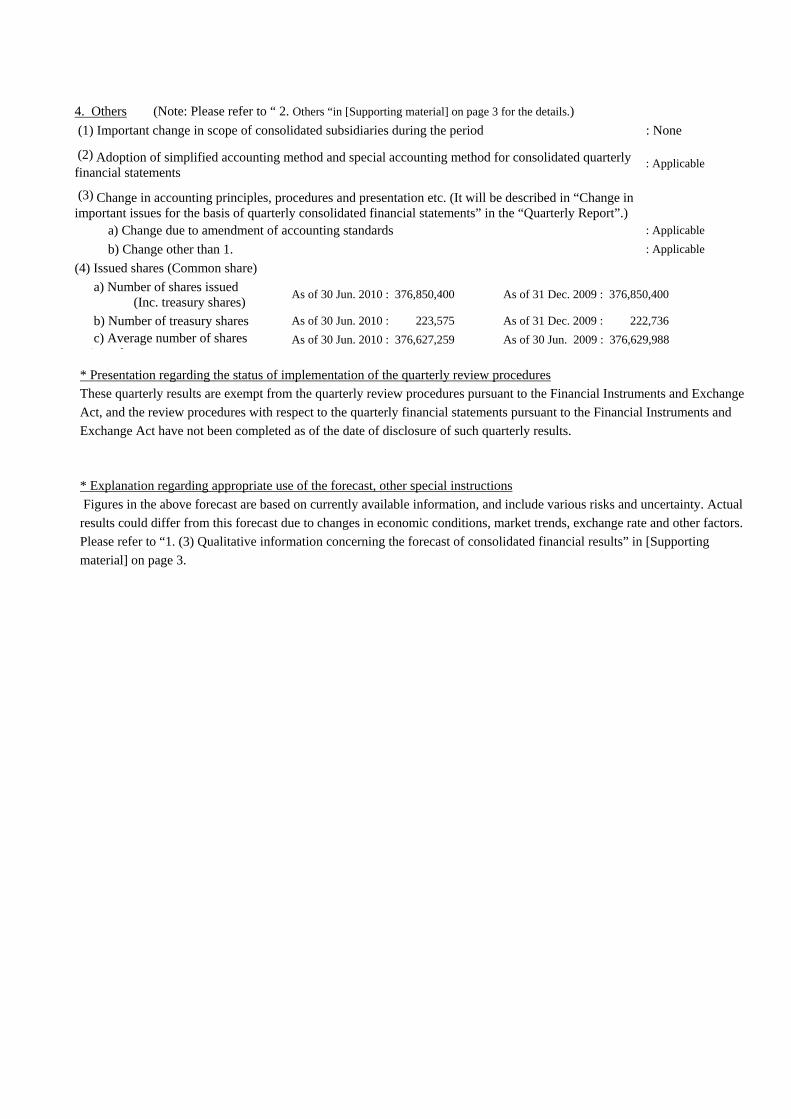
4. Others (Note: Please refer to “ 2. Others “in [Supporting material] on page 3 for the details.) (1) Important change in scope of consolidated subsidiaries during the period : None
(2) Adoption of simplified accounting method and special accounting method for consolidated quarterly financial statements : Applicable
(3) Change in accounting principles, procedures and presentation etc. (It will be described in “Change in important issues for the basis of quarterly consolidated financial statements” in the “Quarterly Report”.)
a) Change due to amendment of accounting standards : Applicable b) Change other than 1. : Applicable (4) Issued shares (Common share)
a) Number of shares issued (Inc. treasury shares) As of 30 Jun. 2010 : 376,850,400 As of 31 Dec. 2009 : 376,850,400
b) Number of treasury shares As of 30 Jun. 2010 : 223,575 As of 31 Dec. 2009 : 222,736
c) Average number of shares i d
As of 30 Jun. 2010 : 376,627,259 As of 30 Jun. 2009 : 376,629,988
* Presentation regarding the status of implementation of the quarterly review procedures These quarterly results are exempt from the quarterly review procedures pursuant to the Financial Instruments and Exchange Act, and the review procedures with respect to the quarterly financial statements pursuant to the Financial Instruments and Exchange Act have not been completed as of the date of disclosure of such quarterly results.
* Explanation regarding appropriate use of the forecast, other special instructions Figures in the above forecast are based on currently available information, and include various risks and uncertainty. Actual results could differ from this forecast due to changes in economic conditions, market trends, exchange rate and other factors. Please refer to “1. (3) Qualitative information concerning the forecast of consolidated financial results” in [Supporting material] on page 3.
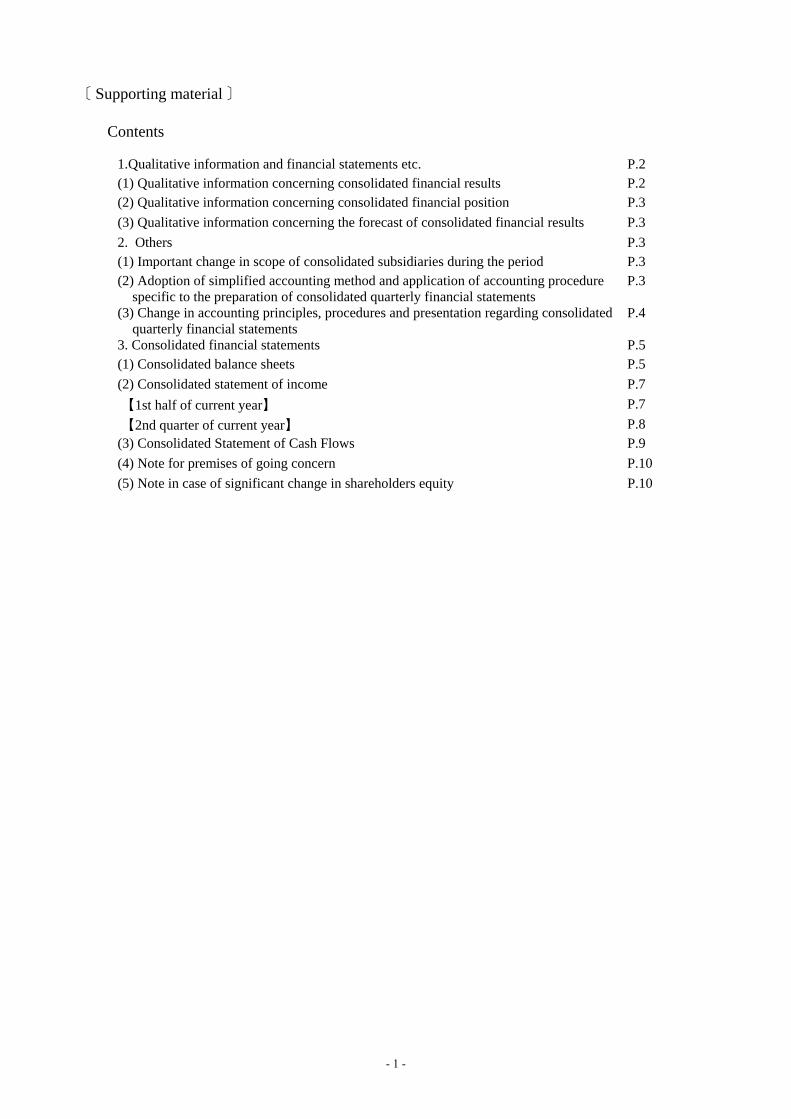
〔 Supporting material 〕 Contents
1.Qualitative information and financial statements etc. P.2 (1) Qualitative information concerning consolidated financial results P.2 (2) Qualitative information concerning consolidated financial position P.3 (3) Qualitative information concerning the forecast of consolidated financial results P.3 2. Others P.3 (1) Important change in scope of consolidated subsidiaries during the period P.3 (2) Adoption of simplified accounting method and application of accounting procedure
specific to the preparation of consolidated quarterly financial statements P.3
(3) Change in accounting principles, procedures and presentation regarding consolidated quarterly financial statements
P.4
3. Consolidated financial statements P.5 (1) Consolidated balance sheets P.5 (2) Consolidated statement of income P.7 【1st half of current year】 P.7 【2nd quarter of current year】 P.8 (3) Consolidated Statement of Cash Flows P.9 (4) Note for premises of going concern P.10 (5) Note in case of significant change in shareholders equity P.10
- 1 -
1. Qualitative information and consolidated financial statements etc. (1) Qualitative information concerning consolidated financial results
Regarding crude oil prices for the six-month period for 2010 (from 1 January 2010 to 30 June 2010), Dubai crude oil prices, which started at the 78-dollar per barrel level at the beginning of this year, once dropped below the 70 dollars per barrel level. Prices then remained stable primarily due to the weak dollar against the euro and the favorable global economic outlook to go higher once reaching 87 dollars per barrel at the beginning of May. However, crude oil prices fell sharply, plunging at one point below 70 dollars per barrel, reflecting concerns about a global economic slump caused by the financial crisis in the eurozone countries, including Greece, and the investors’ rush to avoid risky assets. Thereafter, the prospect of financial assistance packages to limit the financial crisis promoted the recovery of crude oil prices to close the second quarter at the 73-dollars per barrel. The exchange rate, which started the year at 93 yen per US dollar, appreciated to 88 yen per dollar in early March due to the uncertainty about the US economy backed by deterioration in US economic indicators and the Financial Regulatory Reform Bill, as well as the fiscal problems in Greece. The dollar then appreciated following an increase in US interest rates and global equity appreciation to trade at 93 yen per dollar. Subsequently, there was a further rise in the yen from the middle of May because of uncertainty over debt problems facing the eurozone, the fall in European equities, and concerns over a global economic slowdown to close the second quarter at 88 yen per dollar. With regard to the sales of oil products, sales of gasoline were significantly lower than for the same period the previous year due to weak demand after consecutive holidays in May by general consumers who felt that a moderate economic recovery was not at hand. Kerosene, which had enjoyed solid demand in April mainly due to lower average temperatures over the same period a year ago, largely fell below the level during the same period one year ago because of promoted fuel conversion for industrial applications. Sales of diesel oil were less than the same period a year ago owing to a further reduction in the number of trucks as a result of streamlining the logistics systems. Sales of fuel oil were remarkably lower compared with the same period a year ago due to fuel conversion by customers and weak demand for fired electric power generation caused by increased electric energy production from hydraulic or nuclear sources.
In such a business environment, the Showa Shell Sekiyu Group posted consolidated sales of 1,170.2 billion yen (a 24.3% increase compared to the same period a year ago), consolidated operating income of 17.1 billion yen (an increase of 79.4 billion yen compared to the same period a year ago), and consolidated ordinary income of 21.5 billion yen (an increase of 85.0 billion yen compared to the same period a year ago) for the current six-month period of 2010. This was attributable to the impact of the inventory valuation at the beginning of the current six-month period that brought us a significant increase in profit compared to the same period a year ago and the margin recovery driven by improvements in oil product market conditions despite the decline in sales of oil products. In addition, the relevant consolidated ordinary income, excluding the impact of the inventory valuation, was 11.1 billion yen, an increase of 5.0 billion yen compared to the same period a year ago.
With regard to the solar cell business, Showa Shell Solar K.K., a consolidated subsidiary of the Company, established sales subsidiaries in the USA (Northern California) and Germany (Munich, Bayern), changing its name to Solar Frontier K.K. on 1 April 2010 to facilitate business operations by the global branding consolidation under a single name. The Group’s efforts also extend to sales activities in Japan, building a sound network of agencies to accelerate sales operations for residential and industrial solutions, and launching an approach towards the large-scale power generation business, which includes a project for a megawatt scale solar power generation installment to be subsidized in a partnership with Niigata Prefecture with the commencement of operations of the Kunitomi plant (third plant) in Miyazaki Prefecture scheduled for the second half of 2011 in its sales perspectives.
- 2 -
As for the electric power business, the Group became an electric power retail supplier in the Kanto region after
commencing operations of the first natural gas fired large-scale electric power generation plant, which was carried out by Ohgishima Power Co., Ltd., a joint venture with Tokyo Gas Co., Ltd. Preparations for commencement of operations of the second plant in July, including trial operation, are progressing steadily while the existing electric power retail and wholesale transactions of electric power through the Japan Electric Power Exchange (JEPX) are continuously underway.
(2) Qualitative information concerning consolidated financial position
Total assets reached 1,138.7 billion yen at the end of the second quarter, a decrease of 33.9 billion yen from the end of the previous year. This was mainly attributable to a decrease in accounts receivable due to a decrease in sales volume.
Net assets reached 262.2 billion yen, an increase of 4.5 billion yen from the end of the previous year. This was mainly attributable to positive factors, such as net income for the current six-month period exceeding negative factors like the final dividend.
The balance of interest-bearing liabilities (total of long- and short-term debts, commercial paper, and corporate bonds) posted 307.5 billion yen, an increase of 9.4 billion yen from the end of the previous year. As a result, capital adequacy stands at 21.1% at the end of the second quarter of the current consolidated financial year.
(3) Qualitative information concerning the forecast of consolidated financial results As for the outlook for full year 2010, we have revised the previous forecast originally released on 23rd February 2010. Please refer to “Announcement of revisions in the forecast of full year results 2010” released today for details. 2. Others
(1) Important change in scope of consolidated subsidiaries during the period None
(2) Adoption of simplified accounting method and application of accounting procedure specific to the preparation of consolidated quarterly financial statements
a) Simplified accounting method
With regard to the judgment of collectibility of deferred tax assets, as the business environment and temporary differences are deemed not to have been changed significantly since the end of the previous financial year, the method of which the way used in the previous consolidated financial year on the future earnings forecast and tax planning has been adopted.
b) Accounting procedure specific to the preparation of consolidated quarterly financial statements None
- 3 -
(3) Change in accounting principles, procedures and presentation regarding consolidated quarterly financial
statements a) Change in the depreciation method of important depreciable assets Some consolidated subsidiaries, which had adopted the declining balance method for tangible fixed assets, changed the depreciation method to the straight-line method in the first quarter of the current consolidated financial year. The change was implemented because the straight-line method is a more rational depreciation method to further improve the appropriateness of periodical accounting of profit and loss. It was a result of re-examination regarding the investment purposes and the use of refineries held by the consolidated subsidiaries, given the change in economic environment for the oil industry. The change caused an increase of 688 million yen in operating income and ordinary income, and an increase of 684 million yen in net income before taxes, compared with the previous method. b) Change in the standards for recording net sales of completed construction contracts and cost of sales of
completed construction contracts Regarding the standard for recording income from contract work, the percentage of the completion method and the completed contract method had been applied to construction projects worth 5 billion yen or more with a construction period of more than one year and other construction projects. The Group applied the Accounting Standards for Construction Contracts (Accounting Standards Board of Japan (ASBJ) Statement No. 15, December 27, 2007) and the Implementation Guidance on Accounting Standards for Construction Contracts (Implementation Guidance of ASBJ Statement No. 18, December 27, 2007) in the first quarter of the current consolidated financial year. From construction contracts started during the first quarter of the current consolidated financial year, the percentage of the completion method (cost related method for estimation of complete percentage) and the completed contract method are applied to construction projects recognized to hold certainty of outcomes for the portion completed by the end of the second quarter and other construction projects. The change caused an increase of 123 million yen in net sales, and an increase of 21 million yen in operating income, ordinary income, and net income before taxes, compared with the previous method.
- 4 -
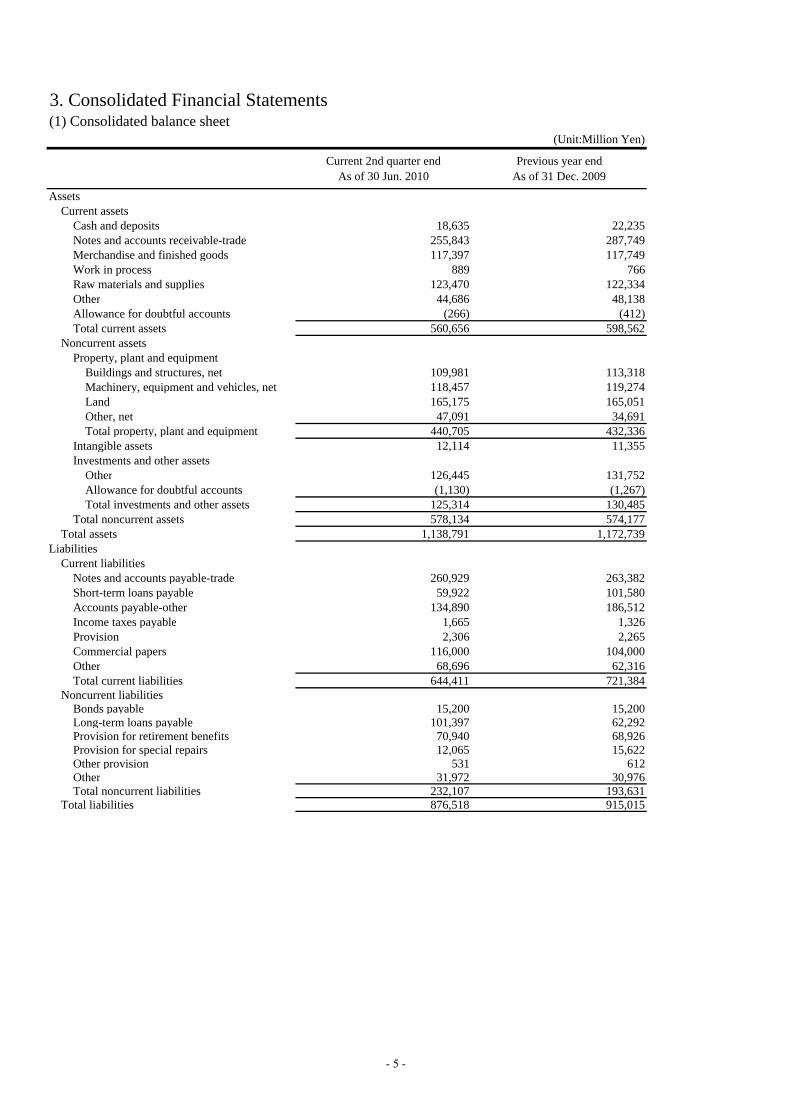
(1) Consolidated balance sheet(Unit:Million Yen)
Current 2nd quarter endAs of 30 Jun. 2010
Previous year endAs of 31 Dec. 2009
Assets Current assets Cash and deposits 18,635 22,235 Notes and accounts receivable-trade 255,843 287,749 Merchandise and finished goods 117,397 117,749 Work in process 889 766 Raw materials and supplies 123,470 122,334 Other 44,686 48,138 Allowance for doubtful accounts (266) (412) Total current assets 560,656 598,562 Noncurrent assets Property, plant and equipment Buildings and structures, net 109,981 113,318 Machinery, equipment and vehicles, net 118,457 119,274 Land 165,175 165,051 Other, net 47,091 34,691 Total property, plant and equipment 440,705 432,336 Intangible assets 12,114 11,355 Investments and other assets Other 126,445 131,752 Allowance for doubtful accounts (1,130) (1,267) Total investments and other assets 125,314 130,485 Total noncurrent assets 578,134 574,177 Total assets 1,138,791 1,172,739Liabilities Current liabilities Notes and accounts payable-trade 260,929 263,382 Short-term loans payable 59,922 101,580 Accounts payable-other 134,890 186,512 Income taxes payable 1,665 1,326 Provision 2,306 2,265 Commercial papers 116,000 104,000 Other 68,696 62,316 Total current liabilities 644,411 721,384 Noncurrent liabilities Bonds payable 15,200 15,200 Long-term loans payable 101,397 62,292 Provision for retirement benefits 70,940 68,926 Provision for special repairs 12,065 15,622 Other provision 531 612 Other 31,972 30,976 Total noncurrent liabilities 232,107 193,631 Total liabilities 876,518 915,015
3. Consolidated Financial Statements
- 5 -
(Unit:Million Yen)
Current 2nd quarter endAs of 30 Jun. 2010
Previous year endAs of 31 Dec. 2009
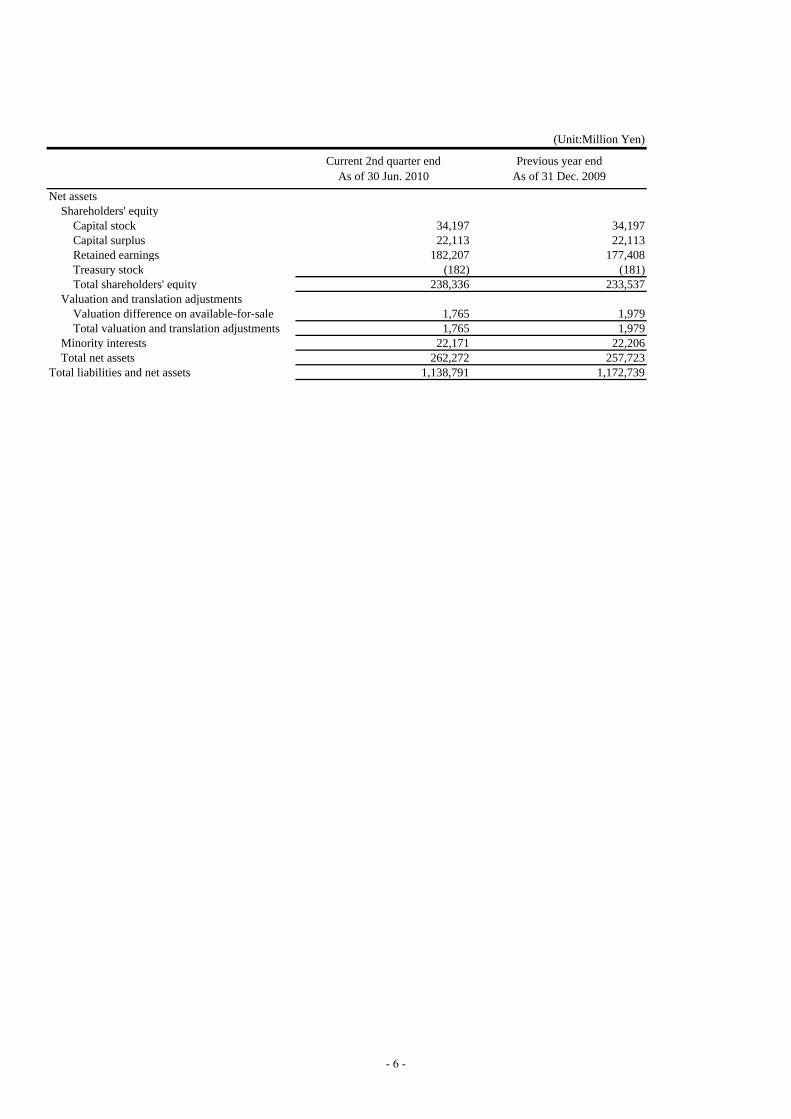
Net assets Shareholders' equity Capital stock 34,197 34,197 Capital surplus 22,113 22,113 Retained earnings 182,207 177,408 Treasury stock (182) (181) Total shareholders' equity 238,336 233,537 Valuation and translation adjustments Valuation difference on available-for-sale 1,765 1,979 Total valuation and translation adjustments 1,765 1,979 Minority interests 22,171 22,206 Total net assets 262,272 257,723Total liabilities and net assets 1,138,791 1,172,739
- 6 -
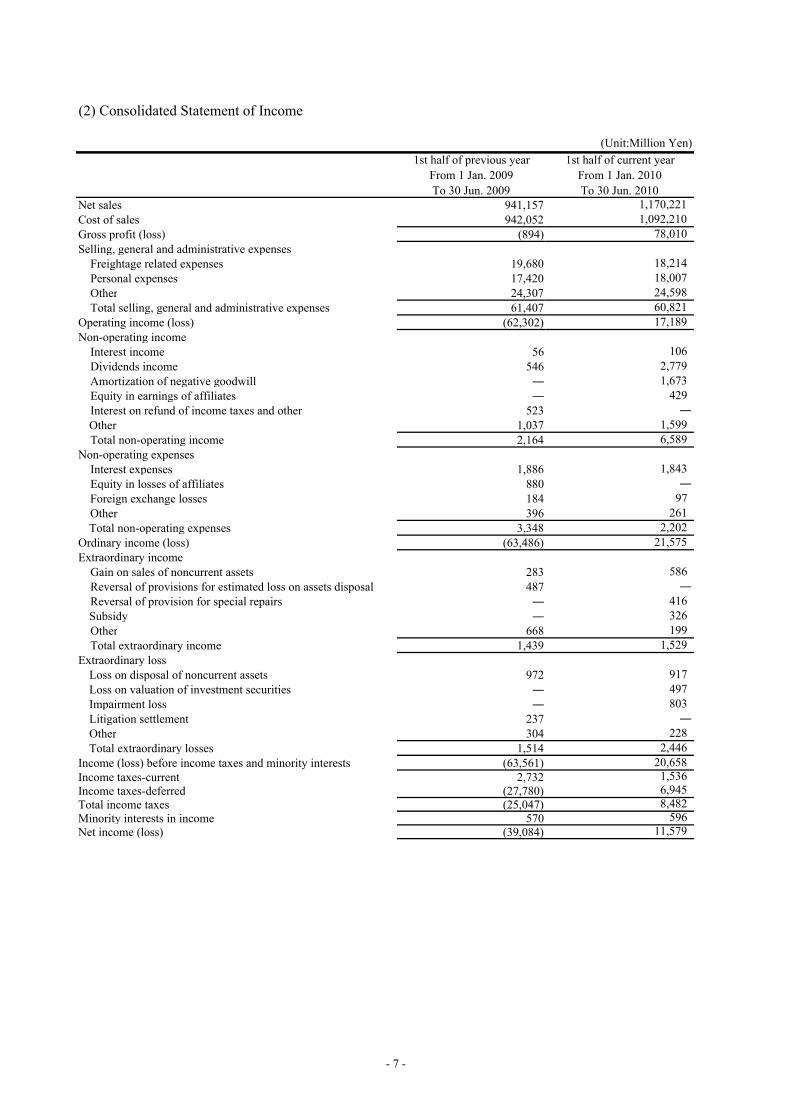
(2) Consolidated Statement of Income
(Unit:Million Yen)1st half of previous year
From 1 Jan. 2009To 30 Jun. 2009
1st half of current yearFrom 1 Jan. 2010To 30 Jun. 2010
Net sales 941,157 1,170,221Cost of sales 942,052 1,092,210Gross profit (loss) (894) 78,010Selling, general and administrative expenses Freightage related expenses 19,680 18,214 Personal expenses 17,420 18,007 Other 24,307 24,598 Total selling, general and administrative expenses 61,407 60,821Operating income (loss) (62,302) 17,189Non-operating income Interest income 56 106 Dividends income 546 2,779 Amortization of negative goodwill ― 1,673 Equity in earnings of affiliates ― 429 Interest on refund of income taxes and other 523 ― Other 1,037 1,599 Total non-operating income 2,164 6,589Non-operating expenses Interest expenses 1,886 1,843 Equity in losses of affiliates 880 ― Foreign exchange losses 184 97 Other 396 261 Total non-operating expenses 3,348 2,202Ordinary income (loss) (63,486) 21,575Extraordinary income Gain on sales of noncurrent assets 283 586 Reversal of provisions for estimated loss on assets disposal 487 ― Reversal of provision for special repairs ― 416 Subsidy ― 326 Other 668 199 Total extraordinary income 1,439 1,529Extraordinary loss Loss on disposal of noncurrent assets 972 917 Loss on valuation of investment securities ― 497 Impairment loss ― 803 Litigation settlement 237 ― Other 304 228 Total extraordinary losses 1,514 2,446Income (loss) before income taxes and minority interests (63,561) 20,658Income taxes-current 2,732 1,536Income taxes-deferred (27,780) 6,945Total income taxes (25,047) 8,482Minority interests in income 570 596Net income (loss) (39,084) 11,579
- 7 -
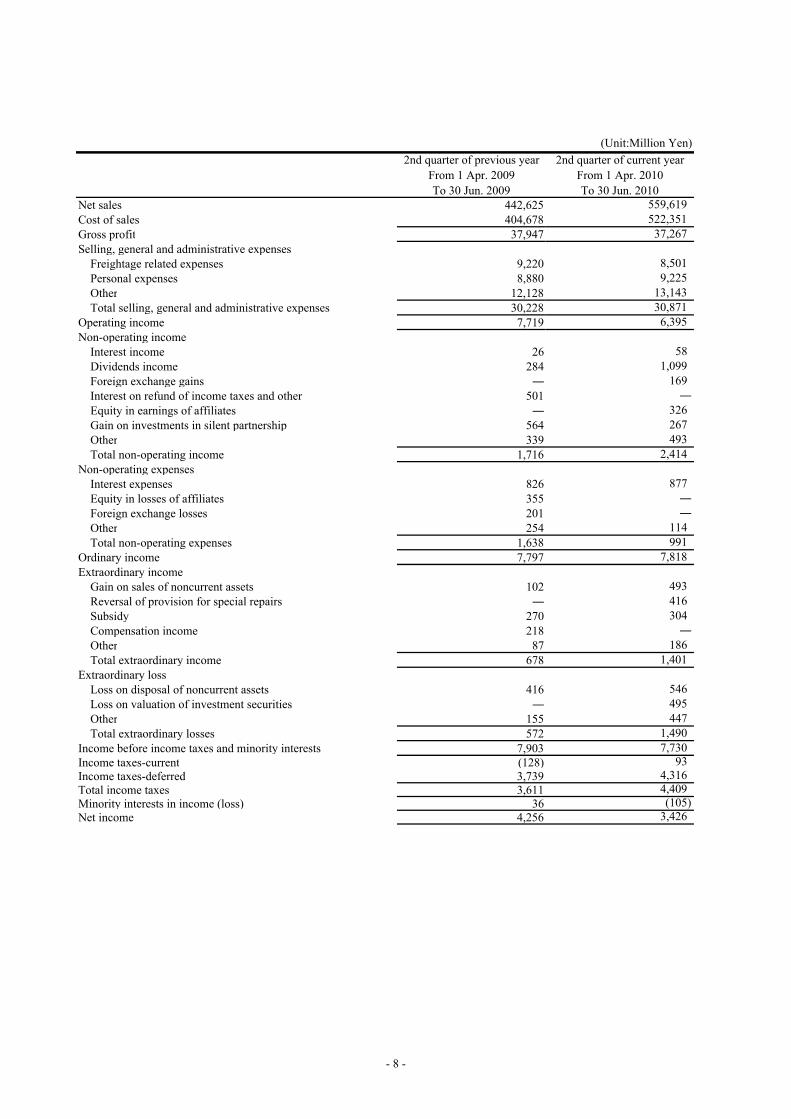
(Unit:Million Yen)2nd quarter of previous year
From 1 Apr. 2009To 30 Jun. 2009
2nd quarter of current yearFrom 1 Apr. 2010To 30 Jun. 2010
Net sales 442,625 559,619Cost of sales 404,678 522,351Gross profit 37,947 37,267Selling, general and administrative expenses Freightage related expenses 9,220 8,501 Personal expenses 8,880 9,225 Other 12,128 13,143 Total selling, general and administrative expenses 30,228 30,871Operating income 7,719 6,395Non-operating income Interest income 26 58 Dividends income 284 1,099 Foreign exchange gains ― 169 Interest on refund of income taxes and other 501 ― Equity in earnings of affiliates ― 326 Gain on investments in silent partnership 564 267 Other 339 493 Total non-operating income 1,716 2,414Non-operating expenses Interest expenses 826 877 Equity in losses of affiliates 355 ― Foreign exchange losses 201 ― Other 254 114 Total non-operating expenses 1,638 991Ordinary income 7,797 7,818Extraordinary income Gain on sales of noncurrent assets 102 493 Reversal of provision for special repairs ― 416 Subsidy 270 304 Compensation income 218 ― Other 87 186 Total extraordinary income 678 1,401Extraordinary loss Loss on disposal of noncurrent assets 416 546 Loss on valuation of investment securities ― 495 Other 155 447 Total extraordinary losses 572 1,490Income before income taxes and minority interests 7,903 7,730Income taxes-current (128) 93Income taxes-deferred 3,739 4,316Total income taxes 3,611 4,409Minority interests in income (loss) 36 (105)Net income 4,256 3,426
- 8 -
(Unit:Million Yen)1st half of previous year
From 1 Jan. 2009To 30 Jun. 2009
1st half of current yearFrom 1 Jan. 2010To 30 Jun. 2010
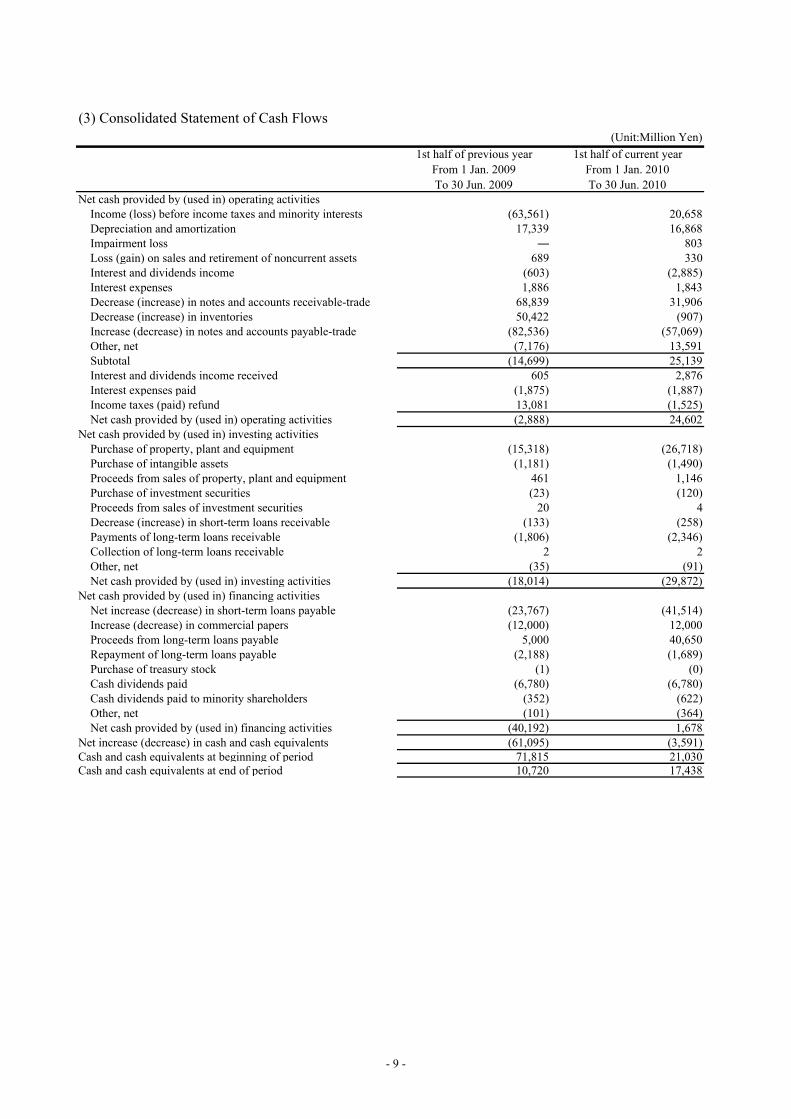
Net cash provided by (used in) operating activities Income (loss) before income taxes and minority interests (63,561) 20,658 Depreciation and amortization 17,339 16,868 Impairment loss ― 803 Loss (gain) on sales and retirement of noncurrent assets 689 330 Interest and dividends income (603) (2,885) Interest expenses 1,886 1,843 Decrease (increase) in notes and accounts receivable-trade 68,839 31,906 Decrease (increase) in inventories 50,422 (907) Increase (decrease) in notes and accounts payable-trade (82,536) (57,069) Other, net (7,176) 13,591 Subtotal (14,699) 25,139 Interest and dividends income received 605 2,876 Interest expenses paid (1,875) (1,887) Income taxes (paid) refund 13,081 (1,525) Net cash provided by (used in) operating activities (2,888) 24,602Net cash provided by (used in) investing activities Purchase of property, plant and equipment (15,318) (26,718) Purchase of intangible assets (1,181) (1,490) Proceeds from sales of property, plant and equipment 461 1,146 Purchase of investment securities (23) (120) Proceeds from sales of investment securities 20 4 Decrease (increase) in short-term loans receivable (133) (258) Payments of long-term loans receivable (1,806) (2,346) Collection of long-term loans receivable 2 2 Other, net (35) (91) Net cash provided by (used in) investing activities (18,014) (29,872)Net cash provided by (used in) financing activities Net increase (decrease) in short-term loans payable (23,767) (41,514) Increase (decrease) in commercial papers (12,000) 12,000 Proceeds from long-term loans payable 5,000 40,650 Repayment of long-term loans payable (2,188) (1,689) Purchase of treasury stock (1) (0) Cash dividends paid (6,780) (6,780) Cash dividends paid to minority shareholders (352) (622) Other, net (101) (364) Net cash provided by (used in) financing activities (40,192) 1,678Net increase (decrease) in cash and cash equivalents (61,095) (3,591)Cash and cash equivalents at beginning of period 71,815 21,030Cash and cash equivalents at end of period 10,720 17,438
(3) Consolidated Statement of Cash Flows
- 9 -

(4) Note for premises of going concern None
(5) Note in case of significant change in shareholders equity None
- 10 -