2010 second quarter fixed income presentation
TRANSCRIPT

2010 SECOND QUARTER FIXED INCOME PRESENTATION
JULY 23, 2010(PRELIMINARY RESULTS)
SLIDE 1
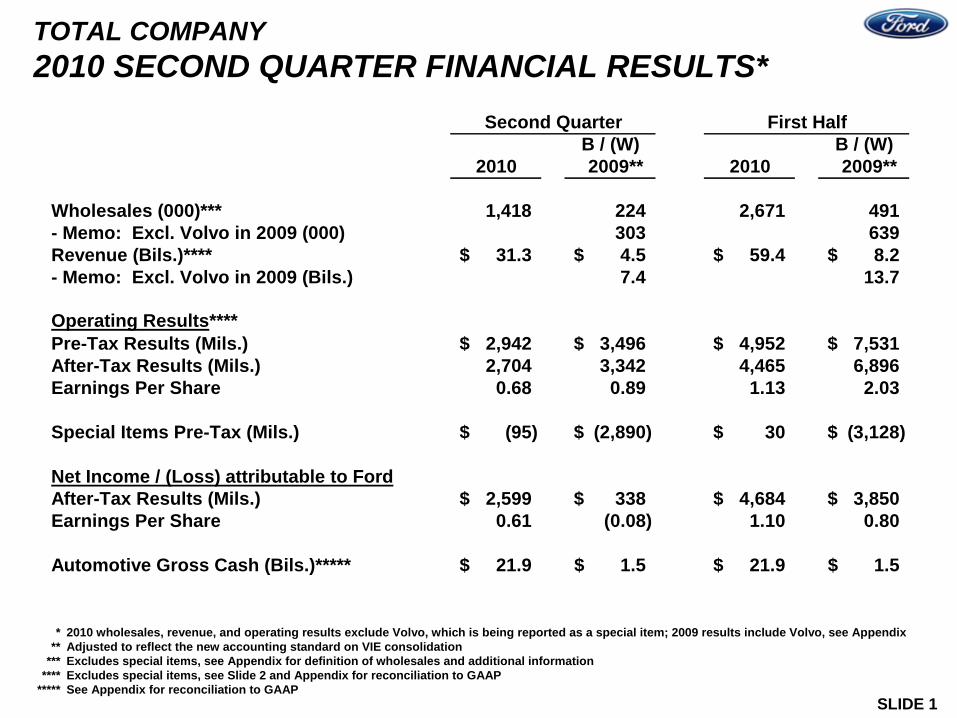
TOTAL COMPANY 2010 SECOND QUARTER FINANCIAL RESULTS*
* 2010 wholesales, revenue, and operating results exclude Volvo, which is being reported as a special item; 2009 results include Volvo, see Appendix** Adjusted to reflect the new accounting standard on VIE consolidation
*** Excludes special items, see Appendix for definition of wholesales and additional information**** Excludes special items, see Slide 2 and Appendix for reconciliation to GAAP
***** See Appendix for reconciliation to GAAP
B / (W) B / (W)2010 2009** 2010 2009**
Wholesales (000)*** 1,418 224 2,671 491 - Memo: Excl. Volvo in 2009 (000) 303 639 Revenue (Bils.)**** 31.3$ 4.5$ 59.4$ 8.2$ - Memo: Excl. Volvo in 2009 (Bils.) 7.4 13.7
Operating Results****Pre-Tax Results (Mils.) 2,942$ 3,496$ 4,952$ 7,531$ After-Tax Results (Mils.) 2,704 3,342 4,465 6,896 Earnings Per Share 0.68 0.89 1.13 2.03
Special Items Pre-Tax (Mils.) (95)$ (2,890)$ 30$ (3,128)$
Net Income / (Loss) attributable to FordAfter-Tax Results (Mils.) 2,599$ 338$ 4,684$ 3,850$ Earnings Per Share 0.61 (0.08) 1.10 0.80
Automotive Gross Cash (Bils.)***** 21.9$ 1.5$ 21.9$ 1.5$
Second Quarter First Half
SLIDE 2
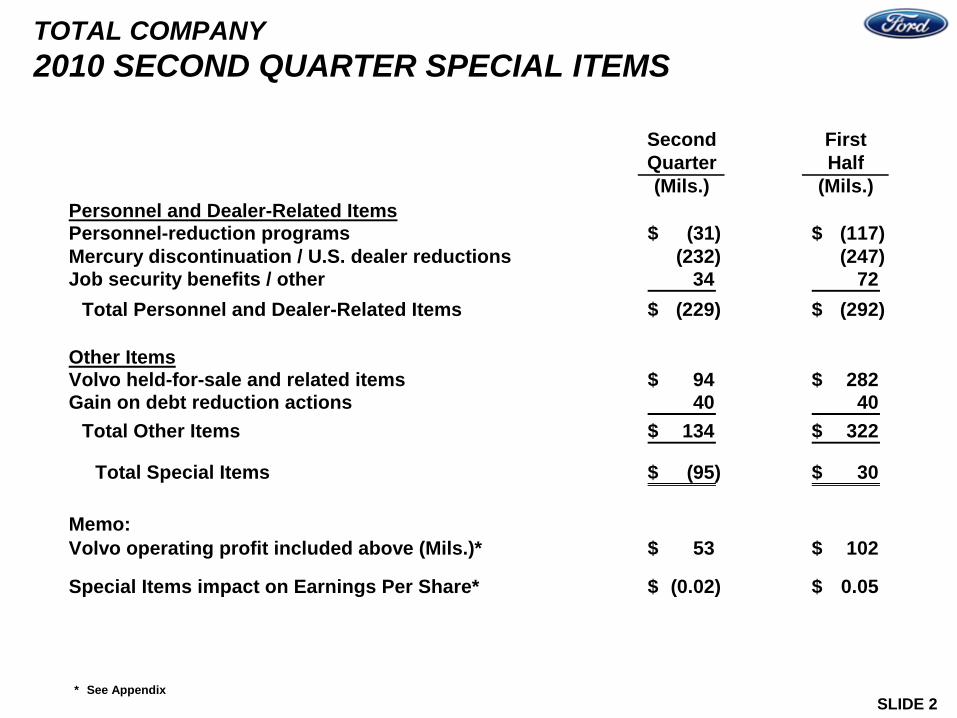
TOTAL COMPANY 2010 SECOND QUARTER SPECIAL ITEMS
* See Appendix
Second FirstQuarter Half(Mils.) (Mils.)
Personnel and Dealer-Related ItemsPersonnel-reduction programs (31)$ (117)$ Mercury discontinuation / U.S. dealer reductions (232) (247) Job security benefits / other 34 72
Total Personnel and Dealer-Related Items (229)$ (292)$
Other ItemsVolvo held-for-sale and related items 94$ 282$ Gain on debt reduction actions 40 40
Total Other Items 134$ 322$
Total Special Items (95)$ 30$
Memo:Volvo operating profit included above (Mils.)* 53$ 102$
Special Items impact on Earnings Per Share* (0.02)$ 0.05$
SLIDE 3
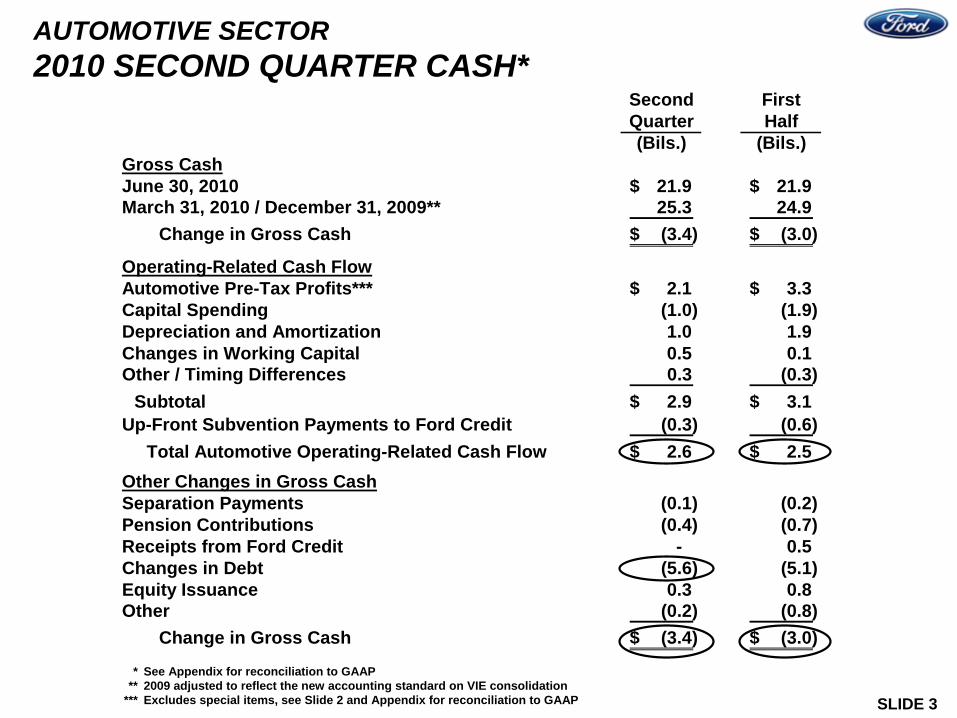
AUTOMOTIVE SECTOR 2010 SECOND QUARTER CASH*
* See Appendix for reconciliation to GAAP** 2009 adjusted to reflect the new accounting standard on VIE consolidation
*** Excludes special items, see Slide 2 and Appendix for reconciliation to GAAP
Second FirstQuarter Half(Bils.) (Bils.)
Gross CashJune 30, 2010 21.9$ 21.9$ March 31, 2010 / December 31, 2009** 25.3 24.9
Change in Gross Cash (3.4)$ (3.0)$
Operating-Related Cash FlowAutomotive Pre-Tax Profits*** 2.1$ 3.3$ Capital Spending (1.0) (1.9) Depreciation and Amortization 1.0 1.9 Changes in Working Capital 0.5 0.1 Other / Timing Differences 0.3 (0.3)
Subtotal 2.9$ 3.1$ Up-Front Subvention Payments to Ford Credit (0.3) (0.6)
Total Automotive Operating-Related Cash Flow 2.6$ 2.5$ Other Changes in Gross CashSeparation Payments (0.1) (0.2) Pension Contributions (0.4) (0.7) Receipts from Ford Credit - 0.5 Changes in Debt (5.6) (5.1) Equity Issuance 0.3 0.8 Other (0.2) (0.8)
Change in Gross Cash (3.4)$ (3.0)$

SLIDE 4
AUTOMOTIVE SECTOR 2010 SECOND QUARTER AUTOMOTIVE DEBT REDUCTION SUMMARY
* Debt discount amortization
Balance Other Automotive Ford Credit BalanceMar. 31, Debt Cash Cash June 30,
2010 Changes Utilized Utilized 2010(Bils.) (Bils.) (Bils.) (Bils.) (Bils.)
Revolving Line of Credit 7.5$ -$ (3.0)$ -$ 4.5$ VEBA Note A 3.1 0.1 (1.9) (1.3) - VEBA Note B 4.0 0.1 (0.6) - 3.5 All Other Debt 16.5 (0.1) (0.1) - 16.3
Subtotal 31.1$ 0.1$ (5.6)$ (1.3)$ 24.3$
Trust Preferred 3.2 - (0.2) - 3.0
Total 34.3$ 0.1$ (5.8)$ (1.3)$ 27.3$
Memo: Second Quarter debt reduction actions have annualized interest savings of more than $470 million
Debt Reduction Actions
$ 7.0
**
(3.8)

SLIDE 5
AUTOMOTIVE SECTOR 2010 SECOND QUARTER AUTOMOTIVE FINANCIAL RESOURCES
* See Appendix for reconciliation to GAAP** As of June 30, 2010, total committed secured and unsecured Automotive credit lines (including local lines available to foreign
affiliates) were $8.7 billion
March 31, June 30,2010 2010(Bils.) (Bils.)
Automotive Gross Cash* 25.3$ 21.9$
Less:Long-Term Debt 29.3$ 26.2$ Debt Payable Within One Year 5.0 1.1
Total Debt 34.3$ 27.3$
Net Cash / (Debt) (9.0)$ (5.4)$
Memo: Liquidity** 25.9$ 25.4$

SLIDE 6
TOTAL COMPANY 2010 PLANNING ASSUMPTIONS AND OPERATIONAL METRICS
We Are On Track To Deliver Solid Profits In 2010 With Positive Automotive Operating-Related Cash Flow, And Continued Improvement In 2011
* Includes medium and heavy trucks** European 19 markets we track
*** Structural cost changes are measured primarily at prior-year exchange, and exclude special items and discontinued operations**** Estimate
Full Year First Full YearPlan Half Outlook
Planning AssumptionsIndustry Volume (SAAR)* -- U.S. (Mils.) 11.5 to 12.5 11.4 11.5 to 12.0Industry Volume (SAAR)* -- Europe (Mils.)** 13.5 to 14.5 15.4 14.5 to 15.0
Operational MetricsCompared with Prior Year- Quality Improve Improved On Track
- Automotive Structural Costs*** Somewhat Higher $350 Million Higher About $1 BillionHigher
- U.S. Market Share (Ford, Lincoln, and Mercury) Equal / Improve 16.7% ImproveU.S. Retail Share of Retail Market**** Equal / Improve 14.1% Improve
- Europe Market Share** Equal 8.7% About Equal toFirst Half 2010
Absolute Amount- Automotive Operating-Related Cash Flow Positive $2.5 Billion On Track- Capital Spending $4.5 to $5 Billion $1.9 Billion About $4.5 Billion

SLIDE 7
Key MetricsPre-Tax Profit (Mils.) Second Quarter
On-Balance SheetReceivables (Bils.) $ 99 $ 85
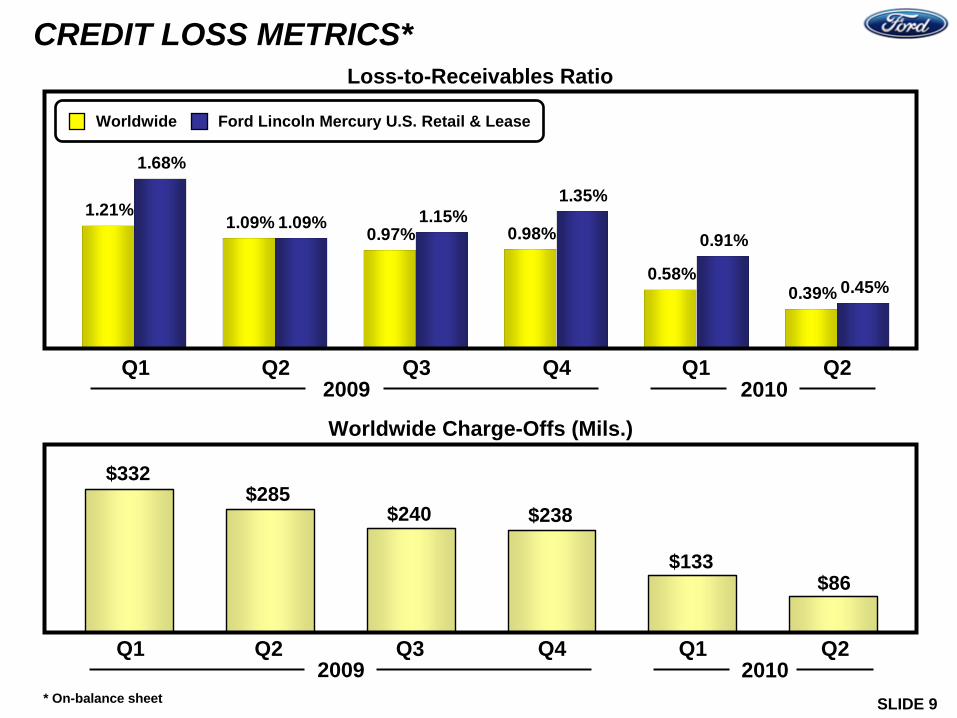
Charge-Offs (Mils.) $ 285 $ 86Loss-to-Receivables Ratio- Worldwide 1.09% 0.39% - U.S. Retail and Lease 1.09 0.45
Allowance for Credit Losses- Worldwide Amount (Bils.) $ 1.8 $ 1.1- Pct. Of EOP Receivables 1.81% 1.26%
Financial StatementLeverage (To 1) 10.2 8.1
Distribution (Bils.) $ 0 $ 0Net Income / (Loss) (Mils.) $ 413 $ 556
Managed*Receivables (Bils.) $ 100 $ 87Leverage (To 1) 8.4 6.6
2009 2010
* See Appendix for calculation, definitions, and reconciliation to GAAP
Second Quarter2009
Second Quarter2010
$646
$888$242
FORD CREDIT RESULTS AND METRICS -- 2010 SECOND QUARTER
SLIDE 8
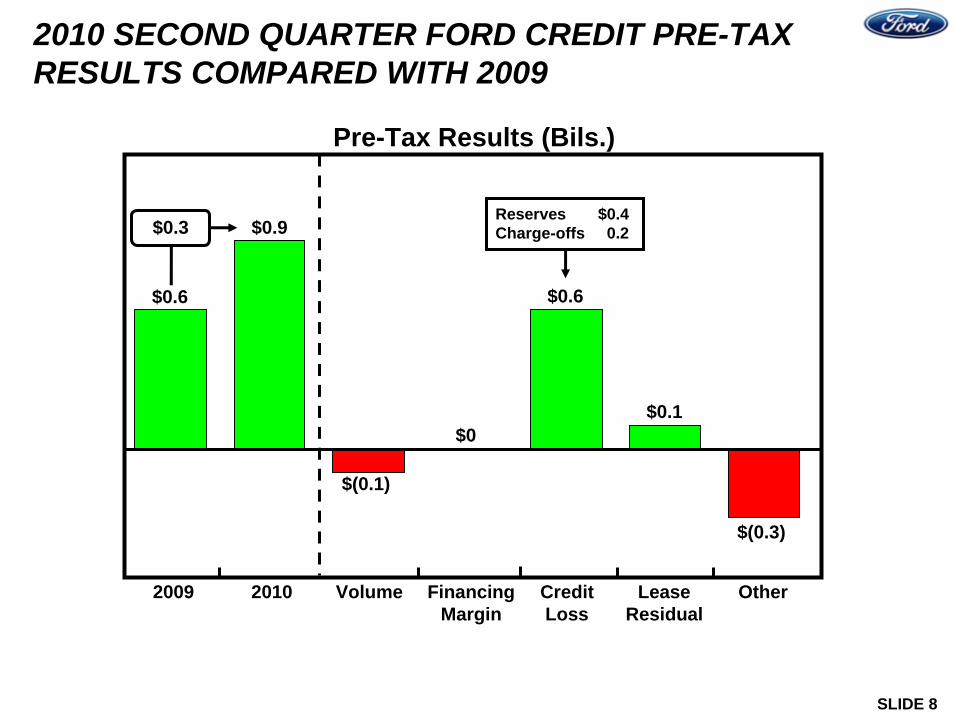
Pre-Tax Results (Bils.)
$0.1
$(0.1)
FinancingMargin
LeaseResidual
$0.6
Volume20102009 CreditLoss
$0.9
$0.6
$0
$(0.3)
Other
$0.3
2010 SECOND QUARTER FORD CREDIT PRE-TAX RESULTS COMPARED WITH 2009
Reserves $0.4Charge-offs 0.2
SLIDE 9
Worldwide Charge-Offs (Mils.)
Loss-to-Receivables Ratio
$240
Q1 Q3Q2
$332
Worldwide Ford Lincoln Mercury U.S. Retail & Lease
0.39%
0.97%1.09%
0.58%
0.98%1.21%
0.45%
1.09%0.91%
1.35%1.15%
1.68%
Q3Q1 Q2
$285
* On-balance sheet
Q4
Q4
Q1
Q1
$238
$133
Q2
Q2
$86
2009
2009
2010
2010
CREDIT LOSS METRICS*
SLIDE 10
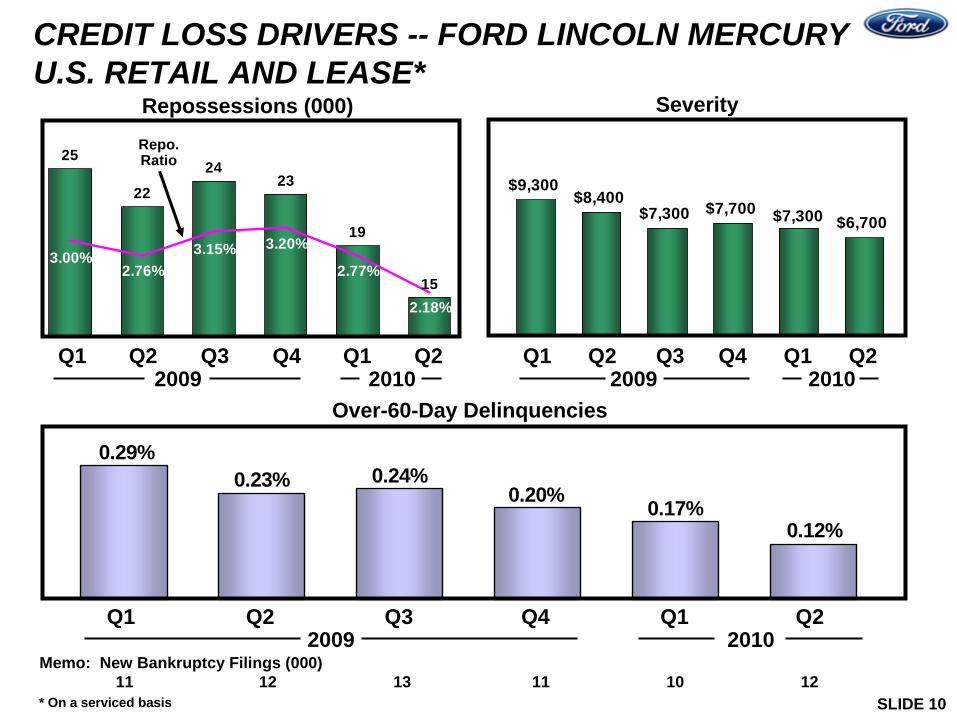
$9,300$8,400
$7,300 $7,700$6,700$7,300
25
22
2423
19
15
3.00%2.76%
3.15% 3.20%
2.77%
2.18%
Over-60-Day Delinquencies
Repossessions (000) Severity
Q1 Q3Q2
* On a serviced basis
Repo. Ratio
Memo: New Bankruptcy Filings (000)11 12 13 11 10 12
Q3Q1 Q2 Q3Q1 Q2
0.12%
0.29%0.23% 0.24%
0.20% 0.17%
Q4 Q4
Q4
Q1 Q1
Q1
Q2
Q2
Q22009 2009
2009
2010 2010
2010
CREDIT LOSS DRIVERS -- FORD LINCOLN MERCURY U.S. RETAIL AND LEASE*
SLIDE 11
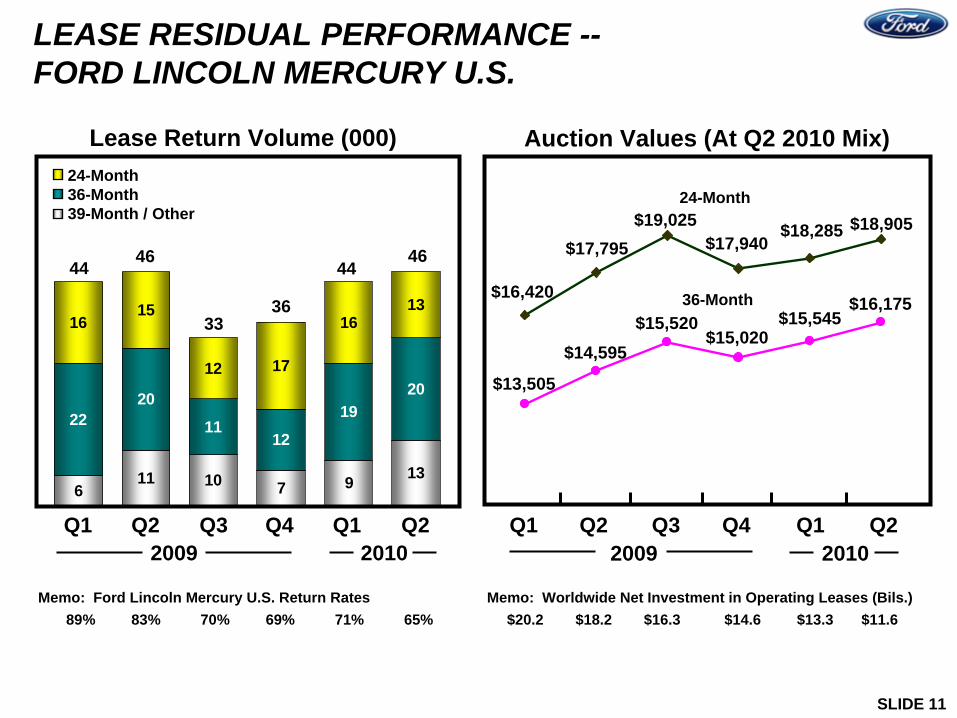
Memo: Ford Lincoln Mercury U.S. Return Rates 89% 83% 70% 69% 71% 65%
611 10 7 9 13
2220
1112
1920
1615
12 17
1613
LEASE RESIDUAL PERFORMANCE -- FORD LINCOLN MERCURY U.S.
Lease Return Volume (000) Auction Values (At Q2 2010 Mix)
36-Month
24-Month
Memo: Worldwide Net Investment in Operating Leases (Bils.)$20.2 $18.2 $16.3 $14.6 $13.3 $11.6
44 46
24-Month36-Month39-Month / Other
44
Q4Q1 Q2 Q3 Q4Q1 Q2 Q3
33
$18,905
$16,175
Q1 Q1
$17,940
$15,020
46
Q2 Q2
$18,285
$15,545$16,420
$13,505
20092009
$17,795
$14,595
$19,025
$15,52036
2010 2010
SLIDE 12
FORD CREDIT FUNDING
• We are on track to complete our Full Year funding plan
– $6 billion of funding in the securitization and unsecured debt markets in the Second Quarter
– $1 billion of additional funding in July
• Renewed $12 billion of committed capacity in the Second Quarter
– All at lower costs
– $2 billion of net incremental capacity
– FCAR renewals completed including multi-year lines
• Key elements of our funding strategy remain unchanged
• Our liquidity remains strong, including a substantial cash balance to meet funding obligations

SLIDE 13
Equity
Asset-Backed Commercial Paper
$118
$61
$11
Year End2008
Year End2009
Year End2010 Fcst.
Funding of Managed Receivables (Bils.)
Securitized Funding as Percentageof Managed Receivables 62% 56% 57% 55 - 60%
Q22010
Term Asset-Backed Securities
Term Debt and Other
Cash, Cash Equivalents, and Marketable Securities*
$24
$12$80-90
$40-45
$35-40
$10-11
$15-18
$56
$6-7
$2
$4-5
Ford Interest Advantage
* Excludes marketable securities related to insurance activities
$87
$43
$11
$17
$7
$39
$4
$95
$47
$11
$17
$6
$44
$4
FORD CREDIT FUNDING STRUCTURE
SLIDE 14
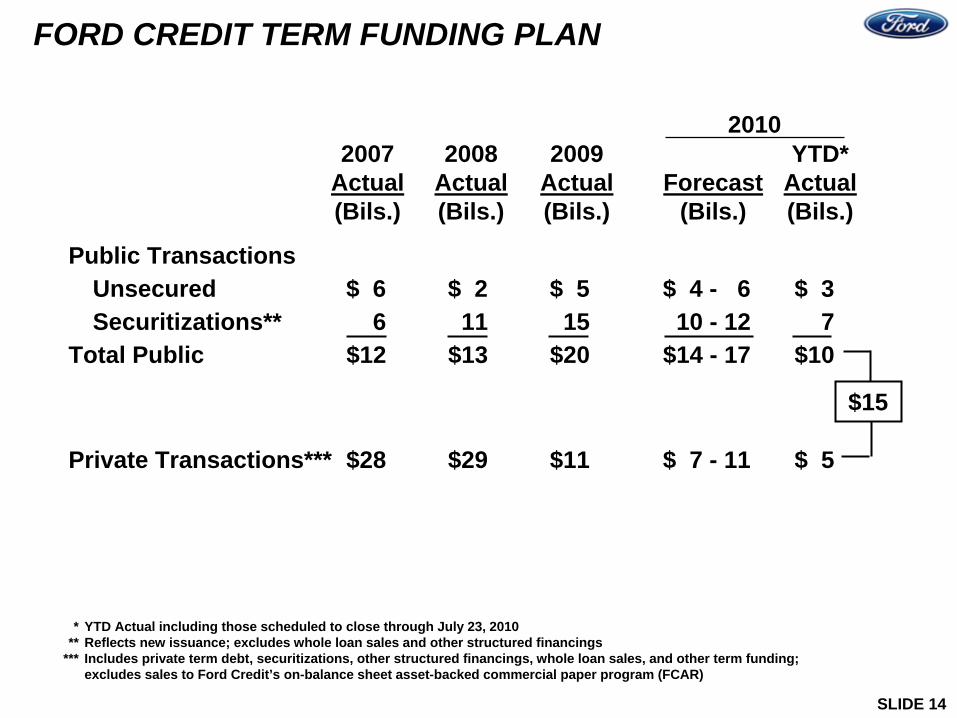
Public TransactionsUnsecured $ 6 $ 2 $ 5 $ 4 - 6 $ 3Securitizations** 6 11 15 10 - 12 7
Total Public $12 $13 $20 $14 - 17 $10
Private Transactions*** $28 $29 $11 $ 7 - 11 $ 5
2007Actual(Bils.)
Forecast(Bils.)
* YTD Actual including those scheduled to close through July 23, 2010** Reflects new issuance; excludes whole loan sales and other structured financings
*** Includes private term debt, securitizations, other structured financings, whole loan sales, and other term funding; excludes sales to Ford Credit’s on-balance sheet asset-backed commercial paper program (FCAR)
2008 Actual(Bils.)
$15
2009 Actual(Bils.)
YTD* Actual(Bils.)
2010
FORD CREDIT TERM FUNDING PLAN
SLIDE 15
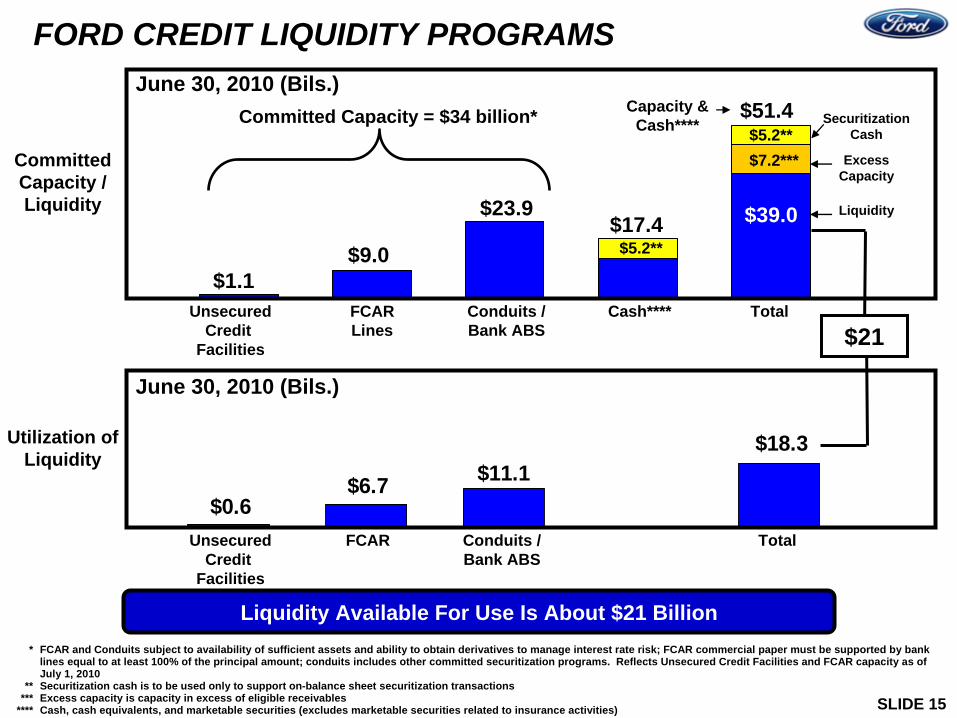
Liquidity Available For Use Is About $21 Billion
FORD CREDIT LIQUIDITY PROGRAMS
Committed Capacity / Liquidity
June 30, 2010 (Bils.)$51.4
UnsecuredCredit
Facilities
FCARLines
Conduits /Bank ABS
Cash**** Total
$23.9
$9.0$1.1
$17.4
Capacity & Cash****
$39.0 Liquidity
Committed Capacity = $34 billion*
$18.3$11.1$6.7
$0.6Unsecured
Credit Facilities
FCAR Conduits /Bank ABS
Total
June 30, 2010 (Bils.)
$5.2**
$7.2***$5.2**
* FCAR and Conduits subject to availability of sufficient assets and ability to obtain derivatives to manage interest rate risk; FCAR commercial paper must be supported by banklines equal to at least 100% of the principal amount; conduits includes other committed securitization programs. Reflects Unsecured Credit Facilities and FCAR capacity as ofJuly 1, 2010
** Securitization cash is to be used only to support on-balance sheet securitization transactions*** Excess capacity is capacity in excess of eligible receivables
**** Cash, cash equivalents, and marketable securities (excludes marketable securities related to insurance activities)
Securitization Cash
Excess Capacity
$21
Utilization of Liquidity
SLIDE 16
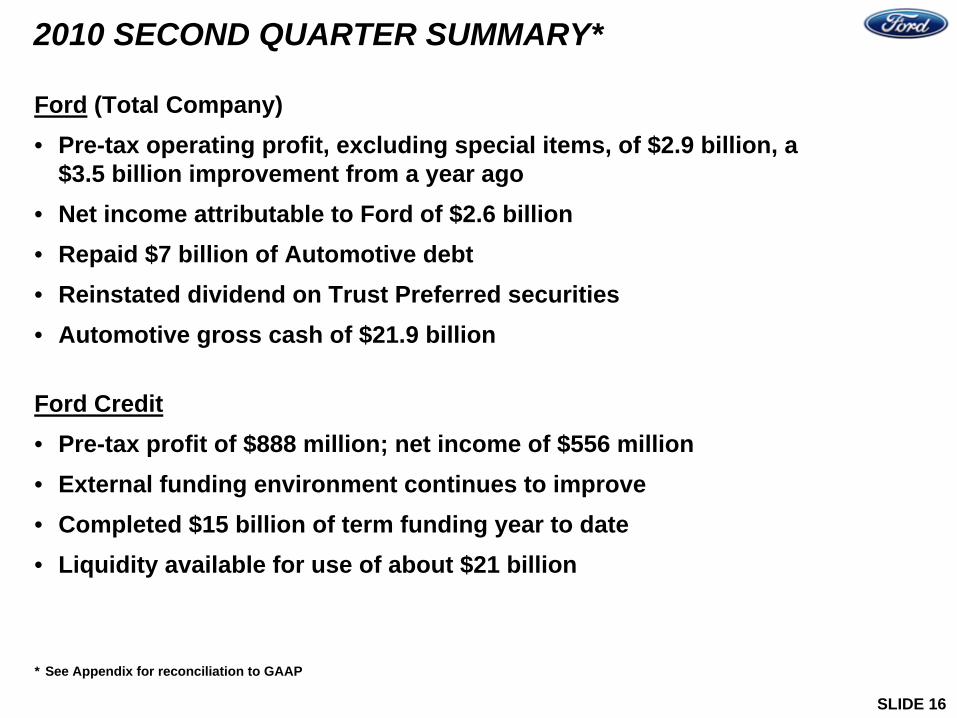
Ford (Total Company)• Pre-tax operating profit, excluding special items, of $2.9 billion, a
$3.5 billion improvement from a year ago• Net income attributable to Ford of $2.6 billion• Repaid $7 billion of Automotive debt• Reinstated dividend on Trust Preferred securities• Automotive gross cash of $21.9 billion
Ford Credit• Pre-tax profit of $888 million; net income of $556 million• External funding environment continues to improve• Completed $15 billion of term funding year to date• Liquidity available for use of about $21 billion
2010 SECOND QUARTER SUMMARY*
* See Appendix for reconciliation to GAAP

SLIDE 17
SAFE HARBOR
Automotive Related:• Further declines in industry sales volume, particularly in the United States or Europe, due to financial crisis, recession, geo-political events or other factors;• Decline in Ford’s market share;• Continued or increased price competition for Ford vehicles resulting from industry overcapacity, currency fluctuations or other factors;• An increase in or acceleration of market shift beyond Ford’s current planning assumptions from sales of trucks, medium- and large-sized utilities, or other more profitable
vehicles, particularly in the United States;• A return to elevated gasoline prices, as well as the potential for volatile prices or reduced availability;• Lower-than-anticipated market acceptance of new or existing Ford products;• Adverse effects from the bankruptcy, insolvency, or government-funded restructuring of, change in ownership or control of, or alliances entered into by a major competitor;• Economic distress of suppliers may require Ford to provide substantial financial support or take other measures to ensure supplies of components or materials and could
increase Ford’s costs, affect Ford’s liquidity, or cause production disruptions;• Work stoppages at Ford or supplier facilities or other interruptions of production;• Single-source supply of components or materials;• Restriction on use of tax attributes from tax law “ownership change”;• The discovery of defects in Ford vehicles resulting in delays in new model launches, recall campaigns or increased warranty costs;• Increased safety, emissions, fuel economy or other regulation resulting in higher costs, cash expenditures and/or sales restrictions;• Unusual or significant litigation or governmental investigations arising out of alleged defects in Ford products, perceived environmental impacts, or otherwise;• A change in Ford’s requirements for parts or materials where it has entered into long-term supply arrangements that commit it to purchase minimum or fixed quantities of
certain parts or materials, or to pay a minimum amount to the seller (“take-or-pay contracts”);• Adverse effects on Ford’s results from a decrease in or cessation of government incentives related to capital investments;• Adverse effects on Ford’s operations resulting from certain geo-political or other events;• Substantial levels of indebtedness adversely affecting Ford’s financial condition or preventing Ford from fulfilling its debt obligations (which may grow because Ford is able
to incur substantially more debt, including additional secured debt);Ford Credit Related:• A prolonged disruption of the debt and securitization markets;• Inability to access debt, securitization or derivative markets around the world at competitive rates or in sufficient amounts due to credit rating downgrades, market volatility,
market disruption, regulatory requirements or otherwise;• Inability to obtain competitive funding;• Higher-than-expected credit losses;• Adverse effects from the government-supported restructuring of, change in ownership or control of, or alliances entered into by a major competitor;• Increased competition from banks or other financial institutions seeking to increase their share of retail installment financing Ford vehicles;• Collection and servicing problems related to our finance receivables and net investment in operating leases;• Lower-than-anticipated residual values or higher-than-expected return volumes for leased vehicles;• New or increased credit, consumer or data protection or other laws and regulations resulting in higher costs and/or additional financing restrictions;• Changes in Ford’s operations or changes in Ford’s marketing programs could result in a decline in our financing volumes;General:• Fluctuations in foreign currency exchange rates and interest rates;• Failure of financial institutions to fulfill commitments under committed credit and liquidity facilities;• Labor or other constraints on Ford’s or our ability to restructure its or our business;• Substantial pension and postretirement healthcare and life insurance liabilities impairing Ford’s or our liquidity or financial condition; and • Worse-than-assumed economic and demographic experience for postretirement benefit plans (e.g., discount rates or investment returns).
Statements included or incorporated by reference herein may constitute “forward-looking statements” within the meaning of the Private Securities Litigation Reform Act of 1995. Forward-looking statements are based on expectations, forecasts, and assumptions by our management and involve a number of risks, uncertainties, and other factors that could cause actual results to differ materially from those stated, including, without limitation:
We cannot be certain that any expectations, forecasts or assumptions made by management in preparing these forward-looking statements will prove accurate, or that any projections will be realized. It is to be expected that there may be differences between projected and actual results. Our forward-looking statements speak only as of the date of their initial issuance, and we do not undertake any obligation to update or revise publicly any forward-looking statements, whether as a result of new information, future events or otherwise. For additional discussion of these risk factors, see Item 1A of Part I of Ford’s 2009 10-K Report and Item 1A of Part I of Ford Credit’s 2009 10-K Report as updated by Ford’s and Ford Credit’s subsequent Quarterly Reports on Form 10-Q and Current Reports on Form 8-K.

APPENDIX

TOTAL COMPANY 2010 SECOND QUARTER FINANCIAL RESULTS
* Adjusted to reflect the new accounting standard on VIE consolidation** See Slide 2 for details of special items
B / (W) B / (W)2010 2009* 2010 2009*
(Mils.) (Mils.) (Mils.) (Mils.)Income / (Loss)Pre-Tax Results (Excl. Special Items) 2,942$ 3,496$ 4,952$ 7,531$ Special Items** (95) (2,890) 30 (3,128)
Pre-Tax Results (Incl. Special Items) 2,847$ 606$ 4,982$ 4,403$
(Provision for) / Benefit from Income Taxes (251) (266) (301) (543) Income / (Loss) from Continuing Operations 2,596$ 340$ 4,681$ 3,860$
Discontinued Operations - (5) - (5) (Income) / Loss attributable to non-controlling interests 3 3 3 (5)
Net Income / (Loss) attributable to Ford 2,599$ 338$ 4,684$ 3,850$
Second Quarter First Half
APPENDIX 1 of 16

TOTAL COMPANY CALCULATION OF EARNINGS PER SHARE
APPENDIX 2 of 16
* As disclosed, our UAW VEBA Note B allows us to elect to satisfy each scheduled payment by delivering cash, Ford Common Stock, or a combination of cash and Common Stock. For purposes of disclosing the maximum potential dilution to our shares that could occur over time, we present our diluted EPS calculation assuming we were to elect to satisfy each scheduled payment on Note B over time in shares rather than cash, holding constant the 30-day volume-weighted average price per share for the Second Quarter period-end as calculated pursuant to the terms of Note B. Using this assumption, our diluted EPS includes 466 million and 465 million for the Second Quarter and First Half, respectively, of potential dilutive shares related to Note B, which reduced our Second Quarter and First Half diluted EPS by 5 cents per share and 8 cents per share, respectively. As previously disclosed, we will use our discretion in determining which form of payment makes sense at the time of each required payment, balancing liquidity needs and preservation of shareholder value. We made our December 31, 2009 and June 30, 2010 scheduled payments on Note B in cash. As announced, the terms of Note B recently have been amended, subject to regulatory approval, to provide us greater flexibility through mid-2013 to pre-pay more frequently (i.e., at each month end except May and June) all or a portion of the remaining Note B obligation in cash at a discount. Pre-payments may be made in cash at a 5% discount prior to 2012, and at a 4% discount during 2012 - 2013
** Excludes Income / (Loss) attributable to non-controlling interests and the effect of discontinued operations; special items detailed on Slide 2*** Shares are net of the restricted and uncommitted ESOP shares
(Mils.) (Mils.) (Mils.) (Mils.)NumeratorAfter-Tax Results 2,599$ 2,704$ 4,684$ 4,465$ Impact on income from assumed exchange of convertible notes and
convertible trust preferred securities 103 103 204 204 After-Tax Operating Results for EPS 2,702$ 2,807$ 4,888$ 4,669$
Impact on income from assumed share issuance to settle UAW VEBA Note B 91 182 Net Income for EPS 2,793$ 5,070$
DenominatorAverage shares outstanding*** 3,411 3,411 3,388 3,388 Net issuable shares, primarily warrants and restricted stock units 198 198 202 202 Convertible notes 372 372 372 372 Convertible trust preferred securities 163 163 163 163
Average Shares for Operating EPS 4,144 4,144 4,125 4,125 UAW VEBA Note B 466 465
Average Shares for Net Income EPS 4,610 4,590
EPS 0.61$ 0.68$ 1.10$ 1.13$
Second Quarter 2010
Items** to Ford*
After-TaxNet IncomeAttributable Excl. Special
Oper. Results
First Half 2010After-Tax
Net Income Oper. ResultsAttributable Excl. Special
to Ford* Items**
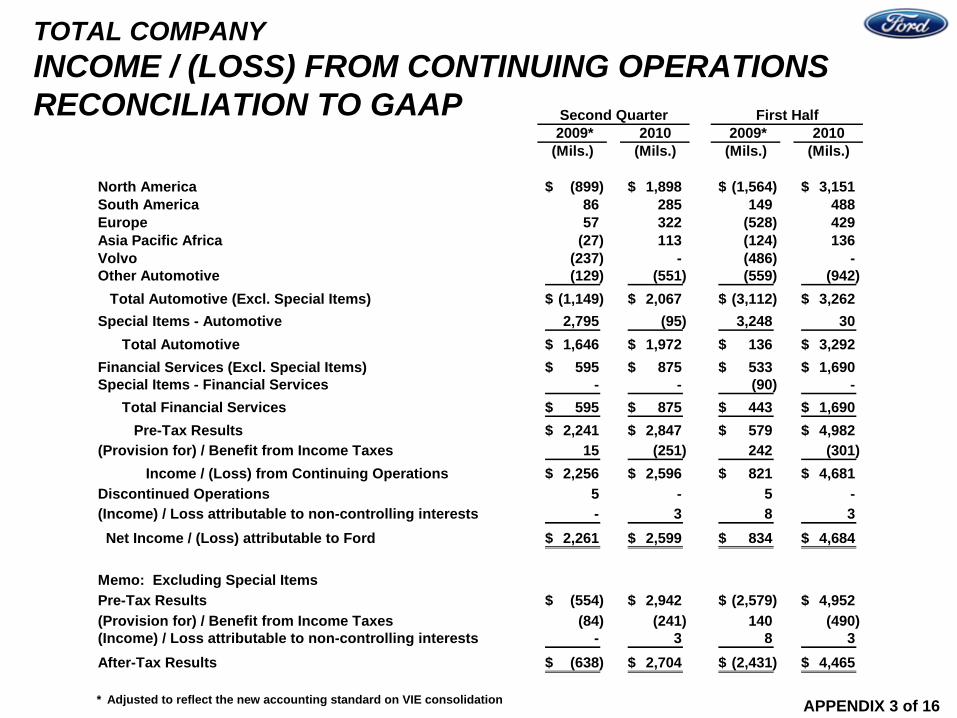
TOTAL COMPANY INCOME / (LOSS) FROM CONTINUING OPERATIONS RECONCILIATION TO GAAP
APPENDIX 3 of 16 * Adjusted to reflect the new accounting standard on VIE consolidation
2009* 2010 2009* 2010(Mils.) (Mils.) (Mils.) (Mils.)
North America (899)$ 1,898$ (1,564)$ 3,151$ South America 86 285 149 488 Europe 57 322 (528) 429 Asia Pacific Africa (27) 113 (124) 136 Volvo (237) - (486) - Other Automotive (129) (551) (559) (942)
Total Automotive (Excl. Special Items) (1,149)$ 2,067$ (3,112)$ 3,262$ Special Items - Automotive 2,795 (95) 3,248 30
Total Automotive 1,646$ 1,972$ 136$ 3,292$ Financial Services (Excl. Special Items) 595$ 875$ 533$ 1,690$ Special Items - Financial Services - - (90) -
Total Financial Services 595$ 875$ 443$ 1,690$ Pre-Tax Results 2,241$ 2,847$ 579$ 4,982$
(Provision for) / Benefit from Income Taxes 15 (251) 242 (301) Income / (Loss) from Continuing Operations 2,256$ 2,596$ 821$ 4,681$
Discontinued Operations 5 - 5 - (Income) / Loss attributable to non-controlling interests - 3 8 3 Net Income / (Loss) attributable to Ford 2,261$ 2,599$ 834$ 4,684$
Memo: Excluding Special ItemsPre-Tax Results (554)$ 2,942$ (2,579)$ 4,952$ (Provision for) / Benefit from Income Taxes (84) (241) 140 (490) (Income) / Loss attributable to non-controlling interests - 3 8 3 After-Tax Results (638)$ 2,704$ (2,431)$ 4,465$
Second Quarter First Half

TOTAL COMPANY REVENUE RECONCILIATION TO GAAP
APPENDIX 4 of 16 * Adjusted to reflect the new accounting standard on VIE consolidation
2009* 2010 2009* 2010(Mils.) (Mils.) (Mils.) (Mils.)
North America 10,744$ 16,908$ 20,762$ 31,040$ South America 1,840 2,620 3,244 4,634 Europe 6,955 7,549 12,724 15,196 Asia Pacific Africa 1,208 1,802 2,373 3,380
Subtotal (Excl. Volvo) 20,747$ 28,879$ 39,103$ 54,250$ Volvo 2,863 - 5,487 -
Total Automotive (Excl. Special Items) 23,610$ 28,879$ 44,590$ 54,250$ Special Items - Volvo - 3,685 - 7,208
Total Automotive 23,610$ 32,564$ 44,590$ 61,458$ Financial Services 3,200 2,503 6,610 5,175
Total Company 26,810$ 35,067$ 51,200$ 66,633$
Memo:Total Company (Excl. Special Items) 26,810$ 31,382$ 51,200$ 59,425$ Total Company (Excl. Volvo) 23,947 31,382 45,713 59,425
- Percentage Change 31 % 30 %
First HalfSecond Quarter
APPENDIX 5 of 16
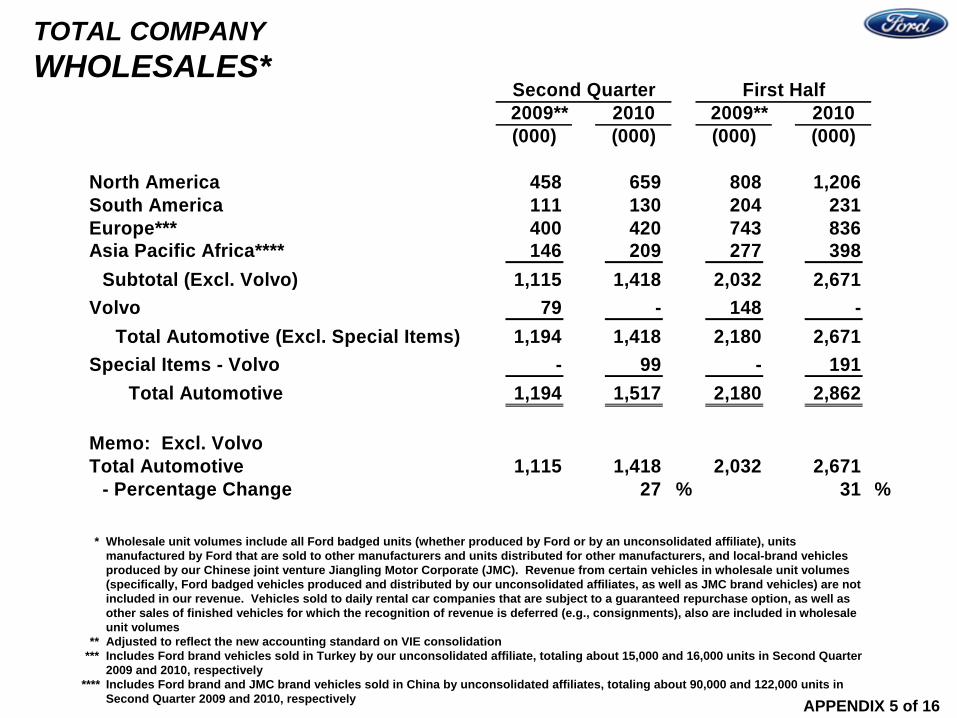
TOTAL COMPANY WHOLESALES*
* Wholesale unit volumes include all Ford badged units (whether produced by Ford or by an unconsolidated affiliate), units manufactured by Ford that are sold to other manufacturers and units distributed for other manufacturers, and local-brand vehicles produced by our Chinese joint venture Jiangling Motor Corporate (JMC). Revenue from certain vehicles in wholesale unit volumes (specifically, Ford badged vehicles produced and distributed by our unconsolidated affiliates, as well as JMC brand vehicles) are not included in our revenue. Vehicles sold to daily rental car companies that are subject to a guaranteed repurchase option, as well as other sales of finished vehicles for which the recognition of revenue is deferred (e.g., consignments), also are included in wholesale unit volumes
** Adjusted to reflect the new accounting standard on VIE consolidation*** Includes Ford brand vehicles sold in Turkey by our unconsolidated affiliate, totaling about 15,000 and 16,000 units in Second Quarter
2009 and 2010, respectively**** Includes Ford brand and JMC brand vehicles sold in China by unconsolidated affiliates, totaling about 90,000 and 122,000 units in
Second Quarter 2009 and 2010, respectively
2009** 2010 2009** 2010(000) (000) (000) (000)
North America 458 659 808 1,206South America 111 130 204 231 Europe*** 400 420 743 836 Asia Pacific Africa**** 146 209 277 398
Subtotal (Excl. Volvo) 1,115 1,418 2,032 2,671Volvo 79 - 148 -
Total Automotive (Excl. Special Items) 1,194 1,418 2,180 2,671Special Items - Volvo - 99 - 191
Total Automotive 1,194 1,517 2,180 2,862
Memo: Excl. VolvoTotal Automotive 1,115 1,418 2,032 2,671
- Percentage Change 27 % 31 %
Second Quarter First Half
APPENDIX 6 of 16
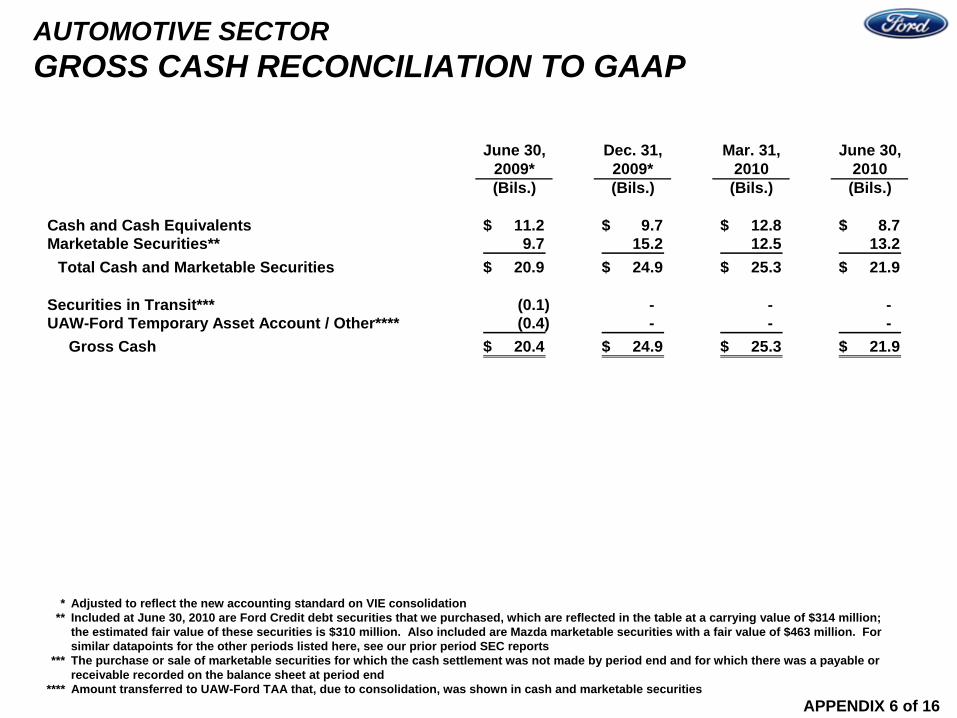
AUTOMOTIVE SECTOR GROSS CASH RECONCILIATION TO GAAP
Dec. 31, Mar. 31, June 30,2009* 2009* 2010 2010(Bils.) (Bils.) (Bils.) (Bils.)
Cash and Cash Equivalents 11.2$ 9.7$ 12.8$ 8.7$ Marketable Securities** 9.7 15.2 12.5 13.2
Total Cash and Marketable Securities 20.9$ 24.9$ 25.3$ 21.9$
Securities in Transit*** (0.1) - - - UAW-Ford Temporary Asset Account / Other**** (0.4) - - -
Gross Cash 20.4$ 24.9$ 25.3$ 21.9$
June 30,
* Adjusted to reflect the new accounting standard on VIE consolidation** Included at June 30, 2010 are Ford Credit debt securities that we purchased, which are reflected in the table at a carrying value of $314 million;
the estimated fair value of these securities is $310 million. Also included are Mazda marketable securities with a fair value of $463 million. For similar datapoints for the other periods listed here, see our prior period SEC reports
*** The purchase or sale of marketable securities for which the cash settlement was not made by period end and for which there was a payable or receivable recorded on the balance sheet at period end
**** Amount transferred to UAW-Ford TAA that, due to consolidation, was shown in cash and marketable securities

AUTOMOTIVE SECTOR OPERATING-RELATED CASH FLOWS RECONCILIATION TO GAAP
APPENDIX 7 of 16
* Adjusted to reflect the new accounting standard on VIE consolidation** Adjusted to reflect the reallocation of amounts previously displayed in "Net change in intersector receivables / payables and other liabilities" on
our Sector Statement of Cash Flows. These amounts are being reallocated from a single line item to the individual cash flow line items within operating, investing, and financing activities of continuing operations on our Sector Statement of Cash Flows
*** 2010 includes cash flows of held-for-sale operations
B / (W) B / (W)2010 2009* 2010 2009*(Bils.) (Bils.) (Bils.) (Bils.)
Cash Flows from Operating Activities of Continuing Operations** 2.9$ 3.3$ 2.9$ 6.2$
Items Included in Operating-Related Cash FlowsCapital Expenditures (1.0) - (1.9) 0.2 Net Cash Flows from Non-Designated Derivatives (0.1) 0.1 (0.2) (0.2)
Items Not Included in Operating-Related Cash FlowsCash Impact of Job Security Benefits and Personnel Reduction Program 0.1 (0.1) 0.2 (0.3) Pension Contributions 0.4 0.1 0.7 - Tax Refunds and Tax Payments from Affiliates - - - 0.3 Other*** 0.3 0.5 0.8 1.1
Operating-Related Cash Flows 2.6$ 3.9$ 2.5$ 7.3$
Second Quarter First Half
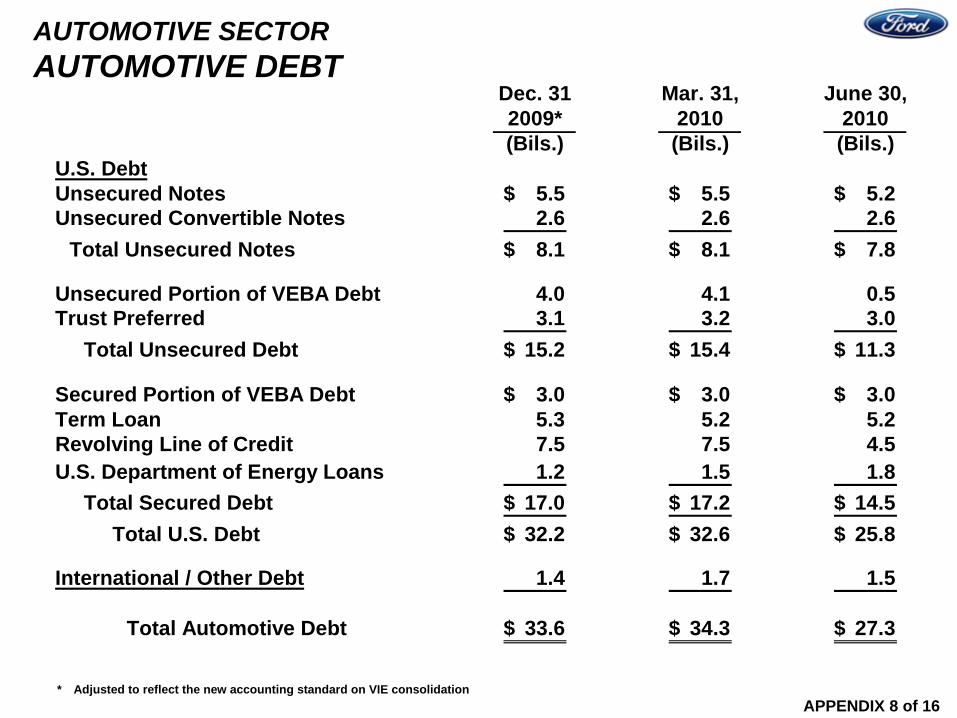
AUTOMOTIVE SECTOR AUTOMOTIVE DEBT
APPENDIX 8 of 16
Dec. 31 Mar. 31, June 30,2009* 2010 2010(Bils.) (Bils.) (Bils.)
U.S. DebtUnsecured Notes 5.5$ 5.5$ 5.2$ Unsecured Convertible Notes 2.6 2.6 2.6
Total Unsecured Notes 8.1$ 8.1$ 7.8$
Unsecured Portion of VEBA Debt 4.0 4.1 0.5 Trust Preferred 3.1 3.2 3.0
Total Unsecured Debt 15.2$ 15.4$ 11.3$
Secured Portion of VEBA Debt 3.0$ 3.0$ 3.0$ Term Loan 5.3 5.2 5.2 Revolving Line of Credit 7.5 7.5 4.5 U.S. Department of Energy Loans 1.2 1.5 1.8
Total Secured Debt 17.0$ 17.2$ 14.5$ Total U.S. Debt 32.2$ 32.6$ 25.8$
International / Other Debt 1.4 1.7 1.5
Total Automotive Debt 33.6$ 34.3$ 27.3$
* Adjusted to reflect the new accounting standard on VIE consolidation

FORD CREDIT OPERATING HIGHLIGHTS
SharesUnited States
Financing share -- Ford, Lincoln, and Mercury Retail installment and lease 28% 30% 29% 32%Wholesale 79 81 78 81
Europe Financing share -- Ford
Retail installment and lease 28% 25% 27% 24%Wholesale 99 98 99 99
Contract Volume -- New and used retail / lease (000)North America Segment
United States 153 181 288 356Canada 33 28 53 45
Total North America Segment 186 209 341 401International Segment
Europe 124 86 246 185Other international 9 7 26 17
Total International Segment 133 93 272 202Total Contract Volume 319 302 613 603
Borrowing Cost Rate* 5.0% 4.7% 5.0% 4.7%* On-balance sheet debt includes the effects of derivatives and facility fees
2009 2010Second Quarter
APPENDIX 9 of 16
2009 2010First Half
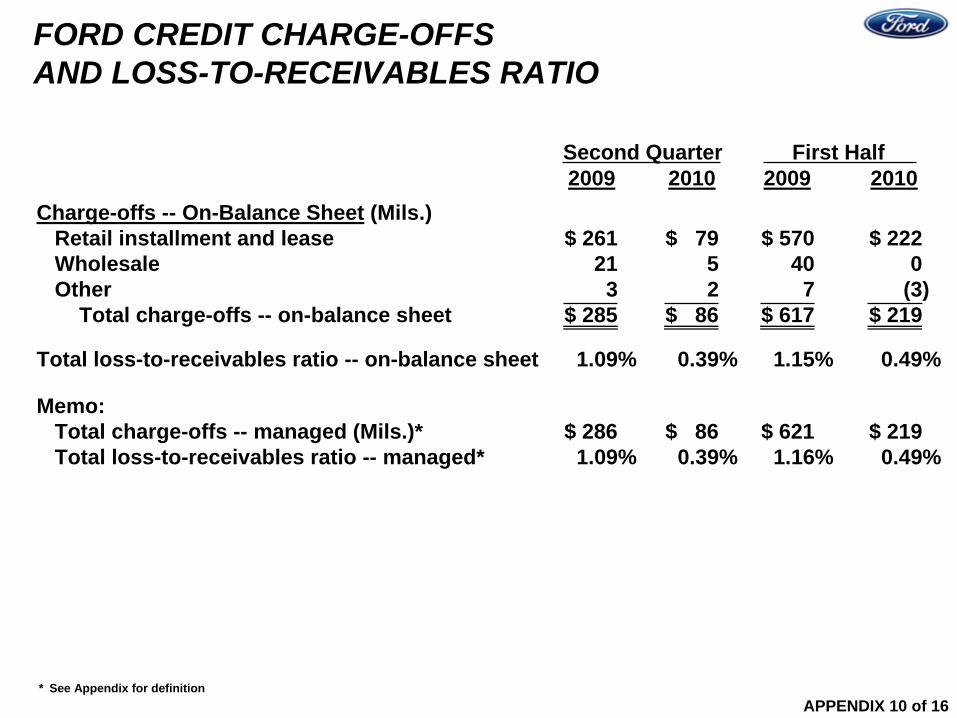
FORD CREDIT CHARGE-OFFS AND LOSS-TO-RECEIVABLES RATIO
Charge-offs -- On-Balance Sheet (Mils.) Retail installment and lease $ 261 $ 79 $ 570 $ 222Wholesale 21 5 40 0Other 3 2 7 (3)
Total charge-offs -- on-balance sheet $ 285 $ 86 $ 617 $ 219
Total loss-to-receivables ratio -- on-balance sheet 1.09% 0.39% 1.15% 0.49%
Memo: Total charge-offs -- managed (Mils.)* $ 286 $ 86 $ 621 $ 219Total loss-to-receivables ratio -- managed* 1.09% 0.39% 1.16% 0.49%
* See Appendix for definition
2009 2010Second Quarter
APPENDIX 10 of 16
2009 2010First Half

FINANCIAL SERVICES SECTOR FORD CREDIT NET FINANCE RECEIVABLES AND OPERATING LEASES
June 30, Dec. 31, June 30,2009 2009 2010(Bils.) (Bils.) (Bils.)
Receivables -- On-Balance SheetRetail installment 61.2$ 56.3$ 51.5$ Wholesale 19.7 22.4 21.8 Other finance receivables 2.7 2.4 2.6 Unearned interest supplements (1.7) (1.9) (2.0) Allowance for credit losses (1.6) (1.3) (1.0)
Finance receivables, net 80.3$ 77.9$ 72.9$ Net investment in operating leases 18.2 14.6 11.6
Total receivables -- on balance sheet 98.5$ 92.5$ 84.5$
Memo:Total receivables -- managed* 100.3$ 94.5$ 86.5$
APPENDIX 11 of 16
* Includes on-balance sheet receivables, excluding unearned interest supplements related to finance receivables of $1.7 billion, $1.9 billion and $2 billion at June 30, 2009, December 31, 2009 and June 30, 2010, respectively; and includes off-balance sheet retail receivables of about $100 million at June 30, 2009 and December 31, 2009

DEBT RATINGS -- FORD AND FORD CREDIT
Issuer RatingsFord Motor B- B1* B BFord Credit B- Ba3 B B (high)
Senior Long-Term UnsecuredFord Motor CCC B2 CCC CCC (high)Ford Credit B- Ba3 BB- B (high)FCE Bank plc B Ba3 BB- NR
Short-Term UnsecuredFord Credit NR NP B R-4
Secured FundingFord Motor B- Ba1 BB BB (low)
Outlook Positive Stable Positive Positive**
DBRSFitchMoody’sS&P
* Moody’s equivalent is a “Corporate Family Rating”** The trend DBRS has assigned to the short-term ratings is Stable
APPENDIX 12 of 16

FINANCIAL SERVICES SECTOR FORD CREDIT KEY METRIC DEFINITIONSIn evaluating Ford Credit’s financial performance, Ford Credit management uses financial measures based on GAAP, as well as financial measures that include adjustments from GAAP; these measures are defined below. Information about the impact of on-balance sheet securitization is also included below:
Managed Receivables -- receivables reported on Ford Credit’s balance sheet, excluding unearned interest supplements related to finance receivables, and securitized off-balance sheet receivables that Ford Credit continues to service
Serviced Receivables -- includes managed receivables and receivables Ford Credit sold in whole- loan sale transactions where Ford Credit retains no interest in the sold receivables, but which Ford Credit continues to service
Charge-offs on Managed Receivables -- charge-offs associated with receivables reported on Ford Credit’s balance sheet and charge-offs associated with receivables that Ford Credit sold in off- balance sheet securitizations and continues to service
Equity -- shareholder’s interest reported on Ford Credit’s balance sheet
Impact of On-Balance Sheet Securitization -- finance receivables (retail and wholesale) and net investment in operating leases reported on Ford Credit's balance sheet include assets that have been sold for legal purposes in securitization transactions that do not satisfy the requirements for accounting sale treatment. These receivables are available only for payment of the debt and other obligations issued or arising in the securitization transactions; they are not available to pay the other obligations of Ford Credit or the claims of Ford Credit's other creditors. Debt reported on Ford Credit's balance sheet includes obligations issued or arising in securitization transactions that are payable only out of collections on the underlying securitized assets and related enhancements. Ford Credit holds the right to the excess cash flows not needed to pay the debt and other obligations issued or arising in each of these securitization transactions
APPENDIX 13 of 16
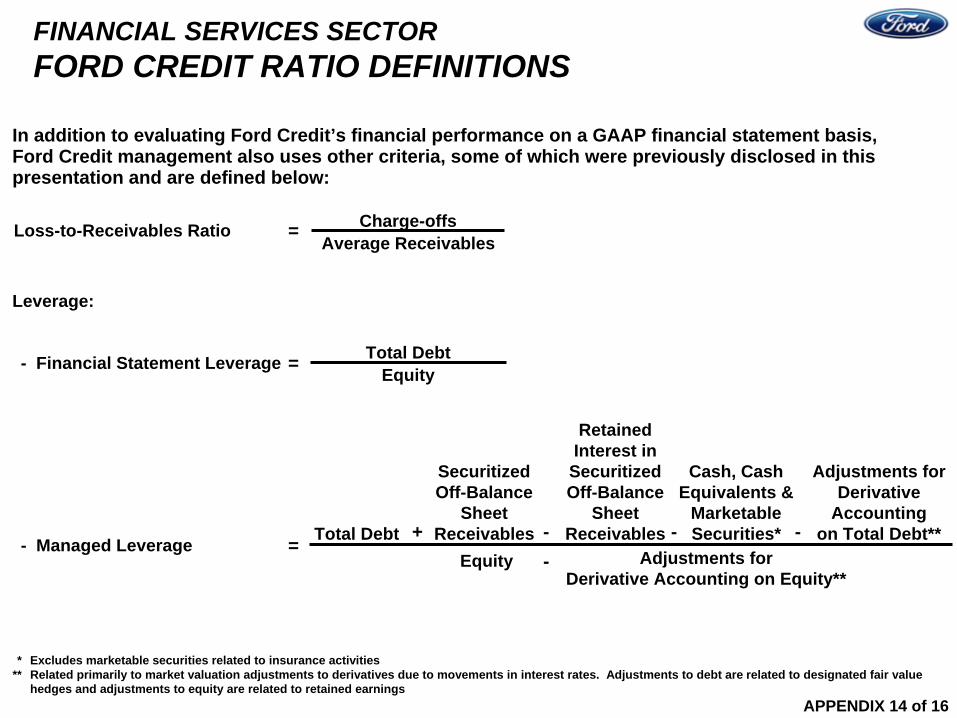
FINANCIAL SERVICES SECTOR FORD CREDIT RATIO DEFINITIONS
In addition to evaluating Ford Credit’s financial performance on a GAAP financial statement basis, Ford Credit management also uses other criteria, some of which were previously disclosed in this presentation and are defined below:
Leverage:
Total Debt- Financial Statement Leverage = Equity
Total Debt
SecuritizedOff-Balance
SheetReceivables
Cash, CashEquivalents &
MarketableSecurities*
Adjustments forDerivative
Accountingon Total Debt**
Equity Adjustments for Derivative Accounting on Equity**
- Managed Leverage+ - - -
=-
RetainedInterest in
SecuritizedOff-Balance
SheetReceivables
Charge-offsAverage Receivables
* Excludes marketable securities related to insurance activities** Related primarily to market valuation adjustments to derivatives due to movements in interest rates. Adjustments to debt are related to designated fair value
hedges and adjustments to equity are related to retained earnings
=Loss-to-Receivables Ratio
APPENDIX 14 of 16

FINANCIAL SERVICES SECTOR FORD CREDIT RECONCILIATIONS OF MANAGED LEVERAGE TO FINANCIAL STATEMENT LEVERAGE
APPENDIX 15 of 16
* Includes $58.6 billion and $49.4 billion on June 30, 2009 and June 30, 2010, respectively, of long-term and short-term asset-backed debt obligations issued in securitization transactions that are payable only out of collections on the underlying securitized assets and related enhancements
** Excludes marketable securities related to insurance activities*** Related primarily to market valuation adjustments to derivatives due to movements in interest rates. Adjustments to debt are related to designated
fair value hedges and adjustments to equity are related to retained earnings
June 30, June 30,2009 2010(Bils.) (Bils.)
Leverage CalculationTotal Debt* 104.9$ 88.5$ Securitized Off-Balance Sheet Receivables Outstanding 0.1 - Retained Interest in Securitized Off-Balance Sheet Receivables (0.1) - Adjustments for Cash, Cash Equivalents, and Marketable Securities** (19.1) (17.4) Adjustments for Derivative Accounting*** (0.2) (0.4)
Total Adjusted Debt 85.6$ 70.7$
Equity 10.3$ 10.9$ Adjustments for Derivative Accounting*** (0.1) (0.1)
Total Adjusted Equity 10.2$ 10.8$
Financial Statement Leverage (to 1) 10.2 8.1 Managed Leverage (to 1) 8.4 6.6

$73
$95$106 $113
$50
$71$82
$97
Cumulative Maturities -- As of December 31, 2009 (Bils.)
* Includes finance receivables net of unearned income, and investment in operating leases net of accumulated depreciation; cash and cash equivalents, marketable securities (excludes marketable securities related to insurance activities)
** Retail and lease ABS are treated as amortizing on January 1, 2010 to match the underlying assets*** Includes all of the wholesale ABS term and conduit maturities of $6.5 billion that otherwise contractually extend to 2011 and beyond
2010 2011 2012 2013 & Beyond
***
Memo: Unsecured long-term debt maturities (Bils.)$7.1 $11.5 $7.1 $13.5
Assets*Debt**
LIQUIDITY PROFILE OF FORD CREDIT’S BALANCE SHEET
APPENDIX 16 of 16