school composition and the black-white achievement...
TRANSCRIPT

School Composition and the Black–White Achievement Gap
NCES 2015-018 U.S. DEPARTMENT OF EDUCATION

Contents
1 Executive Summary
3 Introduction
6 Black Student Density, by Race and Location
12 The Relationship Between Black Student Density and Achievement
22 Exploring Between-School and Within-School Achievement Gaps
26 References
29 Appendix: Technical Notes
What Is NAEP?
The National Assessment of Educational Progress (NAEP) is an assessment program conducted by the National Center for Education Statistics (NCES) to inform the public of what elementary and secondary students in the United States know and can do in various subject areas, including mathematics and science. Since 1969, NAEP, also known as The Nation’s Report Card™, has been administered periodically to students at grades 4, 8, and 12 in order to report results for the nation, participating states, and selected large urban school districts. The National Assessment Governing Board oversees and sets policy for the NAEP program. Additional information about NAEP is available at http://nces.ed.gov/nationsreportcard/.

1 School Composition and the Black–White Achievement Gap
Executive Summary
The Black–White achievement gap has often been studied, but its relationship to school composition has generally not been explored. The demographic makeup of public schools is of particular interest, given recent concerns about the growing resegregation of schools (Frankenberg, Lee, and Orfield 2003; Orfield, Kucsera, and Siegel-Hawley 2012). This report explored eighth-grade achievement as it relates to the percentage of students in the school who were Black,1
1 The category Black includes students who identified as “Black or African American.”
or the density of Black students, to contribute to the understanding of the Black–White student achievement gap. The data used to explore these relationships came primarily from the National Assessment of Educational Progress (NAEP) 2011 Mathematics Grade 8 Assessment but also from the Common Core of Data for 2010–11, which provided additional school characteristics.
On average, White students attended schools that were 9 percent Black while Black students attended schools that were 48 percent Black, indicating a large difference in average Black student density nationally. When the analysis examined variation in density by region and locale, the results showed that schools in the highest density category (60 percent to 100 percent Black students) were mostly located in the South and, to a lesser extent, the Midwest and tended to be in cities. The highest percentage of schools in the lowest density category were in rural areas.
Analysis of the relationship between the percentage of students in a school who were Black and achievement showed the following:
• Achievement for both Black and White students was lower in the highest Black student density schools than in the lowest density schools.
• However, the achievement gap was not different.
However, when accounting for factors such as student socioeconomic status (SES) and other student, teacher, and school characteristics, the analysis found:
• White student achievement in schools with the highest Black student density did not differ from White student achievement in schools with the lowest density.
• For Black students overall, and Black males in particular, achievement was still lower in the highest density schools than in the lowest density schools.
• The Black–White achievement gap was larger in the highest density schools than in the lowest density schools.
• Conducting analysis by gender, the Black–White achievement gap was larger in the highest density schools than in the lowest density schools for males but not for females.
In addition, the size of the achievement gaps within each category of Black student density was smaller when the analysis accounted for student SES and other student, teacher, and school characteristics (except in the highest density category), suggesting that these factors explained a considerable portion of the observed achievement gap.2
2 In the highest density schools, the reduction in the achievement gap was not statistically significant ( p = .058).

2
In a separate analysis, the report estimated the extent to which the Black–White achievement gap could be attributed to between- versus within-school differences in achievement. The value of this analysis is to inform policies that allocate resources between schools versus policies that allocate resources within schools. Results of this analysis showed that, nationally and in most of the states
examined, the portion of the Black–White achievement gap attributed to within-school differences in achievement was larger than the portion attributed to between-school differences. There was, however, a portion of the gap that could not definitively be attributed to either within- or between-school differences alone. This portion was labeled “indeterminate.”

3 School Composition and the Black–White Achievement Gap
Introduction
The academic achievement of both Black and White public school students, as measured by the NAEP, has improved across time (Vanneman et al. 2009). However, the difference, or gap, in the achievement between these two groups of students persists; on average, Black students generally score lower than White students (Vanneman et al. 2009; NCES 2011). For example, on the NAEP 2011 Mathematics Grade 8 Assessment, Black students scored 31 points lower, on average, than did White students (National Center for Education Statistics 2011). By way of comparison, the difference between NAEP Grade 8 mathematics Basic and Proficient achievement levels is 37 points. Researchers, educators, and policymakers continue to seek both to understand the reason for the gaps and to develop policies and strategies to reduce the magnitude of the Black–White student academic performance gap (Fryer and Levitt 2004; Hanushek and Rivkin 2006; Hanushek, Kain, and Rivkin 2009; Kelly 2009; Reardon 2008; Stiefel, Schwartz, and Ellen 2007).
Prior researchers have identified both student- and school- level characteristics that are associated with student academic performance. A number of researchers have examined the demographic makeup of schools and its relationship with student academic performance (Armor and Watkins 2006; Berends and Penaloza 2010; Caldas and Bankston 1998; Ewijk and Sleegers 2010; Hanushek, Kain, and Rivkin 2009; Jencks and Mayer 1990; Mickelson 2001; Rumberger and Palardy 2005). The demographic makeup of schools is important because there have been concerns about growing resegregation in public schools (Fiel 2013; Frankenberg, Lee, and Orfield 2003; Orfield, Kucsera, and Siegel-Hawley 2012), so there is a need to further understand how achievement may be associated with increased racial isolation for Black students.
The current report contributes to this line of inquiry through analyses of the performance of public school students nationally on the NAEP 2011 Mathematics Grade 8 Assessment, along with student and school characteristics data drawn from NAEP, as well as the Common Core of Data. Analysis focused on the eighth grade because parent education, a key socioeconomic indicator, is not available for fourth-grade NAEP assessments. Analyses focused on mathematics on the basis of the assumption that mathematics achievement is less influenced by English language learner status (Abedi 2010; Chudowsky and Chudowsky 2010). With the focus on mathematics, the methods explored here could more easily be extended to other racial or ethnic groups (e.g., Hispanics) that might have more English language learners than the Black and White racial groups analyzed here. The methods employed here can be applied at a later date to analyses of achievement gaps for other racial-ethnic groups.
This report uses data on school demographic characteristics from the 2010–11 school year to create a school-level variable, Black student density (or density for short), which is defined as the proportion of a school’s enrollment that is Black.3
3 The term “density” has been used by various agencies and in peer reviewed literature (e.g., Gieling, Vollebergh, and van Dorsselaer 2010; Madyun and Lee 2010) to describe demographic compositions in various locations, including the racial/ethnic makeup of schools and neighborhoods.
For the analyses presented below, density serves as the organizing framework. It should be noted, however, that while the percentage of students who are Black measures the concentration of Black students in the school, it does not capture the complex ways in which the composition of the rest of the school population might vary. For example, two schools may have the same density measure, say 10 percent. In one school the remaining 90 percent of the student population may be White, while in the second school the remaining 90 percent may be from other minority groups. For the purposes of analysis in this report, however, these two schools would be treated similarly.

4
On the basis of findings from the research cited above, one of the key assumptions guiding the research in this report is that a school’s Black student density is a potential indicator of patterns of school segregation or resegregation. For example, the percentage of grade 8 students who were Black nationally in 2011 was 15 percent (NCES 2011); hence if there were no segregation nationally, then all students would be attending schools in which 15 percent of students were Black. Racial segregation may have a negative association with the quality of teaching and learning in schools attended by a large population of Black students (Aud, Fox, and KewalRamani 2010; Mickelson 2001).
The primary goal of this report is to present descriptive information on the relationships among the percentage of students in a school who are Black, the Black–White student academic performance gap, and student achievement.
• This report begins with a description of how the percentage of students in a school who were Black varies for Black students, compared with that for White students, and identifies the U.S. regions and locale types where the highest Black student density schools were located.
• The second part explores the relationship of the percentage of students in a school who are Black with achievement and achievement gaps.
• Third, the report explores whether the relationship between the percentage of students in a school who are Black and student achievement identified in the first stage of analyses persists when accounting for student demographic characteristics such as socioeconomic status (SES) and other school characteristics that may be associated with achievement. The final analysis in this section separately examines the results for males and females.
• The final section of the report builds on prior research that showed an association of the percentage of students in a school who were Black with the unequal distribution of education resources among schools, and
explores whether achievement gaps might be attributed to within-school or between-school differences. The results of this analysis provide information for people considering the distribution of key education resources, such as effective teachers, more equitably across schools or a focus on the equitable use or distribution of resources within individual schools to reduce achievement gaps.
The research in this report is exploratory. This report examines whether there are associations between the percentage of students in a school who were Black and the Black–White student achievement gap, but it does not assess whether this relationship is causal (e.g., this analysis does not and cannot test whether higher Black student density causes lower achievement). In addition, although the current report estimates the relative importance of inequalities within individual schools versus between schools with a statistical model, the analysis does not assess the effectiveness of any specific policy in addressing density, student achievement, or the achievement gap. Instead, the analysis intends to provide information to those concerned about the general allocation of resources between and within schools.
A better understanding of the current state of the Black– White achievement gap is needed because the Black–White achievement gap remains large (NCES 2011) and by some measures U.S. schools were as segregated in the 2000s as they were in the late 1960s (Orfield 2006). A previous NCES report (Vanneman et al. 2009) has documented trends in Black and White achievement and the gap in the nation and states. This report provides further descriptive and exploratory analysis of recent NAEP data to provide additional insight into the Black–White achievement gap by examining the average gap at different ranges of Black student density both without and with accounting for student and school characteristics such as socioeconomic status. Additionally, this report presents analysis that suggests focal areas to explore for closing the gap by presenting results for the nation and states that identify whether the gaps are primarily found within schools or between schools.4
4 In this report, findings are reported based on a statistical significance level set at .05. When comparisons are made, terms like higher or lower indicate statistically significant findings. Percentages and differences were computed using unrounded numbers, so the results may differ from what would be obtained using the rounded numbers in figures and tables.

5 School Composition and the Black–White Achievement Gap
Why might the Black student density in a school be related to achievement and the Black–White achievement gap?
Understanding the complex relationship between school demographic characteristics and student academic performance is important because prior research has identified mechanisms by which the percentage of students in a school who are Black may directly or indirectly result in lower student achievement.
• First, prior research has identified a relationship between the percentage of students in a school who are Black and an uneven distribution of key academic supports across schools, such as experienced and effective teachers. Schools that serve large percentages of Black students are more likely to employ less experienced teachers (Aud, Fox, and KewalRamani 2010; Mickelson 2001).
• Second, schools with a percentage of students who are Black tend to have higher shares of low-socioeconomic-status students, who often need additional supports to be successful because Black students are more likely to be in a one-parent/guardian family, to be in a family in poverty (Federal Interagency Forum on Child and Family Statistics 2013), and to have parents with lower levels of education, compared with the parents of White students (Aud, Fox, and KewalRamani 2010).
• Third, there is a body of work that explores whether negative education outcomes, such as lower achievement, that are associated with large concentrations of Black students in schools might be due to an “oppositional culture,” which is a part of contemporary Black culture (Fordham and Ogbu 1986; Ogbu 2004). This line of research considers student peer effects associated with larger concentrations of Black students where it has been theorized that certain behaviors that are associated with higher achievement are shunned because they involve learning to cope with pressures such as “the burden of acting White” (Fordham and Ogbu 1986).
• Fourth, some researchers have considered whether teachers may also have lower expectations for student performance in schools with a high population of Black students, sometimes explained as a “Pygmalion effect” (Rosenthal and Jacobson 1992; Ferguson 2003). This research is grounded in the assumption that lower expectations by teachers for students from minority backgrounds may result in lower levels of engagement by both teachers and students, which ultimately may contribute to poorer academic performance. One study found that in predominantly Black elementary schools, Black and White students tend to score lower and eventually are placed on a lower track in high school, and this tracking can start in elementary school (Mickelson 2001).
• Fifth, at the high school level, some research shows that the tracking of Black students tends to differ by the density of Black students in the school. One study found that that Black students are more likely to be in high-track courses (e.g., taking algebra in the eighth grade rather than the ninth grade) in predominantly Black schools than in lower density schools (Kelly 2009). Another study found that even when controlling for achievement, more racial-ethnic and socioeconomic diversity are related to more “de facto” tracking (Lucas and Berends 2002).
• Sixth, the number of school disciplinary reports increases as the percentage of students in a school who are Black increases, and Black students are more likely than White students to face school discipline or office referrals (Rocque and Paternoster 2011), which is relevant because higher rates of out-of-school suspension are related with lower achievement (Rausch and Skiba 2004).

6
Black Student Density, by Race and Location
Black students are, on average, in schools that are 48 percent Black, whereas Whitestudents are, on average, in schools that are 9 percent Black.
Black student density, defined in this report as the percentage of students in a school who are Black, is often used as a base for measures of segregation. Nationally, Black students
attend schools that are, on average, 48 percent Black, whereas White students attend schools that are, on average, 9 percent Black, as displayed in figure 1, below.5
5 The full NAEP sample, including students of all race-ethnicities, was 54 percent White, 16 percent Black, 23 percent Hispanic, 6 percent Asian, 1 percent American Indian, and 2 percent two or more race-ethnicities. Of these students, 47.7 percent were NSLP-eligible, 62.8 percent had a parent with more than a high school diploma, and 28.6 were in schools located in a city.
Figure 1. Average percentage of students who are Black in schools, for White andBlack students: 2011
NOTE: The measures displayed in this figure are average percentages of students in the school who are Black. SOURCE: U.S. Department of Education, Institute of Education Sciences, National Center for Education Statistics, National Assessment of Educational Progress (NAEP), 2011 Mathematics Grade 8 Assessment.

7 School Composition and the Black–White Achievement Gap
Figure 2 displays the four density categories used in this report to examine the relationships among Black student density, achievement, and achievement gaps: The density categories are 0 percent to 20 percent Black students within a school, 20 percent to 40 percent, 40 percent to 60 percent, and 60 percent to 100 percent.6,7
6 There were too few observations in schools with more than 60 percent Black students to have separate categories for 60 percent to 80 percent Black students and 80 percent to 100 percent Black students. 7 In this report, the categories of percent Black are constructed so that there is no overlap between the levels. For example, the first Black student density category is 0 percent Black up to and equal to 20 percent Black, the second is greater than 20 percent up to and equal to 40 percent, and so forth.
Figure 2 further illustrates the disparity noted above, in figure 1: The
majority of White students (86 percent) attend schools in the 0 percent to 20 percent density category, whereas 24 percent of Black students attend schools in this category. About 1 percent of White students attended schools in the highest density category (60 percent to 100 percent Black), whereas 35 percent of Black students did so.8
8 In the sample of Black and White students combined, 74.2 percent attend schools 0–20 percent Black, 12.2 percent attend schools 20–40 percent Black, 5.9 percent attend schools 40–60 percent Black, and 7.7 percent attend schools 60–100 percent Black.
Figure 2. Percentage of students in each Black student density category, by student race: 2011
NOTE: The measures displayed in this figure are percentages of students by race category. Detail may not sum to totals because of rounding. SOURCE: U.S. Department of Education, Institute of Education Sciences, National Center for Education Statistics, National Assessment of Educational Progress (NAEP), 2011 Mathematics Grade 8 Assessment.

Nationally, as shown in figure 3, more than three-quarters of public schools in the nation are in the lowest density category, where “lowest density” is defined as schools in which the percentage of students who are Black is between 0 percent
and 20 percent. Approximately 10 percent of schools are in the highest density category, where “highest density” is defined as schools in which the percentage of students who are Black is between 60 and 100 percent.
Figure 3. Percentage of public schools nationally, by Black student densitycategory: 2011
NOTE: The measures displayed in this figure are percentages of schools. Detail may not sum to totals because of rounding. Calculations based on the number of schools that offer eighth grade and whose Type = Regular school. (For a definition of a “regular” school, see CCD documentation at http://nces.ed.gov/ccd/psadd.asp.) SOURCE: U.S. Department of Education, National Center for Education Statistics, Common Core of Data, 2010–11.
8

9 School Composition and the Black–White Achievement Gap
Schools in the highest Black student density category are mostly located in the South,with very few in the West.
The average percentage of students in a school who are Black varies by region and locality.9
9 CCD regions are the regions defined by the U.S. Census: Northeast, Midwest, South, and West.
Figure 4 displays the distribution of schools by Black student density category and region. As seen in figure 4, across the four regions, large
proportions of schools in the highest density category were found in the South and, to a lesser extent, in the Midwest; the fewest of the schools in the highest density category were found in the West.
Figure 4. Distribution of schools by region within Black student density category: 2011
NOTE: The measures displayed in this figure are percentages of schools within each Black student density category. Detail may not sum to totals because of rounding. Calculations based on the number of schools that offer eighth grade and whose Type = Regular school. SOURCE: U.S. Department of Education, National Center for Education Statistics, Common Core of Data, 2010–11.

Schools in the highest Black student density category are mostly in cities, but thisvaries by region.
Figure 5 shows that schools in the highest Black student density category (60 percent to 100 percent Black) were most frequently located in cities; smaller percentages of these schools were located in suburbs, towns, and rural areas. Within the highest density category (60 percent to
100 percent), 67 percent of schools were located in cities and 15 percent or fewer in each of the other locale types. In the lowest density category (0 percent to 20 percent), 48 percent of schools were located in rural areas and 22 percent or fewer in each of the other locale types.10
10 Locale type is based on CCD codes, which can be found at http://nces.ed.gov/ccd/psadd.asp.
Figure 5. Distribution of schools by locale type within Black student density category: 2011
NOTE: The measures displayed in this figure are percentages of schools within each density category. Detail may not sum to totals because of rounding. Calculations based on the number of schools that offer eighth grade and whose Type = Regular school. SOURCE: U.S. Department of Education, National Center for Education Statistics, Common Core of Data, 2010–11.
10
11 School Composition and the Black–White Achievement Gap
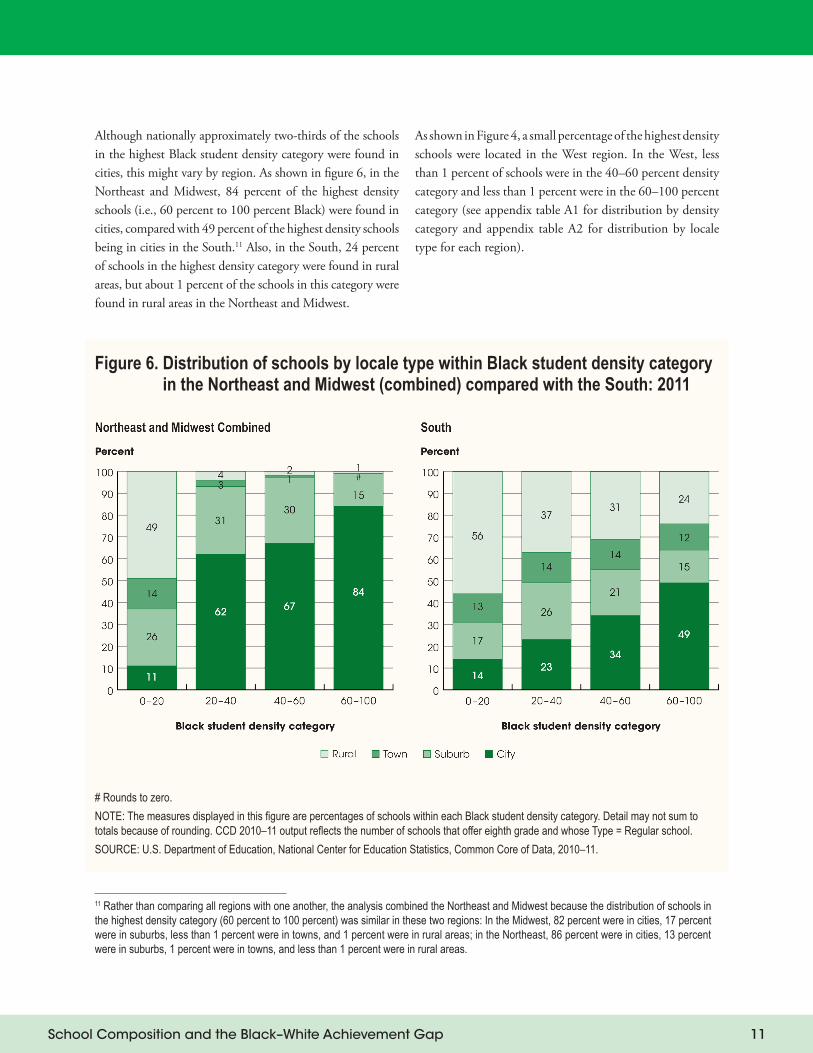
Although nationally approximately two-thirds of the schools in the highest Black student density category were found in cities, this might vary by region. As shown in figure 6, in the Northeast and Midwest, 84 percent of the highest density schools (i.e., 60 percent to 100 percent Black) were found in cities, compared with 49 percent of the highest density schools being in cities in the South.11
11 Rather than comparing all regions with one another, the analysis combined the Northeast and Midwest because the distribution of schools in the highest density category (60 percent to 100 percent) was similar in these two regions: In the Midwest, 82 percent were in cities, 17 percent were in suburbs, less than 1 percent were in towns, and 1 percent were in rural areas; in the Northeast, 86 percent were in cities, 13 percent were in suburbs, 1 percent were in towns, and less than 1 percent were in rural areas.
Also, in the South, 24 percent of schools in the highest density category were found in rural areas, but about 1 percent of the schools in this category were found in rural areas in the Northeast and Midwest.
As shown in Figure 4, a small percentage of the highest density schools were located in the West region. In the West, less than 1 percent of schools were in the 40–60 percent density category and less than 1 percent were in the 60–100 percent category (see appendix table A1 for distribution by density category and appendix table A2 for distribution by locale type for each region).
Figure 6. Distribution of schools by locale type within Black student density category in the Northeast and Midwest (combined) compared with the South: 2011
# Rounds to zero. NOTE: The measures displayed in this figure are percentages of schools within each Black student density category. Detail may not sum to totals because of rounding. CCD 2010–11 output reflects the number of schools that offer eighth grade and whose Type = Regular school. SOURCE: U.S. Department of Education, National Center for Education Statistics, Common Core of Data, 2010–11.

12
The Relationship Between Black Student Density and Achievement
Achievement was lower for both Black and White students in schools with the highest Black student density than in schools with the lowest density. However, the Black– White student achievement gap did not differ significantly between the highest andlowest density schools.
Initial exploration of the relationship between the percentage of students in a school who are Black and student achievement for Black and White students identified two aspects of the relationship between Black student density and student achievement, as follows:
• Black and White students in the highest density schools had lower achievement than their peers in the lowest density schools.
• However, the Black–White student achievement gaps among schools in the higher density categories did not differ significantly from the achievement gap among the lowest density schools.
Figure 7 displays this relationship by using student achievement scores from the NAEP 2011 Mathematics Grade 8 Assessment. White students in schools in the 0 percent to 20 percent Black student density category
had an average NAEP mathematics score of 293, whereas Black students had an average score of 268. This difference represents an achievement gap of, on average, 25 points. Achievement for both Black and White students in the highest density schools was about 10 points lower than in the lowest density schools. However, the achievement gap between the two groups was not significantly different; the achievement gap for schools in the 60 percent to 100 percent density category was 26 points and not significantly different from the gap of 25 points in the 0 percent to 20 percent density category.12
12 Note that, even though the achievement gap across all students in all density categories was 31 points, when the achievement gap was calculated by Black student density category, it is possible for all categories to have achievement gaps lower than 31 points because the categories have unequal proportions of Black and White students. This is sometimes known as “Simpson’s paradox” (Wagner 1982).
As demonstrated later in the report, these relationships changed when the analysis accounted for other factors associated with both achievement and density, such as student SES and other student, teacher, and school characteristics. The rationale for accounting for such other factors was to attempt to focus on the association of the percentage of students in a school who are Black with achievement independent of those other factors.

13 School Composition and the Black–White Achievement Gap
* Significantly different ( p < .05) from the 0 percent to 20 percent Black student density category.
Figure 7. Black–White student achievement and achievement gap, by Black student density category, Grade 8 mathematics: 2011
SOURCE: U.S. Department of Education, Institute of Education Sciences, National Center for Education Statistics, National Assessment of Educational Progress (NAEP), 2011 Mathematics Grade 8 Assessment.

Schools with higher Black student density also have higher percentages of studentswith low socioeconomic status.
Previous research has identified relationships among the percentage of students in a school who are Black, achievement, and achievement gaps. To further understand the complexity of these associations, the analysis here first examined the relationship between SES and achievement gaps. For example, schools with high Black student density would seem likely to enroll students of low SES. The following analyses explore density patterns by SES and assess whether the percentage of students in a school who are Black continues to have a significant relationship with the achievement gap after accounting for SES. This study uses two measures of SES: eligibility for the National School Lunch Program (NSLP), a commonly used measure of family income, and parent education level (United States Department of Agriculture Food and Nutrition Service 2012).13,14
13 “Children from families with incomes at or below 130 percent of the poverty level are eligible for free meals. Those with incomes between 130 percent and 185 percent of the poverty level are eligible for reduced-price meals, for which students can be charged no more than 40 cents” (United States Department of Agriculture Food and Nutrition Service 2012). 14 In the NAEP student background questionnaire, students reported separately on the highest level of education their mother and father had obtained: did not finish high school, graduated from high school, some education after high school, graduated from college, and don’t know. The combined highest level of education was determined by taking the maximum of the two separate parent education levels.
Figure 8 displays the relationship between measures of SES and Black student density. On the left, the relationship between NSLP eligibility and the percentage of students in a school who were Black is presented, and the relationship between student-reported parent education and the percentage of students in a school who were Black is shown on the right. For both Black and White students, NSLP eligibility was higher in the highest density schools than in the lowest density schools. However, there were differences in the rates of eligibility of Black and White students: Within each density category, a higher percentage of Black students than White students were NSLP eligible. For example, 83 percent
of Black students in the highest density schools were NSLP eligible compared with 53 percent of White students.15
15 In the sample of Black and White students combined, the percentage of NSLP-eligible students was 30.4 percent in schools 0–20 percent Black, 49.7 percent in schools 20–40 percent Black, 61.7 percent in schools 40–60 percent Black, and 79.8 percent in schools 60–100 percent Black.
Similar patterns are noticeable when examining parent education level and the percentage of students in a school who were Black. The percentage of students with a parent who had more than a high school diploma was lower in schools in each of the higher Black student density categories than in the lowest density schools (0 percent to 20 percent Black).16
16 In the sample of Black and White students combined, the percentage of students who had a parent with more than a high school diploma was 79.3 percent in schools 0–20 percent Black, 74.0 percent in schools 20–40 percent Black, 71.3 percent in schools 40–60 percent Black, and 70.2 percent in schools 60–100 percent Black.
However, there were two important differences between what was found when using parents’ education, as opposed to NSLP eligibility, as a measure of SES. First, the differences in parent education between Black and White students ranged across density categories from -3 percentage points to 5 percentage points, whereas when looking at NSLP eligibility, the differences ranged from 30 percentage points to 37 percentage points. For example, in the lowest density schools, 79 percent of the White students’ parents had more than a high school education, compared with 76 percent of the Black students’ parents—about a 3 percentage point difference, compared with the 32 percentage point difference in NSLP eligibility for that density category. In the highest density schools, 71 percent of Black students had parents with more than a high school diploma, whereas 66 percent of White students had the same. Second, as one moves from the lowest to the highest density schools, there was about a 6 percentage point decrease in the percentage of parents of Black students with a high school diploma or
14
15 School Composition and the Black–White Achievement Gap
* Significantly different ( p < .05) from the 0 percent to 20 percent density category.
higher, compared with a 14 percentage point decrease for the parents of White students. The 5 percentage point Black– White difference in parent education in the schools with the highest Black student density was significantly different from the -3 percentage point Black–White difference in the lowest density schools.
In summary, these results show that the percentage of students in a school who were Black is related to the two SES indicators used in this study, although the relationships for Black students were different from those for White students, depending on the SES indicator being considered.
Figure 8. Percentage of Black and White students who were National School Lunch Program (NSLP) eligible and percentage who had a parent with more thana high school education, by Black student density category: 2011
NOTE: The measures displayed in this figure are percentages of students within each Black student density category. SOURCE: U.S. Department of Education, Institute of Education Sciences, National Center for Education Statistics, National Assessment of Educational Progress (NAEP), 2011 Mathematics Grade 8 Assessment.

16
Accounting for SES, the previously observed relationship between Black studentdensity and achievement disappeared for Whites but not for Blacks.
An achievement gap may be due to a number of different factors, including differences in SES. As shown in figure 8, Black students were more likely to be NSLP eligible within each of the Black student density categories. In this report, regression analyses were used to explore whether the relationships between density and achievement and between density and the Black–White student achievement gap persisted once the differences in SES, and its influence on achievement, were taken into account.17
17 In figure 8, the relationship between parent education and density is explored by using a composite measure of parent education: whether the highest level of parents’ education was more than a high school diploma. The analysis here uses more detailed information about parent education, including information for mothers and fathers, as well as finer levels of education: less than a high school diploma, a high school diploma, a college degree, or more.
In figure 9, the results from figure 7 (repeated on the left panel of figure 9) are compared with the same results when accounting for SES (on the right panel of figure 9). This analysis indicated that once differences in student SES were accounted for:
• The achievement gap in each Black student density category was smaller by 5 percentage points to 7 percentage points, and the difference was statistically significant for every category except 60 percent to 100 percent Black.
• The only instance where achievement was significantly lower than achievement in the lowest density category was for Black students in the highest density category (60 percent to 100 percent Black).
• The size of the achievement gap was not significantly smaller in any density categories when compared to the gap in the lowest density category.
Without accounting for differences in SES, the achievement gap in the lowest density schools (schools with 0 percent to 20 percent Black students) was -25 points. When accounting for differences in SES, the achievement gap was -18 points. The achievement gap in the highest density category (60 percent to 100 percent Black students), however, was not significantly smaller when accounting for SES differences.
Without accounting for SES differences, achievement was lower in each density category compared to the lowest density category for both Black and White students. In comparison, when accounting for differences in SES, the achievement for White students was not significantly different in other density categories compared to White students’ achievement in the lowest density schools. For Black students, achievement was similarly not significantly different in other density categories when compared to the lowest density schools, except in the highest density schools where average achievement was 7 points lower.

17 School Composition and the Black–White Achievement Gap
Figure 9. Black–White student achievement and achievement gap, by Black student density category, without and with accounting for SES, Grade 8 mathematics: 2011
* Significantly different ( p < .05) from the 0 percent to 20 percent Black student density category. NOTE: Socioeconomic control variables included mothers’ and fathers’ highest level of education (less than a high school diploma, a high school diploma, a college degree, or more) and student National School Lunch Program (NSLP) eligibility status. SOURCE: U.S. Department of Education, Institute of Education Sciences, National Center for Education Statistics, National Assessment of Educational Progress (NAEP), 2011 Mathematics Grade 8 Assessment.

18
When accounting for SES, student, teacher, and school characteristics, the achievementgap was greater among schools with the highest Black student density than the schools with the lowest.
To explore the relationship between the percentage of students in a school who were Black and achievement gaps further, regression analyses were conducted accounting for a broad set of factors. These analyses tested whether the relationship among Black student density, achievement, and the Black–White student achievement gap changed while accounting for the influence of other variables, including student characteristics, teacher characteristics, and school characteristics, in addition to the SES variables included in the previous analysis. The additional variables that the model accounted for included a measure for students with disability status, measures of teacher qualifications, teacher instructional practices, school resources, and school climate.18
18 See the appendix for technical notes about the model used. Complete details about measures and methods used can be found in the methodology paper (Bohrnstedt et al. 2015).
Figure 10 displays the relationship between achievement and the percentage of students in a school who were Black, again comparing the results without accounting for other measures (left panel), with results accounting for the effects of the collection of student, school, and teacher measures (right panel). Comparing the results shows that accounting for differences in student SES, along with other student, teacher, and school characteristics, yields the following results:
• The achievement gaps were reduced in every category of Black student density except 60 percent to 100 percent Black.
• Achievement for White students in the highest density schools (60 percent to 100 percent Black) was not significantly different from White students in the lowest density schools. However, Black students continued to have lower achievement in the highest density schools, compared with that in the lowest density schools.
• The achievement gaps in the two highest density categories (40 percent to 60 percent and 60 percent to 100 percent Black) were larger than that in the lowest density category (0 percent to 20 percent Black).
Note that the estimated relationship between Black student density and performance was different when the analysis accounted for all the variables versus when it accounted for none (see the right panel of figure 10). For White students, there was an increase in NAEP mathematics performance in the 40 percent to 60 percent Black student density category when compared with scores for those in the lowest density schools, but achievement in the highest density schools (60 percent to 100 percent Black) was not different, compared with that in the lowest density schools. For Black students, the average score in the highest density schools was lower than the average score in the lowest density schools. In addition, the gaps were reduced when accounting for differences in student SES, along with other student, teacher, and school characteristics. In the lowest density schools, the achievement gap decreased from 25 points without controls to 15 points when the analysis accounted for differences in student SES, along with other student, teacher, and school characteristics; however, in the highest density schools, the achievement gap was not reduced significantly. Finally, when the analysis accounted for differences in student SES, along with other student, teacher, and school characteristics, the achievement gaps among schools in the 40 percent to 60 percent Black and 60 percent to 100 percent Black density categories were higher than the gap among the lowest density schools. This finding is related to the fact that White students’ scores were higher in the 40 percent to 60 percent Black category and Black students’ scores were lower in the highest density category (60 percent to 100 percent Black).

19 School Composition and the Black–White Achievement Gap
* Significantly different ( p < .05) from the 0 percent to 20 percent Black student density category.
Taken together, these results provide evidence that once the analysis accounted for the differences in student SES, along with other student, teacher, and school characteristics, (a) the negative relationship between the percentage of students in a school who were Black and achievement was eliminated for White students but not for Black students;
(b) the size of the achievement gaps was reduced, especially in the lowest density and schools 20 percent to 40 percent Black; and (c) the achievement gap increased with density because of the differential change in the relationship between density and achievement for Black and White students.
Figure 10. Black–White student achievement and achievement gap, by Black student density category, without and with accounting for student, teacher, and school characteristics, Grade 8 mathematics: 2011
NOTE: Model control variables included socioeconomic status (SES), student characteristics indicators, measures of teacher qualifications, teacher instructional practices, school resources, and school climate. (See appendix for technical notes.) SOURCE: U.S. Department of Education, Institute of Education Sciences, National Center for Education Statistics, National Assessment of Educational Progress (NAEP), 2011 Mathematics Grade 8 Assessment.

20
When looking at results by gender, patterns observed for the total sample persisted for males: There was a wider achievement gap and lower Black student achievement in the highest Black student density schools than in the lowest density schools.
There is considerable interest in the achievement of Black males, given that prior research has identified achievement gaps between males and females across racial and ethnic groups. For example, research conducted by the Council of Great City Schools (Lewis et al. 2010) identified persistent, wide achievement gaps between Black males who attended large city schools (i.e., public schools in a set of U.S. cities with populations exceeding 250,000) and a national sample of White males in public schools. Exploring Black– White achievement gaps is also possible by using NAEP data. Having established that the relationship between the percentage of students in a school who were Black and achievement changes when the analysis accounted for differences in student SES, along with other student, teacher, and school characteristics, the report further explores whether the estimated relationships are the same for females and males.
As seen in figure 11, several differences can be observed in the achievement of females (on the left) and males (on the right), as well as in the achievement gaps. Comparing these graphs, both of which account for differences in student SES, as well as other student, teacher, and school characteristics, the following is evident:
• Although White females scored higher than Black females, there was not a significant relationship between Black student density and achievement or density and achievement gaps for females.
• For males, the Black–White student achievement gap in the highest density schools was greater than in the lowest density schools; additionally, Black student achievement was lower.
Although there was no statistically significant relationship between the percentage of students in a school who were Black and achievement for females, Black or White, there were some differences across Black student density categories for males. First, there was lower achievement for Black males in the highest density schools, compared with that in the lowest density schools when the analysis accounted for differences in student SES, along with other student, teacher, and school characteristics. Second, compared with average achievement for White males in the lowest density schools, average achievement for White males in schools that were 40 percent to 60 percent Black was higher, but the average achievement for White males in the highest density schools was not significantly different.
For females, the Black–White achievement gap was not significantly greater in the highest density schools (15 points) than in the lowest density schools (13 points). For males, however, the Black–White achievement gap was significantly greater in the highest density schools (25 points) than in the lowest density schools (17 points).

21 School Composition and the Black–White Achievement Gap
Figure 11. Black–White achievement and achievement gap, by Black student density category, for females and males, controlling for student, teacher, and school characteristics, Grade 8 mathematics: 2011
* Significantly different ( p < .05) from the 0 percent to 20 percent density category. SOURCE: U.S. Department of Education, Institute of Education Sciences, National Center for Education Statistics, National Assessment of Educational Progress (NAEP), 2011 Mathematics Grade 8 Assessment.

22
Exploring Between-School and Within-School Achievement Gaps
Prior research on achievement gaps has explored whether the gaps are better understood as differences in achievement across schools or as differences within schools (Cook and Evans 2000; Fryer and Levitt 2004; Hanushek and Rivkin 2006; Stiefel, Schwartz, and Ellen 2007; Reardon 2008). One of the key assumptions of this phase of the analysis is that the achievement gap, with the percentage of students in a school who were Black as a key measure, can be broken down or “decomposed” into a portion that represents differences in achievement between schools and differences in achievement within the same schools. Whether gaps are larger between schools or within schools can inform the actions of those who are concerned with improving student achievement and reducing the achievement gap.
Because the indeterminate component of the achievement gap could be either between schools or within schools, it is not clear whether changes in resources or policies that affect achievement within or between schools might close the indeterminate component.
The analyses conducted for this study do not offer suggestions for how to reduce gaps between schools. However, when between-school gaps exist, they theoretically might be addressed by focusing efforts on differences between schools (e.g., access to critical resources that might be associated with higher student achievement, like technology, updated textbooks, or qualified teachers). As an example, Clotfelter, Ladd, and Vigdor (2007) established that there was an uneven distribution of teachers with credentials across schools, and these researchers then showed that teacher credentials were tied to higher student achievement. To address gaps between schools, leaders in schools, districts, and states might focus on providing more resources to underserved schools.
Similarly, the analyses conducted for this study also do not offer suggestions for how to reduce gaps within schools. However, when within-school gaps exist, they theoretically might be addressed by focusing efforts on differences within schools (e.g., access within schools to critical resources, like technology, updated textbooks, or qualified teachers) or changing process (e.g., differential teacher expectations, tracking) that might be associated with higher student achievement. As an example, Figlio (2005) found that, unrelated to a student’s actual ability, teachers had lower expectations for Black students, which resulted in lower test scores.19
19 Specifically, Figlio (2005) found that students with certain types of names had lower expectations from their teachers, and those types of names are more frequently found among Black students.
As another example, “de facto” tracking (Lucas and Berends 2002) can lead to achievement disparities within schools. These within-school gaps may be addressed best by focusing on how internal decisions are made about the organization and support of learning, as well as how resources are allocated within schools.
Prior researchers have applied different methodologies to understand how the achievement gap can be decomposed into parts reflecting differences in achievement between schools and also within schools. However, researchers using different methods have reported different findings. Although some researchers have found that the portion of the achievement gap that can be explained by within-school differences is more than double the portion explained by the between-school differences (Cook and Evans 2000; Fryer and Levitt 2004), other researchers have found that the between-school gap is noticeably larger than the within-school gap (Hanushek and Rivkin 2006; Stiefel, Schwartz, and Ellen 2007). In an attempt to reconcile these divergent findings, Reardon (2008) identified a term in the decomposition formula that some researchers had attributed to the within-school component, whereas others had applied the same term to the between-school component. He identified this potentially overlapping component as “ambiguous,” meaning that it

School Composition and the Black–White Achievement Gap
could be applied to either the between-school or within-school gaps and could potentially be addressed by both types of improvement policies. This report labels the ambiguous portion as “indeterminate” rather than “ambiguous.” This research effort adopts a strategy similar to Reardon’s and measures three components of the achievement gap: between schools, within schools, and indeterminate.
Of the total Black–White achievement gap of 31 points, 16 points can be attributed to within-school differences.
The percentage of students in a school who were Black is a key piece of information in applying decomposition techniques and operates in two key ways.20
20 Similar to the analyses in the previous chapter, the analyses presented in this chapter used individual level data. However, Black student density, or “the percent of students in the school who were Black,” was used as a continuous variable in the methodology. In contrast, the previous chapter examined achievement within each of density categories: 0–20 percent Black, 20–40 percent Black, 40–60 percent Black, and 60–100 percent Black.
First, the estimated relationship between Black student density and student achievement provides a measure for how achievement is distributed across high- and low-density schools. Second, exploring the difference in the average density of schools attended by Black and White students provides information about the relative importance of the between-school and within-school components. For example, if there is no difference in the average density of schools attended by Black and White students, then no part of the achievement gap can be attributed to differences between schools.
Figure 12 displays the average percentage of students in a school who were Black for Black and White students nationally and for the jurisdictions used in this analysis.21
21 Seven states had too few Black students sampled in NAEP assessments to report scores: Idaho, Montana, New Hampshire, North Dakota, Utah, Vermont, and Wyoming. These states are not analyzed separately but are included in calculations for the nation as a whole.
Nationally, White students attended schools that were, on average, 9 percent Black (left side of the bar), whereas Black students attended schools that were, on average, 48 percent Black (right side of the bar). The difference in average Black student density (center of the bar) for White and Black students was 39 percentage points. Across states, the difference in average Black student density ranged from 2 percentage points (New Mexico, center of the bar) to 56 (Illinois, center of the bar). The difference in average density was a key measure used to calculate the main results, which are displayed in figure 13: the portions of the total
achievement gaps attributed to between-school differences, within-school differences, and indeterminate factors.
Figure 13 displays the three components of the Black–White achievement gap on the NAEP 2011 Mathematics Grade 8 Assessment, following the method developed by Reardon (2008) for each jurisdiction analyzed. Among public schools nationally, the Black–White achievement gap was 31 points. Of these 31 points, 16 points were attributable to within-school difference, 5 points to between-school differences, and 10 points were indeterminate.
The pattern of the breakdown of achievement gap components across nearly all the states included in this analysis is similar to the national pattern. The portion of the gap attributable to within-school differences was larger than that for between-school or indeterminate differences in most jurisdictions analyzed. For example, in the District of Columbia, the within-school portion was 32 points, which was different (as designated by the asterisk) from the between-school portion, which was 15 points. Jurisdictions where the within-school portion was not significantly larger than the between-school portion included eight states: Arkansas, Maryland, Michigan, New York, Ohio, Pennsylvania, Tennessee, and Wisconsin.
In a few states, the between-school component was estimated to be greater than zero. A positive number is interpreted to mean that the differences contributed to a decrease in the size of the gap.
In jurisdictions where the largest component of the achievement gap is found within schools, the implication is that to close the Black–White achievement gap it might be more important to focus efforts on addressing differences within schools rather than differences across schools.
23

24
Figure 12. Differences in school’s Black student density for Black and White students, nationally and by jurisdiction: 2011
NOTE: The measures displayed in this figure are average percentages of students in the school who are Black. The following states are not included in the figure because they had too few Black students sampled on NAEP assessments to report scores: Idaho, Montana, New Hampshire, North Dakota, Utah, Vermont, and Wyoming. These states are not analyzed separately but are included in calculations for the nation as a whole. SOURCE: U.S. Department of Education, Institute of Education Sciences, National Center for Education Statistics, National Assessment of Educational Progress (NAEP), 2011 Mathematics Grade 8 Assessment.

25 School Composition and the Black–White Achievement Gap
* Significantly different ( p < .05) from the between-school category. # Rounds to zero.
Figure 13. Breakdown of the components of the achievement gap for public schools, nationally and by jurisdiction: 2011
NOTE: The following states are not included in the figure because they had too few Black students sampled on NAEP assessments to report scores: Idaho, Montana, New Hampshire, North Dakota, Utah, Vermont, and Wyoming. These states are not analyzed separately but are included in calculations for the nation as a whole. SOURCE: U.S. Department of Education, Institute of Education Sciences, National Center for Education Statistics, National Assessment of Educational Progress (NAEP), 2011 Mathematics Grade 8 Assessment.

26
References
Abedi, J. (2010). Performance Assessments for English Language Learners. Stanford, CA: Stanford University, Stanford Center for Opportunity Policy in Education.
Armor, D., and Watkins, S. (2006). School Segregation and Black Achievement: New Evidence From the 2003 NAEP. In The Benefits of Racial and Ethnic Diversity in Elementary and Secondary Education (pp. 28–49). Washington, DC: U.S. Commission on Civil Rights.
Aud, S., Fox, M., and KewalRamani, A. (2010). Status and Trends in the Education of Racial and Ethnic Groups (NCES 2010-015). U.S. Department of Education, National Center for Education Statistics. Washington, DC: U.S. Government Printing Office.
Berends, M., and Penaloza, R.V. (2010). Increasing Racial Isolation and Test Score Gaps in Mathematics: A 30-Year Perspective. Teachers College Record, 112 (4): 978–1007.
Bohrnstedt, G., Kitmitto, S., Ogut, B., Sherman, D., and Chan, D. (2015). School Composition and the Black–White Achievement Gap: Methodology Companion (NCES 2015032). National Center for Education Statistics, Institute of Education Sciences, U.S. Department of Education, Washington, DC.
Caldas, S.J., and Bankston, C.L. (1998). The Inequality of Separation: Racial Composition of Schools and Academic Achievement. Educational Administration Quarterly, 34 (4): 533–557.
Chapin, F.S. (1933). The Measurement of Social Status. Minneapolis, MN: University of Minnesota Press.
Chudowsky, N., and Chudowsky, V. (2010). Has Progress Been Made in Raising Achievement for English Language Learners? Washington, DC: Center on Education Policy.
Clotfelter, C.T., Ladd, H.F., and Vigdor, J.L. (2007). How and Why Do Teacher Credentials Matter for Student Achievement? (NBER Working Paper 12828). Cambridge, MA: National Bureau of Economic Research. Retrieved April 3, 2014, from http://www.nber.org/papers/w12828.
Cook, M.D., and Evans, W.N. (2000). Families or Schools? Explaining the Convergence in White and Black Academic Performance. Journal of Labor Economics, 18 (4): 729–754.
Ewijk, R., and Sleegers, P. (2010). The Effect of Peer Socioeconomic Status on Student Achievement: A Meta- Analysis. Educational Research Review, 5 (2): 134–150.
Federal Interagency Forum on Child and Family Statistics. (2013). America’s Children: Key National Indicators of Well-Being, 2013. Washington, DC: U.S. Government Printing Office.
Fiel, J.E. (2013). Decomposing School Resegregation: Social Closure, Racial Imbalance, and Racial Isolation. American Sociological Review, 78 (5): 828–848.
Figlio, D.N. (2005). Names, Expectations and the Black– White Test Score Gap (NBER Working Paper 11195). Cambridge, MA: National Bureau of Economic Research. Retrieved April 3, 2014, from http://www.nber.org/papers/ w11195.pdf.
Fordham, S., and Ogbu, J.U. (1986). Black Students’ School Success: Coping With the Burden of “Acting White.” The Urban Review, 18: 176–206.
Frankenberg, E., Lee, C., and Orfield, G. (2003). A Multiracial Society With Segregated Schools: Are We Losing the Dream? Cambridge, MA: The Civil Rights Project Harvard University. Retrieved January 26, 2014, from http://pages.pomona.edu/~vis04747/h21/readings/ arewelosingthedream.pdf.
Fryer, R.G., and Levitt, S.D. (2004). Understanding the Black–White Test Score Gap in the First Two Years of School. Review of Economics and Statistics, 86: 447–464.
Gieling, M., Vollebergh, W., and van Dorsselaer, S. (2010). Ethnic Density in School Classes and Adolescent Mental Health. Social Psychiatry and Psychiatric Epidemiology, 45 (6): 639–646.
27 School Composition and the Black–White Achievement Gap
Hanushek, E.A., Kain, J., and Rivkin, S. (2009). New Evidence About Brown v. Board of Education: The Complex Effects of School Racial Composition on Achievement. Journal of Labor Economics, 27: 349–375.
Hanushek, E.A., and Rivkin, S.G. (2006). School Quality and the Black–White Achievement Gap (NBER Working Paper 12651). Cambridge, MA: National Bureau of Economic Research. Retrieved April 3, 2014, from http://www.nber.org/papers/w12651.pdf.
Jencks, C., and Mayer, S.E. (1990). The Social Consequences of Growing Up in a Poor Neighborhood. In L.E. Lynn, Jr., and M.G.H. McGeary (Eds.), Inner City Poverty in the United States (pp. 111–186). Washington, DC: National Academies Press.
Kelly, S. (2009). The Black–White Gap in Mathematics Course Taking. Sociology of Education, 82: 47–69.
Konstantopoulos, S., and Hedges, L. (2008). How Large an Effect Can We Expect from School Reforms? Teachers College Record, 110(8): 1611–1638.
Lewis, S., Simon, C., Uzzell, R., Horwitz, A., and Casserly, M. (2010). A Call for Change: The Social and Educational Factors Contributing to the Outcomes of Black Males in Urban Schools. Washington, DC: Council of the Great City Schools.
Lucas, S.R., and Berends, M. (2002). Sociodemographic Diversity, Correlated Achievement, and De Facto Tracking. Sociology of Education, 75: 328–348.
Mickelson, R.A. (2001). Subverting Swann: First- and Second-Generation Segregation in the Charlotte-Mecklenburg Schools. American Educational Research Journal, 38: 215–252.
National Center for Education Statistics. (2011). The Nation’s Report Card: Mathematics 2011 (NCES 2012458). Washington, DC: Institute of Education Sciences, U.S. Department of Education.
Ogbu, J.U. (2004). Collective Identity and the Burden of “Acting White” in Black History, Community, and Education. The Urban Review, 36 (1): 1–35.
Orfield, G., Kuscera, J., and Siegel-Hawley, G. (2012). E Pluribus . . . Separation: Deepening Double Segregation for More Students. Cambridge, MA: The Civil Rights Project Harvard University. Retrieved April 3, 2014, from http://civilrightsproject.ucla.edu/research/k-12-education/ integration-and-diversity/mlk-national/e-pluribus... separation-deepening-double-segregation-for-more-students/ orfield_epluribus_revised_omplete_2012.pdf.
Rausch, M.K., and Skiba, R. (2004). Disproportionality in School Discipline Among Minority Students in Indiana: Description and Analysis. Children Left Behind Policy Briefs. Supplementary Analysis 2-A. Bloomington, IN: Center for Evaluation and Education Policy. (ERIC ED488897)
Reardon, S.F. (2008). Thirteen Ways of Looking at the Black–White Test Score Gap (Working Paper 2008-08). Palo Alto, CA: Stanford University. Retrieved April 3, 2014, from http://www.ccpr.ucla.edu/events/ccprseminars-previous-years/Reardon_13%20ways.pdf.
Rocque, M., and Paternoster, R. (2011). Understanding the Antecedents of the School-to-Jail-Link: The Relationship Between Race and School Discipline. Journal of Criminal Law and Criminology, 101(2): 633–666.
Rosenthal, R., and Jacobson, L. (1992). Pygmalion in the Classroom (expanded ed.). New York: Irvington.
Rumberger, R.W., and Palardy, G.J. (2005). Does Segregation Still Matter? The Impact of Student Composition on Academic Achievement in High School. Teachers College Record, 107 (9): 1999–2045.
Sewell, W.H. (1940). The Construction and Standardization of a Scale for the Measurement of the Socioeconomic Status of Oklahoma Farm Families. Agricultural Experiment Station Technical Bulletin 9. Stillwater, OK: Agricultural and Mechanical College, pp. 42–54.
Stiefel, L., Schwartz, A.E., and Ellen, I.G. (2007). Disentangling the Racial Test Score Gap: Probing the Evidence in a Large Urban School District. Journal of Policy Analysis and Management, 26 (1): 7–30.

28
United States Department of Agriculture Food and Nutrition Service. (2012). National School Lunch Program (NSLP). Retrieved January 26, 2014, from http://www.fns. usda.gov/nslp/national-school-lunch-program.
U.S. Department of Education. Institute of Education Sciences, National Center for Education Statistics. (2012). Improving the Measurement of Socioeconomic Status for the National Assessment of Educational Progress: A Theoretical Foundation. Retrieved March 20, 2015, from http://nces.ed.gov/nationsreportcard/researchcenter/ socioeconomic_factors.aspx.
Vanneman, A., Hamilton, L., Anderson, J.B., and Rahman, T. (2009). Achievement Gaps: How Black and White Students in Public Schools Perform in Mathematics and Reading on the National Assessment of Educational Progress (NCES 2009-455). U.S. Department of Education, National Center for Education Statistics, Institute of Education Sciences. Washington, DC: U.S. Government Printing Office.
Wagner, C.H. (1982). Simpson’s Paradox in Real Life. The American Statistician, 36 (1): 46–48.

29 School Composition and the Black–White Achievement Gap
Appendix: Technical Notes 1
1 Additional information can be found in the methodology paper (Bohrnstedt et al. 2015).
The technical notes in this appendix provide the sources of data and basic information on the methodology used for analyses in this report. Detailed descriptions of the methodology and supporting analyses are presented in a separate report, School Composition and the Black–White Achievement Gap: Methodology Companion (Bohrnstedt et al. 2015).
Figures 1 and 2 Figures 1 and 2 used the NAEP 2011 Mathematics Grade 8 Assessment combined sample of Black and White students in public schools nationally. Student race, NSLP eligibility, and parent education were obtained from the NAEP student file; percentage of Black students in the school, or Black student density, was obtained from the NAEP school file.
Figures 3, 4, 5, and 6 Figures 3, 4, 5, and 6 used Common Core of Data’s Public Elementary/Secondary School Universe Survey data. Locale classification was determined by Common Core of Data’s urban-centric locale codes. For region classification, the state Federal Information Processing Standards codes provided by the Common Core of Data were used to map each state and school to a Census Bureau region.
Figure 6 provides locale breakdowns by Black student density category for the South region and the combined Midwest and Northeast regions. Breakdowns for each region separately are provided in table A2.
Figures 7, 8, 9, 10, and 11 The data used to generate results for figures 7, 8, 9, 10, and 11 was the 2011 NAEP Mathematics Grade 8 Assessment combined sample of Black and White students in public schools nationally. Observations with missing information were eliminated by using listwise deletion.
NAEP data include information on a variety of student, teacher, and school characteristics. In developing the regression model, a large number of these items were considered; however, rather than include all of them in the models, subsets of them were selected because of the difficulty in obtaining estimates via direct estimation when trying to include all of them, most likely because of high collinearity between some of the independent variables.
To begin, a core group of student characteristics and SES variables at the student and school levels were selected to be included in all the models. These variables included the following:
• student characteristics – whether the student is Black – whether the student has a disability – whether the student is a male
• SES measures at the student level – NSLP eligibility – mother’s and father’s highest level of education
indicators – more than 25 books in the home2
2 Going back as early as the work of Chapin (Chapin 1933) and Sewell (Sewell 1940), sociologists have used household possessions as proxies for SES and these measures are currently still in use (e.g., Konstantopoulos and Hedges 2008). However, because the validity of a given household item as a measure of SES can change over time, NCES has recently removed and added new items to its list. NCES is also studying other ways to improve the measurement of SES in NAEP (U.S. Department of Education 2012).
– an encyclopedia in the home • SES measures at the school level
– percentage of students in the school who are NSLP eligible
– parents’ combined highest level of education – percentage of NAEP Grade 8 sample with more
than 25 books in the home – percentage of NAEP Grade 8 sample with an
encyclopedia in the home

The key variable of interest was Black student density. Density was categorized according to the following ranges:
• 0 percent to 20 percent• 20 percent to 40 percent• 40 percent to 60 percent• 60 percent to 100 percent
Next, a wide range of other covariates that theoretically could impact achievement and/or the achievement gap were considered for inclusion. The variables under consideration were classified into three sets: teacher qualifications (from the teacher questionnaire), teacher instructional strategies (also from the teacher questionnaire), and school factors (from the school questionnaire).
First, the models were developed using NAEP plausible values. These were referred to as “Stage 1 models.” To assess their impact on achievement and gaps, multiple Stage 1 models were estimated by including each set of control variables one at a time. Each of the Stage 1 models also included core student characteristics and SES variables as controls. The variables in the sets were also interacted with “Black” to determine whether they had different patterns
of relationships depending on race (i.e., contributed to or diminished the achievement gap). From these results, indicators that suggested a differential effect on Black versus White students were selected for use in the next stage.
Stage 2 models were the same as the Stage 1 models, with the exception that the variables in each set were limited to those having statistically significant ( p < .05) or nearly statistically significant differential effects for Black versus White students. Results from Stage 2 regressions are presented in the methodology paper (Bohrnstedt et al. 2015).
Stage 3 is the estimation of the final model. This model included the core student characteristics and student and school SES measures, as well as the following control variables derived from the Stage 1 and 2 analyses.
Student level — Mother’s and father’s highest level of education (less than a high school diploma, a high school diploma, a college degree, or more), student NSLP eligibility status, whether the student had an individualized education program, whether the student’s home had more than 25 books, whether the student’s home had an encyclopedia.3
3 These variables were obtained from the NAEP student files.
Table A1. Distribution of schools by Black student density category within region: 2011
Black Student Density Category
0–20 20–40 40–60 60–100 Total
Northeast 72 11 5 11 100
Midwest 80 5 3 12 100
South 62 16 9 14 100
West 95 4 1 1 100
NOTE: Detail may not sum to totals because of rounding. CCD 2010–11 output reflects the number of schools that offer eighth grade and whose Type = Regular school. SOURCE: U.S. Department of Education, National Center for Education Statistics, Common Core of Data, 2010–11.
30

School Composition and the Black–White Achievement Gap
Table A2. Distribution of schools by locale type within Black student density category for each U.S. region: 2011
Black Student Density Category
0–20 20–40 40–60 60–100
Northeast Region
Rural 35 3 1 #
Town 11 2 1 1
Suburb 42 30 32 13
City 12 64 66 86
Total 100 100 100 100
Midwest Region
Rural 56 5 3 1
Town 16 4 1 #
Suburb 17 32 28 17
City 11 59 67 82
Total 100 100 100 100
South Region
Rural 56 37 31 24
Town 13 14 14 12
Suburb 17 26 21 15
City 14 23 34 49
Total 100 100 100 100
West Region
Rural 39 12 4 0
Town 12 # 0 0
Suburb 22 24 20 14
City 27 64 76 86
Total 100 100 100 100
# Rounds to zero. NOTE: The measures displayed in this figure are percentages of schools within each Black student density category. Detail may not sum to totals because of rounding. CCD 2010–11 output reflects the number of schools that offer eighth grade and whose Type = Regular school. SOURCE: U.S. Department of Education, National Center for Education Statistics, Common Core of Data, 2010–11.
31

32
Teacher level
School level
— The following variables were included as main effects and were interacted with a Black student race indicator: whether the teacher had a higher education degree with a minor in mathematics, whether the teacher had a higher education degree with a major in mathematics, whether the teacher had used different methods to teach different students, whether the teacher assigned more than one hour of homework each night.4
4 These variables were obtained from the NAEP teacher files.
— The following variables were included as main effects only: proportion of students in the school who were male, proportion of students in the school who were NSLP eligible, proportion of students in the school who had an individualized education program, proportion of students in the school who had as the highest level of parent education a high school diploma or more, proportion of students in the school who had as the highest level of parent education a bachelor’s degree or more, proportion of students who had more than 25 books in the
home, proportion of students who had an encyclopedia in the home.5
5 These variables were obtained from NAEP student files and aggregated to the school level.
Figures 12 and 13 The results for figures 12 and 13 were generated using the 2011 NAEP Mathematics Grade 8 Assessment. In figure 12, percentages are reported for Black and White students. For figure 13, students from all races and ethnicities were used in the analysis. This analysis used a regression model and formulae, as developed by Reardon (2008). The regression model used NAEP achievement as the dependent variable, and the independent variables were race indicators (Black, Hispanic, Asian, American Indian) and the percentage of students in the school who were Black (i.e., Black student density).
For more information on the methodology and data, see the companion report School Composition and the Black– White Achievement Gap: Methodology Companion (Bohrnstedt et al. 2015).

School Composition and the Black–White Achievement Gap
U.S. Department of Education Arne Duncan Secretary
Institute of Education Sciences Sue Betka Acting Director
National Center for Education Statistics Peggy G. Carr Acting Commissioner
Assessment Division Peggy G. Carr Associate Commissioner
The National Center for Education Statistics (NCES) is the primary federal entity for collecting, analyzing, and reporting data related to education in the United States and other nations. It fulfills a congressional mandate to collect, collate, analyze, and report full and complete statistics on the condition of education in the United States; conduct and publish reports and specialized analyses of the meaning and significance of such statistics; assist state and local education agencies in improving their statistical systems; and review and report on education activities in foreign countries.
NCES activities are designed to address high-priority education data needs; provide consistent, reliable, complete, and accurate indicators of education status and trends; and report timely, useful, and high-quality data to the U.S. Department of Education, the Congress, the states, other education policymakers, practitioners, data users, and the general public. Unless specifically noted, all information contained herein is in the public domain.
We strive to make our products available in a variety of formats and in language that is appropriate to a variety of audiences. You, as our customer, are the best judge of our success in communicating information effectively. If you have any comments or suggestions about this or any other NCES product or report, we would like to hear from you. Please direct your comments to
National Center for Education Statistics Institute of Education Sciences U.S. Department of Education 1990 K Street NW Washington, DC 20006-5651
June 2015
The NCES Home Page address is http://nces.ed.gov. The NCES Publications and Products address is http://nces.ed.gov/pubsearch.
This publication is only available online. To download, view, and print the report as a PDF file, go to the NCES Publications and Products address shown above.
This report was prepared for the National Center for Education Statistics under Contract No. ED-04-CO-00025/0019 with the American Institutes for Research. Mention of trade names, commercial products, or organizations does not imply endorsement by the U.S. government.
Suggested Citation Bohrnstedt, G., Kitmitto, S., Ogut, B., Sherman, D., and Chan, D. (2015). School Composition and the Black–White Achievement Gap (NCES 2015-018). U.S. Department of Education, Washington, DC: National Center for Education Statistics. Retrieved [date] from http://nces.ed.gov/pubsearch.
Content Contact Taslima Rahman (202) 502-7316 [email protected]

www.ed.gov ies.ed.gov
The Department of Education’s mission is to promote student achievement and preparation for global competitiveness by fostering education excellence and ensuring equal access.