foundation funding for hispanics/latinos...foundation funding for hispanics/latinos in the united...
TRANSCRIPT
Foundation Funding for Hispanics/Latinos in the United States and for Latin America
The FoundaTion CenTer in Coll aboraTion wiTh hispaniC s in phil anThropy
ContribUtorS
Marc Almanzor __________ Research Associate
Anjula Carrier ___________ Vice President for Marketing and Communications
Christine Innamorato ______ Production Manager
Steven Lawrence __________ Director of Research
Larry McGill ____________ Vice President for Research
Grace Sato ______________ Research Assistant
Vanessa Schnaidt _________ Director of Communications
AboUt tHe FoUndAtion Center
Established in 1956, the Foundation Center is the leading source of information about philanthropy worldwide. Through data, analysis, and training, it connects people who want to change the world to the resources they need to succeed. The Center maintains the most comprehensive database on U.S. and, increasingly, global grantmakers and their grants — a robust, accessible knowledge bank for the sector. It also operates research, education, and training programs designed to advance knowledge of philanthropy at every level. Thousands of people visit the Center’s web site each day and are served in its five regional library/learning centers and its network of more than 450 funding information centers located in public libraries, community foundations, and educational institutions nationwide and around the world. For more information, please visit foundationcenter.org or call (212) 620-4230.
AboUt HiSpAniCS in pHiLAntHropy
HIP is a transnational network of more than 600 grantmakers committed to strengthening Latino communities across the Americas. The HIP network connects and convenes funders, nonprofits, researchers, and other leaders to identify emerging needs among Latinos as well as best practices for responsive and effective funding of social change. HIP trailblazes new philanthropic models by leading collaborative initiatives and has provided grants and training to help build the capacity of more than 500 organizations and leaders, including afterschool programs, Latino arts centers, immigrant rights advocates, LGBT Latino leaders, housing for Latino older adults, neighborhood health centers, grassroots community organizers, multiservice organizations in rural areas, and economic development in Latin America. For more information, please visit hiponline.org. HIP offices: 55 Second Street, Suite 1500, San Francisco, CA 94105, (415) 837-0427; 55 Exchange Place, Suite 402, New York, NY 10005, (646) 602-2105.
ACknowLedgementS
The authors acknowledge the generous support of the David and Lucile Packard Foundation for funding this research. Special thanks to Diana Campoamor, Ben Francisco Maulbeck, and Elizabeth Hernandez of Hispanics in Philanthropy for providing valuable guidance and feedback in the development of this research.
Download Foundation Funding for Hispanics/Latinos in the United States and for Latin America at foundationcenter.org/gainknowledge/research/pdf/fc_hip2011.pdf or at hiponline.org.
For additional information, please contact Seema Shah at [email protected].
Copyright © 2011 Foundation Center. All rights reserved.
Design by Dianne Rudisill
Printed and bound in the United States of America.
ISBN 978-1-59542-371-9
Seema Shah Director of Research for Special Projects
reina mukai Senior Research Associate
grace mcAllister Research Assistant
Foundation Funding for Hispanics/Latinos in the United States and for Latin America
The FoundaTion CenTer in Coll aboraTion wiTh hispaniC s in phil anThropy
© 2011 The Foundation Center / Foundation Funding for Hispanics/Latinos in the United States and for Latin America ii
An Important Clarification Regarding Foundation Funding for Hispanics/Latinos in the United States and for Latin America
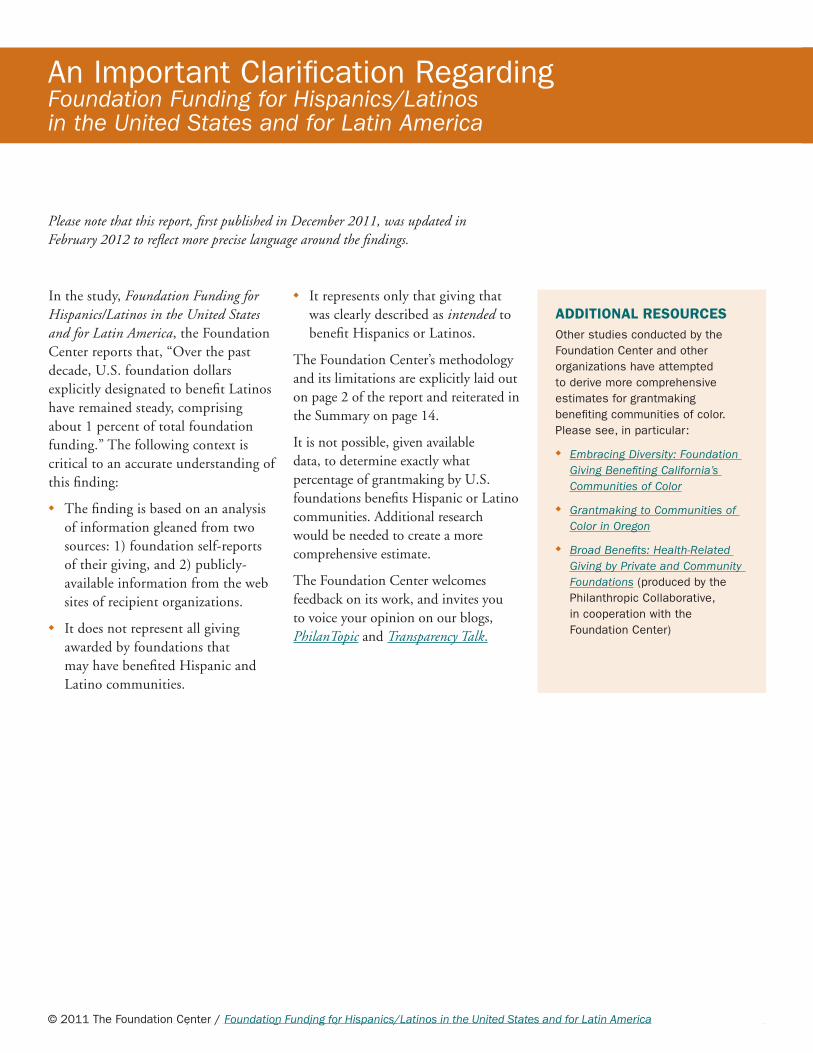
In the study, Foundation Funding for Hispanics/Latinos in the United States and for Latin America, the Foundation Center reports that, “Over the past decade, U.S. foundation dollars explicitly designated to benefit Latinos have remained steady, comprising about 1 percent of total foundation funding.” The following context is critical to an accurate understanding of this finding:
◆ The finding is based on an analysis of information gleaned from two sources: 1) foundation self-reports of their giving, and 2) publicly-available information from the web sites of recipient organizations.
◆ It does not represent all giving awarded by foundations that may have benefited Hispanic and Latino communities.
◆ It represents only that giving that was clearly described as intended to benefit Hispanics or Latinos.
The Foundation Center’s methodology and its limitations are explicitly laid out on page 2 of the report and reiterated in the Summary on page 14.
It is not possible, given available data, to determine exactly what percentage of grantmaking by U.S. foundations benefits Hispanic or Latino communities. Additional research would be needed to create a more comprehensive estimate.
The Foundation Center welcomes feedback on its work, and invites you to voice your opinion on our blogs, PhilanTopic and Transparency Talk.
AdditionAL reSoUrCeSOther studies conducted by the Foundation Center and other organizations have attempted to derive more comprehensive estimates for grantmaking benefiting communities of color. Please see, in particular:
◆ Embracing Diversity: Foundation Giving Benefiting California’s Communities of Color
◆ Grantmaking to Communities of Color in Oregon
◆ Broad Benefits: Health-Related Giving by Private and Community Foundations (produced by the Philanthropic Collaborative, in cooperation with the Foundation Center)
Please note that this report, first published in December 2011, was updated in February 2012 to reflect more precise language around the findings.
© 2011 The Foundation Center / Foundation Funding for Hispanics/Latinos in the United States and for Latin America
© 2011 The Foundation Center / Foundation Funding for Hispanics/Latinos in the United States and for Latin America iii
Contents
Tables and Figures ________________________________________________________________________ iv
Key Findings _____________________________________________________________________________________________ v
1 FOunDATIOn FunDIng FOR HISPAnICS/LATInOS In THe unITeD STATeS ___________________________ 1
Trends in Foundation Funding for Latinos, 1999 to 2009 ______________________________________________________ 1
giving for Hispanics by Funder Type, 2007 to 2009 ___________________________________________________________ 2
Top Funders Awarding grants for Latinos, 2007 to 2009 ______________________________________________________ 3
Funding by Issue Area, 2007 to 2009 ______________________________________________________________________ 3
Funding by Social Justice Issues, 2007 to 2009 _____________________________________________________________ 4
Funding by Recipient Type, 2007 to 2009 ___________________________________________________________________ 5
Funding by Types of Support, 2007 to 2009 _________________________________________________________________ 5
geographic Focus of Funding Intended to Benefit Hispanics ____________________________________________________ 6
Top Metropolitan Areas Receiving Foundation Funding for Latinos _______________________________________________ 8
SPeCIAL SeCTIOn
Foundation giving to Puerto Rico ___________________________________________________________________________ 9
2 FOunDATIOn FunDIng FOR LATIn AMeRICA ______________________________________________ 11
examines patterns of u.S. foundation giving for Latin America. The analysis includes both grants awarded directly to organizations in the region and support for u.S.–based organizations with international programs.
Summary _______________________________________________________________________________________________ 14
© 2011 The Foundation Center / Foundation Funding for Hispanics/Latinos in the United States and for Latin America iv
Tables and Figures
1 FOunDATIOn FunDIng FOR HISPAnICS/LATInOS In THe unITeD STATeS FIguRe 1. Share of Foundation giving explicitly Designated to Benefit Hispanics/Latinos and Population Trends, 1999 to 2009 ____________________________________________________________ 1
FIguRe 2. Foundation giving explicitly Designated to Benefit Latinos, 1999 to 2009 ______________________________ 2
TABLe 1. Foundation giving explicitly Designated to Benefit Latinos by Foundation Type, 2007 to 2009 _____________ 2
TABLe 2. Top 10 Foundations by giving explicitly Designated to Benefit Latinos, 2007 to 2009 ____________________ 3
TABLe 3. Top 10 Foundations by Share of giving explicitly Designated to Benefit Latinos, 2007 to 2009 ____________ 3
FIguRe 3. Foundation giving explicitly Designated to Benefit Latinos by Major Subject, 2007 to 2009 _______________ 3
FIguRe 4. Distribution of Foundation giving explicitly Designated to Benefit Racial and ethnic Minority groups by _____ Subject, 2007 to 2009 _________________________________________________________________________ 4
FIguRe 5. Social Justice giving explicitly Designated to Benefit Latinos versus All Social Justice giving, 2007 to 2009 _________________________________________________________________________________ 5
FIguRe 6. Foundation giving explicitly Designated to Benefit Latinos by Recipient Type, 2007 to 2009 ______________ 5
TABLe 4. Top 10 Recipients of Foundation giving explicitly Designated to Benefit Latinos, 2007 to 2009 ___________ 5
FIguRe 7. Foundation giving explicitly Designated to Benefit Latinos Latinos by Types of Support, 2007 to 2009 _____ 6
TABLe 5. Foundation giving explicitly Designated to Benefit Latinos by Region, 2007 to 2009 _____________________ 7
FIguRe 8. Distribution of Foundation giving explicitly Designated to Benefit Latinos by Region, 2007 to 2009 ________ 8
TABLe 6. Top 10 States by Latino Population growth ________________________________________________________ 9
TABLe 7. Top Metropolitan Areas by Foundation Funding explicitly Designated to Benefit Latinos, 2007 to 2009 _____ 9
FIguRe A-1. Foundation giving to Puerto Rico by Major Subject, 2007 to 2009 __________________________________ 10
TABLe A-1. Top 10 Foundations by giving to Puerto Rico, 2007 to 2009 ________________________________________ 10
TABLe A-2. Selected Puerto Rico Foundations by Total giving, 2007 to 2009 ____________________________________ 10
2 FOunDATIOn FunDIng FOR LATIn AMeRICA TABLe 8. Top 10 Foundations by giving for Latin America, 2007 to 2009 ______________________________________ 11
TABLe 9. Top 10 Foundations by Share of giving for Latin America, 2007 to 2009 ______________________________ 12
TABLe 10. Top 10 Recipients of Foundation giving for Latin America, 2007 to 2009 _____________________________ 12
FIguRe 9. Foundation giving for Latin America by Major Subject, 2007 to 2009 _________________________________ 12
TABLe 11. Foundation giving to Latin American Recipients by Country (Cross-Border), 2007 to 2009 _______________ 13
TABLe 12. Foundation giving to u.S.–based Recipients by Latin American Country, 2007 to 2009 _________________ 13
© 2011 The Foundation Center / Foundation Funding for Hispanics/Latinos in the United States and for Latin America v
In the past decade, the Hispanic1 population in the United States has grown dramatically. The most recent census figures indicate that Latinos have become the most populous minority group in the country, representing 16 percent of the U.S. population. At the same time, myriad economic and social indicators show that Hispanics are living in difficult and challenging circumstances.
Against this demographic landscape, Hispanics in Philanthropy commissioned the Foundation Center to take a deeper look at U.S. foundations’ giving to Hispanics in the United States, as well as giving to Latin America.
This study, the first of its kind, examines foundation giving in the United States by funder type, issue area, geographic area, and type of support. International giving to Latin America is also broken down by issue area. Both sets of analyses include lists of top funders and top recipients.
As with any research effort, there are limitations to the analyses. Yet these data remain the best available information on foundation giving for Latinos in the United States and for Latin America. We hope that this report sparks dialogue within philanthropy about the current state of funding and ways to leverage future investments.
The analyses presented in this report explore patterns of giving by larger U.S. foundations over the last decade, with a particular focus on giving from 2007 to 2009.
giving for Hispanics in the United States
◆ Over the past decade, U.S. foundation dollars explicitly designated to benefit Latinos2 have remained steady, comprising about 1 percent of total foundation funding, even as the Latino population in the U.S. has grown significantly over the same period. From 2007 to 2009, an average of $206 million in grants per year was directed to Latinos by large U.S. foundations.
◆ Among the major areas of activity, human services and health captured the largest shares of grant dollars intended to benefit Latinos, receiving 27 percent and 26 percent, respectively.
◆ Nearly two-thirds of the 2007 to 2009 grant dollars targeting Latinos provided program support. General support for recipient organizations accounted for 28 percent of giving.
◆ Recipient organizations in the Western region of the United States received the largest share (42 percent) of foundation dollars intended to benefit Hispanics. The vast majority of this funding went to organizations in California.
◆ Among U.S. metropolitan areas, the greater Los Angeles metropolitan area received the largest share of grant dollars (17 percent) and number of grants (13 percent). Over the three-year period, this metropolitan area received more than 1,000 grants from sampled foundations totaling $107.3 million.
international giving for Latin America
◆ Between 2007 and 2009, more than $1 billion was directed toward Latin American countries. On average, large U.S. foundations gave $350 million per year for Latin America. Just under half of these funds went to organizations based in Latin American countries, while just over half went to U.S–based international programs.
◆ Of the funding targeting Latin America between 2007 and 2009, environmental giving captured the largest share of grant dollars (33 percent), followed by international affairs (20 percent) and health (14 percent).
◆ Mexico and Brazil each received about one-quarter of all grant dollars directed toward Latin American countries.
endnoteS1 The terms “Hispanic” and “Latino” are used
interchangeably in this report.2 A grant is coded as “explicitly designated to benefit
Latinos” if the foundation awarding the grant has provided a grant description or related information that explicitly specifies this population group as a beneficiary of the grant, or if the organization receiving the grant includes an explicit focus on Latinos within its stated mission. For more information, see “About the Foundation Center grants Sample” on page 2.
Key Findings
© 2011 The Foundation Center / Foundation Funding for Hispanics/Latinos in the United States and for Latin America 1
trends in Foundation Funding for Latinos, 1999 to 2009
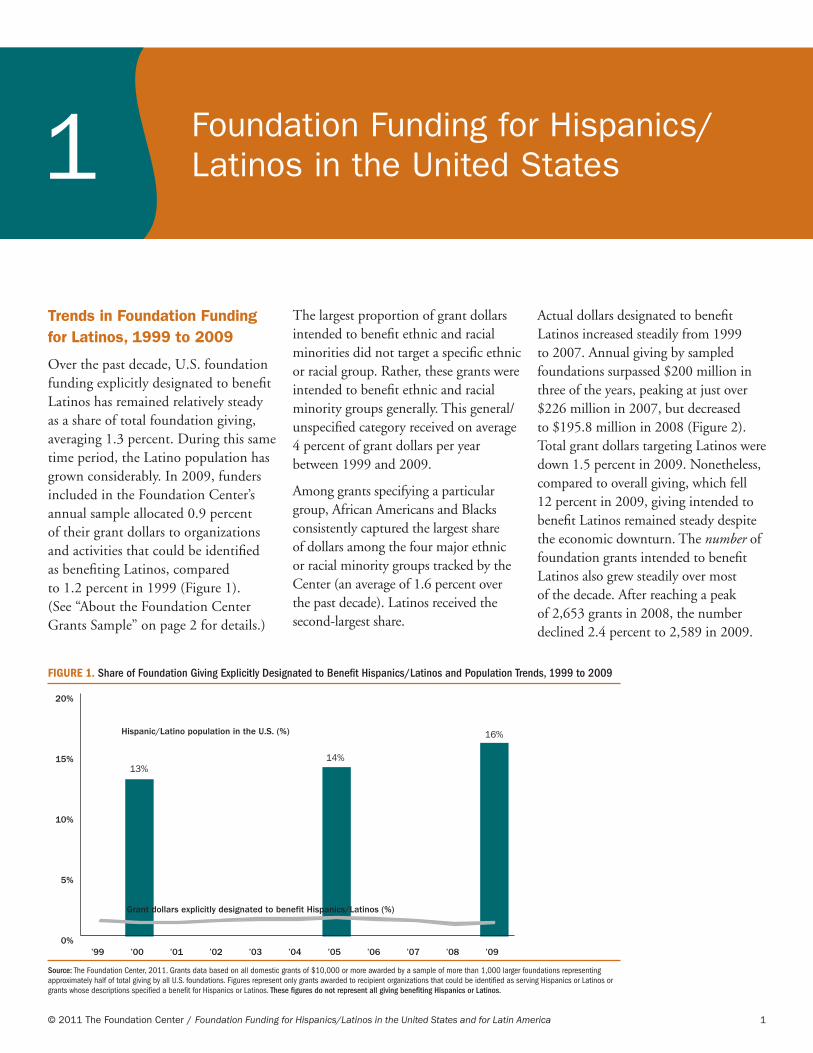
Over the past decade, U.S. foundation funding explicitly designated to benefit Latinos has remained relatively steady as a share of total foundation giving, averaging 1.3 percent. During this same time period, the Latino population has grown considerably. In 2009, funders included in the Foundation Center’s annual sample allocated 0.9 percent of their grant dollars to organizations and activities that could be identified as benefiting Latinos, compared to 1.2 percent in 1999 (Figure 1). (See “About the Foundation Center Grants Sample” on page 2 for details.)
The largest proportion of grant dollars intended to benefit ethnic and racial minorities did not target a specific ethnic or racial group. Rather, these grants were intended to benefit ethnic and racial minority groups generally. This general/unspecified category received on average 4 percent of grant dollars per year between 1999 and 2009.
Among grants specifying a particular group, African Americans and Blacks consistently captured the largest share of dollars among the four major ethnic or racial minority groups tracked by the Center (an average of 1.6 percent over the past decade). Latinos received the second-largest share.
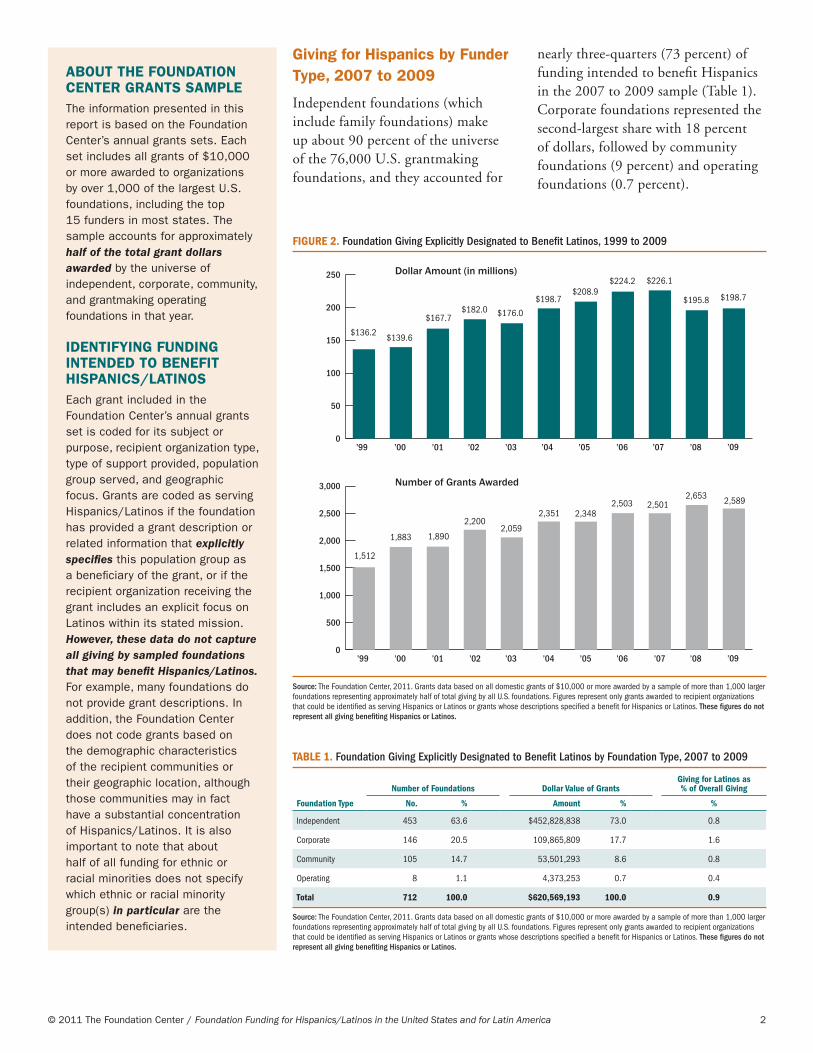
Actual dollars designated to benefit Latinos increased steadily from 1999 to 2007. Annual giving by sampled foundations surpassed $200 million in three of the years, peaking at just over $226 million in 2007, but decreased to $195.8 million in 2008 (Figure 2). Total grant dollars targeting Latinos were down 1.5 percent in 2009. Nonetheless, compared to overall giving, which fell 12 percent in 2009, giving intended to benefit Latinos remained steady despite the economic downturn. The number of foundation grants intended to benefit Latinos also grew steadily over most of the decade. After reaching a peak of 2,653 grants in 2008, the number declined 2.4 percent to 2,589 in 2009.
Foundation Funding for Hispanics/ Latinos in the united States1
Source: The Foundation Center, 2011. Grants data based on all domestic grants of $10,000 or more awarded by a sample of more than 1,000 larger foundations representing approximately half of total giving by all U.S. foundations. Figures represent only grants awarded to recipient organizations that could be identified as serving Hispanics or Latinos or grants whose descriptions specified a benefit for Hispanics or Latinos. These figures do not represent all giving benefiting Hispanics or Latinos.
FIGURE 1. Share of Foundation Giving Explicitly Designated to Benefit Hispanics/Latinos and Population Trends, 1999 to 2009
0.00
0.05
0.10
0.15
0.20
Hispanic/Latino population in the U.S. (%)
’09’08’07’06’05’04’03’02’01’00’990%
5%
10%
15%
20%
Grant dollars benefiting Hispanics/Latinos (%)
’09’08’07’06’05’04’03’02’01’00’99
Grant dollars explicitly designated to benefit Hispanics/Latinos (%)
13%14%
16%
© 2011 The Foundation Center / Foundation Funding for Hispanics/Latinos in the United States and for Latin America 2
FIGURE 2. Foundation Giving Explicitly Designated to Benefit Latinos, 1999 to 2009
giving for Hispanics by Funder type, 2007 to 2009
Independent foundations (which include family foundations) make up about 90 percent of the universe of the 76,000 U.S. grantmaking foundations, and they accounted for
nearly three-quarters (73 percent) of funding intended to benefit Hispanics in the 2007 to 2009 sample (Table 1). Corporate foundations represented the second-largest share with 18 percent of dollars, followed by community foundations (9 percent) and operating foundations (0.7 percent).
Source: The Foundation Center, 2011. Grants data based on all domestic grants of $10,000 or more awarded by a sample of more than 1,000 larger foundations representing approximately half of total giving by all U.S. foundations. Figures represent only grants awarded to recipient organizations that could be identified as serving Hispanics or Latinos or grants whose descriptions specified a benefit for Hispanics or Latinos. These figures do not represent all giving benefiting Hispanics or Latinos.
$136.2
’00’99 ’01 ’02 ’03 ’04 ’05 ’06 ’07 ’080
50
100
150
200
250 Dollar Amount (in millions)
’09
$139.6
$167.7$182.0 $176.0
$198.7$208.9
$224.2 $226.1
$198.7$195.8
0
500
1,000
1,500
2,000
2,500
3,000
1,512
’00’99 ’01 ’02 ’03 ’04 ’05 ’06 ’07 ’08
Number of Grants Awarded
’09
1,883 1,890
2,2002,059
2,351 2,3482,503 2,501
2,653 2,589
TABLE 1. Foundation Giving Explicitly Designated to Benefit Latinos by Foundation Type, 2007 to 2009
AboUt tHe FoUndAtion Center grAntS SAmpLeThe information presented in this report is based on the Foundation Center’s annual grants sets. each set includes all grants of $10,000 or more awarded to organizations by over 1,000 of the largest u.S. foundations, including the top 15 funders in most states. The sample accounts for approximately half of the total grant dollars awarded by the universe of independent, corporate, community, and grantmaking operating foundations in that year.
identiFying FUnding intended to beneFit HiSpAniCS/LAtinoSeach grant included in the Foundation Center’s annual grants set is coded for its subject or purpose, recipient organization type, type of support provided, population group served, and geographic focus. grants are coded as serving Hispanics/Latinos if the foundation has provided a grant description or related information that explicitly specifies this population group as a beneficiary of the grant, or if the recipient organization receiving the grant includes an explicit focus on Latinos within its stated mission. However, these data do not capture all giving by sampled foundations that may benefit Hispanics/Latinos. For example, many foundations do not provide grant descriptions. In addition, the Foundation Center does not code grants based on the demographic characteristics of the recipient communities or their geographic location, although those communities may in fact have a substantial concentration of Hispanics/Latinos. It is also important to note that about half of all funding for ethnic or racial minorities does not specify which ethnic or racial minority group(s) in particular are the intended beneficiaries.
Number of Foundations Dollar Value of GrantsGiving for Latinos as % of Overall Giving
Foundation Type No. % Amount % %
Independent 453 63.6 $452,828,838 73.0 0.8
Corporate 146 20.5 109,865,809 17.7 1.6
Community 105 14.7 53,501,293 8.6 0.8
Operating 8 1.1 4,373,253 0.7 0.4
Total 712 100.0 $620,569,193 100.0 0.9
Source: The Foundation Center, 2011. Grants data based on all domestic grants of $10,000 or more awarded by a sample of more than 1,000 larger foundations representing approximately half of total giving by all U.S. foundations. Figures represent only grants awarded to recipient organizations that could be identified as serving Hispanics or Latinos or grants whose descriptions specified a benefit for Hispanics or Latinos. These figures do not represent all giving benefiting Hispanics or Latinos.
© 2011 The Foundation Center / Foundation Funding for Hispanics/Latinos in the United States and for Latin America 3
top Funders Awarding grants for Latinos, 2007 to 2009
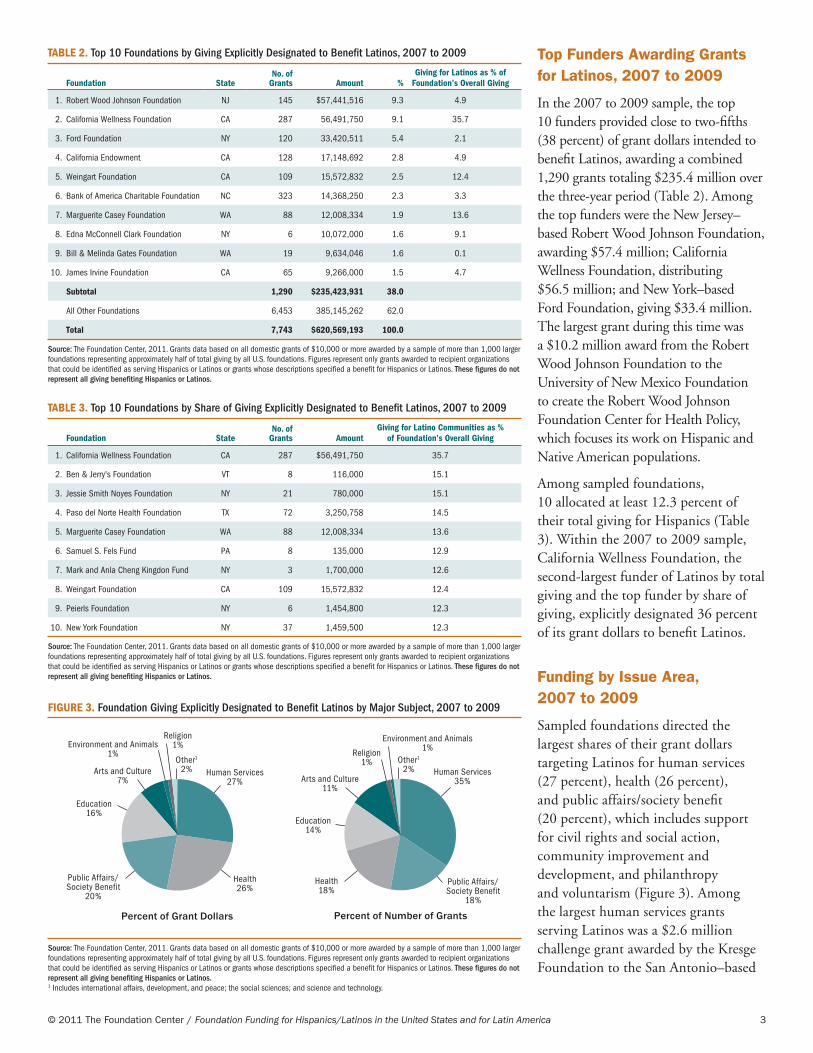
In the 2007 to 2009 sample, the top 10 funders provided close to two-fifths (38 percent) of grant dollars intended to benefit Latinos, awarding a combined 1,290 grants totaling $235.4 million over the three-year period (Table 2). Among the top funders were the New Jersey–based Robert Wood Johnson Foundation, awarding $57.4 million; California Wellness Foundation, distributing $56.5 million; and New York–based Ford Foundation, giving $33.4 million. The largest grant during this time was a $10.2 million award from the Robert Wood Johnson Foundation to the University of New Mexico Foundation to create the Robert Wood Johnson Foundation Center for Health Policy, which focuses its work on Hispanic and Native American populations.
Among sampled foundations, 10 allocated at least 12.3 percent of their total giving for Hispanics (Table 3). Within the 2007 to 2009 sample, California Wellness Foundation, the second-largest funder of Latinos by total giving and the top funder by share of giving, explicitly designated 36 percent of its grant dollars to benefit Latinos.
Funding by issue Area, 2007 to 2009
Sampled foundations directed the largest shares of their grant dollars targeting Latinos for human services (27 percent), health (26 percent), and public affairs/society benefit (20 percent), which includes support for civil rights and social action, community improvement and development, and philanthropy and voluntarism (Figure 3). Among the largest human services grants serving Latinos was a $2.6 million challenge grant awarded by the Kresge Foundation to the San Antonio–based
TABLE 2. Top 10 Foundations by Giving Explicitly Designated to Benefit Latinos, 2007 to 2009
Foundation StateNo. of
Grants Amount %Giving for Latinos as % of
Foundation’s Overall Giving
1. Robert Wood Johnson Foundation NJ 145 $57,441,516 9.3 4.9
2. California Wellness Foundation CA 287 56,491,750 9.1 35.7
3. Ford Foundation NY 120 33,420,511 5.4 2.1
4. California Endowment CA 128 17,148,692 2.8 4.9
5. Weingart Foundation CA 109 15,572,832 2.5 12.4
6. Bank of America Charitable Foundation NC 323 14,368,250 2.3 3.3
7. Marguerite Casey Foundation WA 88 12,008,334 1.9 13.6
8. Edna McConnell Clark Foundation NY 6 10,072,000 1.6 9.1
9. Bill & Melinda Gates Foundation WA 19 9,634,046 1.6 0.1
10. James Irvine Foundation CA 65 9,266,000 1.5 4.7
Subtotal 1,290 $235,423,931 38.0
All Other Foundations 6,453 385,145,262 62.0
Total 7,743 $620,569,193 100.0
Source: The Foundation Center, 2011. Grants data based on all domestic grants of $10,000 or more awarded by a sample of more than 1,000 larger foundations representing approximately half of total giving by all U.S. foundations. Figures represent only grants awarded to recipient organizations that could be identified as serving Hispanics or Latinos or grants whose descriptions specified a benefit for Hispanics or Latinos. These figures do not represent all giving benefiting Hispanics or Latinos.
TABLE 3. Top 10 Foundations by Share of Giving Explicitly Designated to Benefit Latinos, 2007 to 2009
Foundation StateNo. of
Grants AmountGiving for Latino Communities as %
of Foundation’s Overall Giving
1. California Wellness Foundation CA 287 $56,491,750 35.7
2. Ben & Jerry's Foundation VT 8 116,000 15.1
3. Jessie Smith Noyes Foundation NY 21 780,000 15.1
4. Paso del Norte Health Foundation TX 72 3,250,758 14.5
5. Marguerite Casey Foundation WA 88 12,008,334 13.6
6. Samuel S. Fels Fund PA 8 135,000 12.9
7. Mark and Anla Cheng Kingdon Fund NY 3 1,700,000 12.6
8. Weingart Foundation CA 109 15,572,832 12.4
9. Peierls Foundation NY 6 1,454,800 12.3
10. New York Foundation NY 37 1,459,500 12.3
Source: The Foundation Center, 2011. Grants data based on all domestic grants of $10,000 or more awarded by a sample of more than 1,000 larger foundations representing approximately half of total giving by all U.S. foundations. Figures represent only grants awarded to recipient organizations that could be identified as serving Hispanics or Latinos or grants whose descriptions specified a benefit for Hispanics or Latinos. These figures do not represent all giving benefiting Hispanics or Latinos.
Source: The Foundation Center, 2011. Grants data based on all domestic grants of $10,000 or more awarded by a sample of more than 1,000 larger foundations representing approximately half of total giving by all U.S. foundations. Figures represent only grants awarded to recipient organizations that could be identified as serving Hispanics or Latinos or grants whose descriptions specified a benefit for Hispanics or Latinos. These figures do not represent all giving benefiting Hispanics or Latinos. 1 Includes international affairs, development, and peace; the social sciences; and science and technology.
FIGURE 3. Foundation Giving Explicitly Designated to Benefit Latinos by Major Subject, 2007 to 2009
Percent of Grant Dollars
Human Services27%
Health26%
Public Affairs/Society Benefit
20%
Education16%
Arts and Culture7%
Religion1%Environment and Animals
1%Other1
2%
Religion1%
Environment and Animals1%
Other12%
Percent of Number of Grants
Education14%
Arts and Culture11%
Public Affairs/Society Benefit
18%
Human Services35%
Health18%
© 2011 The Foundation Center / Foundation Funding for Hispanics/Latinos in the United States and for Latin America 4
Source: The Foundation Center, 2011. Grants data based on all domestic grants of $10,000 or more awarded by a sample of more than 1,000 larger foundations representing approximately half of total giving by all U.S. foundations. Figures represent only grants awarded to recipient organizations that could be identified as serving Hispanics or Latinos or grants whose descriptions specified a benefit for Hispanics or Latinos. These figures do not represent all giving benefiting Hispanics or Latinos.
FIGURE 4. Distribution of Foundation Giving Explicitly Designated to Benefit Racial and Ethnic Minority Groups by Subject, 2007 to 2009
0%
10%
20%
30%
40%
50%
60%
70%
80%
90%
100%
Percent of Grant Dollars
Latinos/Hispanics African Americans & Blacks Asians & Pacific Islanders Native Americans
Arts and Culture
Education
Environment and Animals
Health
Human Services
International Affairs, Development, Peace, and Human Rights
Public Affairs/Society Benefit
Religion
Science and Technology
Social Sciences
7%
17% 16%
2%
2%
2%
20%
25%
20%
7%
17%
16%
1%
27%
20%
26%
1%
1% 1%
26%
1%
1%
1%
21%
16%
2%
13%
6%
25%
16%
16%
9%
13%
2%2%
Avance Family Support and Education Program for expansion into New Mexico and California.
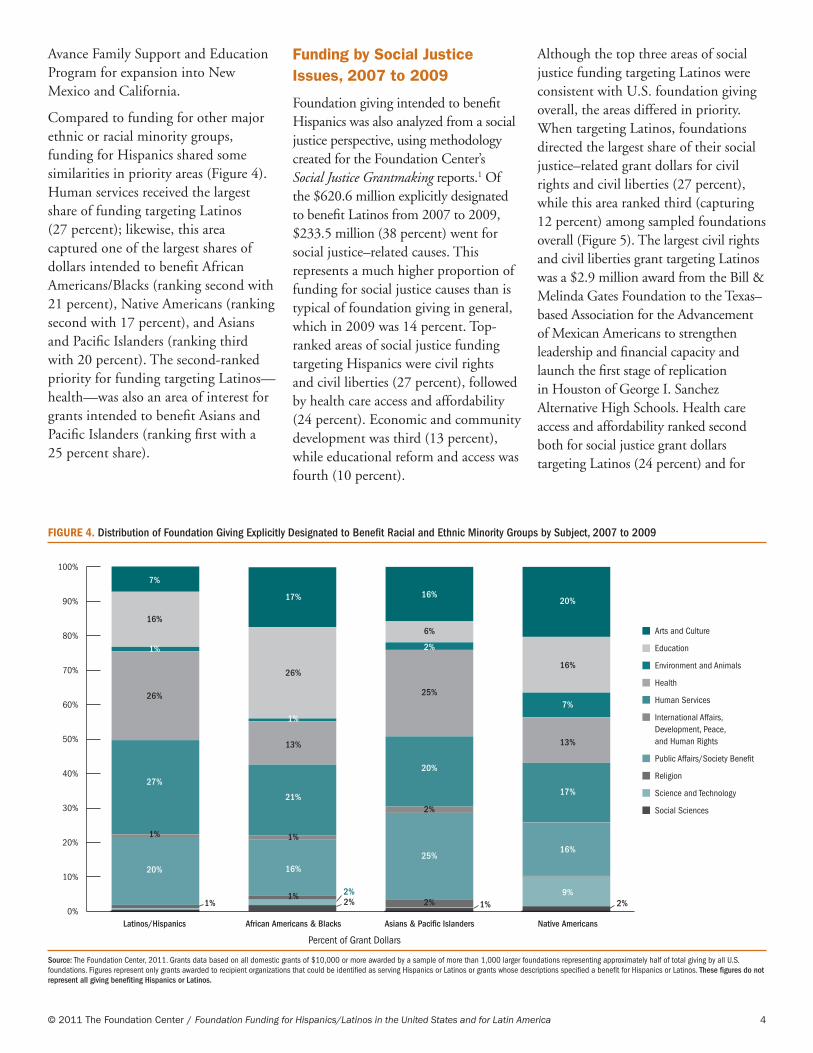
Compared to funding for other major ethnic or racial minority groups, funding for Hispanics shared some similarities in priority areas (Figure 4). Human services received the largest share of funding targeting Latinos (27 percent); likewise, this area captured one of the largest shares of dollars intended to benefit African Americans/Blacks (ranking second with 21 percent), Native Americans (ranking second with 17 percent), and Asians and Pacific Islanders (ranking third with 20 percent). The second-ranked priority for funding targeting Latinos—health—was also an area of interest for grants intended to benefit Asians and Pacific Islanders (ranking first with a 25 percent share).
Funding by Social Justice issues, 2007 to 2009
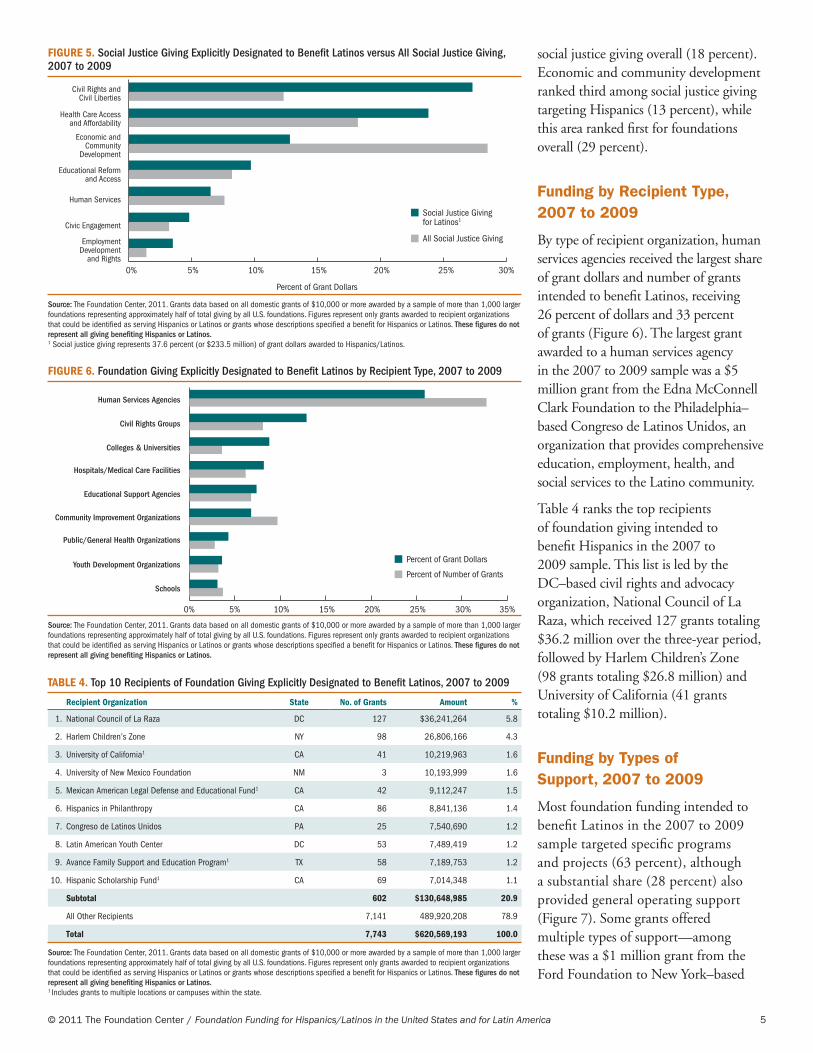
Foundation giving intended to benefit Hispanics was also analyzed from a social justice perspective, using methodology created for the Foundation Center’s Social Justice Grantmaking reports.1 Of the $620.6 million explicitly designated to benefit Latinos from 2007 to 2009, $233.5 million (38 percent) went for social justice–related causes. This represents a much higher proportion of funding for social justice causes than is typical of foundation giving in general, which in 2009 was 14 percent. Top-ranked areas of social justice funding targeting Hispanics were civil rights and civil liberties (27 percent), followed by health care access and affordability (24 percent). Economic and community development was third (13 percent), while educational reform and access was fourth (10 percent).
Although the top three areas of social justice funding targeting Latinos were consistent with U.S. foundation giving overall, the areas differed in priority. When targeting Latinos, foundations directed the largest share of their social justice–related grant dollars for civil rights and civil liberties (27 percent), while this area ranked third (capturing 12 percent) among sampled foundations overall (Figure 5). The largest civil rights and civil liberties grant targeting Latinos was a $2.9 million award from the Bill & Melinda Gates Foundation to the Texas–based Association for the Advancement of Mexican Americans to strengthen leadership and financial capacity and launch the first stage of replication in Houston of George I. Sanchez Alternative High Schools. Health care access and affordability ranked second both for social justice grant dollars targeting Latinos (24 percent) and for
© 2011 The Foundation Center / Foundation Funding for Hispanics/Latinos in the United States and for Latin America 5
social justice giving overall (18 percent). Economic and community development ranked third among social justice giving targeting Hispanics (13 percent), while this area ranked first for foundations overall (29 percent).
Funding by recipient type, 2007 to 2009
By type of recipient organization, human services agencies received the largest share of grant dollars and number of grants intended to benefit Latinos, receiving 26 percent of dollars and 33 percent of grants (Figure 6). The largest grant awarded to a human services agency in the 2007 to 2009 sample was a $5 million grant from the Edna McConnell Clark Foundation to the Philadelphia–based Congreso de Latinos Unidos, an organization that provides comprehensive education, employment, health, and social services to the Latino community.
Table 4 ranks the top recipients of foundation giving intended to benefit Hispanics in the 2007 to 2009 sample. This list is led by the DC–based civil rights and advocacy organization, National Council of La Raza, which received 127 grants totaling $36.2 million over the three-year period, followed by Harlem Children’s Zone (98 grants totaling $26.8 million) and University of California (41 grants totaling $10.2 million).
Funding by types of Support, 2007 to 2009
Most foundation funding intended to benefit Latinos in the 2007 to 2009 sample targeted specific programs and projects (63 percent), although a substantial share (28 percent) also provided general operating support (Figure 7). Some grants offered multiple types of support—among these was a $1 million grant from the Ford Foundation to New York–based
TABLE 4. Top 10 Recipients of Foundation Giving Explicitly Designated to Benefit Latinos, 2007 to 2009
Recipient Organization State No. of Grants Amount %
1. National Council of La Raza DC 127 $36,241,264 5.8
2. Harlem Children’s Zone NY 98 26,806,166 4.3
3. University of California1 CA 41 10,219,963 1.6
4. University of New Mexico Foundation NM 3 10,193,999 1.6
5. Mexican American Legal Defense and Educational Fund1 CA 42 9,112,247 1.5
6. Hispanics in Philanthropy CA 86 8,841,136 1.4
7. Congreso de Latinos Unidos PA 25 7,540,690 1.2
8. Latin American Youth Center DC 53 7,489,419 1.2
9. Avance Family Support and Education Program1 TX 58 7,189,753 1.2
10. Hispanic Scholarship Fund1 CA 69 7,014,348 1.1
Subtotal 602 $130,648,985 20.9
All Other Recipients 7,141 489,920,208 78.9
Total 7,743 $620,569,193 100.0
Source: The Foundation Center, 2011. Grants data based on all domestic grants of $10,000 or more awarded by a sample of more than 1,000 larger foundations representing approximately half of total giving by all U.S. foundations. Figures represent only grants awarded to recipient organizations that could be identified as serving Hispanics or Latinos or grants whose descriptions specified a benefit for Hispanics or Latinos. These figures do not represent all giving benefiting Hispanics or Latinos.1 Includes grants to multiple locations or campuses within the state.
Source: The Foundation Center, 2011. Grants data based on all domestic grants of $10,000 or more awarded by a sample of more than 1,000 larger foundations representing approximately half of total giving by all U.S. foundations. Figures represent only grants awarded to recipient organizations that could be identified as serving Hispanics or Latinos or grants whose descriptions specified a benefit for Hispanics or Latinos. These figures do not represent all giving benefiting Hispanics or Latinos.
FIGURE 6. Foundation Giving Explicitly Designated to Benefit Latinos by Recipient Type, 2007 to 2009
Human Services Agencies
Civil Rights Groups
Colleges & Universities
Hospitals/Medical Care Facilities
Educational Support Agencies
Community Improvement Organizations
Public/General Health Organizations
Youth Development Organizations
Schools
Percent of Grant Dollars
Percent of Number of Grants
0% 5% 10% 15% 20% 25% 30% 35%
Source: The Foundation Center, 2011. Grants data based on all domestic grants of $10,000 or more awarded by a sample of more than 1,000 larger foundations representing approximately half of total giving by all U.S. foundations. Figures represent only grants awarded to recipient organizations that could be identified as serving Hispanics or Latinos or grants whose descriptions specified a benefit for Hispanics or Latinos. These figures do not represent all giving benefiting Hispanics or Latinos. 1 Social justice giving represents 37.6 percent (or $233.5 million) of grant dollars awarded to Hispanics/Latinos.
FIGURE 5. Social Justice Giving Explicitly Designated to Benefit Latinos versus All Social Justice Giving, 2007 to 2009
Civil Rights andCivil Liberties
Health Care Accessand Affordability
Economic andCommunity
Development
Educational Reformand Access
Human Services
Civic Engagement
EmploymentDevelopment
and Rights
Percent of Grant Dollars
Social Justice Giving for Latinos1
All Social Justice Giving
0% 5% 10% 15% 20% 25% 30%

© 2011 The Foundation Center / Foundation Funding for Hispanics/Latinos in the United States and for Latin America 6
El Museo del Barrio to increase staffing in preparation for both the relaunching of the museum following comprehensive renovation of facilities and the implementation of a strategic plan.
Grant dollars targeting Latinos were more likely than overall giving in the 2007 to 2009 sample to provide program support (63 percent versus 51 percent) and general operating support (28 percent versus 20 percent). They were less likely to provide capital support (7 percent versus 15 percent) and fund research (7 percent versus 13 percent). One of the largest program support grants intended to benefit Latinos was a $3 million grant from the David and Lucile Packard Foundation to California–based Resources Legacy Fund to advance urban river parkway projects, engage Latino and children’s organizations in river parkway efforts, and leverage additional funding from state bond acts for parkway projects.
geographic Focus of Funding intended to benefit Hispanics
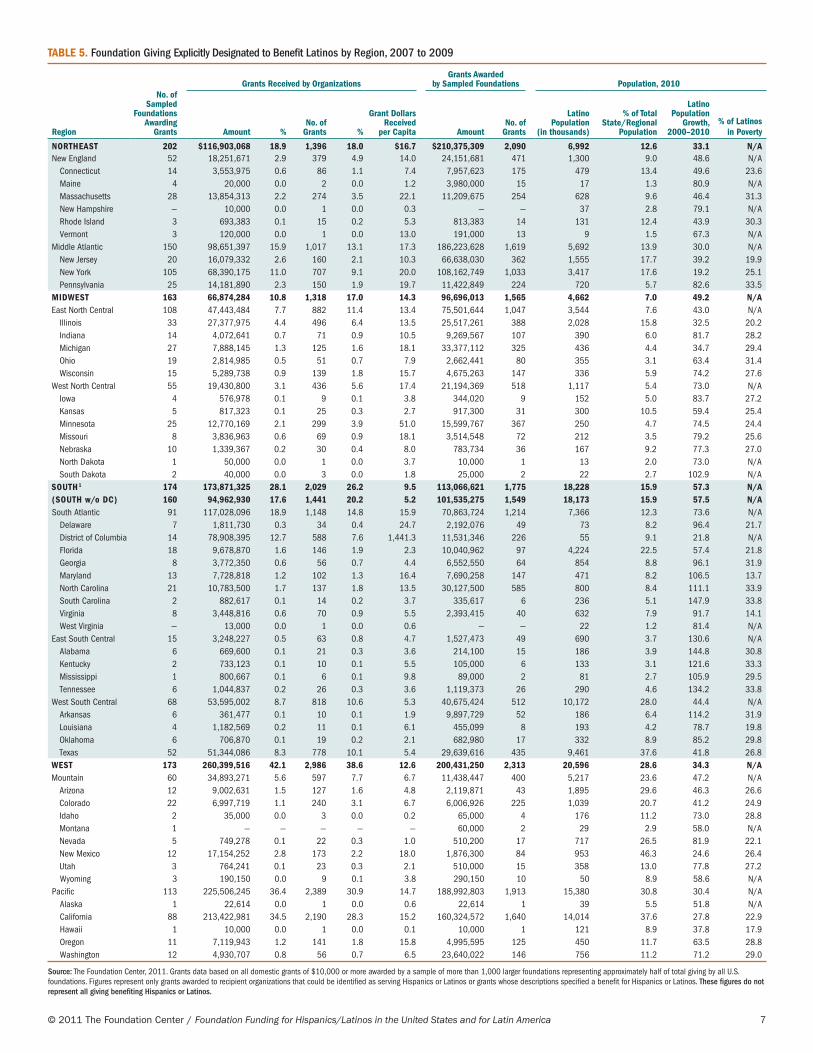
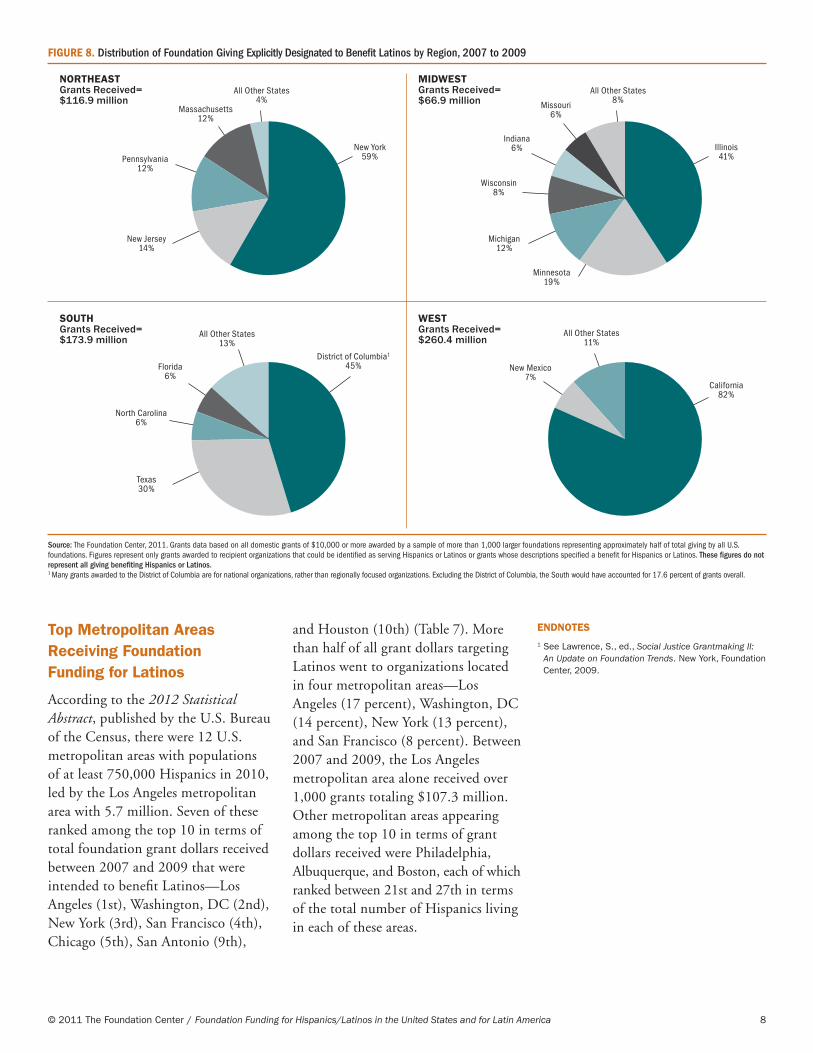
Grant dollars targeting Hispanics in the 2007 to 2009 sample focused predominantly on recipients in the West, which received just over 42 percent of the total (Table 5). The vast majority of this funding went to organizations based in California, which captured roughly four-fifths of Western grant dollars (Figure 8). The South also received a significant portion of funding targeting Latinos, capturing 28 percent of grant dollars. Close to half of grant dollars for this region (45 percent) were awarded to organizations based in DC, many of which are national organizations conducting work outside of the region. Excluding the District of Columbia, the South would have captured a significantly smaller share of funding (18 percent instead of 28 percent). The Northeast captured another 19 percent of grant dollars, followed by the Midwest (11 percent). Among individual states in these latter regions, those receiving the largest shares of grants dollars included New York (11 percent) and Illinois (4 percent).
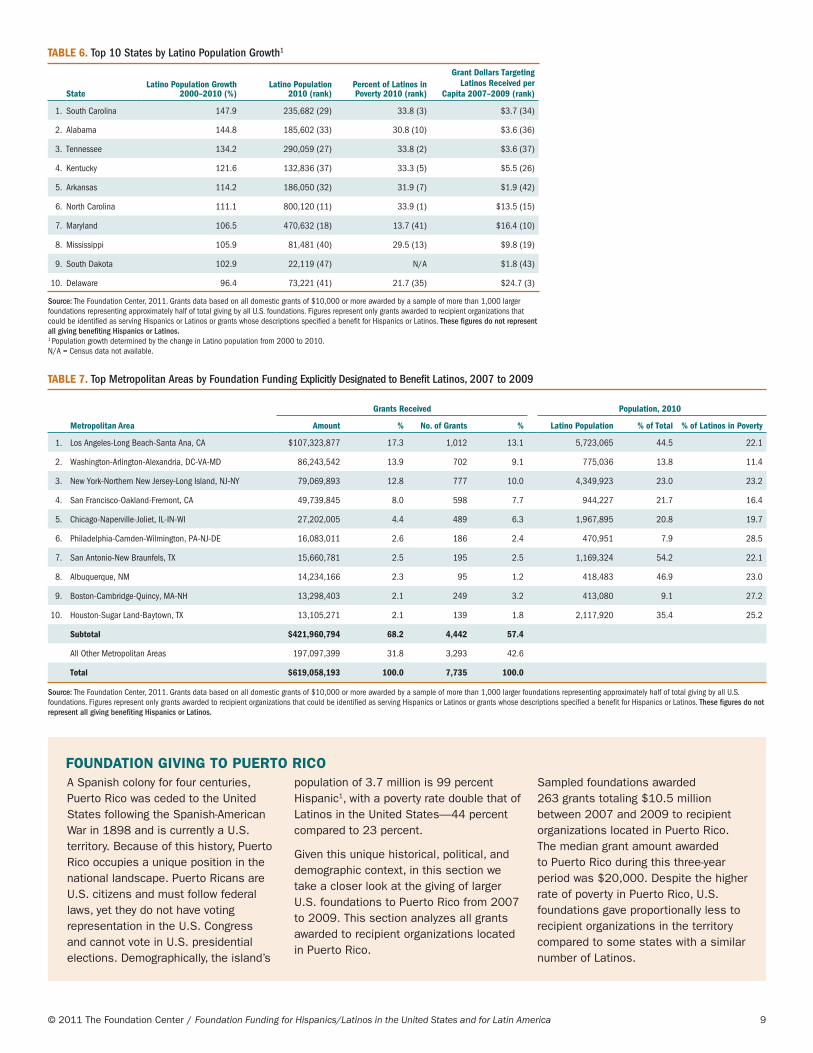
Table 6 shows that the South is experiencing the fastest rate of Hispanic population growth. Over the decade from 2000 to 2010, the eight states with the fastest rates of growth were all located in the South, led by South Carolina and Alabama, each of which saw increases of more than 140 percent in the Hispanic population. In all but two of the top 10 states with the highest rates of Latino population growth, approximately one-third of the Hispanic population lives in poverty. Grant dollars received in these states between 2007 and 2009 appear to be roughly consistent with the total number of Latinos residing in each state. For example, South Carolina ranked 29th in terms of number of Hispanics living in the state and ranked 34th by grant dollars received per capita. Alabama ranked 33rd by number of Latinos in the state and ranked 36th by grant dollars received per capita.
In addition to the location of recipient organizations, regional patterns of giving were also analyzed by the location of foundations. Funders located in the Northeast and West provided the largest shares of grant dollars explicitly designated to benefit Latinos (34 percent and 32 percent, respectively). All but one of the top 10 funders were based either in the Northeast or West. Grantmakers in California alone accounted for over a quarter of funding (26 percent), and New York funders accounted for 17 percent of dollars.
Source: The Foundation Center, 2011. Grants data based on all domestic grants of $10,000 or more awarded by a sample of more than 1,000 larger foundations representing approximately half of total giving by all U.S. foundations. Figures represent only grants awarded to recipient organizations that could be identified as serving Hispanics or Latinos or grants whose descriptions specified a benefit for Hispanics or Latinos. These figures do not represent all giving benefiting Hispanics or Latinos.
FIGURE 7. Foundation Giving Explicitly Designated to Benefit Latinos Latinos by Types of Support, 2007 to 2009
Program
General/Operating
Research
Capital1
Student Aid
Not Specified
Percent of Grant Dollars
Percent of Number of Grants
0% 10% 20% 30% 40% 50% 60% 70% 80%
© 2011 The Foundation Center / Foundation Funding for Hispanics/Latinos in the United States and for Latin America 7
Source: The Foundation Center, 2011. Grants data based on all domestic grants of $10,000 or more awarded by a sample of more than 1,000 larger foundations representing approximately half of total giving by all U.S. foundations. Figures represent only grants awarded to recipient organizations that could be identified as serving Hispanics or Latinos or grants whose descriptions specified a benefit for Hispanics or Latinos. These figures do not represent all giving benefiting Hispanics or Latinos.
TABLE 5. Foundation Giving Explicitly Designated to Benefit Latinos by Region, 2007 to 2009
Grants Received by OrganizationsGrants Awarded
by Sampled Foundations Population, 2010
Region
No. of Sampled
Foundations Awarding
Grants Amount %No. of
Grants %
Grant Dollars Received
per Capita AmountNo. of
Grants
Latino Population
(in thousands)
% of Total State/Regional
Population
Latino Population
Growth, 2000–2010
% of Latinos in Poverty
NORTHEAST 202 $116,903,068 18.9 1,396 18.0 $16.7 $210,375,309 2,090 6,992 12.6 33.1 N/ANew England 52 18,251,671 2.9 379 4.9 14.0 24,151,681 471 1,300 9.0 48.6 N/A
Connecticut 14 3,553,975 0.6 86 1.1 7.4 7,957,623 175 479 13.4 49.6 23.6Maine 4 20,000 0.0 2 0.0 1.2 3,980,000 15 17 1.3 80.9 N/AMassachusetts 28 13,854,313 2.2 274 3.5 22.1 11,209,675 254 628 9.6 46.4 31.3New Hampshire — 10,000 0.0 1 0.0 0.3 — — 37 2.8 79.1 N/ARhode Island 3 693,383 0.1 15 0.2 5.3 813,383 14 131 12.4 43.9 30.3Vermont 3 120,000 0.0 1 0.0 13.0 191,000 13 9 1.5 67.3 N/A
Middle Atlantic 150 98,651,397 15.9 1,017 13.1 17.3 186,223,628 1,619 5,692 13.9 30.0 N/ANew Jersey 20 16,079,332 2.6 160 2.1 10.3 66,638,030 362 1,555 17.7 39.2 19.9New York 105 68,390,175 11.0 707 9.1 20.0 108,162,749 1,033 3,417 17.6 19.2 25.1Pennsylvania 25 14,181,890 2.3 150 1.9 19.7 11,422,849 224 720 5.7 82.6 33.5
MIDWEST 163 66,874,284 10.8 1,318 17.0 14.3 96,696,013 1,565 4,662 7.0 49.2 N/AEast North Central 108 47,443,484 7.7 882 11.4 13.4 75,501,644 1,047 3,544 7.6 43.0 N/A
Illinois 33 27,377,975 4.4 496 6.4 13.5 25,517,261 388 2,028 15.8 32.5 20.2Indiana 14 4,072,641 0.7 71 0.9 10.5 9,269,567 107 390 6.0 81.7 28.2Michigan 27 7,888,145 1.3 125 1.6 18.1 33,377,112 325 436 4.4 34.7 29.4Ohio 19 2,814,985 0.5 51 0.7 7.9 2,662,441 80 355 3.1 63.4 31.4Wisconsin 15 5,289,738 0.9 139 1.8 15.7 4,675,263 147 336 5.9 74.2 27.6
West North Central 55 19,430,800 3.1 436 5.6 17.4 21,194,369 518 1,117 5.4 73.0 N/AIowa 4 576,978 0.1 9 0.1 3.8 344,020 9 152 5.0 83.7 27.2Kansas 5 817,323 0.1 25 0.3 2.7 917,300 31 300 10.5 59.4 25.4Minnesota 25 12,770,169 2.1 299 3.9 51.0 15,599,767 367 250 4.7 74.5 24.4Missouri 8 3,836,963 0.6 69 0.9 18.1 3,514,548 72 212 3.5 79.2 25.6Nebraska 10 1,339,367 0.2 30 0.4 8.0 783,734 36 167 9.2 77.3 27.0North Dakota 1 50,000 0.0 1 0.0 3.7 10,000 1 13 2.0 73.0 N/ASouth Dakota 2 40,000 0.0 3 0.0 1.8 25,000 2 22 2.7 102.9 N/A
SOUTH1 174 173,871,325 28.1 2,029 26.2 9.5 113,066,621 1,775 18,228 15.9 57.3 N/A(SOUTH w/o DC) 160 94,962,930 17.6 1,441 20.2 5.2 101,535,275 1,549 18,173 15.9 57.5 N/ASouth Atlantic 91 117,028,096 18.9 1,148 14.8 15.9 70,863,724 1,214 7,366 12.3 73.6 N/A
Delaware 7 1,811,730 0.3 34 0.4 24.7 2,192,076 49 73 8.2 96.4 21.7District of Columbia 14 78,908,395 12.7 588 7.6 1,441.3 11,531,346 226 55 9.1 21.8 N/AFlorida 18 9,678,870 1.6 146 1.9 2.3 10,040,962 97 4,224 22.5 57.4 21.8Georgia 8 3,772,350 0.6 56 0.7 4.4 6,552,550 64 854 8.8 96.1 31.9Maryland 13 7,728,818 1.2 102 1.3 16.4 7,690,258 147 471 8.2 106.5 13.7North Carolina 21 10,783,500 1.7 137 1.8 13.5 30,127,500 585 800 8.4 111.1 33.9South Carolina 2 882,617 0.1 14 0.2 3.7 335,617 6 236 5.1 147.9 33.8Virginia 8 3,448,816 0.6 70 0.9 5.5 2,393,415 40 632 7.9 91.7 14.1West Virginia — 13,000 0.0 1 0.0 0.6 — — 22 1.2 81.4 N/A
East South Central 15 3,248,227 0.5 63 0.8 4.7 1,527,473 49 690 3.7 130.6 N/AAlabama 6 669,600 0.1 21 0.3 3.6 214,100 15 186 3.9 144.8 30.8Kentucky 2 733,123 0.1 10 0.1 5.5 105,000 6 133 3.1 121.6 33.3Mississippi 1 800,667 0.1 6 0.1 9.8 89,000 2 81 2.7 105.9 29.5Tennessee 6 1,044,837 0.2 26 0.3 3.6 1,119,373 26 290 4.6 134.2 33.8
West South Central 68 53,595,002 8.7 818 10.6 5.3 40,675,424 512 10,172 28.0 44.4 N/AArkansas 6 361,477 0.1 10 0.1 1.9 9,897,729 52 186 6.4 114.2 31.9Louisiana 4 1,182,569 0.2 11 0.1 6.1 455,099 8 193 4.2 78.7 19.8Oklahoma 6 706,870 0.1 19 0.2 2.1 682,980 17 332 8.9 85.2 29.8Texas 52 51,344,086 8.3 778 10.1 5.4 29,639,616 435 9,461 37.6 41.8 26.8
WEST 173 260,399,516 42.1 2,986 38.6 12.6 200,431,250 2,313 20,596 28.6 34.3 N/AMountain 60 34,893,271 5.6 597 7.7 6.7 11,438,447 400 5,217 23.6 47.2 N/A
Arizona 12 9,002,631 1.5 127 1.6 4.8 2,119,871 43 1,895 29.6 46.3 26.6Colorado 22 6,997,719 1.1 240 3.1 6.7 6,006,926 225 1,039 20.7 41.2 24.9Idaho 2 35,000 0.0 3 0.0 0.2 65,000 4 176 11.2 73.0 28.8Montana 1 — — — — — 60,000 2 29 2.9 58.0 N/ANevada 5 749,278 0.1 22 0.3 1.0 510,200 17 717 26.5 81.9 22.1New Mexico 12 17,154,252 2.8 173 2.2 18.0 1,876,300 84 953 46.3 24.6 26.4Utah 3 764,241 0.1 23 0.3 2.1 510,000 15 358 13.0 77.8 27.2Wyoming 3 190,150 0.0 9 0.1 3.8 290,150 10 50 8.9 58.6 N/A
Pacific 113 225,506,245 36.4 2,389 30.9 14.7 188,992,803 1,913 15,380 30.8 30.4 N/AAlaska 1 22,614 0.0 1 0.0 0.6 22,614 1 39 5.5 51.8 N/ACalifornia 88 213,422,981 34.5 2,190 28.3 15.2 160,324,572 1,640 14,014 37.6 27.8 22.9Hawaii 1 10,000 0.0 1 0.0 0.1 10,000 1 121 8.9 37.8 17.9Oregon 11 7,119,943 1.2 141 1.8 15.8 4,995,595 125 450 11.7 63.5 28.8Washington 12 4,930,707 0.8 56 0.7 6.5 23,640,022 146 756 11.2 71.2 29.0
© 2011 The Foundation Center / Foundation Funding for Hispanics/Latinos in the United States and for Latin America 8
top metropolitan Areas receiving Foundation Funding for Latinos
According to the 2012 Statistical Abstract, published by the U.S. Bureau of the Census, there were 12 U.S. metropolitan areas with populations of at least 750,000 Hispanics in 2010, led by the Los Angeles metropolitan area with 5.7 million. Seven of these ranked among the top 10 in terms of total foundation grant dollars received between 2007 and 2009 that were intended to benefit Latinos—Los Angeles (1st), Washington, DC (2nd), New York (3rd), San Francisco (4th), Chicago (5th), San Antonio (9th),
and Houston (10th) (Table 7). More than half of all grant dollars targeting Latinos went to organizations located in four metropolitan areas—Los Angeles (17 percent), Washington, DC (14 percent), New York (13 percent), and San Francisco (8 percent). Between 2007 and 2009, the Los Angeles metropolitan area alone received over 1,000 grants totaling $107.3 million. Other metropolitan areas appearing among the top 10 in terms of grant dollars received were Philadelphia, Albuquerque, and Boston, each of which ranked between 21st and 27th in terms of the total number of Hispanics living in each of these areas.
endnoteS1 See Lawrence, S., ed., Social Justice Grantmaking II:
An Update on Foundation Trends. new York, Foundation Center, 2009.
FIGURE 8. Distribution of Foundation Giving Explicitly Designated to Benefit Latinos by Region, 2007 to 2009
Source: The Foundation Center, 2011. Grants data based on all domestic grants of $10,000 or more awarded by a sample of more than 1,000 larger foundations representing approximately half of total giving by all U.S. foundations. Figures represent only grants awarded to recipient organizations that could be identified as serving Hispanics or Latinos or grants whose descriptions specified a benefit for Hispanics or Latinos. These figures do not represent all giving benefiting Hispanics or Latinos.1 Many grants awarded to the District of Columbia are for national organizations, rather than regionally focused organizations. Excluding the District of Columbia, the South would have accounted for 17.6 percent of grants overall.
WESTGrants Received=$260.4 million
SOUTHGrants Received=$173.9 million
MIDWESTGrants Received=$66.9 million
NORTHEASTGrants Received=$116.9 million
New York59%Pennsylvania
12%
Massachusetts12%
All Other States4%
New Jersey14%
District of Columbia1
45%
North Carolina6%
Florida6%
All Other States13%
Texas30%
Illinois41%
Indiana6%
Wisconsin8%
Missouri6%
All Other States8%
Michigan12%
Minnesota19%
California82%
New Mexico7%
All Other States11%
© 2011 The Foundation Center / Foundation Funding for Hispanics/Latinos in the United States and for Latin America 9
A Spanish colony for four centuries, Puerto Rico was ceded to the united States following the Spanish-American War in 1898 and is currently a u.S. territory. Because of this history, Puerto Rico occupies a unique position in the national landscape. Puerto Ricans are u.S. citizens and must follow federal laws, yet they do not have voting representation in the u.S. Congress and cannot vote in u.S. presidential elections. Demographically, the island’s
population of 3.7 million is 99 percent Hispanic1, with a poverty rate double that of Latinos in the united States—44 percent compared to 23 percent.
given this unique historical, political, and demographic context, in this section we take a closer look at the giving of larger u.S. foundations to Puerto Rico from 2007 to 2009. This section analyzes all grants awarded to recipient organizations located in Puerto Rico.
Sampled foundations awarded 263 grants totaling $10.5 million between 2007 and 2009 to recipient organizations located in Puerto Rico. The median grant amount awarded to Puerto Rico during this three-year period was $20,000. Despite the higher rate of poverty in Puerto Rico, u.S. foundations gave proportionally less to recipient organizations in the territory compared to some states with a similar number of Latinos.
Grants Received Population, 2010
Metropolitan Area Amount % No. of Grants % Latino Population % of Total % of Latinos in Poverty
1. Los Angeles-Long Beach-Santa Ana, CA $107,323,877 17.3 1,012 13.1 5,723,065 44.5 22.1
2. Washington-Arlington-Alexandria, DC-VA-MD 86,243,542 13.9 702 9.1 775,036 13.8 11.4
3. New York-Northern New Jersey-Long Island, NJ-NY 79,069,893 12.8 777 10.0 4,349,923 23.0 23.2
4. San Francisco-Oakland-Fremont, CA 49,739,845 8.0 598 7.7 944,227 21.7 16.4
5. Chicago-Naperville-Joliet, IL-IN-WI 27,202,005 4.4 489 6.3 1,967,895 20.8 19.7
6. Philadelphia-Camden-Wilmington, PA-NJ-DE 16,083,011 2.6 186 2.4 470,951 7.9 28.5
7. San Antonio-New Braunfels, TX 15,660,781 2.5 195 2.5 1,169,324 54.2 22.1
8. Albuquerque, NM 14,234,166 2.3 95 1.2 418,483 46.9 23.0
9. Boston-Cambridge-Quincy, MA-NH 13,298,403 2.1 249 3.2 413,080 9.1 27.2
10. Houston-Sugar Land-Baytown, TX 13,105,271 2.1 139 1.8 2,117,920 35.4 25.2
Subtotal $421,960,794 68.2 4,442 57.4
All Other Metropolitan Areas 197,097,399 31.8 3,293 42.6
Total $619,058,193 100.0 7,735 100.0
Source: The Foundation Center, 2011. Grants data based on all domestic grants of $10,000 or more awarded by a sample of more than 1,000 larger foundations representing approximately half of total giving by all U.S. foundations. Figures represent only grants awarded to recipient organizations that could be identified as serving Hispanics or Latinos or grants whose descriptions specified a benefit for Hispanics or Latinos. These figures do not represent all giving benefiting Hispanics or Latinos.
TABLE 7. Top Metropolitan Areas by Foundation Funding Explicitly Designated to Benefit Latinos, 2007 to 2009
FoUndAtion giving to pUerto riCo
TABLE 6. Top 10 States by Latino Population Growth1
StateLatino Population Growth
2000–2010 (%)Latino Population
2010 (rank)Percent of Latinos in Poverty 2010 (rank)
Grant Dollars Targeting Latinos Received per
Capita 2007–2009 (rank)
1. South Carolina 147.9 235,682 (29) 33.8 (3) $3.7 (34)
2. Alabama 144.8 185,602 (33) 30.8 (10) $3.6 (36)
3. Tennessee 134.2 290,059 (27) 33.8 (2) $3.6 (37)
4. Kentucky 121.6 132,836 (37) 33.3 (5) $5.5 (26)
5. Arkansas 114.2 186,050 (32) 31.9 (7) $1.9 (42)
6. North Carolina 111.1 800,120 (11) 33.9 (1) $13.5 (15)
7. Maryland 106.5 470,632 (18) 13.7 (41) $16.4 (10)
8. Mississippi 105.9 81,481 (40) 29.5 (13) $9.8 (19)
9. South Dakota 102.9 22,119 (47) N/A $1.8 (43)
10. Delaware 96.4 73,221 (41) 21.7 (35) $24.7 (3)
Source: The Foundation Center, 2011. Grants data based on all domestic grants of $10,000 or more awarded by a sample of more than 1,000 larger foundations representing approximately half of total giving by all U.S. foundations. Figures represent only grants awarded to recipient organizations that could be identified as serving Hispanics or Latinos or grants whose descriptions specified a benefit for Hispanics or Latinos. These figures do not represent all giving benefiting Hispanics or Latinos.1 Population growth determined by the change in Latino population from 2000 to 2010.N/A = Census data not available.

© 2011 The Foundation Center / Foundation Funding for Hispanics/Latinos in the United States and for Latin America 10
TABLE A-1. Top 10 Foundations by Giving to Puerto Rico, 2007 to 2009
Foundation StateFoundation
Type1No. of
Grants Amount %
1. Johnson & Johnson Family of Companies Contribution Fund NJ CS 30 $1,190,000 11.4
2. Amgen Foundation CA CS 14 1,185,685 11.3
3. Citi Foundation NY CS 41 702,500 6.7
4. Ford Foundation NY IN 4 686,000 6.6
5. Merck Company Foundation NJ CS 26 655,977 6.3
6. Medtronic Foundation MN CS 26 536,124 5.1
7. O. P. and W. E. Edwards Foundation MT IN 6 494,445 4.7
8. Robert Wood Johnson Foundation NJ IN 2 465,000 4.4
9. Abbott Fund IL CS 6 435,630 4.2
10. Kresge Foundation MI IN 1 415,000 4.0
Subtotal 156 $6,766,361 64.7
All Other Foundations 107 3,694,536 35.3
Total 263 $10,460,897 100.0
Source: The Foundation Center, 2011. Based on all grants of $10,000 or more awarded by a sample of more than 1,000 larger foundations representing approximately half of total giving by all U.S. foundations. Foundations located in Puerto Rico are not included in the Foundation Center’s annual grants sample, therefore they are not represented in this table. See Table A-2 for Puerto Rico–based foundations.1 IN=Independent Foundation; CS=Corporate Foundation.
Consistent with the funding priorities of U.S. foundations overall, larger foundations directed the biggest shares of grant dollars awarded to Puerto Rico for education and health, capturing 30 percent and 22 percent, respectively (Figure A-1). Education also led by share of number of grants (25 percent), followed by human services (25 percent).
In the 2007 to 2009 sample, the top 10 funders provided close to two-thirds (64.7 percent) of grant dollars awarded to recipient organizations in Puerto Rico, giving a combined 156 grants totaling $6.8 million over the three-year period (Table A-1). In a departure from overall giving trends in the United States, corporate foundations dominated the top funder list, capturing six of the top 10 slots. At the top of the list was New Jersey–based Johnson & Johnson Family of Companies Contribution Fund, awarding $1.2 million; California–based Amgen Foundation, distributing $1.2 million; and New York–based Citi Foundation, giving $702,500. The largest grant awarded by a corporate foundation during this time was a $251,859 award from the Amgen Foundation to the University of Puerto Rico for the Amgen Bruce-Wallace program, which helps to bring biotechnology to high school students in Puerto Rico.
Available data show that several Puerto Rican foundations account for a substantial amount of giving as well, much of which is likely to be local (Table A-2). For example, the Angel Ramos Foundation awarded $9.8 million in grants from 2007 to 2009, more than eight times the amount awarded by the top U.S.–based funder.
1 U.S. Census Bureau, as of October 2011.
Source: The Foundation Center, 2011. Grants data based on all domestic grants of $10,000 or more awarded by a sample of more than 1,000 larger foundations representing approximately half of total giving by all U.S. foundations. 1 Includes international affairs, development and peace, and the social sciences.
FIGURE A-1. Foundation Giving to Puerto Rico by Major Subject, 2007 to 2009
Percent of Grant Dollars
Human Services12%
Health22%
Public Affairs/Society Benefit
21%
Education30%
Arts and Culture2%
Science and Technology8%
Religion1%
Environment and Animals2%
Other11%
Human Services25%
Health16%
Public Affairs/Society Benefit
18%
Education25%
Science and Technology4%
Arts and Culture5%
Religion2%
Environment and Animals2%
Other12%
Percent of Number of Grants
Foundation Foundation Type1 Total Giving
1. Angel Ramos Foundation2 PC $9,793,654
2. Banco Popular Foundation2 CS 7,056,863
3. Puerto Rico Community Foundation CM 4,082,984
4. FNZ Foundation IN 2,610,053
5. Davis-Villamil Family Foundation IN 1,034,050
6. Flamboyan Foundation3 IN 942,000
7. Unanue Lopez Family Foundation OP 831,258
8. Harvey Foundation IN 275,500
9. Miranda Foundation IN 120,356
Source: The Foundation Center, 2011. Private foundations in Puerto Rico are not required to file IRS Form 990PF. Only voluntary reporters are represented. Data were not available for several major foundations, including the Ferre Rangel Foundation.1 IN=Independent Foundation; CM=Community Foundation; CS=Corporate; OP= Operating Foundation; PC = Public Charity.2IRS forms were unavailable; based on foundation self-report.3Flamboyan Foundation has offices in both Puerto Rico and Washington D.C. Total giving represents grants awarded to Puerto Rico-based organizations only.
TABLE A-2. Selected Puerto Rico Foundations by Total Giving, 2007 to 2009
© 2011 The Foundation Center / Foundation Funding for Hispanics/Latinos in the United States and for Latin America 11
U.S. Foundation giving to Latin America, 2007–2009
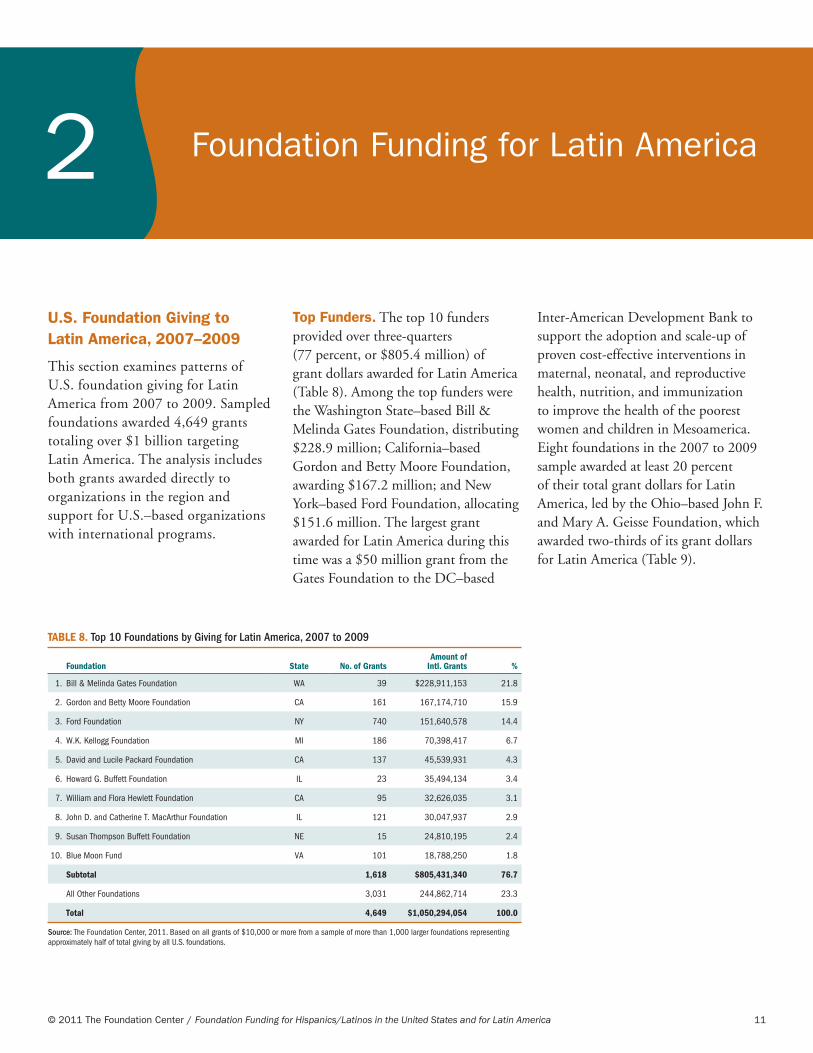
This section examines patterns of U.S. foundation giving for Latin America from 2007 to 2009. Sampled foundations awarded 4,649 grants totaling over $1 billion targeting Latin America. The analysis includes both grants awarded directly to organizations in the region and support for U.S.–based organizations with international programs.
top Funders. The top 10 funders provided over three-quarters (77 percent, or $805.4 million) of grant dollars awarded for Latin America (Table 8). Among the top funders were the Washington State–based Bill & Melinda Gates Foundation, distributing $228.9 million; California–based Gordon and Betty Moore Foundation, awarding $167.2 million; and New York–based Ford Foundation, allocating $151.6 million. The largest grant awarded for Latin America during this time was a $50 million grant from the Gates Foundation to the DC–based
Inter-American Development Bank to support the adoption and scale-up of proven cost-effective interventions in maternal, neonatal, and reproductive health, nutrition, and immunization to improve the health of the poorest women and children in Mesoamerica. Eight foundations in the 2007 to 2009 sample awarded at least 20 percent of their total grant dollars for Latin America, led by the Ohio–based John F. and Mary A. Geisse Foundation, which awarded two-thirds of its grant dollars for Latin America (Table 9).
Foundation Funding for Latin America2
TABLE 8. Top 10 Foundations by Giving for Latin America, 2007 to 2009
Foundation State No. of GrantsAmount of
Intl. Grants %
1. Bill & Melinda Gates Foundation WA 39 $228,911,153 21.8
2. Gordon and Betty Moore Foundation CA 161 167,174,710 15.9
3. Ford Foundation NY 740 151,640,578 14.4
4. W.K. Kellogg Foundation MI 186 70,398,417 6.7
5. David and Lucile Packard Foundation CA 137 45,539,931 4.3
6. Howard G. Buffett Foundation IL 23 35,494,134 3.4
7. William and Flora Hewlett Foundation CA 95 32,626,035 3.1
8. John D. and Catherine T. MacArthur Foundation IL 121 30,047,937 2.9
9. Susan Thompson Buffett Foundation NE 15 24,810,195 2.4
10. Blue Moon Fund VA 101 18,788,250 1.8
Subtotal 1,618 $805,431,340 76.7
All Other Foundations 3,031 244,862,714 23.3
Total 4,649 $1,050,294,054 100.0
Source: The Foundation Center, 2011. Based on all grants of $10,000 or more from a sample of more than 1,000 larger foundations representing approximately half of total giving by all U.S. foundations.
© 2011 The Foundation Center / Foundation Funding for Hispanics/Latinos in the United States and for Latin America 12
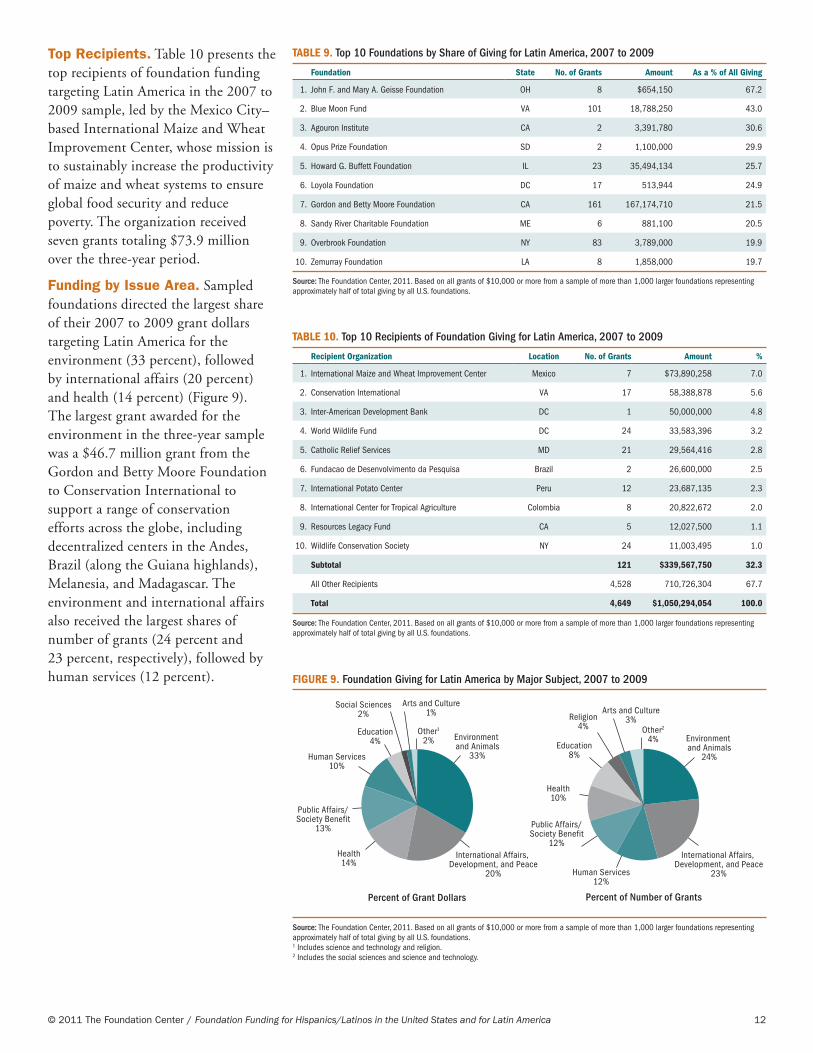
top recipients. Table 10 presents the top recipients of foundation funding targeting Latin America in the 2007 to 2009 sample, led by the Mexico City–based International Maize and Wheat Improvement Center, whose mission is to sustainably increase the productivity of maize and wheat systems to ensure global food security and reduce poverty. The organization received seven grants totaling $73.9 million over the three-year period.
Funding by issue Area. Sampled foundations directed the largest share of their 2007 to 2009 grant dollars targeting Latin America for the environment (33 percent), followed by international affairs (20 percent) and health (14 percent) (Figure 9). The largest grant awarded for the environment in the three-year sample was a $46.7 million grant from the Gordon and Betty Moore Foundation to Conservation International to support a range of conservation efforts across the globe, including decentralized centers in the Andes, Brazil (along the Guiana highlands), Melanesia, and Madagascar. The environment and international affairs also received the largest shares of number of grants (24 percent and 23 percent, respectively), followed by human services (12 percent).
TABLE 9. Top 10 Foundations by Share of Giving for Latin America, 2007 to 2009
Foundation State No. of Grants Amount As a % of All Giving
1. John F. and Mary A. Geisse Foundation OH 8 $654,150 67.2
2. Blue Moon Fund VA 101 18,788,250 43.0
3. Agouron Institute CA 2 3,391,780 30.6
4. Opus Prize Foundation SD 2 1,100,000 29.9
5. Howard G. Buffett Foundation IL 23 35,494,134 25.7
6. Loyola Foundation DC 17 513,944 24.9
7. Gordon and Betty Moore Foundation CA 161 167,174,710 21.5
8. Sandy River Charitable Foundation ME 6 881,100 20.5
9. Overbrook Foundation NY 83 3,789,000 19.9
10. Zemurray Foundation LA 8 1,858,000 19.7
Source: The Foundation Center, 2011. Based on all grants of $10,000 or more from a sample of more than 1,000 larger foundations representing approximately half of total giving by all U.S. foundations.
TABLE 10. Top 10 Recipients of Foundation Giving for Latin America, 2007 to 2009
Recipient Organization Location No. of Grants Amount %
1. International Maize and Wheat Improvement Center Mexico 7 $73,890,258 7.0
2. Conservation International VA 17 58,388,878 5.6
3. Inter-American Development Bank DC 1 50,000,000 4.8
4. World Wildlife Fund DC 24 33,583,396 3.2
5. Catholic Relief Services MD 21 29,564,416 2.8
6. Fundacao de Desenvolvimento da Pesquisa Brazil 2 26,600,000 2.5
7. International Potato Center Peru 12 23,687,135 2.3
8. International Center for Tropical Agriculture Colombia 8 20,822,672 2.0
9. Resources Legacy Fund CA 5 12,027,500 1.1
10. Wildlife Conservation Society NY 24 11,003,495 1.0
Subtotal 121 $339,567,750 32.3
All Other Recipients 4,528 710,726,304 67.7
Total 4,649 $1,050,294,054 100.0
Source: The Foundation Center, 2011. Based on all grants of $10,000 or more from a sample of more than 1,000 larger foundations representing approximately half of total giving by all U.S. foundations.
Source: The Foundation Center, 2011. Based on all grants of $10,000 or more from a sample of more than 1,000 larger foundations representing approximately half of total giving by all U.S. foundations. 1 Includes science and technology and religion. 2 Includes the social sciences and science and technology.
FIGURE 9. Foundation Giving for Latin America by Major Subject, 2007 to 2009
Percent of Grant Dollars
Human Services10%
Health14%
Public Affairs/Society Benefit
13%
International Affairs, Development, and Peace
20%
International Affairs, Development, and Peace
23%
Education4%
Arts and Culture1%
Social Sciences2%
Environment and Animals
33%
Other12%
Religion4%
Environment and Animals
24%
Other2
4%
Percent of Number of Grants
Education8%
Arts and Culture3%
Public Affairs/Society Benefit
12%
Human Services12%
Health10%
© 2011 The Foundation Center / Foundation Funding for Hispanics/Latinos in the United States and for Latin America 13
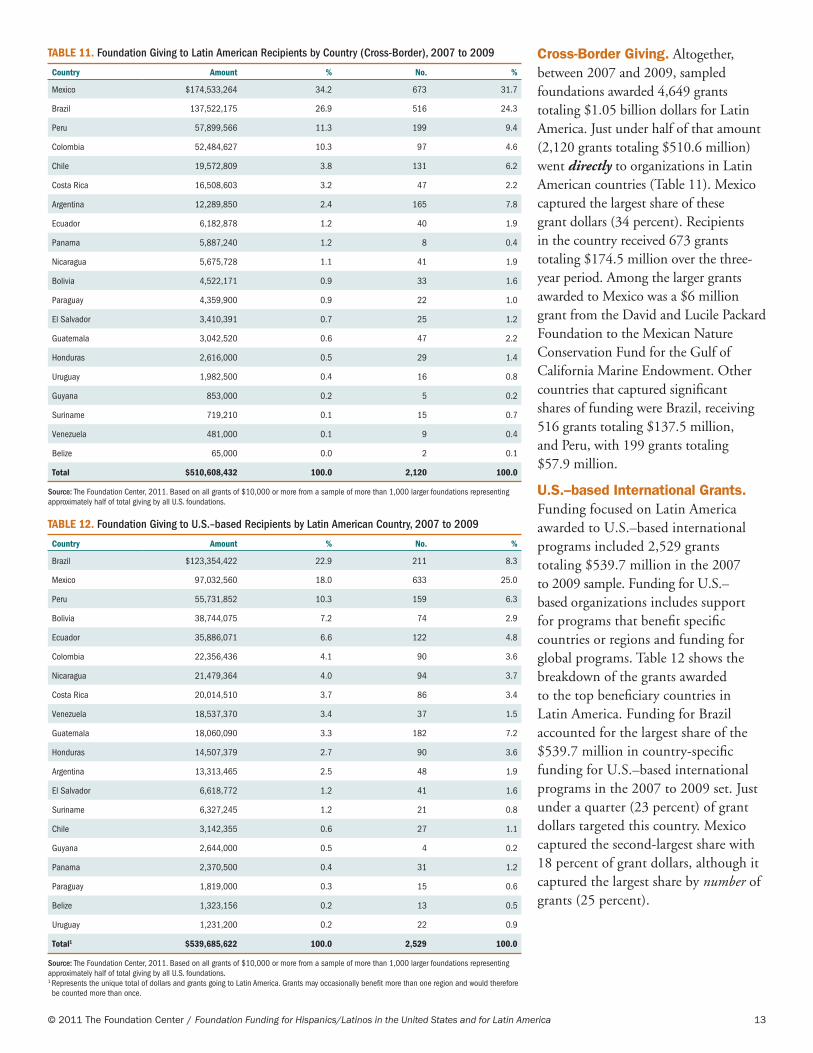
TABLE 11. Foundation Giving to Latin American Recipients by Country (Cross-Border), 2007 to 2009
Country Amount % No. %
Mexico $174,533,264 34.2 673 31.7
Brazil 137,522,175 26.9 516 24.3
Peru 57,899,566 11.3 199 9.4
Colombia 52,484,627 10.3 97 4.6
Chile 19,572,809 3.8 131 6.2
Costa Rica 16,508,603 3.2 47 2.2
Argentina 12,289,850 2.4 165 7.8
Ecuador 6,182,878 1.2 40 1.9
Panama 5,887,240 1.2 8 0.4
Nicaragua 5,675,728 1.1 41 1.9
Bolivia 4,522,171 0.9 33 1.6
Paraguay 4,359,900 0.9 22 1.0
El Salvador 3,410,391 0.7 25 1.2
Guatemala 3,042,520 0.6 47 2.2
Honduras 2,616,000 0.5 29 1.4
Uruguay 1,982,500 0.4 16 0.8
Guyana 853,000 0.2 5 0.2
Suriname 719,210 0.1 15 0.7
Venezuela 481,000 0.1 9 0.4
Belize 65,000 0.0 2 0.1
Total $510,608,432 100.0 2,120 100.0
Source: The Foundation Center, 2011. Based on all grants of $10,000 or more from a sample of more than 1,000 larger foundations representing approximately half of total giving by all U.S. foundations.
TABLE 12. Foundation Giving to U.S.–based Recipients by Latin American Country, 2007 to 2009
Country Amount % No. %
Brazil $123,354,422 22.9 211 8.3
Mexico 97,032,560 18.0 633 25.0
Peru 55,731,852 10.3 159 6.3
Bolivia 38,744,075 7.2 74 2.9
Ecuador 35,886,071 6.6 122 4.8
Colombia 22,356,436 4.1 90 3.6
Nicaragua 21,479,364 4.0 94 3.7
Costa Rica 20,014,510 3.7 86 3.4
Venezuela 18,537,370 3.4 37 1.5
Guatemala 18,060,090 3.3 182 7.2
Honduras 14,507,379 2.7 90 3.6
Argentina 13,313,465 2.5 48 1.9
El Salvador 6,618,772 1.2 41 1.6
Suriname 6,327,245 1.2 21 0.8
Chile 3,142,355 0.6 27 1.1
Guyana 2,644,000 0.5 4 0.2
Panama 2,370,500 0.4 31 1.2
Paraguay 1,819,000 0.3 15 0.6
Belize 1,323,156 0.2 13 0.5
Uruguay 1,231,200 0.2 22 0.9
Total1 $539,685,622 100.0 2,529 100.0
Source: The Foundation Center, 2011. Based on all grants of $10,000 or more from a sample of more than 1,000 larger foundations representing approximately half of total giving by all U.S. foundations.1 Represents the unique total of dollars and grants going to Latin America. Grants may occasionally benefit more than one region and would therefore be counted more than once.
Cross-border giving. Altogether, between 2007 and 2009, sampled foundations awarded 4,649 grants totaling $1.05 billion dollars for Latin America. Just under half of that amount (2,120 grants totaling $510.6 million) went directly to organizations in Latin American countries (Table 11). Mexico captured the largest share of these grant dollars (34 percent). Recipients in the country received 673 grants totaling $174.5 million over the three-year period. Among the larger grants awarded to Mexico was a $6 million grant from the David and Lucile Packard Foundation to the Mexican Nature Conservation Fund for the Gulf of California Marine Endowment. Other countries that captured significant shares of funding were Brazil, receiving 516 grants totaling $137.5 million, and Peru, with 199 grants totaling $57.9 million.
U.S.–based international grants. Funding focused on Latin America awarded to U.S.–based international programs included 2,529 grants totaling $539.7 million in the 2007 to 2009 sample. Funding for U.S.–based organizations includes support for programs that benefit specific countries or regions and funding for global programs. Table 12 shows the breakdown of the grants awarded to the top beneficiary countries in Latin America. Funding for Brazil accounted for the largest share of the $539.7 million in country-specific funding for U.S.–based international programs in the 2007 to 2009 set. Just under a quarter (23 percent) of grant dollars targeted this country. Mexico captured the second-largest share with 18 percent of grant dollars, although it captured the largest share by number of grants (25 percent).
© 2011 The Foundation Center / Foundation Funding for Hispanics/Latinos in the United States and for Latin America 14
Summary
For the first time, this study documents what we currently know about U.S. foundation giving for Latinos in the United States, as well as funding for Latin America.
In the past decade, foundation funding explicitly designated to benefit Latinos in the United States has remained basically unchanged at about 1 percent of total foundation giving annually. The largest proportion of foundation dollars targeting Hispanics in the U.S. went to human services (27 percent) and health (26 percent). Consistent with where the largest Hispanic populations are concentrated, states
like California and New York received the biggest share of grant dollars. At the same time, a significant percentage of grant dollars was directed to southern states, which are experiencing rapid growth in the Latino population, along with high rates of poverty.
While the analyses reported are based on the best available data and provide informative baseline information, they do not account for all giving by large U.S. foundations benefiting Hispanics, due in large part to incomplete information about populations served within the available data.
Currently, there are collective efforts by the Foundation Center, regional associations, and grantmaker networks to develop more robust mechanisms for capturing grantmaking for diverse populations. While these efforts will yield better estimates in the future, we hope the current report stimulates dialogue grounded in available data and contributes to strategic conversations about giving for Latinos at a time when the country’s demographic landscape is rapidly changing.

79 Fifth Avenue ◆ new York, nY 10003 ◆ (800) 424-9836 ◆ foundationcenter.org ISBn 978-1-59542-371-9