rural school district enrollment and building capacity ... · rural school district enrollment and...
TRANSCRIPT
Rural School District Enrollment and Building Capacity
Projections for the Next 10 Years

The Center for Rural Pennsylvania Board of Directors
Senator John R. Gordner, ChairmanRepresentative Tina Pickett, Vice Chairman
Senator John Wozniak, TreasurerDr. Nancy Falvo, Clarion University, Secretary
Representative Tim SeipDr. Theodore R. Alter, Pennsylvania State University
Dr. Stephan J. Goetz, Northeast Regional Center for Rural DevelopmentMichelle Lady, Governor’s RepresentativeDr. Keith T. Miller, Lock Haven UniversityDr. Robert F. Pack, University of PittsburghWilliam Sturges, Governor’s Representative
This project was sponsored by a grant from the Center for Rural Pennsylvania, a legislative agency of thePennsylvania General Assembly.
The Center for Rural Pennsylvania is a bipartisan, bicameral legislative agency that serves as a resource for ruralpolicy within the Pennsylvania General Assembly. It was created in 1987 under Act 16, the Rural RevitalizationAct, to promote and sustain the vitality of Pennsylvania’s rural and small communities.
Information contained in this report does not necessarily reflect the views of individual board members or theCenter for Rural Pennsylvania.
For more information, contact the Center for Rural Pennsylvania, 200 North Third St., Suite 600, Harrisburg, PA17101, telephone (717) 787-9555, email: [email protected].
Rural School District Enrollment and Building CapacityProjections for the Next 10 Years
By:Wenfan Yan, Ph.D., Indiana University of Pennsylvania
September 2009
Executive SummaryGiven the shifting population trends across the
U.S. and Pennsylvania, it is important for policymakers and school districts to know what toexpect, in terms of school district enrollment andfacility needs, in the coming years.
This research was conducted to provide aperspective on the potentialbuilding needs of schooldistricts over the next 10years. The researcher devel-oped an inventory of schoolbuildings in rural Pennsylva-nia through a survey of ruralschool districts, analyzedenrollment trends for ruralschool districts over the next10 years, developed a
statistical model to examine future buildingneeds, and determined whether school districtswill be at risk of under- or over-capacity.
The findings provide a complex portrait ofPennsylvania’s current rural school buildingconditions and projections of building use overthe next 10 years. For example, while the majorityof rural school district respondents reported thattheir school building conditions were satisfactory,a sizable minority reported their buildingconditions as unsatisfactory.
The research revealed that the average age ofPennsylvania rural school buildings is older thanthe national average age of rural schools. Fifteenpercent of rural schools in the survey had afunctional age of 35 years or more. Many agingrural schools have experienced problems withenergy efficiency and other environmentalconditions that interfere with classroom learning.None of the respondents with schools having afunctional age of 35 years or more reportedhaving excellent environmental conditions. Morethan 80 percent of those respondents reportedtheir building energy efficiency conditions to bepoor or borderline. About half reported handi-capped accessibility and vehicular entrances andexits as unsatisfactory.
Over the next 10 years, rural Pennsylvaniaschool enrollment is projected to decrease 8percent. The most significant enrollment declineis projected to be in western Pennsylvania, whererural school districts may have a 16 percentdecline. More than 40 percent of elementaryschools and more than 60 percent of secondaryschools in western Pennsylvania are projected to
Table of Contents
experience significant enrollment decreases (15percent or greater).
More than half of rural schools are projectedto experience severe under-enrollment over thenext 10 years, with more than 25 percent belowcapacity. The proportion of rural schoolsexperiencing under-enrollment will differsomewhat by geographic region. Elementaryand secondary schools in western and centralPennsylvania are more likely to be under-enrolled than those in the east. About 70percent of elementary schools in the west andmore than 50 percent of elementary schools inthe central region will be under-enrolled. About90 percent of secondary schools in the west andmore than 80 percent of secondary schools inthe central region are more likely to be under-enrolled. On the other hand, about 10 percent ofelementary and secondary schools in the eastare more likely to be over-crowded.
The research also looked at telecommunica-tions readiness and compared rural schools andurban schools in terms of Internet access,computer Internet connectivity speed andcomputer processor capacity, and technologyequipment in classrooms and other spaces.
The research found that more than 67 percentof rural school classrooms had wired Internetaccess, about 2 percent had wireless access andabout 30 percent had both.
In general, urban schools tended to have morecomputers with high speed connectivity-highcapacity processors in classrooms and library/media centers than rural schools.
There was no significant difference betweenurban and rural schools in technology equip-ment, expect for the higher number of printersin urban school classrooms than in rural schoolclassrooms.
Based on the findings, the researcher recom-mends the following policy considerations:
• The Pennsylvania Department of Education(PDE) and school districts should considerestablishing a reporting system to effectivelymonitor school building conditions.• School districts should consider ways to useunder-used school buildings and maximizepublic use of school facilities.• PDE and school districts should considerthe changing face of student learning envi-ronments to accurately assess buildingcapacity needs.
Introduction ...................... 5Methodology .................... 5Results ............................... 6Conclusions .................... 11Policy Considerations .... 13References ...................... 14
Rural School District Enrollment and Building Capacity – Projections for the Next 10 Years 5
IntroductionSchool districts administrators across Pennsylvania are
taking note of the shifting population trends occurringacross the state and within their districts.
The Center for Rural Pennsylvania’s 2005 analysis ofthe Pennsylvania Department of Education’s (PDE)school enrollment projections showed a mixed picture forrural districts. For example, between 2005 and 2014, 115rural school districts are projected to have a significantdecline in enrollment (15 percent or greater), while 10rural school districts are projected to have a significantincrease in enrollment (15 percent or greater).
Statistical models and surveys currently available inother states do not match the needs of Pennsylvania’srural districts (Ilsley, 2002; Neblock, 1996; Peters, 1997).PDE currently gathers related data in the following areas:enrollment projections by district through 2016 (gener-ated in 2007) and enrollment trends from 1998 to thepresent. However, building needs, technology readiness,and handicap accessibility projections are not part of thestate’s data collection.
For school districts to prepare for shifting enrollmentsand the future needs of their students, they need tounderstand the current condition of their school build-ings and understand the population trends in theirdistricts.
To provide rural Pennsylvania school districts withsome baseline information on school buildings andpopulation trends, the researcher conducted an inventoryin 2006-2007 of the state’s rural school buildings,including their age, physical condition, telecommunica-tions readiness, and other relevant indicators related tothe cost of maintaining, upgrading, or replacing facilities.
The researcher also analyzed enrollment trends toidentify whether school buildings in rural school districtswill meet future needs over the next 10 years and identi-fied school districts, by region, that, over the course ofthe next 10 years, will be at risk of under- or over-capacity. Currently, this information is unavailablethrough national or state data sources.
MethodologyTo conduct the study, the researcher used multiple data
sources including the following: a statewide survey onrural school building conditions, and PDE’s 10-yearenrollment data, its Pennsylvania Technology Inventory(PATI) and its Plancon data.
Survey InstrumentThe researcher developed a survey, which was sent to
all 243 rural Pennsylvania school districts1. Superinten-dents or other district-level personnel, such as businessmanagers or supervisors of special projects, completedthe surveys. A total of 65 school districts returned thesurveys via email, fax or regular mail, for a response rateof 27 percent.
The survey instrument was divided into three sections:Characteristics of Rural School Districts, Inventory ofExisting School Building Conditions, and Projections.
The “Characteristics of School Districts” sectioncollected information on the characteristics of individualbuildings in rural school districts, such as school names,the number of buildings, the location of buildings, gradelevels included in each building, and student enrollmentin each building.
The “Inventory of Existing Conditions” sectionobtained information on the physical condition andcapacities of each building within the school district,such as building age, which included any renovationprojects, and physical condition, which included environ-mental factors, building features, building safety features,building accessibility, and building energy efficiency.
The “Projections” section collected information on anyanticipated changes in the areas of language arts, math-ematics, and special education over the next 10 years.
PDE DataIn addition to the survey constructed for this project,
the researcher used the following existing data from PDE:• Ten-Year Enrollment Projections (2006-2016) – Theresearcher used the data to analyze the prediction ofenrollment change in the next 5 years (2006-2007 to2011-2012) and next 10 years (2006-2007 to 2016-2017), at both the elementary and secondary levels.• The Pennsylvania Technology Inventory (PATI) –These data provide detailed information regardingcomputer availability and connectivity (includingInternet access, computer Internet connectivity speedand processor capacity, and technology equipment inclassrooms, labs, libraries and offices) for every schooldistrict in the state.• PlanCon Data – School districts seeking reimburse-ment for any renovation or construction projects mustprovide detailed information on their school buildingcapacity. The PlanCon data also provide a standard unitfor calculating building capacities. Even though
1 According to the Center for Rural Pennsylvania, a school district is rural when the number of persons per square mile within theschool district is less than 274. School districts that have 274 persons or more per square mile are considered urban.
6 The Center for Rural Pennsylvania
PlanCon data were only available for the schooldistricts that seek reimbursement for their renovation orconstruction projects through PDE, they providedinformation for validating the data that were collectedfrom the survey. They also provided school capacityinformation for those school districts that were notincluded in the survey. By combining the PlanCon dataand the survey data, the researcher was able to analyzethe building capacity for 126 school districts. Theseschool districts represented 52 percent of the ruralschool districts in Pennsylvania.The school building capacity data were also combined
with enrollment projections to create a school capacityand enrollment dataset. By comparing school enrollmentprojections to school capacity, the researcher couldproject under- and over-enrollment among rural districtsby geographic regions.
Reliability of the Data SourceTwo important indicators of school characteristics -
namely the percentage of low-income students and region- were used throughout the comparisons of this study.Prior literature indicated that school enrollment projec-tions and school building conditions were significantlyrelated to these two factors (NCES, 2000, 2002, 2005;The Center for Rural Pennsylvania, 2005).
This research used PDE data on the percentage of low-income students. PDE uses the following measures todetermine the percentage of low-income students:poverty data sources, such as Temporary Assistance forNeedy Families, Medicaid and the number of childrenliving in institutions for the neglected or delinquent orthose supported in foster homes. To the extent that suchdata were not available, the most recent reliable dataavailable at the time of determination, such as free andreduced school lunch eligibility, were used.
The research also employed data from the Center ofRural Pennsylvania to group rural Pennsylvania school
districts into eastern, central and western regions. Bycombining the percentage of low-income student datawith the regional data, the researcher created the schoolcharacteristics data for rural school districts.
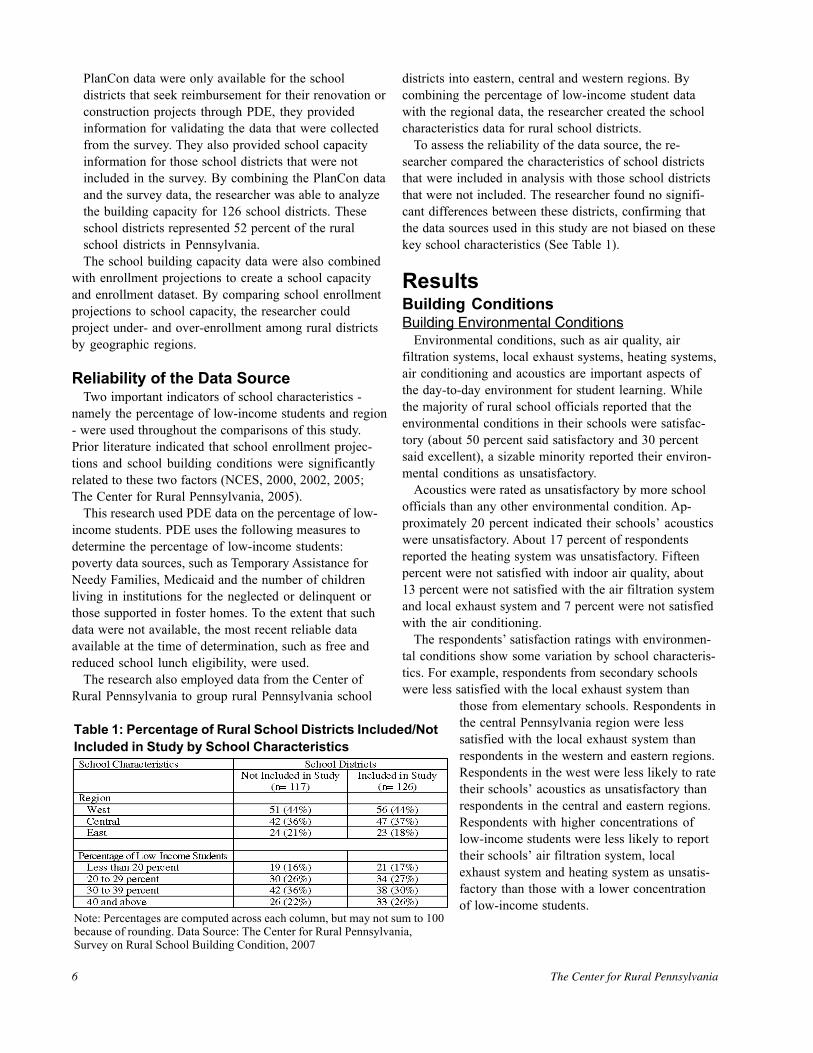
To assess the reliability of the data source, the re-searcher compared the characteristics of school districtsthat were included in analysis with those school districtsthat were not included. The researcher found no signifi-cant differences between these districts, confirming thatthe data sources used in this study are not biased on thesekey school characteristics (See Table 1).
ResultsBuilding ConditionsBuilding Environmental Conditions
Environmental conditions, such as air quality, airfiltration systems, local exhaust systems, heating systems,air conditioning and acoustics are important aspects ofthe day-to-day environment for student learning. Whilethe majority of rural school officials reported that theenvironmental conditions in their schools were satisfac-tory (about 50 percent said satisfactory and 30 percentsaid excellent), a sizable minority reported their environ-mental conditions as unsatisfactory.
Acoustics were rated as unsatisfactory by more schoolofficials than any other environmental condition. Ap-proximately 20 percent indicated their schools’ acousticswere unsatisfactory. About 17 percent of respondentsreported the heating system was unsatisfactory. Fifteenpercent were not satisfied with indoor air quality, about13 percent were not satisfied with the air filtration systemand local exhaust system and 7 percent were not satisfiedwith the air conditioning.
The respondents’ satisfaction ratings with environmen-tal conditions show some variation by school characteris-tics. For example, respondents from secondary schoolswere less satisfied with the local exhaust system than
those from elementary schools. Respondents inthe central Pennsylvania region were lesssatisfied with the local exhaust system thanrespondents in the western and eastern regions.Respondents in the west were less likely to ratetheir schools’ acoustics as unsatisfactory thanrespondents in the central and eastern regions.Respondents with higher concentrations oflow-income students were less likely to reporttheir schools’ air filtration system, localexhaust system and heating system as unsatis-factory than those with a lower concentrationof low-income students.
Table 1: Percentage of Rural School Districts Included/NotIncluded in Study by School Characteristics
Note: Percentages are computed across each column, but may not sum to 100because of rounding. Data Source: The Center for Rural Pennsylvania,Survey on Rural School Building Condition, 2007
Rural School District Enrollment and Building Capacity – Projections for the Next 10 Years 7
Condition of Major Building FeaturesThe survey collected information about the respon-
dents’ satisfaction with four major school buildingfeatures: roof; foundation; drywall, plaster and bricks;and exterior and interior walls. The majority of ruralschool respondents reported that the school foundation,drywall, plaster and bricks, and exterior and interior wallswere satisfactory (more than 50 percent said satisfactoryand more than 23 percent said excellent). Roof condi-tions were rated lowest among the major building featuresas roughly 25 percent of respondents rated the roof asunsatisfactory.
Rural respondents’ satisfaction ratings with the roof,foundation and walls did not vary significantly by schoolcharacteristics, such as instructional level, region andpercentage of low-income students. However, the respon-dents’ satisfaction ratings with drywall, plaster and bricksshow some variation by region and the percentage of low-income students. For example, respondents in the westernand central areas were less satisfied with their schools’drywall, plaster and bricks than those in the east. Respon-dents from more affluent schools were more satisfied withthe drywall, plaster and bricks than those from lesswealthy schools.
Condition of Minor Building FeaturesThe survey collected information about the respon-
dents’ satisfaction with four minor rural school buildingfeatures: interior water supply; exterior water supply;lockers; and restrooms.
More than 90 percent of respondents reported that theinterior/exterior water supply and lockers were satisfac-tory (more than 50 percent satisfactory and more than 40percent excellent). Approximately 89 percent said therestrooms were satisfactory or excellent.
Rural school respondents’ satisfaction ratings withinterior water supply and lockers did not vary signifi-cantly by school characteristics, such as instructionallevel, region and percent of low-income students.
However, satisfaction ratings with exterior water supplyshow some variation by the percentage of low-incomestudents. Respondents with 40 percent or more low-income students were more likely to report that theirschools’ exterior water supply conditions were borderlinethan those from more wealthy schools.
Respondents’ satisfaction ratings with restrooms showsome variation by region and the percentage of low-income students. For example, respondents in the eastwere less likely to rate the restrooms as unsatisfactorythan respondents in the west and central regions. Respon-dents from affluent schools (those with less than 20percent low-income students) were more likely to reportrestrooms as unsatisfactory than those from less wealthy
schools (schools with higher concentrations of low-income students).
Condition of Building SafetyThe survey collected information about respondents’
satisfaction with building safety in terms of fire alarms,smoke detectors and sprinkler systems, light sources, andemergency lighting.
About 97 percent of respondents reported that the firealarms, smoke detectors and sprinkler systems weresatisfactory (36 percent satisfactory and 62 percentexcellent). About 88 percent said the light sources in theirschools were satisfactory (51 percent satisfactory and 37percent excellent). Approximately 90 percent said theemergency lighting in their schools was satisfactory (59percent satisfactory and 31 percent excellent).
Respondents’ satisfaction ratings with building safetydid not vary significantly by school characteristics, suchas instructional level, region and percentage of low-income students.
Condition of Building Energy EfficiencyThe survey gathered information on the respondents’
satisfaction with energy efficiency in terms of fluorescentlighting, building envelopes (outer walls, insulation andsiding), and building energy efficiency.
While more than 60 percent of respondents said thebuilding energy efficiency was satisfactory, more than 30percent said building energy efficiency was unsatisfactory.
Respondents’ satisfaction rating with building energyefficiency did not show any variation by school instruc-tional level and the percentage of low-income students.However, satisfaction ratings with building energyefficiency showed some variation by region as respon-dents from the east were more satisfied than respondentsfrom the west and central regions.
Condition of Building AccessibilityThe survey asked about the respondents’ satisfaction
with various building accessibility features includinghandicapped accessibility, vehicular entrances and exits,pedestrian services, student drop-off areas, and busloading areas.
The majority of respondents reported the handicappedaccessibility, vehicular entrances and exits, pedestrianservices, and bus loading areas were satisfactory (morethan 40 percent satisfactory and more than 30 percentexcellent). Student drop-off areas were rated lowest (33percent unsatisfactory).
Satisfaction with building accessibility did not showany variation by school characteristics, such as instruc-tional level, region and concentration of low-incomestudents.
8 The Center for Rural Pennsylvania
Functional Age of School BuildingMany rural schools have been renovated in the years
since they were built. For this reason, the year of the mostrecent renovation is often a better basis of a school’s agethan the year of original construction. Therefore, toaccurately determine the school building age, the studyused functional age. For schools with no major renova-tions, the functional ages of the buildings were calculatedas the years since they were built. For schools thatcompleted major renovation projects, functional ageswere identified as the number of years since the comple-tion of such projects.
According to the survey results, the average age of ruralPennsylvania school buildings (44 years) is higher thanthe average age of rural schools nationwide (41 years).However, the average functional age of rural Pennsylva-nia schools, as defined above, was 16 years. Fifteenpercent of rural Pennsylvania schools had a functionalage of 35 years or more.
Rural schools’ functional age did not show any varia-tion by school characteristics with regards to region andpercentage of low-income students. However, there wassome variation in the functional age distributions byschool instructional level. The average functional age ofsecondary schools was less than the average functionalage of elementary schools (13 years versus 18 years,respectively).
The indicator of school condition used in this report issatisfaction with the school building conditions. Theproportion of respondents that reported their satisfactionlevel with their building conditions differed by schoolages, with older schools typically receiving worsesatisfaction levels than newer schools. Respondents fromschools with functional ages of 35 years or more, andthose aged 15 to 34 years, were more likely to report theirenvironmental factors (indoor air quality, air filtrationsystem, local exhaust system, heating system, air condi-tioning and acoustics) as poor than those from newerschools (functional ages of less than 5 years, or 5 to 14years). None of the respondents from schools aged 35years or more reported their environmental factors asexcellent. About 20 percent from schools with functionalages of 35 years or more reported their air filtrationsystem and air conditioning as poor.
Respondents from schools with functional ages of 35years or more, and those aged 15 to 34 years, were morelikely to report their major building feature conditions(roof, foundation and walls) as unsatisfactory (poor orborderline) than were those from newer schools (func-tional ages of 14 years or less). More than 50 percent ofrespondents from schools with functional ages of 35 yearsor more rated their roof as poor or borderline.
Older schools typically have worse building safety
conditions and building energy efficiency features thannewer schools. About 18 percent of respondents fromschools with functional ages of 35 years or more reportedthe fire alarms, smoke detectors and sprinkler systems aspoor, and about 23 percent reported the emergencylighting as borderline. More than 80 percent of respon-dents from schools with functional ages of 35 years ormore and 48 percent of those from schools aged 15 to 34years reported their building energy efficiency conditionas poor or borderline.
Respondents from schools with functional ages of 35years or more were more likely to report their buildingaccessibility as poor or borderline than those fromschools aged 34 or less. About 50 percent of respondentsfrom schools with functional ages of 35 years or morereported their handicapped accessibility, and vehicularentrances and exits as unsatisfactory, and more than 70percent reported their student drop-off area as poor orborderline.
Condition of TelecommunicationsReadiness
For this study, the researcher used the most recent PATIdata (school year of 2007-2008) to identify differences oftelecommunications readiness between urban and ruralschools in terms of Internet access, computer Internetconnectivity speed and processor capacity, and technol-ogy equipment in classrooms, labs, libraries and offices.
The researcher aggregated the data to the school districtlevel and used the school district technology data tofurther examine the relationship between telecommunica-tions conditions and school characteristics in rural schooldistricts.
Internet Access in the ClassroomA summary of the comparison of classroom Internet
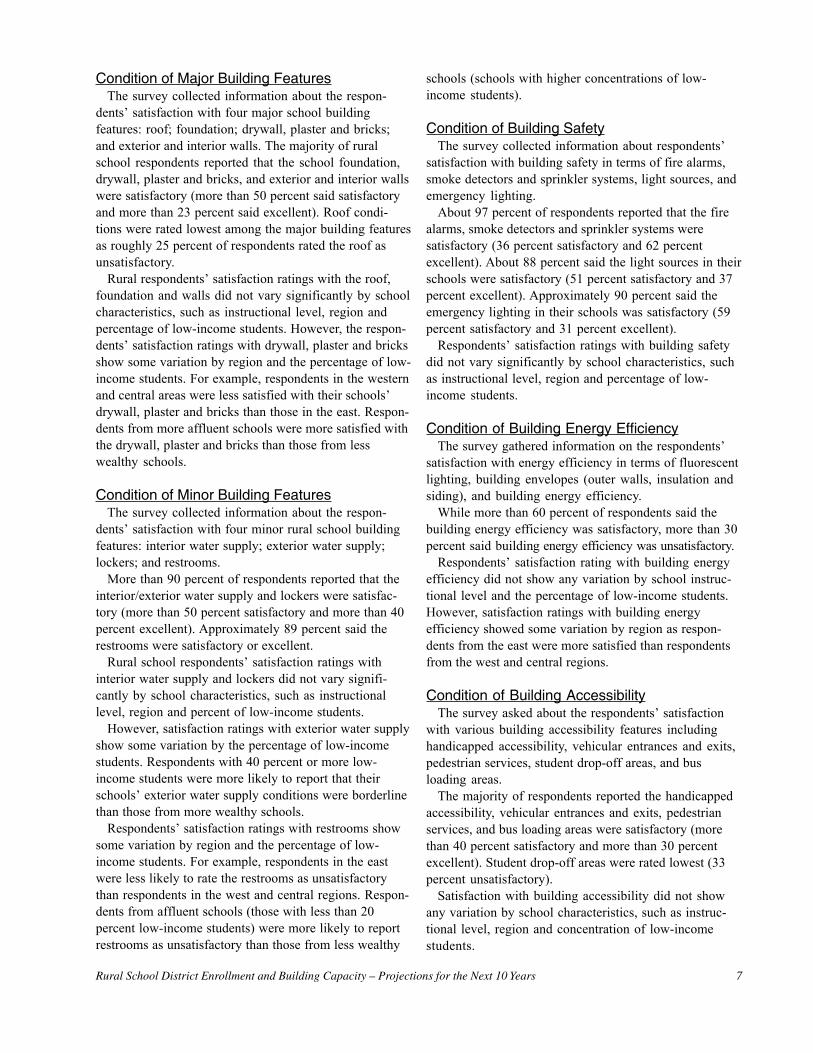
access by rural and urban schools is presented in Table 2.More than 67 percent of rural school classrooms wereequipped with wired Internet access, about 2 percent of
Table 2: Percentage of School Classrooms withInternet Access by Urban and Rural Schools
Note: T-test results indicated that there were no significantdifferences between urban and rural schools in classroom Internetaccess. Data Source: PDE PATI, 2007-2008.
Rural School District Enrollment and Building Capacity – Projections for the Next 10 Years 9
classrooms had wireless Internet access, and 30 percent ofclassrooms had both wired and wireless access. Therewere no significant differences between urban and ruralschools in classroom Internet access.
The condition of rural schools’ Internet access did notsignificantly differ by school characteristics, such asconcentration of low-income students and region, in mostsituations. However, rural schools in the east and centralregions had more stationary computer labs equipped withwireless Internet access than schools in the west.
Computer Internet Connectivity Speed andProcessor Capacity
Computer Internet connectivity speed and processorcapacity are important aspects of technology conditionsfor student learning.
In general, urban schools had more computers with highspeed connectivity-high capacity processors in class-rooms and library/media centers than rural schools. Urbanschools also had more computers in their stationarycomputer labs with high speed connectivity–low capac-ity processors than rural schools.
The number of computers located in mobile computerlabs and administrative offices and their connectivityspeed to the Internet and processor capacity did notsignificantly differ among urban and rural schools. Also,very few classrooms, computer labs, libraries and officesin urban and rural schools had computers still equippedwith dial-up connectivity to the Internet.
The condition of computer Internet connectivity speedand processor capacity in classrooms was further exam-ined by rural school characteristics. The number ofcomputers located in classrooms, stationary computerlabs, mobile computer labs, library/media centers andadministrative offices, and their connectivity speed and
processor capacity did not significantly differ by percent-age of low-income students.
Internet connectivity speed and processor capacity inrural classrooms showed some variation by region,however. Classrooms in the east had more computersequipped with high speed connectivity to the Internetand computers equipped with low capacity processorsthan those in the western and central regions.
Technology EquipmentTechnology equipment, such as electronic whiteboards,
data projectors, printers, digital cameras, digital videocameras and webcams, is important for student learning.
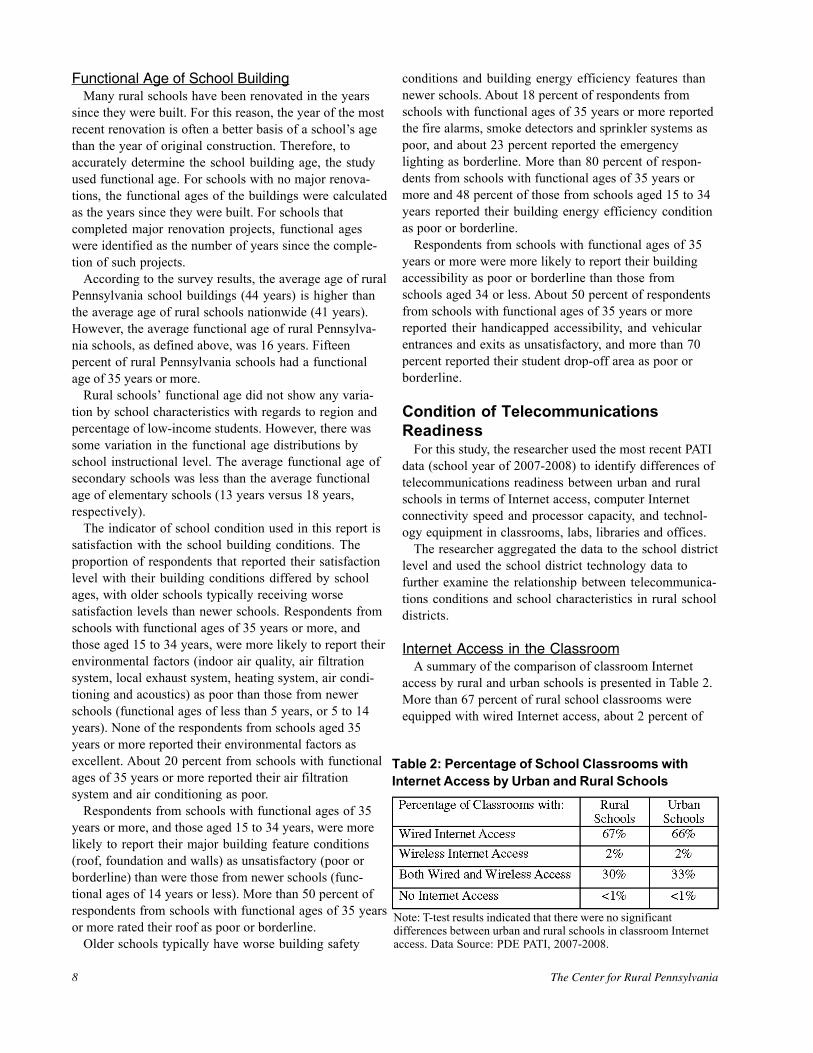
According to the research, there was no significantdifference between urban and rural schools in technologyequipment, expect for the higher number of printerslocated in urban school classrooms and mobile computerlabs than in rural school classrooms and mobile computerlabs (Table 3).
The results also indicate some variation in technologyequipment in rural schools by school characteristics, suchas concentration of low-income students and region. Forexample, more affluent rural schools (with less than 20percent of low-income students) were more likely to havemore digital cameras and digital video cameras in theirclassrooms, more electronic whiteboards in their station-ary computer labs, and more digital video cameras intheir library/media centers than those in less wealthyschools. Rural schools in the east had more data projec-tors with shared access than those in the western andcentral regions. Rural schools in the central region weremore likely to have more printers with shared access thanthose in the western and eastern regions.
Prediction of Enrollment ChangeUsing the most recent enrollment projection data (from
2006 to 2016), the researcher examined enrollmentchanges for rural schools over the next 5 and 10 years.Similar analyses were conducted for elementary andsecondary schools.
Enrollment Change for Rural SchoolsOver the next 5 years (from 2006 to 2011), enrollment
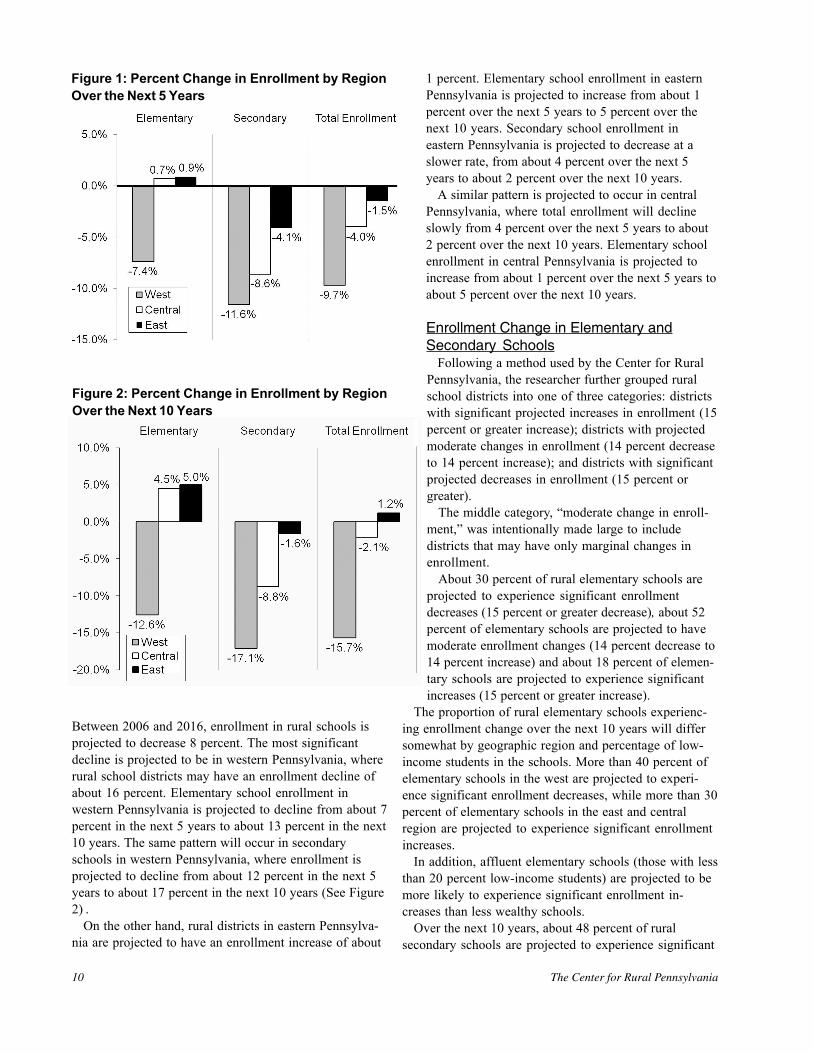
in rural schools is projected to decrease 6 percent. Themost significant decline is projected to be in westernPennsylvania, where rural school districts may see anenrollment decline of about 10 percent. Schools in thecentral region are projected to have a 4 percent decline,and schools in the eastern region are projected to have anenrollment decline of about 2 percent (See Figure 1 onPage 10).
Over the next 10 years (from 2006 to 2016), ruralschool enrollment is projected to continue its decline.
Table 3: Average Number of Technology Equip-ment Located Per Classroom by Urban and RuralSchools
Note: * T-test results indicated no significant differences in thenumber of technology equipment in urban and rural schools,except that urban school classrooms have more printers than ruralschool classrooms. Data Source: PDE, PATI, 2007-2008.
10 The Center for Rural Pennsylvania
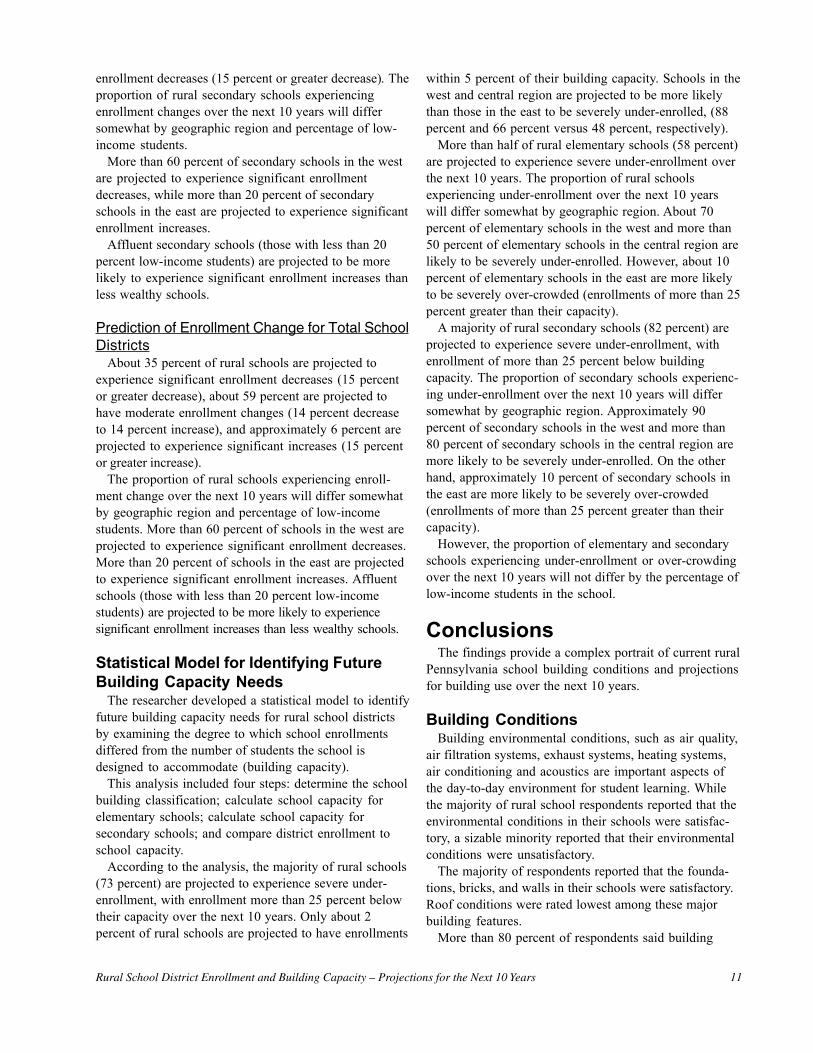
Between 2006 and 2016, enrollment in rural schools isprojected to decrease 8 percent. The most significantdecline is projected to be in western Pennsylvania, whererural school districts may have an enrollment decline ofabout 16 percent. Elementary school enrollment inwestern Pennsylvania is projected to decline from about 7percent in the next 5 years to about 13 percent in the next10 years. The same pattern will occur in secondaryschools in western Pennsylvania, where enrollment isprojected to decline from about 12 percent in the next 5years to about 17 percent in the next 10 years (See Figure2) .
On the other hand, rural districts in eastern Pennsylva-nia are projected to have an enrollment increase of about
1 percent. Elementary school enrollment in easternPennsylvania is projected to increase from about 1percent over the next 5 years to 5 percent over thenext 10 years. Secondary school enrollment ineastern Pennsylvania is projected to decrease at aslower rate, from about 4 percent over the next 5years to about 2 percent over the next 10 years.
A similar pattern is projected to occur in centralPennsylvania, where total enrollment will declineslowly from 4 percent over the next 5 years to about2 percent over the next 10 years. Elementary schoolenrollment in central Pennsylvania is projected toincrease from about 1 percent over the next 5 years toabout 5 percent over the next 10 years.
Enrollment Change in Elementary andSecondary Schools
Following a method used by the Center for RuralPennsylvania, the researcher further grouped ruralschool districts into one of three categories: districtswith significant projected increases in enrollment (15percent or greater increase); districts with projectedmoderate changes in enrollment (14 percent decreaseto 14 percent increase); and districts with significantprojected decreases in enrollment (15 percent orgreater).
The middle category, “moderate change in enroll-ment,” was intentionally made large to includedistricts that may have only marginal changes inenrollment.
About 30 percent of rural elementary schools areprojected to experience significant enrollmentdecreases (15 percent or greater decrease), about 52percent of elementary schools are projected to havemoderate enrollment changes (14 percent decrease to14 percent increase) and about 18 percent of elemen-tary schools are projected to experience significantincreases (15 percent or greater increase).
The proportion of rural elementary schools experienc-ing enrollment change over the next 10 years will differsomewhat by geographic region and percentage of low-income students in the schools. More than 40 percent ofelementary schools in the west are projected to experi-ence significant enrollment decreases, while more than 30percent of elementary schools in the east and centralregion are projected to experience significant enrollmentincreases.
In addition, affluent elementary schools (those with lessthan 20 percent low-income students) are projected to bemore likely to experience significant enrollment in-creases than less wealthy schools.
Over the next 10 years, about 48 percent of ruralsecondary schools are projected to experience significant
Figure 1: Percent Change in Enrollment by RegionOver the Next 5 Years
Figure 2: Percent Change in Enrollment by RegionOver the Next 10 Years
Rural School District Enrollment and Building Capacity – Projections for the Next 10 Years 11
enrollment decreases (15 percent or greater decrease). Theproportion of rural secondary schools experiencingenrollment changes over the next 10 years will differsomewhat by geographic region and percentage of low-income students.
More than 60 percent of secondary schools in the westare projected to experience significant enrollmentdecreases, while more than 20 percent of secondaryschools in the east are projected to experience significantenrollment increases.
Affluent secondary schools (those with less than 20percent low-income students) are projected to be morelikely to experience significant enrollment increases thanless wealthy schools.
Prediction of Enrollment Change for Total SchoolDistricts
About 35 percent of rural schools are projected toexperience significant enrollment decreases (15 percentor greater decrease), about 59 percent are projected tohave moderate enrollment changes (14 percent decreaseto 14 percent increase), and approximately 6 percent areprojected to experience significant increases (15 percentor greater increase).
The proportion of rural schools experiencing enroll-ment change over the next 10 years will differ somewhatby geographic region and percentage of low-incomestudents. More than 60 percent of schools in the west areprojected to experience significant enrollment decreases.More than 20 percent of schools in the east are projectedto experience significant enrollment increases. Affluentschools (those with less than 20 percent low-incomestudents) are projected to be more likely to experiencesignificant enrollment increases than less wealthy schools.
Statistical Model for Identifying FutureBuilding Capacity Needs
The researcher developed a statistical model to identifyfuture building capacity needs for rural school districtsby examining the degree to which school enrollmentsdiffered from the number of students the school isdesigned to accommodate (building capacity).
This analysis included four steps: determine the schoolbuilding classification; calculate school capacity forelementary schools; calculate school capacity forsecondary schools; and compare district enrollment toschool capacity.
According to the analysis, the majority of rural schools(73 percent) are projected to experience severe under-enrollment, with enrollment more than 25 percent belowtheir capacity over the next 10 years. Only about 2percent of rural schools are projected to have enrollments
within 5 percent of their building capacity. Schools in thewest and central region are projected to be more likelythan those in the east to be severely under-enrolled, (88percent and 66 percent versus 48 percent, respectively).
More than half of rural elementary schools (58 percent)are projected to experience severe under-enrollment overthe next 10 years. The proportion of rural schoolsexperiencing under-enrollment over the next 10 yearswill differ somewhat by geographic region. About 70percent of elementary schools in the west and more than50 percent of elementary schools in the central region arelikely to be severely under-enrolled. However, about 10percent of elementary schools in the east are more likelyto be severely over-crowded (enrollments of more than 25percent greater than their capacity).
A majority of rural secondary schools (82 percent) areprojected to experience severe under-enrollment, withenrollment of more than 25 percent below buildingcapacity. The proportion of secondary schools experienc-ing under-enrollment over the next 10 years will differsomewhat by geographic region. Approximately 90percent of secondary schools in the west and more than80 percent of secondary schools in the central region aremore likely to be severely under-enrolled. On the otherhand, approximately 10 percent of secondary schools inthe east are more likely to be severely over-crowded(enrollments of more than 25 percent greater than theircapacity).
However, the proportion of elementary and secondaryschools experiencing under-enrollment or over-crowdingover the next 10 years will not differ by the percentage oflow-income students in the school.
ConclusionsThe findings provide a complex portrait of current rural
Pennsylvania school building conditions and projectionsfor building use over the next 10 years.
Building ConditionsBuilding environmental conditions, such as air quality,
air filtration systems, exhaust systems, heating systems,air conditioning and acoustics are important aspects ofthe day-to-day environment for student learning. Whilethe majority of rural school respondents reported that theenvironmental conditions in their schools were satisfac-tory, a sizable minority reported that their environmentalconditions were unsatisfactory.
The majority of respondents reported that the founda-tions, bricks, and walls in their schools were satisfactory.Roof conditions were rated lowest among these majorbuilding features.
More than 80 percent of respondents said building

12 The Center for Rural Pennsylvania
safety features, such as fire alarms, smoke detectors, andemergency lighting, were satisfactory. And, while morethan 60 percent said that building energy efficiency wassatisfactory, more than 30 percent said it was unsatisfac-tory.
The majority of respondents reported that handicapaccessibility, vehicular entrances and exits, pedestrianservices, and bus loading areas were satisfactory. Studentdrop-off areas were rated lowest: one-third of schoolsreported that student drop-off areas were unsatisfactory.
Respondents’ satisfaction ratings with buildingconditions showed some variation by the percentage oflow-income students. Respondents from affluent schoolswere more satisfied with the drywall, plaster and bricksthan those from less wealthy schools. Respondents fromless wealthy schools (with 40 percent and above low-income students) were more likely to report their exteriorwater supply conditions as borderline than more wealthyschools.
Building AgeRural school buildings, with an average age of 44
years, tended to be older than the national average age ofrural schools (41 years). The average functional age ofrural schools, defined as the number of years since thecompletion of major renovations, was 16 years. Fifteenpercent of rural schools had a functional age of 35 yearsor more.
Rural schools’ functional age did not show any varia-tion by school characteristics, with regard to region andpercentage of low-income students. The average func-tional age of secondary schools was younger than theaverage functional age of elementary schools (13 yearsversus 18 years).
The results showed that respondents from older schoolstypically reported worse school building conditions thanthose from newer schools. None of the respondents fromschools aged 35 years or more said their environmentalfactors were in excellent condition. About 20 percentfrom schools with functional ages of 35 years or morereported their air filtration system and air conditioning aspoor, and more than half from schools with functionalages of 35 years or more reported their roof as poor orborderline.
Older schools typically have worse building safetyconditions and building energy efficiency features thannewer schools. About 18 percent of respondents fromschools with functional ages of 35 years or more reportedtheir fire alarms, smoke detectors and sprinkler systems aspoor and about 23 percent reported their emergencylighting as borderline. More than 80 percent of respon-dents from schools with functional ages of 35 years or
more reported their building energy efficiency conditionas poor or borderline.
Respondents from schools with functional ages of 35years or more were more likely to report their buildingaccessibility as poor or borderline than those fromschools aged 34 or less. About half of the respondentsfrom older schools reported their handicapped accessibil-ity, and vehicular entrances and exits as unsatisfactoryand more than 70 percent said their student drop-off areaswere poor or borderline.
Condition of Telecommunication in RuralSchool Buildings
The majority of rural schools were equipped with wiredInternet access. More than 33 percent were equipped withboth wired and wireless access. However, there was a gapbetween urban and rural schools in the condition oftelecommunications. Rural schools had fewer computerswith high speed connectivity-high capacity processors inclassrooms and library/media centers than urban schools.There were fewer printers located in rural school class-rooms and mobile computer labs than those in urbanschools.
The technology equipment in rural schools also hadsome variations by school characteristics, such as theconcentration of low-income students. More affluent ruralschools (with less than 20 percent of low-income stu-dents) were more likely to have more digital cameras anddigital video cameras in their classroom, more electronicwhiteboards in their stationary computer labs, and moredigital video cameras in their library/media centers thanthose in less wealthy schools.
Prediction of Enrollment ChangeOver the next 10 years, rural school enrollment is
projected to decrease 8 percent. The most significantdecline is projected to be in western Pennsylvania, whererural school districts are projected to have a 16 percentdecline in enrollment. Enrollment in elementary andsecondary schools in western Pennsylvania is projectedto decline about 13 percent and 17 percent, respectively.
About 30 percent of rural elementary schools and 48percent of secondary schools are projected to experiencesignificant enrollment decreases (15 percent or greaterdecrease). The proportion of rural elementary andsecondary schools experiencing enrollment changes overthe next 10 years will differ somewhat by geographicregion and percentage of low-income students. More than40 percent of elementary schools and more than 60percent of secondary schools in the west are projected toexperience significant enrollment decreases, while morethan 30 percent of elementary schools and more than 20
Rural School District Enrollment and Building Capacity – Projections for the Next 10 Years 13
percent of secondary schools in the east are projected toexperience significant enrollment increases.
In addition, affluent elementary and secondary schools(those with less than 20 percent low-income students) areprojected to be more likely to experience significantenrollment increases than less wealthy schools.
Policy ConsiderationsBased on the study findings, the researcher recommends
the following policy considerations.
The Pennsylvania Department of Education and schooldistricts should consider establishing a reporting systemto effectively monitor school building conditions andconducting ongoing inventory assessments of statewidefacilities.
To effectively monitor and enhance school facilityconditions in rural Pennsylvania, PDE should considercreating a comprehensive set of minimum standards forfacility conditions and conducting ongoing inventoriesof statewide facilities. By providing an inventory ofexisting conditions among rural schools in Pennsylvania,state government officials will have the details they needto make informed decisions about future educationalneeds.
At the local level, school districts should also considerevaluating and estimating their school building condi-tions regularly and release these evaluations to thepublic. Currently, the review of school building condi-tions is at the discretion of each district. Most districtsinclude a section on buildings and grounds in their 5-year strategic plans, but they are not bound to completeanything in those plans. School districts are required toformally evaluate the conditions of their buildings if theyseek reimbursement through PDE for any renovation orconstruction projects.
School districts should provide a clear estimate of theirbuilding construction or repair needs, along with a planfor raising the funds to meet those needs. The evaluationshould provide information about building age, physicalcondition, telecommunications readiness, safety accessi-bility, and energy efficiency.
School districts should rethink under-used schoolbuildings and maximize public use of school facilities.
As the survey results indicate, the majority of ruralschools will experience severe under-enrollment over thenext 10 years, with enrollment more than 25 percentbelow capacity. Elementary and secondary schools in thewest and central regions are projected to be more likelythan those in the east to be severely under-enrolled.Taking full advantage of school buildings with extra
space to meet today’s educational program needs areimportant challenges for rural school districts.
School districts may need to consider consolidatingschools. However, school districts could also takeadvantage of extra space in their buildings by offeringcommunity programs. School district officials and localcommunities could work together to look for ways to usethe school facilities and creatively support or finance avariety of shared programs, such as adult education, jobtraining, technology training, and health fitness centers.
PDE and school districts should consider the changingface of student learning environments to accuratelyassess building capacity needs.
Another issue that makes it important for schooldistricts to prepare for future needs is the changing face ofstudent learning environments. As the study resultsindicate, many rural schools appeared to be under-used.However, the current PDE formula for school capacitydoes not always account for the full range of programsthat may be offered in rural schools. For example, federalregulations require a limited number of students withspecial education needs in the classroom. With currentinclusion practices, special education students aremainstreamed back into the regular classroom. Thissituation not only requires the school administration toeffectively use the classroom, but also challenges thecurrent PDE school capacity formula, which did notconsider this factor.
Also, current instructional methods encourage many“hands on” activities, which require more space in theclassroom. Many old buildings in rural schools wereoriginally designed for fixed rows of desks for wholeclass lectures and may not accommodate the new instruc-tional methods of small-group, hands-on activities.
Technology improvements could also reduce thenumber of seats that may reasonably fit into a regularclassroom. For example, current technology improve-ments require more computers in the classroom, whichmay also take more space than the traditional deskarrangement.
14 The Center for Rural Pennsylvania
ReferencesIlsley, P. S. (2002). The Use of the Moving Average Forecasting, Linear Trend Forecasting, and Exponential Smooth-
ing Forecasting Techniques in Education. (pp. 99): University of Southern California.Lawrence, B. K. (2001). Effects of State Policies on Facilities Planning and Construction in Rural Districts. In
Planning (Ed.): United States Government.National Center for Education Statistics (NCES). (1999) Age of Public Schools Based Upon Years Since Construction
of The Main Instructional Building(s), Years Since Most Recent Major Renovation, and Functional Age of TheSchool, by School Characteristics: 1999. Navigating resources for Rural Schools. Retrieved July26, 2005, fromhttp://necs.ed.gov/surveys/ruraled/data/Age_of_Schools.asp.
NCES. (1999) Condition of America’s Public School Facilities: 1999. Retrieved July 26, 2005 from http://nces.ed.gov/pubs2000/2000032.pdf.
NCES. (2002) Digest of Education Statistics Tables and Figures. Retrieved July 26, 2005 from http://nces.ed.gov/programs/digest/d02/dt419.asp.
NCES. (2005) Overcrowding. Retrieved July 26, 2005 from http://nces.ed.gov/surveys/frss/publications/2000032/8.asp.
Neblock, C.S. (1996) The Conceptualization, Development, and Evaluation of a National Categorical EnrollmentProjection Model (pp. 221). Texas Tech University.
Pennsylvania Department of Education. (2001) The Enrollment Projection Model. Retrieved August 10, 2005 fromhttp://enrlproj.ed.state.pa.us/PROJECT.htm.
Pennsylvania Department of Education. (2001) PA Department of Education Enrollment Projections. Retrieved August14, 2005 from http://enrlproj.ed.state.pa.us/.
Pennsylvania Department of Education. (2003) Academic Standards for The Arts and Humanities. Retrieved August10, 2005 from http://www.pde.state.pa.us/stateboard_ed/lib/stateboard_ed/art.pdf
Pennsylvania Department of Education. (2005a) The Enrollment Projection Model. Retrieved August 15, 2005 fromhttp://enrlproj.ed.state.pa.us/PROJECT.htm.
Pennsylvania Department of Education. (2005b) Reimbursement Examples. Retrieved August 15, 2005 from http://www.pde.state.pa.us/constr_facil/cwp/view.asp?a=11&Q=61127.
Peters, S. R. (1997) A Teaching Case for Developing a Facility Utilization Plan (p. 179). Columbia University Teach-ers College.
Sack, J. L. (2004) “Costs Climb on Materials for Schools.” Education Week, 24(1), 1-24.The Center for Rural Pennsylvania. (2005) County Profiles. Retrieved from http://www.ruralpa2.org/
county_profies.cfm.The Center for Rural Pennsylvania. (2005) Trends in Rural School Enrollment: A 20-Year Perspective. Retrieved from
http://www.ruralpa.org/school_enrollment_projections.pdf.


The Center for Rural Pennsylvania200 North Third St., Suite 600Harrisburg, PA 17101Phone: (717) 787-9555Fax: (717) 772-3587www.ruralpa.org1P0909 – 400