road to climate resiliency: the at&t story · climate change overview climate change affects...
TRANSCRIPT

ROAD TO CLIMATE RESILIENCY:
THE AT&T STORY Climate change is one of the world’s most pressing challenges,
and weather events associated with climate change pose a
significant threat to the safety of communities and infrastructure
everywhere. Because AT&T believes businesses can be part of
the solution, it is pushing for progress by working with the U.S.
Department of Energy’s Argonne National Laboratory to help pave
the way toward greater climate resiliency and by the development
of AT&T’s Climate Change Analysis Tool. Using data analysis,
predictive modeling, and visualization, this tool enables AT&T to
react to climate changes by making the adaptations necessary to
help increase safety, service, and connectivity for its employees,
customers, and communities. Being the first in the telecom
industry to publicly embark on such an effort, AT&T understands
how difficult it is to access usable climate change data. That is why
AT&T and Argonne will also be making the climate data that powers
the tool available for public use. By sharing this data, AT&T and
Argonne hope to enable others—such as municipalities, utilities,
and universities—to become more climate resilient.
Copyright 2019 AT&T Intellectual Property. All rights reserved.

ROAD TO CLIMATE RESILIENCY: THE AT&T STORY
2
CLIMATE CHANGE OVERVIEWClimate change affects peoples’ daily lives in many ways. For example, people may notice unseasonably warm or unpredictable weather, or pay higher food prices at their grocery stores. The Universal Ecological Fund (FEU-US) released a report linking food availability and price increases to severe climate-related events such as more frequent and intense droughts and flooding.i People may also hear climate change discussed around the globe, and scientific research such as the 2018 Intergovernmental Panel on Climate Change (IPCC) report warns that the world must cut carbon emissions 45% below 2010 levels by 2030 or risk irreversible effects to the environment.ii Throughout the world, people are experiencing the effects of climate change in their own backyard with the destruction of homes, businesses, and cities in the wake of climate-related weather and natural disasters. This will continue as the future impacts of climate change will include a rise in temperatures and sea levels, changes in precipitation patterns, more droughts and heat waves, more intense hurricanes, and continued artic ice melt.iii
Notably, the way recent natural disasters have impacted infrastructure and human life has been unprecedented. From 2016–2018, the southeastern region of the U.S. endured catastrophic hurricanes including Matthew, Irma, Maria, and Michael.
As these numbers compound upon each other, factoring climate resiliency into current and future infrastructure projects becomes increasingly critical for communities, and companies like AT&T. Vulnerable regions such as the southeastern U.S. face a persistent need for proactive resilience planning. Anticipating, adapting to, and recovering from the impacts of climate change will only become more difficult and costlier in the future if left unchecked. That is why responsible companies, communities, and institutions are analyzing risks to protect their employees, assets, and customer experiences in the face of climate change.
The 2,975 deaths that occurred in Puerto Rico because of Hurricane Maria place Maria among the top-five deadliest disasters in U.S. history.iv
Hurricane Irma is the strongest hurricane on record globally, with sustained winds of 185 mph for more than 36 hours.v
2017 was the costliest year ever as damage to U.S. infrastructure resulting from natural disasters totaled $306.2 billion in cumulative damages.vi
The number of extreme weather events causing at least $1 billion in economic losses has increased from 21 in the 1980s and 38 in the 1990s, to 92 from 2007 to 2016.vii
The southeastern U.S. faces a trend of increasing precipitation—already experiencing a 27% change in precipitation levels from 1958 to 2016.viii
ROAD TO CLIMATE RESILIENCY: THE AT&T STORY
3
THE ROAD TO CLIMATE RESILIENCYAT&T knows businesses can play a role in the global collaborative effort to address climate-related change. It is committed to helping care for the planet and is working to help mitigate climate impacts. For example:
• In 2015, AT&T set a 10x carbon reduction goal to enable carbon savings 10 times the footprint of its operations by 2025.ix
• Since 2010, AT&T has implemented more than 83,000 energy efficiency projects, resulting in annualized savings of $575 million for the company.x
• By the end of 2017, AT&T reduced fleet emissions by 174,403 metric tons of CO2, reduced the size of its domestic fleet by 1,100 vehicles, and has committed to reduce its fleet emissions 30% by 2020.xi
• AT&T is also one of the largest corporate purchasers of renewable energy in the country as demonstrated by its investments to help deliver up to 820 megawatts (MW) of wind energy per year. If AT&T is successful, the clean energy produced will enable a reduction in greenhouse gas emissions equivalent to taking more than 530,000 cars off the road a year. xii
More information on AT&T’s climate mitigation efforts can be found in AT&T’s annual sustainability reporting.
However, in today’s changing environment, AT&T recognizes it must take steps now to help ensure
the resiliency of its business, its customers, and its communities. From adapting how the company chooses where to place new infrastructure such as fiber and cell sites, to enhancing current network redundancy in disaster-prone areas, the climate planning and adaptations AT&T undertakes today will help boost its climate resiliency for years to come—and help the company deliver on its commitment to safety, service, and connectivity. But how are the most needed adaptations determined? This is the story of how AT&T worked with Argonne National Laboratory to derive cutting-edge forecast data and developed its Climate Change Analysis Tool to map those climate forecasts onto AT&T facilities and infrastructure to help AT&T make smarter, climate-informed decisions and better serve its customers and communities.
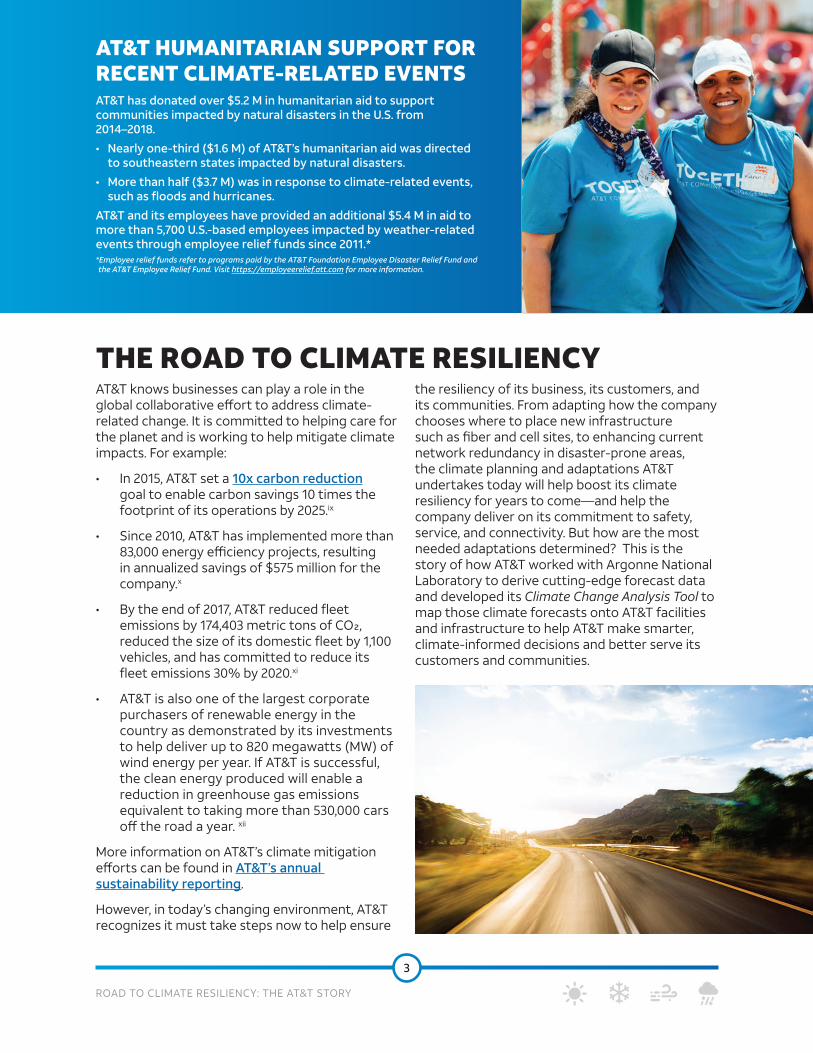
AT&T HUMANITARIAN SUPPORT FOR RECENT CLIMATE-RELATED EVENTS AT&T has donated over $5.2 M in humanitarian aid to support communities impacted by natural disasters in the U.S. from 2014–2018.
• Nearly one-third ($1.6 M) of AT&T’s humanitarian aid was directed to southeastern states impacted by natural disasters.
• More than half ($3.7 M) was in response to climate-related events, such as floods and hurricanes.
AT&T and its employees have provided an additional $5.4 M in aid to more than 5,700 U.S.-based employees impacted by weather-related events through employee relief funds since 2011.**Employee relief funds refer to programs paid by the AT&T Foundation Employee Disaster Relief Fund and the AT&T Employee Relief Fund. Visit https://employeerelief.att.com for more information.
ROAD TO CLIMATE RESILIENCY: THE AT&T STORY
4
“WITHOUT ADAPTATION, CLIMATE CHANGE WILL CONTINUE TO DEGRADE INFRASTRUCTURE PERFORMANCE OVER THE REST OF THE CENTURY, WITH THE POTENTIAL FOR CASCADING IMPACTS THAT THREATEN OUR ECONOMY, NATIONAL SECURITY, ESSENTIAL SERVICES, AND HEALTH AND WELL-BEING.” XIII
The Fourth National Climate Assessment, the U.S. Global Change Research Program’s mandated report to United States Congress and President

ROAD TO CLIMATE RESILIENCY: THE AT&T STORY
5
AT&T’S CLIMATE CHANGE ANALYSIS TOOLRESILIENCY ASSESSMENTI.
The idea: create a tool that can visually layer AT&T’s physical asset data upon future climate impact data to help AT&T ensure safety, service, and connectivity in current and future build plans. The pursuit of this tool was spearheaded by Shannon T. Carroll, Director of Environmental Sustainability at AT&T. In his role with the company’s Corporate Social Responsibility (CSR) team, Carroll works across the business to strengthen its environmental business practices. “We knew it was time for AT&T to take a deep dive into what we were doing as a company to plan for the long-term impacts of climate change,” says Carroll on taking the first step of conducting an assessment of AT&T’s climate resiliency practices. “We received an independent, unbiased, and credible point of view. It provided validation of some thoughts and challenged others, which is a good thing.”
KEY FINDINGS OF RESILIENCY ASSESSMENT:
AREA OF FOCUS STRENGTH RECOMMENDATION
Expand long-term planning to include and account for
climate change
AT&T’s data, analytic, and technological resources
Leverage capabilities to develop a climate risk
tool to enable long-term climate resiliency
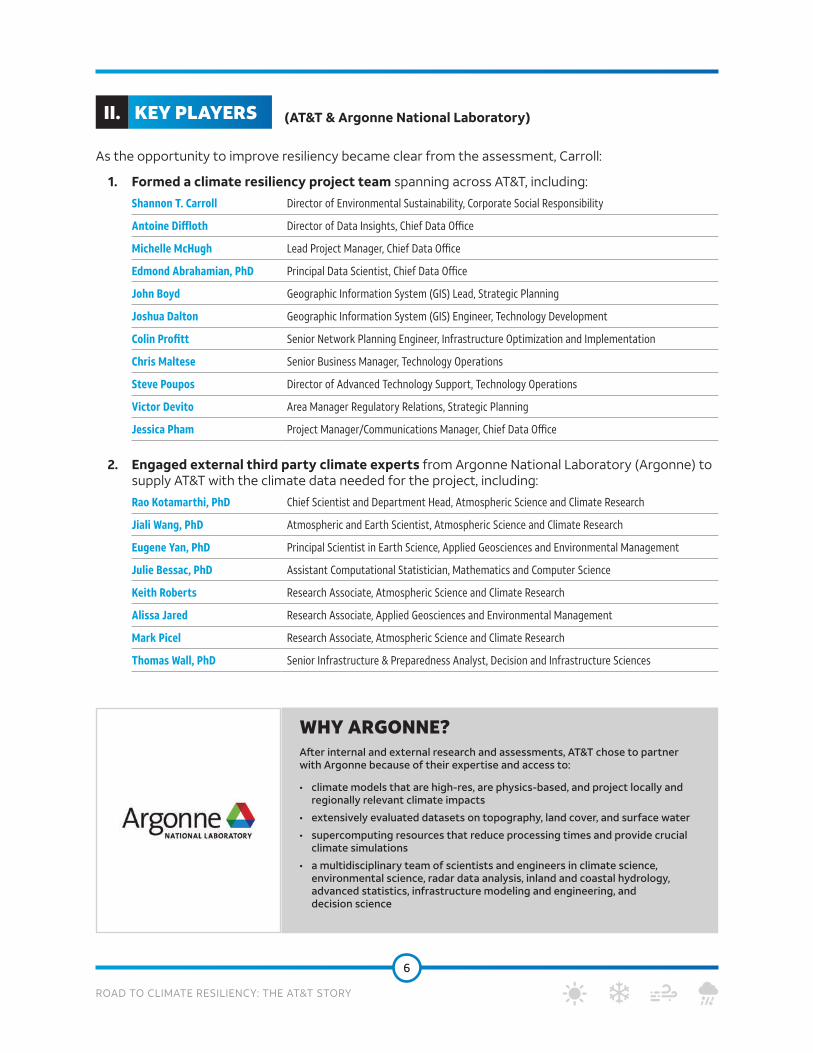
KEY PLAYERS II. (AT&T & Argonne National Laboratory)
As the opportunity to improve resiliency became clear from the assessment, Carroll:
1. Formed a climate resiliency project team spanning across AT&T, including:
Shannon T. Carroll Director of Environmental Sustainability, Corporate Social Responsibility
Antoine Diffloth Director of Data Insights, Chief Data Office
Michelle McHugh Lead Project Manager, Chief Data Office
Edmond Abrahamian, PhD Principal Data Scientist, Chief Data Office
John Boyd Geographic Information System (GIS) Lead, Strategic Planning
Joshua Dalton Geographic Information System (GIS) Engineer, Technology Development
Colin Profitt Senior Network Planning Engineer, Infrastructure Optimization and Implementation
Chris Maltese Senior Business Manager, Technology Operations
Steve Poupos Director of Advanced Technology Support, Technology Operations
Victor Devito Area Manager Regulatory Relations, Strategic Planning
Jessica Pham Project Manager/Communications Manager, Chief Data Office
2. Engaged external third party climate experts from Argonne National Laboratory (Argonne) to supply AT&T with the climate data needed for the project, including:
Rao Kotamarthi, PhD Chief Scientist and Department Head, Atmospheric Science and Climate Research
Jiali Wang, PhD Atmospheric and Earth Scientist, Atmospheric Science and Climate Research
Eugene Yan, PhD Principal Scientist in Earth Science, Applied Geosciences and Environmental Management
Julie Bessac, PhD Assistant Computational Statistician, Mathematics and Computer Science
Keith Roberts Research Associate, Atmospheric Science and Climate Research
Alissa Jared Research Associate, Applied Geosciences and Environmental Management
Mark Picel Research Associate, Atmospheric Science and Climate Research
Thomas Wall, PhD Senior Infrastructure & Preparedness Analyst, Decision and Infrastructure Sciences
WHY ARGONNE? After internal and external research and assessments, AT&T chose to partner with Argonne because of their expertise and access to:
• climate models that are high-res, are physics-based, and project locally and regionally relevant climate impacts
• extensively evaluated datasets on topography, land cover, and surface water
• supercomputing resources that reduce processing times and provide crucial climate simulations
• a multidisciplinary team of scientists and engineers in climate science, environmental science, radar data analysis, inland and coastal hydrology, advanced statistics, infrastructure modeling and engineering, and decision science
ROAD TO CLIMATE RESILIENCY: THE AT&T STORY
6

ROAD TO CLIMATE RESILIENCY: THE AT&T STORY
7
SCOPEIII.
A project scope was solidified to begin developing a tool that would help AT&T analyze and visualize future climate change impacts in regions within the U.S. Due to this region’s susceptibility to Atlantic hurricanes, AT&T narrowed the scope to four priority states within the southeastern U.S., and Argonne delivered forecast data that predicted the likelihood and level of severity for four priority climate impacts.xiv
SCOPE Understand the impact of climate change on AT&T’s products and services and create a tool to visualize climate change impacts on AT&T assets by:
1. Better understanding the climate risk and resiliency challenges of a company with significant infrastructure investment
2. Creating climate datasets to address the risk profiles relevant to AT&T’s business
3. Developing actionable high spatial resolution climate data products for use in AT&T’s Climate Change Analysis Tool
4. Identifying research and data gaps for continued development of climate data and science products to address identified risks and resiliency challenges
NORTH CAROLINA
SOUTHCAROLINA
GEORGIA
FLORIDA
PRIORITY STATES PRIORITY CLIMATE IMPACTS
Inland Flooding Caused by Increased Precipitation
Additional Coastal Flooding Caused by Sea Level Rise and Hurricane Surge
High-Intensity Winds (Non-Hurricane)
High Intensity Winds (Hurricane)

ROAD TO CLIMATE RESILIENCY: THE AT&T STORY
8
SCIENTIFIC APPROACHESIV.
1. ToolsArgonne used three major regional-scale climate environment models to deliver on the project scope:
a. The Weather Research and Forecasting Model (WRF) was developed by the National Center for Atmospheric Research (NCAR) and was used to create the foundational dataset of dynamically downscaled historic and future climate information over North America.
b. The WRF-Hydro® (Version 5) Model was run at a spatial resolution of 200 meters using the output generated from the WRF downscaled climate output to simulate historic and future inland hydrology and flooding. “The 200m spatial resolution of the WRF- Hydro® simulations was informed and enabled by a number of factors, including the types of flood risks of greatest concern to AT&T, the availability of baseline input data for the hydrological simulations, and the availability of advanced computational resources. The 200m spatial resolution generates sufficiently detailed outcomes to inform local decisions, while maintaining statistically robust outcomes needed for extreme value analysis,” said Rao Koramarthi, Chief Scientist and Department head at Argonne.
c. The ADvanced Hydrodynamical CIRCulation Model (ADCIRC) was used to perform coastal flooding simulations, with input from the WRF downscaled climate projections and historical data for the recent major hurricane events to drive those simulations. ADCIRC uses unstructured gridding and extremely high resolution (approximately 50 meters).
To develop its high-resolution, regional climate model projections for North America (WRF Model), Argonne dynamically downscaled existing global climate model simulations that were developed for the United Nations Intergovernmental Panel on Climate Change (IPCC) Fifth Assessment Report (AR5). This global climate dataset is known as the CMIP5 repository.
The CMIP5 global climate data was regionally downscaled for a business-as-usual carbon emission scenario, known as RCP 8.5, and a second case, known as RCP 4.5, that is closer to the Paris Agreement (2015). Under RCP 8.5, it is expected that the total atmospheric concentration of CO2 will be more than double current concentrations by 2100.
2. Computational PowerArgonne is home to world-class high-performance computing systems, which allow Argonne climate scientists to run large-scale climate simulations in an exceptionally short amount of time. Computations for the project were performed on leadership computing facilities operated by the U.S. Department of Energy at Argonne and at the National Energy Research Scientific Computing Center. These simulations project future climate on an hourly basis, decades into the future. For example, simulating one year of future climate in the four priority states would require more than 4,000 hours of computation time on a standard computer. On the AT&T project, Argonne made use of more than 30 years of data for future climate in the four priority states. While the total computing time was in excess of 50 million core hours, when run on Argonne’s supercomputers, it was completed in a matter of months. The hydrological simulations for inland flooding were performed using a version of the WRF-Hydro® model, using Argonne supercomputing resources.
ROAD TO CLIMATE RESILIENCY: THE AT&T STORY
9
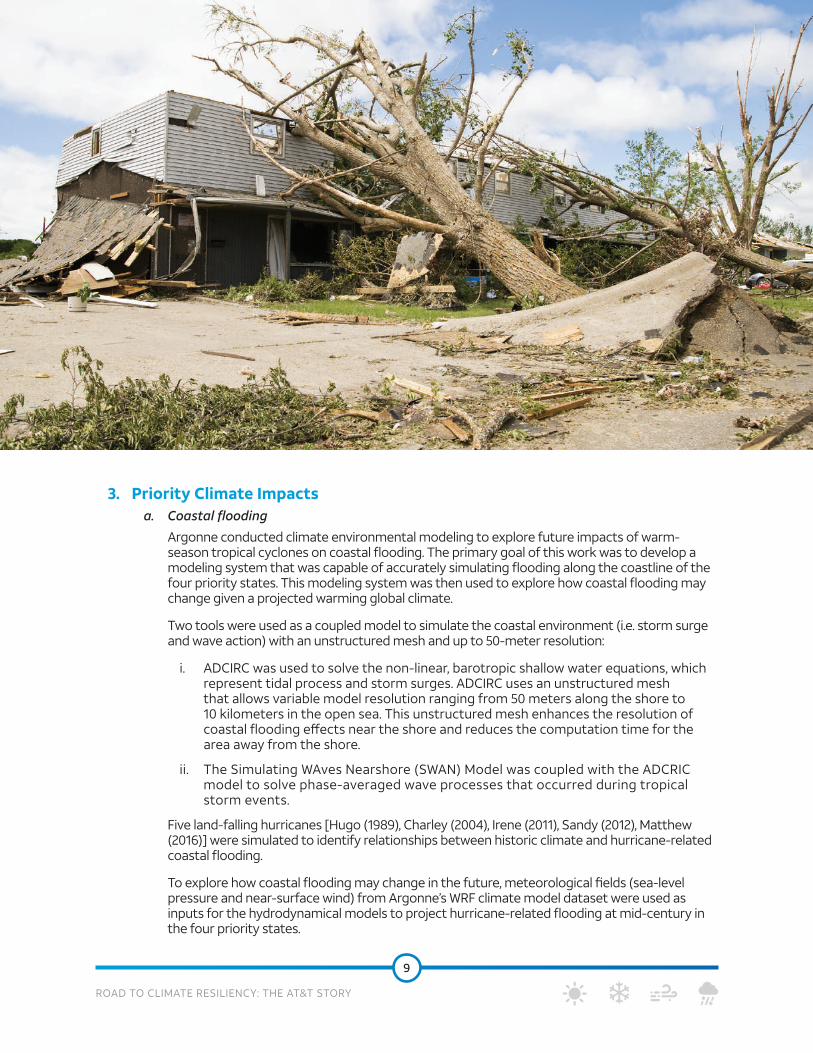
3. Priority Climate Impactsa. Coastal flooding
Argonne conducted climate environmental modeling to explore future impacts of warm-season tropical cyclones on coastal flooding. The primary goal of this work was to develop a modeling system that was capable of accurately simulating flooding along the coastline of the four priority states. This modeling system was then used to explore how coastal flooding may change given a projected warming global climate.
Two tools were used as a coupled model to simulate the coastal environment (i.e. storm surge and wave action) with an unstructured mesh and up to 50-meter resolution:
i. ADCIRC was used to solve the non-linear, barotropic shallow water equations, which represent tidal process and storm surges. ADCIRC uses an unstructured mesh that allows variable model resolution ranging from 50 meters along the shore to 10 kilometers in the open sea. This unstructured mesh enhances the resolution of coastal flooding effects near the shore and reduces the computation time for the area away from the shore.
ii. The Simulating WAves Nearshore (SWAN) Model was coupled with the ADCRIC model to solve phase-averaged wave processes that occurred during tropical storm events.
Five land-falling hurricanes [Hugo (1989), Charley (2004), Irene (2011), Sandy (2012), Matthew (2016)] were simulated to identify relationships between historic climate and hurricane-related coastal flooding.
To explore how coastal flooding may change in the future, meteorological fields (sea-level pressure and near-surface wind) from Argonne’s WRF climate model dataset were used as inputs for the hydrodynamical models to project hurricane-related flooding at mid-century in the four priority states.
ROAD TO CLIMATE RESILIENCY: THE AT&T STORY
10
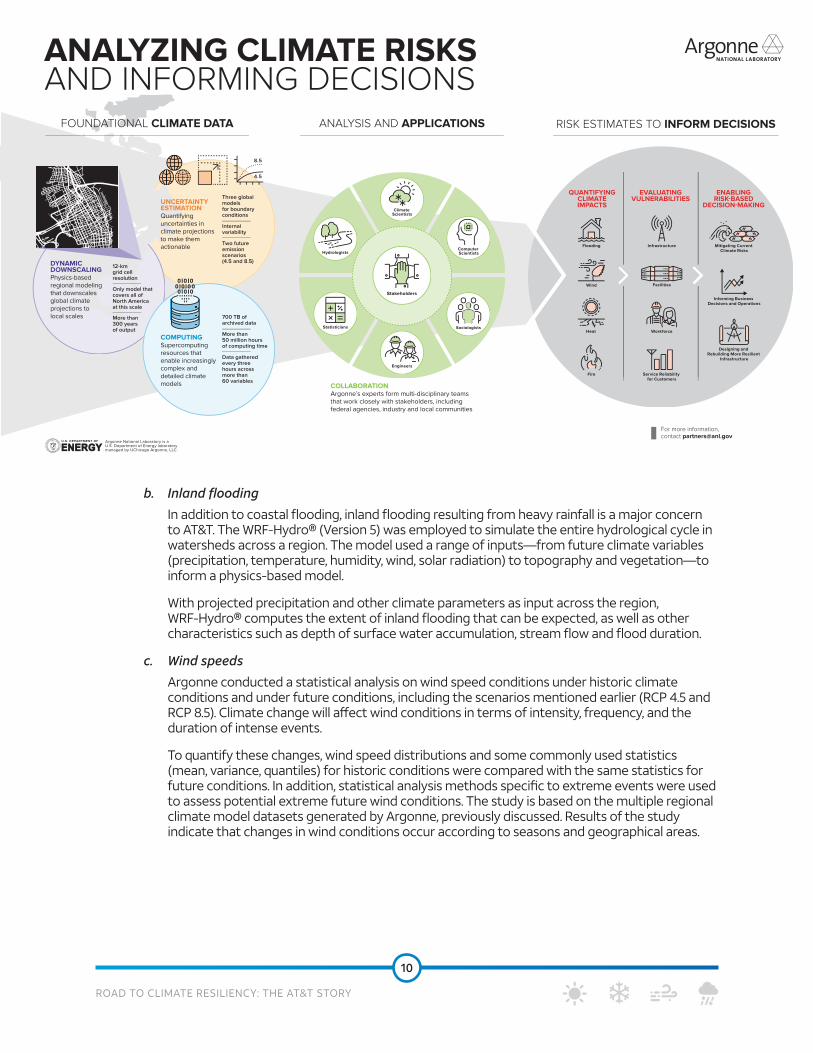
b. Inland flooding
In addition to coastal flooding, inland flooding resulting from heavy rainfall is a major concern to AT&T. The WRF-Hydro® (Version 5) was employed to simulate the entire hydrological cycle in watersheds across a region. The model used a range of inputs—from future climate variables (precipitation, temperature, humidity, wind, solar radiation) to topography and vegetation—to inform a physics-based model.
With projected precipitation and other climate parameters as input across the region, WRF-Hydro® computes the extent of inland flooding that can be expected, as well as other characteristics such as depth of surface water accumulation, stream flow and flood duration.
c. Wind speeds
Argonne conducted a statistical analysis on wind speed conditions under historic climate conditions and under future conditions, including the scenarios mentioned earlier (RCP 4.5 and RCP 8.5). Climate change will affect wind conditions in terms of intensity, frequency, and the duration of intense events.
To quantify these changes, wind speed distributions and some commonly used statistics (mean, variance, quantiles) for historic conditions were compared with the same statistics for future conditions. In addition, statistical analysis methods specific to extreme events were used to assess potential extreme future wind conditions. The study is based on the multiple regional climate model datasets generated by Argonne, previously discussed. Results of the study indicate that changes in wind conditions occur according to seasons and geographical areas.

ROAD TO CLIMATE RESILIENCY: THE AT&T STORY
11
CHALLENGESV.
TOOL INVESTIGATION: To deliver maximum benefit from this project, a data visualization tool that was able to integrate AT&T’s asset data with Argonne’s climate data was needed. “The tool needed to have layering capabilities and support for topological and geolocational features, at a minimum. If this tool were not already available in-house, we would have had to either build it from scratch or license it from a third party,” said Edmond Abrahamian, Principal Data Scientist at AT&T. Fortunately, AT&T discovered a viable internal tool compatible with Argonne’s platform.
IDENTIFYING BUSINESS-RELEVANT CLIMATE VARIABLES: Argonne recognized the need to identify and develop climate decision products that would be most useful to AT&T’s climate resilience initiatives. Discussions between AT&T and Argonne early in the project led to a series of additional focused simulations, data processing, and novel statistical analyses to identify climate extremes and define modeling uncertainty—better aligning to AT&T’s needs.
PROJECTING CLIMATE EXTREMES: Probabilities of climate extremes are projected using advanced statistical analysis of the output of the physical climate models. Generally speaking, the statistical confidence in future projections decreases farther into the future. For example, there is greater confidence in predicting the 10-year or 25-year extreme event than in predicting the 50-year or 100-year extreme event. This study explored multiple methods to increase the confidence of the prediction, and a relatively robust approach was applied. However, as this is an active area of ongoing research, newer and better approaches continue to be developed.
MODELING UNCERTAINTY: Argonne’s North American regional climate model (i.e. WRF) uses the input of three different global climate models to project future climate. Each of these three global climate models predict slightly different variations in climate, but are in general agreement with respect to the types and direction of changes that are expected to occur. However, the amplitude of those changes differs across the models.

ROAD TO CLIMATE RESILIENCY: THE AT&T STORY
12
OUTPUTS/RESULTSVI.
Argonne’s modeling produced results for four priority climate impacts that were of greatest concern to AT&T for the resilience of its systems. These results of the four impacts include:
INLAND FLOODING: WRF-Hydro® (Version 5) simulated the water cycle to project the depth and extent of inland flooding for historical and mid-21st century timeframes. These mid-century results project increased surface water accumulations over 5% in inland and coastal regions in the southeastern U.S. under a business-as-usual emission scenario during warmer seasons (spring, summer, and fall). Extreme flood events are also projected to increase across the four priority states. For example, by mid-century, a 50-year flood event will produce flood waters up to 10 feet deep across inland and coastal areas of southeastern Georgia.
COASTAL FLOODING: Two decades of water level simulations were conducted for a historical (1995-2004) and mid-century time period (2045-2054). Overall, the results are in agreement with other studies: severe hurricanes in climate models tend
to be under-predicted and occur less frequently as compared to observations. This is reflected in our model validation statistics. Additionally, the sea level rise signal associated with warming projections consistent with the RCP8.5 scenario appear to be the largest driver of future warm-season flooding and increases nuisance-level flooding events and severe flooding along the four priority states.
HURRICANE AND NON-HURRICANE WINDS SPEEDS: The comparison of Argonne simulations of wind conditions between historical and mid-century time periods reveal various changes in statistics that vary across regions and seasons. For instance, southern Florida tends to show the greatest change in maximum sustained wind conditions between past and future in both basic statistics and extremes conditions. Fifty-year event wind speeds of 90 mph are possible for a large part of the southern Florida coastal region by mid-century.

ROAD TO CLIMATE RESILIENCY: THE AT&T STORY
13
Output TypesArgonne’s climate models produced multi-dimensional data that can be easily mapped to show the impact of multiple climate variables across a region. The models directly output the data into Network Common Data Format (NetCDF) files, which allows easy storage and access to the data across a wide variety of software applications.
For climate resilience studies such as this one, NetCDF-based climate data is frequently imported into geospatial information systems (GIS) software to generate climate impact maps across regions of interest. The climate impact maps can be overlaid with infrastructure, agriculture or other mapping data to assess the climate impacts to regions and communities.
A subset of the climate model dataset developed for this project focused on projecting various climate extremes (e.g. hurricane wind speeds or extreme flood depth).
To do this, an extreme-value analysis was performed using statistical distributions to extrapolate the simulated intensity of extreme climate and hydrologic variables (e.g. hurricane winds and flood water depths). Parameters of these statistical analyses outcomes were identified and then saved for each grid cell in the four priority states.
Estimated parameters of these distributions in each grid cell were then used to calculate the extreme intensity of climate and hydrologic variables at any return period of interest (e.g. 50-year wind speeds and 25-year flood depths).
SAMPLE OUTPUTS
Historical Max. Water Level
-81.5 -81 -80.5 -80
32.5
32
31.5
31
3
2.5
2
1.5
1
0.5
0
Feet
of
wat
er le
vel (
lmsl
)
Water Depth 50yr• <0.50• 0.51 - 1.00• 1.01 - 1.50• 1.51 - 2.00• 2.01 - 3.00• 3.01 - 10.27
Output of inland flooding model showing neighborhood-scale predictions.
Water depth predictions, 50-year event.Output of coastal flooding model showing variable density of measurement points.

ROAD TO CLIMATE RESILIENCY: THE AT&T STORY
14
RELIABILITY OF RESULTSVII.
Confidence Estimates: Confidence estimates of the predicted change in various climate variables for future timeframes can be a useful statistic for assessing the reliability of climate model results. Confidence levels are estimated by assessing the outputs of multiple climate variables across different climate models. If projections calculated by several different models point to similar changes or agree on the types, direction, and magnitude of changes, there can be greater confidence in climate model outcomes. This study used outputs from three different models for each climate-change emission scenario to assess and develop robust statistics of confidence.
Estimating Extremes:Estimating values can be challenging when assessing impacts for relatively short future time periods (e.g. a 10-year period in the future). To overcome this, Argonne scientists evaluated multiple statistical analysis methods to identify those that produced the most robust outcomes while minimizing uncertainty for the four priority states. These included:
1.
evaluating the performance of four different statistical distribution models for extreme values analysis
2.
increasing the dataset size using p eak-over-threshold (POT) instead of annual maximum series (AMS)
3.
increasing the size of the dataset by identifying regions with homogeneous
grid points and aggregating them into a larger grouping of data points.
The final approach was made based on performance of each approach.
Another challenge is the parameters that define the statistical distributions used to calculate future climate extremes can carry some uncertainty that must be quantified. This uncertainty derives from the fact that the output of three different global climate models were used to drive the regional climate model (WRF) and hydrologic model (WRF-Hydro®). To quantify these parametric uncertainties, this study randomly sampled model outputs from the historical and mid-century datasets, and then derived a range of variation for each parameter. These ranges provide a basis for quantitatively estimating parameter uncertainty, and therefore can be used to estimate the uncertainty of extreme wind speed and flood depths.
Lastly, conventional extreme value analysis uses stationary statistical distributions, where the parameters that define them do not change over time. For climate change applications, the assumption of stationarity may underestimate the intensity of extremes events as climate continues to change over time. To account for these effects in this project, Argonne evaluated the statistical distributions with both stationary and non-stationary parameters using historical and future projections of extremes. If the non-stationary parameters at any grid improved the agreement between distribution predictions and the actual data, then the non-stationary distributions were applied. This approach provides more accurate projections of the future climate and hydrologic impacts.

ROAD TO CLIMATE RESILIENCY: THE AT&T STORY
15
TOOLVIII.
AT&T has several GIS systems currently in service. These systems have hundreds of map layers for tracking assets including real estate locations, central offices, fiber and copper lines, cell sites, and even undersea fiber. The company’s network planning and construction teams use this data to plan maintenance, disaster recovery, and future construction to best serve its customers.
While AT&T’s GIS systems contain data on current weather and the company’s planning teams consider the locations of historical flood plains, there is no data available on the accelerating changes brought on by climate change.
Incorporating Argonne’s new climate data will add incalculable risk identification and mitigation value. For example, AT&T can now cross reference its fiber cable locations with projected sea level rise in the year 2060, making for smarter financial decision-making by mapping risky and conservative areas for new build plans. Offering anywhere from 10-year to 100-year return periods of climate change risk, AT&T’s Climate Change Analysis Tool will allow network planners to understand the range of possible impacts to AT&T assets and align risk tolerance with the expected lifespan of those assets.
“Having climate data in numerical form is great for feeding into geospatial calculations and decision-making processes, but nothing compares to the visual impact of seeing climate change overlaid on our company’s assets in an interactive map,” said Antoine Diffloth, Director of Data Insights at AT&T.
Visualization of flooding data overlaid on AT&T fiber and cell sites.

ROAD TO CLIMATE RESILIENCY: THE AT&T STORY
16
AT&T and Argonne are exploring the potential expansion of the existing tool. Geographically, the tool could expand to include the East Coast, Gulf Coast, and West Coast regions of the U.S. before completing the entire United States and Mexico.
Expansion of the tool could also include other climate change impacts such as wildfires and droughts. The largest and deadliest wildfires in California’s history occurred just last year (2018).xv Though the Mendocino Complex and Camp wildfires were not directly caused by climate change, climate events such as exceedingly dry winds, drought, and vegetation die-off due to anomalous temperatures create conditions that exacerbate the damage caused by fires.xvi To have a more complete tool, other pressing climate change impacts such as increased temperatures and changing precipitation patterns will eventually be included.
Developing climate projections for the southeastern U.S. has allowed Argonne climate scientists to apply new analytical techniques to project regional climate impacts of interest to telecommunications, infrastructure, and other related sectors. These techniques will be extended
to generate similar climate data for the rest of the continental U.S.—
enabling broader study of climate impacts across the country, and
providing the opportunity for Argonne scientists to further hone their analyses.
One such planned enhancement will be to apply bias correction—a systematic
correction to model outcomes where models have been found
to consistently under- or over-predict certain results—to each of
the precipitation projections from the WRF model that were used to inform WRF-
Hydro® and predict inland flood effects. This will improve confidence levels estimates for inland flooding by sampling bias-corrected results from all three climate models.
NEXT STEPS
459,123 acres Mendocino Complex
Wildfire
JULY 2018
BOOSTING COMMUNITY RESILIENCY Climate change affects everyone. That is why AT&T and Argonne are committed to making the climate data used to develop AT&T’s tool available to those who need it. Providing everyone—from municipalities to universities—with the opportunity to better understand the risks posed by climate change, will better equip communities to become more climate resilient.
Taken together, the high resolution, rigorous statistical analysis, and broad regional coverage enables this one-of-kind dataset to give users a powerful tool for analyzing projected flooding and wind extremes, and therefore to quickly develop first-look estimates of potential risks to infrastructure, operations, and services. More on the public release of this project’s data will be shared in the future.

ROAD TO CLIMATE RESILIENCY: THE AT&T STORY
17
The effects of climate change have become increasingly critical for communities and companies like AT&T to address. Solutions that mitigate the impact of CO2 emissions on our planet must also be paired with solutions that help people adapt to the inevitable climate events that will occur today and tomorrow. As a result of this project, AT&T has developed the Climate Change Analysis Tool to visualize the forecast data from Argonne National Laboratory so that it can begin making smarter, climate-informed decisions for its business, customers, and communities for years to come. In this white paper, AT&T shared its journey from asking questions and seeking help from experts, to building a tool that is now part of a broader solution to climate adaptation. And soon, AT&T and Argonne will be making this valuable data accessible to those who seek to build solutions too.
RESILIENCY.This is AT&T on the road to
CONCLUSION

ROAD TO CLIMATE RESILIENCY: THE AT&T STORY
18
REFERENCES i Watson, Robert; McCarthy, James J.; Hisas, Liliana. “The Economic Case for Climate Action in the United States.” Information for
Climate Action. Universal Ecological Fund FEU-US, September, 2017, https://feu-us.org/case-for-climate-action-us2
ii “Summary for Policymakers of IPCC Special Report on Global Warming of 1.5ºC approved by governments.” IPCC Intergovernmental Panel on Climate Change. October 8, 2017, https://www.ipcc.ch/2018/10/08/summary-for-policymakers-of-ipcc-special-report-on-global-warming-of-1-5c-approved-by-governments
iii “How climate is changing.” Global Climate Change – Vital Signs of the Planet. Earth Science Communications Team at NASA’s Jet Propulsion Laboratory, February 7, 2019, https://climate.nasa.gov/effects/
iv Ascertainment of the Estimated Excess Mortality from Hurricane Maria in Puerto Rico. Washington D.C.: Milken Institute School of Public Health, 2018. The George Washington University. https://prstudy.publichealth.gwu.edu/sites/prstudy.publichealth.gwu.edu/files/reports/Acertainment%20of%20the%20Estimated%20Excess%20Mortality%20from%20Hurricane%20Maria%20in%20Puerto%20Rico.pdf
v Watson, Robert; McCarthy, James J.; Hisas, Liliana. “The Economic Case for Climate Action in the United States.” Information for Climate Action. Universal Ecological Fund FEU-US, September, 2017, https://feu-us.org/case-for-climate-action-us2
vi Smith, Adam B. “2017 U.S. billion-dollar weather and climate disasters: a historic year in context.” Climate.gov, NOAA, January 8, 2018, https://www.climate.gov/news-features/blogs/beyond-data/2017-us-billion-dollar-weather-and-climate-disasters-historic-year
vii Watson, Robert; McCarthy, James J.; Hisas, Liliana. “The Economic Case for Climate Action in the United States.” Information for Climate Action. Universal Ecological Fund FEU-US, September, 2017, https://feu-us.org/case-for-climate-action-us2
viii Wuebbles, Donald; Fahey, David W.; Hibbard, Kathy A. “How Will Climate Change Affect the United States in Decades to Come?” EOS: Earth & Space Science News, American Geophysical Union, November 3, 2017, https://eos.org/features/how-will-climate-change-affect-the-united-states-in-decades-to-come
ix “AT&T Commits to Goal Accelerating Technology’s Role in Reducing Carbon Emissions.” Connect to Good, AT&T, November 18, 2015, https://about.att.com/content/csr/home/blog/2015/11/at_t_commits_to_goal.html
x “Energy Management.” Connect to Good, AT&T, August 2018, https://about.att.com/content/csr/home/issue-brief-builder/environment/energy-management.html
xi “Company Fleet and Transportation.” Connect to Good, AT&T, June 2018, https://about.att.com/content/csr/home/issue-brief-builder/environment/company-fleet-and-transportation.html
xii “Big on Renewable Energy.” Connect to Good, AT&T, 2019, https://about.att.com/content/csr/home/planet/renewable-energy.html
xiii USGCRP, 2018: Impacts, Risks, and Adaptation in the United States: Fourth National Climate Assessment, Volume II [Reidmiller, D.R., C.W. Avery, D.R. Easterling, K.E. Kunkel, K.L.M. Lewis, T.K. Maycock, and B.C. Stewart (eds.)]. U.S. Global Change Research Program, Washington, DC, USA, 1515 pp. doi: 10.7930/NCA4.2018. https://nca2018.globalchange.gov/
xiv “Number of extreme weather events causing more than $1 billion in economic losses.” Extreme weather events by state, Universal Ecological Fund (FEU-US), 2018, https://feu-us.org/maps-events-by-state
xv Jenner, Lynn. “California’s Mendocino Complex of Fires Now Largest in State’s History.” Fire and Smoke, NASA, August 7, 2018, https://www.nasa.gov/image-feature/goddard/2018/californias-mendocino-complex-of-fires-now-largest-in-states-history
xvi Voiland, Adam. “Why the SoCal Fires are So Fierce.” Earth Matters, NASA Earth Observatory, December 7, 2017, https://earthobservatory.nasa.gov/blogs/earthmatters/2017/12/07/why-are-the-socal-fires-so-intense/