retrofit audits and cost estimates: a look at quality and...
TRANSCRIPT

Retrofit Audits and Cost Estimates: A Look at Quality and Consistency L. Eisenberg, C. Shapiro, and W. Fleischer Consortium for Advanced Residential Buildings
October 2012

NOTICE
This report was prepared as an account of work sponsored by an agency of the United States government. Neither the United States government nor any agency thereof, nor any of their employees, subcontractors, or affiliated partners makes any warranty, express or implied, or assumes any legal liability or responsibility for the accuracy, completeness, or usefulness of any information, apparatus, product, or process disclosed, or represents that its use would not infringe privately owned rights. Reference herein to any specific commercial product, process, or service by trade name, trademark, manufacturer, or otherwise does not necessarily constitute or imply its endorsement, recommendation, or favoring by the United States government or any agency thereof. The views and opinions of authors expressed herein do not necessarily state or reflect those of the United States government or any agency thereof.
Available electronically at http://www.osti.gov/bridge
Available for a processing fee to U.S. Department of Energy and its contractors, in paper, from:
U.S. Department of Energy Office of Scientific and Technical Information
P.O. Box 62 Oak Ridge, TN 37831-0062
phone: 865.576.8401 fax: 865.576.5728
email: mailto:[email protected]
Available for sale to the public, in paper, from: U.S. Department of Commerce
National Technical Information Service 5285 Port Royal Road Springfield, VA 22161 phone: 800.553.6847
fax: 703.605.6900 email: [email protected]
online ordering: http://www.ntis.gov/ordering.htm
Printed on paper containing at least 50% wastepaper, including 20% postconsumer waste

iii
Retrofit Audits and Cost Estimates: A Look at Quality and Consistency
Prepared for:
The National Renewable Energy Laboratory
On behalf of the U.S. Department of Energy’s Building America Program
Office of Energy Efficiency and Renewable Energy
15013 Denver West Parkway
Golden, CO 80401
NREL Contract No. DE-AC36-08GO28308
Prepared by:
Steven Winter Associates, Inc. &
Pratt Center for Community Development
of the
Consortium for Advanced Residential Buildings (CARB)
61 Washington Street
Norwalk, CT 06854
Technical Monitor: Cheryn Metzger
Prepared under Subcontract No. KNDJ-0-40342-00
October 2012

iv
[This page left blank]

v
Contents Contents ....................................................................................................................................................... v List of Figures ............................................................................................................................................ vi List of Tables .............................................................................................................................................. vi Definitions .................................................................................................................................................. vii Executive Summary ................................................................................................................................. viii 1 Project Objectives ................................................................................................................................ 1 2 Technical Approach and Findings ...................................................................................................... 3
2.1 Data Collection and Tracking System Development ....................................................................... 3 2.2 Utility Bill Collection and Analysis ................................................................................................. 3 2.3 Audit Report Findings...................................................................................................................... 4 2.4 Energy Modeling ............................................................................................................................. 7 2.5 Analysis Methodology ..................................................................................................................... 7 2.6 Multifamily Buildings (Projects 1–4) .............................................................................................. 8 2.7 Project 5 ......................................................................................................................................... 11 2.8 Project 6 ......................................................................................................................................... 12 2.9 Audit Analysis Conclusions ........................................................................................................... 13
3 Technical Challenges and Recommendations ............................................................................... 15 Bibliography .............................................................................................................................................. 16 Appendix A: Pratt Retrofit NYC Block by Block Report ........................................................................ 17 Appendix B: Example Block by Block Audit Report ............................................................................. 44

vi
List of Figures Figure 1. Cumulative annual source energy consumption savings by measure ............................... 10 Figure 2. Annual modeled and actual site electrical consumption. The modeled consumption is
shown for existing and proposed cases of the typical building. Actual consumption is compiled from the utility bills of the existing buildings. ................................................................ 11
Unless otherwise noted, all figures were created by CARB. List of Tables Table 1. Utility Service in New York City by Borough ............................................................................. 4 Table 2. Example Audit Recommendations ............................................................................................. 5 Table 3. Cost-Effectiveness Measures for Example Audit Report ......................................................... 6 Table 4. Cost Analysis Assumptions ........................................................................................................ 8 Table 5. Fuel Costs and Site-to-Source Ratios ........................................................................................ 8 Table 6. Typical Specifications of Multifamily Buildings ........................................................................ 9 Table 7. Incremental Cost Analysis of Recommended Measures ......................................................... 9 Table 8. Cost Analysis of Multifamily Projects ...................................................................................... 10 Table 9. Existing and Proposed Specifications and Incremental Costs for Project 5 ....................... 12 Table 10. Cost Analysis for Project 5 ...................................................................................................... 12 Table 11. Existing and Proposed Specifications and Costs for Project 6 .......................................... 13 Table 12. Cost Analysis for Project 6 ...................................................................................................... 13 Unless otherwise noted, all tables were created by CARB.
vii
Definitions AC Air conditioning
AFUE Annual fuel utilization efficiency
BEopt Building Energy Optimization (tool)
Btu British thermal unit
CARB Consortium for Advanced Residential Buildings
DHW Domestic hot water
EF Energy factor
EGUSA EnergyGauge USA
gal Gallon
h Hour
in. Inch
kBtu Thousand Btu
MMBtu Million Btu
MURS Minimum upgrade reference scenario
NREL National Renewable Energy Laboratory
NYC New York City
NYSERDA New York State Energy Research and Development Authority
o.c. On center
SEER Seasonal energy efficiency ratio
TREAT Targeted Retrofit Energy Analysis Tool
W Watt

viii
Executive Summary Retrofit NYC Block by Block is an outreach program targeting owners of one- to four-family homes. With more than 600,000 citywide, these homes are most common building type in New York City (NYC). The program is administered by the Pratt Center for Community Development and implemented by four nonprofit, community-based organizations. Block by Block connects residents, businesses, and religious and civic organizations in predominantly low- and moderate-income neighborhoods with one or more of a half-dozen public and private financial incentive programs that facilitate energy efficiency retrofits. In this research project, investigators initially sought to evaluate the approach, effectiveness, and energy use reductions accomplished by the Retrofit NYC Block by Block Program. An early objective of this research was to determine if the measures, their costs, and the achieved savings were predictable enough to significantly reduce the use and cost of individualized energy audits and expedite the recommendations process. Unfortunately, the program began operating later than anticipated and the activity has ramped up more slowly than expected. These factors, along with the limited period of performance for this research project, did not allow adequate information to be collected on a significant number of retrofit projects. As a result, the initial research objective could not be accomplished. Instead, with the Block by Block program in the early stage of operation, research efforts focused on examining the audit reports for quality, comprehensiveness, and consistency. Based on a closer look at six buildings for which utility data were available, two primary areas of concern emerged: the energy savings estimates and the costs of the recommended measures. Audit results were found to be highly variable even across very similar buildings. A review of audit reports found that model predictions and energy savings estimates were high and not consistent with actual energy usage data. At a recent Building America team meeting, several researchers raised concerns about the accuracy of building simulation programs when modeling older, poorly insulated buildings. Most of the modeling tools were developed for new construction that performs better. Research into this potential modeling problem is warranted. Using utility data to calibrate the existing building model is an often cited approach to improving accuracy, but obtaining utility data is difficult and time consuming. In addition, these data are often incomplete. It is not apparent that the utility data were entered into the Targeted Retrofit Energy Analysis Tool (TREAT) software (a building modeling tool) in the projects reviewed for this project. Research toward a process that will make household energy use data readily available will enhance future program efforts. Across the audit reports reviewed, cost information by energy efficiency measure was highly variable. Plausible explanations for the lack of detailed information follow:
• Auditors are often not qualified to provide contractor pricing for the broad spectrum of measures being recommended (i.e., this project revealed that insulation contractors might provide a qualified and competitive price for the insulation measures but might only furnish ballpark estimates for heating system measures).

ix
• Significant remediation costs associated with health and safety are included in the energy efficiency measure costs.
• Total replacement costs are provided instead of the incremental cost of a more energy efficient replacement system.
A reliable third-party resource for efficiency measure cost information such as that under development by the National Renewable Energy Laboratory could help alleviate the inconsistent and unreliable cost information problems.

1
1 Project Objectives Important aspects to achieving Building America goals are understanding retrofit delivery practices and the technical challenges involved in implementing packages of efficiency measures at the community scale. In this research project, Consortium for Advanced Residential Buildings (CARB) investigators initially sought to evaluate the approach, the effectiveness, and the energy use reductions accomplished by the Retrofit NYC Block by Block Program. Retrofit NYC Block by Block is an outreach program administered by the Pratt Center for Community Development. It targets owners of one- to four-family homes. With more than 600,000 structures citywide, these homes are the most common building type in New York City (NYC). Four community-based organizations are participating in Block by Block and each employs one full-time outreach coordinator. The outreach coordinator connects residents, businesses, and religious and civic organizations to incentive programs that facilitate energy efficiency retrofits. They work in predominantly low- and moderate-income neighborhoods. About a half-dozen public and private financial incentive programs are potentially available. The organizations that conducted the outreach in this program, funded by the NYC Council, were (1) Bedford Stuyvesant Restoration Corporation, Bedford Stuyvesant, Brooklyn; (2) Chaaya, CDC, Jamaica and Jackson Heights, Queens; (3) Neighborhood Housing Services of Staten Island, Northern Staten Island; and (4) Sustainable South Bronx, Soundview Section, the Bronx. Project personnel hypothesized that one- to four-family homes being targeted within each of the four neighborhoods would likely need similar retrofit measures (e.g., roof and cellar insulation, pipe insulation, air sealing, weather stripping, lighting and appliances, and low-flow fixtures, among others). Even though, over time, variation in the row houses has increased because of individual homeowner maintenance and investment, the homes are built at the same time, of the same materials, often with the same floor plan. Therefore, an initial objective of this research was to determine if the measures, their costs, and the achieved savings were being replicated consistently. If so, it might be appropriate to significantly reduce the use and cost of individualized energy audits and expedite the recommendations process. The initial objectives of this research project were designed to answer the following questions:
• Can row houses of similar types (e.g., steam-heated brownstones) readily achieve similar and significant energy use reductions with common retrofit measures?
• Is there a package, or packages, of measures that could be offered on a large scale and under what conditions?
• What are the energy savings of these measures/packages?
• Can the energy savings be reliably predicted?
• Can the measures be reliably implemented with assured energy savings?
• What barriers are there to mass adoption of this strategy in other neighborhoods?
• How much would lowering contractor prices and transaction costs reduce the cost to implement similar measures at a neighborhood scale?

2
• Are buildings similar enough (i.e., construction type, heating fuel and equipment, and distribution system) and energy performance predictable enough to consider circumventing the significant hurdle of utility data collection?
The NYC Block by Block program began full operation in spring 2011, later than planned, and operations have ramped up slowly. No comprehensive retrofits were completed within the period of performance of this research project, so none were analyzed in this research. With this change in schedule, the scope of the research needed to be adjusted significantly. The final objectives for this research were designed to answer the following questions:
• Are the program audits high in quality, comprehensive, and consistent across different providers?
• Were auditor energy use and savings projections consistent with modeling projections? Appendix A contains a report describing the Block by Block Program’s outreach approach and accomplishments to date.
3
2 Technical Approach and Findings 2.1 Data Collection and Tracking System Development To assist the Block by Block community partners in managing participants and monitoring data, the Pratt Center for Community Development customized a Web-based tracking system on the Salesforce platform. CARB personnel helped create the tracking system by offering recommendations for data items to be collected. Because data were being extracted from a variety of different sources, across several programs, it was important to define what information was necessary to record for analysis purposes. Building on knowledge from previous research and a review of the various audit reports and energy models, CARB advised on critical building characteristics, utility-related inputs, and energy conservation measures for which data fields were developed. Pratt’s database system became available online to its partners in July 2011 after an extensive development period. The system is a unique database of building characteristics, energy use data, audit information, and retrofit implementation activity for NYC’s small homes. The database captures energy assessment and retrofit information across all incentive programs (New York State Energy Research and Development Authority [NYSERDA], utility, city, and state and federal programs). Pratt representatives are currently investigating how to make this database tool available to other neighborhood retrofit campaigns. Pratt staffers are interested in continuing to analyze project data for lessons learned on outreach, program design, and retrofit measures for urban properties. This project meant to test the hypothesis that similar building types require similar types of retrofits. It was also intended to generate ideas about program design that would maximize impact for public dollars invested in housing retrofits. Data collection and entry into the tracking system is a step toward this end, as monitoring and evaluation of building features and energy conservation measures continue to take place at a neighborhood scale. 2.2 Utility Bill Collection and Analysis Originally, when this research project was devised, CARB intended to evaluate the utility bills collected for each project in the Salesforce tracking system. Looking at energy usage data, namely fuel and electric bills, can yield a quantifiable understanding of each building in terms of utility consumption and offer a way to compare a building against industry benchmarks. Although it would be difficult to tease out savings from individual retrofit measures, a utility bill analysis can identify how each building is performing, assess pre- and post-retrofit usage, and normalize for weather patterns. The Block by Block program requests homeowner permission to view electricity (Con Edison) and gas (National Grid or Con Edison) utility accounts as part of the intake process. Con Edison’s website allows customers to access bills for the past two years by logging in with an account number, which is displayed on a hard copy bill. National Grid data are more difficult to obtain because the website requires a username and password, which have to be set up by the primary account holder. Even though most homeowners gave their permission to view their accounts, a number of hurdles made the information difficult to gather and analyze.

4
The utility companies did not respond favorably to requests to obtain energy use data for the accounts of homeowners who had given their permission. Therefore, to access the data, Pratt staff and interns had to go online to individually download information month by month for each account. For electric accounts, this was further complicated by the estimated use numbers versus actual and variable billing periods. For the National Grid accounts, that company’s requirement for an online password to access the account presented an additional hurdle. Because the majority of homeowners either did not set up a National Grid online account or because they were not comfortable sharing their password, retrieving National Grid data resulted in information from few accounts. Analyzing and comparing utility use information would have been useful, but insufficient data were available to do so. Con Edison and National Grid are the two main utility companies that serve the five boroughs where the Block by Block program is active. Con Ed provides both electricity and natural gas service to Manhattan and Bronx residents, but delivers only electricity to Brooklyn, Queens, and Staten Island; natural gas in these areas is supplied by National Grid (see Table 1).
Table 1. Utility Service in New York City by Borough
Borough Electricity Natural Gas Manhattan Con Edison Con Edison
Bronx Con Edison Con Edison Brooklyn Con Edison National Grid Queens Con Edison National Grid
Staten Island Con Edison National Grid The Block by Block program did not attempt to capture use for oil customers. Because there are several oil providers in NYC, tracking down individual oil records for each building would have been labor intensive and tedious. In addition, there is often variability with oil deliveries and dates, making records challenging to piece together. CARB found that these issues prohibited performing a utility bill analysis, but those with complete utility records (which were located in Con Ed territory in Manhattan and the Bronx), were prioritized for energy modeling analysis. 2.3 Audit Report Findings To better understand the audit findings beyond what was documented in the database, CARB looked at a sample of six audit reports to evaluate the effectiveness of the audit recommendations for the Block by Block program. Four projects are very similar multifamily buildings, which were constructed in the late 1980s and located within one superblock. Two of the projects are single-family homes constructed in 1920 that are located near the other four buildings. The audit reports were prepared by one contractor working under the Green Jobs-Green New York Program administered by NYSERDA. The contractor is accredited by the Building Performance Institute as required by the program and there is no reason to believe that the firm is not representative of standard industry practices.

5
Unfortunately, CARB was unable to physically inspect the buildings to verify the specifications reported in the energy audits. The audit reports typically recommend several measures and list the costs associated with installing these measures. The measures are then commonly grouped into two or three packages with one package including all suggested measures. Table 2 shows an example of audit recommendation packages from one of the four multifamily building audits, and Table 3 gives the associated cost-effectiveness measures. This audit report is fairly typical of the retrofit recommendations in the six audits. The auditor used the Targeted Retrofit Energy Analysis Tool (TREAT), a building modeling tool, to calculate retrofit savings. Appendix B contains a sample report for a multifamily building.
Table 2. Example Audit Recommendations
Measure Nonenergy Benefits Package 1 ($)
Package 2 ($)
Package 3 ($)
Install 7.25 in. of Fiberglass Floor Insulation (R-24)
Improve comfort, increase value of building 1,950 1,950
Reduce Infiltration from 4,845 CFM50 to 3,500
CFM50 Reduce drafts 3,000 3,000 3,000
Install 2-Ton 18 SEER Cooling System Increase value of building 3,500
Install Programmable Thermostats
Improve comfort, improve convenience 240 240 240
Install 55 kBtu/h, 95% AFUE Heating System Increased equity 4,000 4,000
Install 55 kBtu/h, 95% AFUE Heating System Increased equity 4,000 4,000
Install New Double Pane Sliding Door
Improve comfort (reduce drafts), increase value of
building 2,000
Install 47 New 15-W Fluorescent Light Fixtures Reduce maintenance costs 470 470 470
Install 1 Low-Flow Reduce water use 100 100 100 Lengthen DHW Discharge
Pipe Improve air quality and
comfort 200 200 200 Notes: CFM50 is the air flow in cubic feet per minute induced by a 50 Pascal pressure from blower door operation. SEER, seasonal energy efficiency ratio; AFUE, annual fuel utilization efficiency; DHW, domestic hot water

6
Table 3. Cost-Effectiveness Measures for Example Audit Report
Measure Package 1 Package 2 Package 3 Total Installed Cost ($) 19,460 8,010 9,960
Annual Energy Cost Savings ($) 915 707 760 Annual Kilowatt-Hour Savings ($) 3,454 2,799 2,699
Total Energy Savings (MMBtu) 37.0 27.6 32.1 Simple Payback (Years) 21.3 11.3 13.1
Savings to Investment Ratio 0.7 1.1 1.1 By looking at the audit reports for these Block by Block projects, CARB discovered several issues with the audit reports, including lack of transparency in cost effectiveness per measure, inclusion of non-energy-related measures in cost-effectiveness savings, and a number of overly expensive measures. Although these issues can vary in degree and manifestation, they are common throughout all of the audits. The primary issue with these audit reports is that the cost effectiveness of each measure is not clearly reported, which makes it difficult for homeowners to select which measures are the best options out of the entire suggested package. The three packages listed in the six reports reviewed appeared to be an arbitrary collection of upgrades. Packages are not presented systematically from most to least cost effective. The cost-effectiveness calculations for each measure are also clouded by non-energy-related measures, which reduce the cost effectiveness of the entire package. In many cases, these measures can be justified for health, safety, or cosmetic reasons, but will not reduce energy use. For all audit reports reviewed, some safety-related measures that may not be high-impact energy efficiency measures included:
• DHW pipe replacement ($200)
• Repair of hole in boiler room ceiling ($200)
• Door replacement ($1,000–$1,500)
• Sliding door replacement ($2,000)
• Aluminum flashing to fix roof leak ($2,000)
• Safety valve ($100)
• Safety pipe ($100)
• Missing radiator ($250)
• Carbon monoxide detectors ($360 each)
• Installation of windows with similar specs to existing windows ($500–$4,800).
Some of these measures have limited energy savings potential and questionable cost effectiveness. For example, installing a new double pane sliding door or replacing windows with new windows of similar performance are not cost effective based on energy savings alone. These

7
measures may have been suggested for cosmetic or repair reasons, but should be excluded from cost-effectiveness calculations. Finally, several audits included expensive upgrades that are not justified by energy savings. These costs seem expensive in comparison to typical costs and the reasons for these high costs are unknown. Examples of expensive upgrades include the following:
Exterior wall insulation improvement from R-7 to R-15 ($8,360)
Floor insulation from R-10 to R-33 ($8,960)
Door replacement ($1,000–$1,500).
2.4 Energy Modeling To further analyze the appropriateness of the predicted energy savings and the cost effectiveness of the suggested retrofit packages, CARB performed energy modeling of the six selected Retrofit NYC projects discussed previously (four two-unit [multifamily] and two single-family homes in the Bronx). CARB used information from the audit reports, city assessor’s records, and Google Earth to develop energy models. Audit reports were used to establish the pre- and post-retrofit specifications. Google Earth and the assessor’s records were used to establish building geometries. The two single-family buildings were modeled using the Building Energy Optimization (BEopt) tool.1 The four multifamily buildings were modeled in EnergyGauge USA (EGUSA) because BEopt cannot model multifamily dwellings.2 2.5 Analysis Methodology All cost analyses were performed using the method outlined by Polly et al. (2011) and all non-energy-related measures were excluded. In their analysis a minimum upgrade reference scenario (MURS) is used as the baseline.
The MURS begins with the existing building at the start of the analysis period and assumes all equipment that wears out over the analysis period is replaced with the same level of efficiency or the current minimum standard, whichever is more efficient. Minimum upgrades are assumed for the reference building so as not to take credit for energy efficiency improvements that would have otherwise occurred through natural wear-out and replacement. In this sense, the MURS is the minimum that a homeowner could do to their house over the analysis period assuming that standards in the future will require at least the current level of efficiency. (Polly et al. 2011, p.10)
Because the equipment in these buildings was older than the predicted lifetime of typical systems, all analyses were performed assuming that the existing equipment was at the end of its lifetime. Cost analyses were performed with an assumed real discount rate of 3%, an inflation rate of 3%, and an assumption that all measures are installed using a 5-year loan with a 7% interest rate, as shown in Table 4.
1 See http://beopt.nrel.gov/ for more information. 2 See http://www.energygauge.com/ for more information on EGUSA.
8
Table 4. Cost Analysis Assumptions
Analysis Period (years) 30 Inflation Rate (%) 3
Loan Rate (%) 7 Loan Period (years) 5
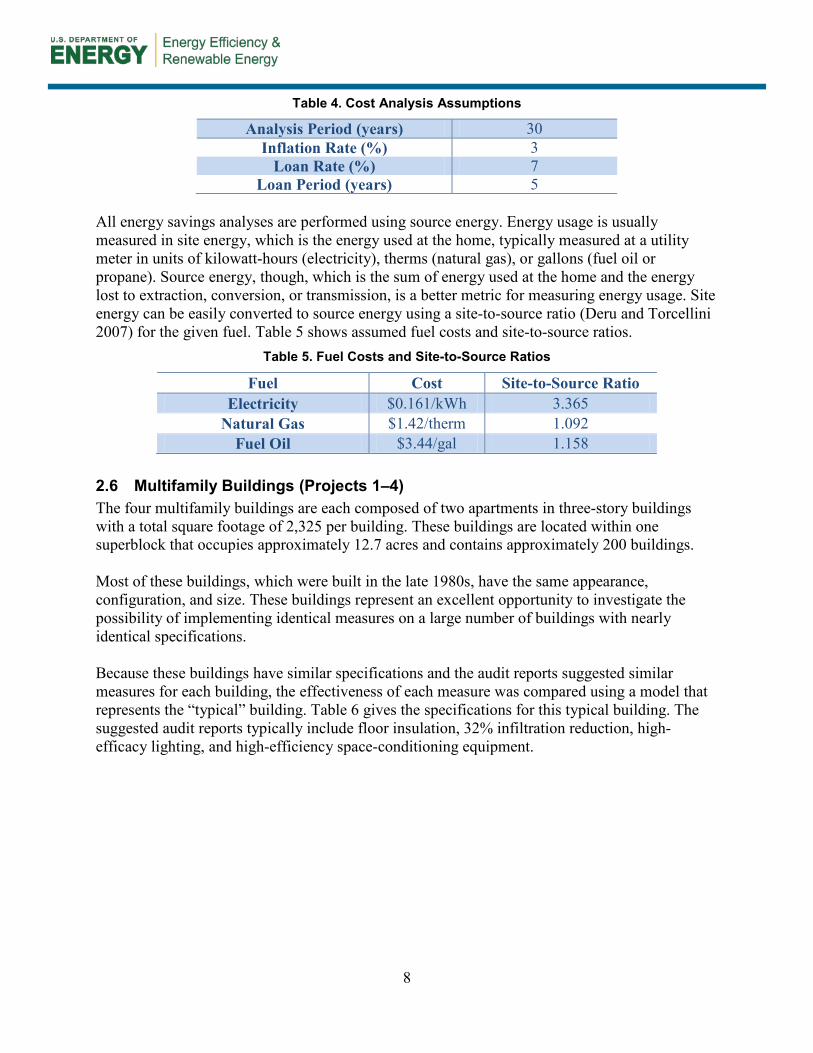
All energy savings analyses are performed using source energy. Energy usage is usually measured in site energy, which is the energy used at the home, typically measured at a utility meter in units of kilowatt-hours (electricity), therms (natural gas), or gallons (fuel oil or propane). Source energy, though, which is the sum of energy used at the home and the energy lost to extraction, conversion, or transmission, is a better metric for measuring energy usage. Site energy can be easily converted to source energy using a site-to-source ratio (Deru and Torcellini 2007) for the given fuel. Table 5 shows assumed fuel costs and site-to-source ratios.
Table 5. Fuel Costs and Site-to-Source Ratios
Fuel Cost Site-to-Source Ratio Electricity $0.161/kWh 3.365
Natural Gas $1.42/therm 1.092 Fuel Oil $3.44/gal 1.158
2.6 Multifamily Buildings (Projects 1–4) The four multifamily buildings are each composed of two apartments in three-story buildings with a total square footage of 2,325 per building. These buildings are located within one superblock that occupies approximately 12.7 acres and contains approximately 200 buildings. Most of these buildings, which were built in the late 1980s, have the same appearance, configuration, and size. These buildings represent an excellent opportunity to investigate the possibility of implementing identical measures on a large number of buildings with nearly identical specifications. Because these buildings have similar specifications and the audit reports suggested similar measures for each building, the effectiveness of each measure was compared using a model that represents the “typical” building. Table 6 gives the specifications for this typical building. The suggested audit reports typically include floor insulation, 32% infiltration reduction, high-efficacy lighting, and high-efficiency space-conditioning equipment.

9
Table 6. Typical Specifications of Multifamily Buildings
Specifications Existing Proposed Exterior Walls R-13, 2 × 4, 16-in. on center (o.c.) — Exterior Finish Vinyl siding —
Roofing Material Built-up roofing — Ceiling/Attic R-24 — Foundation Crawlspace, 2 × 8 with no insulation R-24 floor insulation
Window Area 20% — Window Type Double clear aluminum -
Infiltration (CFM50) 4,945 3,375 Ventilation None — Appliances All standard —
Lighting 37% fluorescent 100% fluorescent Cooling Room AC, SEER 10 Central AC, SEER 18 Heating 80% AFUE 95% AFUE Ducts Distribution efficiency = 100% —
Water Heater Natural gas, EF = 0.57 — To analyze the cost effectiveness of the auditor-recommended measures, each measure was isolated in the model to determine the annual utility bill savings. The costs of the measures based on the audit reports were compared to the cost of the MURS based on the costs and lifetimes published in the National Residential Energy Efficiency Measures Database (NREL 2011). All existing equipment was assumed to be at the end of its life. Table 7 shows the utility bill savings, annualized savings, and cost and lifetime assumptions. The analysis revealed that lighting, infiltration reduction, and floor insulation are cost-effective measures. Space-conditioning upgrades alone are not cost effective, costing an annualized $301 per year. The total annualized savings for the package of measures, however, is $600 per year.
Table 7. Incremental Cost Analysis of Recommended Measures
Cost of Measure
(Proposed, $)
Measure Lifetime
(Proposed, years)
Cost of Measure
(MURS, $)
Lifetime of Measure (MURS, years)
Utility Bill
Savings ($)
Annualized Savings
($)
Lighting 380 9 168 1 201 516 Infiltration 1,850 999 0 999 134 194
Floor Insulation 1,950 999 0 999 133 191
Heating 8,000 20 3,413 20 65 (272) Cooling 3,050 14 806 10.5 555 (29)
Figure 1 shows cumulative source energy consumption by measure. Each bar represents the sequential addition of a measure. The cooling system bar farthest to the right includes all measures. Total source energy savings for the entire package is 31%.

10
Figure 1. Cumulative annual source energy consumption savings by measure
This analysis is representative of the typical multifamily building and applies to projects 1 through 4. Table 8 gives the cost analysis for the total packages in all four projects. The total cost is the sum reported by the auditor, including nonenergy-related measures. The modeled cost is the sum of the reported costs for the specific energy measures modeled. The differences among the project results are largely attributable to differences in the costs of the recommended measures and some slight variation in the recommended measures. It is unclear why there was such a large difference in the measure costs given that the same contractor performed all of the audits.
Table 8. Cost Analysis of Multifamily Projects
Project 1 Project 2 Project 3 Project 4 Auditor-Reported Total Cost ($) 12,040 19,460 17,760 15,440
Modeled Cost (Energy Measures Only, $) 8,145 11,615 12,855 7,295 Annual Modeled Utility Bill Savings ($) 781 728 867 569
Source Energy Savings (% Over Existing) 26 31 32 24 Annualized Savings ($) 662 468 534 178
Annualized Rate of Return (Real, %) 11 6 7 5 Simple Payback (Years) 10.43 15.95 14.83 12.82
A comparison of the modeled and actual site energy consumption raises concerns about the predicted cooling savings generated by EGUSA. Figure 2 shows a comparison between the modeled energy consumption of the typical building against the actual utility bills for the
9492
83
7469
67
0
10
20
30
40
50
60
70
80
90
100
Existing + Lighting + Infiltration + Floor Insulation + Heating + Cooling
Annu
al S
ourc
e En
ergy
(mm
BTU
)
Misc. Appliances (G) Appliances(E) Lighting DHW HVAC Fan Cooling Heating

11
projects. No effort was made to adjust the utility bills for weather. The discrepancy between the modeled and actual energy savings during the winter months is understandable because of expected differences in the usage patterns of lighting, appliances, and miscellaneous loads.
Figure 2. Annual modeled and actual site electrical consumption. The modeled consumption is shown for existing and proposed cases of the typical building. Actual consumption is compiled
from the utility bills of the existing buildings.
The very large difference between the modeled and actual electricity consumption during the summer months, however, is most likely caused by the typical usage patterns for window AC units. Kempton et al. (1987) showed that most owners of room AC run their units in an on/off pattern, turning on the unit only when the residents are home and cooling is needed. Residents who run their units thermostatically (using the thermostat), used nearly three times the electricity of the other residents. As a result, installing thermostatically controlled central AC in these units could actually increase the electricity usage of the building. Although the cooling system upgrade may increase comfort, it appears to increase rather than decrease energy use. 2.7 Project 5 Project 5 is a 1,552-ft2, two-story, single-family home constructed in 1920. The building, which is heated with a natural gas furnace, was modeled in BEopt. Table 9 gives the existing specifications, proposed specifications, and costs.
0
200
400
600
800
1000
1200
1400
1600
1800
Jan Feb Mar Apr May Jun Jul Aug Sep Oct Nov Dec
Elec
tric
ity (k
Wh)
Modeled Existing Modeled Proposed Project 1Project 2 Project 3 Project 4

12
Table 9. Existing and Proposed Specifications and Incremental Costs for Project 5
Specifications Existing Proposed Cost ($)
Exterior Walls R-13, 2 × 4, 16-in.o.c. (derated to R-7)
R-17, 5.5-in.fiberglass (derated to R-15) 8,360
Exterior Finish Stone – – Roofing Material Light asphalt – –
Ceiling/Attic R-10, 2 × 4, 16-in.o.c. R-33, 2 × 4, 10-in. cellulose 8,960
Foundation Uninsulated basement – – Window Area 15% – – Window Type Double clear – –
Infiltration (CFM50) 5700 4700 2,000
Ventilation Spot vent – – Appliances All standard – –
Lighting 0% fluorescent 100% fluorescent 560
Cooling 9 SEER (modeled as SEER 10) – –
Heating Natural gas, AFUE = 84% – –
Ducts 100% distribution efficiency – –
Water Heater Natural gas, 59% Low-flow shower head 100 Despite the large costs of some of the measures, as discussed in Section 2.3, the recommended measures produced an annualized savings of $899 and an annualized rate of return of 7%.
Table 10. Cost Analysis for Project 5
Auditor Reported Total Cost ($) 22,580 Modeled Cost (Energy Measures Only, $) 19,980 Annual Modeled Utility Bill Savings ($) 463
Source Energy Savings (% Over Existing) 16 Annualized Savings ($) 899
Annualized Rate of Return (Real, %) 7 Simple Payback (Years) 43.2
2.8 Project 6 Project 6 is a 1,312-ft2, two-story, single-family home constructed in 1920. The building, which is heated with a fuel oil boiler, was modeled in BEopt. Table 11 shows the existing specifications, proposed specifications, and costs.

13
Table 11. Existing and Proposed Specifications and Costs for Project 6
Specifications Existing Post-Retrofit Cost ($)
Exterior Walls Uninsulated, 2 × 6, 24-in. o.c.
R-19, 2 × 6, 5.5-in. cellulose 6,876
Exterior Finish Siding – – Roofing Material Dark asphalt – –
Ceiling/Attic Uninsulated, 2 × 6, 24-in. o.c. R-30, 2 × 6, 24-in. o.c. 2,000
Foundation Uninsulated basement – – Window Area 15% – – Window Type Double clear – –
Infiltration (CFM50) 4,400 3,000 2,800 Ventilation Spot vent – - Appliances All standard – -
Lighting 40% fluorescent 100% fluorescent 270 Cooling SEER 10 – – Heating Fuel oil boiler 73% – – Ducts None – –
Water Heater Fuel oil,indirect off boiler 62% – –
The audit recommendations produced an annualized savings of $2,593 and a rate of return of 30%, as shown in Table 12. These robust savings are likely the result of the high cost of fuel oil and the low insulation levels of the existing house.
Table 12. Cost Analysis for Project 6
Auditor Reported Total Cost ($) 21,926 Modeled Cost (Energy Measures Only, $) 12,946 Annual Modeled Utility Bill Savings ($) 1,643
Source Energy Savings (% Over Existing) 36 Annualized Savings ($) 2,593
Annualized Rate of Return (Real, %) 30 Simple Payback (Years) 7.88
2.9 Audit Analysis Conclusions The modeled results show energy savings of 16%—32% over the existing buildings, along with real annualized rates of return greater than 5%. For most projects, however, the simple payback periods are extremely long. In most cases, the annualized savings from lighting are dominating the analysis because of savings from replacement costs over the life of the fixtures. The space-conditioning system upgrades are not cost effective on their own. Although these projects are cost effective according to modeled energy savings, audit reports should be improved to address several issues. CARB’s observations and recommendations to auditors are as follows:

14
• Most audits included measures that will not save energy. These measures need to be separated to make clear that they are for cosmetic or health and safety reasons only.
• Window upgrades in general could not be justified because there was no improvement in the specifications of the windows. Quoted prices in some cases were far too high for the listed upgrade, and it is unclear how much of the cost is apportioned to maintenance, health, or safety.
• Auditors included the total price of the measure in their cost analyses. Generally, because these buildings have very old systems, the pricing should be compared to the replacement cost.

15
3 Technical Challenges and Recommendations With the Block by Block program in the early stage of operation, research efforts focused on examining the limited number of audit reports available for quality, comprehensiveness, and consistency. Based on a closer look at six buildings for which utility data were available, two primary areas of concern emerged: the energy savings estimates and the costs of the recommended measures. Audit results were found to be highly variable even across very similar buildings. A review of audit reports found that model predictions and energy savings estimates were high and not consistent with actual energy usage data. At a recent Building America team meeting, several researchers raised concerns about the accuracy of building simulation programs when modeling older, poorly insulated buildings. Most of the modeling tools were developed for new construction that performs better. Research into this potential modeling problem is warranted. Using utility data to calibrate the existing building model is an often cited approach to improving accuracy, but it is not apparent that the utility data was entered into the TREAT software in the projects reviewed. Obtaining utility data is difficult, time consuming, and often incomplete even when obtained. Research towards a process that will make household energy use data readily available will enhance future program efforts. Measure cost information is highly variable and there are many plausible explanations including:
• Auditors are often not qualified to provide contractor pricing for the broad spectrum of measures being recommended (i.e., this project revealed that insulation contractors might provide a qualified and competitive price for the insulation measures but might only furnish ballpark estimates for heating system measures).
• Significant remediation costs associated with health and safety are included in the energy efficiency measure costs.
• Total replacement costs are provided instead of the incremental cost of a more energy efficient replacement system.
A reliable third-party resource for efficiency measure cost information such as that under development by the National Renewable Energy Laboratory could help alleviate the inconsistent and unreliable cost information problems.

16
Bibliography Deru, M.; Torcellini, P. (2007). Source Energy and Emission Factors for Energy Use in Buildings. NREL/TP-550-38617. Golden, CO: NREL.
Kempton, W.; Feuermann, D.; McGarity, A. (1987). “Air Conditioner User Behavior in a Master-Metered Apartment Building.” Proceedings of the Fourth Symposium on Improving Building Systems in Hot and Humid Climates. College Station, TX: Energy Systems Laboratory.
NREL (2011). “National Residential Efficiency Measures Database: Retrofit Measures for Duct Sealing.” http://www.nrel.gov/ap/retrofits/measures.cfm?gId=2&ctId=17. Accessed October 4, 2011.
Polly, B.; Gestwick, M.; Bianchi, M.; Anderson, R.; Horowitz, S.; Christensen, C.; Judkoff, R. (2011). A Method for Determining Optimal Residential Energy Efficiency Retrofit Packages. DOE/GO-102011-3261. Golden, CO: NREL.

17
Appendix A: Pratt Retrofit NYC Block by Block Report

A Laboratory for Retrofitting
New York City Neighborhoods
Pratt Center for Community Development
4/24/2012
18

1
The Pratt Center for Community Development works for a more just, equitable, and sustainable city for all New Yorkers by empowering communities to plan for and realize their futures.
As part of Pratt Institute, we leverage professional skills - especially planning, architecture and public policy - to support community-based organizations in their efforts to improve neighborhood quality of life, attack the causes of poverty and inequality, and advance sustainable development.
The Center was founded at the birth of the community development movement, as the first university-based advocacy planning and design center in the U.S. For almost 50 years, we have helped community groups revitalize their neighborhoods, create and preserve affordable housing, build childcare and community centers, and improve their environment. We have trained hundreds of community leaders and organizations to implement effective community development strategies, and supported a wide array of successful public policy and community planning efforts.
Growing awareness of the threat of climate change and its urgency is evident at not only the policy level but at the street level. We have seen again and again that the residents of New York City want to be part of the solution and make their contribution to addressing the challenges of climate change. Pratt is responding to both the policy and the demands of our constituents by weaving sustainable development objectives throughout our work, from community based planning to industrial development.
Retrofit NYC Block by Block uses and the community outreach and organizing strategies of the community development field to address global warming and to promote energy savings and environmental conservation in New York City’s neighborhoods. The initiative is coordinated with Pratt’s Energy $mart Communities contract with the New York State Energy and Research Development Authority (NYSERDA), and the Brooklyn Greens initiative launched in collaboration with the Brooklyn Community Foundation. In addition, Pratt Center also provides technical assistance to community based organizations that conduct outreach under NYSERDA’s Green Jobs Green New York initiative. These programs employ research and demonstration, education and information dissemination, policy advocacy, and technical assistance to help maintain affordable housing, improve public health and stimulate economic development in low-income neighborhoods.
Pratt Center appreciates the amazing commitment and skills of the people and community-based organizations that make this work possible. Retrofit NYC Block by Block is implemented by:
Bedford Stuyvesant Restoration Corporation Chhaya CDC Sustainable South Bronx Neighborhood Housing Services of Staten Island1
1 This report covers the work done by organizations funded by New York City Council Speaker Christine Quinn. Other retrofit campaigns undertaken by Cypress Hills LDC and El Puente CDC and funded separately are not covered in this report.
19

2
Pratt’s sustainability services work is supported by: New York City Council The Brooklyn Community Foundation Con Edison Deutsche Bank of Americas Foundation The Gimbel Foundation Local Initiatives Support Corporation New York State Energy and Research Development Authority The Scherman Foundation State Farm Steven Winter Associates Con Edison National Grid
20

3
Retrofit NYC Block by Block: A Laboratory for Retrofitting Urban Neighborhoods
I. Executive Summary
Through Retrofit NYC Block by Block, Pratt Center for Community Development partnered with four
community development corporations to increase home energy upgrades in New York City through
community-based outreach and engagement. The project enabled our partners, Bedford Stuyvesant
Restoration Corporation (Restoration), Chhaya CDC, NHS of Staten Island and Sustainable South Bronx,
to hire a staff person to educate and recruit residents to retrofit their properties and to partner with
contractors to facilitate the hiring of local residents in jobs created by increased demand for retrofits.2
Pratt Center developed a web-based tracking system to capture program data, convened the groups in
person to best practices and problem-solve challenges, and provided extensive technical support for
their efforts.
Eleven months into full implementation, the project, particularly the strategy of cultivating early
adopters as ambassadors, increased uptake of incentive programs in the targeted neighborhoods.
Nearly 600 homeowners signed up to participate, 207 homeowners received completed energy
assessments of their homes and 105 have implemented energy upgrades. Ten job trainees have been
hired by the two contractors working as partners in the campaigns and more recently, Bedford
Stuyvesant Restoration hired their first eight employees in their new retrofit and home improvement
company, HouseLift by Restoration.
While these numbers represent an uptick in participation in retrofit programs, these outcomes do not
reflect the project’s much higher goals. Although momentum continues to build, our results to date
suggest that in New York City, where home retrofits have historically lagged behind the rest of the state,
community outreach strategies alone are not sufficient to catalyze a level of activity commensurate with
the need.
High on the list of obstacles was the barrier of up-front costs for the improvements by low- and
moderate-income homeowners. Beginning in spring 2012, our partners will promote the new,
innovative financing tool, on-bill recovery, which will enable homeowners to pay for energy
improvements on their utility bills. This dual intervention will be rolled out during the last months of
Retrofit Block by Block and as part of an expanded community outreach effort funded by the New York
State Energy Research and Development Authority’s Green Jobs Green New York Program. It will be
critically important to realize the potential of on-bill recovery to overcome the hurdle of up-front costs
by making it widely and easily available. We are hopeful that this combination of outreach and low-
cost/low-risk financing will create a significant uptick in home retrofits. In addition, we are pleased to
2 A fifth organization, Cypress Hills Local Development Corporation also implemented the Block by Block strategy
under the Brooklyn Community Foundation funded Brooklyn Greens Initiative. Their data was not yet available at the time of this report.
21

4
have been constructive in building capacity among New York City’s nonprofits to engage their
communities in retrofitting their housing.
At the same time, other obstacles related to the nature of New York City’s housing stock and contracting
industry suggest that exploration of alternative strategies for dramatically increasing the level of
retrofits and related jobs is also warranted. More than half the small homes have two to four units,
complicating program intake and implementation. Further, the home improvement contracting industry
in New York City is more fragmented and organized by trade more than it may be in other parts of the
state, making the comprehensive audit approach more difficult to implement here.
Pratt Center plans to research alternative approaches to increasing retrofits. This report describes our
initiative including the obstacles and opportunities we encountered and offers some lessons and
recommendations for increasing retrofits among New York City’s small homes. Promising ideas for
further development include:
Standardize retrofit packages and aggregate installment for similar housing types;
Improve methods to easily track and report on energy savings
Increase regulation at key points, e.g., sale, home improvement, replacement of major systems;
Integrate energy efficiency upgrades into the home improvement industry
Intervene at the time of heating and hot water system replacements
Make the Weatherization Assistance Program (WAP) more widely available and determine
eligibility by census tract in low-income, urban neighborhoods
Integrate weatherization funds with other financing for affordable, healthy homes to address
needed capital repairs and health issues
II. Introduction
Over 600,000 of New York City’s million buildings are one- to four-family homes. These buildings knit
together block after block of New York City’s residential neighborhoods, house approximately 38% of
the city’s residents and generate about 17% 3 of the city’s carbon emissions. Virtually all of these homes
would benefit from upgrades to reduce the use of heating fuel, electricity and water. Wide-scale
retrofits would also reduce owner and tenant costs for heating, electricity and water, improve housing
durability, safety and comfort, and reduce other emissions and excess sewage while adding much-
needed jobs for neighborhood residents.
The Pratt Center for Community Development created Retrofit NYC Block by Block as a research and
demonstration program to learn about the obstacles and opportunities to generating retrofits at
neighborhood scale and to test strategies to increasing retrofits to further both our community
development and sustainability mission. Through this initiative, funded by the New York City Council,
Pratt subcontracts with four neighborhood-based organizations to run campaigns to educate and
3 PlaNYC 2011 Carbon Emissions Inventory (based on 2009 data).
22

5
engage homeowners about how even small improvements can benefit health, housing affordability and
the environment and to enlist homeowners and tenants in the available retrofit incentive programs.
Retrofit NYC is supported by funding from the New York City Council and
administered through a contract with the New York City Department of
Housing Preservation and Development. The project works in tandem with
the Brooklyn Greens initiative, supported by the Brooklyn Community
Foundation, which also employs a block by block strategy to retrofit
neighborhood homes. The initiative was seeded by and benefits from the
New York State Energy and Research Development Authority (NYSERDA)
Energy $mart Communities program, which Pratt coordinates in Brooklyn
and Queens. Retrofit NYC Block by Block relies on existing retrofit incentive
programs to underwrite the cost of implementing retrofit measures. These
include the NYSERDA Green Jobs Green New York Program, the National
Grid Enhanced Home Air Sealing and Insulation Program (discontinued in
September 2011), the federal Weatherization Assistance Program (WAP)
and other programs such as NYSERDA EmPower NY and the Con Edison
Direct Install programs (see incentive program descriptions in the
appendix). Steven Winter Associates provided some assistance analyzing
our data through a US Department of Energy Building America contract that ended October 31, 2011.
II. Retrofit NYC Block by Block
Rationale The financial, environmental, health and even personal comfort benefits of retrofitting have been
known for years, if not decades. However, Pratt Center saw relatively low uptake of the retrofit
incentives from our efforts to enlist building owners through presentations at public meetings and
website resources. Pratt staff observed the following barriers:
1) General lack of awareness about the benefits of energy retrofits: Although the federally funded
Weatherization Assistance program has been retrofitting buildings for thirty years, it is not
common practice to undertake energy assessments or improvements to reduce energy use
among New York City’s homeowners.
2) Multiple financing options are difficult to navigate: A variety of city, state, federal and utility
programs and tax incentives are available but there is no one place where homeowners can
receive information or get guidance on all the options to figure out which is best for them. Most
homeowners do not know their options.
3) High up-front costs: The energy assessments generated through Retrofit NYC typically recommend improvements ranging from $1,000 to as much as $52,000. For most residents, even if the energy savings are projected to pay off those costs in a reasonable amount of time, the required upfront investment is prohibitive. In the current economy, many homeowners are
Figure 1A Bronx resident telling her neighbor about her energy assessment and Home Tune-up Retrofit.
23

6
reluctant to take loans, even low interest loans, particularly in neighborhoods that have seen large numbers of foreclosures.4
In 2009, Pratt collaborated with the Bedford Restoration Corporation to create a pilot project to offer all
the residents on two contiguous city blocks free, comprehensive energy assessments to provide
homeowners with an individualized set of recommendations to make their homes more energy efficient,
healthy, safe and comfortable. Our premise was that neighborhood-based education and outreach
could stimulate uptake, while lowering costs and generating jobs. We followed-up each energy audit
with individualized assistance to access financial incentives. Seventeen homes on those blocks were
audited and 13 implemented some of the measures via comprehensive retrofits, free installation by
Restorations Justice Corps workforce program or homeowner implemented work. The contractor in the
pilot lowered their standard audit fees to participate. In addition 48 free street trees were planted on
the blocks through NYC’s MillionTrees program and the community garden and church on the block
were upgraded by Restoration Corporation’s Justice Corps program.
On July 1, 2010, the New York City Council awarded Pratt funds to expand our initial pilot project to
include retrofit outreach campaigns in four
neighborhoods, Bedford Stuyvesant, Brooklyn;
Jamaica, Queens; NHS Staten Island;
Soundview, Bronx. The Retrofit NYC Block by
Block project:
Relies on community development
corporations to tap their
neighborhood’s networks -- block
associations, religious institutions, civic
associations, and community boards to
increase awareness and educate
residents. The community organizations identify and cultivate early adopters to be local
champions for home upgrades for energy savings to increase awareness through trusted
neighborhood agents.
Provides individualized assistance to residents to find the best package of incentives to meet
their needs, follows through with residents to explain their energy assessment and encourage
them to implement high impact retrofits, facilitating their use of an optimum package of
incentives.
Partners with contractors who demonstrate a high level of competency and customer service as
a means to lower upfront costs and negotiate job opportunities for neighborhood residents.
Refers neighborhood residents to jobs with participating contractors.
4 On-bill recovery, a mechanism that enables homeowners to pay for their retrofits on their utility bills was not
available during the period covered by this report.
24
7
Collects and analyzes outreach building, audit and retrofit data through a shared, web-based
tracking system to learn about best practices in outreach, audits and retrofits for the one- to
four-family housing stock.
Implementation
In November 2010, Pratt Center and our four community partners announced the Retrofit NYC Block by
Block initiative with City Council Speaker Christine Quinn. Because of delays in the contracting process,
the community partners were not able to hire their outreach workers until early 2011, with the
exception of Restoration, which had already hired an outreach worker in fall 2010 using funding from
the Brooklyn Community Foundation. To prepare the new hires, Pratt Center provided a three-day
training session which included an overview of building science and retrofit measures, existing retrofit
incentives and programs, the process of conducting an energy audit and coordinating with contractors
to implement audit recommendations, best practices for conducting homeowner outreach and lessons
learned from our pilot, and our Block by Block tracking system. We additionally developed a step-by-
step guide that suggests strategies to generate local retrofit demand on topics such as the recruitment
of block leaders, conducting post-retrofit meetings, follow-up calls, and other crucial steps to ramping-
up demand. The groups continue to meet monthly to share information and best practices.
Pratt Center mapped each neighborhood for eligibility criteria for the various incentive programs
including income, heating fuel use and number of units. Based on this data and their social networks,
we worked with each partner to designate a target area for their outreach effort. Each partner chose
between two and fifteen blocks.
Retrofit NYC Block by Block was launched in each
neighborhood with a kick-off event announcing the
initiative, inviting the local councilmember and
requesting target block residents to sign up.
Outreach workers also organized and attended
other block, homeowner and civic association
meetings to recruit early adopters and local
champions. The events were held at accessible,
local venues including schools, churches, and
restaurants. Attendance at community events
varied from 20 to 60 individuals. Most events
generated twelve to twenty completed intake
forms. The events attracted local press and
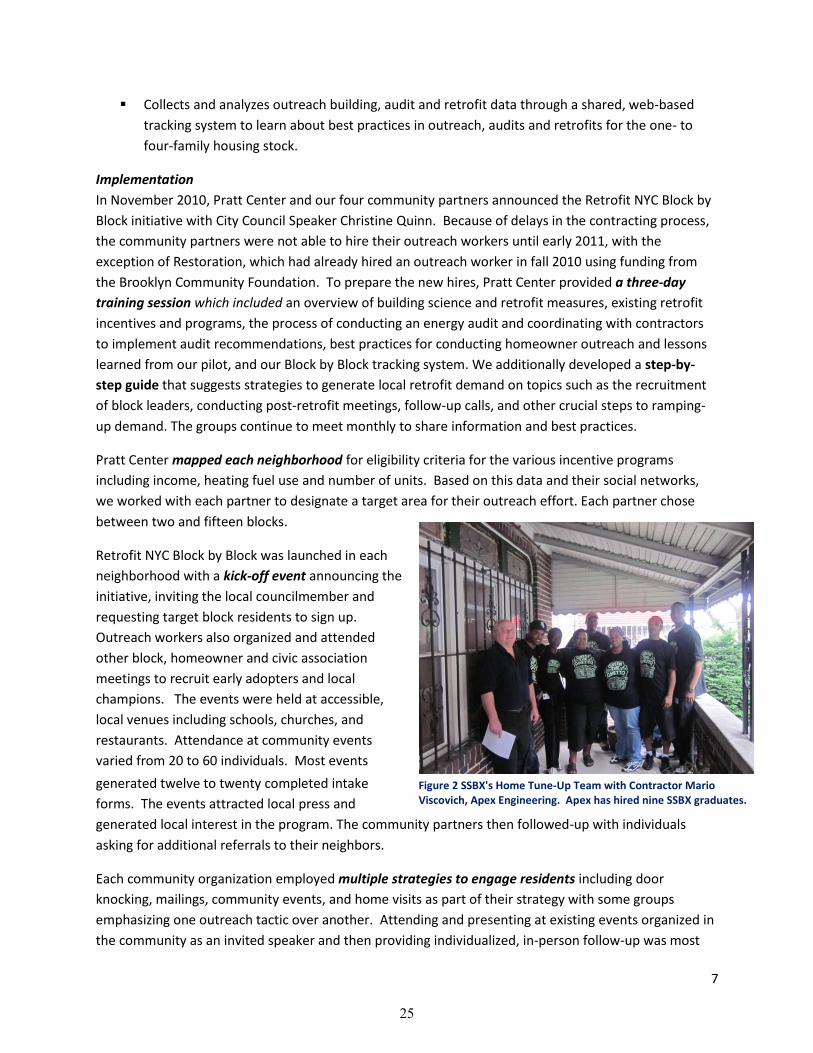
generated local interest in the program. The community partners then followed-up with individuals
asking for additional referrals to their neighbors.
Each community organization employed multiple strategies to engage residents including door
knocking, mailings, community events, and home visits as part of their strategy with some groups
emphasizing one outreach tactic over another. Attending and presenting at existing events organized in
the community as an invited speaker and then providing individualized, in-person follow-up was most
Figure 2 SSBX's Home Tune-Up Team with Contractor Mario Viscovich, Apex Engineering. Apex has hired nine SSBX graduates.
25

8
effective in generating audits and retrofits. Mass mailing and flyers were least effective. Door knocking
was effective only when conducted together with recognized neighbors/block leaders. Referrals from
customers already engaged in the retrofit process also proved to be a successful means of finding more
interested residents.
Pratt subcontracted with Sustainable South Bronx to offer 50 homeowners high-impact, low cost energy
efficiency measures including caulking, weather-stripping, compact fluorescent light bulbs, (CFLS), low
flow shower heads and aerators for free while providing work experience for graduates of the
Sustainable South Bronx BEST for Buildings Program. The Home Tune-up Program was intended to be
used as an incentive to homeowners to undertake an audit while providing paid, part-time work
experience for trainees. Home Tune-up also aimed to encourage homeowners to undertake more costly
measures by reducing overall retrofit costs and to ensure that homeowners move forward with
recommendations in their energy assessment. Home Tune-up increased the number of homes receiving
low-cost retrofit measures and 14 job trainees received some paid work experience, in some cases
leading to jobs. The project only led to homeowners moving forward to a comprehensive retrofit in a
few cases. Recipients, though eager to make the improvements, were reluctant to borrow the money to
make them.
In order to maximize the local economic impact of Block by Block retrofits and ensure green job
creation, Pratt vetted and engaged accredited retrofit contractors. We worked with Laborers’ Local 10,
one of the unions representing retrofit workers, to
identify criteria for vetting contractors according to job
quality and employment practices. We then developed
a contractor vetting questionnaire, and disseminated it
to all of the city’s eligible retrofit contractors in
December 2010 and again in November 2011 (See
Initial Results below for more information). Where
possible, we checked contractor references and made
on-site quality assurance visits. We shared the results
with our community partners who, in turn, formed
strategic alliances with contractors who committed to
hiring local job trainees and maximizing their work’s
impact on Block by Block neighborhoods.
Retrofit NY was integrated with our Sustainable Houses of Worship initiative to retrofit religious buildings and engage congregations in energy efficiency. Through this program, Pratt Center assisted houses of worship in our target communities to conduct energy audits of their properties and to take advantage of resources and incentives provided by Con Edison and NYSERDA to implement energy efficient improvements. We have found that religious buildings can generally save thousands of dollars every year for even modest up-front investment. Pratt also organized a workshop for the managers of religious institutions to learn how to reduce energy costs through management techniques. In Bedford Stuyvesant in particular, the churches have proven to be critical allies, often providing meeting space, participating in energy assessments and improvements themselves and helping to enlist congregants to the cause.
Figure 3Mt Pisgah Church received an audit and implemented measures projected to save $13,000 per year. Reverend Johnny Ray Youngblood is accepting a Beacon of Sustainability plaque; 13 residents signed up for audits that Sunday.
26

9
Pratt Center continues to provide technical support, convenes the community
partners, shares best practices and develops and distributes planning and
implementation tools. For example, Pratt provided decals for the doors of
homeowners who undertook a retrofit to help raise visibility of the initiatives
and created a Guide to Detox homes that offers provocative information
about actions consumers can take to improve the health of their home by
reducing pesticides, harmful cleaning products and the like.
Most importantly, Pratt developed a unique, web-based tracking system to:
1) assist our partners in managing and reaching out to contacts via email and mail merges,
2) track contacts, audits, retrofits and energy saving outcomes for individual homeowners,
neighborhoods and across the project
3) generate reports highlighting trends and key outcomes across New York City
The tracking system came on line and was made available to our partners in July 2011 after an extensive
period of development. It is a unique database of building characteristics, energy usage data, audits,
and retrofits of NYC’s small homes and is able to capture energy assessment and retrofit information
across all incentive programs (NYSERDA, utilities, city, state and federal programs). Pratt is interested in
making it available to other neighborhood retrofit campaigns.
In the last quarter of Retrofit NYC ending June 30, 2012, Pratt will assist our partners to promote on-bill
recovery, the breakthrough financing mechanism by which homeowners can pay for retrofits on their
utility bills. The financing mechanism is being rolled out in spring 2012 after being passed into New York
State law in June 2011.
Pratt Center is providing technical assistance to the 11 community-based organizations/partnerships
working as outreach contractors for the New York State Energy and Research Development Authority
(NYSERDA) under the Green Jobs Green New York project to couple this innovative financing product
with grassroots outreach (the three Retrofit NYC groups that applied to NYSERDA – Chhaya, NHS of
Staten Island and Sustainable South Bronx - are part of partnerships that were awarded outreach
contracts). Even as we aggressively support our CBO partners and NYSERDA, Pratt is mining its data and
the lessons learned from Block by Block to develop alternative ways to reach scale in retrofitting New
York City homes. Meanwhile, we count it as a part of Retrofit NYC Bloc by Block’s successes that
participation in the program has built the capacity of our community based partners to integrate
environmental initiatives into their organizations and helped them qualify for the Green Jobs outreach
contracts.
27

10
III. Results
The following program data represents approximately eleven months of full implementation, from
March 1, 2011 when all the participating community based organizations had their outreach workers in
place to January 31, 2012; Restoration began their outreach July 1, 2010 and this also includes their data
from that time.
At the outset of the project, Pratt and our four community partners set a goal to make 2,000 contacts
with homeowners in each neighborhood in one year. Based on the pilot project, we initially estimated
that approximately 20 percent of all homeowners contacted would apply for an audit and that half of
those would complete an audit (200 homes per neighborhood). We additionally assumed that 80% of all
homeowners who completed the audit would implement at least one retrofit measure (160 per
neighborhood). We also pledged to, collectively, train 30 individuals for retrofit jobs, and to work with
contractors to secure local green employment for trainees.
In eleven months of outreach, each neighborhood met or exceeded annual goals to aggressively reach
out to residents. Over 16,000 homeowners were contacted through four neighborhood retrofit
campaigns through neighborhood meetings, mailings, door-knocking, phone calls and individual
meetings. However, the rates of sign-up were below what we expected based on our pilot project.
B January 31, 2012, 590 homeowners signed up for the program by submitting all necessary
information to be determine eligibility for incentive programs. The highest sign-up rates were in the
neighborhoods that provided the most individualized support to homeowners. About 9% of those
contacted in Bedford Stuyvesant completed intakes, 5% in the Bronx and only 2% in Staten Island and
Queens neighborhoods. Restoration has been conducting outreach the longest and the high number of
block associations in that neighborhoods provide a beneficial social infrastructure that does not exist in
the other neighborhoods, partially explaining their higher rates of enrollment in retrofit programs. NHS
of Staten Island conducted several large mailings which are included in their contacts; if only personal
contacts are considered, the rate of sign-up would likely be higher. Sustainable South Bronx began
relying almost entirely on personal referrals after the initial kick-off event and Restoration continued to
work its network of block associations while NHS of Staten Island working in North Brighton, where
there are fewer block associations, relied on large mailings and flyer distribution.
Of the homeowners that signed up, 207, have completed comprehensive energy assessments. The
energy assessments were primarily completed through the NYSERDA Green Jobs Green NY Program
(GJGNY) Program (50%) and the National Grid Enhanced Air Sealing and Insulation Program (EHSIP)
which was offered in Brooklyn, Queens and Staten Island to National Grid heating gas customers until it
was discontinued in September 2011 (39%). Our data shows that 22 homeowners received audits
through the federal Weatherization Assistance Program (WAP) for people earning below 60% of Area
28
11
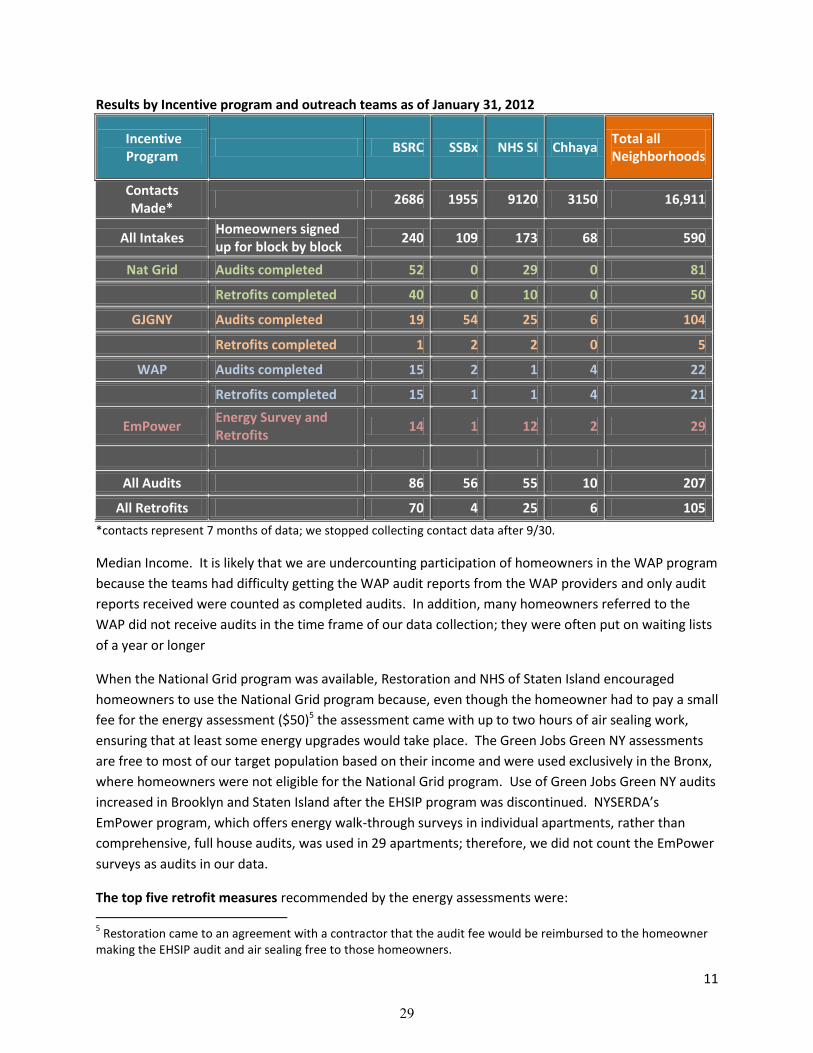
Results by Incentive program and outreach teams as of January 31, 2012
Incentive Program
BSRC SSBx NHS SI Chhaya Total all Neighborhoods
Contacts Made*
2686 1955 9120 3150 16,911
All Intakes Homeowners signed up for block by block
240 109 173 68 590
Nat Grid Audits completed 52 0 29 0 81
Retrofits completed 40 0 10 0 50
GJGNY Audits completed 19 54 25 6 104
Retrofits completed 1 2 2 0 5
WAP Audits completed 15 2 1 4 22
Retrofits completed 15 1 1 4 21
EmPower Energy Survey and Retrofits
14 1 12 2 29
All Audits 86 56 55 10 207
All Retrofits 70 4 25 6 105
*contacts represent 7 months of data; we stopped collecting contact data after 9/30.
Median Income. It is likely that we are undercounting participation of homeowners in the WAP program
because the teams had difficulty getting the WAP audit reports from the WAP providers and only audit
reports received were counted as completed audits. In addition, many homeowners referred to the
WAP did not receive audits in the time frame of our data collection; they were often put on waiting lists
of a year or longer
When the National Grid program was available, Restoration and NHS of Staten Island encouraged
homeowners to use the National Grid program because, even though the homeowner had to pay a small
fee for the energy assessment ($50)5 the assessment came with up to two hours of air sealing work,
ensuring that at least some energy upgrades would take place. The Green Jobs Green NY assessments
are free to most of our target population based on their income and were used exclusively in the Bronx,
where homeowners were not eligible for the National Grid program. Use of Green Jobs Green NY audits
increased in Brooklyn and Staten Island after the EHSIP program was discontinued. NYSERDA’s
EmPower program, which offers energy walk-through surveys in individual apartments, rather than
comprehensive, full house audits, was used in 29 apartments; therefore, we did not count the EmPower
surveys as audits in our data.
The top five retrofit measures recommended by the energy assessments were:
5 Restoration came to an agreement with a contractor that the audit fee would be reimbursed to the homeowner
making the EHSIP audit and air sealing free to those homeowners.
29

12
1) Compact Fluorescent Light bulbs (CFLs) 2) Attic /roof insulation 3) Infiltration reduction/air sealing 4) Door replacement 5) Low flow showerheads
The audits were completed primarily by three contractors.
Virtually all the assessments recommended CFL bulbs, attic roof insulation and air sealing. Assessments
conducted under the National Grid EHSIP program, which did not provide incentives for heating system
improvements, recommended heating system upgrades in only two cases whereas heating system
improvements were a common recommendation in the GJGNY assessments. As a result, the total
package of GJGNY recommendations tends to be much more expensive, averaging $19,211 per home vs.
National Grid averaging $1,071 per home for Retrofit NYC participants. The highest audit package came
in at over $50,000.
To date, 105 homes were upgraded for energy efficiency; 76 (37%) of the 207 homeowners receiving
comprehensive energy assessments implemented energy upgrades on their homes. The energy
upgrades were completed through: the National Grid EHSIP program (50); WAP (21); EmPower, (29);
and Green Jobs Green NY (5). As above, WAP retrofits are likely undercounted because the WAP groups
often do not provide the outreach groups with audit or retrofit information. The retrofits conducted
under the National Grid EHSIP program consist mostly of air sealing work that accompanied the audits.
Most of the measures that were implemented tended to be the relatively low cost, top recommended
measures (see above). We are hoping, with the availability of on-bill recovery, to increase retrofit
uptake in the last quarter.
Workforce Results
Our community partners trained 108 individuals with barriers to employment for green jobs, and had
secured employment for 32 trainees. Nine residents were hired by one contractor; another contractor
hired one. Fourteen Sustainable South Bronx Best for Buildings graduates were given paid, temporary,
part-time placements through the Home Tune-Up program. Bedford Stuyvesant Restoration
Corporation’s new company, HouseLift by Restoration, recently hired their first eight employees.
Discussion of Results
Retrofit NYC Block by Block has increased the uptake of energy assessments and retrofits in the targeted
neighborhoods. However, even in the difficult economic times in which Retrofit NYC Block by Block is
operating and in the relatively low-income communities targeted, we had expected higher rates of audit
completions and energy upgrades.
We anticipate that the availability of on-bill recovery will significantly improve our outcomes; our shared
tracking database will enable our outreach groups to easily circle back to homeowners that have
dropped out at some phase of the process.
30

13
However, we are also aware that New York City has historically had a low rate of retrofits in the
NYSERDA Home Performance Program; we believe NYC represents fewer than 5% of the retrofits
completed statewide. We have seen that, even with increased awareness, many more people signed up
for the programs than undertook retrofits; the rate of follow-through is very low. We suspect that some
of the lackluster performance is related to the relative difficulty of implementing the program in homes
with multiple apartments and tenants, which represents more than half of New York City’s one- to four-
family housing stock. Nearly all the homes that have gone through Home Performance are single-family
homes. Standard audit practices that require participation of all tenants and audit reports geared to
one-family homes is likely to continue to be a hurdle in New
York City. We have found that both landlords and tenants
have some aversion to sharing the income and utility
information needed to qualify for incentives. Pratt Center is
interested in working with NYSERDA and other key
stakeholders to continue to develop solutions to achieve
dramatic increases in energy retrofits among New York City
homeowners.
IV. Interim Observations and Lessons Learned
Retrofit NYC Block by Block was considered by the GJGNY
working groups as a model when the GJGNY outreach was
being designed and many of the lessons we have learned,
obstacles we have encountered and opportunities we are
meeting will apply to these new, expanded efforts. These
lessons and observations follow below.
Community-based outreach
Retrofit NYC Block by Block provides evidence that neighborhood based outreach campaigns can increase
demand for energy assessments and retrofits. Of the 590 homeowners who joined the program, we are
confident that few, if any, would have signed up for energy assessments but for the Retrofit NYC
program. By way of illustration, the two zip codes with the most Green Jobs Green NY audits are the
Bronx and Staten Island neighborhood and half or more of the referrals were from Retrofit NYC partners
NHS of Staten Island and Sustainable South Bronx. In some neighborhoods, all of the audits came from
Block By Block outreach efforts. Community groups found that enrollments were highest in summer
when community outreach is most active and effective, contrary to normal seasonal variations in the
Borough Zip Code
GJGNY Total Referrals
Retrofit NYC Referrals
Percent
Staten Island 10310 21 12 57%
Bronx 10473 30 23 77%
Figure 4 Yury Polonsky, Contractor, Jedidah Baptiste, Restoration Outreach Worker and Irene Evans, former Block Association President working on beautification efforts at the Hancock Street Block Association where 17 homes are being retrofitted.
31

14
Brooklyn 11216 7 5 71%
Brooklyn 11233 17 17 100%
Brooklyn 11221 6 6 100%
industry which see upticks during the
colder months. In seven years of the
availability of Home Performance, 412 New York City homeowners enrolled.
Virtually none of the homeowners we reached out to have heard of an energy retrofit or knew of
anyone who had ever had an energy assessment the first time they were introduced to the initiative.
The initial kick-off meetings provided not just encouragement, but education about the need to save
energy, what energy assessments and retrofits are, how that would help them and the environment,
and explanations of the steps to get an energy assessment for their home. We found that the most
effective outreach workers were persistent and driven about following up with individual homeowners.
By targeting low income people, we have also taken on the toughest neighborhoods. Statewide, Home
Performance has served homeowners with higher incomes who are more likely to qualify for financing
or to be able to pay for home improvements themselves.
Momentum builds over time; local champions can help move toward the “tipping point.” Given the
complexity of this program with its multiple players – Pratt, community partners, contractors, incentive
programs, funders, council members --program ramp-up took time. Furthermore, the campaigns only
begin to build steam when the early adopters become champions, that is, when resident leaders take
responsibility to enlist their neighbors in energy assessments and retrofits. In Bedford Stuyvesant,
where outreach has been in place the longest, the first six months of the campaign saw ten audits
completed and no retrofits (July 1 –December 31, 2010) Restoration is now logging about 15 audits per
month and learning from contractor partners about homeowners who sign up for energy assessments
directly with the contractor, indicating that the initiative is gaining traction. In one case, one
homeowner who became a true believer has recruited 16 homeowners into the program. Similarly, in
the Bronx, once she developed a critical mass of customers who trusted her, the outreach worker began
to rely solely on referrals to enlist homeowners to undertake retrofits. It should be expected in the
GJGNY program, that outreach will gain momentum after about a half-year of program implementation.
According to studies on the widespread adoption of new technologies, there is a “tipping point” when
“early adopters" or “innovators” who adopt the change reach approximately 15% of the target market,
such that it begins to become self-propelling or becomes the norm.6 By way of illustration, Bedford
Stuyvesant has 17,000 buildings; at the point at which we reach 2550 successful retrofits, the market
should take over and an outreach program such as ours will no longer be needed. Retrofit NYC
delivered 70 retrofits in less than a year; we would want to see a much accelerated pace to achieve the
tipping point.
6 Driving Demand for Home Energy Improvements, http://drivingdemand.lbl.gov/Fuller, M., C. Kunkel, M. Zimring,
I. Hoffman, K.L. Soroye, and C. Goldman. LBNL-3960E. September 2010
Figure 5 Retrofit NYC audits completed by the GJGNY program as compared to all GJGNY audits.
32

15
Neighborhoods with well-developed social networks are easier to penetrate. Bedford Stuyvesant, where
the Retrofit NYC Block by Block project was piloted, has a long history of community organization. The
neighborhood has some 200 churches and numerous block associations and civic groups. These
networks, even dormant ones that became reinvigorated through the Retrofit NYC campaign, make
outreach easier and more effective. In North Brighton, Staten Island, where there is less social
infrastructure, or in Jamaica, where networks are organized by language and ethnic group, our outreach
workers have had a slower time finding local champions and building momentum. In these
neighborhoods, individual referrals may be most effective. CBO partners are also working to better
integrate the retrofit outreach with homeownership and financial counseling.
Contractors are critical partners. Nonprofit partners addressed a barrier to homeowner participation by
referring trusted contractors. By engaging with selected contractors, Sustainable South Bronx and
Restoration have found it is easier to coordinate and schedule audit and retrofit appointments with
homeowners as well as to get copies of reports and updates on progress. They find that the
homeowners, with little knowledge about how to screen retrofit contracts, often ask for a referral and
feel most comfortable if the referral comes from a trusted source. Furthermore, contractor
relationships enabled the outreach workers to attend audits, sit in on audit report meetings with the
homeowner and, therefore learn about how the assessments and retrofit programs work in practice.
Contractor partnerships will be essential for implementing aggregation models and getting to scale.
33

16
At the same time, our community partners are not, themselves contractors and, without bidding out the
recommended improvements, they cannot accurately judge whether the prices are competitive. They
are putting their trust with homeowners on the line for a business partner whose main interest is,
explicitly, gaining profitable work. When a partner contractor includes recommendations that seem too
expensive, submit inadequate or late audit reports , or puts costs in the scope that do not appear in the
audit report, it can jeopardize the credibility of the outreach worker and the program. Partnerships with
multiple contractors are most beneficial to foster competition. Sustainable Works in Washington State
offers an alternative approach that separates the audit from the retrofit work and where work is bid out
to qualified contractors by trade, e.g., request bids for insulation of 15 roofs or 10 gas hot water heaters
in one neighborhood.7
Closing the deal requires ongoing assistance. Given that retrofits are relatively unknown, programs are
complicated, and the retrofits require outlay of significant resources, frequent assistance and contacts
with the owner are required. They must follow-up with every individual to complete applications,
ensure they get their assessments and reports and then move forward on at least some upgrades.
Tracking and reporting results are also time consuming. When financial systems to pay for energy
retrofits are better established and the practice is more streamlined, this labor intensive process may no
longer be needed. However, given the current funding and policy environment (e.g., there are no
requirements for homeowners to get energy assessments or improve energy efficiency of their homes)
and the lack of widespread consumer awareness, this individualized approach is warranted.
Messaging for comfort, health and specific homeowner needs is more effective than energy savings.
Homeowners are frequently most satisfied with the improvements to their homes’ comfort and the
benefits to their health. Use of the phrase “energy upgrade” is preferable to “retrofit;” likewise “energy
assessment” is better received than “energy audit.” Until evidence that specific retrofit measures
actually reduce energy consumption becomes more widespread, increased comfort will remain the
strongest, most credible selling point.
Pairing retrofits with behavior change education for homeowners is likely to improve program impacts.
Evidence is increasing that behavioral modifications can make as much difference as physical
improvements in reducing energy use. Education on behavior change should be incorporated into
outreach programs.
Tracking energy use is proving difficult. The Retrofit NYC intake process includes a request for residents’
permission to view and track their utility information and audit reports for research purposes. In most
cases the residents will sign this without hesitation. We wish to track energy use, the most important
benchmark of program success and to provide feedback to homeowners so they can be more
knowledgeable about their use and how they compare to their neighbors. However, securing that
information has proven extremely difficult. We are only able to download Con Edison electrical
information one account at a time and by billing period. Because billing periods vary substantially, e.g.,
they may include one month or several months, it is difficult to compare homeowners’ use over time.
7 Sustainable Works:: http://sustainableworks.com
34

17
National Grid requires a password to view on-line information gas account information. Most often,
homeowners do not have or do not know their password adding a barrier that has made it nearly
impossible to track gas usage.
Retrofit Incentive Program Considerations New York State has one of the most ambitious energy reduction goals in
the nation, to reduce electricity use by 15 percent from forecasted levels
by 2015. To reach that goal, the Public Services Commission oversees the
Energy Efficiency Portfolio Standard (EEPS) and funds a plethora of
incentive programs supported by surcharges to utility customers.
Engaging homeowners in these programs, administered by NYSERDA and
the utility companies, has been the focus of Retrofit NYC Block by Block.
In the absence of regulation, the incentive programs help stimulate
interest; work should be done at the time of audit We find that free or
very low cost measures are needed to motivate homeowners. At the same time, the programs are
complicated to explain and there are multiple programs available, depending on income, heating fuel
and building size. The number of choices and many doors, through which a building owner might enter,
can be confusing to the consumer. In Retrofit NYC, National Grid’s EHSIP Program, which offered air
sealing at the time of the audit and a meaningful incentive for roof insulation, was the most frequently
used program when it was available. While many factors may have influenced that result, we would
conjecture that simple, streamlined programs are easier to understand and use for the outreach worker,
the contractor and the homeowner. Implementing energy upgrades at the time of the energy
assessment generates more energy upgrades than relying on the owners to follow-up the
recommendations in the assessment.
Regulation, in tandem with incentives, has been demonstrated to increase retrofit uptake. Regulations,
such as Boulder Smart Regs, a law requiring the owners of all of Boulder, Colorado’s rental housing to
meet an energy efficiency standard, would likely be more effective in generating scale. In addition,
stricter regulations about upgrading heating systems, hot water heaters, appliances and other
equipment at the time of replacement, would gradually improve the efficiency of systems in use.
Regulations that require energy assessments to be provided to purchasers by homeowners selling their
homes could introduce energy use into the home buying decision, educate purchasers and influence the
market to value energy efficiency.
Low-cost financing is needed to eliminate the obstacle of up-front costs. The average cost of the
recommended measures by Green Job Green NY energy assessments for which we have data (43
reports) is over $19,000. Even if homeowners elect to implement a small portion of the measures, the
retrofits require an outlay of upfront cash that is a well-known obstacle in the retrofit industry.
Furthermore, particularly in the low- and moderate-income neighborhoods in which our partners are
working, many owners are averse to taking loans. They often know of people who have lost their homes
Figure 6 Pratt Center created decals for the doors of homeowners who participated in energy retrofits as one way to raise the visibility of the retrofit work.
35

18
to foreclosure but rarely know of anyone who has benefitted from a retrofit. Finally, of those
homeowners who have applied for low-cost Green Jobs Green NY financing, about half have been
declined for the loans. We are eager to test out the efficacy of on-bill recovery, which allows
homeowners to finance the costs of retrofits on their utility bills, as a market stimulator.
A single point of entry would help increase uptake of retrofits. National Grid, Con Edison and NYSERDA
each provide information about the incentive programs offered by their organizations. Retrofit NYC
plays a role in assisting individuals take advantage of the opportunity that best suits their needs,
interests and budget. Pratt has conceived and conducted initial development of the NYC Energy Funds
Finder which would be a web-based eligibility tool that directs any New York City building owner to the
incentive programs for which they would be eligible. We are seeking resources and partners to
implement the Funds Finder.
Frequently changing incentives are a barrier to scaling up retrofits. During the short course of Retrofit
NYC program implementation, the retrofit incentives and programs available have changed. For
example, the National Grid Enhanced Air Sealing and Insulation Program was shut down with virtually no
notice after being available for less than one year; both homeowners and contractors who were relying
on the program were caught short. While Pratt updates its web resources and let partners know of new
programmatic guidelines and parameters, frequent program design changes add a degree of difficulty
for outreach workers, contractors and homeowners.
Tailor retrofit programs for urban settings. More than half the small homes in NYC are two- to four-
units. Yet the incentive programs are easiest to use for single-family homes. For example, one barrier to
program entry to GJGNY has been the requirement that owners provide a utility use history for all
tenants. The homeowners often do not have access to that information for their tenants and it is not
clear if or how that information is used. In the National Grid program, the program was limited to
homeowners who had direct access to the roof cavity even though the configuration of many New York
City homes is that the owner lives on the ground floor and rents out upper floors. A stumbling block to
participation in the Weatherization Assistance Program is the presence of illegal units, most often in the
basements. Further, audit report templates appear to be designed for the single-family home.
Contractors are not required to list which units/portions of the house have been audited. Finally, the
contractor industry is commonly organized by trade here which may be different than upstate
communities where the retrofit contractors may be general contractors. Designing the programs to
reflect NYC multifamily housing stock and trades-oriented contracting industry would improve uptake.
Comprehensive Energy Assessments
It was a goal of the Retrofit NYC Block by Block initiative to analyze audit data to learn whether and
which recommendations achieved the highest energy savings relative to expenditure and whether
similar buildings consistently need common measures that could be broadly implemented. Indeed, the
audits did result in common recommendations, suggesting that it might be possible and desirable to
36

19
create standard audit packages. Inconsistent audit quality caused us to question whether the individual,
BPI audit is a necessary prerequisite to the retrofit incentive programs.
Audit reports were not persuasive to homeowners: The BPI Energy Assessments required by the
National Grid and Home Performance Programs are expected to be an educational tool as well as a
compelling sales tool. In order for homeowners to easily judge the benefits of the recommended
measures, audit reports should provide a clear, simple list of each recommended measures with its
itemized cost, projected energy savings and payback period. The reports should always include the
homeowner’s current energy use and cost. A common standard, across all programs, requiring this
simple information in a clear format would enable homeowners to make informed, reasoned decisions
to pursue appropriate retrofit measures. The reports received by the homeowners are long and full of
jargon; they are neither clear nor compelling and they require explanation by the contractors and
interpretation by the outreach workers, adding extra labor and cost to the process.
The “comprehensive” energy assessment appears to get skewed to the incentives and /or the expertise
and interests of the contractor: We found a discrepancy in the audits under different programs that we
suspect might relate more to the program than to the differences in the housing stock. The National
Grid program, which paid for
air sealing and insulation,
generated only two heating
system upgrade
recommendations for 82
completed audit reports while
the GJGNY audits included 39
different heating system
recommendations in 57
completed audit reports.
Similarly, there are no
recommended water heater
repairs or replacements in the
82 National Grid reports while
there are eight water heater
related recommendations in the 57 GJGNY reports. We do not conclude that the National Grid
program’s emphasis on insulation is unwarranted, but question whether the energy audits are truly
comprehensive. Furthermore, contractors may be under-recommending items that are not typically
included in their contracts with the homeowner. For example, new appliances would not be in the
scope of work of the contractor but would be a separate purchase by the homeowner. Only four GJGNY
audits recommend a new refrigerator. These issues could be expected to arise in any program designs
where the auditor and the contractor are one and the same.
Some audit reports did not reflect competitive pricing: We have also seen a lot of variance on projected
costs ($15 light bulbs), certain costs omitted (e.g., one audit includes the cost of a new gas boiler but not
the cost of decommissioning the old oil tank). These kinds of discrepancies lead to mistrust by the
84%
82%
64%
91%
66%
52%
82%
4%
92%
84%
Air Sealing
Apartment Lighting Upgrade
Heating System Upgrades
Insulation
Window Door Replacement
Frequency of Recommended Measures By Program
National Grid Green Jobs Green New York
37

20
outreach workers and homeowners. An independent review of six audits by Steven Winter Associates, a
national expert in energy efficiency, found a lot of variability in measure pricing. In one case, an
insulation contractor is listing a $0 cost for items beyond his expertise (heating recommendations). This
is problematic when the audit report is required for financing applications; it adds another step for the
homeowner, a possible deterrent to continuing the retrofit process.
Some audit reports did not appear to be tailored to the individual home: In some cases, auditors seem
to be performing boilerplate audits that repeatedly include the same minor measures. A common
package from one contractor is: replace ten bulbs, replace front door, and add attic insulation. Given the
program emphasis on individualized home assessments, we would expect the assessments to be more
reflective of the particularities of each building and occupant. Some audits are incomplete: they do not
contain adequate basic details about the building such as heating system distribution type and
equipment or a date when the audit took place.
The similar measures across energy audit reports combined with some inconsistencies in audit
completeness and quality and the lack of persuasiveness of the reports to motivate homeowners to
implement measures raises questions about whether they are a necessary prerequisite for energy
efficiency upgrade programs designed to scale up home energy upgrades.
VI. Recommendations for further research and program development
Many, but not all, of the pieces of the retrofit puzzle have been put into place. The community-based
outreach and marketing model represented by Block By Block and now embodied in the Green Jobs
Green NY program will continue to engage more small homeowners than would otherwise join the
existing incentive programs. This outreach is useful to develop early adopters and build momentum.
On-bill financing should remove the financing obstacle and provide a relatively easy and safe way to pay
for retrofit measures. However the slow rate of retrofit uptake in New York City, even with the benefits
of aggressive community outreach, suggest that exploration of alternative strategies for dramatically
increasing the level of retrofits and related jobs is needed. Some of the pieces are still missing.
In the final months of Retrofit NYC Block By Block, Pratt Center and our partners will:
Promote On-Bill Recovery: Pratt Center will work with our community and other industry partners to
realize the potential of on-bill recovery to solve the hurdle of up-front costs. Even though low-cost loans
are available to residents in New York, alternative financial instruments that do not ‘feel’ like a loan
would increase retrofit uptake. We need to make sure to differentiate on-bill recovery from more
traditional loans and to make it widely available for qualified homeowners.
Research and test the hypotheses that similar homes require similar measures that can become a
standard package of measures and that can be aggregated to reduce costs. If a standard package of
cost-effective measures can be identified for New York City’s housing types, and these packages could
38

21
be bid out to achieve cost efficiencies, then we believe costs would come down, the contracting process
would be simplified and it would be possible to ramp up retrofits more quickly and at less cost. Pratt
Center is exploring the feasibility of testing standard packages for similar types of homes.
Pratt will also work with industry partners to:
Develop means for homeowners to easily track and report on energy savings. The difficulty accessing,
tracking and reporting on energy use data is an obstacle to reducing energy use. Customers are willing
to share their energy use information, but records need to be more easily accessible in order to
accurately predict the energy saving potential and ongoing savings of a given dwelling. The entire
retrofit industry would benefit from greater certainty of which measures do or do not save energy for
particular housing types, and the circumstances that influence savings. This analysis will only be
possible when energy use data is available for all retrofitted homes over a period of a few years.
In addition, Pratt will convene industry partners to consider additional ways to scale up home retrofits.
Promising ideas include:
Develop ways to better integrate energy upgrades with existing home improvement
practices. Americans are spending in the range of $300 billion each year improving their
homes.8 It is logical to think that, at the time that the owners are making these
improvements is also when they might consider incorporating energy efficiency
improvements such as insulation, new appliances and light fixtures. Selling retrofits as a
stand-alone upgrade appears more difficult than selling home improvements; we propose
educating contractors and homeowners so that home remodeling integrates best practices
in energy efficiency in order to multiply energy efficiency outcomes. While this is a highly
fragmented industry – small, self-employed contractors make up more than two thirds of
the industry - we believe that directing incentives to home improvement contractors to
include energy efficiency and water saving measures would likely multiply into greater
energy savings than we are seeing by trying to create a stand-alone business model for
energy efficiency.
Increase regulation and incentives at home sales, major home improvements and system
replacement. Increase regulation and incentives related to heating and hot water system
replacements: Regulation, in conjunction with technical assistance and financial incentives
has proven more effective than incentives alone. Sales, major home improvement projects
and systems replacement offer opportunities to regulate improvements in efficiency.
Boilers and hot water heaters are frequently replaced at the point when they break down.
That on-the-spot investment can lead to inefficient fuel use for some thirty years. Energy
efficiency requirements of new systems should be upgraded so that it is not possible to
8 According to the Joint Center for Housing Studies:
http://www.jchs.harvard.edu/publications/remodeling/remodeling2011/r11-1_1_intro_and_summary.pdf
39

22
purchase new, inefficient systems. Furthermore, any time major work is being conducted
on a home (e.g., a permit is required), homeowners and contractors should be encouraged
via to install insulation, upgrade appliances and systems, etc. for energy efficiency.
Integrate education on behavior change: Research suggests that there are significant energy
savings to be gained through behavioral change. Tracking results through energy saving
projections has a tendency to inflate audit results and could ultimately decrease confidence
in the energy assessments. Outreach programs such as Retrofit NYC should combine
behavioral change with energy upgrades and maintain energy savings as the bottom line
outcome.
Other policy recommendations include:
Make the Weatherization Assistance Program (WAP) more widely available and develop
eligibility by census tract in low-income neighborhoods. Given long waiting lists, Retrofit NYC
outreach has had limited success accessing the WAP program for eligible homeowners. In
addition, the eligibility process is extremely time consuming for providers and recipients alike.
We would recommend creating an alternative eligibility for neighborhoods that have a high
percentage of income eligible residents so that the program could be implemented at scale,
improving homes faster and spending fewer resources on bureaucracy.
Integrate weatherization funds with other financing for affordable housing to address needed
capital repairs. Many homes occupied by low-income residents suffer from deferred
maintenance. In particular, we found that roof replacement and mold were frequent problems
that could disqualify homeowners from participation in the Weatherization Assistance Program.
Given these issues, our partner in Cypress Hills found the WAP process so laborious and
ineffective for homeowners in their neighborhood that they are using alternate housing capital
funds to implement a capital repair program that integrates roof and boiler repair and
replacement with weatherization measures.
VII. Conclusions
The Retrofit NYC Block by Block initiative has generated an increase in home retrofits and jobs in the
industry in New York City but not at the scale or pace needed to address the urgency of climate change
or in line with the benefits that would accrue to the homeowners themselves. It has also increased
capacity at the community level and provided experience to suggest new ways of scaling up home
retrofits in New York City. The next year will be crucial as community-based organizations combine
outreach efforts with on-bill recovery to make financing for the up-front costs of energy upgrades widely
and easily available.
40

23
Pratt is planning a study to document the potential, feasibility and reduced costs of adopting
standardized measures for similar housing types to promote the possibility of cost-saving retrofit
aggregation. We are eager to work with stakeholders to dramatically increase the scale of NYC home
retrofits. Promising ideas include:
Standardize retrofit packages and aggregating installment for similar homes
Develop means for homeowners to easily track and report on energy savings
Integrate energy efficiency upgrades into the home improvement industry
Regulate to achieve energy upgrades at sales, home improvements and heating and hot water
system replacements
Make the Weatherization Assistance Program (WAP) more widely available and develop
eligibility by census tract in low-income, urban neighborhoods
Integrate weatherization funds with other financing for affordable, healthy homes to address
needed capital repairs and health issues
In the current context and at month eleven of full implementation, Retrofit NYC Block BY Block is
stimulating demand for energy assessments and retrofits. With on-bill recovery, we see continued
promise in this neighborhood-based approach to cultivate the early adopters as the market develops
and programs and policies are refined.
It is hard to imagine a more important priority than stopping and reversing global warming. It will
require the mobilization of every segment of our population and every sector of our economy. Retrofit
NYC Block By Block offers insights into the challenges and opportunities to achieve the highest level of
participation
41

24
Appendix:
http://prattcenter.net/sites/default/files/users/pdf/homeowners_cutsheet.pdf
42

25
43

44
Appendix B: Example Block by Block Audit Report

45

46

47

48

49

50
51

52
53

54

55

56

57

58

DOE/GO-102012-3631 ▪ October 2012
Printed with a renewable-source ink on paper containing at least 50% wastepaper, including 10% post-consumer waste.