research for rijksinstituut voor...
TRANSCRIPT
research forman and environment
RIJKSINSTITUUT VOOR VOLKSGEZONDHEID EN MILIEUNATIONAL INSTITUTE OF PUBLIC HEALTH AND THE ENVIRONMENT
1) Kiwa Research and Consultancy, P.O.Box 1072, 3430 BB Nieuwegein2) PWN, Water Supply Company North Holland, Lucasweg 2, 2031 BE Haarlem3) SVM, The Foundation for Advancement of Public Health and Environmental Protection, P.O.Box 457,
3720 AL Bilthoven
RIVM report 289202 028
Comparison of methods for enumeration oftotal coliforms and Escherichia coli in watersamples in the Netherlands
F.M. Schets, P.J. Nobel1), S. Strating2), K.A.Mooijman3), G.B. Engels and A. Brouwer1)
March 2001
This investigation has been performed by order and for the account of the GeneralDirectorate for Environmental Protection, directorate of Drinking Water, Water andAgriculture, within the framework of project 289202, Watermicrobiology (MGB projectMGB143).
RIVM, P.O. Box 1, 3720 BA Bilthoven, telephone: 31 - 30 - 274 91 11; telefax: 31 - 30 - 274 29 71
page 2 of 64 RIVM report 289202 028
Abstract
The new European Drinking Water Directive (December 1998) defines a reference methodfor estimating the concentration of coliforms and Escherichia coli in drinking water.Laboratories may use other methods, but should demonstrate that results obtained are at leastas reliable as those produced with the reference method. Three Dutch laboratoriesparticipated in a European trial, in which a protocol for comparing enumeration methods fortotal coliform bacteria and Escherichia coli in water samples was tested. Besides themembrane filtration method on Lactose TTC agar with Tergitol 7 (LTTC) described in ISO9308-1, and the Colilert® method, the Dutch laboratories included membrane filtrationmethods on Laurylsulphate Agar (LSA), Chromocult® Coliform Agar (CCA) and the E. coliDirect Plating method. On LTTC37 significantly more total coliforms were enumerated thanon LSA37; however, the LTTC method was found suitable for analysing very clean(drinking) water samples only, due to its lack of selectivity. The DP method (or Rapid Test inISO 9308-1) is the best method for enumeration of E. coli, while the Colilert® methodproduces 12,5 % false negative E. coli results. Recommendations for making a choice for amethod for detection and enumeration of total coliforms and/or E. coli in water samples withdifferent contamination levels are given.
RIVM report 289202 028 page 3 of 64
SamenvattingDe nieuwe Europese Drinkwater Richtlijn (Anonymous, 1998) schrijft een methode voorvoor de bepaling van het aantal bacteriën van de coligroep en Escherichia coli in drinkwater.Laboratoria mogen andere methoden gebruiken, maar moeten aantonen dat de resultaten diemet deze methoden verkregen worden ten minste zo betrouwbaar zijn als die verkregenworden met de referentiemethode.Er is een protocol voor het vergelijken van referentie en alternatieve methoden ontwikkeld(Fricker, Thames Water Utilities, Engeland; Appendix 1) en een aantal Europese laboratoriaheeft dit protocol getest. De referentie methode voor het bepalen van bacteriën van decoligroep en E. coli in water was hier Lactose TTC agar met Tergitol 7 (LTTC), diebeschreven staat in ISO 9308-1 (Anonymous, 2000). Colilert® (IDEXX Laboratories) werdgebruikt als alternatieve methode.De drie Nederlandse laboratoria die deelnamen aan het onderzoek (RIVM-MGB, Kiwa,PWN) gebruikten naast bovengenoemde methoden ook drie methoden die nu in Nederland ingebruik zijn. Er werden monsters met een verwacht besmettingsniveau van 1-50 bacteriënvan de coligroep per 100 ml geselecteerd. Een totaal aantal van 179 monsters ((verdund)oppervlaktewater, drinkwater (halfproducten)) werd geanalyseerd met behulp van de DirectPlating methode (als snelle test beschreven in ISO 9308-1), Chromocult® Coliform Agar(CCA, Merck), Colilert® en LTTC om E. coli te bepalen. Laurylsulfaat agar (LSA37,Anonymous, 1982)), CCA, Colilert® en LTTC werden gebruikt om bacteriën van decoligroep te bepalen. Van membraanfilters met groei op LTTC en LSA37 werdenkarakteristieke kolonies bevestigd en uit positieve Colilert® wells werden reinculturesgeïsoleerd en bevestigd. Dit rapport beschrijft de resultaten van de Nederlandse deelnemers.Uit paarsgewijze vergelijking van de tellingen met behulp van de "sign test" en de "signed(Wilcoxon) rank test", bleek dat significant (P<0.05) meer bacteriën van de coligroep werdengeteld op LTTC37 dan op LSA37. Alle drie de laboratoria rapporteerden echter achtergrondgroei die 50-100 % van het oppervlak van membraanfilters, geïncubeerd op LTTC bij 37 °C(LTTC37), bedekte. Dit maakte het tellen van de karakteristieke gele kolonies tussen groteaantallen oranje tot bruine kolonies erg lastig. Incubatie van LTTC bij 44 °C (LTTC44)verbeterde dit gebrek aan selectiviteit enigzins. Karakteristieke kolonies die oxidase positiefwaren en door één laboratorium bevestigd werden als Aeromonas, werden regelmatigaangetroffen op LTTC37. De deelnemende laboratoria gebruiken de LSA37 methoderoutinematig en vonden deze eenvoudig uit te voeren en af te lezen. Er werd wel meldinggemaakt van de aanwezigheid van enige storende achtergrondgroei (kleine rose kolonies) bijde analyse van oppervlaktewater monsters. Gemiddeld werd 80 tot 85 % van de isolatenverkregen van resp. LTTC37 en LSA37 bevestigd als bacteriën van de coligroep.Colilert®, de enige MPN methode in dit onderzoek, was erg gebruikersvriendelijk: zowel hetanalyseren van de monsters als het aflezen van de resultaten was eenvoudig. De driedeelnemers telden significant (P<0.05) hogere aantallen bacteriën van de coligroep met dezemethode dan met de andere methoden. Verschillen in tellingen verkregen met demembraanfiltratie methoden op lactosehoudende media en Colilert®, kunnen verklaard

page 4 of 64 RIVM report 289202 028
worden uit het gebruik van verschillende substraten, wat resulteert in de detectie vanverschillende groepen coliformen: op lactosehoudende media vormen bacteriën die zowel hetlacY als het lacZ gen bezitten (coderend voor lactose fermentatie) karakteristieke gelekolonies; bacteriën die alleen het lacZ gen hebben kunnen lactose niet gebruiken en vormengeen gele kolonies, maar geven wel een positief resultaat in Colilert®.Met Colilert® werden significant (P<0.05) lagere aantallen E. coli gevonden dan metLTTC37, LTTC44 en de Direct Plating methode, bovendien werden ook 12,5 % valsnegatieve resultaten voor E. coli waargenomen. Dit bevestigt resultaten uit eerdereonderzoeken. Hieruit bleek dat een deel van de E. coli populatie niet in staat is het Colilert®substraat (een ander substraat dan in de overige methoden) te gebruiken. Hetbevestigingspercentage voor E. coli was zeer hoog: 96 % van de isolaten uit wells diekarakteristieke reacties voor E. coli vertoonden werd als E. coli bevestigd.Concluderend: m.b.v. LTTC37 werden significant meer bacteriën van de coligroepgedetecteerd dan m.b.v. LSA37. Het bevestigingspercentage voor bacteriën van de coligroepwas voor beide methoden vergelijkbaar, maar door gebrek aan selectiviteit is LTTC alleengeschikt voor het onderzoeken van zeer schoon (drink)water. Voor bepaling van E. coli is deDirect Plating methode het meest geschikt; deze methode is eenvoudig uit te voeren endetecteerde meer E. coli dan LTTC37, LTTC44 en Colilert®. Colilert® isgebruikersvriendelijk, maar vanwege het hoge percentage vals negatieven minder geschiktvoor bepaling van E. coli.Er worden aanbevelingen gegeven voor het maken van een keuze voor een methode voorbepaling van bacteriën van de coligroep en/of E. coli in monsters water met verschillendbesmettingsniveau.
RIVM report 289202 028 page 5 of 64
SummaryThe new European Drinking Water Directive (Anonymous, 1998) defines a reference methodfor the estimation of the concentration of total coliforms and Escherichia coli in drinkingwater. Laboratories may use other methods, but should demonstrate that the results obtainedare at least as reliable as those produced by the reference method.A protocol for comparison of reference and alternative methods was developed (Fricker,Thames Water Utilities, UK; Appendix 1) and a number of European laboratories tested thisprotocol. The reference method for determination of total coliforms and E. coli in water wasLactose TTC agar with Tergitol 7 (LTTC), which is described in ISO 9308-1 (Anonymous,2000); Colilert® (IDEXX Laboratories) was used as an alternative method.The three Dutch laboratories (RIVM-MGB, Kiwa, PWN) that joined in the trial also includedthree methods that are currently used in the Netherlands. Samples with an expectedcontamination level of 1-50 coliforms per 100 ml were selected. A total number of 179samples ((diluted) surface water, drinking water (half products)) were analysed by using theDirect Plating method (described as Rapid Test in ISO 9308-1), Chromocult® Coliform Agar(CCA, Merck), Colilert® and LTTC to enumerate E. coli. Laurylsulphate agar (LSA37,Anonymous, 1982), CCA, Colilert® and LTTC were used to enumerate total coliforms. Frompositive membrane filters on LTTC and LSA37, characteristic colonies were confirmed andfrom positive Colilert® wells pure cultures were obtained and confirmed. This reportdescribes the results obtained by the Dutch participants.Pairwise comparison of the count results by using the sign test and the signed rank(Wilcoxon) rank test, showed that LTTC37 enumerated significantly more (P<0.05) totalcoliforms than LSA37. However, all three laboratories reported background growth as highas 50-100 % coverage of membrane filters that were incubated on LTTC at 37 °C (LTTC37).This made counting of the characteristic yellow colonies amongst a crowd of orange to browncolonies very difficult. Incubation at 44 °C (LTTC44) slightly improved this lack ofselectivity. Characteristic yellow colonies being oxidase positive (and confirmed asAeromonas by one laboratory) were regularly observed on LTTC37. The participatinglaboratories use the LSA37 method routinely and found it easy to perform, although somedisturbing background growth (small pink colonies) was reported when analysing surfacewater samples. An average of 80 to 85 % of the isolates obtained from resp. LTTC37 andLSA37 was confirmed as total coliforms.Colilert®, the only MPN method included in the trial, was very convenient: analysingsamples and reading results was easy. The three participants enumerated significantly(P<0.05) higher numbers of total coliforms with this method than with the other methods.Differences in counts obtained with membrane filtration methods on lactose containing mediaand Colilert® can be explained from the different substrates that are used resulting in thedetection of different groups of coliform bacteria: on lactose containing media bacteriahaving both the lacY and the lacZ coding for lactose fermentation form charcteristic yellowcolonies; bacteria having only the lacZ gene cannot use lactose and do not form yellowcolonies, but do give a positive result in Colilert®.

page 6 of 64 RIVM report 289202 028
Colilert® enumerated significantly (P<0.05) less E. coli than LTTC37, LTTC44 and theDirect Plating method; 12.5 % false negative E. coli results were also observed. Thisconfirms results from previous research, which showed that a part of the E. coli populationwas not able to use the Colilert® substrate for E. coli detection, which differs from substratesin the other methods. From 96 % of the Colilert® wells that showed a positive reaction for E.coli, E. coli could be isolated.In conclusion: LTTC37 detected significantly more total coliforms than LSA37, confirmationrates were comparable, but due to lack of selectivity LTTC is suitable for monitoring of veryclean (drinking) water samples only.For enumeration of E. coli, the Direct Plating method is the most suitable method: the methodis easy to perform and detected more E. coli than LTTC37, LTTC44 and Colilert®. Colilert®is userfriendly, but due to a high percentage false negative results considered less suitable forenumeration of E. coli.Recommendations for making a choice for a method for detection and enumeration of totalcoliforms and/or E. coli in water samples with different contamination levels are given.

RIVM report 289202 028 page 7 of 64
Abbreviations
BBLB Brilliant Green Bile Lactose BrothCCA Chromocult® Coliform AgarDP Direct PlatingDW Drinking WaterDWI Drinking Water InspectorateEN Europese NormISO International Organisation for StandardisationLSA Laurylsulphate AgarLTTC Lactose TTC agar with Tergitol 7MPN Most Probable NumberMUG 4-methyllumbelliferyl-β-D-glucuronideONPG ortho-nitrofenyl-β-α-galactopyranosidePS Peptone SalinePWN Water Supply Company North HollandRIVM-MGB National Institute of Public Health and the Environment - Microbiological
Laboratory for Health ProtectionTB Tryptophane BrothTBA Tryptone Bile Agar
TSA Tryptone Soy Agartotcol Total Coliforms
page 8 of 64 RIVM report 289202 028
Contents
1. Introduction 9
2. Materials and methods 11
2.1 Samples 11
2.2 Methods per laboratory 11
2.3 Method description 11
2.3.1 Colilert® 112.3.2 Lactose TTC with Tergitol 7 (LTTC) 112.3.3 Laurylsulphate Agar (LSA) 122.3.4 Chromocult® Coliform Agar (CCA) 122.3.5 E. coli Direct Plating Method (DP) 12
2.4 Quality control 12
2.5 Additional confirmation 13
2.6 Statistical evaluation 14
3. Results 15
3.1 Count results 15
3.2 Comparing count results per laboratory 16
3.3 Confirmation 21
3.4 Practical aspects of methods 22
4. Discussion 25
5. Conclusions 27
6. Recommendations 27
Acknowledgements 28
References 29
Appendices 31
Appendix 1 A draft protocol for comparison of the EU reference method for coliforms and E.coli withalternative culture methods 32
Appendix 2 Short description of sample sites 38Appendix 3 Description of Colilert®-18 39Appendix 4 Description of the Chromocult® Coliform method 40Appendix 5 The number of total coliforms (totcol) and E. coli per 100 ml in samples analysed by Kiwa
with different methods 41Appendix 6 The number of total coliforms (totcol) and E. coli per 100 ml in samples analysed by PWN
with different methods 42Appendix 7 The number of total coliforms (totcol) and E. coli per 100 ml in samples analysed by
RIVM-MGB with different methods 44Appendix 8 European method comparison trial: final report. Colin R. Fricker, Seppo I. Niemela
& John L. Lee, September 2000 46Appendix 9 Mailing list 64

RIVM report 289202 028 page 9 of 64
1. IntroductionThe new European Drinking Water Directive (Anonymous, 1998) defines reference methodsfor the enumeration of microbiological parameters in drinking water. Member states may usealternative methods, in case they have demonstrated that these methods produce results thatare at least as reliable as those produced by the reference methods. Most of the referencemethods chosen are ISO (International Oragnisation for Standardisation) and EN (EuropeseNorm) methods, some of them recently revised.
For many member states the methods defined as reference methods in the new DrinkingWater Directive, are different from the methods currently used in their laboratories.Laboratories that wish to continue the use of their ‘own’ methods will be regularly confrontedwith the problem of having to prove these methods being as good as the reference method.This resulted in the need for a protocol that describes how such a test should be performed togive a statistically reliable outcome. Within ISO, a working group (ISO TC147/SC4/WG12"Analytical Quality control") is in charge of producing an ISO document for comparingmicrobiological methods titled ‘Equivalence of microbiological quantitative culturalmethods’. For the purpose of the comparison of methods for total coliforms and Escherichiacoli in this study, a protocol was developed on basis of a Drinking Water Inspectorate (DWI,UK) document ("Comparison of Methods for Drinking Water Bacteriology – CulturalTechniques’) by C. Fricker (Thames Water Utilities, UK) in cooperation with the participantsin this study. The applied protocol is inserted in Appendix 1 of this report.
According to this protocol, methods are compared based on the recovery of the targetorganisms and the number of false positive results. An alternative method will be rejected if itshows significantly lower average counts than the reference method. It will be accepted if it isbetter or if it is “no different”, and the 95 % confidence interval for the average differencelies entirely above the value which would indicate that the alternative method was finding "10 % fewer organisms than the reference method. Comparison of the fraction of false positiveresults can be obtained by estimating the true positive rate of the methods. In order todetermine this true positive rate, colonies should be confirmed. The true positive rate is thefraction of the tested typical colonies confirmed positive.
Participating countries in the test trial of the "Draft protocol for comparison of the EUreference method for coliforms and E. coli with alternative culture methods" (Appendix 1)were to examine 150 samples with an expected total coliform count of 10-50 per 100 ml and50 samples with an expected total coliform count of 1-10 per 100 ml. For each country, thisworkload could be divided over a number of participating laboratories. Methods to be usedwere the membrane filtration method described in ISO 9308-1 (Anonymous, 2000), in whichmembrane filters were incubated on Lactose TTC agar with Tergitol 7 (LTTC) and thecommercially available Colilert®18/QuantiTray (Colilert®) system which has a MostProbable Number (MPN) format. To suppress expected background growth due to lack ofselectivity of the LTTC medium, for each sample a membrane filter was incubated on LTTC
page 10 of 64 RIVM report 289202 028
at (44 � 0.5) °C, in addition to the usual incubation at (36 � 2) °C. Participating laboratorieswere to confirm at least 100 colonies from LTTC and 200 positive wells from Colilert®.
Three Dutch laboratories participated in the European trial: National Institute of PublicHealth and the Environment, Microbiological Laboratory for Health Protection (RIVM-MGB), Kiwa Research and Consultancy (Kiwa) and Water Supply Company North Holland(PWN). Besides the methods prescribed in the protocol, they also analysed their samples withthree methods that are currently used in the Netherlands for the enumeration of totalcoliforms and E. coli, which differ from the methods included in the European trial. Theyanalysed a total of 179 samples using LTTC, Colilert®, the E.coli Direct Plating method,Laurylsulphate Agar (LSA) and Chromocult® Coliform Agar (CCA). This report describesthe results obtained by the Dutch laboratories. The methods used were compared on basis oftheir count results and confirmation rates, but practical aspects such as readability of resultsand user friendliness were also considered.
The final report of the European Trial, in which 20 laboratories participated and used themethods prescribed in the protocol only, is inserted in Appendix 8 of this report.
RIVM report 289202 028 page 11 of 64
2. Materials and methods
2.1 Samples
Samples were taken according to NEN 6559 (Anonymous, 1992), cooled and transported tothe laboratories, where they were stored at 2-8 °C , if necessary, and analysed within 24hours. Samples were taken at different sites, a description of each sample site and the sampletype is summarized in Appendix 2. A total of 179 samples was analysed (RIVM-MGB 80,Kiwa 38, PWN 61). Surface water samples were diluted in peptone saline (PS: 0.1 % peptonein 0.09 % saline) to obtain an expected count of 1-50 total coliforms per 100 ml. Dilutedsamples with this target were considered natural samples and 100 ml of these samples wasanalysed per method. Counts were not corrected for the dilution.
2.2 Methods per laboratory
RIVM-MGB, Kiwa and PWN enumerated total coliforms by using Colilert®, Lactose TTCwith Tergitol 7 (LTTC) and Laurylsulphate Agar (LSA). Kiwa used Colilert® and LTTC(both at (36 ± 2) and at (44 ± 0.5) °C) to enumerate E. coli, RIVM-MGB added the E. coliDirect Plating (DP) method to these methods, whereas PWN added Chromocult® ColiformAgar (CCA) to enumerate both total coliforms and E. coli. The methods were performedaccording to the brief descriptions in the next paragraph.
2.3 Method description2.3.1 Colilert®100 ml water sample is mixed with a fixed amount of Colilert® reagent, the mixture ispoured into a Quanti-Tray, which has a 51-well MPN format. The tray is sealed andincubated at (37 � 1) °C for 18-22 h. Total coliform positive wells display a yellow color,whereas E. coli positive wells are yellow and fluoresce under UV light (365 nm). By meansof a MPN table (provided with the system) counts of the number of positive wells can betransferred to a Most Probable Number (MPN) of the target organisms.The Colilert® method is described in detail in the user instruction that is inserted inAppendix 3.
2.3.2 Lactose TTC with Tergitol 7 (LTTC)The sample is filtered through a 0.45 �m pore size membrane filter, which is incubated onLTTC for (21 � 3) h at (36 � 2) °C. Typical lactose positive colonies are yellow. Arepresentative number of typical colonies (at least 10) is subcultured onto Tryptone Soy Agar(TSA), which is incubated at (36 � 2) °C for (21 � 3) h. Material from the TSA plate is usedfor oxidase tests and is also inoculated into Tryptophane Broth (TB), which is incubated for(21 � 3) h at (44 � 0.5) °C and examined for the production of indole by adding 0.2-0.3 ml

page 12 of 64 RIVM report 289202 028
Kovacs’ reagent. Lactose positive colonies being oxidase negative are total coliforms; lactosepositive colonies being oxidase negative and indole positive are E. coli.This method and the composition of the used media are described in detail in ISO 9308-1(Anonymous, 2000).
2.3.3 Laurylsulphate Agar (LSA)A water sample is filtered through a 0.45 �m pore size membrane filter, which is incubatedon LSA for (5 � 1) h at (25 � 1) °C, followed by (14 � 2) h at (37 � 1) °C. At least 5 typicalyellow colonies are selected for confirmation in Brillant Green Bile Lactose Broth (BBLB),which is incubated at (37 � 1) °C. The tubes are examined for gas production after (22 � 2) hand (44 � 4) h. Yellow colonies which produce gas in BBLB are total coliforms.This method and the composition of the used media are described in detail in NEN 6571(Anonymous, 1982).
2.3.4 Chromocult® Coliform Agar (CCA)Filtration of a sample through a 0.45 �m pore size membrane filter is followed by incubationof the membrane filter on CCA. PWN incubated the agar plates for (5 ± 1) h at (25 ± 1) °Cand (14 ± 2) h at (37 ± 1)°C, which is different form the incubation prescribed by themanufacturer. Total coliforms produce salmon to red colonies, whereas E. coli forms dark-blue to violet colonies. For confirmation of presumptive E. coli the dark-blue colonies areoverlayed with a drop of Kovacs’ reagent. A positive reaction (cherry-red coloring of thecolony ) confirms the presence of E. coli.A detailed describtion of this method is inserted in Appendix 4.
2.3.5 E. coli Direct Plating Method (DP)After filtration of a sample through a 0.45 �m poresize membrane filter, the membrane filteris incubated on TSA for 4 –5 h at (36 � 2) °C, transferred to Tryptone Bile Agar (TBA) andincubated for 19-20 h at (44 � 0.5) °C. Colonies are stained with James reagent (bioMerieux);cherry-red colonies are E. coli.The E. coli DP method is described as Rapid Test in ISO 9308-1 (Anonymous, 2000).
2.4 Quality control
The participating Dutch laboratories used positive and negative controls and blanc samples asprescribed by their own individual quality control systems. They all used E. coli WR1 andEnterobacter cloacae WR3 as reference strains. Quality control data are not shown sincethere were no deviations.

RIVM report 289202 028 page 13 of 64
2.5 Additional confirmation
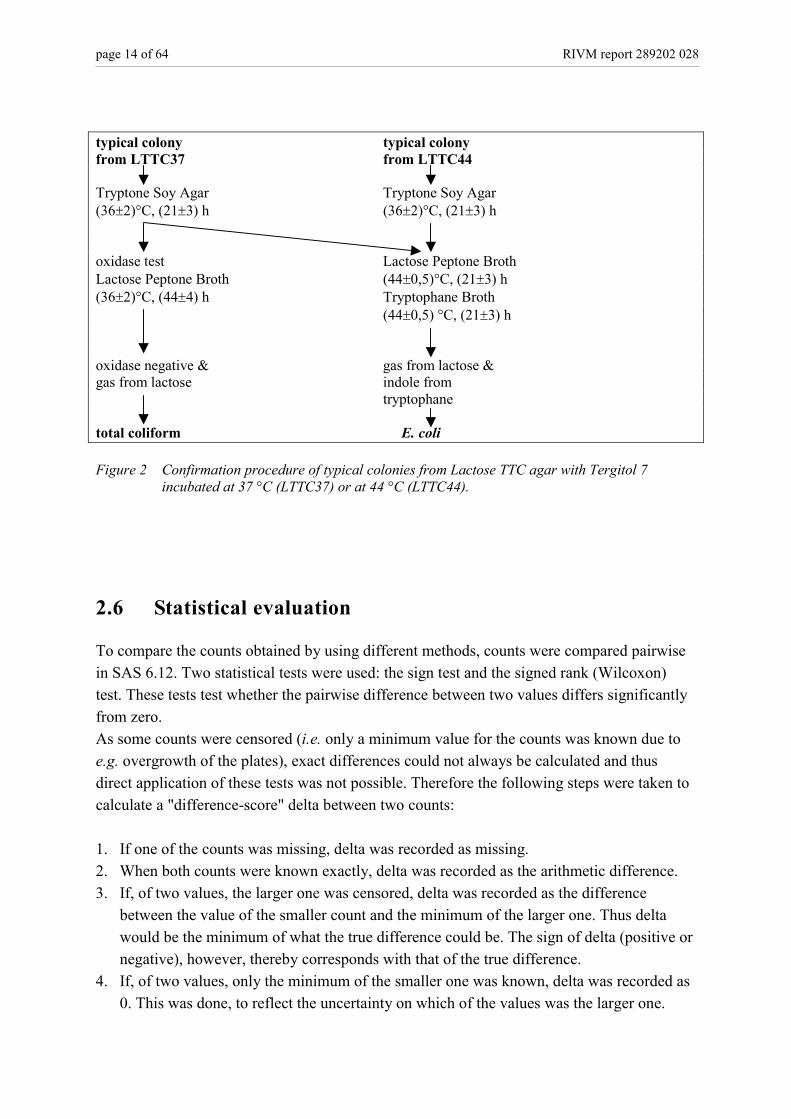
To assess the true positive rate, which is the fraction of the tested typical colonies confirmedpositive, for each method (whenever applicable) additional confirmation tests wereperformed. LSA37 and CCA were confirmed as described in paragraph 2.3.3 and 2.3.4;E.coli DP counts were not further confirmed, since the method already includes testing forindole production. From total coliform positive (yellow) and E. coli positive (yellow andfluorescence) Colilert® wells material was subcultured on MacConkey agar no. 3 (Oxoid) toobtain pure cultures which were confirmed according to the flow chart in Figure 1.Characteristic colonies from LTTC incubated at (36 ± 2) °C (LTTC37) and at (44 ± 0.5) °C(LTTC44) were confirmed following the flow chart in Figure 2.
yellow well yellow and fluorescent well
MacConkey MacConkey(36�2)°C, (21�3) h (44�0,5)°C, (21�3) h
select lactose select lactosepositive colony positive colony
Lactose Peptone Broth Lactose Peptone Broth(36�2)°C, (44�4) h (44�0,5)°C, (21�3) hTryptone Soy Agar Tryptophane Broth(36�2)°C, (21�3) h (44�0,5)°C, (21�3) h
oxidase test gas from lactose &indole from tryptophane
oxidase negative &gas from lactose
total coliform E. coli
Figure 1 Confirmation procedure of total coliform positive (yellow) and E. coli positive (yellow andfluorescence) Colilert® wells.
page 14 of 64 RIVM report 289202 028
typical colony typical colonyfrom LTTC37 from LTTC44
Tryptone Soy Agar Tryptone Soy Agar(36�2)°C, (21�3) h (36�2)°C, (21�3) h
oxidase test Lactose Peptone BrothLactose Peptone Broth (44�0,5)°C, (21�3) h(36�2)°C, (44�4) h Tryptophane Broth
(44�0,5) °C, (21�3) h
oxidase negative & gas from lactose &gas from lactose indole from
tryptophane
total coliform E. coli
Figure 2 Confirmation procedure of typical colonies from Lactose TTC agar with Tergitol 7incubated at 37 °C (LTTC37) or at 44 °C (LTTC44).
2.6 Statistical evaluation
To compare the counts obtained by using different methods, counts were compared pairwisein SAS 6.12. Two statistical tests were used: the sign test and the signed rank (Wilcoxon)test. These tests test whether the pairwise difference between two values differs significantlyfrom zero.As some counts were censored (i.e. only a minimum value for the counts was known due toe.g. overgrowth of the plates), exact differences could not always be calculated and thusdirect application of these tests was not possible. Therefore the following steps were taken tocalculate a "difference-score" delta between two counts:
1. If one of the counts was missing, delta was recorded as missing.2. When both counts were known exactly, delta was recorded as the arithmetic difference.3. If, of two values, the larger one was censored, delta was recorded as the difference
between the value of the smaller count and the minimum of the larger one. Thus deltawould be the minimum of what the true difference could be. The sign of delta (positive ornegative), however, thereby corresponds with that of the true difference.
4. If, of two values, only the minimum of the smaller one was known, delta was recorded as0. This was done, to reflect the uncertainty on which of the values was the larger one.

RIVM report 289202 028 page 15 of 64
3. Results
3.1 Count results
Confirmed (whenever applicable) count results are summarized in Appendix 5 (Kiwa),6 (PWN) and 7 (RIVM-MGB). These results were used to compare a set of methods thatenumerated total coliforms and a set of methods that enumerated E.coli. Comparisons weremade for each laboratory individually. The count results of individual samples were summedper laboratory and an average count per 100 ml was calculated for each method. The resultsof these calculations are displayed in Table 1.All laboratories had highest average total coliform counts with Colilert®, whereas LTTC37and LSA37 gave similar average counts. Both Kiwa and PWN found highest average E. colicounts on LTTC37. However, at RIVM-MGB average E. coli counts on LTTC37, LTTC44and with Colilert® were similar, but the E.coli DP method gave a higher average count.The number of samples that was found positive for total coliforms or E. coli was calculated;the membrane filtration methods done by all laboratories (LSA37 and LTTC37 for totalcoliforms and LTTC37 and LTTC44 for E. coli) were compared with Colilert® (Table 2).
Table 1 Average total coliform counts and E. coli counts in a set of samples, calculated for eachlaboratory and per method used (nd = not done);LSA37, LTTC37 and LTTC44 counts areconfirmed counts, all others are not.
total coliformslaboratory average count per 100 ml with
LSA37 LTTC37 Colilert® CCA
Kiwa 32.5 36.6 50.1 ndPWN 6.1 7.4 30.3 9.1RIVM-MGB 18.9 14.9 72.2 nd
E. colilaboratory average count per 100 ml with
LTTC37 LTTC44 Colilert® CCA DP
Kiwa 20.7 18.2 14.5 nd ndPWN 5.3 3.7 4.1 2.8 ndRIVM-MGB 13.7 13.8 14.0 nd 21.4

page 16 of 64 RIVM report 289202 028
Table 2 The number of samples positive or negative for total coliforms or E. coli with membranefiltration methods (mf; LSA37 and LTTC37 for total coliforms, LTTC37 andLTTC44 for E. coli) or Colilert®.
total coliforms E. coli
mf positive mf negative mf positive mf negative
Colilert® positive 144 21 129 2Colilert® negative 1 5 13 27
3.2 Comparing count results per laboratory
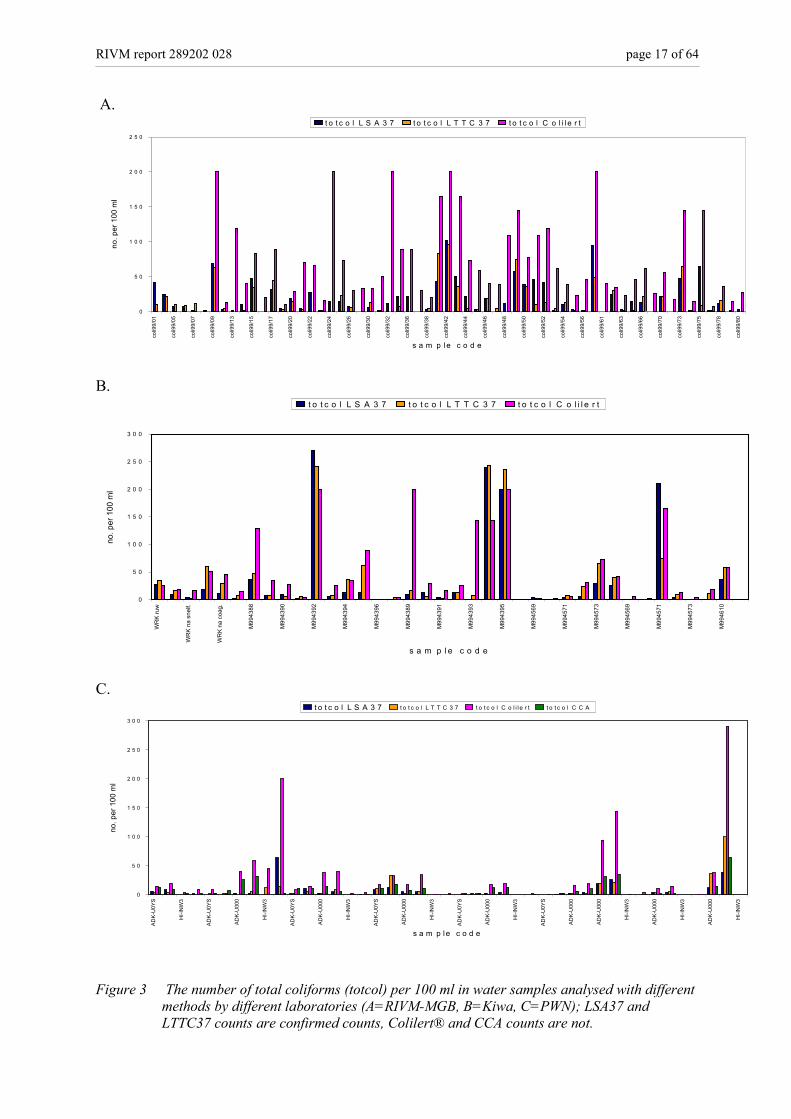
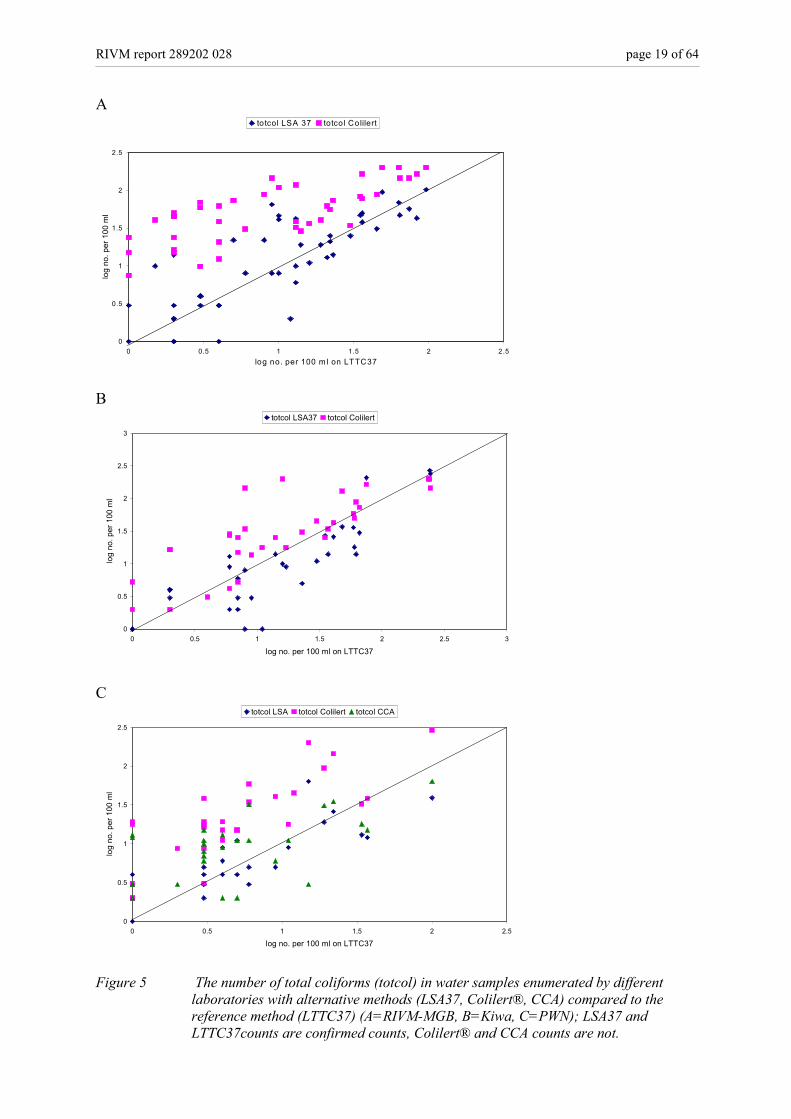
For each laboratory the count results inserted in Appendices 5-7 were used to compare themethods. In these data sets all results with a smaller than (<) sign were replaced by zero’s andall samples that had infinite counts (indicated by >) with one or more methods werediscarded. Results are displayed in simple bar charts with the sample code on the X-axis andthe number of target organisms on the Y-axis to visualize trends in the performance of themethods. Bar charts of total coliform counts are displayed in Figure 3; they show that themembrane filtration methods (LTTC37, LSA37, CCA) give similar results and that the MPNmethod Colilert® gives higher counts, especially at RIVM-MGB; both at PWN and at Kiwaincidental peaks are observed. E. coli bar charts (Figure 4) show that there are no distinctdifferences between LTTC37, LTTC44, CCA and Colilert®, but that most DP data points areabove the data points obtained with the other methods.The results are also displayed in scatter charts with log transformed LTTC37 counts on theX-axis as reference method, log transformed counts obtained with the other methods on theY-axis and a line of equality drawn in the chart. Figure 5 shows that LSA37 and LTTC37perform almost similar, although LSA37 shows a tendency towards somewhat lower counts.For all three laboratories Colilert® counts are above the line of equality, indicating that theyare higher than LTTC37 counts. Counts on CCA obtained by PWN vary and are sometimeshigher, sometimes lower than LTTC37 counts. PWN appears to have highest E. coli countswith LTTC37, since most data points obtained with other methods appear below the line ofequality (Figure 6C). Kiwa obtained comparable results with the methods they used (Figure6B) and for RIVM-MGB again DP counts were higher (Figure 6A).
RIVM report 289202 028 page 17 of 64
A.
0
5 0
1 0 0
1 5 0
2 0 0
2 5 0
coli9
9/01
coli9
9/05
coli9
9/07
coli9
9/09
coli9
9/13
coli9
9/15
coli9
9/17
coli9
9/20
coli9
9/22
coli9
9/24
coli9
9/26
coli9
9/30
coli9
9/32
coli9
9/36
coli9
9/38
coli9
9/42
coli9
9/44
coli9
9/46
coli9
9/48
coli9
9/50
coli9
9/52
coli9
9/54
coli9
9/56
coli9
9/61
coli9
9/63
coli9
9/66
coli9
9/70
coli9
9/73
coli9
9/75
coli9
9/78
coli9
9/80
s a m p l e c o d e
no. p
er 1
00 m
lt o t c o l L S A 3 7 t o t c o l L T T C 3 7 t o t c o l C o l i l e r t
B.
0
5 0
1 0 0
1 5 0
2 0 0
2 5 0
3 0 0
WR
K ru
w
WR
K na
sne
lf.
WR
K na
coa
g.
M99
4388
M99
4390
M99
4392
M99
4394
M99
4396
M99
4389
M99
4391
M99
4393
M99
4395
M99
4569
M99
4571
M99
4573
M99
4569
M99
4571
M99
4573
M99
4610
s a m p l e c o d e
no. p
er 1
00 m
l
t o t c o l L S A 3 7 t o t c o l L T T C 3 7 t o t c o l C o l i l e r t
C.
0
5 0
1 0 0
1 5 0
2 0 0
2 5 0
3 0 0
ADK-
U0Y
S
HI-I
NW
3
ADK-
U0Y
S
ADK-
U00
0
HI-I
NW
3
ADK-
U0Y
S
ADK-
U00
0
HI-I
NW
3
ADK-
U0Y
S
ADK-
U00
0
HI-I
NW
3
ADK-
U0Y
S
ADK-
U00
0
HI-I
NW
3
ADK-
U0Y
S
ADK-
U00
0
ADK-
U00
0
HI-I
NW
3
ADK-
U00
0
HI-I
NW
3
ADK-
U00
0
HI-I
NW
3
s a m p le c o d e
no. p
er 1
00 m
l
t o t c o l L S A 3 7 t o t c o l L T T C 3 7 t o t c o l C o l i l e r t t o t c o l C C A
Figure 3 The number of total coliforms (totcol) per 100 ml in water samples analysed with differentmethods by different laboratories (A=RIVM-MGB, B=Kiwa, C=PWN); LSA37 andLTTC37 counts are confirmed counts, Colilert® and CCA counts are not.

page 18 of 64 RIVM report 289202 028
A
0
2 0
4 0
6 0
8 0
1 0 0
1 2 0
1 4 0
1 6 0
coli9
9/01
coli9
9/03
coli9
9/05
coli9
9/07
coli9
9/09
coli9
9/13
coli9
9/15
coli9
9/17
coli9
9/20
coli9
9/22
coli9
9/24
coli9
9/26
coli9
9/29
coli9
9/31
coli9
9/33
coli9
9/37
coli9
9/41
coli9
9/43
coli9
9/45
coli9
9/47
coli9
9/49
coli9
9/51
coli9
9/53
coli9
9/55
coli9
9/60
coli9
9/62
coli9
9/64
coli9
9/68
coli9
9/70
coli9
9/73
coli9
9/75
coli9
9/78
coli9
9/80
s a m p le c o d e
no. p
er 1
00 m
lE . c o l i L T T C 3 7 E . c o l i L T T C 4 4 E . c o l i C o l i l e r t E . c o l i D P
B
0
5 0
1 0 0
1 5 0
2 0 0
2 5 0
WR
K ru
w
WR
K na
sne
lf.
WR
K na
coa
g.
M99
4388
M99
4390
M99
4392
M99
4394
M99
4396
M99
4389
M99
4391
M99
4393
M99
4395
M99
4569
M99
4571
M99
4573
M99
4569
M99
4571
M99
4573
M99
4610
s a m p le c o d e
no. p
er 1
00 m
l
E . c o l i L T T C 3 7 E .c o l i L T T C 4 4 E .c o l i C o l i le r t
C
0
1 0
2 0
3 0
4 0
5 0
6 0
7 0
8 0
ADK-
U0Y
S
HI-I
NW
3
ADK-
U0Y
S
ADK-
U00
0
HI-I
NW
3
ADK-
U00
0
HI-I
NW
3
ADK-
U0Y
S
ADK-
U00
0
HI-I
NW
3
ADK-
U0Y
S
ADK-
U00
0
HI-I
NW
3
ADK-
U0Y
S
ADK-
U00
0
ADK-
U00
0
HI-I
NW
3
ADK-
U00
0
HI-I
NW
3
ADK-
U00
0
HI-I
NW
3
s a m p le c o d e
no. p
er 1
00 m
l
E . c o l i L T T C 3 7 E .c o l i L T T C 4 4 E .c o l i C o l i l e r t E .c o l i C C A
Figure 4 The number of E. coli per 100 ml in water samples analysed with different methods bydifferent laboratories (A=RIVM-MGB, B=Kiwa, C=PWN); LTTC37,LTTC44 and CCAcounts are confirmed counts, Colilert® counts are not.
RIVM report 289202 028 page 19 of 64
A
0
0.5
1
1.5
2
2.5
0 0.5 1 1.5 2 2.5log no. per 100 m l on LTTC37
log
no. p
er 1
00 m
l
to tcol LSA 37 totcol Colilert
B
0
0.5
1
1.5
2
2.5
3
0 0.5 1 1.5 2 2.5 3
log no. per 100 ml on LTTC37
log
no. p
er 1
00 m
l
totcol LSA37 totcol Colilert
C
0
0.5
1
1.5
2
2.5
0 0.5 1 1.5 2 2.5
log no. per 100 ml on LTTC37
log
no. p
er 1
00 m
l
totcol LSA totcol Colilert totcol CCA
Figure 5 The number of total coliforms (totcol) in water samples enumerated by differentlaboratories with alternative methods (LSA37, Colilert®, CCA) compared to thereference method (LTTC37) (A=RIVM-MGB, B=Kiwa, C=PWN); LSA37 andLTTC37counts are confirmed counts, Colilert® and CCA counts are not.

page 20 of 64 RIVM report 289202 028
A
0
0.5
1
1.5
2
2.5
0 0.5 1 1.5 2 2.5
log no. per 100 ml on LTTC37
log
no. p
er 1
00 m
l
E.coli LTTC44 E.coli Colilert E.coli DP
B
0
0.5
1
1.5
2
2.5
0 0.5 1 1.5 2 2.5 3
log no. per 100 ml on LTTC37
log
no. p
er 1
00 m
l
E.coli LTTC 44 E.coli Colilert
C
0
0.2
0.4
0.6
0.8
1
1.2
1.4
1.6
1.8
2
0 0.2 0.4 0.6 0.8 1 1.2 1.4 1.6 1.8 2
log no. per 100 ml on LTTC37
log
no. p
er 1
00 m
l
E.coli LTTC 44 E.coli Colilert E.coli CCA
Figure 6 The number of E. coli in water samples enumerated by different laboratories withalternative methods (LTTC44, Colilert®, DP, CCA) compared to the referencemethod (LTTC37) (A=RIVM-MGB, B=Kiwa, C=PWN); LTTC3 , LTTC44 and CCAcounts are confirmed counts, Colilert® and DP counts are not.

RIVM report 289202 028 page 21 of 64
3.3 Confirmation
The results of the confirmation tests that were performed on isolates obtained with thedifferent methods by the participating laboratories are summarized in Table 3. The averageconfirmation percentage of characteristic yellow colonies on LSA37 is about 85 %. Acomparable percentage of characteristic colonies from LTTC37 (average 80 %) could beconfirmed as total coliforms, whereas, as expected since they are a part of the coliformpopulation, a lower percentage (average 55 %) could be confirmed as E. coli. The fraction ofthe characteristic colonies that was confirmed as E. coli increased to an average of 79 %when LTTC was incubated at 44 °C (LTTC44). Confirmation percentages of yellowColilert® wells (average 55 %) are below the total coliform confirmation percentagesobtained with the other methods and from some yellow but non-fluorescent wells (average12.5 %) E.coli was isolated, indicating the occurrence of false negative E. coli results. In 96% of the Colilert® wells that showed yellow coloration and fluorescence, E. coli was found.The average total coliform and E. coli counts that were generated per laboratory and permethod (Table 1), were corrected for the results of the additional confirmation and multipliedwith the confirmation rates per laboratory and per method (Table 3). Results are shown inTable 4.
Table 3 Results of confirmation tests: the number and percentage of isolates that was confirmed as total coliforms (totcol) and E. coli calculated per method and per laboratory
laboratory method total no. no. confirmed no. confirmedisolates totcol (%) E. coli (%)tested
RIVM-MGB LSA37 522 449 (86.0) nd (nd)Kiwa LSA37 123 96 (78.0) nd (nd)PWN LSA37 190 172 (90.5) nd (nd)
RIVM-MGB LTTC37 265 218 (82.3) 178 (67.2)Kiwa LTTC37 116 105 (90.5) 55 (47.4)PWN LTTC37 134 90 (67.2) 68 (50.7)
RIVM-MGB LTTC44 313 nd (nd) 269 (85.9)Kiwa LTTC44 115 nd (nd) 86 (74.8)PWN LTTC44 129 nd (nd) 100 (77.5)
RIVM-MGB Colilert®-y 70 30 (42.9) 9 (12.9)Kiwa Colilert®-y 35 24 (68.6) 6 (17.1)PWN Colilert®-y 93 51 (54.8) 7 (7.5)
RIVM-MGB Colilert®-yf 58 nd (nd) 56 (96.6)Kiwa Colilert®-yf 31 nd (nd) 29 (93.5)PWN Colilert®-yf 50 nd (nd) 49 (98.0)nd = not done; Colilert®-y = yellow Colilert® well; Colilert®-yf = yellow and fluorescing Colilert® well
page 22 of 64 RIVM report 289202 028
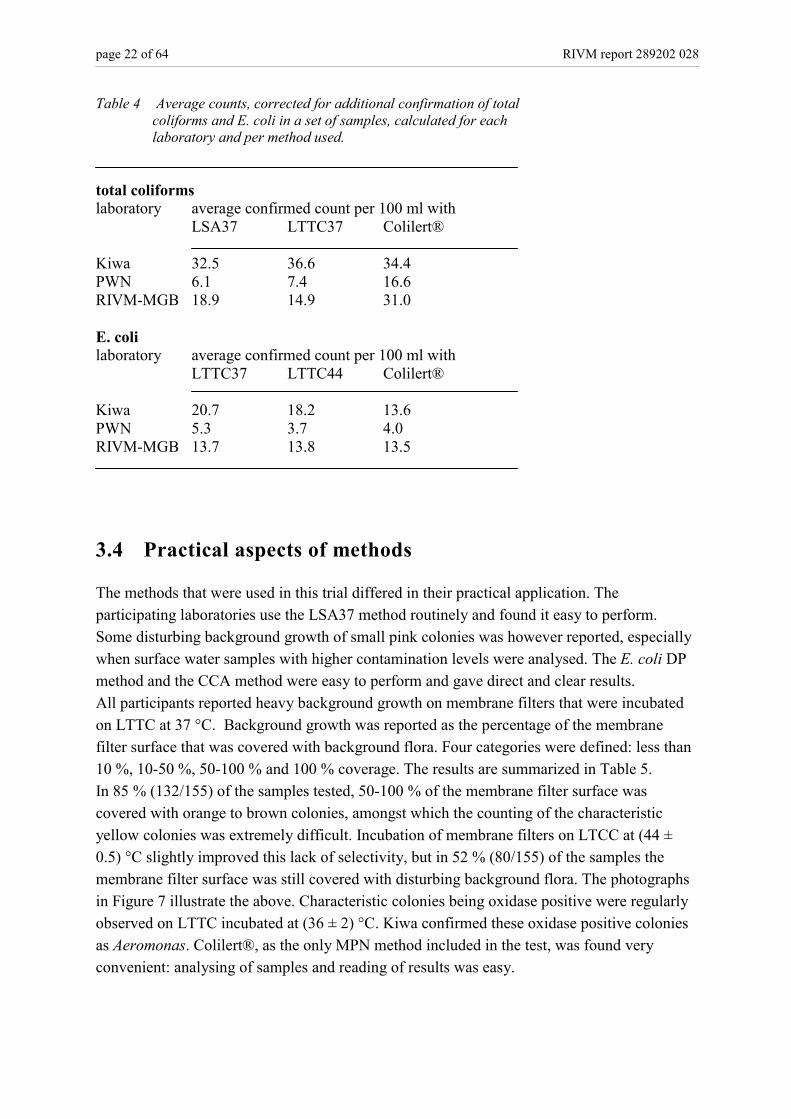
Table 4 Average counts, corrected for additional confirmation of totalcoliforms and E. coli in a set of samples, calculated for eachlaboratory and per method used.
total coliformslaboratory average confirmed count per 100 ml with
LSA37 LTTC37 Colilert®
Kiwa 32.5 36.6 34.4PWN 6.1 7.4 16.6RIVM-MGB 18.9 14.9 31.0
E. colilaboratory average confirmed count per 100 ml with
LTTC37 LTTC44 Colilert®
Kiwa 20.7 18.2 13.6PWN 5.3 3.7 4.0RIVM-MGB 13.7 13.8 13.5
3.4 Practical aspects of methods
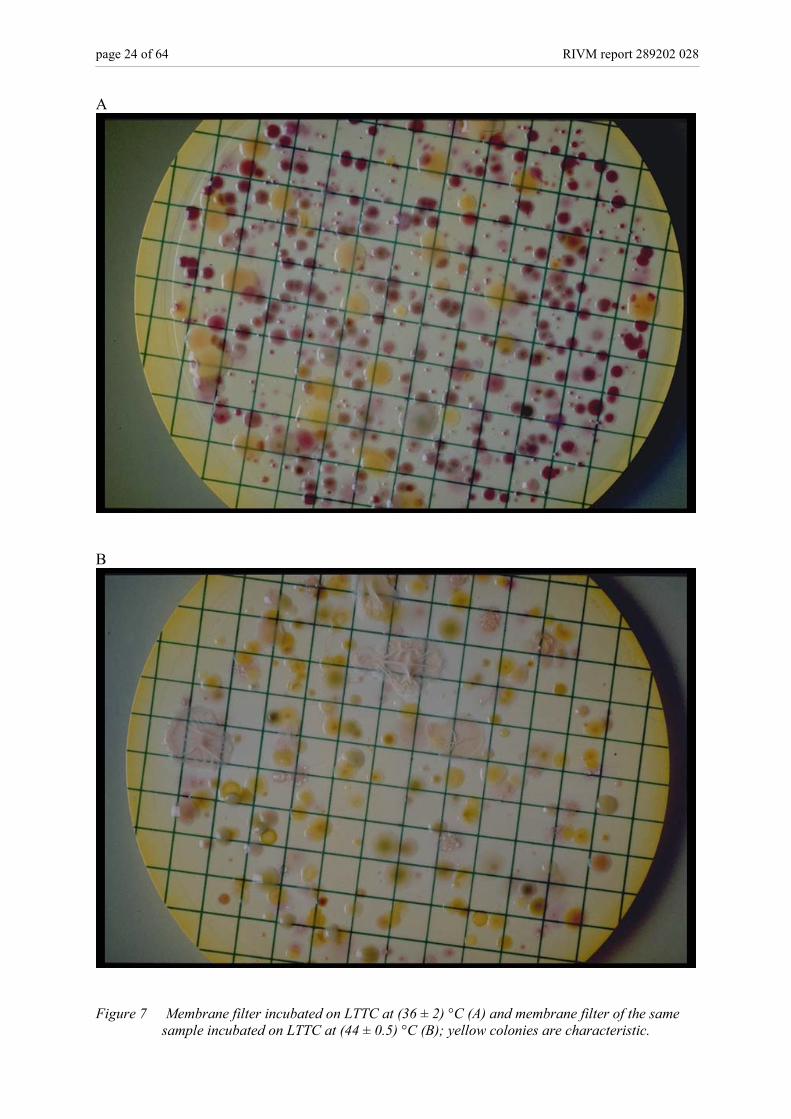
The methods that were used in this trial differed in their practical application. Theparticipating laboratories use the LSA37 method routinely and found it easy to perform.Some disturbing background growth of small pink colonies was however reported, especiallywhen surface water samples with higher contamination levels were analysed. The E. coli DPmethod and the CCA method were easy to perform and gave direct and clear results.All participants reported heavy background growth on membrane filters that were incubatedon LTTC at 37 °C. Background growth was reported as the percentage of the membranefilter surface that was covered with background flora. Four categories were defined: less than10 %, 10-50 %, 50-100 % and 100 % coverage. The results are summarized in Table 5.In 85 % (132/155) of the samples tested, 50-100 % of the membrane filter surface wascovered with orange to brown colonies, amongst which the counting of the characteristicyellow colonies was extremely difficult. Incubation of membrane filters on LTCC at (44 ±0.5) °C slightly improved this lack of selectivity, but in 52 % (80/155) of the samples themembrane filter surface was still covered with disturbing background flora. The photographsin Figure 7 illustrate the above. Characteristic colonies being oxidase positive were regularlyobserved on LTTC incubated at (36 ± 2) °C. Kiwa confirmed these oxidase positive coloniesas Aeromonas. Colilert®, as the only MPN method included in the test, was found veryconvenient: analysing of samples and reading of results was easy.

RIVM report 289202 028 page 23 of 64
Table 5 Background growth on membrane filters incubated on LTTC, incubated at (36 ± 2) °C(37 °) and at (44 ± 0.5) °C (44 °), indicated as the percentage coverage of the membranefilter surface
laboratory no. tested no. of samples with % coverage of membrane filter surface
<10 10-50 50-100 100
37 ° 44 ° 37 ° 44 ° 37 ° 44 ° 37 ° 44 °
RIVM-MGB 72 0 16 18 24 39 26 15 6Kiwa 35 2 23 3 12 24 0 6 0PWN 48 0 0 0 0 2 32 46 16
page 24 of 64 RIVM report 289202 028
A
B
Figure 7 Membrane filter incubated on LTTC at (36 ± 2) °C (A) and membrane filter of the samesample incubated on LTTC at (44 ± 0.5) °C (B); yellow colonies are characteristic.

RIVM report 289202 028 page 25 of 64
4. DiscussionAll participating laboratories enumerated much higher numbers of total coliforms withColilert® than with LSA37 and LTTC37; differences were significant (P<0.05). Differencesin counts obtained with these membrane filtration methods and Colilert® can be explainedfrom the different substrates that are used, resulting in the detection of two different groups ofcoliform bacteria. Coliforms growing on lactose-containing agar media, need two enzymes toferment lactose: �-galactoside-permease, for active transport of lactose into the bacterial cellsand �-galactosidase, to use lactose, resulting in the production of acid and gas. The genes thatcode for these enzymes are lacY and lacZ, respectively. Coliforms that lack lacY do not formcharacteristic yellow colonies on lactose-containing agar media, unless lactose is present inextremely high concentrations. When lacZ is however present, the Colilert® substrate ortho-nitrofenyl-�-�-galactopyranoside (ONPG) can be used. Coliforms that have both genes canuse lactose and ONPG.From our results it is clear that a larger population of bacteria contains only the lacZ generesulting in higher counts with Colilert®. Fricker et al. (1997) also reported the occurrence ofnon-lactosefermenting coliforms: approximately 10 % of the coliforms they isolated frompotable source water did not ferment lactose due to lack of β-galactosidepermease. TheChromocult® method is based on the same detection principle as Colilert®, but CCA countswere however significantly (P<0.05) lower than Colilert® counts. This might be due to adifferent resuscitation capacity of liquid media (Colilert®) and solid agar media (CCA). CCAtotal coliform counts were higher (P<0.05) than LSA37 counts, but were equal to LTTC37counts (P>0.05).Total coliform counts on LSA37 were significantly (P<0.05) lower than total coliform countson LTTC37. Confirmation percentages of these membrane filtration methods werecomparable: LSA37 85 % and LTTC37 80 %. The presence of disturbing background growthis experienced as a serious drawback of the LTTC37 method. Presence of some disturbingbackground growth (small pink colonies) on LSA37 was reported, particularly when highlycontaminated surface water samples were analysed, but this was not considered a majorproblem and no attempt was made to quantify the proportion of background growth. Theabundance of organisms other than the target organisms on LTTC37 reduces readability ofthe membrane filters and makes it almost impossible to use the criterium that is stated in ISO9308-1: ”… count as lactose-positive bacteria all typical colonies irrespective of size whichshow a yellow color development in the medium under the membrane.”. With so many otherorganisms present, the medium under the membrane filters is almost completely yellow. Inthis way counts are less accurate and can only be properly made when only a few targetorganisms are present and the amount of background growth is equally reduced. We noticedthat heavy background growth appeared in surface water with higher total coliformcontamination levels (most RIVM-MGB samples, some PWN samples), but that it could alsobe abundant in samples with rather low total coliform contamination levels (most Kiwasamples, some PWN samples). Incubation of LTTC at 44 °C slightly reduced the amount ofbackground growth, but a different type of background bacteria, the so called ‘spreaders’
page 26 of 64 RIVM report 289202 028
(usually members of the genus Bacillus) appeared. There were low numbers of these bacteriapresent, but they spread along the membrane filters and hindered the counting of the targetorganisms. Incubation of membrane filters on LTTC at 44 °C also suppresses the growth ofsome of the members of the total coliform group and results in the detection of fecalcoliforms in stead of total coliforms. Incubation at 44 °C did not alter the E. coli count resultsin the analysed samples.Confirmation of isolates from yellow (total coliform positive) Colilert® wells showed thatonly 55 % (range 43 – 69 %) of the isolates were total coliforms, when total coliforms weredefined as lactosefermenting organisms. The confirmation procedure that was followed,included direct streaking of material from yellow Colilert® wells on MacConkey agar inwhich lactose is present. In quite a few cases this direct streaking on MacConkey agarresulted in no or very poor growth due to the lack of the lacY gene in a part of the isolatesfrom Colilert®, resulting in a low confirmation rate. As Colilert® and the tested membranefiltration methods enumerated different groups of coliform bacteria, counts obtained withthese methods can only be fairly compared when results are confirmed and the criteria usedto define the group of bacteria called ‘total coliforms’are identical. In an attempt to get anindication, the average total coliform and E. coli counts were corrected for the obtainedconfirmation rates. These calculations suggest that a larger number of lactose fermenting totalcoliforms is detected with Colilert® than with LSA37 and LTTC37.LTTC37, LTTC44 and DP enumerated significantly (P<0.05) more E. coli than Colilert® andCCA. Colilert® and CCA performed similar (P>0.05). A high percentage false negative E.coli results was found with Colilert®: from 12,5 % (range 7,5-17,1 %) of wells that werepositive for total coliforms but negative for E. coli, i.e. showing yellow coloration but nofluorescence, E. coli was isolated. The lower counts with Colilert® and CCA, which include4-methylumbelliferyl-�-D-glucuronide (MUG) as a substrate for the enzyme �-glucuronidasefor E. coli detection, and the high percentage false negative results with Colilert® in thisstudy show that testing water samples for �-glucuronidase activity will underestimate thenumber of E. coli present in a sample. Present results confirm results from previous research(Schets and Havelaar, 1991) in which 14 % (range 4-26 %) of isolated E. coli strains wasfound �-glucuronidase negative at 44 °C. A fraction of these isolates was �-glucuronidasepositive at 37 °C. An indole test will give a more reliable count of the number E. coli insamples, since only 2-4 % of E. coli strains are indole negative (Schets and Havelaar, 1991;Schets et al., 1993). The E. coli DP method is based on testing for indole production andincludes a resuscitation step on a non-selective medium (Havelaar and During, 1988). In thisstudy the method was used by RIVM-MGB only and gave higher counts than all othermethods used by RIVM-MGB, differences were significant (P<0.05) for LTTC44 andColilert®, but not for LTTC37.

RIVM report 289202 028 page 27 of 64
5. Conclusions� Membrane filtration methods based on transport and use of lactose used in this study
(LTTC37 and LSA37) have similar true positive rates for total coliforms, but totalcoliform counts on LSA37 are significantly lower than on LTTC37.
� Due to lack of selectivity, LTTC37 is however suitable for monitoring of very clean(drinking) water samples only.
� Colilert® and CCA enumerate a different group of coliform bacteria than the othermethods used; counts can only be fairly compared when results are confirmed and thecriteria used to define the group of bacteria called 'total coliforms' are identical.
� For enumeration of ONPG positive total coliforms Colilert® might be a suitablealternative for membrane filtration methods.
� For enumeration of E. coli, the DP method (or Rapid Test in ISO/FDIS 9308-1) appearedto be most suitable, although the method was only used by one laboratory in this study;
6. RecommendationsFor enumeration of total coliforms, drinking water companies can use the EU referencemethod on LTTC agar, but due to its lack of selectivity this method can only be used formonitoring of very clean drinking water samples. This forces the water companies to have asecond method for enumeration of total coliforms operable, for analysis of e.g. surface watersamples, drinking water half products or repair samples. The LSA method, extensively usedin the Netherlands, is more selective than the LTTC method and can therefore be used foranalysis of water samples with various contamination levels, ranging from surface water todrinking water. Some disturbing background growth may however occur when certainsurface water samples are analysed. The elevated selectivity of LSA results in lower totalcoliform counts.Colilert® can be used as alternative for the above mentioned membrane filtration methods: itis a convenient method, giving final results within 18 h and can be used for analysis of allwater types. It should be borne in mind that this method enumerates a broader group ofcoliform bacteria than the membrane filtration methods, resulting in higher counts.When a drinking water sample is found positive for total coliforms with either LTTC, LSA orColilert®, subculturing for E. coli should be performed; for Colilert® this should be doneregardless of the presence of fluorescence in wells. Colilert® is considered less suitable fordirect detection of E. coli because of the occurrence of a high percentage false negativeresults due to the inability of a fraction of the E. coli population to use the substrateincorporated in Colilert® for E. coli detection. Resulting form the present study, the DPmethod is the most suitable method for detection and enumeration of E. coli: it is easy toperform and detected more E. coli than the other methods.

page 28 of 64 RIVM report 289202 028
AcknowledgementsThe authors thank Nico Nagelkerke (RIVM-IMA) for statistical analysis of data.

RIVM report 289202 028 page 29 of 64
ReferencesAnonymousBacteriologisch onderzoek van water - Kwantificeren van bacteriën van de coligroep metbehulp van membraanfiltratie (NEN 6571)Nederlands Normalisatie Instituut, Delft, The Netherlands, 1982
AnonymousBacteriologisch onderzoek van water – Monsterneming en conservering (NEN 6559)Nederlands Normalisatie Instituut, Delft, The Netherlands, 1992
AnonymousCouncil Directive 98/83/EC on the quality of water intended for human consumptionOfficial Journal of the European Communities, Brussels, Belgium, 1998
AnonymousWater Quality - Detection and enumeration of Escherichia coli and total coliform bacteria -Part 1: Membrane filtration method (ISO 9308-1)International Organisation for Standardisation, Geneva, Switzerland, 2000
Fricker EJ, Illingworth KS, Fricker CRUse of two formulations of colilert and quantitray™ for assessment of the bacteriologicalquality of waterWat Res 1997; 31: 2495-2499
Havelaar AH, During MEvaluation of the Anderson Baird-Parker direct plating method for enumeration ofEscherichia coli in waterJ Appl Bact 1988; 64: 89-98
Schets FM, Havelaar AHComparison of indole production and β-glucuronidase activity for the detection ofEscherichia coli in a membrane filtration methodLett Appl Bact 1991; 13: 272-274
Schets FM, Medema GJ, Havelaar AHComparison of Colilert with Dutch standard enumeration methods for Escherichia coli andtotal coliforms in waterLett Appl Bact 1993; 17: 17-19

page 30 of 64 RIVM report 289202 028

RIVM report 289202 028 page 31 of 64
Appendices
page 32 of 64 RIVM report 289202 028
Appendix 1 A draft protocol for comparison of the EU reference method for coliformsand E.coli with alternative culture methods
IntroductionThe European Drinking Water Directive (1998) defines a reference method for the estimationof the concentration of coliforms and E.coli in drinking water. Whilst it is not mandatory thatmember states use this method, there is an obligation to demonstrate that any alternativemethod which is to be used has a similar performance. The exact nature of the similarity isnot defined, nor is the methodology to be used for comparison of methods. It is generallyaccepted however, that alternative methods should have a performance which is equivalent orbetter. In this context, “equivalent or better” must be defined. A method is normallyconsidered to be “equivalent” if the recovery of target organisms is not significantly lowerthan the reference method. However, “significantly lower” also requires definition and forthe purposes of comparisons such as this, a definition of overall not significantly lower than10% of the reference method is suitable.In addition to testing the recovery of organisms using the two test methods, the number offalse positive results should be determined. This can done by estimating the true positive rateof the methods. Since the EU reference method does not require that colonies be“confirmed” all colonies which fulfil the criteria described in the method should be counted.In order to determine the true positive rate, all colonies should be confirmed using anappropriate methodology. However, this is not feasible for a study of this size and therefore acompromise must be used. In this case, it is reasonable for each laboratory to “confirm” theidentity of one hundred colonies selected at random from a range of water types. Anypositive results which do not confirm by traditional methodologies should be sent to singlereference laboratory (in this case Thames Water) for accurate identification. In addition tothe 100 colonies identified from the EU reference method, 100 positive wells from Colilertshould be examined. This can be done using the protocol given below.
Tests to be performed by individual laboratoriesEach laboratory or group of laboratories, will perform a minimum of 200 tests in total. Thesewill be split into two phases. In phase one, a minimum of five and a maximum of ten siteswill be selected which will give 10-50 colonies of coliforms per 100 ml. A total of 150samples from this type of source should be examined, with the samples being spread evenlyover the different sites. The type of water sample should be chosen according to the type ofsample normally examined by individual laboratories. For example, laboratories whosenormal samples are from surface water treatment plants which receive disinfection, thensewage effluent disinfected with chlorine should be used to generate the samples, accordingto the protocol given below. Laboratories who examine samples of water which receives nodisinfection should use contaminated groundwater or good quality surface water for thisphase of the study.Results should be reported on the forms given in this document. The site, type of sample,date of analysis, and results should be presented as shown in the example.
RIVM report 289202 028 page 33 of 64
For the second phase of the study, samples should be selected to give results in the range 1-10coliforms per 100 ml. All results should be reported, even where the result is zero. Aminimum of 30 samples where at least one organism is recovered by one or other method orboth should be reported.In reporting results, no attempt should be made to correct the results in view of the findingsof confirmation tests, unless the method being compared specifically states that results shouldbe confirmed. In this trial of Colilert and the EU reference method, neither method requiresconfirmation. When the results are analysed, account will be taken of the true resultsobtained by examination of the 100 organisms identified as described above.
SamplesSamples should be taken into bottles of no less than 500 ml. Aliquots (100 ml) should beused for each of the three tests, i.e. Colilert, membrane filtration for coliforms and membranefiltration E.coli. Each aliquot must be taken from the same bottle. On no account mustsubsamples be taken from different bottles. Samples must be adequately mixed by repeatedinversion of the sample bottle.
Disinfection of sewage effluentDisinfected sewage effluent has been used in several studies to good effect to determine theefficiency of different methods for recovering coliforms and E.coli. The protocol uses “goodquality” sewage effluents i.e. with suspended solids of less than 30 mg per litre.The method for producing samples from sewage effluent is as follows:Day 11. Fill a 10 litre container with tap water warm to 37oC for two hours and then place at 4oC
overnight.Day 22. Select a good quality sewage effluent (one litre) and allow to stand for 2 hours to allow
large particulates to sediment.3. Carefully pour off 500 ml of effluent into a clean container.4. Add the 500 ml of sewage effluent to the tap water, mix by shaking and place on a
magnetic stirrer.5. Prepare a solution of chlorine using chlorine generating tablets (Instachlor, Palintest)
containing in total 10-15 mg of chlorine.6. Add the chlorine solution to the diluted sewage effluent.7. Allow to mix for 5 minutes.8. Take one litre samples of the chlorinated effluent into sterile bottles containing 5 ml of
18% sodium thiosulphate solution at one minute intervals (i.e. 5-14 minutes contact time)and mix thoroughly.
9. Examine 100 ml of the chlorinated sewage effluent from each time point using Colilert 18and the Colilert 2000 QuantiTrays.
10. Store all chlorinated samples at 4oC overnight.Day 311. Read the QuantiTrays and record the results
page 34 of 64 RIVM report 289202 028
12. Select samples which give 15-70 coliforms per 100 ml. These can be used directly tocompare the methods and duplicate samples can be analysed.
13. Select samples which yield 150-700 coliforms per 100 ml.14. These can be diluted 1:10 in de-chlorinated water to yield one litre samples. Tap water
can be de-chlorinated by adding 5 ml of 18% sodium thiosulphate to 900 ml of water.Five replicate one litre samples can be prepared from each sample which yielded 150-700coliforms. These samples can each be used to compare the methods and samples fromeach bottle can be analysed in duplicate.
15. Analyse samples using EU reference method to be incubated for recovery of total andfaecal coliforms (i.e. incubate one membrane at 37oC and 44oC) and the Colilert 18method.
16. Incubate samples at appropriate temperatures for the relevant time.17. Examine samples after incubation and record the count from each sample on the Results
Sheet.18. Organisms can be selected at this stage for determination of the “True Positive Rate” for
each method according to the protocol given below.
Protocol for determining the “True Positive Rate”To determine the “True Positive Rate” 100 organisms from each test will be identified. Formethods which produce colonies these must be selected at random from a variety of sites.Selecting colonies at random is essential and no attempt to should be made to selectcolonies on the basis of whether they are “typical” or “atypical”. For Colilert, select onehundred wells which are yellow with no fluorescence and one hundred which are yellow andfluorescent.
1. Colonies from membranesi. Select a well isolated colony and streak out onto nutrient agar, incubate overnight at 37oCii. After incubation, inoculate a single colony into lactose peptone water and incubate at 37oC
for 48 hours and record the result. For membranes intended to detect faecal coliforms,inoculate a single colony into lactose peptone water and tryptone water and incubate at44oC for 24 hours. Test the tryptone water for indole production using Kovacs reagentand record the result. Record the result from the lactose peptone water.
iii. Test the growth from the nutrient agar plate for cytochrome oxidase production and recordthe result
2. For Colilert samplesi. Select wells showing yellow colour or yellow colour plus fluorescence as appropriate.ii. Puncture the back of the well with a sterile hypodermic needle or sterile pipette tip and
withdraw a small volume (approximately 10 �l ) of liquid.iii. Inoculate the liquid on to a MacConkey agar plate and streak out for single colonies.
Incubate plates from fluorescing wells at 44oC and those from wells which are yellow onlyat 37oC overnight.
RIVM report 289202 028 page 35 of 64
iv. Select a well isolated lactose fermenting colony. Isolates from fluorescing wells should beinoculated into lactose peptone water and tryptone water for incubation at 44oC asdescribed above. Isolates from yellow only wells should be inoculated into lactosepeptone water and incubated at 37oC for 48 hours and onto a nutrient agar plate forexamination for cytochrome oxidase.
v. Results should be recorded on the appropriate sheet.
Quality AssuranceIt is essential that all laboratories taking part in this study must have appropriate qualitycontrol systems in place. Some specific quality control points are listed below in relation tothe use of the EU reference medium. It is also beneficial if laboratories can provide resultsfrom an external quality assurance scheme.
IncubatorsAll incubators to be used in this study must be monitored daily to ensure compliance with thetarget temperature. The temperature required is ±1 degree C of the target temperature or asspecified within the specific method (i.e. the Colilert package insert and the EU referencemethod).
MediaCulture media should be made and stored in accordance with the manufacturers instructions.With regard to the EU reference media, all media should be used within seven working daysof preparation.A quality control procedure, based on that used by Institut Pasteur, Lille is provided. Thismust be used with every batch of media produced.
Protocol for quality control of media
I / Field of applicationThis protocol describes the quality controls to be performed on each production batch ofmedia used in microbiology laboratories.
The sensitivity, pH, selectivity and/or performance are studied (performance of a positivestrain comparing to a reference medium and non selective medium, selection characteristicsof a positive strain for confirmation media).
II / Definitions2.1/ Batch : a batch is a group of containers, tubes or flasks, containing medium, coming fromthe same production lot, in other words a « series » in the case of media prepared with anautomatic preparator.2.2/ Sterility : absence of any culture at the temperature and timing normally used for themedium studied.
page 36 of 64 RIVM report 289202 028
III/ Control3.1/Presumptive media3.1.1/ general principle
Take :� 1% of the production (at different stages of production, with a minimum of 3) to control
the pH,� 1% of the production (at different stages of production, with a minimum of 3) to control
the sterility,� 1% of the production (at different stages of production, with a minimum of 3) to control
the performance of a positive control� 2 samples for the negative control (at the beginning and at the end of the production),
so in total 3% of the production and 2 samples.
To control the pH, a pH-meter is used. The mean of measurements must be calculated. ThepH should fall within the limits set by the manufacturer. If this is not the case, then the mediamust be rejected.
The negative control (a strain of Aeromonas) must not grow on both plates or must notbe/look like the target strains identified on the media.
To test the performance of the medium, a reference strain should be examined on the“reference medium” and on nutrient agar. The recovery on the reference medium should bebetween 55 and 120% of that found on the nutrient agar. For this purpose, lenticules will besupplied. These should be rehydrated in 500 ml of sterile distilled water. Four membranefilters are then used to concentrate 100 ml of the material and two incubated on nutrient agar(one at 37oC and the other at 44oC) and two on the reference medium (one at 37oC and theother at 44oC). Colonies are then counted after incubation and the results recorded.
If results do not demonstrate that the medie are equivalent in performance then a second setof controls should be run. If these do not give acceptable results then the batch of mediumshould be discarded.
3.2/ Confirmation media3.2.1/ general principle
Take :� 1% of the production (at different stages of production, with a minimum of 3) to control
the pH,� 1% of the production (at different stages of production, with a minimum of 3) to control
the sterility,

RIVM report 289202 028 page 37 of 64
� 1% of the production (at different stages of production, with a minimum of 3) to controlthe performance of a positive controlso in total 3% of the production
This applies to tryptone water and lactose peptone water.
To control the pH, a pH-meter is used. The results must fall within the range specified by themedia manufacturer.
The sterility is controlled with plates or tubes, incubated at the specified temperature and thetiming normally used for the medium. No growth in all samples is the only acceptable result.
Each medium is incubated with a strain of E.coli and a strain of Aeromonas spp. To ensurecorrect performance. The E.coli strain should ferment lactose at both 37 and 44oC andproduce indole from tryptophane at 44oC. The strain of Aeromonas should give negativeresults in all tests.
Results are reported in the file of results. If results do not meet fixed criteria of quality, a newcontrol is done. If the second control gives the same results, the batch is discarded a newbatch is made.
3.3/ Nutrient agar
At each production, we take 1% of the production (at different stages with a minimum of3 flasks) to control the sterility, the pH and the performance.
For each flask, prepare 2 boxes (1 for the control of the sterility and 1 for the pH). Keep therest at 50°C to control the performance.
To control the sterility, put the plates at 20°C. No growth after an incubation of 72 hours.To control the pH, a pH-meter is used. The mean must be within the limits specified by themanufacturer.
If results do not follow the fixed criteria of quality, a new control is done. If the secondcontrol gives the same results, the batch is refused and a new production is made.
Quality Control samplesOn each day that analyses are being performed, a lenticule should be added to 500 ml ofsterile deionised water. After appropriate mixing, samples should be analysed by membranefiltration and incubated on tergitol TTC medium at 37 and 44oC and on nutrient agar at 37and 44oC. Counts should be recorded and sent in with the other analytical results.

page 38 of 64 RIVM report 289202 028
Appendix 2 Short description of sample sites
sample code sample site sample type and dilution
coli99/01, /09, /17, /25, /33, /41, /49,/57, /65, /73
De Oude Pol – Nunspeet surface water, 10 x in PS
coli99/02, /10, /18, /26, /34, /42, /50,/58, /66, /74
Strand Horst –Harderwijk
surface water, 10 x in PS
coli99/03, /11, /19, /27, /35, /43, /51,/59, /67, /75
Salmsteke – Lopik surface water, 10 x in PS
coli99/04, /12, /20, /28, /36, /44, /52,/60, /68, /76
River Lek – Vianen surface water, 10 x in PS
coli99/05, /13, /21, /29, /37, /45, /53,/61, /69, /77
Maarseveenseplassen –Molenpolder
surface water, 10 x in PS
coli99/06, /14, /22, /30, /38, /46, /54,/62, /70, /78
De Strook – Tienhoven surface water, 10 x in PS
coli99/07, /15, /23, /31, /39, /47, /55,/63, /71, /79
De Wijde Blik –Kortenhoef
surface water, 10 x in PS
coli99/08, /16, /24, /32, /40, /48, /56,/64, /72, /80
Vinkeveenseplassen –Vinkeveen
surface water, 10 x in PS
WRK ruw WRK Nieuwegein surface waterWRK coag, M994391, M994572 WRK Nieuwegein drinking water proces, after
coagulationWRK snelf WRK Nieuwegein drinking water proces, after
rapid filtrationM994388, M994390, M994392,M994571, M994573, M994574
not specified surface water, afterreservoir storage
M994389, M994393, M994369,M994570,
not specified drinking water proces, afterfiltration
M994394, M994395 not specified artificial contaminateddrinking water
M994610, M994611 pilotplant after filtrationAUOY1 Lake IJsselmeer surface water, 10 x in DWAUOY2 Lake IJsselmeer surface water, 10 x in DWAUOY3 Lake IJsselmeer surface waterAUOY4 Lake IJsselmeer surface water, after 1 week
storage at 4°CAUOO1 Lake IJsselmeer raw water, 10 x in DWAUOO2 Lake IJsselmeer surface water, 10 x in DWAUOO3 Lake IJsselmeer raw waterAUOO4 Lake IJsselmeer raw water, after 1 week
storage at 4°CHI-INW1 WRK Andijk surface waterHI-INW2 WRK Andijk surface water, after 1 week
storage at 4°CPS = peptone saline, DW = drinking water

RIVM report 289202 028 page 39 of 64
Appendix 3 Description of Colilert®-18
Colilert®-18 Test Kit _Introduction and Product UseColilert-18 is used for the simultaneous detection and confirmation of total coliforms and E. coli infresh and marine waters. It is based on IDEXX's patented Defined Substrate Technology's (DST=).When total coliforms metabolize Colilert-18's nutrient-indicator, ONPG, the sample turns yellow.When E. coli metabolize Colilert-18's nutrient-indicator, MUG, the sample fluoresces. Colilert-18can simultaneously detect these bacteria at 1 cfu/100 ml within 18 hours even with as many as 2million heterotrophic bacteria per 100 ml present.MaterialsCatalog # WP020-18 and WP200-18 contain 20 and 200 Snap Packs respectively, each containingsufficient Colilert-18 reagent for a 100 ml water sample.StorageStore at 4-25°C away from light.Presence/Absence (P/A) Procedure1. Add contents of one pack to a 100 ml sample in a sterile, transparent, non-fluorescing vessel2. Cap vessel and shake3. If sample is not already at 33-38°C, then place vessel in a 35°C waterbath for 20 minutes or,
alternatively, a 44.5°C waterbath for a minimum of 7 and a maximum of 10 minutes.4. Incubate at 35±0.5°C for the remainder of 18 hours.5. Read results according to Result Interpretation table below.Quanti-Tray" EnumerationProcedure1. Add contents of one pack to a 100 ml, room temperature water sample in a sterile vessel,
Vessel does not need to be transparent or non-fluorescing.2. Cap vessel and shake until dissolved3. Pour sample/reagent mixture into a Quanti-Tray or Quanti-Tray/2000 and seal in an IDEXX
Quanti-Tray Sealer.4. Place the sealed Tray in a 35±0.5°C incubator for 18 hours (this 18 hours includes warming time).5. Read results according to the Result Interpretation table below. Count the number of positive wells
and refer to the MPN table provided with the Trays to obtain a Most Probable Number.Result Interpretation
Appearance Result
Colorless or slighttinge
negative for totalcoliforms and E. coli
Yellow equal to orgreater thanthe comparator* positive for total colitormsYellow andfluorescence equal toorgreater
positive for E. coli
than the comparator
� Look for fluorescence with a 6 watt, 365 nm, UV light within 5 inches of the sample. Face lightaway from your eyes and towards the sample.
� Samples are negative if at any time after 18 hours there is no yellow and/or fluorescence.� Yellow or yellow/fluorescence observed before 18 hours is a valid positive. However, after 22
hours from inoculation, heterotrophs may overwhelm Colilert-18's inhibition system. Therefore,yellow or yellow/fluorescence first observed after 22 hours from inoculation is not a validpositive.
Procedural Notes� A slight tinge maybe observed when Colilert-18 is added to the sample.� Colilert-18 can be run in any multiple tube format. Standard Methods for the Examination of
Water and Wastewater MPN tables should be used to find Most Probable Numbers (MPN's). .� Some water samples containing humic material may have an innate color. If a water sample
has some background color, compare inoculated Colilert-18 sample to a control blank of thesame water sample.
� Do not dilute sample in buffered water. Colilert-18 is already buffered.� Colilert-18 is a primary water test. Colilert-18 performance characteristics do not apply to
samples altered by any pre-enrichment or concentration.� Marine water samples must be diluted at least ten-fold with sterile fresh water (e.g. 10 ml
sample added to 90 ml sterile fresh water).� In samples with excessive chlorine, a blue flash may be seen when adding Colilert-18. If this is
seen, consider sample invalid and discontinue testing� Aseptic technique should be always be followed when using Colilert-18. Dispose of in
accordance with Good Laboratory Practices.Quality Control ProceduresThe following quality control procedure is recommended for each lot of Colilert-18, or more often asregulations require.1. Inoculate 3 sterile vessels filled with 100 ml sterile water with the following:
A one with Quanti-Cult°'" E. coli or a sterile loop of ATCC"` 25922 or 11775 (E. coli)B. one with Quanti-Cult Klebsiella pneumoniae or a sterile loop of ATCC 31488 (totalcoliform)C. one with Quanti-Cult Pseudomonas aeruginosa or a sterile loop of ATCC 10145 or 27853(non-coliform)
2. Follow the P/A Procedure or Quanti-Tray Enumeration Procedure above.3. Results should match the Result Interpretation table above
page 40 of 64 RIVM report 289202 028
Appendix 4 Description of the Chromocult® Coliform method
Chromocult® Coliform Agar
Selective agar for the simultaneous detection of totalcoliforms and E. coli in water and food samples.
Mode of ActionIn the first instance, the interaction of selectedpeptones, pyruvate, sorbitol and a phosphate bufferguarantees rapid colony growth, even for the subletallyinjured coliforms. The growth of Gram-positive bacteriaas well as some Gram-negative bacteria is largelyinhibited by the content of Tergitol® 7 which has nonegative effect on the growth of the coliform bacteria.For the second stage, Merck has developed a newcombination of two chromogenic substrates which allowfor the simultaneous detection of total coliforms and E.coli.
Coliform identificationThe characteristic enzyme for coliforms,[3-D-galactosidase cleaves the Salmon-GAL substrateand causes a salmon to red colour of the coliformcolonies.
E. coli identificationThe substrate X-glucuronide is used for the identificationof (3-D-glucuronidase which is characteristic for E. coli.
E. coli cleaves broth Salmon-GAL and X-glucuronide, sothat positive colonies take on a dark-blue to violetcolour. These are easily distinguished from the othercoliform colonies which have a salmon to red colour.
As part of an additional confirmation of E. coli, the inclu-sion of tryptophane improves the indole reaction,thereby increasing detection reliability when it is used incombination with the Salmon-GAL and X-glucuronidereaction.
Typical Composition (g/litre)Peptones 3.0; sodium chloride 5.0; sodium di-hydrogenphosphate 2.2; di-sodium hydrogen phosphate 2.7;sodium pyruvate 1 .0; tryptophane 1 .0; agar-agar 10.0;Sorbitol 1 .0; Tergitol~ 7 0.15; chromogenic mixture 0.4.
PreparationSuspend 26.5 g in 1 litre of demin. water by heating in aboiling water bath or in a flowing steam. Stir theconcents to assist dissolution (approx. 35 min). Someturbidity may occur, but this does not effect theperformance!• Do not autoclave! Do not overheat! pH: 6.8 ± 0.2 at25 °C.
Note: if high accompanying flora is expected, especiallyPseudomonas spp. and Aeromonas spp., let themedium cool to 45-50 °C and add Cefsoludin solution (5mg Cefsulodin in 1 ml of demin. water in case of surfaceand pourplate method and 10 mg Cefsulodin in 2 ml ofdemin. water in case of membrane-filter-technique) to 1litre of the medium. Homogenize by gently shaking andpour into plates.
The plates are turbid and yellowish. Store in arefrigerator and protect from light. To prevent platesfrom becoming dry seal in plastic-pouches or bags.Shelf-life under these conditions: 6 months.
Experimental ProcedureInoculate the medium by the pour-plate method or byspreading the sample material on the surface of theplates. In addition the membrane filter technique canalso be used. Incubation: 24 hours at 35-37 °C.
EvaluationE. coli: dark-blue to violet colonies (Salmon-GAL andX-Glucuronicle reaction).Total coliforms: salmon to red colonies (Salmon-GALreaction) and dark-blue to violet colonies (E. coli).
Other Gram-negatives: colourless colonies, except forsome organisms which possess P-D-glucuronidaseactivity. Theses colonies appear light-blue to turquoise Inorder to confirm E. coli, overlay the dark-blue to violetcolonies with a drop of KOVACS' indole reagent. If thereagent turns to a cherry-red colouring after someseconds, a positive reaction confirms the presence of E.coli.
Cat. No. 1.10426.0100/0500(100 g, 500 g)
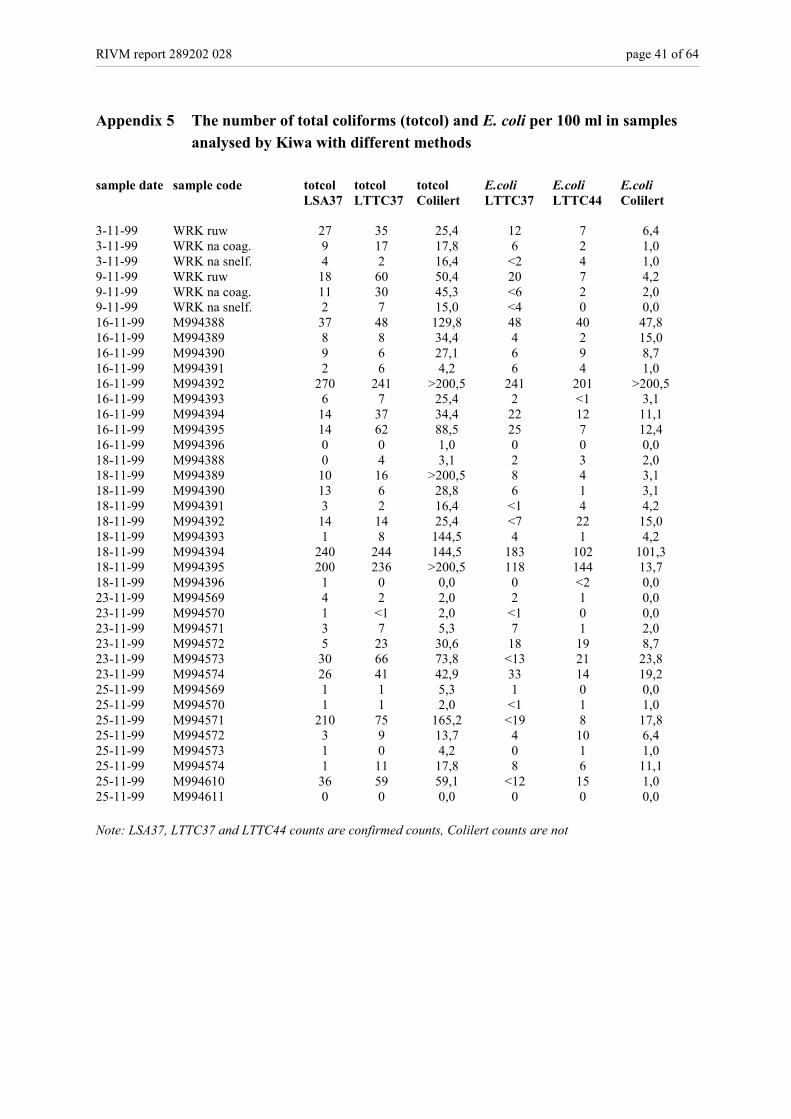
RIVM report 289202 028 page 41 of 64
Appendix 5 The number of total coliforms (totcol) and E. coli per 100 ml in samplesanalysed by Kiwa with different methods
sample date sample code totcol totcol totcol E.coli E.coli E.coliLSA37 LTTC37 Colilert LTTC37 LTTC44 Colilert
3-11-99 WRK ruw 27 35 25,4 12 7 6,43-11-99 WRK na coag. 9 17 17,8 6 2 1,03-11-99 WRK na snelf. 4 2 16,4 <2 4 1,09-11-99 WRK ruw 18 60 50,4 20 7 4,29-11-99 WRK na coag. 11 30 45,3 <6 2 2,09-11-99 WRK na snelf. 2 7 15,0 <4 0 0,016-11-99 M994388 37 48 129,8 48 40 47,816-11-99 M994389 8 8 34,4 4 2 15,016-11-99 M994390 9 6 27,1 6 9 8,716-11-99 M994391 2 6 4,2 6 4 1,016-11-99 M994392 270 241 >200,5 241 201 >200,516-11-99 M994393 6 7 25,4 2 <1 3,116-11-99 M994394 14 37 34,4 22 12 11,116-11-99 M994395 14 62 88,5 25 7 12,416-11-99 M994396 0 0 1,0 0 0 0,018-11-99 M994388 0 4 3,1 2 3 2,018-11-99 M994389 10 16 >200,5 8 4 3,118-11-99 M994390 13 6 28,8 6 1 3,118-11-99 M994391 3 2 16,4 <1 4 4,218-11-99 M994392 14 14 25,4 <7 22 15,018-11-99 M994393 1 8 144,5 4 1 4,218-11-99 M994394 240 244 144,5 183 102 101,318-11-99 M994395 200 236 >200,5 118 144 13,718-11-99 M994396 1 0 0,0 0 <2 0,023-11-99 M994569 4 2 2,0 2 1 0,023-11-99 M994570 1 <1 2,0 <1 0 0,023-11-99 M994571 3 7 5,3 7 1 2,023-11-99 M994572 5 23 30,6 18 19 8,723-11-99 M994573 30 66 73,8 <13 21 23,823-11-99 M994574 26 41 42,9 33 14 19,225-11-99 M994569 1 1 5,3 1 0 0,025-11-99 M994570 1 1 2,0 <1 1 1,025-11-99 M994571 210 75 165,2 <19 8 17,825-11-99 M994572 3 9 13,7 4 10 6,425-11-99 M994573 1 0 4,2 0 1 1,025-11-99 M994574 1 11 17,8 8 6 11,125-11-99 M994610 36 59 59,1 <12 15 1,025-11-99 M994611 0 0 0,0 0 0 0,0
Note: LSA37, LTTC37 and LTTC44 counts are confirmed counts, Colilert counts are not
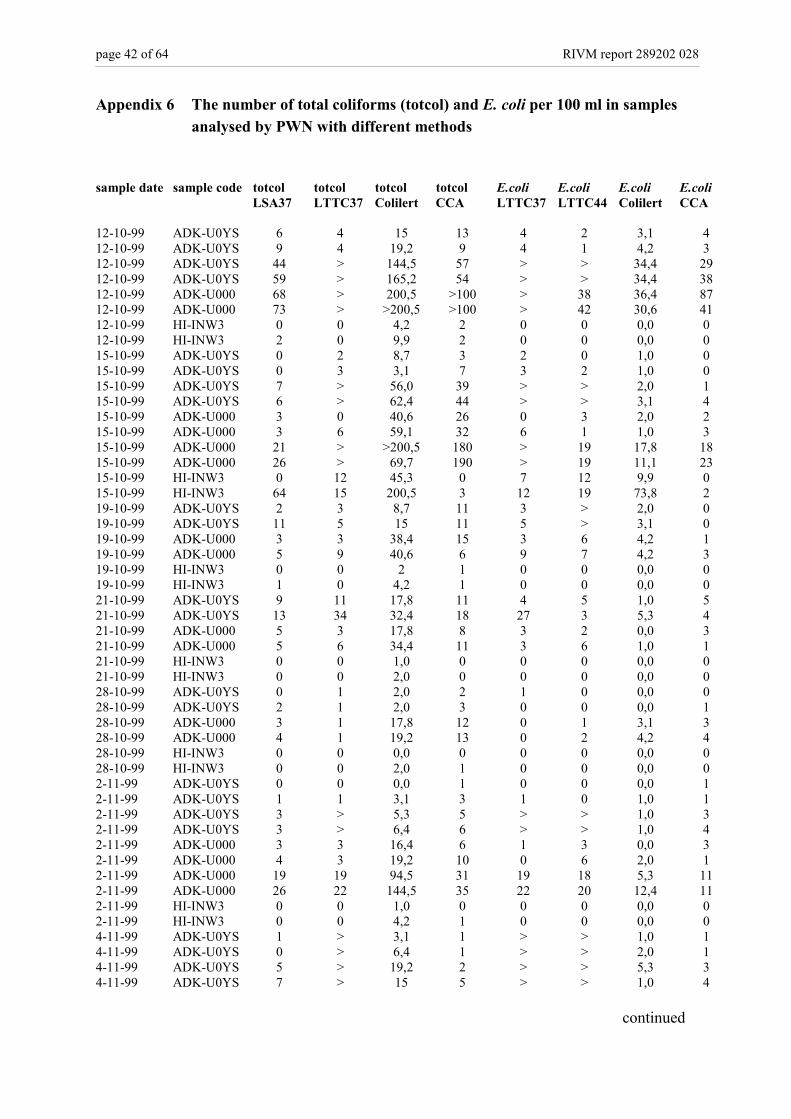
page 42 of 64 RIVM report 289202 028
Appendix 6 The number of total coliforms (totcol) and E. coli per 100 ml in samplesanalysed by PWN with different methods
sample date sample code totcol totcol totcol totcol E.coli E.coli E.coli E.coliLSA37 LTTC37 Colilert CCA LTTC37 LTTC44 Colilert CCA
12-10-99 ADK-U0YS 6 4 15 13 4 2 3,1 412-10-99 ADK-U0YS 9 4 19,2 9 4 1 4,2 312-10-99 ADK-U0YS 44 > 144,5 57 > > 34,4 2912-10-99 ADK-U0YS 59 > 165,2 54 > > 34,4 3812-10-99 ADK-U000 68 > 200,5 >100 > 38 36,4 8712-10-99 ADK-U000 73 > >200,5 >100 > 42 30,6 4112-10-99 HI-INW3 0 0 4,2 2 0 0 0,0 012-10-99 HI-INW3 2 0 9,9 2 0 0 0,0 015-10-99 ADK-U0YS 0 2 8,7 3 2 0 1,0 015-10-99 ADK-U0YS 0 3 3,1 7 3 2 1,0 015-10-99 ADK-U0YS 7 > 56,0 39 > > 2,0 115-10-99 ADK-U0YS 6 > 62,4 44 > > 3,1 415-10-99 ADK-U000 3 0 40,6 26 0 3 2,0 215-10-99 ADK-U000 3 6 59,1 32 6 1 1,0 315-10-99 ADK-U000 21 > >200,5 180 > 19 17,8 1815-10-99 ADK-U000 26 > 69,7 190 > 19 11,1 2315-10-99 HI-INW3 0 12 45,3 0 7 12 9,9 015-10-99 HI-INW3 64 15 200,5 3 12 19 73,8 219-10-99 ADK-U0YS 2 3 8,7 11 3 > 2,0 019-10-99 ADK-U0YS 11 5 15 11 5 > 3,1 019-10-99 ADK-U000 3 3 38,4 15 3 6 4,2 119-10-99 ADK-U000 5 9 40,6 6 9 7 4,2 319-10-99 HI-INW3 0 0 2 1 0 0 0,0 019-10-99 HI-INW3 1 0 4,2 1 0 0 0,0 021-10-99 ADK-U0YS 9 11 17,8 11 4 5 1,0 521-10-99 ADK-U0YS 13 34 32,4 18 27 3 5,3 421-10-99 ADK-U000 5 3 17,8 8 3 2 0,0 321-10-99 ADK-U000 5 6 34,4 11 3 6 1,0 121-10-99 HI-INW3 0 0 1,0 0 0 0 0,0 021-10-99 HI-INW3 0 0 2,0 0 0 0 0,0 028-10-99 ADK-U0YS 0 1 2,0 2 1 0 0,0 028-10-99 ADK-U0YS 2 1 2,0 3 0 0 0,0 128-10-99 ADK-U000 3 1 17,8 12 0 1 3,1 328-10-99 ADK-U000 4 1 19,2 13 0 2 4,2 428-10-99 HI-INW3 0 0 0,0 0 0 0 0,0 028-10-99 HI-INW3 0 0 2,0 1 0 0 0,0 02-11-99 ADK-U0YS 0 0 0,0 1 0 0 0,0 12-11-99 ADK-U0YS 1 1 3,1 3 1 0 1,0 12-11-99 ADK-U0YS 3 > 5,3 5 > > 1,0 32-11-99 ADK-U0YS 3 > 6,4 6 > > 1,0 42-11-99 ADK-U000 3 3 16,4 6 1 3 0,0 32-11-99 ADK-U000 4 3 19,2 10 0 6 2,0 12-11-99 ADK-U000 19 19 94,5 31 19 18 5,3 112-11-99 ADK-U000 26 22 144,5 35 22 20 12,4 112-11-99 HI-INW3 0 0 1,0 0 0 0 0,0 02-11-99 HI-INW3 0 0 4,2 1 0 0 0,0 04-11-99 ADK-U0YS 1 > 3,1 1 > > 1,0 14-11-99 ADK-U0YS 0 > 6,4 1 > > 2,0 14-11-99 ADK-U0YS 5 > 19,2 2 > > 5,3 34-11-99 ADK-U0YS 7 > 15 5 > > 1,0 4
continued

RIVM report 289202 028 page 43 of 64
Appendix 6 (continued)
sample date sample code totcol totcol totcol totcol E.coli E.coli E.coli E.coliLSA37 LTTC37 Colilert CCA LTTC37 LTTC44 Colilert CCA
4-11-99 ADK-U000 4 4 11,1 2 4 1 0,0 04-11-99 ADK-U000 4 5 15,0 2 2 2 0,0 24-11-99 ADK-U000 22 > 131 78 > .> 3,1 34-11-99 ADK-U000 24 > 125 84 > > 12,4 94-11-99 HI-INW3 0 0 0,0 0 0 0 0,0 04-11-99 HI-INW3 0 0 1,0 0 0 0 0,0 09-11-99 ADK-U0YS 190 > >200,5 90 > > 65,9 759-11-99 ADK-U0YS > > 2400 >200 > 68 517 >2009-11-99 ADK-U000 12 37 38,4 15 22 4 5,3 69-11-99 ADK-U000 39 100 291 64 60 26 27 419-11-99 HI-INW3 0 0 0,0 0 0 0 0,0 0
Note: LSA37, LTTC37, LTTC44 and CCA E. coli counts are confirmed counts, Colilert and CCA totcol countsare not ; > = too numerous to count
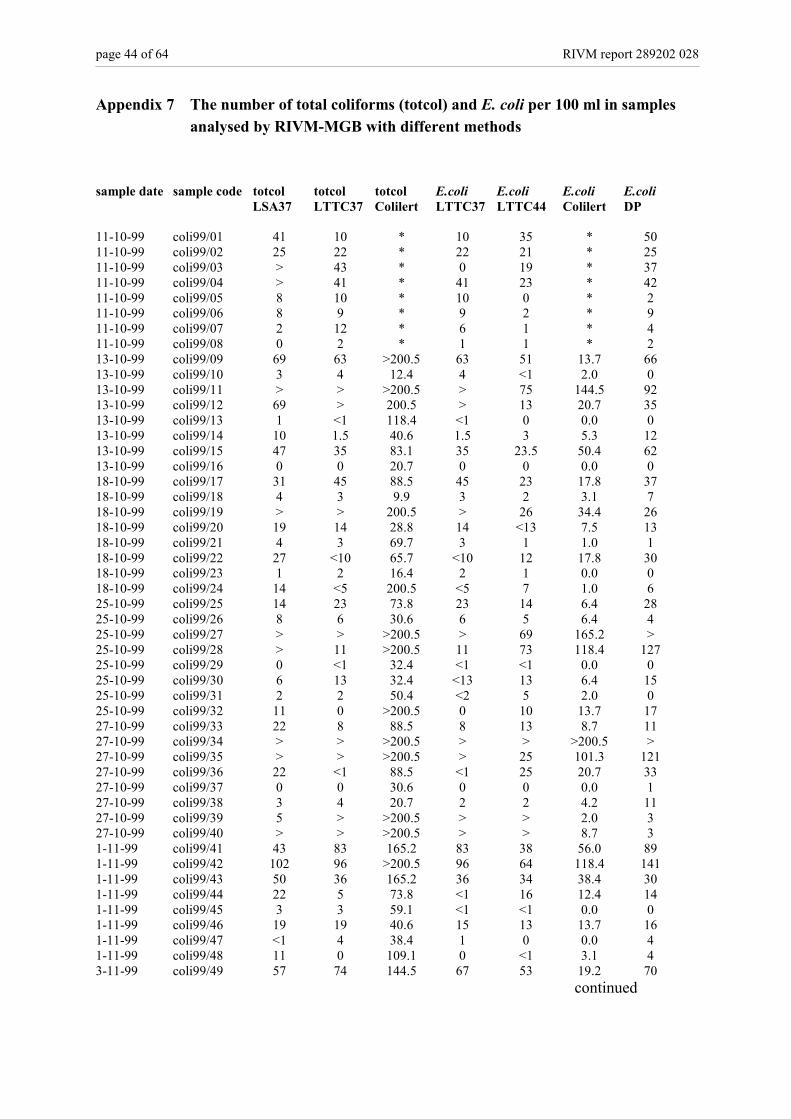
page 44 of 64 RIVM report 289202 028
Appendix 7 The number of total coliforms (totcol) and E. coli per 100 ml in samplesanalysed by RIVM-MGB with different methods
sample date sample code totcol totcol totcol E.coli E.coli E.coli E.coliLSA37 LTTC37 Colilert LTTC37 LTTC44 Colilert DP
11-10-99 coli99/01 41 10 * 10 35 * 5011-10-99 coli99/02 25 22 * 22 21 * 2511-10-99 coli99/03 > 43 * 0 19 * 3711-10-99 coli99/04 > 41 * 41 23 * 4211-10-99 coli99/05 8 10 * 10 0 * 211-10-99 coli99/06 8 9 * 9 2 * 911-10-99 coli99/07 2 12 * 6 1 * 411-10-99 coli99/08 0 2 * 1 1 * 213-10-99 coli99/09 69 63 >200.5 63 51 13.7 6613-10-99 coli99/10 3 4 12.4 4 <1 2.0 013-10-99 coli99/11 > > >200.5 > 75 144.5 9213-10-99 coli99/12 69 > 200.5 > 13 20.7 3513-10-99 coli99/13 1 <1 118.4 <1 0 0.0 013-10-99 coli99/14 10 1.5 40.6 1.5 3 5.3 1213-10-99 coli99/15 47 35 83.1 35 23.5 50.4 6213-10-99 coli99/16 0 0 20.7 0 0 0.0 018-10-99 coli99/17 31 45 88.5 45 23 17.8 3718-10-99 coli99/18 4 3 9.9 3 2 3.1 718-10-99 coli99/19 > > 200.5 > 26 34.4 2618-10-99 coli99/20 19 14 28.8 14 <13 7.5 1318-10-99 coli99/21 4 3 69.7 3 1 1.0 118-10-99 coli99/22 27 <10 65.7 <10 12 17.8 3018-10-99 coli99/23 1 2 16.4 2 1 0.0 018-10-99 coli99/24 14 <5 200.5 <5 7 1.0 625-10-99 coli99/25 14 23 73.8 23 14 6.4 2825-10-99 coli99/26 8 6 30.6 6 5 6.4 425-10-99 coli99/27 > > >200.5 > 69 165.2 >25-10-99 coli99/28 > 11 >200.5 11 73 118.4 12725-10-99 coli99/29 0 <1 32.4 <1 <1 0.0 025-10-99 coli99/30 6 13 32.4 <13 13 6.4 1525-10-99 coli99/31 2 2 50.4 <2 5 2.0 025-10-99 coli99/32 11 0 >200.5 0 10 13.7 1727-10-99 coli99/33 22 8 88.5 8 13 8.7 1127-10-99 coli99/34 > > >200.5 > > >200.5 >27-10-99 coli99/35 > > >200.5 > 25 101.3 12127-10-99 coli99/36 22 <1 88.5 <1 25 20.7 3327-10-99 coli99/37 0 0 30.6 0 0 0.0 127-10-99 coli99/38 3 4 20.7 2 2 4.2 1127-10-99 coli99/39 5 > >200.5 > > 2.0 327-10-99 coli99/40 > > >200.5 > > 8.7 31-11-99 coli99/41 43 83 165.2 83 38 56.0 891-11-99 coli99/42 102 96 >200.5 96 64 118.4 1411-11-99 coli99/43 50 36 165.2 36 34 38.4 301-11-99 coli99/44 22 5 73.8 <1 16 12.4 141-11-99 coli99/45 3 3 59.1 <1 <1 0.0 01-11-99 coli99/46 19 19 40.6 15 13 13.7 161-11-99 coli99/47 <1 4 38.4 1 0 0.0 41-11-99 coli99/48 11 0 109.1 0 <1 3.1 43-11-99 coli99/49 57 74 144.5 67 53 19.2 70
continued

RIVM report 289202 028 page 45 of 64
Appendix 7 (continued)
sample date sample code totcol totcol totcol E.coli E.coli E.coli E.coliLSA37 LTTC37 Colilert LTTC37 LTTC44 Colilert DP
3-11-99 coli99/50 38 36 78.2 36 47 30.6 523-11-99 coli99/51 46 10 109.1 6 18 19.2 333-11-99 coli99/52 42 13 118.4 4 22 16.4 213-11-99 coli99/53 1 4 62.4 3 4 1.0 23-11-99 coli99/54 10 13 38.4 10 12 11.1 213-11-99 coli99/55 3 1 23.8 <1 1 2.0 03-11-99 coli99/56 1 2 45.3 1 0 0.0 28-11-99 coli99/57 > > >200.5 > 62 94.5 1108-11-99 coli99/58 > > >200.5 > > >200.5 >8-11-99 coli99/59 > > >200.5 > 51 78.2 768-11-99 coli99/60 95 49 200.5 44 36 38.4 338-11-99 coli99/61 0 <1 40.6 <1 1 0.0 18-11-99 coli99/62 25 30 34.4 21 17 6.4 168-11-99 coli99/63 3 2 23.8 1 4 1.0 18-11-99 coli99/64 14 2 45.3 <1 5 2.0 210-11-99 coli99/65 81 > >200.5 > > 40.6 15410-11-99 coli99/66 13 21 62.4 21 12 9.9 1710-11-99 coli99/67 58 > >200.5 > not done 59.1 4910-11-99 coli99/68 71 7 >200.5 4 51 40.6 7410-11-99 coli99/69 0 <1 25.4 <1 0 1.0 110-11-99 coli99/70 21 22 56.0 20 13 16.4 1910-11-99 coli99/71 0 0 17.8 0 0 0.0 110-11-99 coli99/72 83 > >200.5 > 22 20.7 2515-11-99 coli99/73 47 64 144.5 64 26 6.4 3615-11-99 coli99/74 2 2 15.0 2 3 2.0 515-11-99 coli99/75 65 9 144.5 8 20 16.4 1515-11-99 coli99/76 41 > 165.2 > 22 32.4 2215-11-99 coli99/77 1 1 7.5 1 1 0.0 015-11-99 coli99/78 11 16 36.4 15 12 11.1 1815-11-99 coli99/79 0 1 15.0 1 0 0.0 015-11-99 coli99/80 3 0 27.1 0 0 0.0 0
Note: LSA37, LTTC37 and LTTC44 counts are confirmed counts, Colilert and DP counts are not; * = analysisfailed, > = too numerous to count

page 46 of 64 RIVM report 289202 028
Appendix 8 European method comparison trial: final reportColin R. Fricker, Seppo I. Niemela & John L. Lee, September 2000
Summary
A large trial has been performed with twenty participating laboratories from thirteenEuropean countries. The aim of the trial was to test whether a protocol for comparing twomicrobiological methods was suitable for its purpose. The ISO reference procedure fordetection of coliforms and E. coli in water was compared with the Colilert 18/QuantiTraymethod. Analysis of the data was carried out independently and not by any of theparticipating laboratories.
Examination of the data showed that the use of “confirmation coefficients” or “true positiverates” to compare the two methods showed a degree of uncertainty. The data produced bymultiplying presumptive counts with laboratory-specific confirmation factors is not Normalenough (based on Gaussian statistics) to permit a parametric test. Non-parametric tests donot address comparison of the true means. Therefore, the statistically inefficient compromiseof testing the sums of 20 laboratories must be accepted.
Data collected in one laboratory where all colonies from a large number of samples wereconfirmed showed that the use of confirmation coefficients led to an underestimate of theperformance of Colilert compared to the ISO method. In that particular laboratory, whilstconfirming all isolates showed that Colilert recovered significantly more E. coli than thereference method, use of a confirmation coefficient, would have led to the conclusion that thereference method recovered significantly more E. coli than Colilert. Comparing thedifferences between individual samples can be misleading. However, it was clear from thedata that the confirmation rate for Colilert was significantly higher than that for the referencemethod in most laboratories and in most cases Colilert results could be used withoutconfirmation. The confirmation rate for Colilert was generally under estimated becausefermentation of lactose was used in the definition of a coliform. It is clear that manycoliforms are unable to ferment lactose within 48 hours but are able to cleave ONPG throughthe use of �-D-galactosidase. If the definition of a coliform had been possession of �-D-galactosidase then the confirmation rates for Colilert would have been higher.
Comparisons have been made of the relative difference of the sums of organisms detected ineach laboratory and the mean relative difference. These comparisons demonstrate thatColilert recovered significantly more coliforms than the ISO method and that there was noapparent difference between Colilert and the ISO method for recovery of E. coli. In order todetermine if the use of confirmation coefficients is acceptable and to provide more usefuldata for E. coli further work was performed in five laboratories. This work involvedconfirmation of all colonies obtained from a small number of samples and subsequentstatistical analysis of the results demonstrated that Colilert was significantly better than theISO reference method in some laboratories and was as good in the remaining laboratories. Itis concluded that Colilert is a suitable alternative procedure for the detection of E. coli andcoliforms in water.
A protocol has been developed which has been shown to be suitable for comparing twomicrobiological methods. The basis of the protocol is that a relatively small number oflaboratories (five is suggested) from different geographical locations and with different watertypes should be used. Samples should not be “drinking water” but should be drinking watercontaminated with sewage effluent which is then chlorinated or drinking water seeded withriver water, depending on whether the laboratory normally analyses chlorinated or

RIVM report 289202 028 page 47 of 64
unchlorinated drinking water. The need for very large numbers of samples can be avoided inthis way. Whilst large numbers of samples are not required, it is important that a largeamount of confirmation data is obtained and for this reason, samples with relatively lownumbers of target organisms are preferable such that all isolates can be confirmed.
Introduction
The microbiological quality of drinking water is safeguarded through a program of frequentanalyses of water samples leaving the treatment works, in the distribution system and atcustomers’ taps. These frequent analyses for the indicator organisms, coliforms, Escherichiacoli, faecal streptococci and Clostridium perfringens are prescribed in the European UnionDrinking Water Directive (EUDWD) and will be incorporated into the national law ofmember states. The EUDWD specifies a method to be used for the detection of coliformsand E.coli that involves membrane filtration and incubation on a tergitol-TTC agar medium.Whilst it is not mandatory that member states use this method, there is an obligation todemonstrate that any alternative method which is to be used has a similar performance.
The exact nature of the similarity is not defined, nor is the methodology to be used forcomparison of methods. In Article 7, Part 5b, the European Directive specifically states,”Methods other than those specified in Annex III, Part 1, may be used, providing it can bedemonstrated that the results obtained are at least as reliable as those produced by themethods specified. Member States which have recourse to alternative methods shall providethe Commission with all relevant information concerning such methods and theirequivalence.”
It is generally accepted that alternative methods should have a performance, which isequivalent or better. In this context "equivalent or better" must be defined. A method isnormally considered to be "equivalent, if the (confirmed) recovery of target organisms is notsignificantly lower than the reference method. However, “significantly lower" also requiresdefinition. “Equivalence” may also incorporate factors other than sensitivity. Whencomparing two methods it is often the case that the practicality of the tests may also beconsidered. For example a test which takes one day to complete and has a similar sensitivityto another test which takes three days to complete may be considered “better” or at leastmore appropriate.
In order to try and develop a protocol for comparison of quantitative microbiological culturalmethods, a large team of laboratories from thirteen European countries was established(Appendix 1). A detailed protocol for performing the comparison between the Europeanreference method and Colilert 18/QuantiTray (Colilert) was developed and agreed to by allparticipants (Appendix 2). Quality control procedures were also established. Colilert waschosen, as the method for comparison as it is easy to use, is quick to perform, requires verylittle training and allows a wide range of laboratory personnel to perform microbiologicaltests.
page 48 of 64 RIVM report 289202 028
The Trial
The Initial TrialInitial tests were performed over a period of several months during the latter part of 1999.Individual laboratories used the types of water which they would normally expect to examineduring routine operation. Thus those laboratories which routinely examine unchlorinatedwaters used these for comparison whilst those which typically examine chlorinated watersused, for the most part, disinfected sewage effluent, using a procedure developed at ThamesWater and subsequently modified by the Public Health Laboratory Service, UK. A trainingsession was held before the commencement of the comparison where the personnel whowould actually perform the tests were trained in how to perform both tests and, wherenecessary, how to prepare disinfected sewage effluents. In addition, trained personnel madevisits to individual laboratories for further training and advice where necessary.
Each laboratory performed a small number of confirmations as described in Appendix 2 andalso sent strains to a central laboratory for independent confirmation. One laboratoryperformed confirmations on all samples where the result for one of the two tests was tenorganisms or less per 100 ml of water. All these confirmations of isolates from the variouslaboratories were performed in an effort to determine the “true positive rate” for each test ineach laboratory.
The Second Stage of the TrialA second stage of the trial, where samples were analyzed for E.coli only was performedduring June and July of 2000. This part of the trial was performed in five laboratories and allisolates (either colonies on membranes or positive wells from Colilert) were confirmed. Allsamples were analyzed by the same personnel who visited each laboratory to perform thework.
Results were collated at one laboratory and subsequently independently analyzed byProfessor Seppo Niemela.
Results
The Initial TrialTable 1 shows the number of useable data points from each laboratory. Samples where bothmethods gave a negative result (0/0) were removed, as were any samples where results werereported as “greater than” or “too numerous to count”.
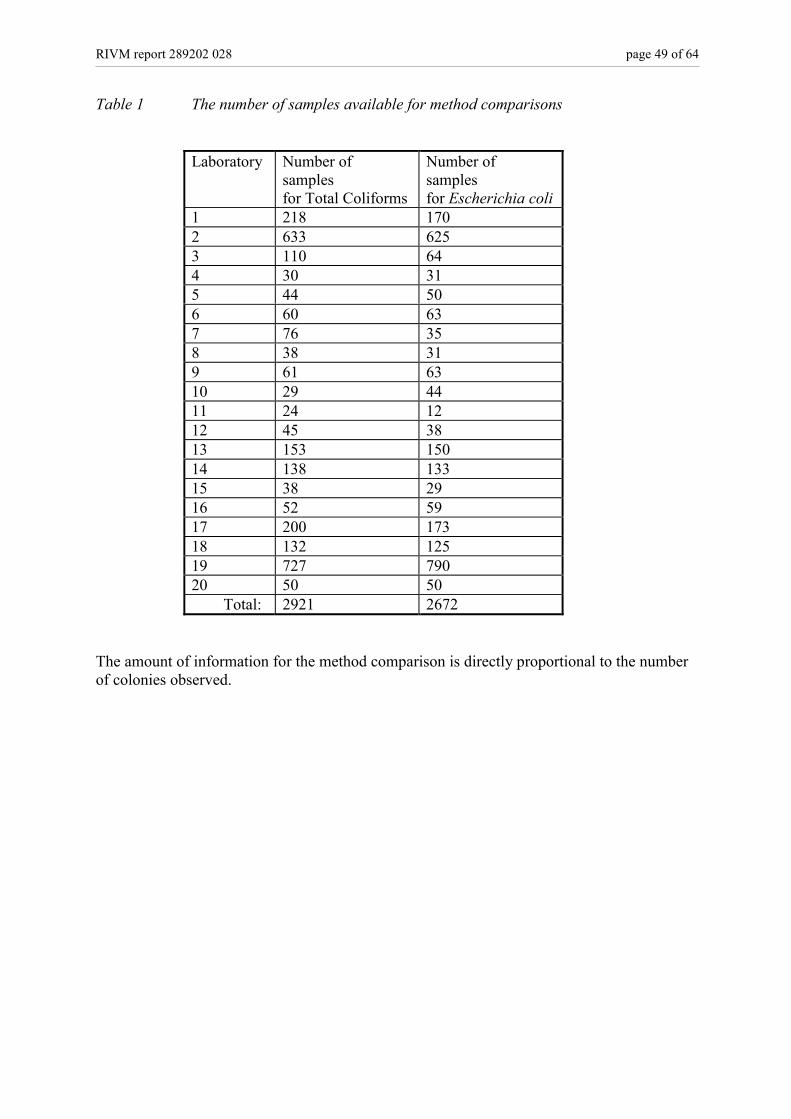
RIVM report 289202 028 page 49 of 64
Table 1 The number of samples available for method comparisons
Laboratory Number ofsamplesfor Total Coliforms
Number ofsamplesfor Escherichia coli
1 218 1702 633 6253 110 644 30 315 44 506 60 637 76 358 38 319 61 6310 29 4411 24 1212 45 3813 153 15014 138 13315 38 2916 52 5917 200 17318 132 12519 727 79020 50 50 Total: 2921 2672
The amount of information for the method comparison is directly proportional to the numberof colonies observed.

page 50 of 64 RIVM report 289202 028
Table 2 Numbers of presumptive colonies (and corresponding Colilert counts)observed
Laboratory PresumptiveColilert TC
Presumptive Tergitol TC
PresumptiveColilert EC
PresumptiveTergitol EC
1 8378 6982 230 4752 23220 13637 3728 62913 1310 1084 108 5114 1147 378 316 3315 1753 1524 588 8896 1383 1471 449 9407 2323 1333 141 4838 1525 1047 512 4779 1715 2624 655 101810 183 245 715 18611 443 259 24 4412 1447 611 182 26513 5068 5137 542 76214 2940 1376 373 62215 1011 209 266 27016 3337 571 1518 134917 4328 4235 602 125618 2509 1609 468 125719 13838 13592 2531 488820 909 974 211 786 Total: 78770 58898 14160 23100
The amount of information contributed by each laboratory differs considerably.
The amount of information available for the comparison of the total coliform methods isalmost four times that available for comparing the E.coli methods. The difference becomeseven greater after the confirmation coefficients have been applied (see Tables 6 and 8).
For the determination of the confirmation coefficients, each laboratory isolated a number ofcultures for confirmation. The reliability of the coefficient is related to the number of culturestested.

RIVM report 289202 028 page 51 of 64
Table 3 The numbers of cultures tested in each laboratory to determine anaverage confirmation coefficient for each of the four methods. Thecoefficients themselves are presented in Table 4
Laboratory ColilertTC
TergitolTC
ColilertEC
TergitolEC
1 148 109 97 1252 356 310 323 3083 99 109 57 604 52 22 22 255 50 50 50 506 28 30 28 287 51 46 29 418 39 133 41 1299 20 18 18 1910 38 32 12 2411 30 28 7 1412 34 34 24 3113 113 107 114 11814 101 96 68 8215 89 52 48 4816 70 55 58 5917 100 55 100 4218 26 27 25 2719 1894 2265 1766 380620 25 25 25 25 Total: 3363 3603 2912 5061
The numbers of cultures isolated in each laboratory were very different and small numberslead to imprecise coefficients, thus increasing the random differences between laboratories.
The “confirmation coefficients” (the proportion of isolates which were detected by eachmethod and subsequently shown by confirmation tests to be target organisms) for eachlaboratory have been calculated and are shown in Table 4.

page 52 of 64 RIVM report 289202 028
Table 4 Table of confirmation coefficients
Laboratory ColilertTC
TergitolTC
ColilertEC
TergitolEC
1 0.53 0.21 0.56 0.182 0.77 0.48 0.86 0.593 0.91 0.83 0.93 0.784 0.90 0.82 0.91 0.645 0.90 0.86 0.92 0.706 1.00 1.00 0.96 1.007 0.75 0.74 0.90 0.468 0.95 0.90 0.88 0.769 0.75 0.67 0.83 0.6310 1.00 0.66 0.92 0.4611 0.90 0.93 1.00 0.5012 0.62 0.91 0.92 0.9413 0.88 0.65 0.97 0.8514 0.83 0.77 0.75 0.3015 0.57 0.60 1.00 0.5616 0.60 0.82 0.97 0.8317 0.91 0.67 0.97 0.2618 0.92 0.96 0.88 0.4119 0.97 0.74 0.99 0.4220 1.00 0.92 1.00 0.44
It is clear that there are considerable differences between the confirmation coefficientsobtained in different laboratories and between methods. The ranges, means, standarddeviations and standard error of the means of the confirmation coefficients are shown in
Table 5 Range, mean, standard deviations and standard error of the means of allparticipating laboratories
Method Range ofconfirmationcoeff
Meanconfirmationcoeff
Standarddeviation
Standard errorof the mean
Colilert totalcoliforms
0.53-1.0 0.83 0.15 0.034
Tergitol totalcoliforms
0.21-1.0 0.76 0.19 0.043
Colilert E.coli 0.56-1.0 0.91 0.10 0.022Tergitol E.coli 0.18-1.0 0.59 0.23 0.051
The means have been calculated simply by summing the confirmation coefficient for eachlaboratory and dividing by 20 (the number of laboratories which submitted confirmationdata). In most cases, Colilert had higher confirmation coefficients for both coliforms andE.coli.
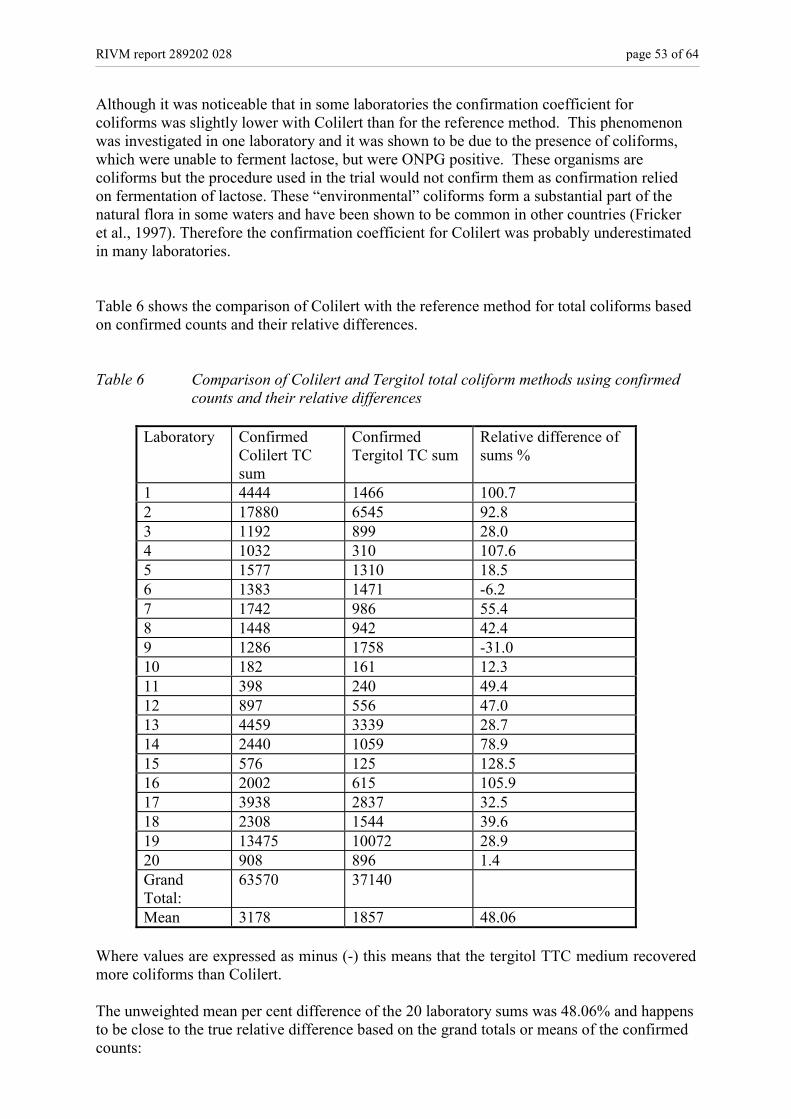
RIVM report 289202 028 page 53 of 64
Although it was noticeable that in some laboratories the confirmation coefficient forcoliforms was slightly lower with Colilert than for the reference method. This phenomenonwas investigated in one laboratory and it was shown to be due to the presence of coliforms,which were unable to ferment lactose, but were ONPG positive. These organisms arecoliforms but the procedure used in the trial would not confirm them as confirmation reliedon fermentation of lactose. These “environmental” coliforms form a substantial part of thenatural flora in some waters and have been shown to be common in other countries (Frickeret al., 1997). Therefore the confirmation coefficient for Colilert was probably underestimatedin many laboratories.
Table 6 shows the comparison of Colilert with the reference method for total coliforms basedon confirmed counts and their relative differences.
Table 6 Comparison of Colilert and Tergitol total coliform methods using confirmedcounts and their relative differences
Laboratory ConfirmedColilert TCsum
ConfirmedTergitol TC sum
Relative difference ofsums %
1 4444 1466 100.72 17880 6545 92.83 1192 899 28.04 1032 310 107.65 1577 1310 18.56 1383 1471 -6.27 1742 986 55.48 1448 942 42.49 1286 1758 -31.010 182 161 12.311 398 240 49.412 897 556 47.013 4459 3339 28.714 2440 1059 78.915 576 125 128.516 2002 615 105.917 3938 2837 32.518 2308 1544 39.619 13475 10072 28.920 908 896 1.4GrandTotal:
63570 37140
Mean 3178 1857 48.06
Where values are expressed as minus (-) this means that the tergitol TTC medium recoveredmore coliforms than Colilert.
The unweighted mean per cent difference of the 20 laboratory sums was 48.06% and happensto be close to the true relative difference based on the grand totals or means of the confirmedcounts:
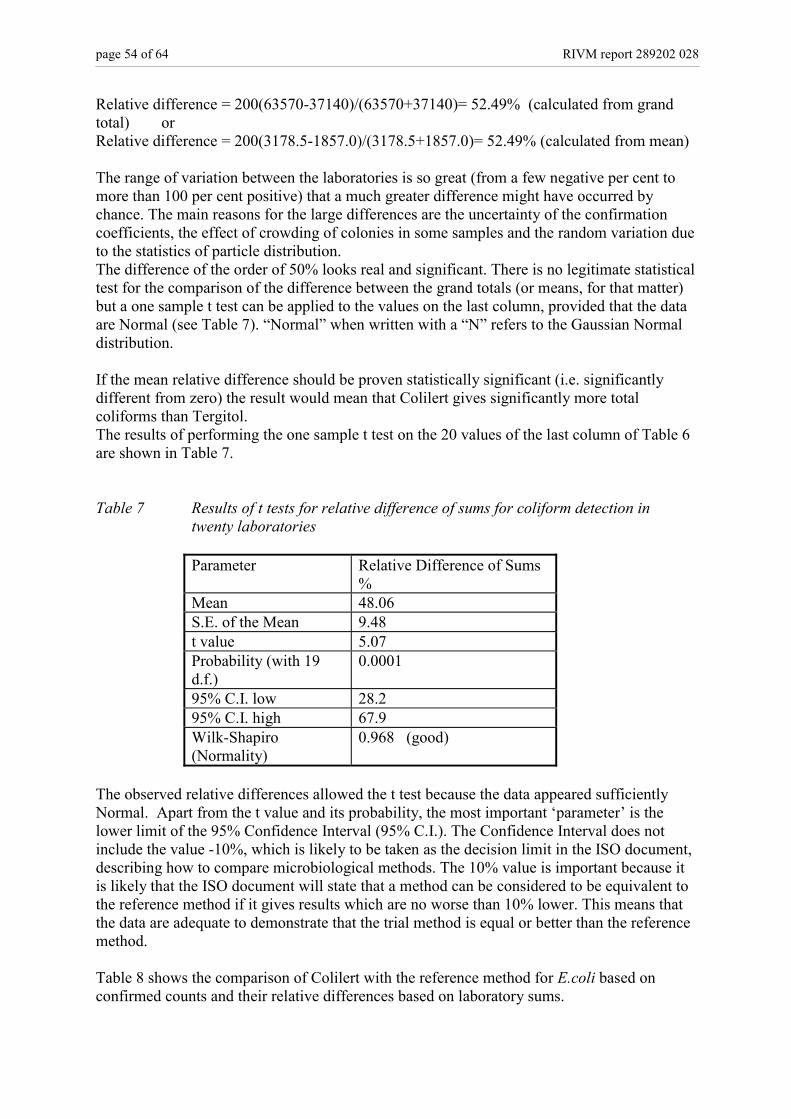
page 54 of 64 RIVM report 289202 028
Relative difference = 200(63570-37140)/(63570+37140)= 52.49% (calculated from grandtotal) orRelative difference = 200(3178.5-1857.0)/(3178.5+1857.0)= 52.49% (calculated from mean)
The range of variation between the laboratories is so great (from a few negative per cent tomore than 100 per cent positive) that a much greater difference might have occurred bychance. The main reasons for the large differences are the uncertainty of the confirmationcoefficients, the effect of crowding of colonies in some samples and the random variation dueto the statistics of particle distribution.The difference of the order of 50% looks real and significant. There is no legitimate statisticaltest for the comparison of the difference between the grand totals (or means, for that matter)but a one sample t test can be applied to the values on the last column, provided that the dataare Normal (see Table 7). “Normal” when written with a “N” refers to the Gaussian Normaldistribution.
If the mean relative difference should be proven statistically significant (i.e. significantlydifferent from zero) the result would mean that Colilert gives significantly more totalcoliforms than Tergitol.The results of performing the one sample t test on the 20 values of the last column of Table 6are shown in Table 7.
Table 7 Results of t tests for relative difference of sums for coliform detection intwenty laboratories
Parameter Relative Difference of Sums%
Mean 48.06S.E. of the Mean 9.48t value 5.07Probability (with 19d.f.)
0.0001
95% C.I. low 28.295% C.I. high 67.9Wilk-Shapiro(Normality)
0.968 (good)
The observed relative differences allowed the t test because the data appeared sufficientlyNormal. Apart from the t value and its probability, the most important ‘parameter’ is thelower limit of the 95% Confidence Interval (95% C.I.). The Confidence Interval does notinclude the value -10%, which is likely to be taken as the decision limit in the ISO document,describing how to compare microbiological methods. The 10% value is important because itis likely that the ISO document will state that a method can be considered to be equivalent tothe reference method if it gives results which are no worse than 10% lower. This means thatthe data are adequate to demonstrate that the trial method is equal or better than the referencemethod.
Table 8 shows the comparison of Colilert with the reference method for E.coli based onconfirmed counts and their relative differences based on laboratory sums.
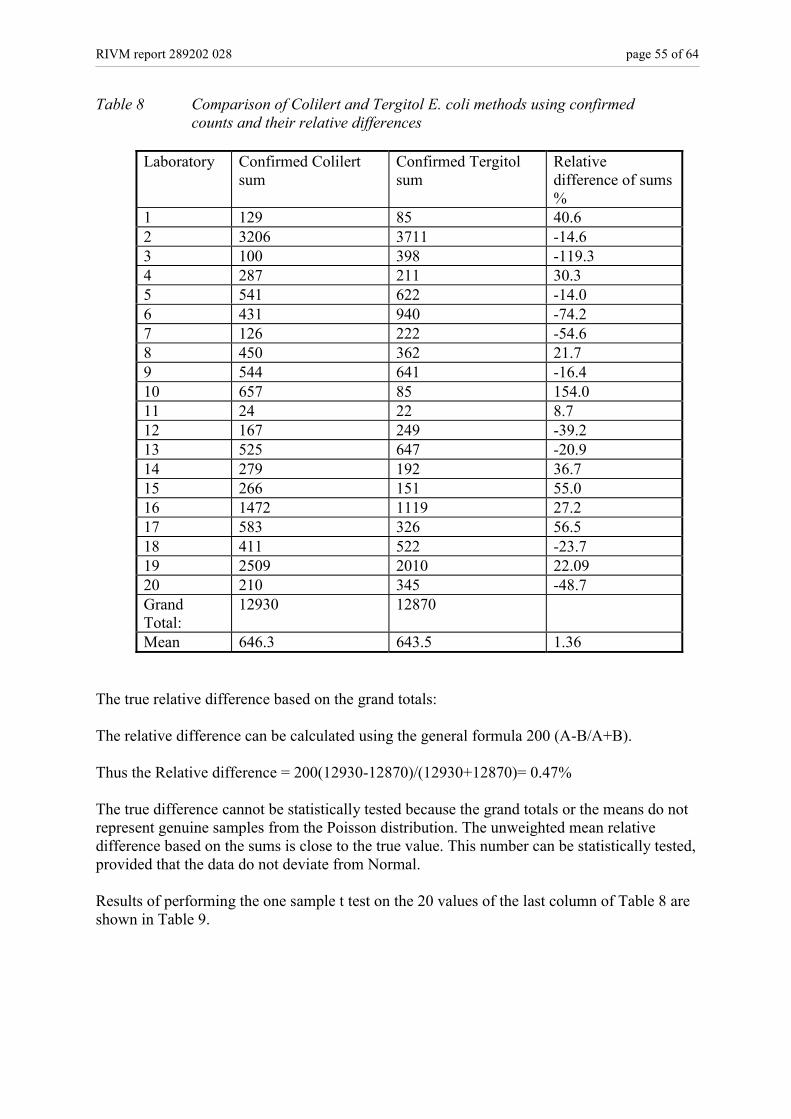
RIVM report 289202 028 page 55 of 64
Table 8 Comparison of Colilert and Tergitol E. coli methods using confirmedcounts and their relative differences
Laboratory Confirmed Colilertsum
Confirmed Tergitolsum
Relativedifference of sums%
1 129 85 40.62 3206 3711 -14.63 100 398 -119.34 287 211 30.35 541 622 -14.06 431 940 -74.27 126 222 -54.68 450 362 21.79 544 641 -16.410 657 85 154.011 24 22 8.712 167 249 -39.213 525 647 -20.914 279 192 36.715 266 151 55.016 1472 1119 27.217 583 326 56.518 411 522 -23.719 2509 2010 22.0920 210 345 -48.7GrandTotal:
12930 12870
Mean 646.3 643.5 1.36
The true relative difference based on the grand totals:
The relative difference can be calculated using the general formula 200 (A-B/A+B).
Thus the Relative difference = 200(12930-12870)/(12930+12870)= 0.47%
The true difference cannot be statistically tested because the grand totals or the means do notrepresent genuine samples from the Poisson distribution. The unweighted mean relativedifference based on the sums is close to the true value. This number can be statistically tested,provided that the data do not deviate from Normal.
Results of performing the one sample t test on the 20 values of the last column of Table 8 areshown in Table 9.

page 56 of 64 RIVM report 289202 028
Table 9 Results from one sample t tests from Table 8
Parameter Relative Difference of Sums%
Mean 1.36S.E. of the Mean 12.97t value 0.10Probability 0.917695% C.I. low -25.895% C.I. high 28.5Wilk-Shapiro(Normality)
0.941 (sufficient)
The null hypothesis of no difference between the methods has not been disproved. Thismeans that the methods should be considered equivalent unless further data show otherwise.The data are Normal enough for the test to be acceptable.
Due to the very great variation between laboratories the mean is very uncertain and itsstandard error remains high. The Confidence Interval contains the value -10%. That meansmore or better quality data are required to definitively determine that the -10% limit is notincluded in the 95% C.I.
The ideal situation of basing a t test on all the 2671 degrees of freedom (see Table 1) frompaired samples is not realized.
After completion of the second stage of the study in which all isolates were confirmed itbecame apparent that an alternative statistical analysis would be preferable. Data weretherefore re-examined using the same statistical approach as was used for the second stage,for both coliforms and E.coli. The data have been ‘edited’ by omitting cases (samples) asfollows:
1. All cases (samples) with either Colilert or Tregitol counts zero2. Colilert counts higher than 201 (This is a safety measure because such high counts are
impossible with Colilert 18 unless dilutions are involved. There is some doubtwhether this was taken into account with the accompanying Tergitol results. Thisaffects only 20 total coliform and no faecal coliform cases.)
3. Cases with Tergitol counts higher than 200.
The evaluations are based on decision rules adapted from the ISO document. The words‘better’ and ‘worse’ contain a value judgement wider than mere quantitative comparison andare not used. The following evaluation includes only the quantitative comparison of meandifferences between confirmed counts. The evaluation includes four alternatives:
1. ‘higher’ is used when the mean relative difference is positive (Colilert counts higher)and the difference is statistically significant. Statistical significance is judged byobserving that the lower 95% C.I. is higher than zero.
2. ‘lower’ is used when the mean relative difference is negative (Colilert counts lower)and the upper 95% C.I. is less than zero (negative).
3. ‘no difference’ is used when the confidence interval includes zero but the lower 95%C.I. is higher than –10%.
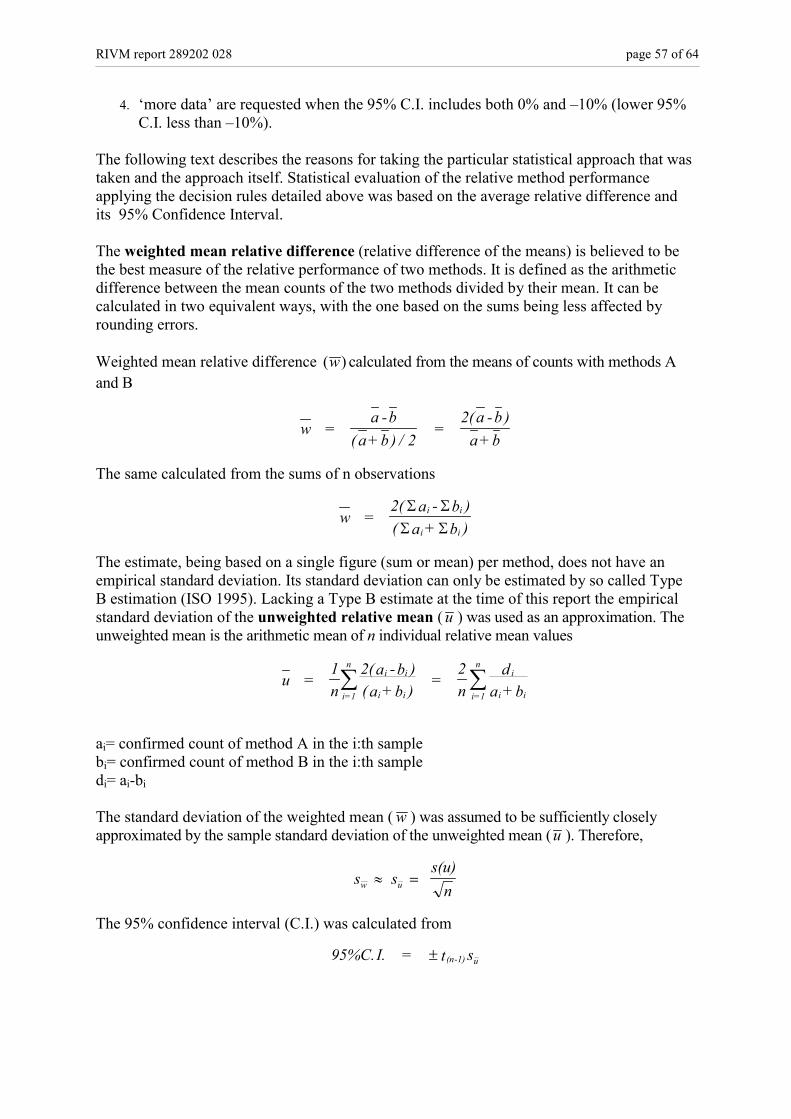
RIVM report 289202 028 page 57 of 64
4. ‘more data’ are requested when the 95% C.I. includes both 0% and –10% (lower 95%C.I. less than –10%).
The following text describes the reasons for taking the particular statistical approach that wastaken and the approach itself. Statistical evaluation of the relative method performanceapplying the decision rules detailed above was based on the average relative difference andits 95% Confidence Interval.
The weighted mean relative difference (relative difference of the means) is believed to bethe best measure of the relative performance of two methods. It is defined as the arithmeticdifference between the mean counts of the two methods divided by their mean. It can becalculated in two equivalent ways, with the one based on the sums being less affected byrounding errors.
Weighted mean relative difference ( )w calculated from the means of counts with methods Aand B
The same calculated from the sums of n observations
The estimate, being based on a single figure (sum or mean) per method, does not have anempirical standard deviation. Its standard deviation can only be estimated by so called TypeB estimation (ISO 1995). Lacking a Type B estimate at the time of this report the empiricalstandard deviation of the unweighted relative mean ( u ) was used as an approximation. Theunweighted mean is the arithmetic mean of n individual relative mean values
ai= confirmed count of method A in the i:th samplebi= confirmed count of method B in the i:th sampledi= ai-bi
The standard deviation of the weighted mean ( w ) was assumed to be sufficiently closelyapproximated by the sample standard deviation of the unweighted mean (u ). Therefore,
The 95% confidence interval (C.I.) was calculated from
w = a -b
( a+b ) / 2 =
2(a -b )a+b
w = 2( a - b )( a + b )
i i
i i
� �
� �
u = 1n
2(a -b )( a +b )
= 2n
da +bi=1
ni i
i i i=1
ni
i i� �
s s s(u)
nw u� �
95%C.I. = t s(n-1) u�
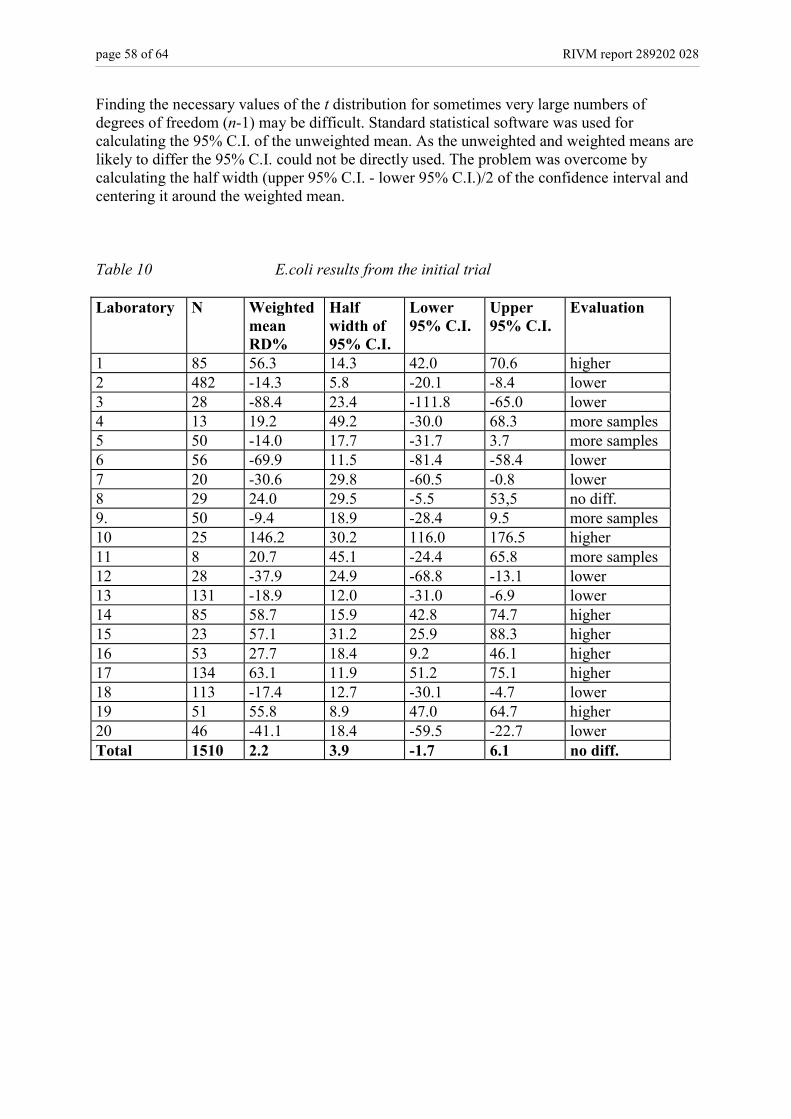
page 58 of 64 RIVM report 289202 028
Finding the necessary values of the t distribution for sometimes very large numbers ofdegrees of freedom (n-1) may be difficult. Standard statistical software was used forcalculating the 95% C.I. of the unweighted mean. As the unweighted and weighted means arelikely to differ the 95% C.I. could not be directly used. The problem was overcome bycalculating the half width (upper 95% C.I. - lower 95% C.I.)/2 of the confidence interval andcentering it around the weighted mean.
Table 10 E.coli results from the initial trial
Laboratory N WeightedmeanRD%
Halfwidth of95% C.I.
Lower95% C.I.
Upper95% C.I.
Evaluation
1 85 56.3 14.3 42.0 70.6 higher2 482 -14.3 5.8 -20.1 -8.4 lower3 28 -88.4 23.4 -111.8 -65.0 lower4 13 19.2 49.2 -30.0 68.3 more samples5 50 -14.0 17.7 -31.7 3.7 more samples6 56 -69.9 11.5 -81.4 -58.4 lower7 20 -30.6 29.8 -60.5 -0.8 lower8 29 24.0 29.5 -5.5 53,5 no diff.9. 50 -9.4 18.9 -28.4 9.5 more samples10 25 146.2 30.2 116.0 176.5 higher11 8 20.7 45.1 -24.4 65.8 more samples12 28 -37.9 24.9 -68.8 -13.1 lower13 131 -18.9 12.0 -31.0 -6.9 lower14 85 58.7 15.9 42.8 74.7 higher15 23 57.1 31.2 25.9 88.3 higher16 53 27.7 18.4 9.2 46.1 higher17 134 63.1 11.9 51.2 75.1 higher18 113 -17.4 12.7 -30.1 -4.7 lower19 51 55.8 8.9 47.0 64.7 higher20 46 -41.1 18.4 -59.5 -22.7 lowerTotal 1510 2.2 3.9 -1.7 6.1 no diff.
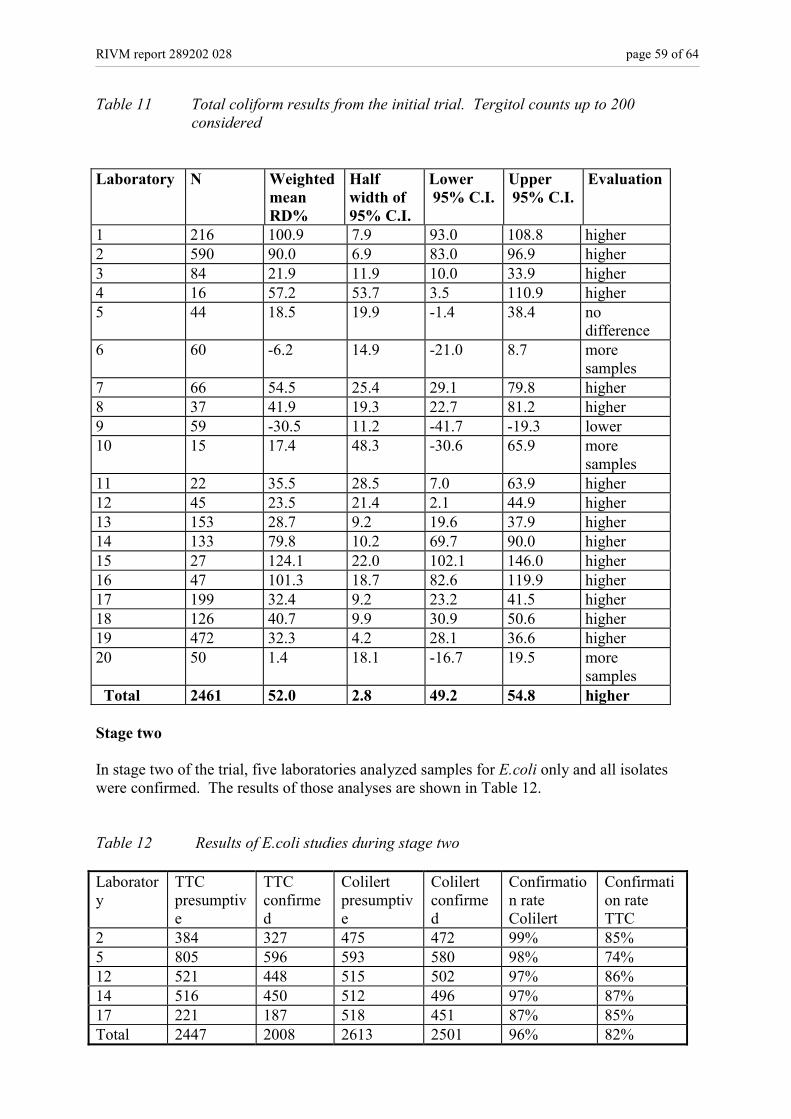
RIVM report 289202 028 page 59 of 64
Table 11 Total coliform results from the initial trial. Tergitol counts up to 200considered
Laboratory N WeightedmeanRD%
Halfwidth of95% C.I.
Lower 95% C.I.
Upper 95% C.I.
Evaluation
1 216 100.9 7.9 93.0 108.8 higher2 590 90.0 6.9 83.0 96.9 higher3 84 21.9 11.9 10.0 33.9 higher4 16 57.2 53.7 3.5 110.9 higher5 44 18.5 19.9 -1.4 38.4 no
difference6 60 -6.2 14.9 -21.0 8.7 more
samples7 66 54.5 25.4 29.1 79.8 higher8 37 41.9 19.3 22.7 81.2 higher9 59 -30.5 11.2 -41.7 -19.3 lower10 15 17.4 48.3 -30.6 65.9 more
samples11 22 35.5 28.5 7.0 63.9 higher12 45 23.5 21.4 2.1 44.9 higher13 153 28.7 9.2 19.6 37.9 higher14 133 79.8 10.2 69.7 90.0 higher15 27 124.1 22.0 102.1 146.0 higher16 47 101.3 18.7 82.6 119.9 higher17 199 32.4 9.2 23.2 41.5 higher18 126 40.7 9.9 30.9 50.6 higher19 472 32.3 4.2 28.1 36.6 higher20 50 1.4 18.1 -16.7 19.5 more
samples Total 2461 52.0 2.8 49.2 54.8 higher
Stage two
In stage two of the trial, five laboratories analyzed samples for E.coli only and all isolateswere confirmed. The results of those analyses are shown in Table 12.
Table 12 Results of E.coli studies during stage two
Laboratory
TTCpresumptive
TTCconfirmed
Colilertpresumptive
Colilertconfirmed
Confirmation rateColilert
Confirmation rateTTC
2 384 327 475 472 99% 85%5 805 596 593 580 98% 74%12 521 448 515 502 97% 86%14 516 450 512 496 97% 87%17 221 187 518 451 87% 85%Total 2447 2008 2613 2501 96% 82%
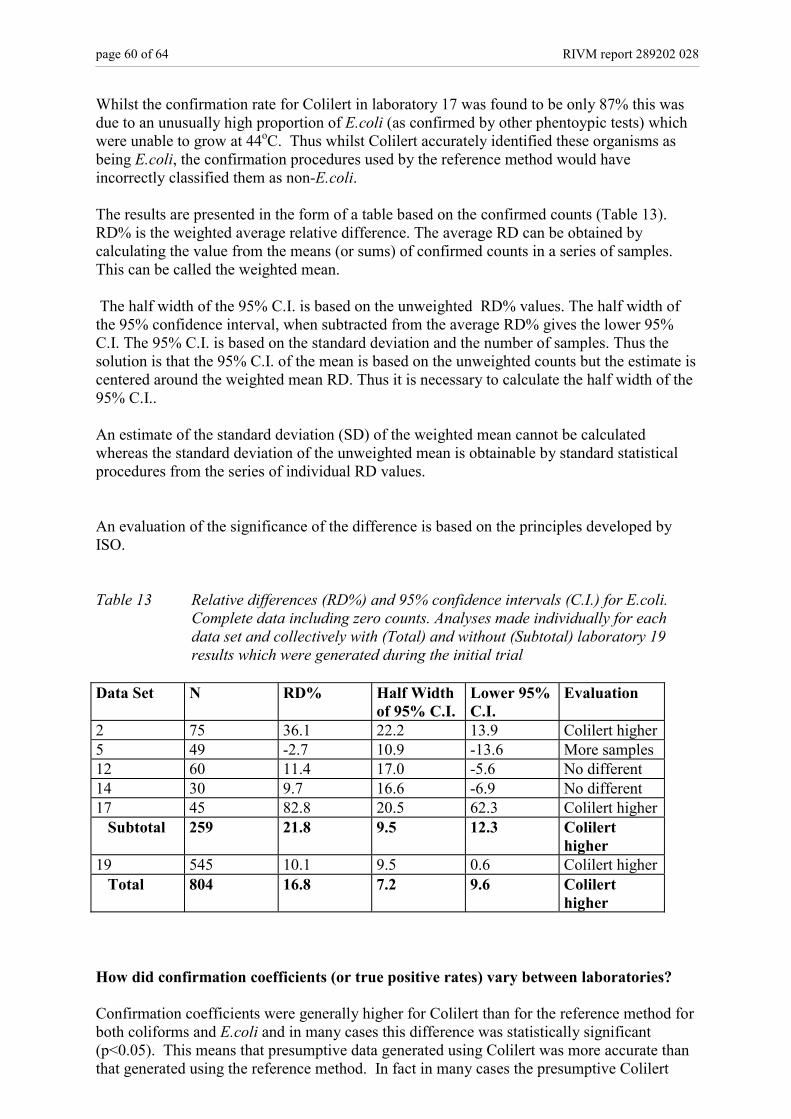
page 60 of 64 RIVM report 289202 028
Whilst the confirmation rate for Colilert in laboratory 17 was found to be only 87% this wasdue to an unusually high proportion of E.coli (as confirmed by other phentoypic tests) whichwere unable to grow at 44oC. Thus whilst Colilert accurately identified these organisms asbeing E.coli, the confirmation procedures used by the reference method would haveincorrectly classified them as non-E.coli.
The results are presented in the form of a table based on the confirmed counts (Table 13).RD% is the weighted average relative difference. The average RD can be obtained bycalculating the value from the means (or sums) of confirmed counts in a series of samples.This can be called the weighted mean.
The half width of the 95% C.I. is based on the unweighted RD% values. The half width ofthe 95% confidence interval, when subtracted from the average RD% gives the lower 95%C.I. The 95% C.I. is based on the standard deviation and the number of samples. Thus thesolution is that the 95% C.I. of the mean is based on the unweighted counts but the estimate iscentered around the weighted mean RD. Thus it is necessary to calculate the half width of the95% C.I..
An estimate of the standard deviation (SD) of the weighted mean cannot be calculatedwhereas the standard deviation of the unweighted mean is obtainable by standard statisticalprocedures from the series of individual RD values.
An evaluation of the significance of the difference is based on the principles developed byISO.
Table 13 Relative differences (RD%) and 95% confidence intervals (C.I.) for E.coli.Complete data including zero counts. Analyses made individually for eachdata set and collectively with (Total) and without (Subtotal) laboratory 19results which were generated during the initial trial
Data Set N RD% Half Widthof 95% C.I.
Lower 95%C.I.
Evaluation
2 75 36.1 22.2 13.9 Colilert higher5 49 -2.7 10.9 -13.6 More samples12 60 11.4 17.0 -5.6 No different14 30 9.7 16.6 -6.9 No different17 45 82.8 20.5 62.3 Colilert higher Subtotal 259 21.8 9.5 12.3 Colilert
higher19 545 10.1 9.5 0.6 Colilert higher Total 804 16.8 7.2 9.6 Colilert
higher
How did confirmation coefficients (or true positive rates) vary between laboratories?
Confirmation coefficients were generally higher for Colilert than for the reference method forboth coliforms and E.coli and in many cases this difference was statistically significant(p<0.05). This means that presumptive data generated using Colilert was more accurate thanthat generated using the reference method. In fact in many cases the presumptive Colilert
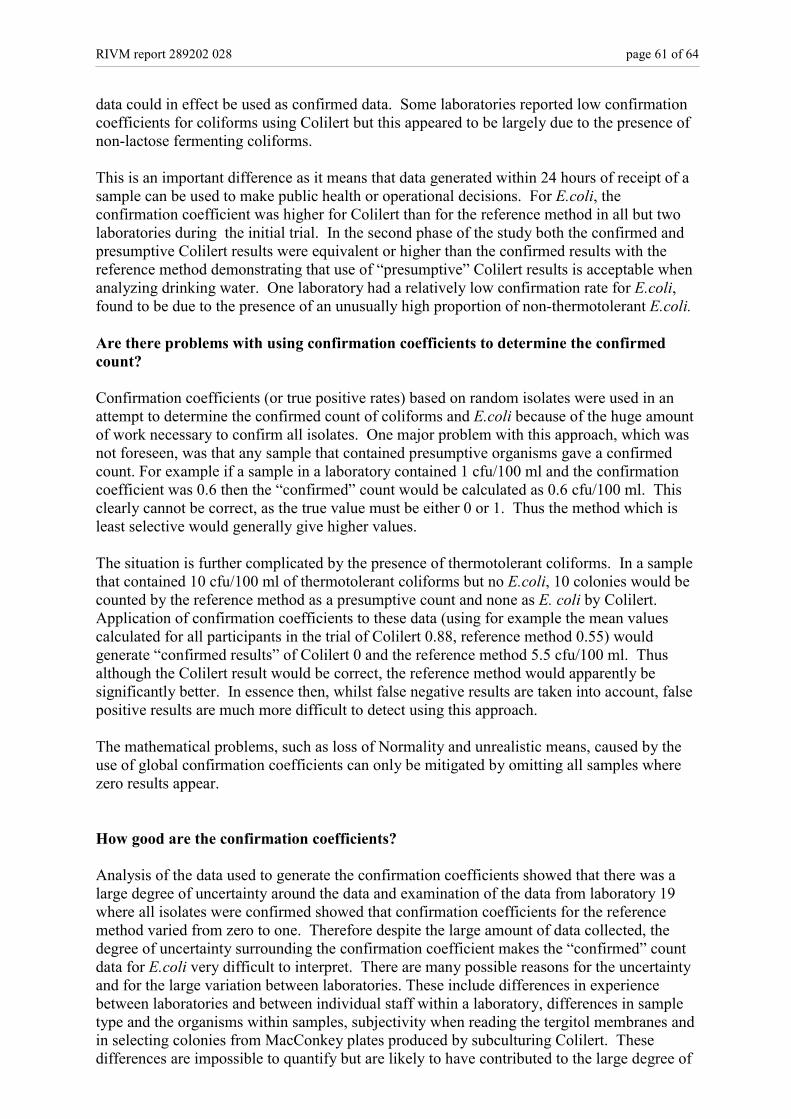
RIVM report 289202 028 page 61 of 64
data could in effect be used as confirmed data. Some laboratories reported low confirmationcoefficients for coliforms using Colilert but this appeared to be largely due to the presence ofnon-lactose fermenting coliforms.
This is an important difference as it means that data generated within 24 hours of receipt of asample can be used to make public health or operational decisions. For E.coli, theconfirmation coefficient was higher for Colilert than for the reference method in all but twolaboratories during the initial trial. In the second phase of the study both the confirmed andpresumptive Colilert results were equivalent or higher than the confirmed results with thereference method demonstrating that use of “presumptive” Colilert results is acceptable whenanalyzing drinking water. One laboratory had a relatively low confirmation rate for E.coli,found to be due to the presence of an unusually high proportion of non-thermotolerant E.coli.
Are there problems with using confirmation coefficients to determine the confirmedcount?
Confirmation coefficients (or true positive rates) based on random isolates were used in anattempt to determine the confirmed count of coliforms and E.coli because of the huge amountof work necessary to confirm all isolates. One major problem with this approach, which wasnot foreseen, was that any sample that contained presumptive organisms gave a confirmedcount. For example if a sample in a laboratory contained 1 cfu/100 ml and the confirmationcoefficient was 0.6 then the “confirmed” count would be calculated as 0.6 cfu/100 ml. Thisclearly cannot be correct, as the true value must be either 0 or 1. Thus the method which isleast selective would generally give higher values.
The situation is further complicated by the presence of thermotolerant coliforms. In a samplethat contained 10 cfu/100 ml of thermotolerant coliforms but no E.coli, 10 colonies would becounted by the reference method as a presumptive count and none as E. coli by Colilert.Application of confirmation coefficients to these data (using for example the mean valuescalculated for all participants in the trial of Colilert 0.88, reference method 0.55) wouldgenerate “confirmed results” of Colilert 0 and the reference method 5.5 cfu/100 ml. Thusalthough the Colilert result would be correct, the reference method would apparently besignificantly better. In essence then, whilst false negative results are taken into account, falsepositive results are much more difficult to detect using this approach.
The mathematical problems, such as loss of Normality and unrealistic means, caused by theuse of global confirmation coefficients can only be mitigated by omitting all samples wherezero results appear.
How good are the confirmation coefficients?
Analysis of the data used to generate the confirmation coefficients showed that there was alarge degree of uncertainty around the data and examination of the data from laboratory 19where all isolates were confirmed showed that confirmation coefficients for the referencemethod varied from zero to one. Therefore despite the large amount of data collected, thedegree of uncertainty surrounding the confirmation coefficient makes the “confirmed” countdata for E.coli very difficult to interpret. There are many possible reasons for the uncertaintyand for the large variation between laboratories. These include differences in experiencebetween laboratories and between individual staff within a laboratory, differences in sampletype and the organisms within samples, subjectivity when reading the tergitol membranes andin selecting colonies from MacConkey plates produced by subculturing Colilert. Thesedifferences are impossible to quantify but are likely to have contributed to the large degree of

page 62 of 64 RIVM report 289202 028
uncertainty. Such differences can only be eliminated by confirming all colonies and by usingthe same personnel to perform the work in each laboratory.
How do the data generated using confirmation coefficients compare with thosegenerated using actual confirmation?
In laboratory 19, 676 data sets were collected for E.coli, where all colonies were confirmed.Of these samples, 239 had presumptive E.coli on the reference medium that subsequently didnot confirm. Thus by confirming all colonies 239 samples were shown to give false positivepresumptive counts. Had the procedure of using a confirmation coefficient been used then allof these samples would then have had a positive value. The effect of this would have beendramatic. In laboratory 19, Colilert was found to be significantly better than the referencemethod for both coliforms and E.coli, if the confirmation coefficient concept was used, thenthe reference method would have appeared to have been significantly better than Colilert forE.coli which would have been incorrect.
Data from Stage Two
Due to the difficulty in interpreting the data from the E.coli part of the initial trial, thedifferences seen in the data generated in laboratory 19 using “true positive rates”, andconfirmation of all isolates, stage two consisted of five laboratories performing a comparisonfor E.coli only and confirming all isolates. This data showed that in two laboratories Colilertwas significantly better than the ISO reference method, in two laboratories there was nosignificant difference and in one laboratory there was insufficient data to draw conclusions.However, in all laboratories, Colilert had a significantly higher confirmation rate and overall,when all data were combined Colilert recovered significantly more E.coli than did thereference method.
A major problem encountered when attempting to compare two methods is the definitionsused for coliforms and E.coli. In this study, the definition of coliforms for the purposes of theISO reference method is that the organisms should be able to ferment lactose. Colilert doesnot contain lactose but detects coliforms on the basis of their ability to cleave ONPG usingthe enzyme �-D-galactosidase. Similarly Colilert detects E.coli on the basis of possession ofthe enzyme �-D-glucuronidase whereas the reference methods relies on the ability of E.colito grow at 44oC and ferment lactose and produce indole from tryptophan. Thus the twomethods will undoubtedly be different.
Many organisms will be detected by both methods but only one or the other of the methodswill detect a subset. For example glucuronidase negative E.coli will not be detected byColilert but may be detected by the reference method. However, lactose negative E.coli willnot be detected by the reference method but may be detected by Colilert. In this study, thecriteria used for confirmation were those incorporated into the reference method which willresult in a proportion of coliforms and E.coli that was detected by Colilert being recorded as“false positives” despite the fact that they were indeed the target organisms.
It is clear from the two separate stages of work that the key to successful methods comparisonis not necessarily the absolute number of total samples tested, but the confirmation of allisolates. Use of this approach enables an accurate assessment of the sensitivity andspecificity of both methods.
RIVM report 289202 028 page 63 of 64
Conclusions
From this study several important conclusions can be drawn:
1. When comparing two methods, in order to generate statistically significant data, the keyis not necessarily to test a huge number of samples, but to confirm as many isolates aspossible. Confirmation of all presumptive positive organisms is the preferred option.
2. There is no need to utilize large numbers of laboratories for inter-laboratory studies. Inthe second stage of the trial statistically significant data was generated using fivelaboratories.
3. Single laboratory validations however are not recommended, as there are often significantdifferences between the results generated in different laboratories. This may be due todifference in sample types or some other differences within the laboratory.
4. It is suggested that future comparative studies should utilize five laboratories in differentgeographical locations. The study design should incorporate a variety of water types (e.g.chlorinated and unchlorinated) and that all isolates should be confirmed. Thisrecommendation will be incorporated into the ISO document describing the basis forcomparison of methods.
5. Colilert gave significantly higher recoveries of both coliforms and E.coli than did the ISOreference method even when the ISO reference procedure definitions were used forconfirmation.
6. Confirmation rates for Colilert, when all isolates were confirmed were significantlyhigher than those for the reference method and in many cases approached 100%.
7. The confirmation rate is dependent on the criteria used for defining the target organism.During this study, Colilert isolated many coliforms which did not “confirm” because thecriteria used included fermentation of lactose. Many coliforms are unable to fermentlactose in 48 hours. Similarly, some strains of E.coli were isolated by Colilert, which didnot subsequently confirm because they were unable to grow at 44 °C, did not fermentlactose or failed to produce indole from tryptophan. Despite this the confirmation rate forColilert was still higher.
8. Based on the results of this study, Colilert can be recommended as being at least as goodas the ISO reference method for the detection of E.coli and coliforms and can be usedwithout the need for confirmations.
References
Fricker, E.J., Illingworth, K and Fricker, C.R. (1997). Use of two formulations of Colilert andQuanti-Tray for assessment of the bacteriological quality of water. Water Research 31,2495-2499.
ISO 1995. Guide to the expression of uncertainty in measurement. First edition, corrected andreprinted in 1995. International Organization for Standardization, Geneva
ISO 2000, Water quality – Criteria for the establishment of equivalence betweenmicrobiological methods. ISO/TC 147/SC 4/WG 12 N34, ISO WD 17994.
page 64 of 64 RIVM report 289202 028
Appendix 9 Mailing list
1 DGM, Directeur Drinkwater, Water, Landbouw, Drs. J.A. Suurland2 Hoofdinspecteur IMH, Mr. G.J.R. Wolters3 Plaatsvervangend Directeur-Generaal Milieubeheer, Dr. ir. B.C.J. Zoeteman4 Ir. W. Cramer, DGM/DWL5 Ir. B. Haring, DGM/DWL6 F. Wetsteyn, DGM/IMH-ZW7 M. Oversluizen, DGM/IMH-NW8 Dr. L.M.R. Blazer, IDEXX Laboratories9 D. Bosboom, Stichting Waterleidinglaboratorium Zuid, Breda10 L. Cornelissens, Laboratorium NV DELTA Nutsbedrijven, Terneuzen11 M. Dijkhuijsen, NV Duinwaterbedrijf Zuid-Holland, Voorburg12 M. Frijmut, Watermaatschappij Zuid-Holland Oost, Gouda13 C. Hoogendorp, NV Waterbedrijf Europoort, Rotterdam14 A. Krom, Gemeentewaterleidingen Amsterdam, Amsterdam15 C. van der List, NV Waterwinningbedrijf Brabantse Biesbosch, Werkendam16 J. Tangelder, NV WLO, Onderzoek en Advies, Doetinchem17 H. Veenendaal, Kiwa Onderzoek en Advies, Nieuwegein18 S. in 't Veld, Waterleiding Maatschappij Overijssel NV, Zwolle19 E. Winkel, NV Waterleidingbedrijf Midden-Nederland, Utrecht20 G. Wübbels, Milieulaboratorium de Punt, Glimmen21 Depot Nederlandse Publikaties en Nederlandse Bibliografie, Den Haag22 Directie RIVM23 Prof. Dr. ir. D. Kromhout, Directeur Sector 224 Dr. ir. A.M. Henken, Hoofd MGB25 Dr. ir. A.H. Havelaar, Plaatsvervangend Hoofd MGB26 Dr. ir. E.J.T.M. Leenen, projectleider Watermicrobiologie27 Ir. J.F.M. Versteegh, LWD28 Dr. N.J.D. Nagelkerke, IMA29-34 Auteur(s)35-38 Kiwa Onderzoek en Advies, Nieuwegein40-44 Provinciaal Waterleidingbedrijf Noord-Holland, Haarlem45 SBD/Voorlichting & Public Relations I.46 Bureau Rapportenregistratie47 Bibliotheek RIVM48-57 Bureau Rapportenbeheer58-70 Reserve exemplaren