research for rijksinstituut voor volksgezondheid en milieu ... · rijksinstituut voor...
TRANSCRIPT

research forman and environment
RIJKSINSTITUUT VOOR VOLKSGEZONDHEID EN MILIEUNATIONAL INSTITUTE OF PUBLIC HEALTH AND THE ENVIRONMENT
RIVM report 711701021
Evaluation and revision of the CSOILparameter setProposed parameter set for human exposure modellingand deriving Intervention Values for the first series ofcompoundsP.F. Otte, J.P.A. Lijzen, J.G. Otte, F.A. Swartjesand C.W. Versluijs.
March 2001
This investigation has been performed by account of The Ministry of Housing SpatialPlanning and the Environment, Directorate General for the Environment (DGM), Directorateof Soil, Water and Rural Areas, within the framework of RIVM project 711701, Risks inrelation to Soil Quality.
RIVM, P.O. Box 1, 3720 BA Bilthoven, telephone: 31 - 30 - 274 91 11; fax: 31 - 30 - 274 29 71

page 2 of 125 RIVM report 711701021
RIVM report 711701021 page 3 of 125
Abstract
Intervention Values are generic soil quality standards used to classify historicallycontaminated soils, sediments and groundwater (i.e. before 1987) as seriously contaminatedin the framework of the Dutch Soil Protection Act. In 1994 Intervention Values werepublished for 70 (groups of) compounds. Intervention values are based on potential risks forboth human health and ecosystems. Human toxicological Serious Risk Concentrations forsoil, sediment and groundwater (SRChuman) are determined using the human exposure modelCSOIL.
This report presents an evaluation and revision of the CSOIL parameter set as part of thetechnical evaluation of the Intervention Values. The evaluation of the CSOIL parameter setcomprises the physicochemical data of all compounds for the first series, as well as the soil,site and exposure parameters. The evaluation results in a revised CSOIL data set with animproved underpinning and traceability of the data set. Another improvement concerns therevision of the soil-water partition coefficients. The report also provides insight into theimpact of the revised data set on the SRChuman and resulted in a better insight into theuncertainties and variation of the model input parameters.

page 4 of 125 RIVM report 711701021
Preface
The Intervention Values for Soil/Sediment and Groundwater contamination were published in1994 as part of the Dutch Soil Protection Act (VROM, 1994). To provide an up-to-datescientific basis for these values, the Directorate General of Environment commissioned theproject ‘Technical Evaluation of Intervention Values for soil contamination’ to the NationalInstitute of Public Health and the Environment (RIVM).
All the elements of this project are contained in several subprojects for revising human-toxicological and ecotoxicological risk limits for soil, sediment and groundwater. Human-toxicological risk limits for soil are derived with the human exposure model CSOIL, theparameter set of which has been evaluated and revised here. Other reports on the technicalevaluation of Intervention Values are:• Ecotoxicological Serious Risk Concentrations for soil, sediment and (ground)water:
updated proposals for first series of compounds (RIVM report 711701020; Verbruggen etal., 2001).
• Evaluation of the most relevant model concepts for human exposure; proposals forupdating the most relevant exposure routes of CSOIL (RIVM report 711701022; Rikkenet al., 2001).
• Risk assessment of historical soil contamination with cyanides, origin, potential humanexposure and evaluation of Intervention Values (RIVM report 711701019; Köster, 2001);
• Proposal for revised Intervention Values for petroleum hydrocarbons on base of fractionsof petroleum hydrocarbons (RIVM report 711701015; Franken et al., 1999).
• Re-evaluation of human-toxicological Maximum Permissible Risk levels (RIVM report711701025; Baars et al., 2001).
• Accumulation of metal in plants as a function of soil type (RIVM report 711701024;Versluijs and Otte, in prep.).
• Revision of the Intervention Value for lead; evaluation of the Intervention Values derivedfor Soil/Sediment and Groundwater (RIVM report 711701013; Lijzen et al., 1999).
The integration of the results obtained in the subprojects mentioned and the derivation of theproposed risk levels are reported in:• Technical evaluation of the Intervention Values for Soil/Sediment and Groundwater.
Human and ecotoxicological risk assessment and derivation of risk limits for soil, aquaticsediment and groundwater (RIVM report 711701023; Lijzen et al., 2001).
We owe gratitude to the ‘Expert group on human-toxicological risk assessment’ for theinformation, advice and remarks on this report. Experts include J. Vegter, TCB; T.Crommentuijn, DGM-BWL; J.A. van Zorge, DGM-SAS; C.J.M. van de Bogaard, DGM-IMH; T. Fast; D.H.J. van de Weerdt, GGD Regio IJssel-Vecht; R. van Doorn, GGDRotterdam; J. Dolfing, Alterra; P.W. van Vliet, Gezondheidsraad; C. van de Guchte, RIZA; J.Wezenbeek, Grontmij; A. Boshoven, IWACO b.v.; W. Veerkamp, VNO/NCW-BMRO; Th.Vermeire, RIVM-CSR; and J. Lijzen, RIVM-LBG. We are also grateful to the ‘Expert groupon ecotoxicological risk assessment’: J. Van Wensem, TCB; D. Sijm and T. Traas, RIVM-CSR; J. Appelman, CTB; T. Brock, Alterra; S. Dogger, Gezondheidsraad; J.H. Faber,Alterra; K.H. den Haan, VNO/NCW-BMRO; M. Koene, Stichting Natuur en Milieu; A.Peijnenburg, RIKZ; E. Sneller, RIZA; W.J.M. van Tilborg, VNO/NCW-BMRO.

RIVM report 711701021 page 5 of 125
Contents
Samenvatting 8
Summary 11
1 Introduction 13
1.1. Scope and objectives 13
1.2. CSOIL human exposure model 15
1.3. Starting points for the evaluation and selection of input parameter values 15
1.4. Reading guide 16
2 Selection of parameters to be evaluated 17
2.1. Physicochemical parameters – compound-specific 172.1.1. Molecular weight (M) 182.1.2. Solubility (S) 182.1.3. Vapour pressure (Vp) 192.1.4. Henry’s law constant (H) 192.1.5. Acid dissociation constant (Ka) 192.1.6. Octanol-water partition coefficient (Kow ) 212.1.7. Organic carbon normalised soil-water partition coefficient (Koc) 212.1.8. Bioconcentration factor for crops (BCF) 222.1.9. Soil-water partition coefficient for metals (Kp) 242.1.10.Permeation coefficient (Pe) 252.1.11.Dermal sorption factor (Daw) 252.1.12.Relative absorption factor (fa) 252.1.13.Summary 26
2.2. Site and exposure parameters 272.2.1. Introduction 272.2.2. Importance of exposure routes 272.2.3. Selected parameters 28
3 Retrieval and selection of compound-specific input parameters 29
3.1. Introduction 29
3.2. Retrieved M, S, Vp, H, Ka and Kow data 313.2.1. M, S, Vp, H and Ka data 313.2.2. Octanol – water partition coefficient (Kow) 35
3.3. Organic carbon normalised soil-water partition coefficients (Koc) 383.3.1. Koc for non-dissociating compounds 383.3.2. Koc for dissociating compounds 42
3.4. Bioconcentration factor metals 44
3.5. Kp metals for soil 483.5.1. Introduction 483.5.2. Kp values based on measured data 493.5.3. Kp values based on sorption models 503.5.4. Selection of Kp values 53
3.6. Permeation coefficient (Pe) 55

page 6 of 125 RIVM report 711701021
4 The evaluation and revision of soil, site and exposure parameters 56
4.1 Current CSOIL data. 56
4.2 Soil parameters 574.2.1 Soil characteristics within the CSOIL model 574.2.2 Pore, pore water, and pore air fraction. 584.2.3 Dry bulk density of the standard soil 584.2.4 Organic matter content 584.2.5 Clay content 594.2.6 pH (KCl) 594.2.7 Résumé 60
4.3 Site parameters 634.3.1 The flux of the evaporating water (Ev) 634.3.2 Mean depth of the contamination (dp) 634.3.3 Height of the crawl space (Bh) 644.3.4 Air exchange rate of the crawl space (Vv) 654.3.5 Contribution of the crawlspace air to indoor air (fbi) 654.3.6 Parameters for the description of the convective flow 654.3.7 Parameters for the description of soil resuspension 66
4.4 Crop consumption 664.4.1 Average consumption pattern 664.4.2 Average consumption (Qfvk, Qfvb) 674.4.3 Fraction dry weight of vegetables and potatoes (fdws, fdwr) 694.4.4 Fraction contaminated crops (Fvk, Fvb) 694.4.5 Deposition constant 72
4.5 Soil ingestion: daily intake of soil (AID) 724.5.1 Introduction 724.5.2 Soil ingestion by children 724.5.3 Soil ingestion by adults and older children 754.5.4 Soil ingestion data used in other countries 764.5.5 Discussion and conclusion 76
4.6 Input parameters on the dermal exposure to soil route 77
5 Discussion and recommendations 79
5.1. Physicochemical parameters 795.1.1. Introduction 795.1.2. Molecular weight, solubility, vapour pressure, Henry’s law constant and acid dissociation
constant 795.1.3. Octanol-water partition coefficient (Kow) 815.1.4. Organic carbon normalised soil−water partition coefficients (Koc) 825.1.5. Bioconcentration factor for metal accumulation in crops 835.1.6. Kp for metals 845.1.7. The overall effect of the revision of physicochemical data on calculated human exposure 855.1.8. Comparison with other data used for risk assessment 87
5.2. The soil, site and exposure parameters 89
5.3. Recommendations 91

RIVM report 711701021 page 7 of 125
References 93
Mailing List 98
Appendix 1: Current CSOIL-1995 input parameter set 100
Appendix 2: Evaluation of databases and selection of physicochemical parameter values. 104
1. Database analysis 104
2. Selection of retrieved values 105
3. Temperature correction of vapour pressure (Vp) and solubility (S) 106
4. Determination of geometric means and the spread of values 107
5. Results of the database analysis 107
6. Conclusion and recommendation 108
Appendix 3: A guideline for the selection of the soil-water partition coefficients for organic compounds110
Appendix 4: Crop specific data on metal accumulation. 113
Appendix 5: Bioconcentration factors for barium, chromium, cobalt and molybdenum 116
Appendix 6: Comparison of revised and INS physicochemical data 119
Appendix 7: Revised CSOIL 2000 dataset 121
page 8 of 125 RIVM report 711701021
SamenvattingIn het kader van de Wet Bodembescherming zijn in 1994 de Interventiewaardenbodemsanering voor de eerste tranche van circa 70 stoffen en stofgroepen vastgesteld.Interventiewaarden zijn generieke risicogrenzen voor de bodem/sediment- engrondwaterkwaliteit, en zijn gebaseerd op het potentiële risico voor de mens en voorecosystemen. Ze worden gebruikt om bodem-, sediment- of grondwaterverontreiniging teclassificeren als ‘ernstig verontreinigd’.Het Directoraat-Generaal Milieubeheer heeft het RIVM opdracht gegeven voor eentechnisch-wetenschappelijke evaluatie van deze Interventiewaarden op basis van recente(toxiciteit)data en nieuwe inzichten in risicobeoordeling. De uiteindelijke doelstelling is hetdoen van voorstellen voor nieuwe risicogrenswaarden.Het project ‘Technische Evaluatie Interventiewaarden bodemsanering’ bestaat uitverschillende deelstudies die elk een aspect van de evaluatie en herziening omvatten. Eén vande deelaspecten is de afleiding van potentiële humaan-toxicologische risicogrenzen voorbodem en grondwater (SRChumaan). De afleiding gebeurt met het blootstellingsmodel CSOIL,dat uitgaat van het blootstellingscenario ‘wonen met tuin’. Dit rapport beschrijft de evaluatieen herziening van zowel de bodem-, lokatie- en blootstellingsparameters van ditblootstellingsmodel als de parameters die de stofeigenschappen beschrijven. De evaluatie vanhet humaan-toxicologisch Maximum Toelaatbaar Risico (MPRhumaan) is gerapporteerd doorBaars et al. (2001). De CSOIL parameterset wordt ten dele gebruikt voor de afleiding vanpotentiële humaan-toxicologische risicogrenzen voor sediment met het model SEDISOIL envoor de afleiding van eco-toxicologische risicogrenzen(SRCeco).
De berekening van de humane blootstelling aan verontreinigde bodem gebeurt op basis vaneen vastgelegd modelconcept en blootstellingscenario. Het gedrag van verontreinigingen, deblootgestelde mens en het scenario worden beschreven met behulp van een groot aantalparameters. Op basis van verschillende analyses en berekeningen zijn de meest relevantemodelparameters geïdentificeerd.Met betrekking tot de fysisch-chemische parameters zijn dit voor metalen de bodem-plantbioconcentratie factor (BCF) en de partitiecoeffcient bodem-water (Kp). Met betrekking totorganische contaminanten zijn belangrijke fysisch-chemische parameters departitiecoëfficiënt voor octanol-water (Kow) en de partitiecoefficient organisch koolstof-water (Koc). Voor een aantal stoffen kunnen tevens de wateroplosbaarheid (S) en dedampdruk (Vp) van belang zijn. Daarnaast zijn op basis van een onzekerheids- engevoeligheidsanalyse een aantal bodem-, locatie- en blootstellingparameters als belangrijkvoor de evaluatie aangemerkt.
Voor alle relevante fysisch-chemische parameters zijn nieuwe aanvullende data gezocht. Dedata betreffende oplosbaarheid en dampdruk zijn voor de als standaard gedefinieerdebodemtemperatuur (283 K) gecorrigeerd. Voor de octanol-water partitiecoëfficiënt (Kow)zijn, na een beoordeling van de data, de LOGPSTAR waarden uit de Medchem (1996)database geselecteerd. In tegenstelling tot de huidige Koc data van 1995, zijn de herziene Kocwaarden gebaseerd op experimentele waarden. De vaststelling van generiekebioconcentratiefactoren (BCF) voor metaalopname door moestuingewassen is voor eenbelangrijk deel gebaseerd op de resultaten van het project ‘Accumulatie van metalen ingroentegewassen’ (Versluijs en Otte, in voorbereiding). De Kp waarden voor deverschillende metalen zijn geselecteerd na de evaluatie van enkele veel gebruikte datasets.Zowel voor de BCF als de Kp voor metalen is nagegaan in hoeverre bodemeigenschappen

RIVM report 711701021 page 9 of 125
zoals het percentage lutum en organisch koolstof en de pH de waarden beïnvloeden. Om deonderbouwing voor de afleiding van zogenaamde somwaarden te verbeteren is de CSOILstoffenset uitgebreid met meer PAK’s, PCB’s, chloorbenzenen, chloorfenolen, ftalaten enoliefracties (Total Petroleum Hydrocarbons).Voor de bodemparameters zijn nieuwe waarden vastgesteld voor de fractie porielucht en debulkdichtheid en andere waarden voor het organisch stof gehalte, lutum en pH ter overweginggegeven. Met betrekking tot de route inhalatie van binnenlucht zijn enkele locatieparametersgewijzigd en enkele toegevoegd ten gevolge van conceptuele aanpassingen. Verder is eenaantal parameters gewijzigd met betrekking tot de blootstelling via de consumptie vangroentegewassen uit eigen tuin (consumptiehoeveelheid) en met betrekking tot de routeingestie van grond (inname hoeveelheid).
De verschillen tussen de huidige fysisch-chemische dataset uit 1995 en de herziene datasetzijn geanalyseerd, waarbij bovendien het effect van de herziening op de afleiding van dehumane risicogrenzen in beeld is gebracht. Hieruit blijkt dat met name de herziening van departitiecoëfficiënt voor organisch koolstof-water (Koc) bijdraagt tot een veranderdeblootstelling en daarmee tot een andere SRChumaan voor bodem.Met de herziening van de locatie- en blootstellingparameters, zoals opgenomen in CSOILvoor het standaard scenario ‘wonen met tuin’ is de CSOIL dataset geactualiseerd en beteronderbouwd. Het effect van de herziening van deze groep parameters is voor de meestestoffen minder groot dan het effect van de herziening van de fysisch-chemische data.Het gezamenlijk effect van de herziening van de verschillende aspecten betreffende deafleiding van het humaan risico (humaan-toxicologische risicogrenswaarden, modelconcepten modelparameters) wordt beschouwd in de rapportage van Lijzen et al. (2001).
De evaluatie en herziening van de CSOIL parameterset hebben geleid tot een beteronderbouwde, beter herleidbare en geactualiseerde dataset. Voor enkele stoffen bestaat nogsubstantiële onzekerheid betreffende de fysisch-chemische data ten behoeve van de potentiëlerisicobeoordeling. Het betreft hier met name vinylchloride (Vp en H), aldrin en dieldrin(beide Koc). Overwogen moet worden om aanvullend onderzoek of metingen te verrichten.Het onderzoek heeft geleid tot een beter inzicht in de spreiding en onzekerheden van deverschillende parameters. Deze spreiding is vaak inherent aan het karakter van de parameter(de ‘natuurlijke’ en ‘ruimtelijke’ spreiding).Op basis van de herziene dataset dient te worden overwogen om in de toekomst deblootstelling van de mens uit te drukken in een kansverdeling. Hiermee kan het effect van deonzekerheid van verschillende fysisch-chemische-, locatie- en blootstellingsparameters op deblootstelling op een goede manier in beeld worden gebracht. Bovendien kan een indrukworden verkregen over het risico dat wordt gelopen wanneer de humaan toxicologischetoelaatbare blootstelling wordt over- of onderschreden.De herziene dataset wordt ten dele ook gebruikt voor de afleiding van ecotoxicologischerisicogrenzen voor de afleiding van humaan-toxicologische risicogrenzen voor sediment methet model SEDISOIL. Een verdere harmonisatie met gerelateerde activiteiten is wenselijkhoewel verschillen in doelstellingen, vertrekpunten en selectiecriteria een mogelijk obstakelkunnen zijn.

page 10 of 125 RIVM report 711701021

RIVM report 711701021 page 11 of 125
SummaryIn 1994 the Intervention Values for soil contamination were published for the first series ofabout 70 (groups of) compounds in the framework of the Dutch Soil Protection Act.Intervention Values, based on the potential risk for both human and ecotoxicological risk, aregeneric soil quality standards used to classify historical soil contamination as ‘seriouslycontaminated’. The Intervention Values for all compounds of the first series were evaluatedin line with the most recent views on risk assessment and (toxicological) data to yieldproposals for new risk limit values.The project on ‘Technical Evaluation of Intervention Values’ consists of separate studies,each dealing with one aspect of evaluation and revision of Intervention Values.One of these is the derivation of human-toxicological serious risk concentrations (SRChuman)for soil, sediment and groundwater. For the derivation of SRChuman this means the calculationof the ‘lifetime average exposure’ of the ‘average individual’ in a ‘standard situation’. Toderive the SRChuman, the CSOIL exposure model is used with a defined exposure scenariocalled ‘residential with garden’.
This study was set up to evaluate and revise the model parameter set of the exposure model,CSOIL, while the evaluation and revision of the human-toxicological Maximum PermissibleRisk levels (MPR) is described in Baars et al. (2001). The CSOIL parameter set is in part alsoused for the derivation of SRChuman for sediments with the exposure model SEDISOIL andfor the derivation of ecotoxicological risk limits (SRCeco).
The calculation of human toxicological potential exposure to contaminated soil is based onseveral starting points like realistic case risk level and the standard exposure scenario,residential with garden. The behaviour and characteristics of humans, the scenario used andthe contaminants are described with a set of parameters. The most relevant parameters for thecalculation of human exposure to contaminated soil and groundwater are identified on thebasis of model analysis. For organic contaminants important physicochemical parameters arethe partition coefficient octanol-water (Kow) and the partition coefficient organic carbon-water (Koc). For volatile contaminants, the water solubility (S) and vapour pressure (Vp)may also be of importance. For metals, the soil-to-plant bioconcentration factor (BCF) andthe partition coefficients, soil/sediment-water (Kp), are critical. For soil, site and exposureparameters, all the parameters describing the exposure routes, ‘ingestion of soil’, ‘inhalationof indoor air’ and ‘consumption of home-grown crops’ were evaluated.
New data are selected for all physicochemical parameters. Solubility (S) and vapour pressure(Vp) data are corrected for default soil temperature (283 K). After assessment of the retrieveddata for partition coefficients octanol-water (Kow), it was agreed to use the LOGPSTAR dataselected from the Medchem database (1996). The selected Koc data is based mainly onexperimental data, in contrast with the current Koc data set. The selection of generic soil toplant bioconcentration factors (BCF) is based on the results of a RIVM study on‘Accumulation of metals by vegetables and potatoes’ (Versluijs and Otte, in prep.). Therevised Kp values for metals are selected after an evaluation of some frequently used sets.The relationship with standard soil characteristics (pH, clay and organic carbon) is consideredfor both BCF and Kp metals. To strenghten the basis for the derivation of so-called sumvalues, the physicochemical data set is extended with data for more PAH and PCB congeners,
page 12 of 125 RIVM report 711701021
phthalates, chlorobenzenes, chlorophenols and Total Petroleum Hydrocarbon (TPH)fractions.Revised values are determined for pore air and dry bulk density. Other values for organiccarbon and lutum content and pH are selected for consideration.New parameters for the exposure routes ‘inhalation of indoor air’, ‘consumption of home-grown crops’ (consumption amounts) and ‘ingestion of soil’ (ingestion amounts) areintroduced and revised.
The differences between current and revised data sets are analysed and a picture is givenabout the impact of the revised data set on the SRChuman. Here especially the revision of theKoc contributes to changes of SRChuman levels. With the evaluation and revision of the soil,site and exposure parameters the CSOIL data set is actualised, transparent and well founded.The effects of the revised soil, site and exposure parameters on the derived SRChuman levelsare less important compared with the effects caused by the revised physicochemical data. Thecombined effects of all revisions (CSOIL input parameter set, model concepts and MPRs) onthe derived SRChuman levels are considered in the report of Lijzen et al. (2001).
The evaluation and revision of the CSOIL parameter set resulted in a well-founded, state-of-the-art data set.For vinylchloride uncertainty still remained about the selected values for vapour pressure andHenry’s law constant. Because both parameters are critical for the derived SRChuman, anadditional study was recommended. This also applies to the Kow and Koc values selected foraldrin and dieldrin.The study has resulted in better insight into the uncertainties and variation of the model inputparameters. The variation is often inherent to the character of the parameter (the ‘nature’ andspatial variation).
On the basis of this information it is recommended in the future to deal quantitatively withuncertainties and to express the human exposure in a distribution of probability.This allows the demonstration of the combined effects of all the uncertainties of the differentparameters on the calculated exposure. Moreover it is possible to get an impression about therisk at exposure levels above or below the maximum permissible intake.The revised data is also used (in part) for the derivation of ecotoxicological risk levels(SRCeco). A further harmonisation with other related activities is desirable although it isrealised that differences in objectives, starting points and selection criteria constitute apossible obstacle.

RIVM report 711701021 page 13 of 125
1 Introduction
1.1. Scope and objectivesThe project ‘Technical Evaluation of Intervention Values’ targeted the overall evaluation ofthe Intervention Values for soil contamination belonging to the first series of compounds. Thefirst series of Intervention Values for contaminated soil, sediment and groundwater wasestablished in 1994 (VROM, 1994). For an overview of the methods used see Swartjes(1999). Since the publication of the Intervention Values, the policy towards contaminatedsoil, groundwater and sediments has been changed (BEVER, 1999; VROM, 1999). Usefulresponses on specific (groups of) compounds came from the group of users of theIntervention Values, e.g. the competent authorities (municipalities of large cities, provinces,the district Water Boards and Department of Public Works) and consultancy firms. Inaddition, new scientific views, more data, exposure models or calculation methods couldhave become available in this time period. To integrate this new information in theIntervention Value, a technical evaluation of the Intervention Values was considerednecessary. Besides, the wish of the Dutch Lower House is to evaluate these risk-basedstandards about once every five years. The main purpose of the technical evaluation is toderive risk limits (as a basis for Intervention Values) according to the most recent views onthe exposure assessment to soil contaminants, by means of evaluating the exposure models,underlying input data, and human-toxicological and ecotoxicological data.
The other activities within the project ‘Technical Evaluation of Intervention Values for soilcontamination’ are mentioned in the preface of this report. The integration of the results andthe derivation of the proposed risk levels are reported in Lijzen et al. (2001).
Figure 1.1 shows the derivation of human-toxicological serious risk concentrations(SRChuman) for soils and groundwater, as carried out by the CSOIL human exposure model.The model calculates the human exposure to contaminated soil via various routes according adefined concept and with the use of approximately 100 input parameters. The concept (Figure1.3) of the CSOIL model has been assessed and evaluated in the report ‘Evaluation of themost relevant model concepts for human exposure’ (Rikken et al., 2001). The exposure of humans to contaminated sediments and the derivation of SRChuman forsediments were carried out with the SEDISOIL exposure model (Figure 1.2). This model usesa part of the CSOIL input data set, which accounts for a limited number of physicochemicaldata used for the derivation of ecotoxicological serious risk concentrations (SRCeco, Table2.1). The SEDISOIL model, developed in 1996, (Bockting et al.) was recently evaluated byRIVM and RIZA (Otte et al., 2000). Where appropriate, attention will be given in the reportbefore you to points of similarity and noteworthy differences between both models will beindicated.

page 14 of 125 RIVM report 711701021
Figure 1.1: General diagram showing the derivation of the integrated risk limits (IntegratedSerious Risk Concentrations)
The aim of this study is to evaluate the most relevant CSOIL input parameters so as toimprove:• The quality of input data;• The consistency and traceability of the process used for CSOIL input parameter selection;• Insight on the uncertainty.
HC50Hazardous Concentration for:
50% of species50% of microbial processes
human exposurewith SEDISOIL
Human-toxicological MaximumPermissible Risk (MPRhuman)
SRChuman forsediment
SRCeco forsediment
Integrated SRC forsediment
Figure 1.2: Diagram showing the derivation of risk limits (integrated values) for aquaticsediment (SRC= Serious Risk Concentration).
This report provides the background information for the evaluation of all relevant inputparameters used to calculate human exposure to contaminated soil with the CSOIL exposure
HC50Hazardous Concentration for:
50% of species50% of microbial processes
SRCecofor soil
SRChumanfor soil
Integrated SRC forsoil
SRChuman forgroundwater
SRCeco forgroundwater
Integrated SRC forgroundwater
human exposurewith CSOIL
Human-toxicological MaximumPermissible Risk (MPRhuman)
Max.conc. indrinkingwater

RIVM report 711701021 page 15 of 125
model. This evaluation has resulted in a revised parameter set for all compounds of the firstseries of Intervention Values.
1.2. CSOIL human exposure model The CSOIL model concept (Figure 1.3) consists roughly of three parts: first, the descriptionof the behaviour of the compound in the soil and the partitioning over the soil phases; second,the description and parameterisation of the different exposure routes, and finally, thequantification of the lifetime average exposure. On the basis of this concept the inputparameters can be roughly divided into:• compound-specific input parameters; mainly physicochemical properties;• site and soil properties related to potential exposure and• exposure parameters which describe the receptor characteristics and behaviour.
SOIL AIRconcentration
representativeSOIL CONTENT
PORE WATERconcentration
distributionover
soil fractions
transfer-processes
directexposure
indirectexposure
transport toSURFACE SOIL
transport toGROUNDWATER
uptake by /deposition on
VEGETATION
dilution inINDOOR and
OUTDOOR AIR
transport toDRINKING WATER
permeation intoDRINKING WATER
ingestion, inhalation,dermal uptake
SOIL
inhalation,dermal uptake
AIR
intake DRINKING WATER,dermal contact, inhalation
SHOWERING
consumption ofVEGETATION
Figure 1.3: Diagram showing the exposure routes of CSOIL.
1.3. Starting points for the evaluation and selection of inputparameter values
The uncertainty of the derived risk limits and the underlying political decisions orassumptions are discussed in the integration report (Lijzen et al., 2001). The potential risk isdirectional for the derivation of Intervention Values. Referring to the derivation of SRChumanlevels, this will mean calculating the ‘lifetime average exposure’ of the ‘average individual’in a ‘standard situation’ and determine, among other factors, the proposals for adjusting thecurrent CSOIL data set.

page 16 of 125 RIVM report 711701021
The standard exposure scenario called ‘residential with garden’ describes the ‘standardsituation’. The scenario is the starting point for the risk assessment and is not discussed. Aconsequence of the formulated starting points will be the selection of average parametervalues. This prevents the accumulation of conservative values, which can lead to anoverestimation of the human exposure. However, for the selection of certain parameter valuesother criteria or considerations may also be valuable. The discrimination between theuncertainty of a parameter caused by measurement errors and its intrinsic variability might beimportant. In other cases, selecting a conservative value in favour of the average value mightbe preferable. These and similar considerations will be discussed in this report.
The most important sources of uncertainty on the compound-specific input parameters aretabulated in Table 1.1. Vissenberg and Swartjes (1996) investigated the uncertainty of soil,site and exposure parameters.
Table 1.1 Most important sources of uncertainty for different parametersInput parameter Uncertainty source Approach
MSVpKowH
Measurement error Consensus on the method used for data selection.In principle, the geometric mean is selected asinput parameter value
Koc Measurement errorSite-specific natureConcentration effects
Consensus on the method used for selection andpreconditions
Kp metals Measurement errorSite-specific natureConcentration effects
Average values obtained by Multiple LinearRegression of field data or the geometric mean ofselected field dataConsensus on preconditions
BCF metalaccumulation forplants
Measurement errorsSoil typeCrop-specificClimateMatrix effectsConcentration effects
Average values obtained by Multiple LinearRegression of field data or the geometric mean ofselected field dataConsensus on preconditions
1.4. Reading guideChapter 2 discusses the CSOIL model performance and the determination of the mostrelevant input parameters, with Chapter 3 describing the selection of compound-specific inputparameter values, method used and the revised parameter set. The evaluation and revision ofnon-compound-specific parameter values (e.g. exposure parameters, and site and soilproperties) are described in Chapter 4. Chapter 5 recapitulates the revised data set, which hereis also compared with the present CSOIL input parameter set. Significant differences areexplained.

RIVM report 711701021 page 17 of 125
2 Selection of parameters to be evaluatedThe input parameter set comprises approximately a hundred parameters, partially compound-specific. Hence, in evaluating the input parameter set it is necessary to put emphasis on theparameter(s) having an important effect on the resulting SRChuman. Van den Berg (1995)reported the existing CSOIL input parameter set. This chapter overviews the current inputparameter values and gives a broad outline of how the input parameters influence thecalculation of human exposure. Based on these findings the most relevant parameters areselected for evaluation.
The criterion used to identify the most relevant parameters is the effect of the input parametervalue on the calculated human exposure (model sensitivity). In addition the parametersrelevant for the determination of the Intervention Values for groundwater will be evaluated.
The results and conclusions from the sensitivity and uncertainty analysis by Vissenberg andSwartjes (1996) and two reports of Van den Berg (1995; 1997) are used to evaluate thepresent CSOIL data set. The sensitivity and uncertainty analysis of Vissenberg and Swartjes(1996) considers the most relevant exposure, site and soil parameters. Compound-specificparameters were left out of the analysis. For the priority assessment of the compound-specificparameters, carrying out a sensitivity and uncertainty analysis prior to the evaluation wasconsidered. However, due to the following this analysis was considered impracticable.1. Parallel with the evaluation of the CSOIL input parameter set, the evaluation of the
CSOIL concepts was started. The findings from the sensitivity and uncertainty analysiswith the current CSOIL model concept will be of limited value for the improvedCSOIL model concept.
2. The program language of the current CSOIL model hampers the execution ofuncertainty and sensitivity analysis with the available Monte-Carlo computer programs.
3. Information about the uncertainty of the current 1995 CSOIL parameter values waspoor.
Section 2.1 focuses on the compound-specific parameters and section 2.2 on the exposure,site and soil parameters.
2.1. Physicochemical parameters – compound-specific The current physicochemical- and compound-specific properties used for the determinationof SRChuman levels for soil are given in Table 2.1. The physicochemical properties, which arealso used for the determination of SRChuman levels for sediments and groundwater and forSRCeco risk levels, are indicated.

page 18 of 125 RIVM report 711701021
Table 2.1: Physicochemical- and compound-specific input parametersPhysicochemical properties SRCeco,
soil
SRCeco,
sediment
SRChuman,
soil
SRChuman,
groundwater
SRChuman,
sediment 1)
Molecular weight (M) used usedSolubility (S) used usedVapour pressure (Vp) usedHenry’s law constant (H) usedAcid dissociation constant (pKa) used usedOctanol-water coefficient (Kow) used usedOrganic carbon normalised soil-water partitioncoefficient (Koc)
used used used used used
Bio Concentration Factor vegetables for metals(BCF)
used
Bio Concentration Factor fish for metals (BCF) 2) usedSoil-water partition coefficient (Kp metals) 2) used used used used usedPermeation coefficient (Pe) usedRelative oral absorption factor for soil (Fag) used used
1) For a description of the derivation of human risk limits for sediments and the used exposure modelSEDISOIL see the report of Otte et al. (2000a).
2) The selection of the BCF fish for metals and the Kp metals for sediments are described in the report ofOtte et al. (2000a)
The relative absorption factor (fa) will be discussed in general, as this parameter is notsubject of this study.
2.1.1. Molecular weight (M)The calculated human exposure is influenced by the molecular weight of the compound. Forseven compounds Van den Berg (1997) reported input errors.
2.1.2. Solubility (S)Solubility was evaluated for organic compounds, not for inorganic chemicalsThe calculation of the exposure to metals from contaminated soils is based on the total soilconcentration of the element. The chemical form in which the metal is present andconsequently the solubility is not considered.For those compounds that belong to the group inorganic compounds (cyanides, thiocyanates,bromide, chloride and fluoride) it is considered that the total compound is present in the waterphase of the soil. For cyanides a specific evaluation was executed and reported by Köster(2001).
Regarding organic compounds, the CSOIL model concept uses solubility for the calculationof the Henry’s law constant (H). In particular the exposure via inhalation of air is directlyinfluenced by the solubility.The current solubility values, as selected by Van den Berg (1995), are mainly based onVerschueren and Kolkhuis Tanke (1989) and on values extracted from the ASTER database.Moreover solubility values were taken from RIVM Integrated Criteria Documents forhexaclorocyclohexanes, chlorobenzenes, polycyclic aromatic hydrocarbons, chlorophenolesand phthalates (Van den Berg, 1997).
Solubility has significant effect on the exposure to contaminated soil via inhalation. There isno direct effect on the exposure via crop consumption as the concentration in the pore water
RIVM report 711701021 page 19 of 125
is determined by the partition coefficient. Only in case of pore water concentrationsexceeding the solubility an effect may be found.It is concluded that the value of the solubility is significant for the exposure via inhalation ofair and, for compounds with low solubility, the exposure via crop consumption.
2.1.3. Vapour pressure (Vp)The vapour pressure of a solid or liquid substance is the pressure exerted by its vapour underequilibrium conditions at a given temperature.The current vapour pressure values, as used for the calculations of the exposure of the firstseries of compounds, are based on the same references as mentioned for solubility (section2.1.2). Vapour pressure influences directly the partitioning of the compound over the threesoil phases as the vapour pressure is used for the calculation of the Henry’s law constant(section 2.1.4).The value of the vapour pressure is substantially influenced by temperature. It is uncertain(for compounds of the first series) if all data on vapour pressure were corrected for soiltemperature (10 oC).Vapour pressure influences directly the SRChuman for volatile compounds (when exposure viainhalation is the dominant route). The vapour pressure value is found critical for the exposureroutes inhalation indoor and inhalation outdoors.
2.1.4. Henry’s law constant (H)The dimensionless Henry’s law constant (or the air-water partition coefficient) is theproportionality constant between the vapour pressure of a solute above an aqueous solutionand the concentration in solution. Henry’s law constant is in particular important for the morevolatile compounds. Moreover Henry’s law constant is used in the CSOIL model to calculatethe exposure to compounds during showering. This exposure route however, is foundnegligible for all compounds of the first series.
According the current CSOIL concept, the Henry’s law constant (H) is calculated from thevapour pressure and the solubility by:
H = Vp / (S*R*T)
H: Henry’s Law constant (-)Vp: vapour pressure (Pa)S: water solubility (mol.m-3 )R: gas constant (8.3144 Pa . m3 mol-1. K-1 )T: soil temperature (K)
As the calculation of the Henry constant from vapour pressure and solubility is maintained, aspecific evaluation of this parameter is not appropriate.
2.1.5. Acid dissociation constant (Ka)The acid dissociation constant (Ka) expresses the capacity of an organic compound todissociate. As the pH changes the tendency to dissociate is influenced (Figure 2.1)The non-dissociated fraction is calculated from the pKa.

page 20 of 125 RIVM report 711701021
fnd = 1 / ( 1 + 10 [ pH - pKa ] )
fnd: non-dissociated (neutral) fraction (-)pKa: dissociation coeffcient (pKa = -log Ka)pH: soil pH (-log[H+] )
Negatively charged compounds are more mobile compared with their neutral parent. Thecurrent CSOIL model assumes that the dissociated form not sorbs to organic matter andtotally present in the pore water phase (dissolved). Thus, for the calculation of the Kp value,the current CSOIL concept considers only the non-dissociated or neutral form. The Kp fordissociating compounds (e.g. chlorophenols) is calculated as follows:
Kp = Koc * foc * fnd
Kp: partition coefficient (dm3/kg)Koc: organic carbon normalised partition coefficient (dm3/kg)foc: fraction organic carbon (-)fnd: non dissociated (neutral) fraction (-)
The formularies show that the Kp of dissociating organic contaminants depends on theselected pKa and the soil characteristics (pH and organic matter).
Dissociating organic compoundspKa = 5
0%
20%
40%
60%
80%
100%
3.5 4.5 5.5 6.5 7.5 8.5pH
pres
ence
of n
eutra
l and
di
ssoc
iate
d fra
ctio
n
neutraldissociated
Figure 2.1: Presence of neutral and dissociated form at different pH for an organiccompound with a pKa of 5.
Considering the effect of dissociation on the Kp value, the evaluation of pKa values fordissociating compounds is important.

RIVM report 711701021 page 21 of 125
2.1.6. Octanol-water partition coefficient (Kow )The octanol-water partition coefficient expresses the hydrophobic character of a compound.The Kow is the unitless ratio of the concentration in the n-octanol phase to the concentrationin the water phase.The current Kow values for compounds of the first series Intervention Values were based onliterature data of merely measured values. References were not always mentioned (Van denBerg, 1997). Because the lack of data on Kow values for some compounds, for sixteencompounds the Kow values were calculated from the solubility using the relation betweenKow, and water solubility (according to Verschueren en Kolkhuis Tanke (1989) en Van denBerg (1997):
Kow = 10 4.75 * S –0.67
Kow: octanol-water partition coefficient (-)S: water solubility (mg/dm3)
Although the relation between calculated Kow and measured Kow was demonstrated by Vanden Berg (1997), occasionally differences up till one log unit or more can be found.
The Kow is a key input parameter for the calculation of the human exposure from organiccompounds according the current concept of CSOIL. The current concept implies that theorganic matter normalised soil-water partition coefficient (Koc) and the bioconcentrationfactors (BCF) for the accumulation of compounds in crops are based on Kow values. Thusthe Kow determines the human exposure via two important routes i.e. crop consumption andindoor air inhalation. The exposure from dermal uptake during bathing is directly controlledby the Kow value. This route however contributes not more than 5 % to total exposure.If measured Koc values are used, the effect on the model output (human exposure) for Kowwill become less. Only exposure via consumption of home-grown crops and via dermaluptake during bathing remains Kow dependent.Because of the use of the Kow value for the calculation of BCF and possibly the Koc(measured) Kow values are searched and evaluated for all compounds.
2.1.7. Organic carbon normalised soil-water partition coefficient(Koc)
The soil water partition coefficient (Kp) determines the distribution of a compound over thesoil and water phases. Generally it is defined as the ratio between the content of a compoundadsorbed at the solid phase and its equilibrium pore water concentration.The Kp can be calculated from the Koc under the assumption that organic carbon is the majorsorption phase:
Kp = Koc * foc
Kp: partition coefficient (dm3/kg)Koc: organic carbon normalised soil-water partition coefficient (dm3/kg)foc: fraction organic carbon (-)
For most organic compounds an accurate estimate (e.g. an experimental value) of the Koc isnot available. In the literature often Koc values generated with quantitative linear models, in

page 22 of 125 RIVM report 711701021
particular Kow-Koc relationships, are published. However, such relationships should be usedwith caution (Bockting et al., 1993).According to the current CSOIL concept all the Koc values are calculated from the Kowusing the equation of Karickhoff (Koc = 0.411 * Kow; Karickhoff, 1981).The exposure routes influenced by the Koc value are the inhalation of indoor and outdoor air,the consumption of crop, and the less important routes via drinking water and showering andbathing.
2.1.8. Bioconcentration factor for crops (BCF)The tendency for accumulation of compounds by crops is expressed by the bioconcentrationfactor (BCF). The BCF for metals is based on field or laboratory experiments, while the BCFfor organic compounds is calculated from the octanol-water partition coefficient (Kow).
MetalsThe BCF for metals is defined as the ratio of the metal content in crops (mg/kg dry weight)and soil (mg/kg dry weight). The CSOIL model uses different bioconcentration factors forroot and leaf vegetables. The current BCFs are based on Bockting and Van den Berg (1992).The BCF, as used in the CSOIL model, are considered non-crop-specific or generic based onavailable bioconcentration factors from different crops (preferably vegetables and potatoes).In case no experimental data were available the BCF was calculated from the formula of Baeset al. (1984) giving the correlation between the BCF value and the soil-water partitioncoefficient (Kp):
ln BCF = 2.67 - 1.12 * ln Kp
BCF: bioconcentration factor (mg.kg -1 dry weight / mg.kg -1 dry weight)Kp: partition coefficient (dm3/kg)
Most BCF values currently used were based on data collected from field experiments.Bockting and Van den Berg stressed that the selected BCF values represent at best indicativevalues because of various reasons (Bockting et al., 1992 and Versluijs et al., in prep.):• BCFs for cadmium, zinc, nickel, lead, chromium and copper are based on one data set
only.• BCFs are partly based on pot experiments. Application to field grown crops is limited.• BCFs are based on a few different vegetables.• Average vegetable consumption pattern is not taken into consideration (except for
potatoes).• For some metals the BCFs are based on vegetables or crops not frequently grown in home
gardens.• The BCFs have not been normalised on the basis of the standard soil (pH, clay and
organic matter)• The influence of total metal soil content on BCF values has not been considered• For some metals the BCF is estimated based on other crops or metals• Selection criteria are not always clear
Table 2.2 shows the current BCF values for root and leaf crops with the estimated BCF rangebetween brackets. The second column shows the contribution (in %) via consumption ofhome-grown vegetables to the total exposure.

RIVM report 711701021 page 23 of 125
Table 2.2: BCF values for metals (Bockting and Van den Berg, 1992)compound relative
contributionBCF roots
(mg/kg dw)/(mg/kg)BCF leafs
(mg/kg dw)/(mg/kg)(%)
Arsenic 51 0.015 (estimated from BCF leaf) 0.03 (0.001-0.1)Barium 68 0.005 (estimated from BCF leaf) 0.1 (< 0.1-<0.1)Cadmium 95 0.15 (0.01-0.75) 0.7 (0.34-1.34)Chromium (III) 32 0.002 (0.001-0.004) 0.02 (0.017-0.017)Chromium (VI) 32Cobalt 51 0.015 (estimated from BCF leaf) 0.03 (0.01-0.05)Copper 83 0.1 (0.032-0.30) 0.1 (0.08-0.22)Mercury 51 0.015 (estimated) 0.03 (0.001-0.04)Lead 39 0.001 (0.0001-0.006) 0.03 (0.012-0.044)Molybdenum 86 0.015 (estimated from BCF leaf) 0.3 (0.01-1)Nickel 80 0.07 (0.011-0.678) 0.1 (estimated from BCF root)Zinc 91 0.1 (0.02-0.61) 0.4 (0.26-0.65)
The exposure to metals via consumption of home-grown vegetables contributes significantlyto the total exposure. Evaluation of the underlying data showed that the BCF-leaf is based onmetal accumulation of vegetables while the BCF-root is based on metal accumulation ofpotatoes only.The CSOIL equation for the calculation of the metal concentration in the crop is:
For leafy crops:Cpl, leaf = BCF leaf * Cs + Cdp
For root crops:Cpl, root = BCF root * Cs
Cpl: concentration in the plant, the leaf or root (mg/kg dry weight).BCF bioconcentration factor (mg.kg -1 dry weight / mg.kg -1 dry weight).Cs: total soil content (mg/kg dry weight).Cdp: contribution due to metal deposition from soil particles originated from
the same location (mg/kg dry weight).
The importance of the exposure path ‘crop consumption’ and the indicated large uncertaintiesin the current CSOIL BCF values gives the evaluation of metal accumulation by vegetablesand potatoes a high priority. This evaluation is carried out in close relation with the project on‘Accumulation in crops’. This project aims to develop a model for the estimation of site-specific accumulation of metals in consumed parts of vegetables and potatoes (Versluijs,1998).

page 24 of 125 RIVM report 711701021
Organic compoundsIn contrast with the BCF for metals, the BCF for organic compounds is on the basis of porewater concentration and based on statistical relations between crop content and octanol-waterpartition coefficient, developed by Briggs et al. (1982, 1983). The relation according Briggsis:
BCFroot = 10 ( 0.77 * log Kow – 1.52 ) + 0.82
BCFlleaf, stem = [10 ( 0.95 * log Kow – 2.05 ) +0.82] * [0.784 * 10 ( -0.434 * (log Kow – 1.78 )^2 / 2.44) ]
BCF: bioconcentration factor (mg/kg fresh weight) / (mg/dm3 )
The BCF value of organic compounds is evaluated within the subproject ‘Evaluation ofconcepts’ (Rikken et al., 2001). In this report no specific evaluation of the BCF for organiccompounds will take place.
2.1.9. Soil-water partition coefficient for metals (Kp)The soil water partition coefficient1 (Kp) describes the partitioning of a compound over thetwo phases. The Kp is defined as:
Kp = Cs / Cpw
Kp: soil-water partition coefficient (dm3/kg)Cs: total metal content (mg/kg)Cpw: metal concentration pore water (mg/dm3 )
The current CSOIL concept calculates the exposure to a metal from the total soilconcentration (e.g. accumulation of metal by plants). This means that the selected Kp doesnot affect the SRChuman levels. The Intervention Value for groundwater however is based onthe calculated pore water concentration (by equilibrium partition) at Intervention Value levelfor soil.The current Kp values are based on a study of Van den Berg en Roels (1991). The selectedKp is the geometric mean of the reported values after which some values were adjusted androunded off. Soil characteristics as clay, organic matter content and pH were not taken intoaccount. However, the selected values were considered applicable for standard soil but in facta possible relation was not determined.Table 2.3 shows the current Kp set and shows the estimated 10 and 90 percentiles.An evaluation of the current Kp values is considered of utmost importance for thedetermination of the Intervention Values for groundwater.
1 The definition of the partition concept depends on the objective and its use. Koops et al. (1998)gives an overview of possible definitions.

RIVM report 711701021 page 25 of 125
Table 2.3: Current CSOIL partition coefficients (Van den Berg and Roels, 1991).metal log Kp Kp
( dm3 / kg)estimated range
10 – 90 percentiles 1)
As 2.99 980 200 – 5400Ba 1.78 60 -Cd 2.28 190 7 – 51000Cr 4.16 14400 2) 20000 – 170000Co 2.09 120 70 – 270Cu 2.73 540 30 – 22000Hg 3.46 3300 1200 – 89000Pb 3.38 2380 280 – 260000Mo 1.30 20 2) 26 – 90Ni 2.75 560 40 – 300000Zn 2.40 250 20 – 45000
1) A precise determination of the percentiles is not feasible because of the small set of underlying data2) The selected Kp values for chromium and molybdenum are outside the 10 and 90 percentiles of the
used data set for unknown reason.
2.1.10. Permeation coefficient (Pe)The permeation coefficient (expressed in m2 per day) is a measure of the affinity fortransport of a compound through a membrane. It is used to calculate the concentration of soilcontaminants in drinking water after permeation of the compound through the tube. Thewater tube is specified as a Low-Density Polyethylene (LDPE) tube, as permeation throughthis material is found higher than with other materials.
Current permeation coefficient values are based on reports of Vonk (1985) and Van derHeijden en Hofman (1987). Van den Berg (1997) gives an evaluation and description of theprocedure.
The exposure pathways influenced by permeation coefficient are ‘consumption of drinkingwater’, ‘inhalation during showering and bathing’ and ‘dermal contact during showering andbathing’. These exposure pathways are found of minor importance.An additional evaluation of the permeation coefficient is considered not necessary. Thefindings of Van den Berg (1997) are subscribed and revised values will be implemented.
2.1.11. Dermal sorption factor (Daw)Exposure through dermal uptake during showering is a minor exposure route. The maximumcontribution, in terms of percentage of total exposure, reaches only 4 (naphthalene andchlorobenzenes). The dermal sorption factor is calculated from the Kow. In section 2.1.5 theevaluation of all Kow values was decided, consequently no further considerations arerequired.
2.1.12. Relative absorption factor (fa)The relative absorption factor (fa) is the fraction of a compound in soil (or crops, water, airetc.) absorbed in the body. Vissenberg en Swartjes (1996) identified the relative absorptionfactor as a parameter that contributes substantial to the uncertainty of the exposure. Aseparate project was initiated to evaluate the relative absorption factor (Lijzen et al., 2001).

page 26 of 125 RIVM report 711701021
The current CSOIL concept sets the relative absorption factor to 1.0 for all compounds,except for lead (Lijzen et al., 1999)
2.1.13. SummaryThe current data set is tabulated in Appendix 1: Current CSOIL-1995 input parameter set.Table 2.4 gives an overview of all the physicochemical parameters and the effect on theexposure pathways. The ✔sign indicates a direct effect of the parameter on the exposurethrough the named exposure route. A ✔ sign between brackets indicates an indirect effect(e.g. limitation of the exposure in case of limited solubility).Based on the findings as reported in this section it was decided that:• For metals
- the evaluation of partition coefficients and BCF values do have a high priority.• For organic compounds:
- evaluation of Koc do have a high priority;- evaluation of Kow, S, Vp and pKa (only dissociating compounds) is considered
important;- molecular weight (M) and Permeation coefficient (Pe) will be verified only;- the Henry’ law coefficient (H) and the dermal sorption factor (Daw) are calculated
from other parameters; consequently a further evaluation of data is not necessary.
Table 2.4: Physicochemical parameters and the effect on the different exposure paths.parameter soil air crop drinking
watershowering /
bathingingestion dermal
contactinhala-
tioninhalationair indoor
inhalationair outdoor
consump-tion
consump-tion
inhala-tion
dermalcontact
M (all ) ✔ ✔ ✔ ✔ ✔ ✔ ✔ ✔ ✔
Kp (metals) (✔) ✔
BCF (metals) ✔
S (organiccompounds)
✔ ✔ (✔) (✔)
Vp (organiccompounds)
✔ ✔
H (organiccompounds)
✔
Kow (organiccompounds)
✔ ✔ ✔ ✔ ✔ ✔
Koc (organiccompounds)
✔ ✔ ✔ ✔ ✔ ✔
Ka (organiccompounds)
✔ ✔ ✔
Pe (organiccompounds)
✔ ✔ ✔

RIVM report 711701021 page 27 of 125
2.2. Site and exposure parameters2.2.1. Introduction This section focuses on all site and exposure parameters. The following criteria are used toidentify the most relevant parameters for evaluation:• importance of the exposure route for the total human exposure to compounds;• sensitivity and uncertainty of the input parameters in relation with the distribution of the
calculated human exposure with CSOIL; These criteria can be applied by using the results and conclusions from the sensitivity anduncertainty analysis by Vissenberg en Swartjes (1996) and two reports of Van den Berg(1995 and 1997). Based on the results of these studies the most critical site and exposureparameters for determining the SRChuman are selected. Appendix 1: Current CSOIL-1995 input parameter set, gives an overview of all theparameters values used for the calculation of the SRChuman. It shows which parameters areclassified as exposure and site parameters.
2.2.2. Importance of exposure routes From the CSOIL report (Van den Berg, 1995) the exposure routes can be extracted that havea major contribution to the total human exposure. It depends on the characteristics of thecompound, which of the routes play an important role in the exposure. Three exposure routesare responsible for at least 90% of the total exposure for almost all compounds. Because ofthe high contribution of the exposure to the total exposure the following routes are importantin the evaluation:
• soil ingestion (max 90 %, benzo(ghi)perylene, maneb);• inhalation of air (max. 100%, vinylchloride);• crop consumption (max. 100%, inorganic compounds, e.g. cyanides).
A minor contribution is given by the exposure routes (for some compounds):• dermal uptake via soil contact (max. 7%, benzo(ghi)perylene);• drinking-water intake due to permeation through LDPE (max. 13%, cresol);• dermal uptake during bathing (max. 5%, p-dichlorobenzene, styrene).
A negligible contribution is given by the exposure routes:• inhalation of outdoor air (< 1 %);• inhalation during bathing (max. 1%, monochlorobenzene, p-dichlorobenzene, styrene);• inhalation of soil particles (max. 1%, some PCA, DDT, maneb).
The parameters determining the exposure routes: soil ingestion, inhalation of air and cropconsumption, have a high priority in the evaluation. The parameters related to dermal uptakevia soil contact (>1% for 19 compounds) and drinking-water intake (>1% for 30 compounds)have a lower priority. The relevant parameters for the exposure route dermal uptake duringbathing are excluded from this evaluation. No attention will be given to the parameters on the three exposure routes with a negligiblecontribution.

page 28 of 125 RIVM report 711701021
2.2.3. Selected parameters Table 2.5 shows the selected parameters for the five considered exposure routes. Inhalation of indoor air The parameters relevant for the inhalation of indoor air are related to the composition of thesoil (Va, Vw, foc) and characteristics of the location at the polluted site (Ev, dp, Vv, Bh, fbi). Consumption of contaminated cropsThree parameters relevant for crop consumption are the organic carbon content (foc) and thefraction of the consumed crops (root or leaf) that are contaminated (exposure parameters Fvkand Fvb). Other selected parameters for evaluation and relevant for this major exposure routeare the daily consumption of crops for adult and child (Qfv) and the ratio dry weight-freshweight (fdw) Ingestion of soil For the ingestion of soil the only important parameter is the daily intake of soil by adults andby children (AIDa and AIDc). Other exposure routes Many parameters are important for the calculated exposure by dermal uptake by soil contact.For the uptake of contaminated drinking water because of the permeation of compoundsthrough LDPE water-pipes, two soil parameters are relevant: the organic carbon content (foc)and the mass volume of dry soil (SD).
Table 2.5: CSOIL-parameters contributing to the uncertainty of the calculated humanexposure by that exposure route (Vissenberg and Swartjes, 1996) Parameter unit Description inhalation of indoor air Va Vw foc Ev dp Vv Bh fbi
m3.m-3
m3.m-3
kg.kg-1
dm3.m-2.d-1
m h-1
m -
volume fraction air volume fraction water fraction organic carbon flux of evaporating water mean depth of the contamination air-exchange rate height of the crawl space contribution of the crawl space air to indoor air (fraction)
crop consumption foc Fv (k,b) Qfv (k,b) fdw (r,s)
kg.kg-1
kg.kg-1
kg fw.d-1
-
fraction organic carbon fraction consumed contaminated root and leaf crops average consumption of children and adults fraction dry weight vegetables and potatoes
soil ingestion AID (a,c)
mg.d-1
daily intake of soil by children and adults
dermal uptake by soil contact fm frs (i,o) Aexp DAE Tba (i, o) DAR
- - m2
g.m-2
h h-1
matrix factor, fraction soil in dust indoor/outdoor exposed surface area adult indoor/outdoor degree of coverage indoor/outdoor (adults and children) time fraction exposure indoor/outdoor absorption velocity
uptake by polluted drinking water foc SD
kg/kg kg.dm-3
fraction organic carbon mass volume of dry soil (kg dry soil. dm-3 humid soil)

RIVM report 711701021 page 29 of 125
3 Retrieval and selection of compound-specificinput parameters
3.1. IntroductionThis section discusses briefly the approach to retrieve compound-specific parameter valuesand the selection of the parameter value used for the calculation of human exposure (theCSOIL value).Data searches were focussed on the most critical parameters as mentioned in chapter 2. It wasdecided to minimise the work by using chemical databases for data collection (M, S, Vp, Ka,Kow and Koc). To prevent much time being spent on searches, an evaluation of 12 databaseswas carried out. Based on the evaluation the most promising databases were selected.Moreover the method for the temperature correction of vapour pressure and solubility wasdefined and the determination of the selected CSOIL parameter value was laid down. Adetailed description of the evaluation and approach is given in Appendix 2: Evaluation ofdatabases and selection of physicochemical parameter values. For a number of organiccompounds, it was experienced that the retrieved data for Koc, originated from the selecteddatabases, resulted in a poor data set. To improve the data set and to select a recognised valuethe selection of Koc values was carried out according a guideline which was determined inco-operation with other ‘Koc users’ (Appendix 3: A guideline for the selection of the soil-water partition coefficients for organic compounds.
Below, for each (group of) parameters a summary of the used method is given.• M, S, Vp, pKa and Kow:First, the current CSOIL documentation on physicochemical parameter values was reviewed.Second, new data was collected from the selected databases (Table 3.1) and added. After datacollection a further selection was made on the basis of completeness of the acquired data.Incomplete data (e.g. missing temperatures) were not considered. To compare the remainingdata all variables were converted to the same units. Vapour pressure and solubility data werecorrected for soil temperature (10 °C). In some cases evident outliers were removed afterwhich the geometric mean (M, S, Vp) or average value (pKa and log Kow) was determined.• Koc:The selection of organic-carbon normalised soil-water partition coefficients (Koc) wascarried out according to the Koc guideline (Appendix 3: A guideline for the selection of thesoil-water partition coefficients for organic compounds). Data on soil-water partitioncoefficients reported by Bockting et al. (1993) and Van den Berg (1997) and data taken fromthe databases searched were taken. For some compounds other sources were considered. Aderived Koc value (from the Kow) according to Sabljić et al. (1995) was added to thecollection. In principle the final Koc value will be the geometric mean2 of all experimental(measured) Koc’s and one derived Koc according Sabljić. Note that a surplus value isassigned to the experimental Koc’s by combining ALL experimental Koc’s with ONE derivedKoc.• BCF metals:The collection of data used to derive bioconcentration factors for metal accumulation inplants (Versluijs et al., in prep.) was part of the subproject ‘metal accumulation in plants’, inwhich soil-plant relations for metal accumulation were derived. These soil-plant relationships
2 In case the Koc values are expressed as log, a normal average is calculated.

page 30 of 125 RIVM report 711701021
were used as the basis for the derivation of BCF values suitable for potential risk assessment.The derivation of BCF values, considerations and applicability is discussed in section 3.4.• Kp metals:The evaluation of the current Kp data set was based, for example, on the work of Koops at al.(1998) and Otte et al. (2000b). Criteria were formulated for the selection of Kp valuessuitable for the derivation of Intervention Values for groundwater and for the estimation ofthe risk of dispersion. Four data sets were assessed from which Kp values were derived.• Permeation Coefficient:The determination of permeation coefficients was not considered as a priority given thelimited effect of the exposure route involved. The assessment was based on the evaluation ofVan den Berg (1997).
Table 3.1 gives the databases searched and reviews used. An asterix (*) indicates the maindatabases used. Other databases were used only in the case of additional demands.
Table 3.1 Databases searched and (review) articles used for standard data searches. Anasterix (*) indicates the main databases used.
Name of databaseMerck databaseChemiekaartenMerck Safety Data Sheet
∗ International Chemical Safety Cards∗ Beilstein∗ Hazardous Substance Database
OhmstadsCheminfoCESARS: Chemical Evaluation Search and Retrieval SystemPesticide manual 11 ed.
∗ Medchem∗ ASTER
EpiwinReview articles and reports
∗ Van den Berg, R. (1997), Verantwoording van gegevens en procedures voor de eerste trancheinterventiewaarden. RIVM report no. 715810012, RIVM, Bilthoven
∗ Bockting et al. (1993), Soil-Water partition coëfficiënts for organic compounds. RIVM reportno. 679101013, RIVM, Bilthoven
Mackay database, CD-ROM (1999)
Sabljić, A. et al. (1995), Qsar modelling of soil sorption. Improvement and systematics of logKoc vs. log Kow correlations. Chemosphere 31: 11-12; 4489-4514.

RIVM report 711701021 page 31 of 125
3.2. Retrieved M, S, Vp, H, Ka and Kow data3.2.1. M, S, Vp, H and Ka dataThe verification of all molecular weights indicated that adjustments would be necessary forseven compounds (Table 3.2). Moreover, given the reliability of molecular weight data it wasproposed to express the molecular weight values to one decimal point accuracy.
Table 3.2: Adjustments for molecular weight valuesCompounds current value geomean number of
Van den Berg (1995) g/mol referencesEthylbenzene 102 106.2 3Toluene 90 92.1 4m-Xylene 102 106.2 3Naphthalene 130 128.2 3Endrin 393 380.9 4Heptane 98 100.2 2Octane 110 114.2 3
For most compounds the revised solubility and vapour pressure is based on more referencesthan the current CSOIL (1995) values. Table 3.3 gives the current (Van den Berg, 1995) andthe revised data for solubility, vapour pressure and Henry’s Law constant. The number ofreferences from which the revised data was determined is also given.
The Henry’s law constant is calculated from solubility, molecular weight and vapour pressure(see section 2.1.4). The calculation of the Henry’s law constant is also used for the evaluationof substances (EUSES, 1997), for deriving environmental risks limits in the Netherlands (J.de Bruijn et al., 1999), and for the evaluation of the environmental aspects of pesticides(Mensink, 1995). It was considered to use measured Henry’s law constants. However,because measured H constants are often not available it was decided to maintain the currentCSOIL concept for the determination of Henry’s law constant.Van de Berg (1997) reported input errors for several compounds (e.g. 2,3,4-trichlorophenol,pyridine, carbaryl, carbofuran, tetrahydrofuran and tetrahydrothiophene). Table 3.3 gives thecorrected data. The compounds marked with an asterix (*) were added at the end of theevaluation process. For these compounds only part of the evaluation process was completed.Six PAH congeners were added to the PAH group because the MPR values were determinedfor 17 PAH congeners. The non-ortho substituted (planar) PCBs were added because the riskof PCB-contaminated soil is particularly dependent on the presence of these planar isomers.Data are based on the report of Van Wezel et al. (1999) on the derivation of MaximumPermissible Concentrations for polychlorinated biphenyls. More phthalates were added incoherence with the selected phthalates for deriving SRCeco values (Verbruggen, 2000), andthus the basis for the determination of the Intervention Value for total phthalates could bestrengthened.
The selected pKa values are given in Table 3.4. The role of the pKa values estimating theKoc is described in section 2.1.5.

page 32 of 125 RIVM report 711701021
Table 3.3: Solubility, vapour pressure and Henry’s law constant for all evaluated organiccompounds. Both current data (Van den Berg, 1995) and revised data are givenCompound S
(mg/dm3)S(mg/dm3)
number ofrefs.
Vp (Pa) Vp (Pa) number ofrefs.
H (-) H (-)
vdBerg 95 vdBerg 95 vdBerg 95Aromatic compoundsBenzene 1.78E+03 1.99E+03 17 1.01E+04 9.51E+03 3 1.88E-01 1.59E-01Ethylbenzene 1.52E+02 1.59E+02 15 9.33E+02 9.53E+02 3 2.77E-01 2.70E-01Phenol 8.20E+04 6.56E+04 7 2.67E+01 3.29E+01 4 1.30E-05 2.00E-05p-Cresol 2.40E+04 2.86E+04 3 5.33E+00 1.88E+01 3 - 3.02E-05o-Cresol - 1.49E+04 3 - 2.35E+01 3 - 7.26E-05m-Cresol - 6.32E+03 3 5.33E+00 1.14E+01 3 - 8.25E-05Toluene 5.15E+02 6.11E+02 11 2.94E+03 2.96E+03 3 2.23E-01 1.90E-01o-Xylene - 2.19E+02 6 - 6.76E+02 4 - 1.39E-01p-Xylene - 2.11E+02 9 - 8.60E+02 3 - 1.84E-01m-Xylene 1.80E+02 1.97E+02 7 8.01E+02 8.05E+02 3 2.00E-01 1.84E-01Catechol 4.51E+05 1.24E+05 3 1.33E+02 3.39E+00 3 1.38E-05 1.28E-06Resorcinol 8.40E+05 2.42E+05 3 1.33E+02 8.03E-01 3 7.40E-06 1.55E-07Hydroquinone 5.90E+04 3.92E+04 13 1.34E+02 3.86E-02 7 1.06E-04 4.61E-08Styrene 3.00E+02 3.20E+02 13 6.67E+02 5.25E+02 11 9.83E-02 7.27E-02PAH 1)
Naphthalene 3.00E+01 3.18E+01 6 2.27E+00 6.83E+00 5 4.11E-03 1.17E-02Anthracene 7.50E-02 7.13E-02 7 1.30E-04 8.43E-04 3 1.31E-04 8.95E-04Phenanthrene 1.60E+00 8.50E-01 11 2.41E-03 1.51E-02 3 1.14E-04 1.35E-03Fluoranthene 2.65E-01 2.01E-01 4 2.31E-04 3.80E-03 4 7.48E-05 1.63E-03Benzo(a)anthracene 1.00E-02 1.16E-02 6 5.51E-06 2.07E-07 3 5.34E-05 1.73E-06Chrysene 1.50E-03 1.79E-03 7 2.60E-07 8.74E-08 3 1.68E-05 4.73E-06Benzo(a)pyrene 3.00E-04 8.42E-04 4 1.31E-08 1.25E-07 3 4.68E-06 1.60E-05Benzo(ghi)perylene 2.60E-04 1.86E-04 4 2.60E-09 5.04E-09 3 1.17E-06 3.18E-06Benzo(k)fluoranthene 6.00E-04 4.84E-04 3 2.60E-09 1.24E-08 3 4.64E-07 2.76E-06Indeno, 1,2,3-cd pyrene 1.00E-04 2.65E-04 3 2.60E-09 2.65E-09 2 3.05E-06 1.17E-06Pyrene *) - 1.06E-01 6 - 9.20E-05 4 - 7.49E-05Acenaphthene *) - 2.57E+00 1 - 4.22E-01 1 - 1.08E-02Benzo(b)fluoranthene *) - 1.68E-02 1 - 1.82E-06 1 - 1.16E-05Benzo(j)fluoranthene *) - 8.81E-03 1 - 1.82E-06 1 - 2.21E-05Dibenz(a,h)anthracene *) - 8.28E-04 1 - 2.67E-07 1 - 3.81E-059H-Fluorene *) - 1.32E+00 1 - 1.16E-01 1 - 6.19E-03Acenaphthylene *) - 4.01E+00 2 - 1.79E-01 2 - 2.89E-02Chlorinated hydrocarbons1,2-Dichloroethane 8.69E+03 1.02E+04 3 8.14E+03 7.39E+03 4 3.94E-02 3.05E-02Dichloromethane 2.00E+04 1.80E+04 4 4.66E+04 4.30E+04 5 8.42E-02 8.61E-02Tetrachloromethane 8.00E+02 9.38E+02 5 1.20E+04 9.49E+03 5 9.82E-01 6.61E-01Tetrachloroethene 1.50E+02 1.19E+02 3 1.87E+03 1.57E+03 4 8.78E-01 9.29E-01Trichloromethane(chloroform) 8.00E+03 9.39E+03 4 2.14E+04 2.01E+04 5 1.36E-01 1.09E-01Trichloroethene 1.10E+03 1.16E+03 3 8.01E+03 5.81E+03 5 4.07E-01 2.78E-01Vinylchloride 1.10E+03 4.28E+02 11 3.55E+05 2.98E+05 17 8.57E+00 1.85E+01Monochlorobenzene 5.00E+02 5.07E+02 3 1.17E+03 1.19E+03 6 1.12E-01 1.13E-011,2-Dichlorobenzene - 1.40E+02 6 - 1.30E+02 5 - 5.80E-021,3-Dichlorobenzene - 1.13E+02 5 - 1.49E+02 3 - 8.28E-021,4-Dichlorobenzene 4.90E+01 6.05E+01 5 8.00E+01 9.06E+01 4 1.02E-01 9.35E-021,2,3-Trichlorobenzene - 1.36E+01 4 - 2.47E+01 3 - 1.40E-011,2,4-Trichlorobenzene 1.90E+01 2.88E+01 6 1.87E+01 4.07E+01 3 7.59E-02 1.09E-011,3,5-Trichlorobenzene - 4.71E+00 2 - 2.80E+02 2 - 4.58E+001,2,3,4-Tetrachlorobenzene 3.50E+00 3.40E+00 3 5.34E-01 6.78E-01 3 1.40E-02 1.83E-021,2,3,5-Tetrachlorobenzene - 2.61E+00 3 - 1.29E+00 3 - 4.53E-021,2,4,5-Tetrachlorobenzene - 6.82E-01 3 - 4.00E+00 3 - 5.37E-01Pentachlorobenzene 2.40E-01 3.23E-01 8 1.33E-01 4.52E-01 4 5.90E-02 1.49E-01Hexachlorobenzene 1.10E-01 1.17E-02 4 1.33E-03 6.13E-04 3 1.60E-03 6.36E-032-Chlorophenol 2.85E+04 8.71E+03 3 1.07E+02 2.25E+02 3 2.05E-04 1.41E-033-Chlorophenol - 7.97E+03 3 - 1.93E+01 3 - 1.33E-04

RIVM report 711701021 page 33 of 125
Compound S(mg/dm3)
S(mg/dm3)
number ofrefs.
Vp (Pa) Vp (Pa) number ofrefs.
H (-) H (-)
vdBerg 95 vdBerg 95 vdBerg 954-Chlorophenol - 7.67E+03 3 - 1.13E+01 3 - 8.03E-052,3-Dichlorophenol - 9.05E+02 2 - 1.27E+01 3 - 9.76E-042,4-Dichlorophenol 4.60E+03 1.91E+03 4 1.33E+01 4.09E+00 3 2.00E-04 1.48E-042,5-Dichlorophenol - 4.21E+02 3 - 1.04E+01 3 - 1.71E-032,6-Dichlorophenol - 5.34E+02 3 - 7.14E+00 3 - 9.26E-043,4-Dichlorophenol - 3.02E+01 3 - 4.40E-01 2 - 1.01E-033,5-Dichlorophenol - 3.99E+01 3 - 2.46E+00 3 - 4.26E-032,3,4-Trichlorophenol 1.00E+03 7.11E+01 2 1.07E+00 7.93E-01 2 8.96E-05 9.36E-042,3,5-Trichlorophenol - 1.26E+02 - - 2.02E-01 - - 1.35E-042,3,6-Trichlorophenol - 1.26E+02 3 - 2.02E-01 2 - 1.35E-042,4,5-Trichlorophenol 1.00E+03 3.80E+02 4 - 1.00E+00 3 - 2.22E-042,4,6-Trichlorophenol - 2.43E+02 3 - 9.83E-01 3 - 3.40E-043,4,5-Trichlorophenol - 3.46E+01 3 - 2.02E-01 2 - 4.89E-042,3,4,5-Tetrachlorophenol 1.25E+02 3.61E+00 3 1.33E-01 3.94E-02 3 1.05E-04 1.07E-032,3,4,6-Tetrachlorophenol - 1.47E+01 3 - 6.03E-02 3 - 4.05E-042,3,5,6-Tetrachlorophenol - 4.79E+00 3 - 3.94E-02 3 - 8.10E-04Pentachlorophenol 1.40E+01 4.28E+00 10 1.47E-02 8.53E-03 9 1.19E-04 2.26E-041-Chloronaphatalene 2.24E+01 1.68E+01 4 5.25E+00 4.25E+00 6 1.62E-02 1.75E-022-Chloronaphatalene - 9.71E+00 3 - 1.00E+00 4 - 7.14E-03PCB 28 2.25E-01 1.21E-01 20 7.00E-04 1.60E-02 8 3.40E-04 1.44E-02PCB 52 - 2.65E-02 23 - 6.07E-03 19 - 2.85E-02PCB101 - 1.32E-02 3 - 9.27E-03 2 - 9.76E-02PCB118 - 6.54E-03 4 - 2.96E-04 1 - 6.28E-03PCB138 - 6.96E-04 3 - 4.30E-06 2 - 9.48E-04PCB153 1.20E-02 2.74E-03 4 7.00E-04 1.75E-04 12 8.95E-03 9.79E-03PCB180 - 7.69E-04 4 - 4.96E-05 6 - 1.08E-02Dioxins (+PCDF, PCBs 2))1-MCDD 4.20E-01 4.20E-01 1.61E-02 1.61E-02 3.57E-03 3.57E-032-MCDD 2.80E-01 2.80E-01 1.90E-02 1.90E-02 6.32E-03 6.32E-0327-DCDD 3.75E-03 3.75E-03 1.20E-04 1.20E-04 3.44E-03 3.44E-0328-DCDD 1.67E-02 1.67E-02 1.41E-04 1.41E-04 9.08E-04 9.08E-04124-TrCDD 8.41E-03 8.41E-03 1.12E-04 1.12E-04 1.63E-03 1.63E-032,3,7,8-TCDD 3.00E-04 3.00E-04 1.40E-06 1.40E-06 6.39E-04 6.39E-041,3,6,8-TeCDD 3.20E-04 3.20E-04 7.06E-07 7.06E-07 3.02E-04 3.02E-04PCDD 1.20E-04 1.20E-04 8.88E-08 8.88E-08 1.12E-04 1.12E-04HxCDD 4.40E-06 4.40E-06 5.08E-08 5.08E-08 1.92E-03 1.92E-03HpCDD 2.40E-06 2.40E-06 7.51E-10 7.51E-10 5.65E-05 5.65E-05OCDD 4.00E-07 4.00E-07 5.93E-10 5.93E-10 2.90E-04 2.90E-04PCB 77 *) - 1.91E-03 4 - 5.09E-05 2 - 3.30E-03PCB 105 *) - 7.15E-03 2 - 1.55E-04 1 - 3.01E-03PCB 126 *) - 7.00E-03 1 - 1.55E-04 1 - 3.07E-03PCB 156 *) - 1.22E-03 1 - 4.05E-05 1 - 5.09E-03PCB 157 *) - 1.22E-03 1 - 4.05E-05 1 - 5.09E-03PCB 169 *) - 5.58E-04 3 - 1.26E-06 2 - 3.46E-04TetraCDF 4.13E-04 4.13E-04 7.89E-06 7.89E-06 8.12E-06 8.12E-06PentaCDF 2.36E-04 2.36E-04 2.17E-05 2.17E-05 3.91E-05 3.91E-05HexaCDF 8.25E-06 8.25E-06 8.09E-06 8.09E-06 4.17E-04 4.17E-04HeptaCDF 1.35E-06 1.35E-06 1.55E-06 1.55E-06 4.87E-04 4.87E-04OctaCDF 2.15E-07 2.15E-07 2.91E-08 2.91E-08 5.75E-05 5.75E-05PesticidesDDT 3.10E-03 6.48E-03 5 2.53E-05 1.22E-05 4 1.23E-03 2.84E-04DDE 4.00E-02 4.09E-02 3 1.33E-05 4.29E-05 3 4.49E-05 1.42E-04DDD - 6.23E-02 4 - 1.93E-05 3 - 4.22E-05Aldrin 1.00E-02 2.46E-02 3 3.07E-03 2.33E-03 4 4.76E-02 1.47E-02Dieldrin 1.00E-01 2.99E-01 3 2.40E-05 2.94E-05 3 3.89E-05 1.60E-05Endrin 2.00E-02 4.66E-01 3 2.67E-05 1.25E-05 3 2.16E-04 4.33E-06α-HCH 1.63E+00 1.63E+00 3 3.33E-03 3.50E-02 3 2.53E-04 2.65E-03β-HCH 2.40E-01 9.38E-01 9 3.73E-05 1.98E-02 13 1.92E-05 2.61E-03

page 34 of 125 RIVM report 711701021
Compound S(mg/dm3)
S(mg/dm3)
number ofrefs.
Vp (Pa) Vp (Pa) number ofrefs.
H (-) H (-)
vdBerg 95 vdBerg 95 vdBerg 95γ-HCH 7.80E+00 5.81E+00 6 2.13E-02 1.23E-03 5 3.38E-04 2.61E-05δ-HCH 3.14E+01 1.01E+01 3 2.26E-03 3.06E-02 3 8.91E-06 3.75E-04Carbaryl 1.20E+02 8.16E+01 3 6.67E-01 1.43E-01 3 4.75E-04 1.50E-04Carbofuran 5.00E+02 3.76E+02 3 2.70E-03 2.03E-03 3 5.07E-07 5.07E-07Maneb 1.00E-04 8.50E-05 2 1.00E-04 2.08E-06 2 1.13E-01 2.76E-03Atrazine 7.00E+01 3.81E+01 6 4.00E-05 2.70E-05 3 5.23E-08 6.50E-08Mineral oil 3)
aliphatic >EC5-EC6 - 2.80E+01 - - 5.07E+04 - - 6.23E+01aliphatic >EC6-EC8 - 4.20E+00 - - 8.61E+03 - - 8.71E+01aliphatic >EC8-EC10 - 3.25E-01 - - 8.21E+02 - - 1.40E+02aliphatic >EC10-EC12 - 2.61E-02 - - 7.90E+01 - - 2.06E+02aliphatic >EC12-EC16 - 5.90E-04 - - 3.55E+00 - - 5.11E+02aliphatic >EC16-EC21 - 9.99E-07 - - 1.72E-01 - - 1.98E+04aromatic >EC5-EC7 - 2.20E+02 - - 1.11E+04 - - 1.67E+00aromatic >EC7-EC8 - 1.30E+02 - - 3.24E+03 - - 9.77E-01aromatic >EC8-EC10 - 6.50E+01 - - 8.21E+02 - - 6.44E-01aromatic >EC10-EC12 - 2.48E+01 - - 7.90E+01 - - 1.76E-01aromatic >EC12-EC16 - 5.81E+00 - - 3.55E+00 - - 3.90E-02aromatic >EC16-EC21 - 5.43E-01 - - 1.72E-01 - - 2.56E-02aromatic >EC21-EC35 - 6.60E-03 - - 8.00E-04 - - 1.24E-02Other pollutantsCyclohexanone 2.30E+04 1.90E+04 6 5.33E+02 4.90E+02 9 9.65E-04 1.08E-03Dimethyl phthalate (DMP) *) 4) - 2.01E+03 1 - 3.87E+00 1 - 1.58E-04Diethyl phthalate (DEP) *) 4) - 2.87E+02 1 - 6.68E-01 1 - 2.20E-04Dibuthyl phthalate (DBP) *) 4) - 2.35E+00 1 - 3.40E-02 1 - 1.71E-03Diisobutylphthalate (DIBP) *) - 9.60E+00 6 - 1.37E-02 3 - 1.69E-04Butylbenzylphthalate (BBP) 2.90E+00 4.22E+00 3 1.15E-03 6.53E-04 3 5.26E-05 2.06E-05Dihexyl phthalate (DHP) *) 4) - 1.15E-02 1 - 1.61E-03 1 - 1.99E-02Di(2-ethylhexyl)phthalate(DEHP)
2.85E-01 4.57E-02 5 8.60E-04 2.72E-04 4 5.00E-04 9.88E-04
Pyridine 2.33E+05 6.65E+05 3 3.11E+03 2.02E+03 14 4.48E-04 1.02E-04Tetrahydrofuran 2.18E+05 4.06E+05 3 2.21E+04 1.47E+04 3 3.11E-03 1.11E-03Tetrahydrothiophene 1.06E+04 1.29E+04 2 2.41E+03 2.05E+03 2 8.50E-03 5.94E-031) The data on the added PAHs, marked with an asterix (*) represent, with exception of pyrene, values
from EPIWIN.2) The physicochemical parameters of dioxins (belonging to the second series of compounds) were not
evaluated. The data are taken from Van den Berg (1994). The data of the added planar PCBs are basedon Van Wezel et al. (1999). Mono-, di- and trichlorobiphenyls were left out because the MPR does notinclude these congeners.
3) The data on Total Petroleum Hydrocarbons are taken from Franken (1999).4) The data on the added compound are values from EPIWIN and Staples et al. (1997).*) Added compounds (explained in section 3.2.1)
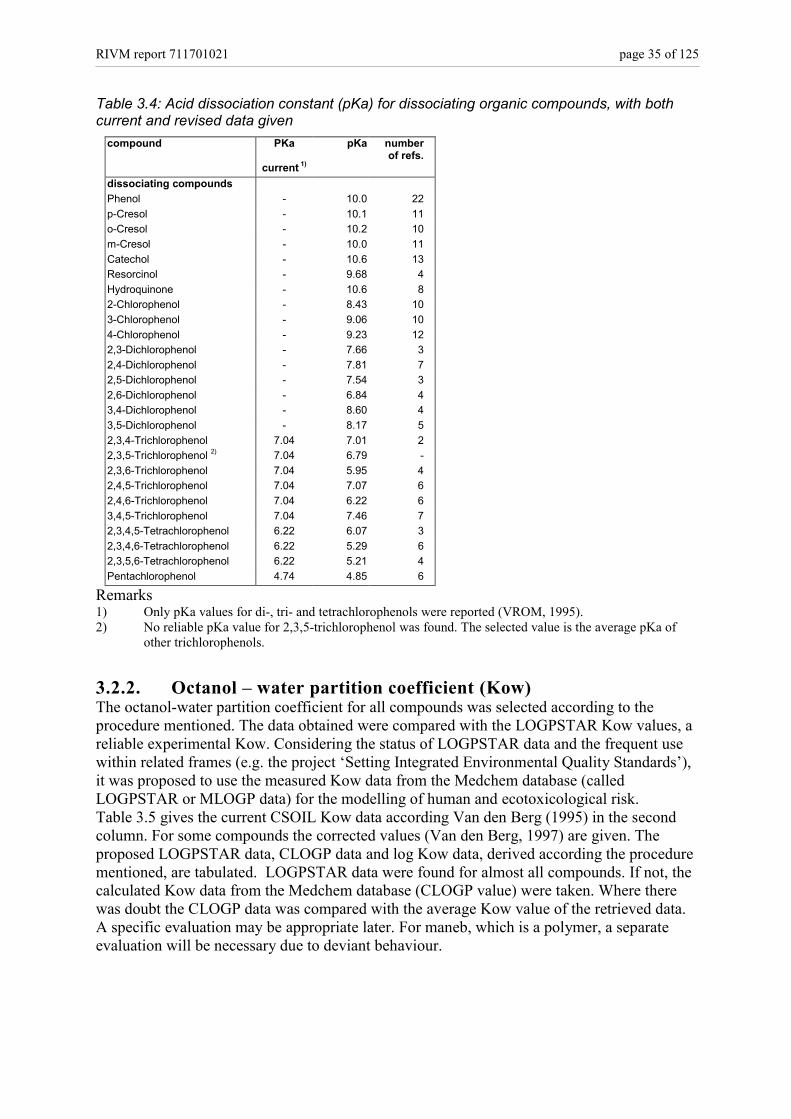
RIVM report 711701021 page 35 of 125
Table 3.4: Acid dissociation constant (pKa) for dissociating organic compounds, with bothcurrent and revised data given
compound PKa pKa numberof refs.
current 1)
dissociating compoundsPhenol - 10.0 22p-Cresol - 10.1 11o-Cresol - 10.2 10m-Cresol - 10.0 11Catechol - 10.6 13Resorcinol - 9.68 4Hydroquinone - 10.6 82-Chlorophenol - 8.43 103-Chlorophenol - 9.06 104-Chlorophenol - 9.23 122,3-Dichlorophenol - 7.66 32,4-Dichlorophenol - 7.81 72,5-Dichlorophenol - 7.54 32,6-Dichlorophenol - 6.84 43,4-Dichlorophenol - 8.60 43,5-Dichlorophenol - 8.17 52,3,4-Trichlorophenol 7.04 7.01 22,3,5-Trichlorophenol 2) 7.04 6.79 -2,3,6-Trichlorophenol 7.04 5.95 42,4,5-Trichlorophenol 7.04 7.07 62,4,6-Trichlorophenol 7.04 6.22 63,4,5-Trichlorophenol 7.04 7.46 72,3,4,5-Tetrachlorophenol 6.22 6.07 32,3,4,6-Tetrachlorophenol 6.22 5.29 62,3,5,6-Tetrachlorophenol 6.22 5.21 4Pentachlorophenol 4.74 4.85 6
Remarks1) Only pKa values for di-, tri- and tetrachlorophenols were reported (VROM, 1995).2) No reliable pKa value for 2,3,5-trichlorophenol was found. The selected value is the average pKa of
other trichlorophenols.
3.2.2. Octanol – water partition coefficient (Kow)The octanol-water partition coefficient for all compounds was selected according to theprocedure mentioned. The data obtained were compared with the LOGPSTAR Kow values, areliable experimental Kow. Considering the status of LOGPSTAR data and the frequent usewithin related frames (e.g. the project ‘Setting Integrated Environmental Quality Standards’),it was proposed to use the measured Kow data from the Medchem database (calledLOGPSTAR or MLOGP data) for the modelling of human and ecotoxicological risk.Table 3.5 gives the current CSOIL Kow data according Van den Berg (1995) in the secondcolumn. For some compounds the corrected values (Van den Berg, 1997) are given. Theproposed LOGPSTAR data, CLOGP data and log Kow data, derived according the procedurementioned, are tabulated. LOGPSTAR data were found for almost all compounds. If not, thecalculated Kow data from the Medchem database (CLOGP value) were taken. Where therewas doubt the CLOGP data was compared with the average Kow value of the retrieved data.A specific evaluation may be appropriate later. For maneb, which is a polymer, a separateevaluation will be necessary due to deviant behaviour.

page 36 of 125 RIVM report 711701021
Table 3.5: Log Kow values for all compounds evaluatedCompound Van den Berg LOGPSTAR CLOGP geometric mean number
(1995) (proposed) selected values of refs.Aromatic compoundsBenzene 2.13 2.13 2.14 2.11 9Ethylbenzene 3.15 3.15 3.17 3.15 5Phenol 1.46 1.47 1.47 1.46 7o-Cresol - 1.95 1.97 2.00 5m-Cresol - 1.96 1.97 1.97 5p-Cresol 2.00 1.94 1.97 1.94 5Toluene 2.69 2.73 2.64 2.71 6o-Xylene - 3.12 3.09 3.03 6p-Xylene - 3.15 3.14 3.15 6m-Xylene 3.20 3.20 3.14 3.20 5Catechol 0.88 0.88 0.88 0.91 6Resorcinol 0.78 0.80 0.81 0.79 4Hydroquinone 0.55 0.59 0.81 0.59 9Styrene 3.09 2.95 2.87 2.98 11PAH 1)
Naphthalene 3.36 3.30 3.32 3.35 9Anthracene 4.49 4.45 4.49 4.48 9Phenanthrene 4.54 4.47 4.49 4.51 7Fluoranthene 5.33 5.16 4.95 5.05 6Benzo(a)anthracene 5.61 5.54 5.66 5.64 7Chrysene 6.64 5.81 5.66 5.63 7Benzo(a)pyrene 6.35 6.13 6.12 6.04 7Benzo(ghi)perylene 6.00 6.22 - 6.74 7Benzo(k)fluoranthene 6.84 6.11 6.12 6.20 5Indeno, 1,2,3-cd pyrene 7.43 6.87 - 6.87 6Pyrene *) 6.00 4.99 4.95 - -acenaphthene *) - 3.92 - - -Benzo(b)fluoranthene *) - 5.78 - - -Benzo(j)fluoranthene *) - 6.11 - - -Dibenz(a,h)anthracene *) - 7.11 - - -9H-Fluorene *) - 4.18 - - -Acenaphthylene *) - 3.94 - - -Chlorinated hydrocarbons1,2-Dichloroethane 1.45 1.47 1.46 1.47 5Dichloromethane 1.87 1.25 1.25 1.34 6Tetrachloromethane 2.64 2.83 2.88 2.76 7Tetrachloroethene 2.60 3.40 3.48 2.89 8Trichloromethane 1.97 1.97 1.95 1.96 7Trichloroethene 2.71 2.61 2.63 2.48 9Vinylchloride 2.71 1.52 1.52 1.32 10Monochlorobenzene 2.81 2.89 2.86 2.85 51,2-Dichlorobenzene - 3.43 3.45 3.43 81,3-Dichlorobenzene - 3.53 3.57 3.51 71,4-Dichlorobenzene 3.40 3.44 3.57 3.48 71,2,3-Trichlorobenzene - 4.14 4.04 4.01 41,2,4-Trichlorobenzene 4.06 4.05 4.16 4.11 71,3,5-Trichlorobenzene - 4.19 4.28 4.24 21,2,3,4-Tetrachlorobenzene 4.70 4.64 4.63 - -1,2,3,5-Tetrachlorobenzene - 4.66 4.75 4.57 31,2,4,5-Tetrachlorobenzene - 4.60 4.75 4.62 5Pentachlorobenzene 5.17 5.18 5.35 5.25 10Hexachlorobenzene 5.34 5.73 6.06 5.61 82-Chlorophenol 2.39 2.15 2.15 2.16 63-Chlorophenol - 2.50 2.48 2.49 54-Chlorophenol - 2.39 2.48 2.45 62,3-Dichlorophenol - 2.84 2.84 3.00 32,4-Dichlorophenol 3.15 3.06 2.96 2.96 5

RIVM report 711701021 page 37 of 125
Compound Van den Berg LOGPSTAR CLOGP geometric mean number(1995) (proposed) selected values of refs.
2,5-Dichlorophenol - 3.06 2.96 3.07 32,6-Dichlorophenol - 2.75 2.63 2.73 33,4-Dichlorophenol - 3.33 3.17 3.30 43,5-Dichlorophenol - 3.52 3.29 3.44 42,3,4-Trichlorophenol 3.88 3.46 3.46 4.07 12,3,5-Trichlorophenol - 3.58 3.58 - -2,3,6-Trichlorophenol - 3.77 3.25 3.67 32,4,5-Trichlorophenol - 3.72 3.58 3.61 62,4,6-Trichlorophenol - 3.69 3.37 3.61 63,4,5-Trichlorophenol - 4.01 3.79 4.06 32,3,4,5-Tetrachlorophenol 3.35 4.21 4.18 4.49 32,3,4,6-Tetrachlorophenol - 4.12 3.97 4.18 42,3,5,6-Tetrachlorophenol - 3.88 3.97 4.29 3Pentachlorophenol 5.13 5.12 4.68 4.92 141-Chloronaphatalene 3.85 4.10 4.03 4.05 62-Chloronaphatalene - 4.14 4.03 4.07 4PCB 28 - 5.62 5.92 5.56 7PCB 52 - 6.26 6.38 5.59 13PCB101 - 6.85 6.97 5.89 5PCB118 - 7.12 7.10 - -PCB138 - 7.45 7.45 6.68 3PCB153 6.57 7.44 7.57 6.79 7PCB180 - 8.16 8.16 7.21 2Dioxins (+PCDF, PCBs 2))1-MCDD 4.75 4.752-MCDD 5.00 5.0027-DCDD 5.75 5.7528-DCDD 5.60 5.60124-TrCDD 6.35 6.352,3,7,8-TCDD 6.80 6.801368-TeCDD 7.10 7.10PCDD 7.40 7.40HxCDD 7.80 7.80HpCDD 8.00 8.00OCDD 8.20 8.20PCB 77 *) - 6.63 6.64 6.34 8PCB 105 *) - 6.98 6.98 - -PCB 126 *) - 7.23 7.23 - -PCB 156 *) - 7.70 7.70 - -PCB 157 *) - 7.60 7.58 - -PCB 169 *) - 7.41 7.83 7.54 7TetraCDF 6.53 6.53PentaCDF 6.85 6.85HexaCDF 7.81 7.81HeptaCDF 7.92 7.92OctaCDF 8.28 8.28PesticidesDDT 6.18 6.91 6.76 6.47 8DDE 5.73 6.96 6.74 6.23 6DDD - 6.22 6.06 5.94 5Aldrin 7.40 6.50 5.41 5.62 8Dieldrin 5.36 4.55 3.70 4.86 7Endrin 4.95 4.55 3.70 4.34 8α-HCH 3.72 3.72 3.75 3.81 6β-HCH 3.72 3.72 3.75 3.83 17γ-HCH 3.72 3.72 3.75 3.76 9δ-HCH 3.72 3.72 3.75 3.70 5Carbaryl 3.36 2.36 2.39 2.42 7Carbofuran 2.94 1.63 2.47 2.16 6Maneb 3) 7.43 - - - -

page 38 of 125 RIVM report 711701021
Compound Van den Berg LOGPSTAR CLOGP geometric mean number(1995) (proposed) selected values of refs.
Atrazine 2.18 2.61 2.50 2.62 8Mineral oilaliphatic >EC5-EC6 - 3.52 - - -aliphatic >EC6-EC8 - 3.60 - - -aliphatic >EC8-EC10 - 3.69 - - -aliphatic >EC10-EC12 - 3.76 - - -aliphatic >EC12-EC16 - 3.85 - - -aliphatic >EC16-EC21 - 3.97 - - -aromatic >EC5-EC7 - 3.53 - - -aromatic >EC7-EC8 - 3.54 - - -aromatic >EC8-EC10 - 3.55 - - -aromatic >EC10-EC12 - 3.58 - - -aromatic >EC12-EC16 - 3.61 - - -aromatic >EC16-EC21 - 3.66 - - -aromatic >EC21-EC35 - 3.74 - - -Other pollutantsCyclohexanone 1.83 0.81 0.86 0.81 8Dimethyl phthalate (DMP) *) - 1.56 1.56 - -Diethyl phthalate (DEP) *) - 2.47 2.62 - -Dibuthyl phthalate (DBP) *) - 4.72 4.73 - -Di-isobutylphthalate (DIBP) *) - 4.46 - - -Butylbenzylphthalate (BBP) 4.44 4.91 3.88 4.54 6Dihexyl phthalate (DHP) *) - 6.85 6.85 - -Di(2-ethylhexyl)phthalate(DEHP)
5.12 7.45 8.71 6.40 5
Pyridine 1.15 0.65 0.64 0.73 12Tetrahydrofuran 1.17 0.47 0.53 0.42 3Tetrahydrothiophene 2.05 1.61 1.45 1.51 31) The Kow data on the added PAHs, marked with an asterix (*) represent, with exception of pyrene,
values from EPIWIN.2) The physicochemical parameters of dioxins (belonging to the second series of compounds) were not
evaluated. The data is taken from Van den Berg, 1994. The data of the added planar PCBs are based onVan Wezel et al. (1999). Mono-, di- and trichlorobiphenyls were left out because the MPR does notinclude these congeners.
3) No reliable Kow for Maneb was found.*) Added compounds are explained in section 3.2.1.
3.3. Organic carbon normalised soil-water partitioncoefficients (Koc)
3.3.1. Koc for non-dissociating compoundsOrganic-carbon normalised soil-water partition coefficients are, within the scope of potentialrisk assessment, considered to be independent of soil type. Ageing, the nature and type oforganic matter (polarity C/N+O, aromaticity), and the process of so-called ‘slow desorption’in situ (van Steenwijk et al., 1999), which can provoke additional variation, are not taken intoaccount. These effects are site-specific and simply not predictable. As potential riskassessment considers the average situation, site-specific effects are outside the scope of thisstudy.
De current SRChuman values of compounds for the first series were based on Kow derived Kocvalues according the relationship of Karickhoff (section 2.1.7). These values were found toshow substantial differences when compared with measured Koc values or with other logKoc vs. log Kow correlations (Sabljić, 1995).

RIVM report 711701021 page 39 of 125
In general, we believe that experimental measured Koc values should be the basis of valuessuitable for potential risk assessment. The selection criteria agreed on by several ‘Koc users’are given in Appendix 3. Moreover, it was agreed that both humantoxicological andecotoxicological risk values (soils and sediments) will use the same Koc data set.
Table 3.6 gives the current CSOIL log Koc data (Van den Berg, 1995) and the revised logKoc data derived following the Koc guideline, together with the standard deviation (log) andthe number of references.
Table 3.6: Current (Van den Berg, 1995) and revised log Koc valuescompound Van den Berg
(1995)revised standard
deviationnumber ofreferences
log Koc log Koc 6)
Aromatic compoundsBenzene 1.74 1.87 0.18 14Ethylbenzene 2.76 2.53 0.40 4Phenol 1.07 1.52 0.43 18o-Cresol - 1.59 1.30-2.14 3m-Cresol - 1.72 1.49-2.14 3p-Cresol 1.61 1.64 0.20 9Toluene 2.30 2.09 0.33 16o-Xylene - 2.18 1.76-2.60 2p-Xylene - 2.66 0.16 7m-Xylene 2.81 2.41 0.20 4Catechol 0.49 1.85 1.45-2.07 3Resorcinol 0.39 1.14 0.98-1.41 3Hydroquinone 0.16 1.95 1.27-2.64 2Styrene 2.70 2.58 2.44-2.71 2PAH 1)
Naphthalene 2.97 2.98 0.27 13Anthracene 4.10 4.30 0.25 9Phenanthrene 4.15 4.23 0.27 7Fluoranthene 4.94 5.18 0.76 9Benzo(a)anthracene 5.22 5.79 0.64 5Chrysene 6.25 5.72 0.90 5Benzo(a)pyrene 5.96 5.82 0.90 5Benzo(ghi)perylene 5.61 6.43 0.63 5Benzo(k)fluoranthene 6.45 6.24 0.68 7Indeno, 1,2,3-cd pyrene 7.04 6.02 5.66-6.20 3Pyrene *) 5.61 4.83 0.25 401,2-dihydroacenaphthalene *) - 3.53 3.28-3.79 2Benzo(b)fluoranthene *) - 5.34 4.78-5.91 2Benzo(j)fluoranthene *) - 5.48 5.05-5.91 2Dibenz(a,h)anthracene *) - 6.14 5.86-6.42 29H-Fluorene *) - 3.77 3.49-4.05 2Acenaphthylene *) - 3.47 3.29-3.79 3Chlorinated hydrocarbons1,2-Dichloroethane 1.06 1.49 0.21 8Dichloromethane (methylenechloride) 1.48 1.22 0.33 5Tetrachloromethane (carbontetrachloride) 2.25 1.75 0.44 11Tetrachloroethene 2.21 2.42 0.23 17Trichloromethane(chloroform) 1.58 1.66 0.17 7Trichloroethene 2.32 2.06 0.11 19Vinylchloride 2.32 1.56 0.24 4Monochlorobenzene 2.42 2.34 0.22 141,2-Dichlorobenzene - 2.60 0.24 111,3-Dichlorobenzene - 2.69 0.34 61,4-Dichlorobenzene 3.01 2.82 0.26 161,2,3-Trichlorobenzene - 3.23 0.28 7

page 40 of 125 RIVM report 711701021
compound Van den Berg(1995)
revised standarddeviation
number ofreferences
log Koc log Koc 6)
1,2,4-Trichlorobenzene 3.67 3.28 0.32 151,3,5-Trichlorobenzene - 3.98 3.26-5.10 31,2,3,4-Tetrachlorobenzene 4.31 3.91 0.13 41,2,3,5-Tetrachlorobenzene - 3.57 0.29 51,2,4,5-Tetrachlorobenzene - 3.77 0.31 11Pentachlorobenzene 4.78 3.92 0.49 6Hexachlorobenzene 4.95 4.06 0.51 132-Chlorophenol 2.00 1.97 0.44 53-Chlorophenol - 2.56 0.49 184-Chlorophenol - 1.93 0.27 52,3-Dichlorophenol - 2.56 0.22 82,4-Dichlorophenol 2.76 2.54 0.29 132,5-Dichlorophenol - 2.83 - 12,6-Dichlorophenol - 2.63 - 13,4-Dichlorophenol 2) - 2.90 0.42 173,5-Dichlorophenol - 2.34 0.55 32,3,4-Trichlorophenol 3.49 3.08 - 12,3,5-Trichlorophenol - 3.16 - 12,3,6-Trichlorophenol - 3.28 - 12,4,5-Trichlorophenol 2) - 3.36 0.32 172,4,6-Trichlorophenol 2) - 3.47 0.89 143,4,5-Trichlorophenol - 3.54 0.10 42,3,4,5-Tetrachlorophenol 2) 2.96 3.87 0.34 72,3,4,6-Tetrachlorophenol - 3.10 0.26 132,3,5,6-Tetrachlorophenol - 3.34 - 1Pentachlorophenol 2) 4.74 3.20 0.54 841-Chloronaphatalene 3.46 3.42 3.36-3.48 22-Chloronaphatalene - 3.42 3.36-3.47 2PCB 28 5.18 4.61 0.62 5PCB 52 - 4.70 1.08 6PCB101 - 5.53 0.71 15PCB118 - 6.35 0.42 8PCB138 - 5.71 0.74 9PCB153 6.18 5.87 0.70 62PCB180 - 5.99 0.65 9Dioxines and planar PCBs 3)
1-MCDD 3.95 3.95 - -2-MCDD 4.15 4.15 - -27-DCDD 4.76 4.76 - -28-DCDD 4.64 4.64 - -124-TrCDD 5.24 5.24 - -2,3,7,8-TCDD 5.61 5.61 - -1368-TeCDD 5.85 5.85 - -PCDD 6.09 6.09 - -HxCDD 6.42 6.42 - -HpCDD 6.58 6.58 - -OCDD 6.74 6.74 - -PCB 77 *) - 5.85 5.47-6.31 3PCB 105 *) - 6.13 0.33 7PCB 126 *) - 5.94 5.92-5.96 3PCB 156 *) - 6.34 - 1PCB 157 *) - 6.26 - 1PCB 169 *) - 6.01 5.92-6.10 2TetraCDF 5.39 5.39PentaCDF 5.65 5.65HexaCDF 6.42 6.42HeptaCDF 6.52 6.52OctaCDF 6.80 6.80
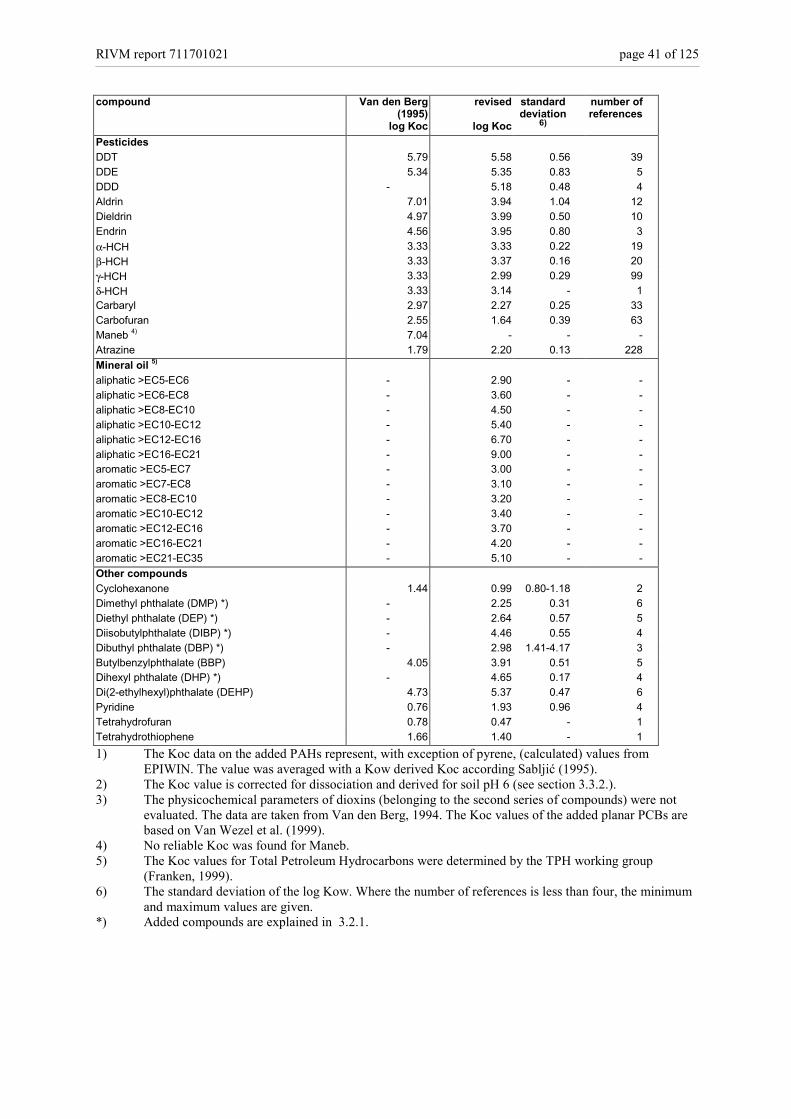
RIVM report 711701021 page 41 of 125
compound Van den Berg(1995)
revised standarddeviation
number ofreferences
log Koc log Koc 6)
PesticidesDDT 5.79 5.58 0.56 39DDE 5.34 5.35 0.83 5DDD - 5.18 0.48 4Aldrin 7.01 3.94 1.04 12Dieldrin 4.97 3.99 0.50 10Endrin 4.56 3.95 0.80 3α-HCH 3.33 3.33 0.22 19β-HCH 3.33 3.37 0.16 20γ-HCH 3.33 2.99 0.29 99δ-HCH 3.33 3.14 - 1Carbaryl 2.97 2.27 0.25 33Carbofuran 2.55 1.64 0.39 63Maneb 4) 7.04 - - -Atrazine 1.79 2.20 0.13 228Mineral oil 5)
aliphatic >EC5-EC6 - 2.90 - -aliphatic >EC6-EC8 - 3.60 - -aliphatic >EC8-EC10 - 4.50 - -aliphatic >EC10-EC12 - 5.40 - -aliphatic >EC12-EC16 - 6.70 - -aliphatic >EC16-EC21 - 9.00 - -aromatic >EC5-EC7 - 3.00 - -aromatic >EC7-EC8 - 3.10 - -aromatic >EC8-EC10 - 3.20 - -aromatic >EC10-EC12 - 3.40 - -aromatic >EC12-EC16 - 3.70 - -aromatic >EC16-EC21 - 4.20 - -aromatic >EC21-EC35 - 5.10 - -Other compoundsCyclohexanone 1.44 0.99 0.80-1.18 2Dimethyl phthalate (DMP) *) - 2.25 0.31 6Diethyl phthalate (DEP) *) - 2.64 0.57 5Diisobutylphthalate (DIBP) *) - 4.46 0.55 4Dibuthyl phthalate (DBP) *) - 2.98 1.41-4.17 3Butylbenzylphthalate (BBP) 4.05 3.91 0.51 5Dihexyl phthalate (DHP) *) - 4.65 0.17 4Di(2-ethylhexyl)phthalate (DEHP) 4.73 5.37 0.47 6Pyridine 0.76 1.93 0.96 4Tetrahydrofuran 0.78 0.47 - 1Tetrahydrothiophene 1.66 1.40 - 11) The Koc data on the added PAHs represent, with exception of pyrene, (calculated) values from
EPIWIN. The value was averaged with a Kow derived Koc according Sabljić (1995).2) The Koc value is corrected for dissociation and derived for soil pH 6 (see section 3.3.2.).3) The physicochemical parameters of dioxins (belonging to the second series of compounds) were not
evaluated. The data are taken from Van den Berg, 1994. The Koc values of the added planar PCBs arebased on Van Wezel et al. (1999).
4) No reliable Koc was found for Maneb.5) The Koc values for Total Petroleum Hydrocarbons were determined by the TPH working group
(Franken, 1999).6) The standard deviation of the log Kow. Where the number of references is less than four, the minimum
and maximum values are given.*) Added compounds are explained in 3.2.1.

page 42 of 125 RIVM report 711701021
3.3.2. Koc for dissociating compoundsThe use of Koc values as derived in section 3.3.1 is not valid for dissociating organiccompounds. Dissociating organic compounds exist in both neutral and ionised forms. Therelative amounts of the ionised and neutral (fnd: fraction non-dissociated form) formrepresent a function of pH. Table 3.7 shows that the degree of dissociation is only ofimportance for some chlorophenols. The current CSOIL model (Van den Berg, 1995)accounts only for the sorption of the neutral form. However, if the amount of ionisation issubstantial, ignoring the sorption of the ionised form can lead to an inaccurate estimation ofthe soil sorption.Table 3.7: Degree of dissociation at different soil pH
available neutral form in percentage (fnd)compound pKa pH 5 pH 6 pH 7 pH 8Phenol 10 100% 100% 100% 99%o-Cresol 10.1 100% 100% 100% 99%m-Cresol 10.2 100% 100% 100% 99%p-Cresol 10 100% 100% 100% 99%Catechol 10.6 100% 100% 100% 100%Resorcinol 9.68 100% 100% 100% 98%Hydroquinone 10.6 100% 100% 100% 100%2-Chlorophenol 8.43 100% 100% 96% 73%3-Chlorophenol 9.06 100% 100% 99% 92%4-Chlorophenol 6.23 94% 63% 15% 2%2,3-Dichlorophenol 7.66 100% 98% 82% 31%2,4-Dichlorophenol 7.84 100% 99% 87% 41%2,5-Dichlorophenol 7.54 100% 97% 78% 26%2,6-Dichlorophenol 6.84 99% 87% 41% 6%3,4-Dichlorophenol 8.6 100% 100% 98% 80%3,5-Dichlorophenol 8.17 100% 99% 94% 60%2,3,4-Trichlorophenol 7.01 99% 91% 51% 9%2,3,5-Trichlorophenol 6.79 98% 86% 38% 6%2,3,6-Trichlorophenol 5.95 90% 47% 8% 1%2,4,5-Trichlorophenol 7.07 99% 92% 54% 11%2,4,6-Trichlorophenol 6.22 94% 62% 14% 2%3,4,5-Trichlorophenol 7.46 100% 97% 74% 22%2,3,4,5-Tetrachlorophenol 6.07 92% 54% 11% 1%2,3,4,6-Tetrachlorophenol 5.29 66% 16% 2% 0%2,3,5,6-Tetrachlorophenol 5.21 62% 14% 2% 0%Pentachlorophenol 4.85 41% 7% 1% 0%
In addressing this problem, the derivation of Koc values for ionising organic compounds issomewhat different from the procedure applied for non-ionising compounds. The selection ofKoc values takes place according to the guideline. However, for the derivation of the genericKoc valid for the standard soil, only those values determined at known soil pH may beconsidered. Lee et al. (1991) describes the prediction of the soil-water partition coefficient forionising organic compounds. He defines the total sorption coefficient as the sum of theweighted individual sorption coefficients for the ionised and neutral species at a given pH.

RIVM report 711701021 page 43 of 125
Koc = Koc neutral * fnd + Koc ionised *(1 – fnd) (1)
where:Koc: soil organic carbon / water partition coefficient (dm3/kg)Koc neutral: partition coefficient for the neutral species (dm3/kg)fnd: fraction of the neutral species present at given pH (-)Koc ionised: partition coefficient for the ionised species (dm3/kg)
The fraction of the neutral species can be calculated as follows:
fnd = 1 / (1+10 [ pH – pKa ] ) (2)
where:pKa: dissociation constant
FThe selected experimental Koc values are in fact the overall Koc as the weighted sum of theKoc for the neutral part and the Koc for the ionised part. Sorption coefficients for bothneutral and ionised species are often not reported. The ratio of Koc-ionised to Koc-neutralcould be calculated from published data (U.S. EPA, 1996) on the sorption of somechlorophenolic compounds (Table 3.8).Table 3.8: Koc ratio for ionised and neutral forms
compound ratio Koc ionised to Koc neutral 2,4,5 –trichlorophenol 0.0152,4,6 –trichlorophenol 0.12,3,4,5 – tetrachlorophenol 0.051Pentachlorophenol 0.02Other phenolic compounds 0.015
All chlorophenols 0.02 (used for generic risk assessment)
From:- equations 1 and 2;- the known ratio of the Koc values for the ionised and neutral species (given that the
generic approach of risk assessment as a fixed ratio of 0.02 is used for allchlorophenols) and
- the selected Koc data (measured Koc values at known soil pH).The overall generic Koc values (valid for standard soil at a given soil pH) are computed asfollows:
First, the Koc neutral and the Kocionised are computed from the selected measured Koc (atknown soil pH):
Koc neutral = Koc / {fnd + [0.02* (1-fnd)]}Koc ionized = 0.02 * Koc neutral
Second, the overall Koc at a soil pH of 6 (standard soil) is calculated according therelationship in equation (1). This was done for all selected experimental Koc values.Afterwards the geometric mean is considered as the best Koc value for potential risk analysis.
Table 3.7 gives the average of the retrieved pKa data and the calculated neutral fraction fordifferent soil pH, proving that an adjustment of the measured Koc values is appropriate forpenta-, tetra- and some trichlorophenols. Due to available Koc data only an adjustment for
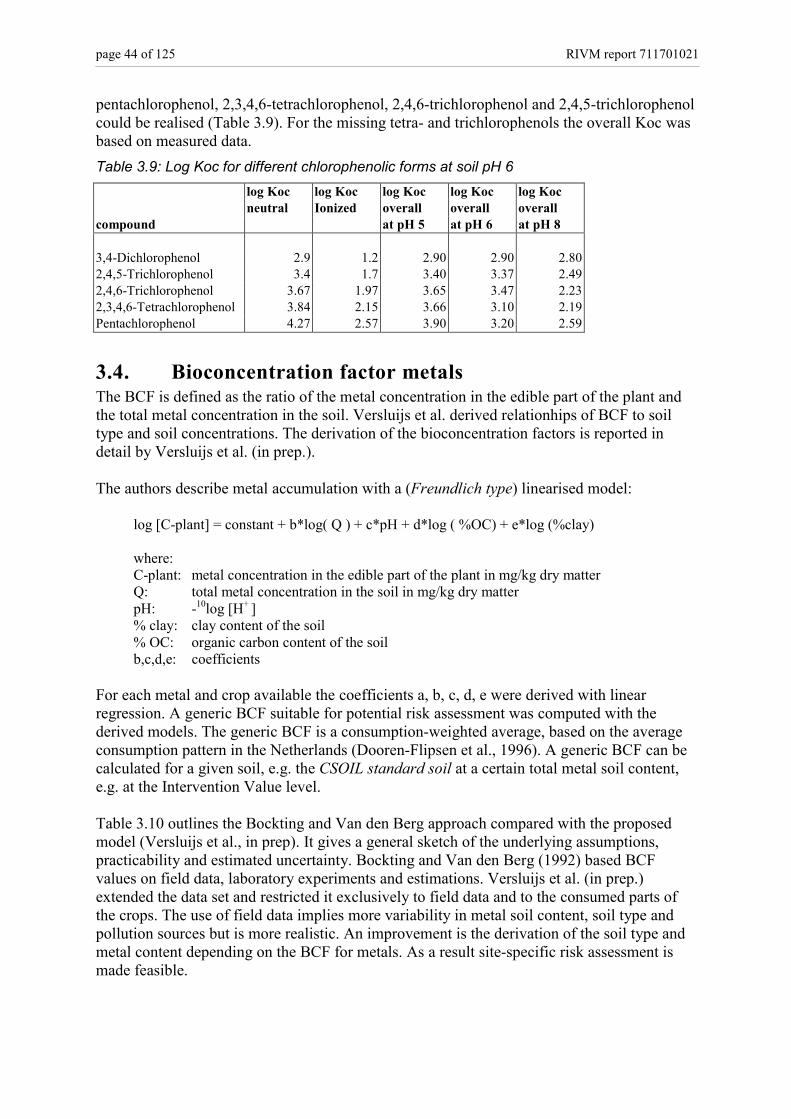
page 44 of 125 RIVM report 711701021
pentachlorophenol, 2,3,4,6-tetrachlorophenol, 2,4,6-trichlorophenol and 2,4,5-trichlorophenolcould be realised (Table 3.9). For the missing tetra- and trichlorophenols the overall Koc wasbased on measured data.Table 3.9: Log Koc for different chlorophenolic forms at soil pH 6
log Koc log Koc log Koc log Koc log Kocneutral Ionized overall overall overall
compound at pH 5 at pH 6 at pH 8
3,4-Dichlorophenol 2.9 1.2 2.90 2.90 2.802,4,5-Trichlorophenol 3.4 1.7 3.40 3.37 2.492,4,6-Trichlorophenol 3.67 1.97 3.65 3.47 2.232,3,4,6-Tetrachlorophenol 3.84 2.15 3.66 3.10 2.19Pentachlorophenol 4.27 2.57 3.90 3.20 2.59
3.4. Bioconcentration factor metalsThe BCF is defined as the ratio of the metal concentration in the edible part of the plant andthe total metal concentration in the soil. Versluijs et al. derived relationhips of BCF to soiltype and soil concentrations. The derivation of the bioconcentration factors is reported indetail by Versluijs et al. (in prep.).
The authors describe metal accumulation with a (Freundlich type) linearised model:
log [C-plant] = constant + b*log( Q ) + c*pH + d*log ( %OC) + e*log (%clay)
where:C-plant: metal concentration in the edible part of the plant in mg/kg dry matterQ: total metal concentration in the soil in mg/kg dry matterpH: -10log [H+ ]% clay: clay content of the soil% OC: organic carbon content of the soilb,c,d,e: coefficients
For each metal and crop available the coefficients a, b, c, d, e were derived with linearregression. A generic BCF suitable for potential risk assessment was computed with thederived models. The generic BCF is a consumption-weighted average, based on the averageconsumption pattern in the Netherlands (Dooren-Flipsen et al., 1996). A generic BCF can becalculated for a given soil, e.g. the CSOIL standard soil at a certain total metal soil content,e.g. at the Intervention Value level.
Table 3.10 outlines the Bockting and Van den Berg approach compared with the proposedmodel (Versluijs et al., in prep). It gives a general sketch of the underlying assumptions,practicability and estimated uncertainty. Bockting and Van den Berg (1992) based BCFvalues on field data, laboratory experiments and estimations. Versluijs et al. (in prep.)extended the data set and restricted it exclusively to field data and to the consumed parts ofthe crops. The use of field data implies more variability in metal soil content, soil type andpollution sources but is more realistic. An improvement is the derivation of the soil type andmetal content depending on the BCF for metals. As a result site-specific risk assessment ismade feasible.

RIVM report 711701021 page 45 of 125
The data on metal accumulation for individual crops are summarised in Appendix 4, Tables 1and 2. For potential risks, the assessment is geared to an average human with an averageconsumption pattern. BCF is consequently calculated as a weighted average of the amountsconsumed in the Netherlands (see section 4.4.4.2). The BCF values are valid for standard soiland metal content around the Intervention Value. Appendix 4-Table 1 overviews the rangesand averages of the BCF values. This appendix does not distinguish the total metalconcentrations in the soil and the soil types. Table 2 of Appendix 4 gives the parametervalues for the derived crop-specific plant-soil models as a function of soil metalconcentration and soil type.
Table 3.10: Fundamental comparison of approaches used, practicability and underlyingassumptionsApproach Bockting and Van den Berg
(1992)Versluijs et al. (2000)
general character average or median BCF based onfield data
plant-soil accumulation relationobtained by linear modelling offield data
total soil-metal content dependent no yessoil type-dependent no yes, pH, clay and organic matterConsumption pattern considered no, only the consumption of
potatoes is separately consideredyes, based on the averageconsumption pattern. Calculationfor deviant patterns possible (withinlimits)
UNDERLYING DATAdata sets one data set completed with
estimations and data from potexperiments
field data from different sources
Field data dominant exclusiveHome-grown vegetables dominant exclusiveData from consumable parts if available exclusive
VALIDITY/ USEpotential risk assessment yes yesmetal content range probably around Target Value level metal-content dependent. Range is
determinedsite-specific risk 1) no yes, within certain ranges for pH,
clay and organic matteractual risk 2) no limitedUNCERTAINTIESDetermined Global and based on estimation
and expert judgementPartly analyzed by Monte Carlosimulation
BCF –ranges min – average – max (estimation 3)) 5 – 50 - 95 percentile (dataset)As 0.001 – 0.03 – 0.1 0.0014 - 0.025 - 0.15Ba 0.02 – 0.05 – 0.08 Not determinedCd 0.01 – 0.7 – 10 0.09 - 0.55 - 4.6Cr 0.001 – 0.02 – 1 Not determinedCo 0.01 – 0.03 – 0.05 Not determinedCu 0.01 – 0.1 – 10 0.09 - 0.29 - 0.80Hg 0.001 – 0.03 – 0.02 0.02- -0.33 - 3Pb 0.0001 – 0.03 – 0.5 0.002 - 0.015 - 0.083Mo 0.01 – 0.3 – 1 Not determinedNi 0.01 – 0.1 – 2 0.010 - 0.025 - 0.15Zn 0.01 – 0.4 – 10 0.07 - 0.30 - 1.31)
Site-specific risk: soil-type dependent risk (pH, %clay and %OC)2)
Actual risk: risk assessment for different soil types and deviant receptor characteristics (e.g. crop-specific approach)3)
The reported minimum and maximum values are from Bockting and Van den Berg (1992). Considering the dataused, the given minimum and maximum values are concluded to show a limited image of the uncertainties.

page 46 of 125 RIVM report 711701021
The correlation coefficients of the derived soil-plant relationships (see Table 2, Appendix 4)are generally low. This is due to the fact that a number of effects are not included in theapplied model. Season, root depth, chemical form of the metals, contaminant matrix, amountsof iron and aluminium in the soil, variety of crop and probably also variations in chemicalanalysis also influence the results. By agreement, these effects are not taken into account.Given this restriction and aiming for an ideal generic approach, the data set should mirror theaverage situation for parameters not included in the Freundlich model. Also in this ideal casemany values will not be on the regression line; this line is only valid for an average situationand the correlation coefficient is not necessarily close to unity. The collection of more data(while conserving the average situation) does not necessarily lower the regression coefficient.
In the present situation, where data is lacking, the data set used cannot be expected to mirroran ideal average of all contamination situations. The regression line is also dependent on thedistribution of effects not included in the Freundlich model. A high correlation coefficient(approach 1) may even be caused by data from a too limited number of contaminationsituations and may indicate an adverse situation. This effect makes it difficult to evaluate thepredicting value of the collected data. It is recommended to collect more data to be able todescribe the average situation. It could be advantageous to differentiate betweencontamination situations.
The predicting values of the soil-plant relationships are evaluated with an F-test (one-sided5% exceeding probability). If the relationship for a particular crop fails in the test, thegeometric mean of the BCF is used. If the predicting value of the relationship is acceptable,it is used to calculate the BCF value for the standard soil with a total soil concentration nearthe Intervention Value.An associated problem is that the data sets cover only a restricted range of soil types andconcentrations. Extrapolation outside the ranges of the field data sets used were found topossibly lead to unpredictable and unreliable results. Table 3.11 overviews the applicationrange of the relationships for a metal in terms of the 5- and 95-percentiles of the relevantparameters.
Table 3.11: Application range of the derived metal accumulation models for generic riskassessment
Q (mg/kg dm)(Q5 - Q95)
pH OC% 1) clay %
As 1.4 - 24 5.1 - 7.5 0.8 - 3.7 2 – 45Cd 0.12 - 3.2 5.4 - 7.5 0.9 - 13 3 – 33Cu 21 - 45 5.2 - 8.4 1.6 - 3.5 12 – 16Hg 0.01 - 0.2 5.1 - 7.5 0.8 - 3.7 2 – 45Ni 19 - 44 6.8 2.9 - 3.7 12 – 16Pb 10 - 359 5.0 - 7.5 0.9 - 13 1.7 – 33Zn 57 - 748 5.2 - 8.4 0.5 - 2.9 6 – 161) OC: organic carbon (= 0.58 * % organic matter)
As a result, the following approach is proposed for determining BCF values for potential riskassessment:- No extrapolation outside the ranges of the underlying field data sets. Only interpolations
within the given ranges (Table 3.11).- Outside the ranges indicated, the BCF values are fixed at the limit values (conservative
estimation).
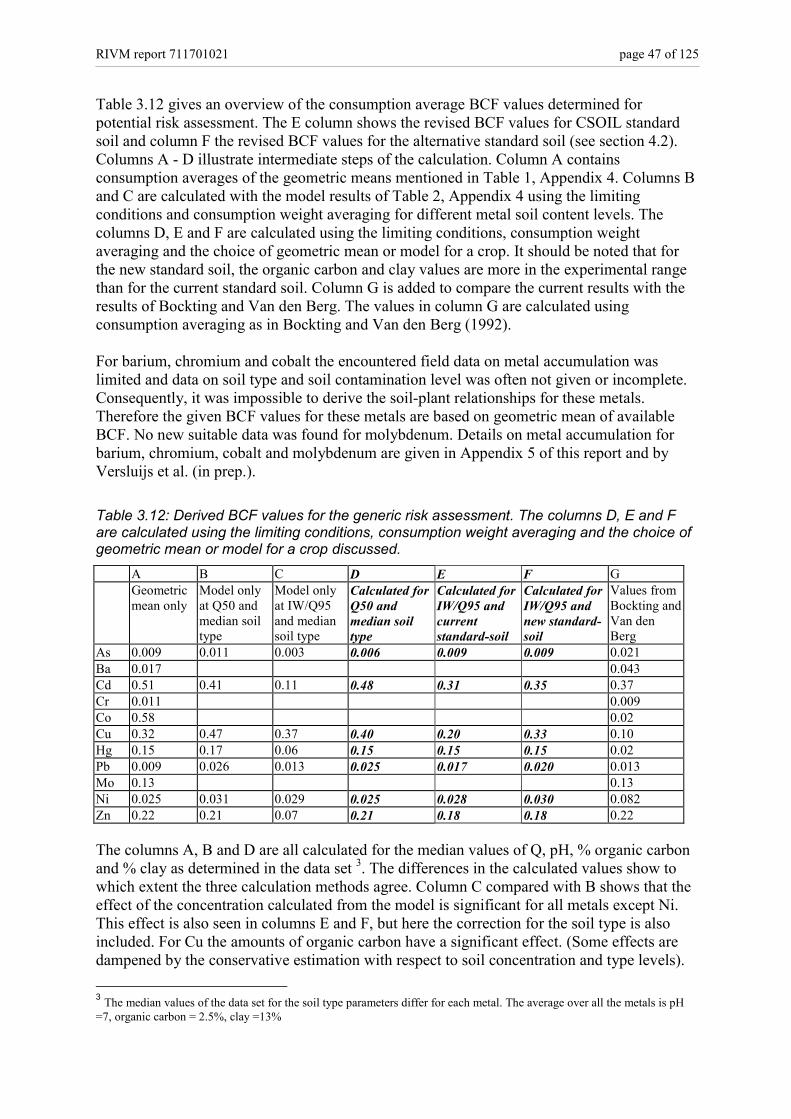
RIVM report 711701021 page 47 of 125
Table 3.12 gives an overview of the consumption average BCF values determined forpotential risk assessment. The E column shows the revised BCF values for CSOIL standardsoil and column F the revised BCF values for the alternative standard soil (see section 4.2).Columns A - D illustrate intermediate steps of the calculation. Column A containsconsumption averages of the geometric means mentioned in Table 1, Appendix 4. Columns Band C are calculated with the model results of Table 2, Appendix 4 using the limitingconditions and consumption weight averaging for different metal soil content levels. Thecolumns D, E and F are calculated using the limiting conditions, consumption weightaveraging and the choice of geometric mean or model for a crop. It should be noted that forthe new standard soil, the organic carbon and clay values are more in the experimental rangethan for the current standard soil. Column G is added to compare the current results with theresults of Bockting and Van den Berg. The values in column G are calculated usingconsumption averaging as in Bockting and Van den Berg (1992).
For barium, chromium and cobalt the encountered field data on metal accumulation waslimited and data on soil type and soil contamination level was often not given or incomplete.Consequently, it was impossible to derive the soil-plant relationships for these metals.Therefore the given BCF values for these metals are based on geometric mean of availableBCF. No new suitable data was found for molybdenum. Details on metal accumulation forbarium, chromium, cobalt and molybdenum are given in Appendix 5 of this report and byVersluijs et al. (in prep.).
Table 3.12: Derived BCF values for the generic risk assessment. The columns D, E and Fare calculated using the limiting conditions, consumption weight averaging and the choice ofgeometric mean or model for a crop discussed.
A B C D E F GGeometricmean only
Model onlyat Q50 andmedian soiltype
Model onlyat IW/Q95and mediansoil type
Calculated forQ50 andmedian soiltype
Calculated forIW/Q95 andcurrentstandard-soil
Calculated forIW/Q95 andnew standard-soil
Values fromBockting andVan denBerg
As 0.009 0.011 0.003 0.006 0.009 0.009 0.021Ba 0.017 0.043Cd 0.51 0.41 0.11 0.48 0.31 0.35 0.37Cr 0.011 0.009Co 0.58 0.02Cu 0.32 0.47 0.37 0.40 0.20 0.33 0.10Hg 0.15 0.17 0.06 0.15 0.15 0.15 0.02Pb 0.009 0.026 0.013 0.025 0.017 0.020 0.013Mo 0.13 0.13Ni 0.025 0.031 0.029 0.025 0.028 0.030 0.082Zn 0.22 0.21 0.07 0.21 0.18 0.18 0.22
The columns A, B and D are all calculated for the median values of Q, pH, % organic carbonand % clay as determined in the data set 3. The differences in the calculated values show towhich extent the three calculation methods agree. Column C compared with B shows that theeffect of the concentration calculated from the model is significant for all metals except Ni.This effect is also seen in columns E and F, but here the correction for the soil type is alsoincluded. For Cu the amounts of organic carbon have a significant effect. (Some effects aredampened by the conservative estimation with respect to soil concentration and type levels). 3 The median values of the data set for the soil type parameters differ for each metal. The average over all the metals is pH=7, organic carbon = 2.5%, clay =13%
page 48 of 125 RIVM report 711701021
The values of Bockting and Van den Berg are calculated similarly to values in column A.Differences originate in the selection of crops, inclusion of laboratory experiments and thecalculation of the consumption average. Comparing column G with the columns E and Finvolves the correction for soil concentration and types.
It should be recognised that the values are given for the current Intervention Value and maychange if the Intervention Value is changed. The calculation of new Intervention Valuesshould, in principle, be made iterative, or with the help of relationships be included in thedependency of the generic BCF on the soil total concentration. The BCF values are estimatedconservatively as constant values above the Q95 of the data set. Since Q95 usually <IV inpractice the calculation is often straightforward. The dependency of the BCF on soilconcentration can also play an important role in an uncertainty analysis.
3.5. Kp metals for soil3.5.1. IntroductionThe Kp in this section is primarily meant for the derivation of the risk limits for groundwater.As part of this derivation the concentration calculated in the groundwater is calculated that isin equilibrium with a total concentration in soil equal to the Intervention Value for soil (see2.1.9). According to this standard the Kp should represent the fraction of contaminants in thepore water that is subject to transport, i.e. the total pore water concentration including organicand inorganic metal complexes. Because metal transport takes place in the unsaturated part ofthe soil before leaching into the groundwater takes place, the partition coefficients shouldpreferentially represent this whole unsaturated soil layer. However, because information onpartition in deeper soil layers is lacking, the variation of Kp values with depth is notconsidered in this study. Because in most cases samples are taken in the upper soil layer,where at least the organic matter content is relatively high (see 4.2), the Kp values which arederived in this study generally overestimate Kp values for the whole unsaturated soil profile.For practical reasons the total soil content is taken as the representative metal content in soil.As a consequence, the relevant Kp for deriving the Intervention Value for groundwater, theKp-transport, is defined as:
Kp-transport = total soil content / total pore water concentration
A different pore water concentration (e.g. the readily bioavailable fraction) and hence adifferent Kp might be used when assessing bioavailability.The derivation of Kp relationships for metals is affected by a variety of soil characteristics.Frequently mentioned factors are (Koops et al., 1998 and Otte et al. 2000b):- pH, clay content and organic matter;- redox potential, iron or aluminium oxide content;- Cation Exchange Capacity;- presence of inorganic and organic complexing agents;- presence of other metal ions;- soil moisture content;- presence of the metal in reactive or inert pools (matrix effects).
The relationship between these factors and Kp values is difficult to quantify. The reason forthis is the great number of factors involved; some of these factors are mutually dependent and

RIVM report 711701021 page 49 of 125
the influence of some factors is not univocal. Besides, it is not feasible to consider all thefactors mentioned above because of limitations in the available data sets. For the intended useof Kp values, i.e. the derivation of groundwater quality standards, there are roughly twomethods for derivation of Kp values.1. Kp value based directly on measured data (measured metal content in the soil and
the measured metal concentration in the pore water).2. Kp value based on sorption models, which describe the concentration in the pore
water as a function of the soil characteristics and, in some cases, the total metalcontent in soil.
Both options will be discussed in the next sections.
3.5.2. Kp values based on measured dataGiven the purpose of the Kp, preferentially Kp sets based on total metal content and totalmetal pore water concentration is considered. Furthermore, a choice has to be made on howto convert the measured data to a representative Kp, e.g. selecting the most relevant measuredmetal content in the soil and the most relevant measured metal concentration in the porewater, or calculating a geometric mean or the median value of (part of) the data set.In this section four Kp data sets were evaluated:1. The Van den Berg-Roels set (Van den Berg and Roels, 1991) is based on both measured
and calculated Kp values. The calculated Kp values are, for example, estimated fromempirical bioconcentration factors (Baes et al., 1984). Koops et al. (1998) gives a detailedsurvey of this data set. The resulting Kp values are the geometric means of the collecteddata and have been used for the derivation of the first series of Intervention Values forgroundwater (Van den Berg and Roels, 1991).
2. The Bockting set (Bockting et al., 1992) has been used to derive the ecotoxicologicalMaximum Permissible Concentrations and Negligible Concentrations for metals(Crommentuijn et al., 1997). The set is based on batch experiments from Buchter et al.(1989) and King (1988). For some metals the Kp values were based on Kp values forother metals complemented with additional data. This accounts for barium (assumedsimilarity with Kp for calcium), cobalt (additional data) and tin (assumed similarity withKp for lead).
3. The recently published Kp values of Sauvé (2000) are based on an extended literaturereview on partition coefficients. Over 70 different studies were considered for this study.The Kp values are compiled with a similar purpose, i.e. derivation of Kp values requiredfor risk assessment models as well as the evaluation of the dependency of Kp values onmetal content and soil characteristics. The study is based on total soil metal content andtotal metal pore water concentration of a wide geographical variety of in-situcontaminated soils. The reported Kp values are the medians.
4. The PGBO4 data set was compiled on the basis of a field-based data set (Otte et al.,2000b). This data set is the combined set of the Van den Hoop data set (Van den Hoop,1995), the Janssen data set (Janssen et al., 1996 and 1997) and the National SoilMonitoring Network (LMB) data set (Lagas et al., 1996) concerning data on metalsorption and soil characteristics. The given Kp values are the geometric means of thecollected data, but only data from soils with a metal content higher than the Target Valuewere used.
4 PGBO refers to the governmental programme Programme on Integrated Soil Management).

page 50 of 125 RIVM report 711701021
Table 3.13 tabulates the Kp values resulting from the four data sets.
Table 3.13: Kp values (l/kg) computed from four data sets (see text for references)Metal Van den Berg-Roels
set (currently used)Bockting set Sauvé Kp values PGBO set
As 980 191 1800 -Ba 60 60 2500 -Cd 190 200 390 3200Cr 14400 110 4800 -Co 120 40 - -Cu 540 977 2120 2400Hg 3300 170 7500 -Pb 2380 1905 102000 62700Mo 20 871 40 -Ni 560 120 2330 -Zn 250 158 1730 6800
The differences between the four data sets reflect the wide variability of partition coefficients.In general, the Kp values from the Bockting set (except molybdenum) and from the Van denBerg-Roels set (except chromium and molybdenum) are considerably lower than the Kpvalues calculated from the PGBO set and the Kp values reported by Sauvé et al. (2000).Possible reasons are: (1) only the data of Sauvé and PGBO are exclusively field data on in-situ contaminated soils, (2) the data set of Bockting is derived from batch experiments and (3)the underlying data of Van den Berg-Roels comprise a mixture of experimental andcalculated Kp values. Moreover, none of the a fore-mentioned soil characteristics areconsidered. This defect increases the differences between the four data sets, and arelationship of the computed Kp values (Table 3.13) with the standard soil (see section 4.2)does not exist.
3.5.3. Kp values based on sorption modelsAs mentioned in the introduction, Kp values are affected by several soil parameters. It isgenerally recognised that soil pH, clay content and organic matter content have a large effecton metal concentration in the pore water and hence on Kp values. Besides, these parametersare relatively easy to measure. For this reason, sorption models based on one or more of theseparameters can be used to predict the metal content in soil and are suitable for application. Toimprove sorption models, other soil parameters like aluminium or iron oxide content could beadded to the model. However, this might hamper practical application in the field. In thisstudy only the models with ‘the easy available’ characteristics, i.e. soil pH, clay content andorganic matter, are considered. As a consequence, the models of Elzinga et al. (1996), forexample, are left out of the evaluation of sorption models, although these models (for Cd, Cuand Zn) are based on an enormous number of data and attention has been focused on totalpore water concentration.
Two sorption models for calculating Kp values are considered in this section:• Models which assume a relation between the Kp and soil parameters (‘Kp models’):
log Kp = a + b * pH + c log [%OM] + d log [ %L]%OM = percentage of organic matter%L = percentage of lutum
The sorption models considered in this study are the combined Van den Hoop-Janssenmodels and the Kp models based on the PGBO data set.

RIVM report 711701021 page 51 of 125
• Models that describe the concentration in the pore water as a function of total content inthe soil and soil characteristics. In this study Freundlich sorption models are considered(‘Freundlich models’).
Kp Models from Van den Hoop-JanssenTable 3.14 tabulates the Kp models based on the combined Van den Hoop-Janssen set(Janssen et al., 1996). The Kp model for arsenic is missing, because this model is mainlybased on the Fe(hydr)oxide content.
Table 3.14: Kp models based on Van den Hoop-Janssen set, R2 and number of soils (N)Metal Kp model R2 NCd Log Kp = -0.43 + 0.48 pH + 0.71 log (%OM) 0.70 31Cr log Kp = 2.64 + 0.21pH 0.54 19Cu log Kp = 0.38 + 0.36 pH 0.49 33Ni log Kp = 1.00 + 0.25 pH + 0.57 log (%L) 0.74 32Pb log Kp = 2.05 + 0.35 pH 0.60 32Zn Log Kp = -0.26 + 0.45 pH + 0.60 log (%L) 0.85 33
details of the used data setpH: pH after 0.01 M CaCl2 (average = 5.35)%L: clay content (%) (average = 16.1)%OM: organic matter content (%) (average = 9.06)
Kp models based on the PGBO data setA similar Kp model was fitted using the PGBO data set (Otte et al., 2000b), starting withelimination of the Kp data on total metal content below Target Value. The resulting Kpmodels are listed in Table 3.15.
Table 3.15: Kp models based on PGBO set, R2 and number of soils (N)median
concentrationKp model
mg/kg R2 NCd 6.8 log Kp = 0.30 + 0.36 pH + 0.41 log (%L) + 0.52 log %OC 0.60 41Cu 104 log Kp = 0.62 + 0.31 pH + 0.73 log %OC 0.39 34Pb 320 log Kp = 0.83 + 0.46 pH + 0.71 log (%L) 0.66 37Zn 750 log Kp = -2.05 + 0.62 pH + 1.34 log (%L) – 0.18 log %OC 0.82 44%OC: organic carbon (= 0.58 * % organic matter)
Freundlich sorption modelThe Freundlich sorption model predicts the total concentration in the pore water as a functionof pH, organic matter, clay and total metal content. As a consequence, Kp values can bederived for the optimal metal soil content and most relevant soil characteristics. Total porewater concentration has been derived with a model in the following form:
log [C-pw] = a + b*log( Q ) + c*pH + d*log ( %clay) + e*log (%OM)
log[C-pw]: metal concentration in pore water (mg/l)log (Q): total metal content soil (mg/kg d.m.)
Models were derived for seven metals within the subproject ‘Metal accumulation in plants’(Versluijs et al., in prep.). These are based on the Van den Hoop-Janssen data set. Therelation with the total metal content facilitates the derivation of Kp values at the optimal
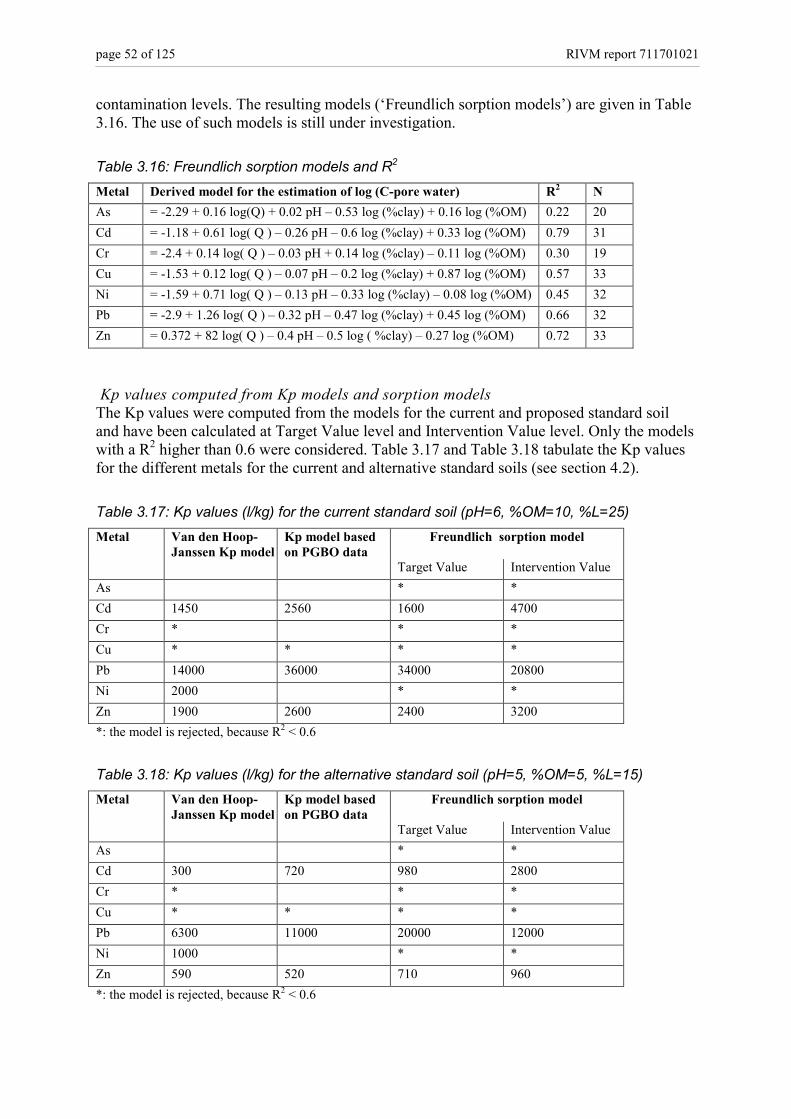
page 52 of 125 RIVM report 711701021
contamination levels. The resulting models (‘Freundlich sorption models’) are given in Table3.16. The use of such models is still under investigation.
Table 3.16: Freundlich sorption models and R2
Metal Derived model for the estimation of log (C-pore water) R2 NAs = -2.29 + 0.16 log(Q) + 0.02 pH – 0.53 log (%clay) + 0.16 log (%OM) 0.22 20Cd = -1.18 + 0.61 log( Q ) – 0.26 pH – 0.6 log (%clay) + 0.33 log (%OM) 0.79 31Cr = -2.4 + 0.14 log( Q ) – 0.03 pH + 0.14 log (%clay) – 0.11 log (%OM) 0.30 19Cu = -1.53 + 0.12 log( Q ) – 0.07 pH – 0.2 log (%clay) + 0.87 log (%OM) 0.57 33Ni = -1.59 + 0.71 log( Q ) – 0.13 pH – 0.33 log (%clay) – 0.08 log (%OM) 0.45 32Pb = -2.9 + 1.26 log( Q ) – 0.32 pH – 0.47 log (%clay) + 0.45 log (%OM) 0.66 32Zn = 0.372 + 82 log( Q ) – 0.4 pH – 0.5 log ( %clay) – 0.27 log (%OM) 0.72 33
Kp values computed from Kp models and sorption modelsThe Kp values were computed from the models for the current and proposed standard soiland have been calculated at Target Value level and Intervention Value level. Only the modelswith a R2 higher than 0.6 were considered. Table 3.17 and Table 3.18 tabulate the Kp valuesfor the different metals for the current and alternative standard soils (see section 4.2).
Table 3.17: Kp values (l/kg) for the current standard soil (pH=6, %OM=10, %L=25)Metal Van den Hoop-
Janssen Kp modelKp model basedon PGBO data
Freundlich sorption model
Target Value Intervention ValueAs * *Cd 1450 2560 1600 4700Cr * * *Cu * * * *Pb 14000 36000 34000 20800Ni 2000 * *Zn 1900 2600 2400 3200*: the model is rejected, because R2 < 0.6
Table 3.18: Kp values (l/kg) for the alternative standard soil (pH=5, %OM=5, %L=15)Metal Van den Hoop-
Janssen Kp modelKp model basedon PGBO data
Freundlich sorption model
Target Value Intervention ValueAs * *Cd 300 720 980 2800Cr * * *Cu * * * *Pb 6300 11000 20000 12000Ni 1000 * *Zn 590 520 710 960*: the model is rejected, because R2 < 0.6

RIVM report 711701021 page 53 of 125
3.5.4. Selection of Kp valuesKoops et al. (1998) already evaluated the sets of Bockting and Van den Berg-Roels. Koopsconcluded that the Van den Berg-Roels Kp set demonstrated a high level of consistency withother Kp sets and was widely accepted. A demerit of the set is its vague fundament and thelack of relevancy for Dutch soils. The Kp set from Bockting et al. (1992) was notrecommended because of the vague fundament, weak consistency with other sets and lack ofrelevancy for Dutch soils. The Van den Hoop-Janssen Kp sorption models are recommendedby Koops et al. (1998) as an alternative for the present Kp values. The authors concluded theresulting Kp values to be thoroughly founded and consistent with other Kp values. The Kp setdoes not account for the degree of contamination. However, no strong variation of the Kpvalue with total metal content was registered.
The resulting Kp values are judged on the basis of the following criteria (in decreasing orderof importance):• Quality of the data set or sorption models, based on:i) the number of underlying data,ii) R2 andiii) the type of data:
Preferentially, the total metal content and total pore water concentration are taken intoaccount (criteria ‘type of data’) and in the case of the R2 of the sorption models beinginferior to 0.6, the model is rejected.
• Metal content: the ideal data set would have been compiled with the metal content at alevel at which application of Intervention Values takes place, i.e. around and above theIntervention Value.
• Compatibility with Dutch soils: preferentially, experiments on Dutch soils are taken intoconsideration. It is also advantageous if the partition coefficients are appropriate for theaverage soil characteristics (standard soil), which could be achieved if organic mattercontent, clay content, pH, etc. are variables as in the case of the Kp and sorption models.
• Experimental set-up: although under discussion, field data are preferred over laboratoryexperiments.
• Status: Kp values in use are preferred to alternative Kp values
Table 3.19 tabulates the scoring on the above-mentioned criteria. The resulting ranking (frombest to worst options) is given in the outermost left column of the table. The scores (- = poor,0 = average, + = good, ++ = very good) are based on the following analysis:• Quality of the data set. The Sauvé set contrasts with the other options for the large
number of soils and data that have been incorporated (++). The Van den Berg andBockting set contrasts with the other sets because of the arbitrary selection of data (-).
• Metal content. Most options are based on metal content between Target and InterventionValues (+). The Bockting set is based on metal content that is substantially above, up toseveral orders of magnitudes, than the Intervention Value (-). No information is found onthe metal content of the Van den Berg and Roels and the Sauvé sets.
• Compatibility with Dutch soils. Most options are based on samples taken from Dutchsoils (+). Besides, for all Kp and sorption models the Kp can be made compatible withaverage Dutch soil characteristics (++). The Van den Berg-Roels, Bockting and Sauvésets are based mainly on foreign soil types, but not on exotic soil types (0).
• Experimental set-up. Apart from the Van den Berg and Bockting set (-) the options arebased on field experiments (+).

page 54 of 125 RIVM report 711701021
• Status. The Van den Berg and Roels data Kp values and the Bockting Kp values are usedfor the derivation of the Intervention Values for groundwater of the first series and for thederivation of the ecotoxicological Maximum Permissible Concentrations and NegligibleConcentrations, respectively (+). The Freundlich sorption model has not yet beenpublished (-).
Table 3.19: Criteria for judgement of Kp values (- = poor, 0 = average, + = good, ++ = verygood) and ranking (1 = best option; 7 = worst option)
Quality Metalcontent
Compati-bility withDutch soils
Experi-mental set-
up
Status Ranking
Van den Berg-Roels set - ? 0 - + 6Bockting set - - 0 - + 7Sauvé set ++ ? 0 + 0 4PGBO set + + + + 0 5Van den Hoop-Janssen Kp + + ++ + 0 2Kp model based on PGBO data + + ++ + 0 1Van den Hoop-JanssenFreundlich model
+ + ++ + - 3
Table 3.20 tabulates the revised Kp values for current standard soil (pH 6, OM 10% and clay25%), the alternative standard soil (pH 5, OM 5% and clay 15%). Besides, the current Kpvalues are incorporated in the table. Although the scores of the PGBO and Van den Hoop-Janssen Kp models are equal, first priority is given to the Kp values based on the PGBO Kpmodel, because this model is of more recent date and more data have been taken intoconsideration. However, reliable models are only found for cadmium, lead en zinc. The Kpvalue for nickel is taken from the second option, i.e. Van den Hoop-Janssen Kp model. Theremaining Kp values are taken from the fourth option (the third option, i.e. the Van denHoop-Janssen Freundlich model, does not give reliable relations for the remaining metals),i.e. the Sauvé data set.Table 3.20: Kp values (l/kg) and references
Metal Reference revised Kp revised Kp current CSOIL Kp(pH 6, OM 10%,
clay 25%)(pH 5, OM 5%,
clay 15%)As Sauvé et al., 2000 1800 1800 980Ba Sauvé et al., 2000 2500 2500 60Cd PGBO Kp model, this report 2560 720 190Cr Sauvé et al., 2000 4800 4800 14400Co Van den Berg and Roels, 1991 120 120 120Cu Sauvé et al., 2000 2120 2120 540Hg Sauvé et al., 2000 7500 7500 3300Pb PGBO Kp model, this report 36000 11000 2380Mo Sauvé et al., 2000 40 40 20Ni Van den Hoop-Janssen, 1996 2000 1000 560Zn PGBO Kp model, this report 2600 520 250

RIVM report 711701021 page 55 of 125
From Table 3.20 it can be concluded that, with the exception of the Kp values for chromiumand cobalt, revised Kp values are generally higher than the current Kp values. This varies forthe alternative standard soil from a factor of 2 for molybdenum up to a factor of 40 forbarium. The Kp values for cadmium, lead, nickel and zinc are influenced by the choice of thestandard soil.
3.6. Permeation coefficient (Pe)Van den Berg (1997) gave a justification of the derived permeation coefficients based onreports of Vonk (1985) and van der Heijden and Hofman (1987), together with a detaileddescription of the interpretation of data. An additional evaluation of the permeationcoefficient was not considered necessary (see 2.1.10) The selected values were accordinglyreported by Van den Berg (1997). Based on this report, the permeation coefficients of phenol,tetrachloroethene, monochlorophenols, trichlorophenols and PCBs were adjusted. The Pe foraliphatic TPH fractions were estimated from the Pe values of hexane, heptane, octane andnonane while the Pe for aromatic TPH fractions were considered comparable with the Pe ofbenzene. The Pe values of dioxins were taken from Van den Berg, 1994. Forchlorodibenzofurans, the Pe values of dioxins were selected.
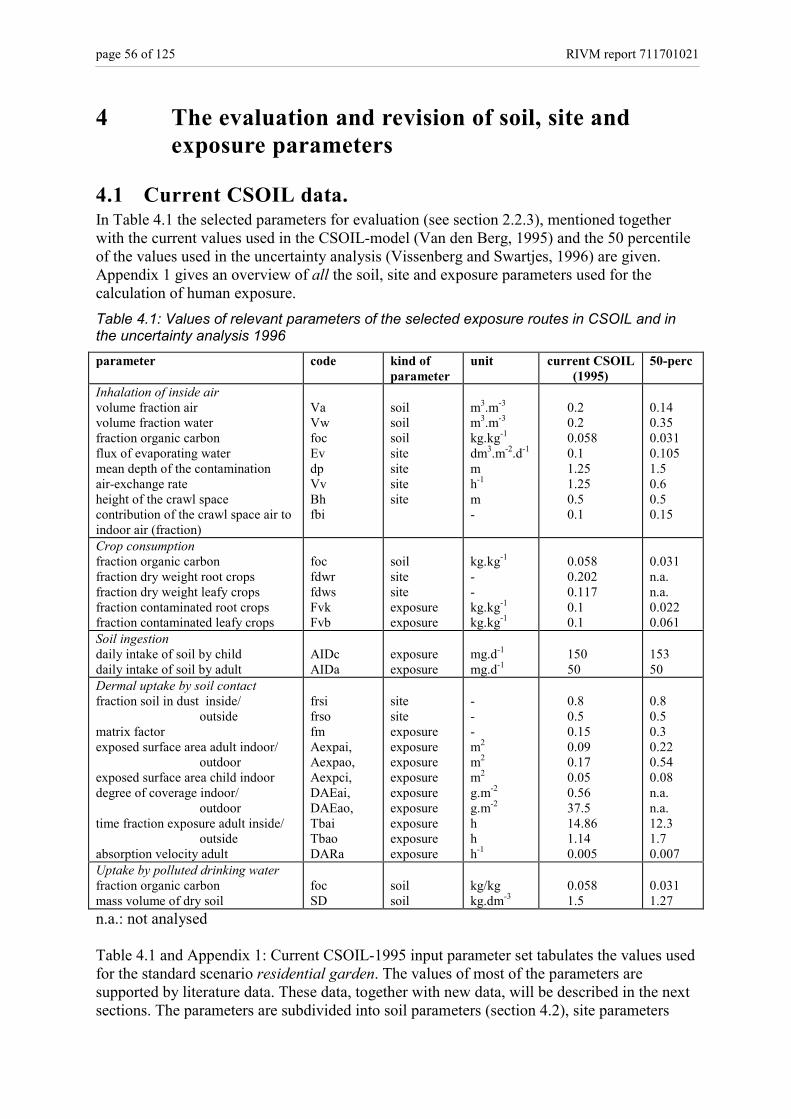
page 56 of 125 RIVM report 711701021
4 The evaluation and revision of soil, site andexposure parameters
4.1 Current CSOIL data.In Table 4.1 the selected parameters for evaluation (see section 2.2.3), mentioned togetherwith the current values used in the CSOIL-model (Van den Berg, 1995) and the 50 percentileof the values used in the uncertainty analysis (Vissenberg and Swartjes, 1996) are given.Appendix 1 gives an overview of all the soil, site and exposure parameters used for thecalculation of human exposure.Table 4.1: Values of relevant parameters of the selected exposure routes in CSOIL and inthe uncertainty analysis 1996parameter code kind of
parameterunit current CSOIL
(1995)50-perc
Inhalation of inside airvolume fraction airvolume fraction waterfraction organic carbonflux of evaporating watermean depth of the contaminationair-exchange rateheight of the crawl spacecontribution of the crawl space air toindoor air (fraction)
VaVwfocEvdpVvBhfbi
soilsoilsoilsitesitesitesite
m3.m-3
m3.m-3
kg.kg-1
dm3.m-2.d-1
mh-1
m-
0.20.20.0580.11.251.250.50.1
0.140.350.0310.1051.50.60.50.15
Crop consumptionfraction organic carbonfraction dry weight root cropsfraction dry weight leafy cropsfraction contaminated root cropsfraction contaminated leafy crops
focfdwrfdwsFvkFvb
soilsitesiteexposureexposure
kg.kg-1
--kg.kg-1
kg.kg-1
0.0580.2020.1170.10.1
0.031n.a.n.a.0.0220.061
Soil ingestiondaily intake of soil by childdaily intake of soil by adult
AIDcAIDa
exposureexposure
mg.d-1
mg.d-115050
15350
Dermal uptake by soil contactfraction soil in dust inside/
outsidematrix factorexposed surface area adult indoor/
outdoorexposed surface area child indoordegree of coverage indoor/
outdoortime fraction exposure adult inside/
outsideabsorption velocity adult
frsifrsofmAexpai,Aexpao,Aexpci,DAEai,DAEao,TbaiTbaoDARa
sitesiteexposureexposureexposureexposureexposureexposureexposureexposureexposure
---m2
m2
m2
g.m-2
g.m-2
hhh-1
0.80.50.150.090.170.050.5637.514.861.140.005
0.80.50.30.220.540.08n.a.n.a.12.31.70.007
Uptake by polluted drinking waterfraction organic carbonmass volume of dry soil
focSD
soilsoil
kg/kgkg.dm-3
0.0581.5
0.0311.27
n.a.: not analysed
Table 4.1 and Appendix 1: Current CSOIL-1995 input parameter set tabulates the values usedfor the standard scenario residential garden. The values of most of the parameters aresupported by literature data. These data, together with new data, will be described in the nextsections. The parameters are subdivided into soil parameters (section 4.2), site parameters

RIVM report 711701021 page 57 of 125
(section 4.3), parameters describing the crop consumption (section 4.4), parametersdescribing soil ingestion (section 4.5) and parameters on the dermal exposure to soil route(section 4.6).
4.2 Soil parameters4.2.1 Soil characteristics within the CSOIL modelSome soil characteristics have a direct effect on the Intervention Value for soil, because theyare used in the calculation of human exposure using the CSOIL model and/or for thenormalisation of ecotoxicological effect data. Besides, soil characteristics are used forcorrection of the Intervention Values for a standard soil for bioavailability when used in thepractice of soil and groundwater quality assessment. At the moment this correction isperformed on the basis of ‘easy available’ soil characteristics, i.e. organic matter content andclay.To identify the soil characteristics two different approaches could be followed. In the firstapproach an average value for Dutch soils could be derived for each soil characteristic. As aresult the combination of soil characteristics might represent a hypothetical, i.e. non-existentsoil type. In the second approach the soil characteristics are extracted from a representativesoil type in the Netherlands. This implies that in the first approach the soil characteristics arerepresentative, and in the second approach the soil type is representative.According to the second approach, two major soil types are found in the Netherlands, i.e.sandy soils (45%) and clay soils (42%)(see Table 4.1). Because it does not seem valid toignore one of these major soil types, a combination of soil characteristics of sandy and claysoils could be arranged, as an alternative ‘representative soil type’, resulting in a hypotheticalsoil type. If this alternative version of the second approach is followed, the differencebetween the two approaches diminishes: in the first approach soil characteristics of all Dutchsoil types are incorporated and in the second approach the contribution of peat soils (11%)and the loess soils (2%) is ignored. In this study the first approach is worked out, in which asurface-area weighted-average value for each soil characteristic is derived. The reason is thatinformation on the whole area of application of Intervention Values (i.e. the Netherlands) isused and that there are no strong arguments against application of a hypothetical soil type.
Besides, the result would be similar if thesecond approach was followed (a combinationof sandy and clay soils), because the surface-area contribution of peat and loess soils islimited.
Figure 4.1 Soil types in the Netherlands.

page 58 of 125 RIVM report 711701021
4.2.2 Pore, pore water, and pore air fraction.The pore water fraction and the pore air fraction are complementary and combined equallywith the pore fraction. Is has been assumed that accumulation of compounds by crops andadverse effects on ecosystems are related to the concentration in the pore water rather than tothe total content in soil. However, in the procedure used to derive the Intervention Value thedistribution of compounds over the solid and the liquid phases is calculated on the basis ofequilibrium, independent of the pore-water fraction. This implies that the pore-water fractiondoes not affect the concentration in the pore water and, as a consequence, does not affectexposure or acceptable ecotoxicological risk limits. For the same reason, the concentration inpore air is independent of the pore-air fraction. However, human exposure increases with ahigher pore-air fraction because diffusion takes place over a larger surface area, and so isonly relevant for volatile organic compounds.Identification of a representative value for the different fractions is hampered by spatialvariability due to climatic dynamics. The situation at pF = 3 is proposed as a representativestate for soil moisture. Based on pore water fractions at pF = 3 of 0.05 for sand, 0.50 for clayand 0.40 for peat (Koorevaar et al., 1983) a surface- area-weighted average value of 0.29 canbe calculated for the pore water fraction. Ranges for pore fractions for different soil types arealso given in Koorevaar et al. (1983): 0.35-0.60 for sand, 0.30-0.70 for clay and 0.80-0.85 forpeat soils. A surface-area-weighted average value of the pore fraction of 0.51 can becalculated on the basis of average values for the pore fractions for each soil type. A value of0.22, resulting as the difference between representative pore fraction and pore-water fraction,can be assumed as the representative, i.e. surface-area-weighted average value of the pore-airfraction.• The representative surface-area-weighted average pore water fraction is determined at
0.3 and the corresponding pore air fraction at 0.2.
4.2.3 Dry bulk density of the standard soilOn the basis of the fugacity theory (Mackay and Paterson, 1981), the mass fractions of thethree soil phases are calculated using the density of the solid phase as one of the parameters.A higher density results in higher human exposure to organic compounds. However, thecalculation of human exposure is not very sensitive to the density of the solid phase.Koorevaar et al., 1983 give the following dry bulk densities of the solid phase: for sand 1600kg/m3, for clay 1100 kg/m3 and for peat 250 kg/m3. A surface- area-weighted averagerepresentative dry bulk density of the solid phase of 1210 kg/m3 can be calculated.• The representative value for dry bulk density is determined at 1210 kg/m3 .
4.2.4 Organic matter contentOrganic matter is a well-known sorbing agent in soils for metals as well as for organiccompounds. As a consequence, the available contaminant fraction in the pore water decreaseswith higher organic matter. And reduction of the available fraction implies reducedcontaminant accumulation by crops (which means lesser exposure) and, in general, a decreasein adverse ecological effects. It should be noted that some organisms are (also) exposedthrough consumption of contaminated particles in soils, in which case adverse effects areindependent of the available fraction. Because contaminant concentration in pore air iscorrelated to contaminant concentration in pore water, indoor air concentration (and exposuredue to inhalation of contaminated air) also decreases with increasing organic matter content.Calculation of human exposure and determination of adverse ecological risk limits haveproven to be very sensitive to the organic matter content.
RIVM report 711701021 page 59 of 125
A practical problem is that the influence of organic matter on the available metal fraction isdependent on the type of organic matter and other soil characteristics. Herms and Bruemmer(1980, 1984), for instance, observe an increase of the available fraction of copper and lead inthe pore water with increasing organic matter content, particularly with high pH and underreduced redox conditions. In this case the organic matter is available as Dissolved OrganicCarbon (DOC), which tends to form soluble metal-organic ligands. This mobilising influenceof organic matter is difficult to quantify and can at best be assessed in the stage when theactual i.e. site-specific risks, are determined.In CSOIL, the organic matter content is used to determine the partition coefficient for organiccompounds (=Koc * fraction organic matter, see section 2.1.6.), which controls thedistribution of these organic compounds over the solid and the pore water phases. Besides,ecotoxicological effect data for organic compounds are normalised on the basis of the organicmatter content.The organic matter content varies from almost 0 for some sandy soils up to 90% for peatsoils. A value of 4.5 % is proposed as being representative for the organic matter content.This is the average value for 39 soil samples from five different soil types in the Netherlands,taken in a depth range of 0-15 cm under arable land, grassland and forest (De Vries, 1994).Figure 4.2 (page 62) gives the cumulative frequency distribution of the organic mattercontent. Note that the organic matter content generally greatly decreases with depth, whichmeans that these values overestimate the organic matter content for deeper soil layers.• An organic matter content of 4.5 % (organic carbon 2.61 %) is determined as being a
representative value for Dutch soil.
4.2.5 Clay contentClay particles also act as strong sorbing agents in soil for metals. Sorption of organiccompounds, however, is hardly influenced by the presence of clay particles. The clay contentdoes not influence calculated exposure, because this parameter is not incorporated in theCSOIL model. However, the clay content is used for normalising ecotoxicological effect dataand for the bioavailability correction of the Intervention Value for metals. As a result theIntervention Value of metals is quite sensitive to the clay content.The clay content shows huge geographical variation and is, of course, strongly dependent onsoil type. In the Soil Map of the Netherlands (De Vries, 1994) values of 2% (sandy soil) and50% (clay soil) are given as the extreme average values for the different soil units. From thissoil map the following average clay contents could be derived for the different soil types:27% for clay soils (150 sea clay soils and 100 river clay soils); 5,4% for sandy soils (175observations) and 35% for peat soils (58 observations). From these data a surface-area-weighted average representative value for the clay content of 16% is calculated. Figure 4.2gives the cumulative frequency distribution of the clay content.• Clay content of 16% is determined as a surface- area-weighted average representative
value for Dutch soil.
4.2.6 pH (KCl)Because hydrogen ions act as competitors for the available sorption sites, the metalconcentration in the pore water increases with lower pH values. As a consequence,accumulation of metals by crops (and hence: human exposure through crop consumption) andadverse effects on ecosystems due to metal accumulation also increase with lower pH values.The pH is generally recognised as a very influential parameter for availability of metals.The pH is used in the current CSOIL model, but only for calculating the dissociated fraction.The pore-water concentration of metals is calculated on the basis of a constant, i.e.independent of pH value or partition coefficient. However, the pH could be used for
page 60 of 125 RIVM report 711701021
normalising ecotoxicological effect data and for the bioavailability correction of theIntervention Value for metals. In this case the Intervention Value of metals could be verysensitive to the pH. Attention should be paid to the fact that soil pH is currently (see sections3.4 and 3.5) considered for the derivation of bioconcentration factor for metal accumulationby crops and for the derivation of soil-water partition coefficients for metals.The pH is determined by the soil material, soil use and anthropogenic activities. The averagepH values for the different soil units varies from 3.2 for sandy soils under forest up to 7.4 forclay soil under arable land (De Vries, 1994). Compared with other soil characteristics the pHin the soil is relatively dynamic. As representative value for the pH (KCl) a value of 5.2 isproposed. This is the average value for 39 soil samples from five different soil types in theNetherlands, taken in a depth range of 0-15 cm under arable land, grassland and forest (DeVries, 1994). Figure 4.2 gives the cumulative frequency distribution of the pH (KCl). Notethat the majority of the soil types considered concern agricultural soils, which implies thatthese soils are influenced by agricultural activity (liming). If only undisturbed forest soils hadbeen considered an average pH of 4.0 would result. However, forest soils are notrepresentative for most contaminated sites in the Netherlands.• A soil pH of 5.2 is determined as a representative value for Dutch soil.
4.2.7 RésuméThe soil characteristics that have a direct effect on the Intervention Value for soil are pore,pore-water and pore-air fractions, density of the solid phase and organic matter content. Theyare used in the calculation of human exposure and/or for the normalisation ofecotoxicological effect data.The organic matter and clay content are used for the soil-type correction of the InterventionValues (derived for standard soil). At the moment the use of the soil pH for site-specificassessment is under discussion.In Table 4.2 the representative values of the soil characteristics have been summarised. Thecurrent values (Van den Berg, 1995), the ranges of the soil characteristics on the basis of‘frequently found soils in the Netherlands’ and proposed values are given (in bold).

RIVM report 711701021 page 61 of 125
Table 4.2: Soil characteristics: present values, range on the basis of ‘frequently found soils inthe Netherlands’, representative values and proposed value (bold)Soil characteristic Present
valueRange Representative
valueProposedvalue
Pore fraction (-) 0.4 0.35 (sand) - 0.85 (peat) 0.51 0.5
Pore-water fraction (-) 0.2 0.05 (sand) - 0.50 (clay) 0.29 0.3
Pore-air fraction (-) 0.2 - 0.22 0.2
Density soil phase (kg/m3) 1500 250 (peat) – 1600 (sand) 1210 1200
Organic matter content (%) 10 0 (sand/clay) – 90 (peat) 4.5 5
Clay content (%) 25 2 (sand) - 50 (clay) 16 15pH (KCl) 6 3.2 (sand/forest)-
7.4 (clay/arable)5.2 5
• From Table 4.2 it is proposed to revise the CSOIL standard soil by:• increasing the pore water fraction from 0.2 to 0.3 (and the pore fraction from 0.4 to
0.5);• decreasing the organic matter content from 10% to 5%;• decreasing the dry bulk density from 1500 (kg/m3) to 1200 (kg/m3);• decreasing the pH (KCl) from 6 to 5;• decreasing the clay content from 25 % to 15 %;
Furthermore, it is proposed to maintain the value of the pore air fraction (0.2).
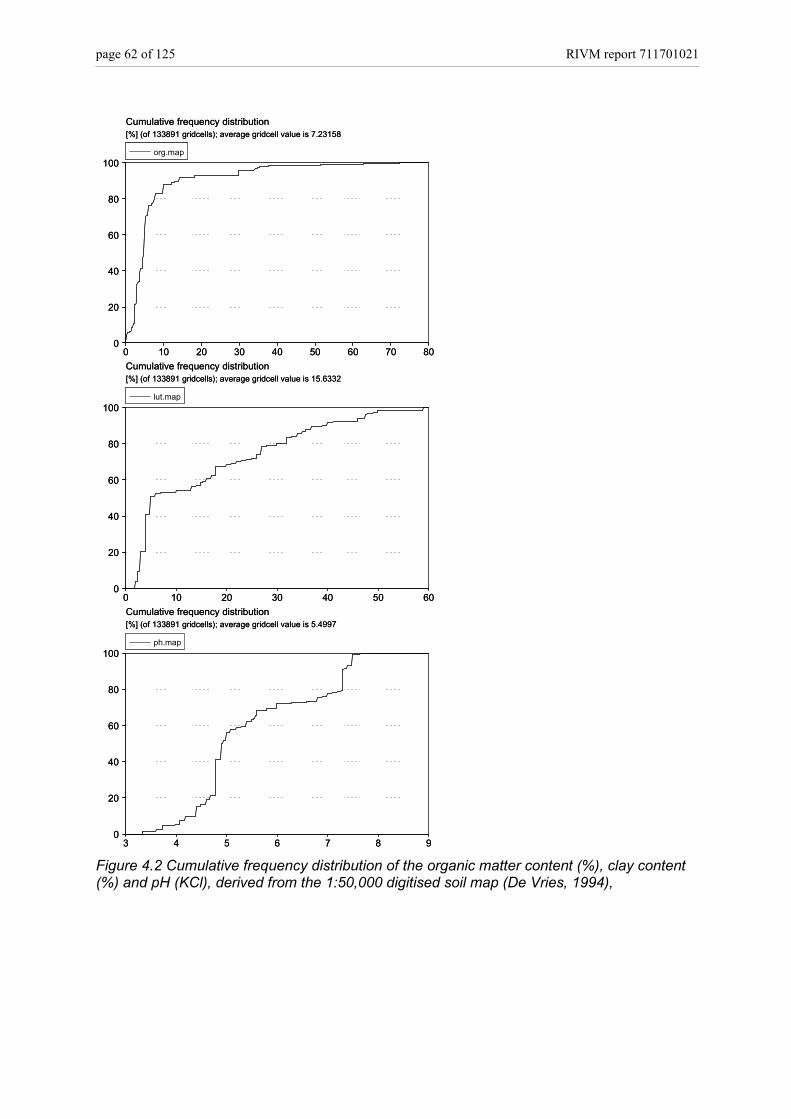
page 62 of 125 RIVM report 711701021
0 10 20 30 40 50 60 70 800
20
40
60
80
100org.map
Cumulative frequency distribution[%] (of 133891 gridcells); average gridcell value is 7.23158
0 10 20 30 40 50 60 70 800
20
40
60
80
100org.map
Cumulative frequency distribution[%] (of 133891 gridcells); average gridcell value is 7.23158
0 10 20 30 40 50 600
20
40
60
80
100lut.map
Cumulative frequency distribution[%] (of 133891 gridcells); average gridcell value is 15.6332
0 10 20 30 40 50 600
20
40
60
80
100lut.map
Cumulative frequency distribution[%] (of 133891 gridcells); average gridcell value is 15.6332
3 4 5 6 7 8 90
20
40
60
80
100ph.map
Cumulative frequency distribution[%] (of 133891 gridcells); average gridcell value is 5.4997
3 4 5 6 7 8 90
20
40
60
80
100ph.map
Cumulative frequency distribution[%] (of 133891 gridcells); average gridcell value is 5.4997
Figure 4.2 Cumulative frequency distribution of the organic matter content (%), clay content(%) and pH (KCl), derived from the 1:50,000 digitised soil map (De Vries, 1994),

RIVM report 711701021 page 63 of 125
4.3 Site parametersThe most important site parameters used for the assessment of human exposure, and selectedfor evaluation, are given in Table 4.1. For a complete statement refer to Appendix 1. Thissection describes the evaluation of the most important parameters. Besides, two newparameters are introduced for the estimation of the convective flow, contributing to theconcentration of volatile compounds in indoor air: the pressure difference between soil andcrawl space (∆P) and the permeability of the soil (κ). The data and the selection of the valueto be used in the calculation are described in Rikken et al. (2001).
4.3.1 The flux of the evaporating water (Ev)In the evaluation of the model concept it is proposed to exclude the evaporation flux in thecalculation of the indoor air concentration (Rikken et al., 2001). Therefore this parameter hasnot been evaluated. In the uncertainty analysis (Vissenberg and Swartjes, 1996) thisparameter has a log- distribution between 0.05 and 0.25 (50-perc. 0.105 dm3/m2 per day).• It is proposed to remove the evaporation flux from the CSOIL model.
4.3.2 Mean depth of the contamination (dp)In the evaluation of the model concepts it is proposed to relate the mean depth of the(volatile) compound to the depth of the groundwater table. The compound may be present inthe unsaturated zone of the soil or in the groundwater. For both situations it is proposed to usethe depth of the groundwater table (dg) combined with the height of the (almost) saturatedzone, the capillary transition boundary (z) to estimate de depth of the compound (dp= dg+z)(Rikken et al., 2001). The current mean depth of the contamination in CSOIL is 1.25 m belowland surface. A range of 0.5m to 5 m demonstrated a large influence on the calculatedexposure (Vissenberg and Swartjes, 1996).
The data from the National Groundwater Monitoring Network (LMG) from 1990 till 1998were analysed to get an impression of the distribution of the groundwater depth in theNetherlands. The average height of rise for all observations is 2.09 m below land surface(STD=2.15). The 50-, 75-, and 90-percentiles of the observations are 1.60, 1.09 and 0.73 m,respectively, below land surface (see Figure 4.3).For the risk assessment it is important to know the situation in built-up areas, whichcomprises 11% of the available observations (n=1418). These data show an averagegroundwater level of 2.45 below land surface (STD=1.82). The 50-, 75-, and 90-percentilesof the observations are 1.82, 1.32 and 1.0 m, respectively, below land surface (see Figure4.3). It can be concluded that the groundwater level, in general, in built-up areas is lower thanfor all locations. Reasons for this difference can be that the ground level is raised, or that thegroundwater level was lowered or that construction is taking place on higher ground.
Besides the LMG database there is a database for monitoring the effects of the policy onnutrients. All data originate from agricultural areas, mostly in sandy regions. The average riseat these locations is 1.39 m below land surface (STD=0.59) and 50-, 75-, and 90-percentilesof 1.28, 0.99 and 0.8 m, respectively, below land surface (see Figure 4.3).

page 64 of 125 RIVM report 711701021
A third database is the OLGA database used in the National Groundwater Model (LGM) inwhich the average height of rise of the groundwater in the upper aquifer is monitored. Theaverage height of rise at these locations is 2.82 m below land surface. The 50-, 75-, and 90-percentiles are 1.52, 1.02 and 0.5 m, respectively, below land surface (see Figure 4.3).
Figure 4.3 Distribution of the depth of the groundwater based on 3 databases.
The height of the capillary transition boundary (CTB) above the groundwater tabledetermines the height above the groundwater table below which the blocking of the water-filled pores becomes relevant for diffusion (and the convective flow). For the 18 soils of theStaring series (Wösten et al., 1994) the height is calculated at between 12 and 84 cm (Waitzet al., 1996). The arithmetic mean of all soils (47 cm) is almost the same as that of sand: 50cm. It is proposed to use this generic value of 0.5 m.
• It is proposed to use the median groundwater depth. Based on the LMG database andbecause mostly built-up areas are referred to here, it is proposed to set the generic depthof the groundwater level (dg) at -1.75 m (below land surface). Combining this value withthe height of the capillary transition boundary (z) leads to a proposal for the depth of thecontaminant (dp) of -1.25 m. This means there is no need to change the current value.
4.3.3 Height of the crawl space (Bh)The height of the crawl space in CSOIL is set at 0.5 m. The depth can be very low, but willnormally not exceed 1.0 m. Therefore in the uncertainty analysis the range is set at 0.1 m to0.9 m (Vissenberg en Swartjes, 1996). A lower crawl space will lead to a smaller crawl spacevolume and to a longer soil column over which transport takes place. The effect of bothchanges (crawl space volume and soil column) on the SRChuman is in opposite directions. The
distribution depth of groundwater
-7
-6
-5
-4
-3
-2
-1
00 10 20 30 40 50 60 70 80 90 100
percentile
dept
h of
gro
undw
ater
(m b
elow
gro
und
leve
l)
LMG all locationsLMG built-up area
agriculturalOLGA-data 1991

RIVM report 711701021 page 65 of 125
conclusion is that the height of the crawl space is a moderate sensitive parameter for volatilecompounds.• The current height of the crawl space is a good estimate of the average crawl space
height. There is no reason to revise the current value.
4.3.4 Air exchange rate of the crawl space (Vv)The current air exchange rate of the crawl space in CSOIL is 1.25 h-1, based on Fast et al.(1987). In the uncertainty analysis this parameter has a large range, which is set between 0.03and 7.4 with a lognormal distribution 50-percentile of 0.6 (Vissenberg en Swartjes, 1996).From the data of Fast et al. (1987) it has become clear that this value will vary with time andlocation. The ventilation rate depends on weather conditions (e.g. wind, temperature) andproperties of the house.
The mean air exchange rate of the crawl space in 77 houses is 1.25 h-1, with a median valueof 1.0 h-1 (Fast et al., 1987; Kliest et al., 1989). The average ventilation rate of the crawlspaceof about 700 houses in a study on radon was 1.1 h-1 (STD=1.2), corresponding with 41.5m3/h. For the living room a ventilation rate of 0.9 h-1 (STD=0.7) was found (Stoop et al.,1998).
• It is proposed to use an average ventilation rate of 1.1 h-1 in the model as the airexchange rate of the crawlspace (Vv), based on both studies mentioned.
4.3.5 Contribution of the crawlspace air to indoor air (fbi)The contribution of the crawl space air to indoor air is currently 0.1, based on Fast et al.(1987). In that study the concentration of the crawlspace air to the indoor air in 77 houses wasmeasured with a tracer gas. The average contribution of the crawlspace air to the indoor airwas 10.6% with a substantial spread; the median value is 15.3 % and the 95-percentile 39 %.In the houses with a wooden and a concrete ground floor the average contribution was 19.3%and 9.6%, respectively (Fast et al., 1987). In a study on about 700 new built houses with aconcrete floor, the contribution of the crawlspace air to the indoor air was measured withtracer gas. The average contribution of the airflow from the crawlspace to the living room tothe total airflow in the living room was 7% (6 out of 85 m3/h)(Stoop et al., 1998).
• It is proposed to maintain the current value for the contribution of crawlspace air toindoor air (fbi) at 0.10, based on the measured average contribution in above- mentionedreferences and the fact that the latter reference concerns new houses with ground floorsof concrete.
4.3.6 Parameters for the description of the convective flowThree new parameters are introduced for the estimation of the convective flow contributing tothe concentration of volatile compounds in indoor air. The pressure difference between soiland crawl space (∆P), the permeability of the soil (κ) and the viscosity of the air parameterwere determined. The parameter η is a physical parameter of air, which is 18E-6 N/m2 s(Pa.s) or 5E-9 Pa.h (Chang, 1981; CRC, 1998). The data and the selection of the values to beused in the calculation are described in Rikken et al. (2001).

page 66 of 125 RIVM report 711701021
• The air permeability of soil (κ) is set at 10-11 m2 .• The pressure difference between soil and crawl space (∆P) is set at 1 Pa.• Viscosity of air (η or ETA) in Pa.h is set at 5 E-09.
4.3.7 Parameters for the description of soil resuspensionSoil and dust parts can be deposited on the plant by wind or rain. This process is called soilresuspension or rainsplash. The contribution of soil resuspension to the concentration of soilcontaminants in the plant is difficult to estimate and depends on many factors (e.g. thegeometry of the plant). Nevertheless, the contribution via this route is considered important inthe case of contaminated soils.
For organic compounds and for the aboveground plant parts, it is proposed to add a factor toaccount for soil particle resuspension. The contribution of this exposure route is provisionallyset at 1% dry soil per dry plant (Rikken et al., 2001). For metals the contribution of soilresuspension is considered to be incorporated in the Bioconcentration Factors derived.
• For organic compounds the contribution of soil resuspension to the aboveground parts ofthe plant is set at 1 % of the total soil concentration (in dry soil per dry plant).
• For metals the contribution of soil resuspension is not considered separately butincorporated in the selected Bioconcentration Factors.
4.4 Crop consumption4.4.1 Average consumption patternThe proposed bioconcentration factors for metals are calculated from plant-soil relations(section 3.4). The model developed accounts for the average consumption pattern ofvegetables and potatoes. Frequently consumed vegetables contribute more to the generic(consumption-weighted average) plant-soil metal accumulation relationship than occasionallyconsumed vegetables. The report of Versluijs and Otte (2000) gives full details about thederivation of the plant-soil metal accumulation relationship. Section 3.4 of this report givesthe details on the derivation of the proposed bioconcentration factors.For the derivation of plant-soil accumulation models 31 vegetables and potatoes wereconsidered. Table 4.3 gives the consumption pattern as used for the derivation of the genericplant-soil relationship. The crops and their respective consumption amounts are taken fromDooren-Flipsen et al. (1996, Theoretical maximum daily intake of pesticide residues in theNetherlands – A model for risk assessment). The consumption pattern, expressed in gramfresh product per day, is converted to the consumption pattern in gram dry weight per day.The figures expressed on dry weight were used for the derivation of the genericBioconcentration Factors.

RIVM report 711701021 page 67 of 125
Table 4.3: Average consumption pattern (source: Dooren-Flipsen et al., 1996)no group crop consumption water content average
consumption ing fresh per day g/100 g product g dry weight
per day0 potatoes potatoes 179.7 83.3 30.01 other plants beetroot 5.2 87.3 0.65
carrots 13.4 87.8 1.64celeriac 0.8 88.0 0.09turnip 0.8 91.9 0.07radish 0.4 94.8 0.02winter carrot 0.2 87.8 0.02
2 bulbous plants onions 17.0 90.8 1.56leek 12.9 83.0 2.19
3 fruits tomatoes 26.1 94.0 1.56cucumber 8.0 96.1 0.31melon 2.2 89.7 0.23maize 1.4 76.0 0.34
4 cabbages cauliflower 16.0 92.3 1.23brussels sprouts 4.7 86.0 0.65white cabbage 7.0 95.3 0.33red cabbage 5.1 91.6 0.43oxheart cabbage 2.0 95.3 0.10curly kale 4.9 84.5 0.76broccoli 2.0 90.7 0.18
5 leaf vegetables (greens) lettuce (head) 8.5 95.4 0.39endive 7.4 93.8 0.46spinach 10.4 91.6 0.88chicory 9.2 95.3 0.43
6 legumes (peas and beans) green bean 11.7 90.3 1.13string/bush bean 3.1 90.3 0.30broad/horse/fava bean 2.5 88.9 0.28garden pea 14.8 88.9 1.64
7 beans haricot bean 0.9 77.1 0.20kidney bean 1.8 77.1 0.40
8 stem and stalk vegetables rhubarb 0.7 93.6 0.05asparagus 1.7 92.3 0.13
4.4.2 Average consumption (Qfvk, Qfvb)The average consumption of vegetables and potatoes is based on the most recent DutchNational Food Consumption Survey of 1998 (Voedingscentrum, 1998). This survey showsthe average vegetable and potato consumption for each phase of life (Figure 4.4 and Figure4.5). Based on this survey the (weighted) average lifetime consumption of vegetables wasfound at 139 g per day fresh vegetables for adults and schoolgoing children (age 7-70) and at58.3 g per day fresh vegetables for babies and pre-schoolers (age 1-6). For potatoes theaverage lifetime consumption was found at 122 g per day for adults and schoolgoing childrenand 59.5 g per day for pre-schoolers (1-6 year) (see Table 4.4).

page 68 of 125 RIVM report 711701021
0
50
100
150
200
lifetime average consumption of vegetables (in g/d)
male 54 65 78 90 105 111 122 135 176 172
female 50 64 72 78 100 94 104 131 168 164
1-4 4-7 7-10
10-13
13-16
16-19
19-22
22-50
50-65
65+
Figure 4.4 Average consumption of vegetables (g wet weight).
0
50
100
150
200
lifetime average consumption of potato (in g/d)
male 54 69 98 108 137 157 163 132 145 149
female 46 69 95 99 111 110 118 101 106 103
1-4 4-7 7-10
10-13
13-16
16-19
19-22
22-50
50-65 65+
Figure 4.5 Average consumption of potatoes (in g wet weight).
Comparing the surveys (Dooren-Flipsen, 1996, with DNFCS, 1998) we observe differencesin the total amounts of consumed potatoes and vegetables. These differences areunderstandable because the Dutch food consumption survey records in terms of prepared(cooked) actual amounts of foods eaten, with composite products included. The consumptionpattern (Table 4.3), being the basis for the generic plant-soil relationships, is based on thefresh product (at harvesting), shrink and waste to be included.Considering that the point of departure for potential risk assessment is the calculation of theaverage lifetime exposure, the determination of the consumption for vegetables and potatoesshould be according to the Dutch National Food Consumption Survey of 1998(Voedingscentrum, 1998)As the modelling of metal content in vegetables and potatoes is based on the fresh product (atharvesting), this should be determined according the food consumption pattern as presentedin Table 4.3.

RIVM report 711701021 page 69 of 125
• Table 4.4 presents the proposed average lifetime consumption for vegetables andpotatoes for the CSOIL exposure model.
Table 4.4: The proposed average lifetime consumption*) for vegetables and potatoes(source: DNFCS 1998, Voedingscentrum, 1998)
consumption of consumption ofGroup time span vegetables
g fw per daypotatoes
g fw per dayvegetables
g fw per daypotatoesg fw per
daycurrent(95) current (95) proposed proposed
babies and pre-schoolers 0-6 year 76.1 74.8 58.3 59.5adults and schoolgoingchildren5
7-70 year 157.8 136.7 139 122
*) consumption in g fresh weight per day
4.4.3 Fraction dry weight of vegetables and potatoes (fdws, fdwr)The dry matter content of vegetables and potatoes is used to express the crop metal content inmg/kg dry weight. Table 4.3 gives the water content of most vegetables according to the EPAExposure Factor Handbook (1997).
• The consumption pattern in weighted average dry weight is calculated at 13.5 g /100gfresh product (Table 4.5).
Table 4.5: Water content of vegetables, potatoes and average of all relevant cropscurrent CSOIL value (Bocktingand Van den Berg, 1992)
revised CSOIL values
data source EPA, 1997method
Ng et al.1982mean of available data weighted averagewater contentg/ 100g
dry weight(fdw) g/ 100g
water contentg/ 100g
dry weight (fdw)g/ 100g
potatoes 79.8 20.2 83.3 16.7vegetables *) 88.3 11.7 90.2 9.8weighted average - 86.5 13.5
*) fruits were not taken into account
4.4.4 Fraction contaminated crops (Fvk, Fvb)The fraction contaminated root crops (Fvk) and leafy crops (Fvb) in CSOIL are currentlyboth 0.1 for the standard scenario (residential with garden), based on Linders (1990). In thestandard scenario vegetables and potatoes are grown in residential gardens. Many peopleliving in houses with a garden do not grow consumption crops; on the other hand, there arepeople growing crops for home consumption. Besides, it is difficult to differentiate betweenan allotment garden and kitchen gardens.
According to Van de Ven-Breken (1990) the consumption from kitchen gardens in severalEuropean countries is 15 to 30 % of the national vegetable consumption. On the basis of thenumber of people owning a kitchen garden or allotment garden (Hulshof, 1988), it isestimated that about 18% (2.6 million people) of the Dutch population could eat crops fromallotment gardens.
5 About 6 % of the consumed amounts of vegetables and about 9 % of the consumed amount ofpotatoes are obtained outdoors. These amounts are not taken into account.

page 70 of 125 RIVM report 711701021
In a study using 154 households with kitchen gardens (Hulshof, 1988) the averageconsumption of vegetables and potatoes is 93 and 54 kg, respectively, per person per year (or255 and 148 g per day, respectively). This is more than the average consumption of the wholeDutch population, as given in Table 4.4. Based on the study of Hulshof (1988), the respectiveaverage consumption from one’s own garden was 51 kg and 7 kg per person per year. For allcrops this comes to 58 kg per person per year. The average consumption per person per dayand the percentage consumed vegetables and potatoes from one’s own garden is given inTable 4.6.
Taking into account that about 18% of the whole population eats 54.8 % vegetables and 13 %potatoes from their own gardens and 88 % do not eat from their own gardens, the averageconsumption of home-grown vegetables (from kitchen gardens and all others) is around 10%and for potatoes around 2.3% (Table 4.6).
Table 4.6: Consumption of home-grown crops (source Hulshof, 1988; Van de Ven-Breken,1990)
Total consumption Home-grown consumptionKitchen gardeners Kitchen gardeners All peoplekg.yr-1 g.pp-1.d-1 kg.yr-1 g.pp-1.d-1 % %
vegetables 93 254.8 51 139.7 54.8 9.9potatoes 54 147.9 7 19.2 13.0 2.3Total 147 402.7 58 158.9 39.5 7.1
Crop consumption in the Netherlands compared with other countriesTo give an impression of the differences in total crop consumption and the fractioncontaminated crops in other countries, the crop intake values for adults are compared withvalues used in models in the UK, Germany and the USA. More detailed information can befound in Rikken et al. (2001). In UMS (Germany) only the total vegetables and fruitsconsumption are defined. Besides, it must also be noted that potatoes are not considered asroot vegetables in UMS. The differences between the different models are fairly large,especially for the amounts of consumed crops from one’s own garden. The differencebetween the lowest and highest home-grown intake rate is a factor 13 for root crops and afactor 30 for leafy crops.
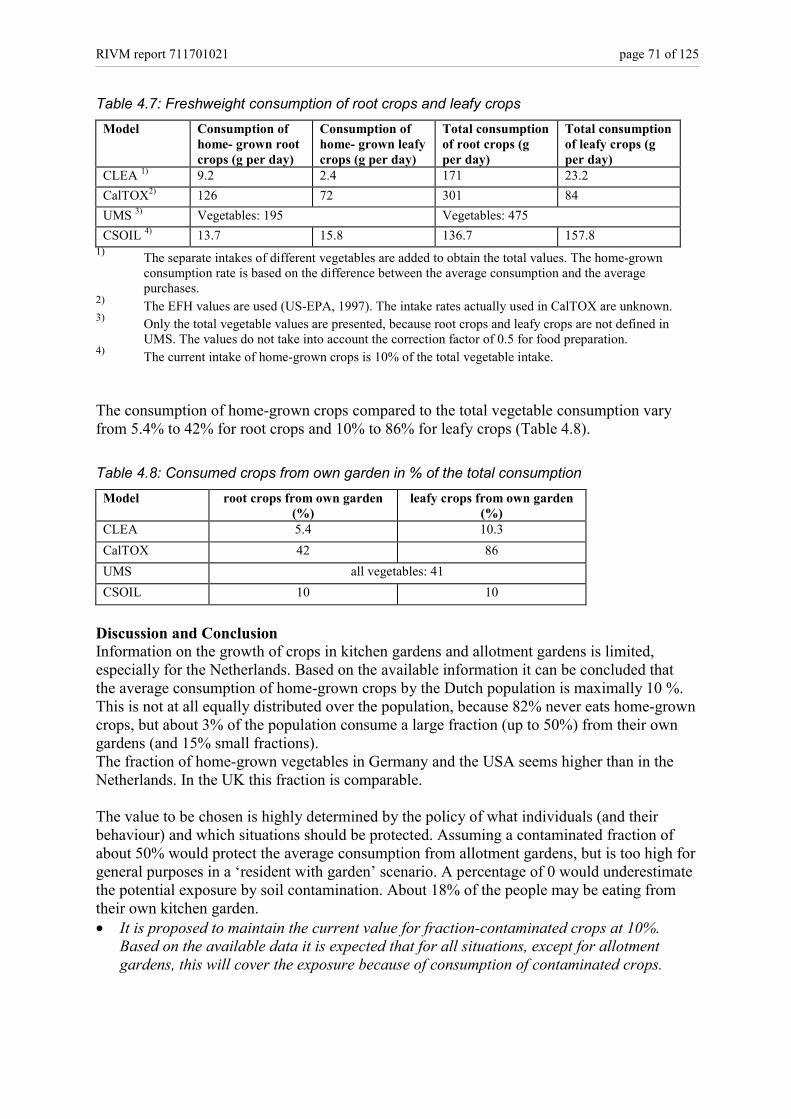
RIVM report 711701021 page 71 of 125
Table 4.7: Freshweight consumption of root crops and leafy cropsModel Consumption of
home- grown rootcrops (g per day)
Consumption ofhome- grown leafycrops (g per day)
Total consumptionof root crops (gper day)
Total consumptionof leafy crops (gper day)
CLEA 1) 9.2 2.4 171 23.2CalTOX2) 126 72 301 84UMS 3) Vegetables: 195 Vegetables: 475CSOIL 4) 13.7 15.8 136.7 157.8
1) The separate intakes of different vegetables are added to obtain the total values. The home-grownconsumption rate is based on the difference between the average consumption and the averagepurchases.
2) The EFH values are used (US-EPA, 1997). The intake rates actually used in CalTOX are unknown.3) Only the total vegetable values are presented, because root crops and leafy crops are not defined in
UMS. The values do not take into account the correction factor of 0.5 for food preparation.4) The current intake of home-grown crops is 10% of the total vegetable intake.
The consumption of home-grown crops compared to the total vegetable consumption varyfrom 5.4% to 42% for root crops and 10% to 86% for leafy crops (Table 4.8).
Table 4.8: Consumed crops from own garden in % of the total consumptionModel root crops from own garden
(%)leafy crops from own garden
(%)CLEA 5.4 10.3CalTOX 42 86UMS all vegetables: 41CSOIL 10 10
Discussion and ConclusionInformation on the growth of crops in kitchen gardens and allotment gardens is limited,especially for the Netherlands. Based on the available information it can be concluded thatthe average consumption of home-grown crops by the Dutch population is maximally 10 %.This is not at all equally distributed over the population, because 82% never eats home-growncrops, but about 3% of the population consume a large fraction (up to 50%) from their owngardens (and 15% small fractions).The fraction of home-grown vegetables in Germany and the USA seems higher than in theNetherlands. In the UK this fraction is comparable.
The value to be chosen is highly determined by the policy of what individuals (and theirbehaviour) and which situations should be protected. Assuming a contaminated fraction ofabout 50% would protect the average consumption from allotment gardens, but is too high forgeneral purposes in a ‘resident with garden’ scenario. A percentage of 0 would underestimatethe potential exposure by soil contamination. About 18% of the people may be eating fromtheir own kitchen garden.• It is proposed to maintain the current value for fraction-contaminated crops at 10%.
Based on the available data it is expected that for all situations, except for allotmentgardens, this will cover the exposure because of consumption of contaminated crops.

page 72 of 125 RIVM report 711701021
4.4.5 Deposition constantIn Rikken et al. (2001) it was concluded that the rainsplash concept (or resuspension of soilparticles) should be added to CSOIL, because soil and dust particles can deposit on thedifferent plant parts by rainsplash. In the UK, the human exposure model CLEA 30 g dry soilper kg dry plant (= 3%) for soil attached to crops is used; this is based on a mean estimatedsoil load on plants as in Sheppard and Evenden (1992). Trapp and Matthies (1995) suggests aless conservative value of 1% dry soil per dry plant. Provisionally, the contribution of thisroute has been set at 1% dry soil per kg dry plant to add to the estimated uptake of organiccompounds by plants. The empirical BCF data for metal accumulation in plants is supposedto include deposition by rainsplash.
4.5 Soil ingestion: daily intake of soil (AID)4.5.1 IntroductionImportant parameters for the exposure by soil ingestion are the daily intake of soil by children(AIDc) and the daily intake of soil by adults (AIDa, which are currently set (Van den Berg,1995) at 150 and 50 mg/d, respectively. These values are mainly based on the data of Hawley(1985), Linders (1990) and van Wijnen et al. (1990). In Hawley the exposure of youngchildren is estimated on 150 mg per day, based on an outside ingestion of 250 mg during 130days a year, and inside ingestion of 100 mg per day in winter (182 d) and 50 mg per day insummer (182 d). Linders estimates a soil ingestion of 200 mg per day during 3 days a week(0.43 x 200= 86 mg per day).First, the soil ingestion by children (1 to 6) and, second, the soil ingestion by older childrenand adults are discussed. The ingestion by older children (>7 yr.) and adults will be much lessthan for children.
4.5.2 Soil ingestion by childrenFor soil ingestion by children a difference should be made between:A. intentional (incidental) soil ingestion (in fact to be compared with data about acute
toxicity) andB. inadvertent soil ingestion during a longer period of time.
For deriving Intervention Values we focus on children aged 1 to 6; especially the youngerchildren aged 1 to 3 can have higher soil ingestion. The deliberate soil ingestion is not takeninto account in this evaluation.
Several studies have been done to estimate the ‘normal’ soil ingestion by children aged 1 to 6(Binder et al., 1986; Clausing et al., 1987; Calabrese et al., 1989; van Wijnen et al., 1990;Davis et al., 1990; Stanek and Calabrese 1995a and Stanek and Calabrese, 1995b). All thesestudies have in common that tracers have been used to estimate the amount of soil that isingested. These tracers are natural compounds occurring in soil and are analysed from thefaeces of children.
The amount of these tracers found is compared with their concentration in the soil and inhouse dust. The concentration found can originate from soil and dust, but for some tracersfood can also be an important source. Therefore the most reliable tracers had to be identified.According to Calabrese (1989) and Stanek (1995) Aluminium and Silicon (and Yttrium) arethe most reliable tracers. Beside these, the limited tracer method (LTM) is used, in which for

RIVM report 711701021 page 73 of 125
every sample the lowest of all tracers are used (Binder et al., 1986; Clausing et al., 1987; vanWijnen et al., 1990).
Stanek and Calabrese (1995a; 1995b) give new interpretations of two earlier studies (Davis etal., 1990 and Calabrese et al., 1989) and claim to have a better interpretation of theseexperimental data. Clausing (1987) and van Wijnen et al. (1990) are the only Dutch studiesand should therefore be of more importance to the Dutch situation, although large differencesbetween countries are not expected. Most studies were done in the summer period, a timewhen the soil contact probably will be more frequent than other periods of the year.There are some differences between the studies in correction for other routes of intake oftracers than soil ingestion. Van Wijnen (1990) and Clausing (1987) used measurements of anon-exposed group of children, others (Calabrese et al., 1989; Davis et al., 1990; Stanek andCalabrese, 1995a en 1995b) used measurements of the tracer content of food to make a massbalance for these elements. Binder (1986) did not make corrections and seems therefore lessaccurate.
Soil ingestion by young children can differ in time, and between children; it has a log normaldistribution (Calabrese, 1989). Deliberate soil ingestion (known as ‘pica’) occurs within asubstantial part of the children aged 1 to 3 at 1 or 2 days a year with an amount of more than1 g per day or even 10 g per day (Calabrese, 1997). Although it seems possible that for somecompounds toxicological effects could occur, this incidental exposure is not taken intoaccount in this evaluation.
The data of the eight above-mentioned references are stated in Table 4.8. When available inde reference the (arithmetic) mean, the median (50-percentile), the geometric mean, the 90-and 95-percentiles of the data are given. These data show a large difference between meanand median value. The reason for this difference is the probably log normal distribution of thedaily soil ingestion by children. The data show also that there is already a large spread in timeof the soil ingestion, between different children and per child.
The (estimated) average daily soil ingestion of all references is between 61 and 179 mg perday, taking into account the background exposure. The mean of all these values is 102 mg perday. The median values are between 26 and 88, with a mean value of 42 mg per day (seeTable 4.8) The 90-percentile of the several data sets is roughly between 150 and 200 mg perday, whereas the 95-percentile of the soil ingestion is around 200 mg per day.
Besides the tracer studies there are references in which the exposure of children (and adults)due to soil ingestion are estimated. In (US-EPA, 1997) an overview of these data is given.One of these references is the estimate according to Hawley (1985), on which the currentestimate in CSOIL is mainly based. Some of these articles are based on the evaluation ofseven earlier mentioned studies and others on the measured soil and dust on the skin ofhands, and the hand-mouth behaviour of children. These studies are considered to be asupplementary to the quantitative data in the other references. Simon (1998) gives a fairlycomplete overview of the data on soil ingestion, but no conclusions are given on the bestdata.

page
74
of 1
25R
IVM
repo
rt 71
1701
021
Tab
le 4
.9: D
aily
soi
l ing
estio
n by
chi
ldre
n in
8 re
fere
nces
Ref
eren
cen
Trac
erm
ean
SD95
% c
onf.
med
ian
min
.m
ax.
90-p
erc.
95-p
erc.
geom
etri
cG
SD
(num
ber
of
of m
ean
limit
of(5
0-pe
rc.)
(logn
.(lo
gn.
mea
n(g
eom
. st.
child
ren)
mea
ndi
str.
)di
str.
)de
viat
ion)
Bind
er e
t al,
1986
59A
l18
120
312
125
1324
584
128
Si18
417
513
631
799
578
130
LTM
108
121
884
708
386
65Cl
ausi
ng e
t al.,
198
718
Al
232
263
9323
979
579
707
136
AIR
129
6910
848
362
174
264
117
LTM
105
6782
162
201
90 b
ackg
roun
d (h
ospi
tal)
4922
4875
7945
Cala
bres
e et
al.,
198
964
Al
153
852
2968
3722
3So
ilSi
154
693
4055
4927
6Y
8589
09
6736
106
mea
n A
l, Si
, Y13
126
202
Dav
is e
t al,1
990
101
Al
3914
25-2
97Si
8212
59-4
04m
ean
Al,
Si61
42va
n W
ijnen
e.a
., 19
90
all d
ata
d
ayca
re 1
292
LTM
232
124
145
2.24
dayc
are
218
7LT
M10
690
921.
69da
ycar
e 1+
216
6LT
M16
228
611
411
11.
6C
ampg
roun
d78
LTM
213
160
174
1.73
Back
grou
nd (h
ospi
tal)
15LT
M93
4667
-119
110
149
742.
34se
lect
ed
day
care
122
LTM
265
162
data
d
ayca
re 2
15LT
M17
210
4C
ampg
roun
d32
LTM
258
163
Stan
ek&
Cal
abre
se, 1
995
a64
Al
122
2946
9213
125
4(in
terp
reta
tion
of
Si13
932
4975
206
224
Cal
ebre
se, 1
989)
tota
l17
945
7703
186
208
Stan
ek&
Cal
abre
se, 1
995
b22
9m
edia
n A
l,Si,T
i11
337
1187
419
424
9(in
terp
reta
tion
of D
avis
, 199
0;
med
ian
best
104
3711
415
156
217
Cal
ebra
se, 1
989)
4 tra
cers
Cala
bres
e et
al,
1997
.64
med
ian
best
775
1-1
0138
073
160
4 tra
cers
Aver
age
of a
ll re
fere
nces
1)
102
4215
023
049
1)B
old
data
are
use
d in
cal
cula
tions
( 1
valu
e pe
r ref
eren
ce)

RIVM report 711701021 page 75 of 125
UncertaintiesAlthough the data give a good impression of the soil ingested, there are several uncertainties,which should be mentioned. First, we are concerned here with short studies, which meansthat the data do not have to represent long exposure. Second there is experimental uncertaintyin the measurement of the soil ingestion by children, for example, by only partial sampling ofthe food and faeces or transit time differences. Third, there are uncertainties in the uptake oftracers by the human body. Also there is an uncertainty in the homogeneity of the soilsamples (US-EPA, 1997).
4.5.3 Soil ingestion by adults and older childrenOnly four studies are available for making an estimation of the soil ingestion of adults. InHawley (1985) estimates are based on soil and dust on hands and hand-to-mouth transfer. Asoil ingestion of 480 mg per day was estimated for adults in outdoor activities and for indooractivities soil ingestion between 0.56 and 110 mg per day was estimated. In US-EPA (1997)an estimate of 10 mg per day is also mentioned, based on arsenic levels in urine, hand-to-mouth transfer and activity patterns. Because of the lack of direct measurements these datahave a low reliability.Calabrese et al. (1990) and Stanek et al. (1997) quantified soil ingestion in two tracer studieswith adults. Although part of a childhood soil ingestion study (Calabrese et al., 1990) on themost reliable tracers (Al, Si, Y and Zr) yielded respective mean soil ingestion values of 77, 5,53 and 22 mg per day (see Table 4.9), from which a average of 39 mg per day can becalculated. Stanek et al.(1997) also formed a part of a larger study involving 10 adults. Thetracers used for estimating soil ingestion are Al, Si, Ti, Y and Zr. Based on the ‘best tracermethod’ (BTM) the average daily soil ingestion (10 persons over 4 weeks) was 6 mg per day.The data also provide information on the distribution of soil ingestion. Based on these results,the average ingestion by adults is concluded to be 10 mg per day. Taking into account theresults of the separate weeks (see Table 4.10), it can be concluded that this relatively lowaverage is a result of the low values in week 4. The mean of the first three weeks is 53 mg perday. Although there are still a lot of uncertainties involved, as mentioned before, these studiesgive the best quantitative estimates currently available.Table 4.10: Soil ingestion by adultsReference n (number tracer mean SD min. median 75-perc. 90-perc. 95-perc. max
of adults) of mean (50-perc.)Calabrese 6 Al 77 65 57et al., 1990 Si 5 55 1
Y 53 51 65Zr 22 141 -4
median of Al, Si, Y, Zr 38 29average of Al, Si, Y, Zr 39 30
Stanek etal., 1997
10 median of 4best tracers
4 weeks 6 165 -400 -11 34 201 331 620week 1 67 202 -39 -14 37 384 620 620week 2 44 120 -52 18 37 210 376 376week 3 49 127 -84 -5 120 269 285 285week 4 -137 126 -400 -143 -93 21 100 100

page 76 of 125 RIVM report 711701021
4.5.4 Soil ingestion data used in other countriesIn addition to the data on soil ingestion in the literature, the data used in risk assessment toolsin the UK, USA and Germany are summarised. More details can be found in Rikken et al.(2001).
In all models an age-adjusted soil ingestion factor is used because inadvertent soil ingestion isdifferent for children and adults. The age categories used and corresponding soil ingestionrates are not the same for all models. On the basis of the yearly averaged soil ingestion ratesit can be concluded that the present value for children in CSOIL of 150 mg per day is higherthan the ingestion rates of the other models (see Table 4.11). For the relevant scenarios of theother models the yearly averaged soil ingestion rates for children are 123 mg per day and 74mg per day for UMS, 114 mg per day for the CLEA and 60 mg per day for CalTOX. Foradults the ingestion rate of the UK is comparable with the CSOIL value of 50 mg per day.The ingestion rate of UMS (Germany) is 16 mg per day and in CalTOX 10 mg per day.Further it must be noted that only the CLEA model accounts for an additional deliberate soilingestion rate in the second year of life.In Denmark an average daily intake of 200 mg per day is used for children, being a 90-95percentile of a group of children. The Soil Quality Criteria is based on this figure only. Foradults they assume an intake of 25 mg soil per day (pers. comm. Larsen).
Table 4.11: Soil ingestion rates and use of deliberate soil ingestion for the compared modelsModel Yearly average
soil ingestion ratefor adults
(mg per day)
Yearly averagesoil ingestion rate
for children(mg per day)
Use of deliberatesoil ingestion for
children
Absorption orresorption rate3)
CLEA 60 80 / 114 1) Yes 2) NoCalTOX 10 60 No NoUMS 16 3) 123 (1-3 year)
74 (4-8 year) 4)No Yes (default 1)
CSOIL 50 150 No Yes (default 1)1) Without deliberate soil ingestion: 80 mg/kg. With deliberate soil ingestion: 114 mg/kg2) 5000 mg per day for a maximum of 30 days in the second year of life3) The uptake in the human body, based on a soil ingestion of 30 mg per day and an exposure duration of 190
d/y4) Based on a soil ingestion of 250 mg per day (1-3) and 150 mg per day (4-8) and an exposure duration of 180d/y
4.5.5 Discussion and conclusionThe quantitative data on soil ingestion from the 7 references for children and 2 references foradults, together with the background information in other countries will be the main bases fora proposal on daily soil ingestion by children and by adults. To decide on the soil ingestion tobe used, it is important to decide what part of the behaviour of people should be protected.This is important because there is a distribution of exposure in time en between differentpersons. In the CSOIL exposure model the starting point is the average human lifetimeexposure within the exposure scenario ‘residential with garden’. Therefore it is proposed touse the average exposure, but depending on de function of the risk assessment it could bedecided to use an upper percentile (90 or 95 percentile). All studies are comparable with thescenario ‘residential with garden) except from a study on a campsite (worst case). Because ofthe spread of the soil ingestion between children and the spread of the ingestion in time, the
RIVM report 711701021 page 77 of 125
average can be seen as a (yearly averaged) daily soil ingestion by children. Using the medianvalue of soil ingestion would lead to an underestimation of the yearly soil ingestion.
Soil ingestion by childrenBased on the literature data and the data used in other countries it can be concluded that thecurrent value of 150 mg per day as an estimate of the average daily soil ingestion by childrenis relatively high. There also appears to be a large spread in the data: the estimate of theaverage soil ingestion in the studies lies between 56 and 179 mg.d-1. The most recent datafrom the risk assessment in the UK, Germany and US for the average daily soil ingestion are114, 100 and 123, respectively.
• Based on the evaluated and assessed data a good estimate of the average daily soilingestion through children for the scenario ‘residential home with garden’ is 100 mg.d-1.It is proposed to use this value in the risk assessment.
• When the spread between the studies is considered also the upper limit of the 90-percentconfidence interval of the mean, 125 mg per day could be used. For a realistic worst casea 90-percentile or 95-percentile of the soil ingestion of children could be chosen, beingabout 150 and 200 mg per day, respectively.
Soil ingestion by adultsBased on the 2 references on soil ingestion by adults it can be concluded that the currentvalue of 50 mg per day is well within the range found for the average soil ingestion. The mostrecent data from the risk assessment in the UK, Germany and US for the average daily soilingestion are 60, 50 and 16, respectively. Although the most recent study suggests an averagesoil ingestion of 10 mg per day, because of the strongly differing results of week 4, a yearlyaverage soil ingestion of 40 or 50 mg per day will be proposed as a good estimate. A 90-percentile of 200 mg per day can be estimated with substantial uncertainty.
• It is proposed to maintain the current value of 50 mg per day soil ingestion by adults.
4.6 Input parameters on the dermal exposure to soil routeDermal exposure via soil contact is a less important exposure route compared with the threemajor exposure routes: soil ingestion, inhalation of indoor air and crop consumption.In section 2.2.3 it was decided to give no priority to the evaluation of the input parametersinvolved with this route. In agreement with the priority setting it was also decided not toevaluate the current concept of this exposure route (Rikken et al., 2001).Concerning the dermal exposure via sediment, other considerations have been made. TheSRChuman for sediments is determined with the exposure model SEDISOIL and the standarduse of sediments (inclusive the banks of rivers, lakes et cetera) is described with the scenario‘the possibility of recreation and recreational fishery’. Recreational activities imply a moreintensive dermal contact with sediment than activities as defined for the standard CSOILscenario ‘residential use with garden’. Exploratory calculations with the SEDISOIL modelshowed that for certain compounds (e.g. PAH), the contribution of the exposure route dermaluptake via soil contact could be relevant (Otte et al., 2000a). Therefore it is recommended toevaluate in future this exposure route.

page 78 of 125 RIVM report 711701021
The following input parameters are used to calculate the dermal exposure to soil route.
- Matrix factor (fm)The matrix factor in CSOIL is set at 0.15. It represents the fraction of the soil that is incontact with the skin and is based on observations of Hawley (1985). In the uncertaintyanalysis a uniform distribution is assumed to be between 0.1 and 0.5.
- Exposed surface area adult indoor and outdoor (Aexpai/Aexpao)The exposed surface area for adults in CSOIL is set at 0.09 and 0.17 m2, respectively. In theuncertainty analysis a normal distribution is assumed to be between 0.09-0.34 m2 (inside) andbetween 0.09 and 0.98 (outside), based on data of Hawley (1985). For children a normaldistribution is assumed to be between 0.04 and 0.125 m2 (inside).
- Degree of coverage indoor and outdoor (DAEai/DAEao)The degree of coverage indoor in CSOIL is set at 0.00056 and the degree of coverageoutdoor for adults and children 0.0375 and 0.0051 kg soil per m2, respectively.
- Exposure period (Tb)The exposure period of an adult indoor and outdoor (Tbai/Tbao) in CSOIL is set at 14.86 and1.14 h per day, respectively. The exposure time is related to the exposure by inhalation ofinside air. In the uncertainty analysis a normal distribution of the exposure time is assumed tobe between 6.7 and 16 h (inside) and 0.1 and 5 h (outside), based on data of Silvers et al.(1994). The exposure period for children indoor and outdoor (Tbci and Tbco) in CSOIL isset at 9.14 and 2.86 h per day, respectively).
- Fraction soil in dust inside (frs)In CSOIL the fraction soil in dust is set at 0.8.
- Absorption velocity for adults (DARa)In CSOIL the absorption velocity for an adult is set at 0.005 per h. Although the velocity isalso substance-dependent, in the uncertainty analysis it is set at between 0.004 and 0.01 per h,based on data of McKone and Bogen (1990).
• In agreement with the priority setting (section 2.2.4.) it was decided not to evaluate orrevise the input parameters used for the calculation of dermal exposure to soil.
• It is recommended to evaluate the model concept jointly with the relevant inputparameters in future.

RIVM report 711701021 page 79 of 125
5 Discussion and recommendations
5.1. Physicochemical parameters5.1.1. IntroductionAll the relevant physicochemical parameters were evaluated, resulting in a revised data set.Data were completed for all the chlorophenols and the PAHs; PCBs and phthalates wereextended with more congeners. This enhanced the base for deriving SRC values for groups ofcompounds. The physicochemical data of the dioxins (belonging to the second series ofcompounds) were not evaluated and maintained (Van den Berg et al., 1994).The physicochemical data for petroleum hydrocarbons have been reviewed recently in astudy supervised by the Mineral Oil Working Group (Franken et al., 1999). Thephysicochemical data as proposed by the Total Petroleum Hydrocarbon Criteria WorkingGroup were evaluated and completed. The proposals reported by Franken et al. (1999) wereadopted. The complete revised physicochemical data set is given in Appendix 7. Theunderlying individual data will be compiled and made available later. We propose to use thedata set (chapter 3) for the assessment of potential human risks and for the evaluation of thecurrent Intervention Values for Soil and Groundwater.The most important details of the revised data set will be outlined in the sections below,followed by a comparison of the revised data with the current data (Van den Berg, 1995).Substantial differences are emphasised and the effect of the revised parameter (or parameters)on the calculated risk level examined.
5.1.2. Molecular weight, solubility, vapour pressure, Henry’s lawconstant and acid dissociation constant
As the molecular weight (M) is a well-known parameter an evaluation was not necessary.Only the correction of the molecular weight for seven compounds due to earlier reportedinput errors (Van den Berg, 1997) was carried out.The revised solubility (S) and vapour pressure (Vp) data is based on the geometric mean ofthe selected data. Contrary to the current data, the revised data is corrected for a standard soiltemperature of 10o C. According to the current CSOIL formulary Henry’s law constant iscalculated from the vapour pressure and solubility data. We considered using experimentalHenry’s law constants when available, however, it is not certain if measured Henry’s lawconstants give better descriptions of the air-water partition in situ. Moreover, reliableexperimental Henry’s law constants for many compounds are often not available. The currentpractice was continued to maintain a consistent methodology.The acid dissociation constant (pKa) only has effect on the determination of the Koc for somedissociating compounds. The effect on the Koc (and the calculated level of SRChuman)depends on the pKa value and the defined pH of the CSOIL standard soil (see section 2.1.7).
Table 5.1 overviews the compounds for which the differences between current and reviseddata exceed a factor of 3 (solubility) or 5 (vapour pressure and H constant). These factors arechosen on the basis of the estimated standard deviation for solubility and vapour pressure(Jager et al., 1997). In a broad sense, when the current solubility or vapour pressure differsmore then respectively a factor 3 or 5 it indicates that the current value is outside theestimated 20th and 80th percentiles.

page 80 of 125 RIVM report 711701021
It is difficult to estimate if the proposed new solubility and vapour pressure data will lead to asubstantially(> factor 2) different SRChuman value. This also depends on other revisedcompound-specific parameters as well as soil, exposure and site parameter adjustments.However, when only the revision of solubility (S), vapour pressure (Vp) and Henry’s lawconstant (H calculated from S and Vp) is considered separately, a substantial effect on theSRChuman is found for four compounds (Table 5.1).
Table 5.1: Differences between current and revised data (> a factor of 3 or 5) and the effecton the SRChuman (> a factor of 2 as difference) because of these differences (in italics)
Solubility Vapour pressure H constant Effect on SRC human∆∆∆∆ > factor 3 ∆∆∆∆ > factor 5 ∆∆∆∆ > factor 5 ∆∆∆∆ > factor 2
Catechol Catechol Catechol Resorcinol Resorcinol Resorcinol Resorcinol Hydroquinone Hexachlorobenzene Hydroquinone Hydroquinone α-HCH 2-Chlorophenol Anthracene Anthracene Di(2-ethylhexyl)phthalate 2,3,4-Trichlorophenol Benzo(a)anthracene Benzo(a)anthracene 2,3,4,5-tetrachlorophenol Benzo(a)pyrene Fluoranthene Pentachlorophenol Fluoranthene Phenanthrene PCB153 Phenanthrene Benzo(k)fluoranthene Endrin PCB 28 2-Chlorophenol β-HCH α-HCH 2,3,4-Trichlorophenol δ-HCH β-HCH 2,3,4,5-TetrachlorophenolDi(2-ethylhexyl)phthalate γ-HCH PCB 28
δ-HCH α-HCH Maneb β-HCH
γ-HCH δ-HCH Endrin Maneb
The following remarks can be made on the revised solubility data. Van de Berg (1997)reported input errors for 2,3,4-trichlorophenol, pyridine, carbaryl, carbofuran, tetrahydrofuranand tetrahydrothiophene. The input data for these compounds were corrected before theevaluation process. When the current solubility data (Van den Berg, 1995 and 1997) arecompared with the revised data, substantial differences (> factor 3) were found for 12compounds. However, the use of the revised solubility data only have a substantial effect (>factor 2) on the SRChuman level for di(2-ethylhexyl)phthalate. The revised solubility value fordi(2-ethylhexyl)phthalate (from 0.285 to 0.0457 mg/l) permits a lower maximum pore waterconcentration and consequently a lower plant uptake.
In the revision of vapour pressure data, substantial differences (> factor 5) were found for 14compounds, mainly those with a low volatility (< 1 Pa); consequently, the effect on humanexposure is small. The current vapour pressure values for hydroquinone, resorcinol andcatechol were arbitrarily set at 133 Pa (Van den Berg, 1997) because data for thesecompounds were not available. The revised vapour pressure data were significantly lower,resulting in higher BCF values for leafy crops and, consequently, a higher plant uptake. Forhydroquinone and resorcinol this implies lower SRChuman levels. The revised vapour pressurefor α-HCH (from 3.33E-03 to 3.50E-02 Pa) resulted in a small increase in the humanexposure via inhalation of indoor air. This resulted in a significant lower SRC level due to thelow TCA (compared with the TDI) for α-HCH.
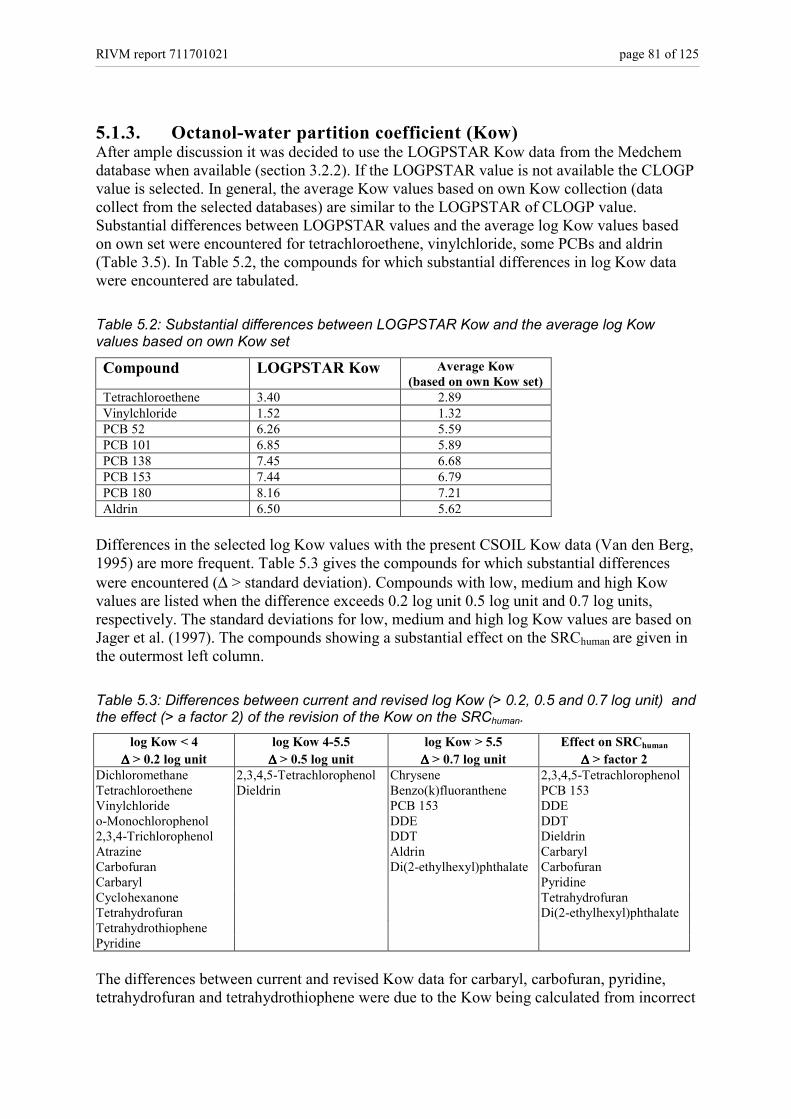
RIVM report 711701021 page 81 of 125
5.1.3. Octanol-water partition coefficient (Kow)After ample discussion it was decided to use the LOGPSTAR Kow data from the Medchemdatabase when available (section 3.2.2). If the LOGPSTAR value is not available the CLOGPvalue is selected. In general, the average Kow values based on own Kow collection (datacollect from the selected databases) are similar to the LOGPSTAR of CLOGP value.Substantial differences between LOGPSTAR values and the average log Kow values basedon own set were encountered for tetrachloroethene, vinylchloride, some PCBs and aldrin(Table 3.5). In Table 5.2, the compounds for which substantial differences in log Kow datawere encountered are tabulated.
Table 5.2: Substantial differences between LOGPSTAR Kow and the average log Kowvalues based on own Kow set
Compound LOGPSTAR Kow Average Kow(based on own Kow set)
Tetrachloroethene 3.40 2.89Vinylchloride 1.52 1.32PCB 52 6.26 5.59PCB 101 6.85 5.89PCB 138 7.45 6.68PCB 153 7.44 6.79PCB 180 8.16 7.21Aldrin 6.50 5.62
Differences in the selected log Kow values with the present CSOIL Kow data (Van den Berg,1995) are more frequent. Table 5.3 gives the compounds for which substantial differenceswere encountered (∆ > standard deviation). Compounds with low, medium and high Kowvalues are listed when the difference exceeds 0.2 log unit 0.5 log unit and 0.7 log units,respectively. The standard deviations for low, medium and high log Kow values are based onJager et al. (1997). The compounds showing a substantial effect on the SRChuman are given inthe outermost left column.
Table 5.3: Differences between current and revised log Kow (> 0.2, 0.5 and 0.7 log unit) andthe effect (> a factor 2) of the revision of the Kow on the SRChuman.
log Kow < 4 log Kow 4-5.5 log Kow > 5.5 Effect on SRChuman
∆∆∆∆ > 0.2 log unit ∆∆∆∆ > 0.5 log unit ∆∆∆∆ > 0.7 log unit ∆∆∆∆ > factor 2Dichloromethane 2,3,4,5-Tetrachlorophenol Chrysene 2,3,4,5-TetrachlorophenolTetrachloroethene Dieldrin Benzo(k)fluoranthene PCB 153Vinylchloride PCB 153 DDEo-Monochlorophenol DDE DDT2,3,4-Trichlorophenol DDT DieldrinAtrazine Aldrin CarbarylCarbofuran Di(2-ethylhexyl)phthalate CarbofuranCarbaryl PyridineCyclohexanone TetrahydrofuranTetrahydrofuran Di(2-ethylhexyl)phthalateTetrahydrothiophenePyridine
The differences between current and revised Kow data for carbaryl, carbofuran, pyridine,tetrahydrofuran and tetrahydrothiophene were due to the Kow being calculated from incorrect

page 82 of 125 RIVM report 711701021
solubility data (see section 5.1.2). After correction of the solubility (Van den Berg, 1997), thecalculated Kow data continue to be different from LOGPSTAR data. Other solubility-basedKow data were used for vinylchloride, cyclohexanone, dichloromethane, 2,3,4,5-tetrachlorophenol, di(2-ethylhexyl)phthalate, benzo(ghi)perylene, indeno(1,2,3-cd)pyrene,trichloroethene, pentachlorobenzene, chloronaphthalene, maneb and butylbenzylphthalate(Van den Berg, 1997). Substantial differences were frequent between solubility-based Kowand the LOGPSTAR Kow data. Other substantial differences were noticed fortetrachloroethene, atrazine, 2,3,4-trichlorophenol, 2,3,4,5-tetrachlorophenol, dieldrin, di(2-ethylhexyl)phthalate, DDE, aldrin, PCB 153, DDT and benzo(k)fluoranthene.
Whether these differences provoke substantial alterations in the level of the SRChuman alsodepends on the chosen concept for deriving Koc values. Van den Berg (1995) derived Kocvalues from the Kow according to Karickhoff (1981). This implies that with an alteration ofthe Kow value the calculated Koc also changes. In section 3.3.1 it was decided to useexperimentally based Koc values, resulting in a different (smaller) effect of Kow alterationsthan with the current 1995 approach for Koc derivation. Table 5.3 gives the effect on theSRChuman of the revision of Kow only (means that the Koc within the model is independent ofKow).
5.1.4. Organic carbon normalised soil−−−−water partition coefficients(Koc)
The current Koc values in Van den Berg (1995) were based on Kow values (Karickhoff,1981). In contrast with the CSOIL 1995 log Koc data, the revised Koc data is based mainlyon experimental data. Databases and reviews used are given in Table 3.1.For dissociating contaminants the overall Koc for a standard soil is computed, taking intoaccount both neutral and negatively charged forms (Koc for dissociating compounds3.3.2).The CSOIL 1995 log Koc data (Van den Berg, 1995) considered only the sorption of theneutral form.The current Koc data set (Van den Berg, 1995) is compared with the revised Koc data (seeTable 3.6). The compounds for which substantial differences were encountered are tabulatedin Table 5.4. Compounds are listed when the log Koc differs more than 0.3 log, 0.5 log and0.7 log unit for compounds with low, medium and high Kow values, respectively. Thiscriterion is based on the estimated standard deviation calculated from the collected Kocvalues.The revision of the log Koc influences the calculated exposure and the SRChuman for soilsubstantially (> factor 2) for 27 compounds (Table 5.4 right column).
Part of the encountered differences were caused by the fact that some Koc values were basedon weakly founded (calculated from solubility) Kow values. This applies to carbofuran,carbaryl, tetrahydrofuran, 2,3,4,5-tetrachlorophenol, pentachlorobenzene, vinylchloride andcyclohexanone). For some of the other compounds the use of the Kow-Koc model(Karickhoff, 1981) is doubtful (e.g. hydroquinone, catechol, resorcinol and chlorophenols), assuch models are mainly class-specific (e.g. predominantly hydrophobic). The revised log Kocvalues of aldrin, dieldrin and endrin are lower than the current log Koc values.
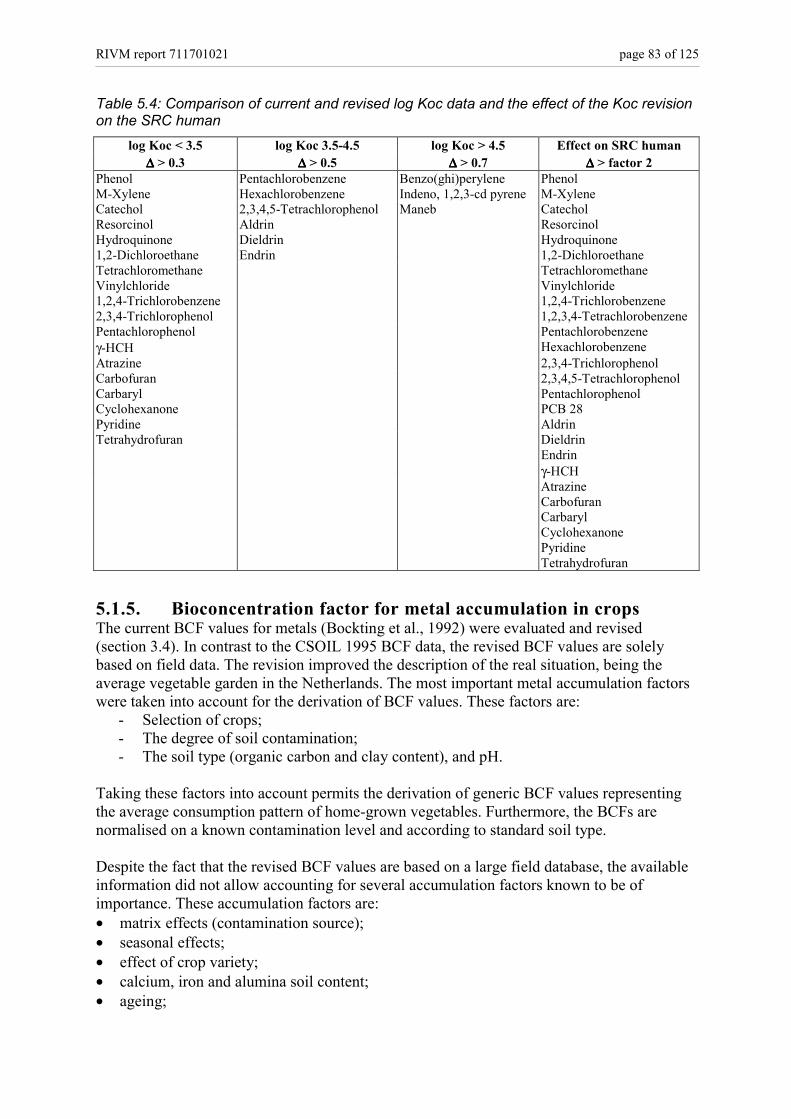
RIVM report 711701021 page 83 of 125
Table 5.4: Comparison of current and revised log Koc data and the effect of the Koc revisionon the SRC human
log Koc < 3.5 log Koc 3.5-4.5 log Koc > 4.5 Effect on SRC human∆∆∆∆ > 0.3 ∆∆∆∆ > 0.5 ∆∆∆∆ > 0.7 ∆∆∆∆ > factor 2
Phenol Pentachlorobenzene Benzo(ghi)perylene PhenolM-Xylene Hexachlorobenzene Indeno, 1,2,3-cd pyrene M-XyleneCatechol 2,3,4,5-Tetrachlorophenol Maneb CatecholResorcinol Aldrin ResorcinolHydroquinone Dieldrin Hydroquinone1,2-Dichloroethane Endrin 1,2-DichloroethaneTetrachloromethane TetrachloromethaneVinylchloride Vinylchloride1,2,4-Trichlorobenzene 1,2,4-Trichlorobenzene2,3,4-Trichlorophenol 1,2,3,4-TetrachlorobenzenePentachlorophenol Pentachlorobenzeneγ-HCH HexachlorobenzeneAtrazine 2,3,4-TrichlorophenolCarbofuran 2,3,4,5-TetrachlorophenolCarbaryl PentachlorophenolCyclohexanone PCB 28Pyridine AldrinTetrahydrofuran Dieldrin
Endrinγ-HCHAtrazineCarbofuranCarbarylCyclohexanonePyridineTetrahydrofuran
5.1.5. Bioconcentration factor for metal accumulation in cropsThe current BCF values for metals (Bockting et al., 1992) were evaluated and revised(section 3.4). In contrast to the CSOIL 1995 BCF data, the revised BCF values are solelybased on field data. The revision improved the description of the real situation, being theaverage vegetable garden in the Netherlands. The most important metal accumulation factorswere taken into account for the derivation of BCF values. These factors are:
- Selection of crops;- The degree of soil contamination;- The soil type (organic carbon and clay content), and pH.
Taking these factors into account permits the derivation of generic BCF values representingthe average consumption pattern of home-grown vegetables. Furthermore, the BCFs arenormalised on a known contamination level and according to standard soil type.
Despite the fact that the revised BCF values are based on a large field database, the availableinformation did not allow accounting for several accumulation factors known to be ofimportance. These accumulation factors are:• matrix effects (contamination source);• seasonal effects;• effect of crop variety;• calcium, iron and alumina soil content;• ageing;

page 84 of 125 RIVM report 711701021
• harvesting period;• farm management and use of fertilisers;• root zone in relation with the spatial variability of the pollution;• effect of aerial deposition.
The use of data from different sources is expected to cause suppression of the effects of theseaccumulation factors thus providing a good picture of the average situation.The underlying plant–soil relationships can be improved when more field data sets becomeavailable. However, at the moment it is clear that with the proposed BCF data-set riskassessment due to consumption of home-grown crops has been improved.
5.1.6. Kp for metalsWhen the current CSOIL Kp set was evaluated and compared with three other Kp sets(section 3.5), the current CSOIL Kp set was shown to be considerably lower Kp than the setsof Sauvé (2000) and PGBO (Otte et al., 2000b). Based on five criteria the data sets andderived Kp values or Kp models were compared.The presented Kp values (Table 3.13, Table 3.17 and Table 3.18) are estimated averagevalues applicable to soils in the Netherlands. The Kp values show a wide variability - severalorders of magnitude - due to differences in:• soil characteristics;• soil moisture content;• metal content;• speciation of the metal.
There are also several questions under discussion including:• How can the fraction of metals in the groundwater that is subject to transport (total
concentration in pore water) be assessed?• Which results are more reliable: sorption coefficients that are based on laboratory or field
experiments?• Under which conditions should (field and or laboratory) experiments be performed?• How must we deal with changes in metal pore water concentration in time due to changes
in soil moisture content?The derivation of the bioavailable fraction, i.e. that part of the metals in the pore water thatadversely affects soil organisms, is even more complex than the derivation of the fraction ofmetals in the groundwater subject to transport (Otte et al., 2000b).
At the moment there is no ideal set of Kp values available. However, the revised values arean improvement thanks to the better basis. Furthermore the revised Kp values are related tothe significant fraction in the pore water. The revised Kp values are considered to be moreappropriate for Dutch soils in the most relevant concentration range and, as they are averagevalues, more appropriate for potential risk assessment.
Kp values are used for the calculation of pore water concentration in CSOIL, applying theequilibrium-partitioning concept. The derived pore water concentration is used for thederivation of SRC levels for groundwater. The revision of the procedure, including the effectof the revised Kp set, is described in Lijzen et al. (2001). Verbruggen et al. (2001) used Kpvalues to derive soil concentrations (risk limits) from aquatic toxicological data.
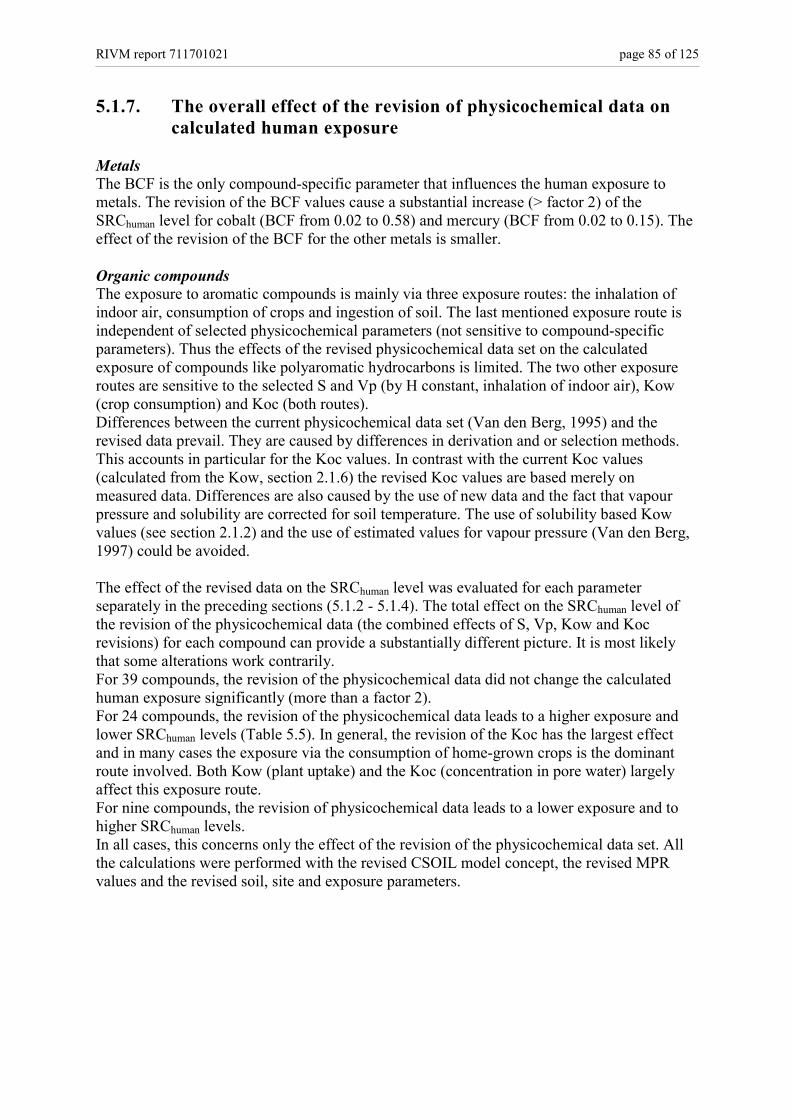
RIVM report 711701021 page 85 of 125
5.1.7. The overall effect of the revision of physicochemical data oncalculated human exposure
MetalsThe BCF is the only compound-specific parameter that influences the human exposure tometals. The revision of the BCF values cause a substantial increase (> factor 2) of theSRChuman level for cobalt (BCF from 0.02 to 0.58) and mercury (BCF from 0.02 to 0.15). Theeffect of the revision of the BCF for the other metals is smaller.
Organic compoundsThe exposure to aromatic compounds is mainly via three exposure routes: the inhalation ofindoor air, consumption of crops and ingestion of soil. The last mentioned exposure route isindependent of selected physicochemical parameters (not sensitive to compound-specificparameters). Thus the effects of the revised physicochemical data set on the calculatedexposure of compounds like polyaromatic hydrocarbons is limited. The two other exposureroutes are sensitive to the selected S and Vp (by H constant, inhalation of indoor air), Kow(crop consumption) and Koc (both routes).Differences between the current physicochemical data set (Van den Berg, 1995) and therevised data prevail. They are caused by differences in derivation and or selection methods.This accounts in particular for the Koc values. In contrast with the current Koc values(calculated from the Kow, section 2.1.6) the revised Koc values are based merely onmeasured data. Differences are also caused by the use of new data and the fact that vapourpressure and solubility are corrected for soil temperature. The use of solubility based Kowvalues (see section 2.1.2) and the use of estimated values for vapour pressure (Van den Berg,1997) could be avoided.
The effect of the revised data on the SRChuman level was evaluated for each parameterseparately in the preceding sections (5.1.2 - 5.1.4). The total effect on the SRChuman level ofthe revision of the physicochemical data (the combined effects of S, Vp, Kow and Kocrevisions) for each compound can provide a substantially different picture. It is most likelythat some alterations work contrarily.For 39 compounds, the revision of the physicochemical data did not change the calculatedhuman exposure significantly (more than a factor 2).For 24 compounds, the revision of the physicochemical data leads to a higher exposure andlower SRChuman levels (Table 5.5). In general, the revision of the Koc has the largest effectand in many cases the exposure via the consumption of home-grown crops is the dominantroute involved. Both Kow (plant uptake) and the Koc (concentration in pore water) largelyaffect this exposure route.For nine compounds, the revision of physicochemical data leads to a lower exposure and tohigher SRChuman levels.In all cases, this concerns only the effect of the revision of the physicochemical data set. Allthe calculations were performed with the revised CSOIL model concept, the revised MPRvalues and the revised soil, site and exposure parameters.

page 86 of 125 RIVM report 711701021
Table 5.5: Effect of the revised physicochemical data on the SRChuman level compared withthe current data set (arranged in order of effect)
Compound Lower 1) SRChuman 2)
(higher exposure)Main cause
is the revision of:Dominant
exposure route Aldrin <<< Koc crop consumption Carbofuran <<< Kow/Koc crop consumption Tetrahydrofuran <<< Kow perm. drinking water Di(2-ethylhexyl)phthalate <<< Koc crop consumption Hexachlorobenzene <<< Koc crop consumption Carbaryl <<< Kow crop consumption Pentachlorobenzene << Koc inhalation inside DDE << Koc crop consumption PCB153 << Kow/Koc crop consumption Vinylchloride << S,Vp (H) inhalation inside DDT < Koc/Kow crop consumption Cobalt < BCF crop consumption Mercury < BCF crop consumption α-HCH < S, Vp (H) crop consumption Dichloromethane < Koc/Kow inhalation inside PCB 28 < Koc crop consumption γ-HCH < Koc crop consumption Cyclohexanone < Koc crop consumption m-Xylene < Koc inhalation inside 1,2,3,4-Tetrachlorobenzene < Koc crop consumption Pentachlorophenol < Koc crop consumption Dieldrin < Kow/Koc crop consumption Endrin < Koc crop consumption Tetrachloromethane < Koc inhalation inside
Compound Higher 1) SRChuman 3)
(lower exposure)Main cause is
the revision of:Dominant
exposure route
p-Cresol >> Koc crop consumption Catechol >> Koc crop consumption 2,3,4,5-Tetrachlorophenol > Koc crop consumption 1,2-Dichloroethane > Koc inhalation inside 1,2,4-Trichlorobenzene > Koc inhalation inside Tetrahydrothiophene > Koc inhalation inside Atrazine > Koc crop consumption Hydroquinone > Koc crop consumption Phenol > Koc crop consumption1) A higher exposure leads to a potential lower SRChuman level. The effect of other revisions such as MPRhuman ,
model concepts and the revision of soil, site and exposure parameters can change the picture. The sameremark is made in the case of a potential higher SRChuman level caused by a lower exposure.
2) <<<: the decrease of the SRChuman is more than a factor 10<< : the decrease of the SRChuman is between a factor 5 and 10< : the decrease of the SRChuman is between a factor 2 and 5
3) >> : the increase of the SRChuman is between a factor 5 and 10> : the increase of the SRChuman is between a factor 2 and 5

RIVM report 711701021 page 87 of 125
5.1.8. Comparison with other data used for risk assessmentAppendix 6 gives the data as presented in ‘Environmental Risk Limits in the Netherlands’(De Bruijn et al., 1999), the so-called INS data. It tabulates the data on vapour pressure,Henry’s law constant, log Kow and log Koc for the compounds present in the revised CSOILdata set. By way of comparison, the revised data are also tabulated. The revised data arecompared with the INS data (De Bruijn et al., 1999), using the same method and criteria asfor the comparison of current and revised data (see sections 5.1.2 - 5.1.7).
Table 5.6 tabulates the compounds for which significant differences were encountered.Although differences are encountered, the two data sets are concluded to be, in the main,comparable. Comparing calculations with the INS data showed only significant differenceson derived SRChuman levels for nine compounds (outermost left column, with name ofcompound printed in bold).
Table 5.6: Comparison of revised physicochemical data with physicochemical INS dataVapour pressure and /or log Kow < 3.5: ∆∆∆∆ > 0.3 log Koc < 3.5: ∆∆∆∆ > 0.3 OVERALL effectH constant log Kow 3.5-4.5: ∆∆∆∆ > 0.5 log Koc 3.5-4.5: ∆∆∆∆ > 0.5 on SRC human∆∆∆∆ > factor 5 log Kow > 4.5: ∆∆∆∆ > 0.7 log Koc > 4.5: ∆∆∆∆ > 0.7 ∆∆∆∆ > factor 2Benzo(a)anthraceneBenzo(a)pyreneBenzo(k)fluoranthene1,3,5-Trichlorobenzene1,2,3,4-Tetrachlorobenzene1,2,3,5-Tetrachlorobenzene1,2,4,5-TetrachlorobenzenePentachlorobenzeneVinylchloride
Carbofuran2,3-Dichlorophenol3,4-Dichlorophenol2,3,4-Trichlorophenol2,3,5-Trichlorophenol2,3,4,5-Tetrachlorophenol2,3,5,6-TetrachlorophenolDieldrinEndrin
Aldrin4-Chlorophenol2,4-Dichlorophenol2,3,4-Trichlorophenol2,4,6-Trichlorophenol3,4,5-Trichlorophenol2,3,4,5-TetrachlorophenolDichloromethaneDieldrinγγγγ-HCHNaphthaleneStyreneTetrachloromethaneo-Xylene
Aldrin2,4-dichlorophenol2,3,4-trichlorophenol2,3,4,5-tetrachlorophenolDieldrinγ-HCHTetrachloromethanePentachlorobenzeneVinylchloride
Next, the observed differences will be briefly discussed.
Vapour pressure and Henry’s law constantDifferences are found between the vapour pressure data of some PAHs. However, given thelow volatility of PAHs (<< 1 Pa), these differences will not provoke alterations in calculatedexposure.Other differences in selected vapour pressure data concerns the tri- and tetrachlorobenzenes.The small set of underlying data can be the cause. The aggregation of the data for individualchlorobenzenes to one average value for di-, tri- and tetrachlorobenzenes is a possiblesolution. Appendix 6 also gives the values for ALL di-, tri- and tetrachlorobenzenes. Theencountered differences have no serious effects on the calculated risk levels.The INS vapour pressure value for pentachlorobenzene (2.2 Pa) is higher than the revisedCSOIL value (0.452 Pa) and the current CSOIL value (0.133 Pa). The Henry’s law constantselected by INS (experimental value) is lower than the revised Henry’s law constant, which iscalculated from vapour pressure and solubility (0.033 vs. 0.15, respectively). Calculationswith the INS data lead to a higher (factor 2) SRChuman level.The vapour pressure for vinylchloride differs considerably from the INS value (33700 Pa).The revised CSOIL value is based on 17 values ranged from 181,000 to 341,000 Pa. The

page 88 of 125 RIVM report 711701021
selected geometric mean is 298,000 Pa. The resulting Henry’s law constant (18.5) also differsfrom the INS value (0.646). The INS value is a measured value. However, Van de Plasscheand Bockting (1993) observed considerable differences between measured values (range0.646 to 50). Because the Henry’s law constant for the human risk assessment is critical (seeoutermost right column of Table 5.6:), it is recommended to determine the Henry’s lawconstant and or the vapour pressure values for vinylchloride according to state-of-the-artquality standards.
Kow and KocThe INS-log Koc selected for aldrin (5.11) differs by one log unit from the revised log Kocfor aldrin (4; standard deviation 1, N=12), and two log units from the current Koc (7.01)according Van den Berg (1995). The LOGPSTAR value for aldrin (also used by INS) seemshigh compared with the CLOGP value and the average value from selected values (see Table3.5: Log Kow values for all compounds). The INS Koc is a Kow-based partition coefficientaccording to Gerstl (1990). Because the Koc is a critical parameter it is recommended toevaluate the observed differences, if necessary completed with additional measurements.Also for other drins differences between INS log Kow and log Koc values and revised logKow and log Koc values are observed. The revised set seems more consistent.The INS log Koc selected for tetrachloromethane (2.83) differs from the revised log Koc(1.75). The INS log Koc is derived from the Kow value according to the empirical regressionequation Koc = Kow (Van de Plassche and Bockting, 1993). The revised log Koc is based on11 values (Table 3.6) ranging from 1.1 – 2.1.The INS log Koc selected for carbofuran (1.63) matches well with the revised log Koc (1.64).The INS-log Kow (Bockting et al., 1993) is somewhat higher (2.32 against 1.63) whichimplies a higher plant uptake. The INS log Koc values for ethylbenzene, naphthalene,styrene, o-xylene and dichloromethane are somewhat higher (0.3 log unit) than the revisedlog Koc values. The effects of these differences are less than a factor 2 on the SRChuman level.Other differences are observed for some chlorophenols. The small set of underlying data maybe the cause. The aggregation of the data for individual chlorophenols to one average valuefor di-, tri- and tetrachlorophenols is a possible solution. Appendix 6 gives the values forALL di-, tri- and tetrachlorophenols. Calculations with the physicochemical data for ALL di-,tri- and tetrachlorophenols lead to comparable risk levels.
Summarising, it may be said that the two sets are comparable, taking into account the natureand expected uncertainty of physicochemical data (e.g. Koc values, see section 3.3). Thedifferences found for aldrin and dieldrin remain unclear. Another matter for attention is theuncertainty of the derived data for vinylchloride (Vp and H) and, consequently. theuncertainty of the derived SCRhuman for this compound.

RIVM report 711701021 page 89 of 125
5.2. The soil, site and exposure parametersTable 5.7 gives an overview of all the parameters describing the CSOIL standard soil, the siteand the exposure parameters for adults and children (also called the receptor characteristics).The site and exposure parameters are based on the user scenario ‘residential with garden’. Inchapter 2 it was explained that only the most critical parameters were selected for evaluation.For al the evaluated parameters, a current 1995 and a revised value are given; changes aregiven in bold. The revised parameters will be shortly discussed below. The relevant sectionfor each evaluated parameter is given in the outermost right column.
Table 5.7: Current and revised soil, site and exposure parameters and constantsParameters code unit current revised evaluated in
value (1995) value (2000) sectionSoil parameterssoil temperature T [K] 283volume fraction air Va [-] 0.2 0.2 4.2.2volume fraction water Vw [-] 0.2 0.3 4.2.2volume fraction soil Vs [-] 0.6 0.5 4.2.2fraction organic carbon foc [-] 0.058 0.058*1 4.2.4percentage clay L [%] 25 25*1 4.2.5dry bulk density SD [kg/dm3] 1.5 1.2 4.2.3pH pH [-] 6 6*1 4.2.6Constants and site parametersgas constant R [Pa.m3/mol.K] 8.3144thickness boundary layer d [m] 0.005 removed Rikken et al., 2001flux of evaporating water Ev [m3/m2.d] 0.0001 removed 4.3.1viscosity of air ETA [Pa.h) - 5 E-09 4.3.6mean depth of contamination dp [m] 1.25 1.25 4.3.2air permeability of soil KAPPA [m2] - 1 E-11 4.3.6air-exchange rate Vv [1/h] 1.25 1.1 4.3.4height of crawl space Bh [m] 0.5 0.5 4.3.3depth of groundwater table dg [m] - 1.75 4.3.2height of the capillary transition boundary z [m] - 0.5 4.3.2air pressure difference crawl space and room DELTAPCS [Pa] - 1 4.3.6contribution of the crawl space air to indoor air fbi [-] 0.1 0.1 4.3.5diameter contaminated area Lp [m] 100fraction dry matter root crops fdwr [-] 0.202 0.167 4.4.3fraction dry matter leafy crops fdws [-] 0.117 0.098 4.4.3deposition constant dpconst [kg/kg] 1.09E-03 0.01 Rikken et al., 2001fraction soil in dust inside frsi [-] 0.8fraction soil in dust outside frso [-] 0.5dillution factor pore water-ground water fdil [-] 0.1 removed Lijzen et al., 2001temperature bath water Tsh [K] 313drinking water constant dwconst [-] 45.6Exposure parametersfraction exposed skin showering fexp [-] 0.4retention factor soil particles in lungs fr [-] 0.75relative sorption factor Fa [-] 1relative sorption factor soil ingestion Fag [-] - 1 *2 Lijzen et al., 2001matrix factor dermal uptake fm [-] 0.15showering period tdc [h per day] 0.25bathing period td [h] 0.5fraction contaminated root crops Fvk [-] 0.1 0.1fraction contaminated leafy crops Fvb [-] 0.1 0.1

page 90 of 125 RIVM report 711701021
Table 5.7 continuedcode unit children adults children adults evaluated
Exposure parameters 1995 1995 2000 2000 sectionbody weight BWc,a [kg] 15 70daily intake soil AIDc,a [kg per
day]1.50E-04 5.00E-05 1.00E-04 5.00E-05 4.5.
consumption of root crops Qk'c,a [kg fw perday]
0.0748 0.1367 0.0595 0.1220 4.4.2.
consumption of leafy crops Qb'c,a [kg fw perday]
0.0761 0.1578 0.0583 0.1390 4.4.2.
consumption of drinking water Qdw,c,a [dm3 perday]
1 2
dermal sorption coefficient DACc,a [kg per day] 6.43E-06 5.92E-06inhalation of soil particles ITSPc,a [kg per day] 3.13E-07 8.33E-07inhalation period indoors Tiic,a [h] 21.14 22.86inhalation period outdoors Tioc,a [h] 2.86 1.14air volume Avc,a [m3/h] 0.32 0.83body surface Atotc,a [m2] 0.95 1.8exposed surface skin indoors Aexpc,a i [m2] 0.05 0.09exposed surface skin outdoors Aexpc,a o [m2] 0.28 0.17degree of coverage skin indoors DAEc,a i [kg/m2] 5.6E-04 5.6E-04degree of coverage outdoors DAEc,a o [kg/m2] 5.1E-03 3.8E-02dermal absorption velocity DARc,a [1/h] 0.01 0.005period exposure through contact soilindoors
Tbci,a [h per day] 9.14 14.86
period exposure through contact soiloutdoors
Tbco,a [h per day] 2.86 1.14
dillution velocity Vfc,a [m/h] 161.3 324.6
*1 These values differ from the recommended values in Table 4.2: foc= 0.029, %clay= 15, pH= 5.2 (see text)*2 Only for lead were enough data available to provisionally lower this Relative Absorption Factor to 0.6(Lijzen et al., 2001).
Soil parametersThe soil parameters describe the standard soil as used in the CSOIL model. The SRC levels(both ecotoxicological as humantoxicological risk concentrations) are based on this standardsoil. Two approaches for the determination of the standard soil were considered. In theevaluation (section 4.2) it was proposed to base the standard soil characteristics on acombination of two major Dutch soil types, which resulted in hypothetical representative soilcharacteristics. By mutual agreement it was decided to revise only a part of the recommendedparameter values (see footnote Table 5.7). The implementation of the recommended standardsoil characteristics in the procedure so as to derive ecotoxicological risk limits was one of themain constrains. Implementing all revised values in the future is recommended.The impact of the revised values on the SRChuman is small. If the recommended value for focwere to be implemented, the SRChuman for most compounds would be halved. Changing thepercentage of clay and pH would have an impact on the BCF and Kp for metals.
Constants and site parametersThe evaluation of the model concept for calculating the indoor air concentration led toremoval of the thickness boundary layer (d) and the evaporation flux of water (Ev). The air-exchange rate of the crawl space (Vv) was based on more data, slightly changed. Theevaluation of model concepts also led to the introduction of the constant viscosity of air(ETA) and the parameters air permeability of soil (KAPPA, κ), pressure difference betweencrawl space and soil air (DELTAPCS, ∆Pcs), depth of the groundwater table (dg) and thecapillary transition boundary (z). The revised parameters are described in section 4.3. Further

RIVM report 711701021 page 91 of 125
details are given in Rikken et al. (2001). The impact of the changed model concept on theSRChuman is given in Lijzen et al. (2001). The impact of only the changed data (Vv) is small.A minor change is the revision of the fraction dry matter of vegetables and potatoes, leadingto a slightly lower estimated accumulation of metals in crops. Another change for organiccompounds is the higher value for deposition (better called ‘soil resuspension’), of which theimpact on the risk limit also depends on the change in the model concept for uptake by plants.The dillution factor of pore water to groundwater has been removed from the procedure. Themain reason for this modification of the proposed derivation of SRC levels for groundwater isthe lack of scientific backing for including this factor in the model, as described in Lijzen etal. (2001).
Exposure parametersThe daily intake of soil by children has been revised from 150 to 100 mg per day. This valueis uncertain for specific children or situations but is based on a statistical interpretation of thereported yearly average soil ingestion rate of eight references (see section 4.5.2.). The impactof this change is small for most compounds, because a lifetime-averaged exposure is used.Only for lead, for which exposure to children is used, this change led to a higher human risklimit for soil. The daily intake of soil refers only to inadvertent soil ingestion. Pica behaviour,which can provoke acute toxicity effects (Calabrese et al., 1997), is considered to be outsidethe scope of potential risk assessment, but could be considered in the future. The daily soilingestion rate by adults is maintained at 50 mg per day.The fraction of contaminated crops is maintained at 0.1, although it can be argued that it doesnot describe the average situation in the Netherlands (section 4.4.4). The intake of root cropsand leafy crops is revised for children and adults and leads to a lower exposure of about 10%for the exposure pathway of crop consumption. The relative sorption factor (Fag) for soilingestion is maintained at one for all compounds except lead. Metals present in the soilmatrix are considered less available for the human body than metals present in food (Sips etal., in prep.).
5.3. RecommendationsEvaluation and revision of the CSOIL parameters have resulted in a well-founded, state-of-the-art data set. The use of the revised data contributes to the improved derivation ofSRChuman levels for soil, sediment and groundwater.For vinylchloride uncertainty remains about the selected values for vapour pressure andHenry’s law constant. Because both parameters are critical for the derived SRChuman, anadditional study is recommended. This also applies to the Kow and Koc values selected foraldrin and dieldrin. Deviation of the selected values might be arguable, also for othercompounds. However, it must be realised that the selected parameter values are meant forgeneric purposes (potential risk assessment) and moreover, the encountered uncertainties ofphysicochemical data must be balanced against the uncertainties of other parameters, modelconcepts and human toxicological risk levels (MTR).
In conclusion, the evaluation has broadened the information on the uncertainty and variationof the input parameters; it is recommended using this information to deal quantitatively withuncertainties in the risk assessment.The revised data is also used (in part) for deriving ecotoxicological risk levels (SRCeco). Afurther harmonisation with other related activities is desirable although it is realised thatdifferences in objectives, starting points and selection criteria could constitute a possibleobstacle.

page 92 of 125 RIVM report 711701021

RIVM report 711701021 page 93 of 125
ReferencesBaars AJ, Theelen RMC, Janssen PJCM, Hesse JM, Van Apeldoorn ME, Meijerink MCM, Verdam, L;Zeilmaker MJ (2001): Re-evaluation of human-toxicological Maximum Permissible Risk levels. RIVM,Bilthoven. RIVM report 711701025.
Baes, C.F. Sharp, R.D., Sjoreen, A.L., and Shor, R.W. (1984) A review and analysis of parameters for assessingtransport of environmentally released radionuclides. Compound data for organic solvents. Values used forfurther calculations through agriculture. Oak Ridge National Laboratory, USA. ORNL Report No. 5786.Available from National Technical Information Service, U.S. Department of Commerce, 5285 Port Royal Road,Springfield, Virginia 22161.
BEVER (1999). Van Trechter naar Zeef. UPR BEVER/Sdu , The Hague, October (in Dutch).
Binder, S.M.D. D.M.D. Sokal, D.M.A. Maughan, 1986. Estimating soil ingestion: the use of tracer elements inestimating the amount of soil ingested by young children. Archives of Environmental health, Vol 41, No 6, 341-345.
Bockting, G.J.M.; Van den Berg, R. (1992) The accumulation of trace metals in crops grown on contaminatedsoils. A literature study. RIVM, Bilthoven. RIVM report 725201009 (in Dutch).
Bockting, G.J.M., Van de Plassche, E.J., Struijs, J.; Canton, J.H. (1992) Soil-water partition coefficients fortrace elements. RIVM, Bilthoven. RIVM report 679101003.
Bockting, G.J.M., Van de Plassche, E.J., Struijs, J.; Canton, J.H. (1993) Soil-water partition coefficients fororganic compounds. RIVM, Bilthoven. RIVM report 679101013.
Bockting, G.J.M., J.G.M. Koolenbrander; F.A. Swartjes. (1996) SEDISOIL: Model for the calculation of humanexposure due to contaminated sediments. RIVM, Bilthoven. RIVM report 715810011 (in Dutch).
Boerngen, J.H. and H.T. Shacklette (1980). Chemical analysis of fruits, vegetables and their associate soils fromares of commercial production in the conterminous United States. Geological survey, U.S.A open file report 80-84. United States.
Briggs, G.G., R.H. Bromilow, and A.A. Evans (1982) Relationship between lipophilicity and root uptake andtranslocation of non-ionised chemicals by barely. Pestic.Science, 13: 495-504.
Briggs, G.G., R.H. Bromilow, A.A. Evans, and M. Williams, (1983) Relationship between lipophilicity anddistribution of non-ionised chemicals in barely shoots following uptake in roots. Pestic.Science, 14: 492-500.
Buchter, B., B. Davidoff, M.c. Amacher, C. Hinz, I.K. Iskander and H.M. Selim. 1989. Correlation of freundlichKd and n retention parameters with soils and elements. Soil Science vol. 48: 370-379.
Chang, R.1981. Physical chemistry with applications to biological systems ; 2nd ed New York ; MacMilland.
Calabrese, E.J., R. Barnes, E.J. Stanek III, H. Pastides, C.E. Gilbert, P. Veneman, X. Wang, A. Lasztity, P.Kostecki, (1989) How much soil do young children ingest; an epidemiologic study. Regulatory Toxicology andPharmacology, Vol 10, 123-137.
Calabrese, E.J., E.J. Stanek III, C.E. Gilbert and R.M. Barnes, 1990. Preliminary Adult Soil ingestion Estimates:Results of a pilot study. Regulatory toxicology and pharmacology 12, 88-95 (1990)
Calabrese, J., E.J. Stanek, R.C. James and S.M. Roberts. (1997) Soil ingestion: a concern for acute toxicity inChildren. Environmental Health Perspectives 105.
Chang, R., 1990. Physical chemistry with applications to biological systems. Macmillan Publ. Co., New York(NY), USA.
Clausing, P, B. Brunekreef, J.H. van Wijnen, 1987. A method for estimating soil ingestion by children. Int.Arch. Occup. Environm. Health, Vol 59, 73-82
Crommentuijn, T., M.D. Polder and E.J. van de Plassche (1997). Maximum Permissable Concentrations andNegligable Concentrations for metals, taken background concentrations into account. RIVM, Bilthoven. RIVMreport 679101019.
CRC Handbook of chemistry and physics, 79th edition, 1998.

page 94 of 125 RIVM report 711701021
Davis, S., P. Waller, R. Buschom, J. Ballou, and P. White (1990) Quantative estimates of soil ingestion innormal children between the ages 2 and 7: population based estimates using Al, Si and Ti as soil tracer elements.Archives of Environmental Health 45, 112-122.
De Bruijn, J., Crommentuijn, T., Van Leeuwen, K., Van der Plassche, E., Sijm, D. and Van der Weiden, M.(1999) Environmental Risk Limits in The Netherlands. RIVM, Bilthoven. RIVM report 601640 001.
Elzinga, E.J., B. van den Berg, J.J.M. van Grisven en F.A. Swartjes. 1997. Freundlich adsorptievergelijkingenvoor cadmium, koper en zink in de bodem op basis van literatuurgegevens. RIVM, Bilthoven. RIVM report711501001.
EUSES (1997) EUSES; the European Union System for the evaluation of substances; EUSES1.00 User Manual.TSA Group Delft BV, The Netherlands.
Fast, T., J. Kliest, H. van de Wiel, 1987. De bijdrage van verontreiniging van de lucht in woningen. Report no. 6in de publicatiereeks Milieubeheer. VROM, Leidschendam, The Netherlands.
Franken, R.O.G., A.J. Baars, G.H. Crommentuijn and P.F. Otte (1999). Proposal for revised Intervention Valuesfor petroleum hydrocarbons (‘minerale olie’) on base of fractions of petroleum hydrocarbons. RIVM, Bilthoven.RIVM report 7117015.
Gerstl, Z., (1990). Estimation of organic chemical sorption by soils. J. Contaminant Hydrology 6: 357-375.
Hawley, J.K. (1985). Assessment of health risk from exposure to contaminated soil. Risk Analysis, Vol. 5, no. 4.
Herms, U. und G. Brümmer, (1980). Einfluss der Bodenreaktion au Löslichkeit und tolerierbare Gesamtgehaltean Nickel, Kupfer, Zink, Cadmium und Blei in Böden und kompostierten Siedlungsabfällen. landw. Forsch.33(4): 408-423.
Hulshof, P.J.M., (1988). De groentenconsumptie van volkstuinders. Staatstoezicht op de Volksgezondheid,Rijswijk.
Jager, D.T., M.G.J. Rikken and P. van der Poel (1997). Uncertainty analysis of EUSES: Improving riskmanagement by probabilistic risk assessment. RIVM, Bilthoven. report 679102039.
Janssen, R.P.T., P.J. Pretorius, W.G.J.M. Peijnenburg, M.A.G.T. van den Hoop (1996). Determination of field-based partition coefficients for heavy metals in Dutch soils and the realtionships of these coefficients sith soilcharacteristics. RIVM Bilthoven. RIVM report 719101023.
Janssen, R.P.T.; Peijnenburg, W.J.G.M.; Posthuma, L.; Van den Hoop, M.A.G.T. (1997) Equilibriumpartitioning of heavy metals in Dutch field soils. I. Relationship between metal partition coefficients and soilcharacteristics. Environ. Toxicol. Chem. 16: 2470-2478.
Karickhoff, S.W., Brown, D.S. and Scott, T.A. (1979). Sorption of hydrophobic pollutants on natural sediments.Water Res. 13: 241-248.
Karickhoff, S.W. (1981). Semi-empirical estimation of sorption of hydrophobic pollutants on natural sedimentsand soils. Chemosphere 10(8): 833-846.
King, L.D. (1988). Retention of metals by several soils of the Southeastern United States. Journal ofEnvironmental Quality, 17(2): 239-250.
Kliest, J.J.G. (1991). Vaststelling van de potentiële en actuele inhalatoire blootstelling als gevolg vanbodemverontreiniging. RIVM, Bilthoven. Report 725201004.
Koops, R., J.J.M. van Grinsven, T. Crommentuijn, M.A.G.T. van den Hoop, F.A. Swartjes, P.R.G. Kramer andW.J.G.M. Peijnenburg (1998). Evaluatie van door het RIVM gehanteerde partitiecoëfficiënten voor metalen.RIVM, Bilthoven. RIVM report 711401005.
Koorevaar , P, G. Menelik, C. Dirksen (1983). Elemenst of Soil Physics. Developments in Soil Science 13.Elsevier, Amsterdam.
Köster , H.W. (2001). Risk assessment of historical soil contamination with cyanides; origin, potential humanexposure and evaluation of Intervention Values. RIVM, Bilthoven. RIVM report 711701019.
Kreule, P.; Swartjes, F.A. (1998) Proposals for Intervention Values for soil and groundwater, including thecalculation of the human-toxicological serious soil contamination concentrations: fourth series of compounds.RIVM report 711701005.

RIVM report 711701021 page 95 of 125
Lagas, P. and Groot, M.S.M. (1996). Bodemkwaliteitskartering van de nederlandse landbouwgronden. RIVM,Bilthoven. RIVM report 714801003.
Lee, L.S., P.S.C. Rao, and M.L. Brusseau (1991). Nonequilibrium sorption and transport of neutral and ionizedcompounds. Environ. Sci. Tech., 25: 722-729.
Linders, J.B.H.L. (1990). Risicobeoordeling voor de mens bij blootstelling aan stoffen. Uitgangspunten enveronderstellingen. RIVM, Bilthoven. RIVM report 725201003.
Lijzen, J.P.A.; Baars, A.J.; Crommentuijn, G.H.; Otte, P.F.; Plassche, E. van de; Rikken, M.G.J. ; Rompelberg,C.J.M.; Sips, A.J.A.M.; Swartjes, F.A. (1999). Revision of the Intervention value for lead; evaluation of theIntervention Values derived for soil/sediment and groundwater. RIVM, Bilthoven. RIVM report 711701013 (inDutch ).
J.P.A. Lijzen, A.J. Baars, P.F. Otte, M. Rikken, F.A. Swartjes, E.M.J. Verbruggen and A.P. van Wezel (2001).Technical evaluation of the Intervention Values for Soil/sediment and Groundwater. Human andecotoxicological risk assessment and derivation of risk limits for soil, sediment and groundwater. RIVM,Bilthoven. report 711701 023.
Mackay D., S. Paterson, B. Cheung, W. Brock Neely (1985). Evaluating the environmetal behaviour ofchemicals with a level III fugacity moel. Chemosphere 14: 335-374.
McKone T.E. and K.T. Bogen (1990). Uncertainty in exposure and health risk assessment: An integratedapproach. Livermore, Lawrence Livermore National Laboratory, 90-186.2.
Medchem (1996). Database and calculation method for Kow values (developed at Pomona College, Claremont,California, and described by Leo et al., 1971).
Mensink, B.J.W.G. M. Montforts, L. Wijkhuizen-Máslankiewics, H. Tibosch and J.B.H.J. Linders. (1995).Manual for summarising and evaluating the environmental aspects of pesticides. RIVM, Bilthoven. RIVMreport 679101022.
Ng, Y.C.., Cosher, Y.C., and Thompson, S.E. (1982). Soil-to-plant concentration factors for radiologicalassessments. Washington, Lawrence Livermore National laboratory. Reportnumber, NUREG/CR-2975 UCID-19463.
Otte, P.F, M. van Elswijk, M. Bleijenberg, F. Swartjes en C. van de Guchte (2000a). Calculation of human risklimits voor sediments; Discussion report RIZA-werkdocument 2000.084x (in Dutch). Bilthoven/Lelystad, mei2000.
Otte, J.G., P.F.A.M. Römkens, A. Tiktak and W. de Vries (2000b). Partitie relaties voor zware metalen (Cd, Cu,Pb, Zn) voor diffuus verontreinigde Nederlandse bodems (in Dutch). PGBO, Wageningen. Reports PGBO, deel30, 44pp.
Rikken, M.G.J, J.P.A. Lijzen and A.A. Cornelese (2001). Evaluation of model concepts on human exposure;proposals for updating of the most relevant exposure routes of CSOIL. RIVM, Bilthoven. RIVM 711701022.
Sauerbeck, D. (1989) Der Transfer von Schwermetallen in die Pflanze: Die Beurteilung vonSchwermetallkontaminationen im Bodem. DECHEMA, Frankfurt am Main, ISBN 3-926959-06-1.
Sabljić, A., Güsten, H., Verhaar, H. and Hermens, J. (1995). Qsar modelling of soil sorption. Improvement andsystematics of log Koc vs. log Kow correlations. Chemosphere 31 (11-12); 4489-4514.
Sauvé, S.; Henderschot, W.; Allen, H.E. (2000). Solid-solution partitioning of metals in contaminated soils:dependence on pH, total metal burden and organic matter. Environ. Sci. Technol. 34:1125-1131.
Sheppard, S.C., W.G. Evenden (1992). Contaminant enrichment of sparingly soluble contaminants (U, Th andPb) by erosion and by soil adhesion to plants and skin. Environmental Geochemistry and Health 14 121-131
Silvers, A., B.T. Florence, D.L. Rourke, R.J. Lorimor (1994). How children spend their time: A sample survey foruse in exposure and risk assessment. Risk Analysis, Vol. 14, No. 6: 931-944
Simon, S.L. (1998). Soil ingestion by humans: a review of history, data and etiology with application to riskassessment of radioactively contaminated soil. Health Physics, Volume 74, No 6, pp 647-672.
Sips AJAM, Bruil MA, Dobbe CJG, van de Kamp E, Pereboom DPKH, Rompelberg CJM, Zeilmaker MJ. (inpreparation). Bioaccessibility of contaminants from ingested soil in humans assessed in an in vitrodigestionmodel. - I. a) Project definition, b) optimisation and c) results for lead and benzo[a]pyrene. RIVM, Bilthoven.RIVM report 711701 012.
page 96 of 125 RIVM report 711701021
Stanek III, E.J. and E.J. Calabrese (1995a). Daily estimates of soil ingestion in children. Environmental healthperspectives 103, no 3, pp 276-285.
Stanek III, E.J. and E.J. Calabrese (1995b). Soil ingestion estimates for use in site evaluations based on the besttracer method. Hum. Ecol. Risk Assess. Vol 1, No 2, pp 133-156.
Staples. C.A., D.R. Peterson, T.F. Parkerton and W.J. Adams (1997). The environmenta fate of phthalate esters:A literature review. Chemosphere 35 (4): 667-749.
Steenwijk, J.M. van, G. Cornelissen, Th.E.M. Ten Hulscher (1999). Omgaan met verdelingscoëfficiënten voororganische verbindingen. RIZA rapport 99.023, Lelystad.
Stoop, P., P. Glastra, Y. Hiemstra, L. de Vries and J. Lembregts (1998). Results of the second Dutch nationalsurvey on radon in dwellings. RIVM, Bilthoven. RIVM report 610058006).
Swartjes, F.A. (1999). Risk-based assessment of soil and groundwater quality in the Netherlands: Standards andremediation urgency. Risk Anal. 19:1235-1249.
Trapp, S. and M. Matthies (1995). Generic one-compartment model for uptake of organic chemicals by foliarvegetation. Environmental Science and Technology, vol. 29, no.9, 2333-2338.
United States Environmental Protection Agency (1997). Exposure Factors Handbook Volume I – GeneralFactors. EPA/600/P-95/002Fa. Update to Exposure Factors Handbook. EPA/600/8-89/043.
United States Environmental Protection Agency (1996). Soil Screening Guidance: Technical BackgroundDocument. Publication 9355.4-17A.
Van den Berg, R. and Roels, J.M. (1991). Assessment of risks to man and the environment in case of exposureto soil contamination. Integration of the results of the preceding studies. RIVM, Bilthoven. RIVM report725201013.
Van den Berg, R. (1995). Exposure of man to soil contamination. A qualitative and quantitative analysis,resulting in proposals for human-toxicological C values. RIVM, Bilthoven, Revised version of RIVM report725201011.
Van den Berg, R. (1997). Verantwoording van gegevens en procedures voor de 1e tranche interventiewaarden:van RIM-rapporten naar de Notitie interventiewaarden bodemsanering. RIVM, Bilthoven. RIVM report715810012.
Van de Plassche, E.J., and G.J.M. Bockting (1993). Towards integrated environmental quality objectives forseveral volatile compounds. RIVM, Bilthoven, RIVM report 679101011.
Van der Heyden and Hofman (1987). Bemonstering van drinkwater op plaatsen van bodemverontreiniging.SBD-36104. Gemeentelijke Drinkwaterleiding Rotterdam.
Van den Hoop, M.A.G.T. (1995). Metal speciation in Dutch soils: Field based partition coefficients for heavymetals at background levels. RIVM, Bilthoven. RIVM report 719191913.
Van de Ven-Breken, T.J., J. Brenot, S. Bonnefous, H. Noordijk, H.P. Leenhouts (1990). Consumption of food inEC countries, CEC research programme Post Chernobyl, Action 5: Underlying data for derived emergencyreference levels. RIVM, Bilthoven. RIVM report 243402002.
Van Gestel, C.A.M., E.M. Dirven-van Breemen. J.W. Kamerman (1992). Beoordeling van gereinigde grond IV.Toepassing van bioassays met planten en regenwormen op referentiegronden. RIVM, Bilthoven. RIVM report216402004.
Van Wezel, A.P. Van Vlaardingen, P.; Posthumus, R.; Crommentuijn, G.H.; Sijm, D.T.H.M. (2000)Environmental risk limits for two phthalates, with special emphasis on endocrine disruptive properties.Ecotoxicol. Environ. Saf. 46:305-321.
Van Wijnen, J.H., P. Clausing, B. Brunekreef (1990). Estimated soil ingestion by children. EnvironmentalResearch, Vol 51, 147-162.
Verbruggen, E.M.J., R. Posthumus and A.P. van Wezel, (2001) Ecotoxicological Serious Risk Concentrationsfor soil, sediment and water: updated proposals for first series of compounds. RIVM, Bilthoven. RIVM report711701020.
Verschueren, K. en R. Kolkhuis Tanke (1989). Risicoindexen voor bodem- en grondwaterbedreigende stoffen.Micon milieuconsultants, 1989, rapportnr. 050153-4.
RIVM report 711701021 page 97 of 125
Versluijs, C.W., R. Koops, P. Kreule and M.F.W. Waitz (1998). The accumulation of soil contaminants incrops, location-specific calculation based on the CSOIL module. RIVM, Bilthoven. RIVM report 711701008.
Versluijs, C.W., and P.F. Otte (in preparation). Accumulation of metals in plants as function of soil type.RIVM, Bilthoven. RIVM report 711701024 (in Dutch).
Vissenberg, H.A., and F.A. Swartjes (1996). Evaluatie van de met CSOIL berekende blootstelling, middels eenop Monte Carlo-technieken gebaseerde gevoeligheids- en onzekerheidsanalyse. RIVM, Bilthoven. RIVMrapport 715810018.
Voedingscentrum, Den Haag (1998). Zo eet Nederland. Resultaten van de voedselconsumptiepeiling 1997-1998.
Vonk, M.W. (1985). Permeation of organic chemicals through piping materials. Mededelingen no. 85, KIWA,Nieuwegein, The Netherlands (in Dutch), also in: H2O, 18: 529-538 (in Dutch).
Vries, F. de (1994). Een fysisch-chemische karakterisering van de bodemeenheden van de Bodemkaart vanNederland, schaal 1:50,000, met onderscheid naar grondgebruik. Rapport 286. DLO-Staring Centrum,Wageningen, 1994.
VROM (1988). Premises for risk management (annex to the Dutch Environmental Policy Plan). Lower House,session 1988-1989, 21 137, no. 5.
VROM, Ministry of, (1994). Ministerial Circular on second phase remediation paragraph, Soil Protection. Act.Reference DBO/16d94001.
VROM, Ministry of, (1995). Urgentie van bodemsanering; de handleiding. SDU, Den Haag , 1995 (ISBN9012082218).
VROM, Ministry of, (1999). Governmental view on the soil use specific and cost-effective approach of soilcontamination (in Dutch). Tweede Kamer 1999-2000, 25411, no 7.
Waitz, M.F.W., J.I. Freijer, P. Kreule and F.A. Swartjes (1996). The Volasoil risk assessment model based onCSOIL for soils contaminated with volatile compounds. RIVM, Bilthoven, RIVM report 715810014.
Wösten, J.H.M., G.J. Veerman, J. Stolte (1994). Waterretentie- en doorlatendheidkarakteristieken van boven- enondergronden in Nederland: De Staringreeks. New edition 1994. DLO-Staring centrum, Wageningen, TheNetherlands. Technische Document 18.

page 98 of 125 RIVM report 711701021
Mailing List1- 6 DGM/BWL-directeur, Drs. J.A. Suurland7 Plv. Directeur-Generaal Milieubeheer, VROM, Dr.ir. B.C.J. Zoeteman8 Directoraat-Generaal Milieubeheer, Directie Bodem, Water en Landelijk gebied,
Afdeling Landelijk gebied en Bodembeheer, Dr. J.M. Roels9 Hoofdinspectie van de Volksgezondheid voor de Milieuhygiëne, Mr. G.J.R. Wolters10-14 Regionale Inspecties van de Volksgezondheid voor de Milieuhygiëne15 Mr. drs. A. Gravesteijn (DGM/BWL)16 Drs. N.H.S.M. de Wit (DGM/BWL)17 Dr. ir. A.E. Boekhold (DGM/BWL)18 Dr. T. Crommentuijn (DGM/BWL)19 Mr. A.B. Holtkamp (DGM/LMV)20 Dr. J.A. van Zorge (DGM/SAS)21 Dr. M.E.J. van der Weiden (DGM/SAS)22-44 Onderzoeksbegeleidingsgroep ECO, via dr. D.T.H.M. Sijm (RIVM-CSR)45-61 Onderzoeksbegeleidingsgroep HUMAAN, via ir. J.P.A. Lijzen (RIVM-LBG)62-70 Leden Werkgroep UI, via Dr. T. Crommentuijn (DGM/BWL)71 VNG/WEB, via J. Verburg (VNG, Den Haag)72 IPO/ABO, via F. Kok (Prov. Zuid-Holland, Den Haag)73 NARIP, via Dr. H. Leenaers (NITG-TNO, Delft)74 ONRI-werkgroep bodem, via Drs. M.F.X. Veul (Witteveen en Bos, Deventer)75 CLARINET, via Mr. H. Kasamas (CLARINET office, Vienna, Austria)76 Dr. N. Earl (University of Nottingham, UK)77 Ir. C. Cornelis (VITO, Belgium)78 Dr. D. Müller (Umweltbundesamt, Vienna ,Austria)79 Dr. R. Bonnart (INERIS, Verneuil-en-Halatte, France)80 Dr. J. Brogan (EPA, Dublin, Ireland)81 Dr. F. Quercia (ANPA, Rome, Italy)82 Dr. C. Jorge (LNEC, Lissabon, Portugal)83 Dr. J. Sovari (Finish Environment Institute, Helsinki, Finland)84 Dr. J. Vegter (TCB, Den Haag)85 Ir. T.M. Lexmond (WUR, Wageningen)86 Drs. J. Wezenbeek (Grontmij, Houten)87 Ing. P.J. Smit (Van Hall Instituut, Groningen)88 Dr. ir. P. Römkens (Alterra, Wageningen)89 Dr. ir. W. de Vries (Alterra, Wageningen)90 Dr. B. Bosveld (Alterra, Wageningen)91 Dr. N. Earl (University of Nottingham)92 Drs. P. Kreule (TAUW)93 Drs. M.F.W. Waitz (TAUW)94 Drs. C. diMauro (TNO-MEP)95 Dr. A. Sinke (TNO-MEP)96 Drs. J. Tuinstra (IWACO)97 Dr. I. Canter-Cremers (IWACO)98 Drs. E. van der Plassche (Haskoning)99 Dr. V. Dries (OVAM)100 Dr. J. Vink (RIZA)101 Drs. M. van Elswijk (RIZA)102 Ir. A.B. Roeloffzen (Gemeentewerken Rotterdam)103 Depot Nederlandse Publikaties en Nederlandse Bibliografie104 Directie van het Rijksinstituut voor Volksgezondheid en Milieu

RIVM report 711701021 page 99 of 125
105 Prof.ir. N.D.van Egmond (dir. Milieu)106 Ir. F. Langeweg (dir. Sector Milieuonderzoek)107 Dr. ir. G. de Mik (dir. Sector Stoffen en Risico’s)108 Dr. W.H. Könemann (hCSR)109 Ir. R. van den Berg (hLBG)110 Ir. J.J.G. Kliest (hIEM)111 Dr. R.C.G.M. Smetsers (hLSO)112 Ir. A.H.M. Bresser (hLWD)113 Dr. A. Opperhuizen (hLEO)114 Drs. J.H. Canton (hECO)115 Dr. A.P. van Wezel (CSR)116 Prof.dr. C.J. van Leeuwen (CSR)117 Dr. D.T.H.M. Sijm (CSR)118 Drs. T.G. Vermeire (CSR)119 Ing. P. Janssen (CSR)120 Drs. M.G.J. Rikken (CSR)121 Dr. E.M.J. Verbruggen (CSR)122 Dr. A.J. Baars (CSR)123 Dr. T. Traas (CSR)124 Drs. D.T. Jager (ECO)125 Dr. W. Peijnenburg (ECO)126 Dr. L. Posthuma (ECO)127 Dr. M. Rutgers (ECO)128 Dr. A.J.A.M. Sips (LBM)129 Dr. M.P.M. Janssen (LSO)130 Drs. B.J. de Haan (LBG)131 Dr. H.W. Köster (LBG)132 Ir. R.O.G. Franken (LBG)133- 137 Auteurs138 SBD/Voorlichting and Public Relations139 Bureau Rapportenregistratie140 Bibliotheek RIVM141 Bibliotheek RIVM, depot LBG142 Bibliotheek CSR143-170 Bureau Rapportenbeheer171-180 Reserve exemplaren
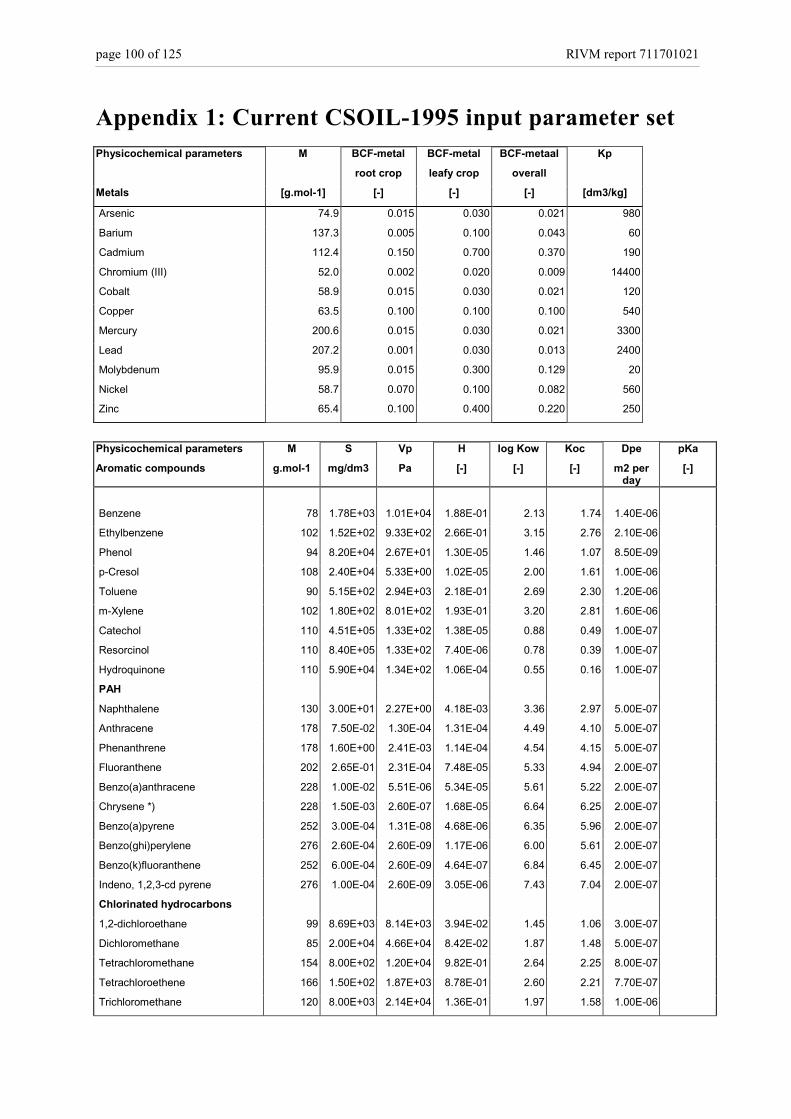
page 100 of 125 RIVM report 711701021
Appendix 1: Current CSOIL-1995 input parameter setPhysicochemical parameters M BCF-metal BCF-metal BCF-metaal Kp
root crop leafy crop overall
Metals [g.mol-1] [-] [-] [-] [dm3/kg]
Arsenic 74.9 0.015 0.030 0.021 980
Barium 137.3 0.005 0.100 0.043 60
Cadmium 112.4 0.150 0.700 0.370 190
Chromium (III) 52.0 0.002 0.020 0.009 14400
Cobalt 58.9 0.015 0.030 0.021 120
Copper 63.5 0.100 0.100 0.100 540
Mercury 200.6 0.015 0.030 0.021 3300
Lead 207.2 0.001 0.030 0.013 2400
Molybdenum 95.9 0.015 0.300 0.129 20
Nickel 58.7 0.070 0.100 0.082 560
Zinc 65.4 0.100 0.400 0.220 250
Physicochemical parameters M S Vp H log Kow Koc Dpe pKa
Aromatic compounds g.mol-1 mg/dm3 Pa [-] [-] [-] m2 perday
[-]
Benzene 78 1.78E+03 1.01E+04 1.88E-01 2.13 1.74 1.40E-06
Ethylbenzene 102 1.52E+02 9.33E+02 2.66E-01 3.15 2.76 2.10E-06
Phenol 94 8.20E+04 2.67E+01 1.30E-05 1.46 1.07 8.50E-09
p-Cresol 108 2.40E+04 5.33E+00 1.02E-05 2.00 1.61 1.00E-06
Toluene 90 5.15E+02 2.94E+03 2.18E-01 2.69 2.30 1.20E-06
m-Xylene 102 1.80E+02 8.01E+02 1.93E-01 3.20 2.81 1.60E-06
Catechol 110 4.51E+05 1.33E+02 1.38E-05 0.88 0.49 1.00E-07
Resorcinol 110 8.40E+05 1.33E+02 7.40E-06 0.78 0.39 1.00E-07
Hydroquinone 110 5.90E+04 1.34E+02 1.06E-04 0.55 0.16 1.00E-07
PAH
Naphthalene 130 3.00E+01 2.27E+00 4.18E-03 3.36 2.97 5.00E-07
Anthracene 178 7.50E-02 1.30E-04 1.31E-04 4.49 4.10 5.00E-07
Phenanthrene 178 1.60E+00 2.41E-03 1.14E-04 4.54 4.15 5.00E-07
Fluoranthene 202 2.65E-01 2.31E-04 7.48E-05 5.33 4.94 2.00E-07
Benzo(a)anthracene 228 1.00E-02 5.51E-06 5.34E-05 5.61 5.22 2.00E-07
Chrysene *) 228 1.50E-03 2.60E-07 1.68E-05 6.64 6.25 2.00E-07
Benzo(a)pyrene 252 3.00E-04 1.31E-08 4.68E-06 6.35 5.96 2.00E-07
Benzo(ghi)perylene 276 2.60E-04 2.60E-09 1.17E-06 6.00 5.61 2.00E-07
Benzo(k)fluoranthene 252 6.00E-04 2.60E-09 4.64E-07 6.84 6.45 2.00E-07
Indeno, 1,2,3-cd pyrene 276 1.00E-04 2.60E-09 3.05E-06 7.43 7.04 2.00E-07
Chlorinated hydrocarbons
1,2-dichloroethane 99 8.69E+03 8.14E+03 3.94E-02 1.45 1.06 3.00E-07
Dichloromethane 85 2.00E+04 4.66E+04 8.42E-02 1.87 1.48 5.00E-07
Tetrachloromethane 154 8.00E+02 1.20E+04 9.82E-01 2.64 2.25 8.00E-07
Tetrachloroethene 166 1.50E+02 1.87E+03 8.78E-01 2.60 2.21 7.70E-07
Trichloromethane 120 8.00E+03 2.14E+04 1.36E-01 1.97 1.58 1.00E-06

RIVM report 711701021 page 101 of 125
Physicochemical parameters M S Vp H log Kow Koc Dpe pKa
Aromatic compounds g.mol-1 mg/dm3 Pa [-] [-] [-] m2 perday
[-]
Trichloroethene 132 1.10E+03 8.01E+03 4.07E-01 2.71 2.32 1.60E-06
Vinylchloride 63 1.10E+03 3.55E+05 8.57E+00 2.71 2.32 1.00E-06
Monochlorobenzene 113 5.00E+02 1.17E+03 1.12E-01 2.81 2.42 3.50E-06
1,4-Dichlorobenzene 147 4.90E+01 8.00E+01 1.02E-01 3.40 3.01 2.00E-06
1,2,4-Trichlorobenzene 182 1.90E+01 1.87E+01 7.59E-02 4.06 3.67 1.00E-06
1,2,3,4-Tetrachlorobenzene 216 3.50E+00 5.34E-01 1.40E-02 4.70 4.31 1.00E-06
Pentachlorobenzene 251 2.40E-01 1.33E-01 5.90E-02 5.17 4.78 1.00E-06
Hexachlorobenzene 285 1.10E-01 1.33E-03 1.46E-03 5.34 4.95 1.00E-06
2-Chlorophenol 129 2.85E+04 1.07E+02 2.05E-04 2.39 2.00 4.80E-09 8.43
2,4-Dichlorophenol 163 4.60E+03 1.33E+01 2.00E-04 3.15 2.76 1.00E-07 7.81
2,3,4-Trichlorophenol 198 1.19E+03 1.07E+00 7.55E-05 3.88 3.49 5.40E-07 7.01
2,3,4,5-Tetrachlorophenol 232 1.25E+02 1.33E-01 1.05E-04 3.35 2.96 1.00E-06 6.07
Pentachlorophenol 267 1.40E+01 1.47E-02 1.19E-04 5.13 4.74 2.24E-06 4.85
1-Chloronaphatalene 163 2.24E+01 5.25E+00 1.62E-02 3.85 3.46 5.00E-07
2,5,2'-Trichlorobiphenyl (PCB 18) 258 2.25E-01 7.00E-04 3.40E-04 5.60 5.21 5.00E-07
Hexachlorobiphenyl 361 1.20E-02 7.00E-04 8.95E-03 6.57 6.18 2.00E-07
Pesticides
DDT 355 3.10E-03 2.53E-05 1.23E-03 6.18 5.79 5.00E-07
DDE 318 4.00E-02 1.33E-05 4.49E-05 5.73 5.34 5.00E-07
Aldrin 365 1.00E-02 3.07E-03 4.76E-02 7.40 7.01 5.00E-07
Dieldrin 381 1.00E-01 2.40E-05 3.89E-05 5.36 4.97 5.00E-07
Endrin 393 2.00E-02 2.67E-05 2.23E-04 4.95 4.56 5.00E-07
α-HCH 291 1.63E+00 3.33E-03 2.53E-04 3.72 3.33 5.00E-07
β-HCH 291 2.40E-01 3.73E-05 1.92E-05 3.72 3.33 5.00E-07
γ-HCH 291 7.80E+00 2.13E-02 3.38E-04 3.72 3.33 5.00E-07
δ-HCH 291 3.14E+01 2.26E-03 8.90E-06 3.72 3.33 5.00E-07
Carbaryl *) 201 1.20E-01 6.67E-01 4.75E-01 5.37 4.98 2.00E-07
Carbofuran *) 221 5.00E-01 2.70E-03 5.07E-04 4.95 4.56 2.00E-07
Maneb 265 1.00E-04 1.00E-04 1.13E-01 7.43 7.04 2.00E-07
Atrazine 216 7.00E+01 4.00E-05 5.23E-08 2.18 1.79 2.00E-07
Others
Cyclohexanone *) 98 2.30E+04 5.33E+02 9.65E-04 1.83 1.44 1.00E-07
Butylbenzylphthalate 312 2.90E+00 1.15E-03 5.26E-05 4.44 4.05 2.00E-06
Di(2-ethylhexyl)phthalate 390 2.85E-01 8.60E-04 5.00E-04 5.12 4.73 2.00E-06
Pyridine *) 79 2.33E+02 3.11E+03 4.48E-01 3.16 2.77 2.00E-06
Styrene 104 3.00E+02 6.67E+02 9.83E-02 3.09 2.70 2.00E-06
Tetrahydrofuran *) 72 2.18E+02 1.02E+05 1.43E+01 3.18 2.79 2.00E-06
Tetrahydrothiophene *) 88 1.06E+01 2.41E+03 8.52-00 4.06 3.67 2.00E-06
*) For compounds marked with a star the physicochemical parameters were changed in 1998 asrecommended by Van den Berg (1997). In the above table the values are according Van denBerg (1995).

page 102 of 125 RIVM report 711701021
Soil parameters unit code currentvalue (1995)
soil temperature [K] T 283volume fraction air [-] Va 0.2volume fraction water [-] Vw 0.2volume fraction soil [-] Vs 0.6fraction organic carbon [-] foc 0.058percentage clay [%] L 25dry bulk density [kg/dm3] SD 1.5pH [-] pH 6constantsgas constant [Pa.m3/mol.K] R 8.3144thickness boundary layer [m] d 0.005flux of evaporating water [m3/m2.d] Ev 0.0001viscosity of air [Pa.h) ETA -mean depth of contamination [m] dp 1.25air permeability of soil [m] KAPPA -air-exchange rate [1/h] Vv 1.25height of crawl space [m] Bh 0.5air pressure difference crawl space and room [Pa] DELTAPCS -contribution of the crawl space air to indoor air [-] fbi 0.1diameter contaminated area [m] Lp 100fraction dry matter root crops [-] fdwr 0.202fraction dry matter leafy crops [-] fdws 0.117deposition constant [-] dpconst 1.09E-03fraction soil in dust inside [-] frsi 0.8fraction soil in dust outside [-] frso 0.5dillution factor pore water-ground water [-] fdil 0.1temperature bath water [K] Tsh 313drinking water constant [-] dwconst 45.6
exposure parametersfraction exposed skin showering [-] fexp 0.4retention factor soil particles in lungs [-] fr 0.75relative sorption factor [-] Fa 1relative sorption factor soil ingestion [-] Fag -matrix factor dermal uptake [-] fm 0.15showering period [h per day] tdc 0.25bathing period [h] td 0.5fraction contaminated root crops [-] Fvk 0.1fraction contaminated leafy crops [-] Fvb 0.1
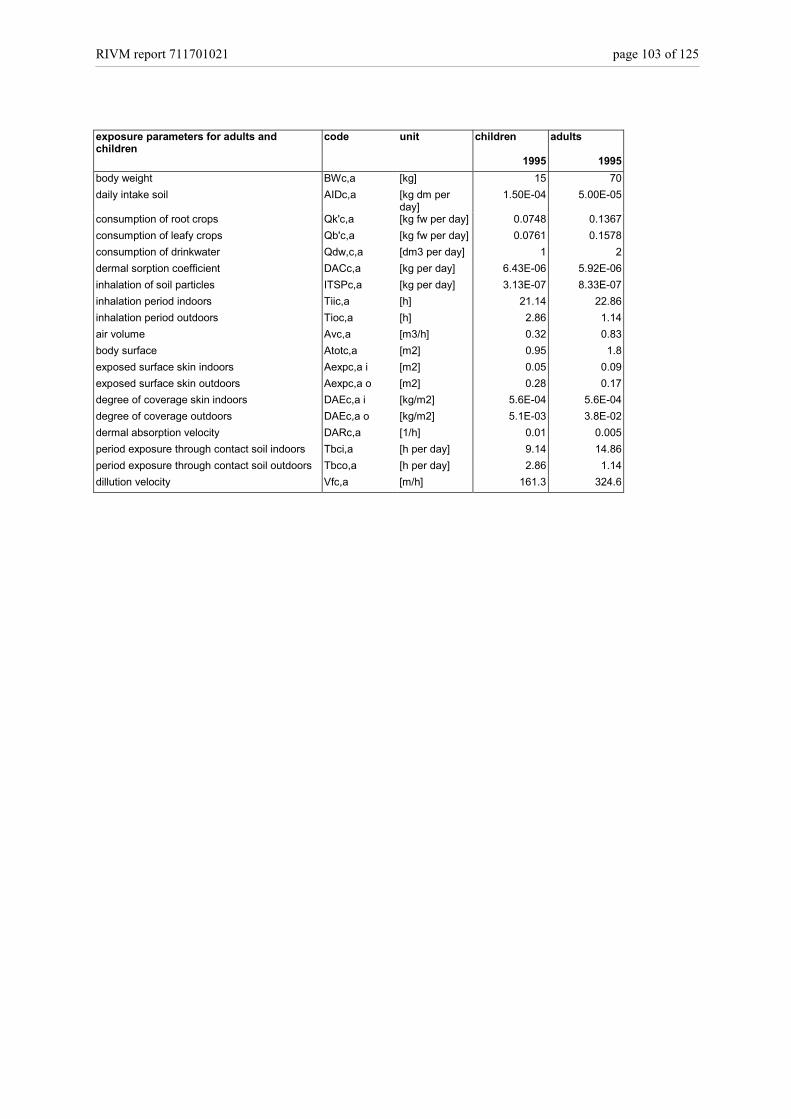
RIVM report 711701021 page 103 of 125
exposure parameters for adults andchildren
code unit children adults
1995 1995body weight BWc,a [kg] 15 70daily intake soil AIDc,a [kg dm per
day]1.50E-04 5.00E-05
consumption of root crops Qk'c,a [kg fw per day] 0.0748 0.1367consumption of leafy crops Qb'c,a [kg fw per day] 0.0761 0.1578consumption of drinkwater Qdw,c,a [dm3 per day] 1 2dermal sorption coefficient DACc,a [kg per day] 6.43E-06 5.92E-06inhalation of soil particles ITSPc,a [kg per day] 3.13E-07 8.33E-07inhalation period indoors Tiic,a [h] 21.14 22.86inhalation period outdoors Tioc,a [h] 2.86 1.14air volume Avc,a [m3/h] 0.32 0.83body surface Atotc,a [m2] 0.95 1.8exposed surface skin indoors Aexpc,a i [m2] 0.05 0.09exposed surface skin outdoors Aexpc,a o [m2] 0.28 0.17degree of coverage skin indoors DAEc,a i [kg/m2] 5.6E-04 5.6E-04degree of coverage outdoors DAEc,a o [kg/m2] 5.1E-03 3.8E-02dermal absorption velocity DARc,a [1/h] 0.01 0.005period exposure through contact soil indoors Tbci,a [h per day] 9.14 14.86period exposure through contact soil outdoors Tbco,a [h per day] 2.86 1.14dillution velocity Vfc,a [m/h] 161.3 324.6

page 104 of 125 RIVM report 711701021
Appendix 2: Evaluation of databases and selection ofphysicochemical parameter values.
1. Database analysisChemical databases can be used for extracting values for a number of CSOIL inputparameters. Values for the following input parameters, indispensable for the calculation ofhuman exposure, can be found in these databases:• molecular weight;• solubility;• vapour pressure;• dissociation exponent;• octanol-water partition coefficient (Kow);• organic carbon normalised soil-water partition coefficient (Koc).
To prevent that much time will be spent on searching, it is recommended to restrict thenumber of databases that will be searched for. To evaluate which databases contain the mostand the most reliable values for of the above mentioned physicochemical properties, thefollowing databases were examined:
• Merck• Chemiekaarten;• Merck Safety Data Sheet;• International Chemical Safety Cards;• Beilstein;• HSDB: Hazardous Substance Data Bank;• Ohmtads;• Cheminfo;• CESARS: Chemical Evaluation Search and Retrieval System;• Pesticide Manual 11th edition.• Medchem;• ASTER;
The database ‘Epiwin’, which in fact is a computer program which calculates values forparameters for organic compounds, is not used for this database analysis.
The 11 organic compounds, for which the databases are searched, are:• Hydroquinone;• Vinyl Chloride;• Pyridine;• Pentachlorobenzene;• Pentachlorophenol;• 1-Chloronaphtalene;• 2-Chloronaphtalene;• Beta-hexachlorocyclohexane (β-HCH);

RIVM report 711701021 page 105 of 125
• Cyclohexanone;• Styrene.
2. Selection of retrieved valuesNot all the available values in the databases are used for the examination of the databases. Onthe condition that three or more values are available for a certain compound, in the followingcases values are not used:When the temperature belonging to the value of the solubility, the vapour pressure or thedissociation exponent is beyond the temperature range 0 - 25°C;When the temperature belonging to the value of the solubility, the vapour pressure or thedissociation exponent is lacking. When less than three values are given a temperature of 20°Cis supposed;In case a value of a variable is expressed as a ‘smaller than’-value;When the solubility is described, for example as ‘not soluble’, these descriptions are not used.In case a relatively small range of solubility or vapour pressure is given at one temperature,the mean value of solubility or vapour pressure is used. When a vapour pressure range and acorresponding temperature range are given, the minimum value of the vapour pressure issupposed to belong to the minimum value of the temperature and the maximum value of thevapour pressure to the maximum value of the temperature.
To compare the values of the various variables it is necessary that the variables be expressedin the same units. Therefore the values for the solubility and the vapour pressure arerecalculated to the same units. For solubility the unit ‘mg/l’ is used and for vapour pressurethe unit ‘Pascal’ is used. In case the solubility is expressed as a percentage, the unit isinterpreted as weight solute per weight solvent when the compound is a solid at soiltemperature (10 °C). When the compound is a fluid at soil temperature (10 °C) the unit isinterpreted as volume solute per volume solvent. The formulas to convert the unit‘percentage’ in these two cases are nevertheless identical. All the occurring units and the wayof conversion are presented in table 1.
Table 1: Units and way of conversion (M = molecular weight; SW = specific weight)Parameter Conversion FormulaSolubility mol/m3 � mg/l mg/l = mol/m3 * M
mol/l � mg/l mg/l = mol/l * 1000 * Mppm � mg/l mg/l = ppm% (m3/ m3) � mg/l mg/l = % * SW% (g/g) � mg/l mg/l = % * SW
Vapour pressure mmHg � Pa Pa = mmHg * 133.33bar � Pa Pa = bar * 105
torr � Pa Pa = torr * 133.33atm � Pa Pa = atm* 1.01325*105
pKa pKb � pKa pKa = 14 – pKb

page 106 of 125 RIVM report 711701021
3. Temperature correction of vapour pressure (Vp) andsolubility (S)
Vapour pressure and solubility are physicochemical properties correlated with each other viathe Henry constant. Both vapour pressure and solubility are highly temperature dependent(Waitz et al., 1996). The values of these input parameters given in the chemical databases aremeasured or calculated at several temperatures. To use these values for the calculation ofgeometric means and the distribution, the values are recalculated to soil temperature (10 °C)by applying temperature corrections.
The vapour pressure at a given temperature will be recalculated to a vapour pressure at 10 °C(283 K) by using the Clausius-Clapeyron equation (Chang, 1990).
( )RTT
HTT vap
eVpVp ××−
= 21
12
12 [1]
Vp1 = vapour pressure at T1 [Pa]Vp2 = vapour pressure at T2 [Pa]R = molar gas constant [8.3144 J.mol-1.K-1]Hvap = enthalpy of vaporisation at 298 K [J.mol-1]T1 = temperature at known vapour pressure (e.g. 293 K) [K]T2 = temperature at unknown vapour pressure (e.g. 283 K) [K]
The value of the enthalpy of vaporisation at 298 K (25 °C) is 104.8089 Joules per gram. Thisvalue can be recalculated for each compound by multiplication by the molecular weight ofthe compound (Weast et al.,1974).
Because solubility and vapour pressure are correlated to each other, temperature correctionfor solubility will be realised using a temperature correction for the Henry constant (Waitz etal.,1996):
H VpS1
1
1
= [2]
H1 = Henry constant at T1 [Pa.m3.mol-1]Vp1 = vapour pressure at T1 [Pa]S1 = solubility at T1 [mol.m-3]
To obtain the value of the vapour pressure at T1 in the above mentioned equation, first thegeometric mean of all the calculated values per compound at 10 °C are calculated with theexception of outliers. Then the values of the vapour pressure at T1 are calculated by using atemperature correction for the vapour pressure (formula [1]). The Henry constant at 10 °C(H2) can be calculated by the following temperature correction:
( )( )H H e T T2 1
0 024 2 1= −. [3]
H2 = Henry constant at T2 [Pa.m3.mol-1]H1 = Henry constant at T1 [Pa.m3.mol-1]T1 = temperature at known Henry constant (e.g. 293 K) [K]T2 = temperature at unknown Henry constant (e.g. 283 K) [K]

RIVM report 711701021 page 107 of 125
This temperature correction is an empirical expression of the Arrhenius equation, which isbased on the assumption that in a closed container the number of collisions between gasmolecules increases with higher temperatures (Waitz et al., 1996).
By using the vapour pressure at 10 °C (T2)(calculated with the temperature correction forvapour pressure, equation [1]) and the Henry constant at 10 °C (T2) (calculated with equation[3]), the unknown solubility (S2) at 10°C (T2) can be calculated (Waitz et al., 1996):
S VpH2
2
2
= [4]
S2 = solubility at T2 [mol.m-3]Vp2 = vapour pressure at T2 [Pa]H2 = Henry constant at T2 [Pa.m3.mol-1]
4. Determination of geometric means and the spread of valuesTo express the uncertainty of a calculated geometric mean, the spread of the values iscalculated by the following equation:
( )%100
_minmax ×
−meangeometric
XX[5]
It is considered to exclude outliers on the basis of a Z-test and to express the uncertainty asthe standard deviation, but for application of the Z-test and the standard deviation a normaldistribution of the data is required. In the data sets too few values are available to assume anormal distribution.On the other hand, the use of the relative spread as an indicator for the quality of thecalculated value is disrupted in case of low values, log expressed values (Kow, Koc and pKa)and in case of clear-cut outliers. It is concluded that a univocal parameter to indicate thequality of a data set is not easily found. In this report (chapter 2) an indication is given toinput values that are considered critical to the model output. The stigma is based on theresults of the sensitivity analysis.
5. Results of the database analysisIn table 2 the findings are resumed to obtain an overview of databases that yield the mostvalues. To produce this overview the number of compounds is considered for a certaindatabase for which one or more values are available.

page 108 of 125 RIVM report 711701021
Table 2: Overview of databases that yield the most valuesInput parameter Order of databases that yield the most values
(from left tot right)Molecular weight 12 4 2 1 8Solubility 12 5, 6 7 9Vapour pressure 12 6 2,4,5Log Kow 11,12 6 4 9pKa 5 12 6 1Log KocNumber database: 7 Ohmtads1 Merck 8 Cheminfo2 Chemiekaarten 9 CESARS3 Merck Safety Data Sheet 10 Pesticide Manual 11ed
4 International Chemical Saftey Cards 11 Medchem5 Beilstein 12 ASTER6 HSDB
It appears that the databases ‘ASTER’ and ‘International Chemical Safety Cards’ yield themost values for the input parameter molecular weight. The databases ‘ASTER’, ‘Beilstein’and ‘HSDB’ yield the most values for solubility. ‘HSDB’ and ‘Chemiekaarten’ yield the mostvalues for vapour pressure. Further yield ‘Medchem’, ‘ASTER’ and ‘HSDB’ the most valuesfor the octanol-water partition coefficient (Kow). ‘Beilstein’ and ‘HSDB’ yield the mostvalues for the dissociation coefficient (pKa).
6. Conclusion and recommendationThe quality judgement of the geometric mean of each data set strongly depends on theaccuracy of the measuring method and on the number of values that are available.The databases that produce the most values on the whole and which can be searched best are:ASTER;HSDB;Beilstein;The databases, which can be searched second best, are:Medchem;Chemiekaarten;International Safety Cards.
The databases that yield the most values for each input parameter are considered. In table 3an overview is presented of databases that are advised to search for each parameter.
Table 3: Overview of databases that are advised to search for each parameterASTER HSDB Beilstein Medchem Chemie-
kaartenICSC
Molecularweight
X X
Solubility X X XVapourpressure
X X
Log Kow X X XpKa X X

RIVM report 711701021 page 109 of 125
Based on these findings it was decided that:
• Data on molecular weight , solubility, vapour pressure, pKa and log Kow will beretrieved from the three best 6 databases (standard procedure).
• Occasionally it will be necessary to complete the data set with data from other sources.• Conversion of data according to table 1• Temperature correction of Vp and S according to the method of this appendix• Determination of the parameter value according to 1.3.
Given the poor results of retrieved Koc data a different approach for this parameter will befollowed (see Appendix 3).
6 With the earmark ‘best’ we willnot suggest a quality judgment in the general sense of speaking. Thejudging of databases must be seen in the frame of the objectives of this study.

page 110 of 125 RIVM report 711701021
Appendix 3: A guideline for the selection of the soil-water partition coefficients for organic compoundsFor a number of organic compounds, it is experienced that the retrieved data for Koc,originated from the selected databases, results in a poor data set. To improve the data set andto select a recognised value a guideline for selecting Koc values for risk assessment wasdetermined in co-operation with others.Appendix 2 gives a guideline for extracting values for a number of CSOIL input parameters.For the selection of a Koc value however, this elementary guideline will, for mostcompounds, results in unsatisfactory number of values.It is understood by researchers that, because of the complexity of the selection of Koc’s, acloser look is always required. This results in a current practice were different researchersapplies different approaches resulting in a number of Koc values.This problem was put to several ‘Koc users’ within the RIVM and RIZA. Simultaneous withthis question a stepwise guideline was formulated as a first move to establish some kind ofguideline and finally achieve a recognised set of Koc values.
ExplanationAbout harmonisationTo some extent, harmonisation of Koc values (within the RIVM) is seen as a useful activity.The proposed steps seem to fit with the current practice within INS scope. The proposed useof the Sabljić models has common consent.
About experimental Koc valuesGenerally speaking, the feeling exist that experimental measured values should be the basisof a recognised Koc value. Although the Koc is normalised on organic matter, it is said thateach measured Koc is in fact a site-specific Koc (Van Steenwijk et al. 1999). Nature and typeof organic matter (polarity C/N+O, aromaticity) can influence the Koc value up till a factor10. Moreover, the process of so-called ‘slow desorption’ in situ can provoke variation up tilla factor 100. This effect is site-specific and simply not predictable. For potential riskassessment however these site-specific effects are considered outside the scope of this study.The general feeling is that a Koc based on a set of good experimental determined values (insitu) will meet the requirements to asses potential risks.
‘Kow derived’ Koc valuesIf a reliable set of measured Koc values is not available the Koc can be derived from theKow. All consulted Koc users prefer the models of Sabljić (1995). Sabljić defined QSARmodels for 20 compound groups. He reported the application range (log Kow range) andindicated the reliability ( ± 2σ range ). A diagram for the selection of the proper QSARmodel is available. In case the derivation according to Sabljić is problematic it isrecommended to use the Syracuse Program EPIWIN. This program calculates as well theKow as the Koc. The calculation of the Koc is based on first order molecular connectivityindices. The program is more easy than the application of the Sabljić models because it is notnecessary to select the appropriate model.

RIVM report 711701021 page 111 of 125
Koc values for sedimentsSome Koc users mentioned the lack of (experimental) data on sediments. Therefor theapplication of the soil Koc’s for sediments is recommended. In case of actual (site-specific)risk assessment of sediments, additional measurements are recommended.
Guideline
The guideline is based on the suggestions and experiences of the consulted ‘Koc users’ andshould be seen in relation with the overall objective: ‘a recognised Koc value for the potentialrisk assessment’.A time consuming activity like literature study is not explicitly included. Of course there arearguments to carry out additional literature study, but this should be judged from case to case.
The selection of a Koc value for potential risk assessment follows the next steps:
Step 1The retrieval of measured Koc’s from the recommended databases and surveys
Step 2A derived Koc value from the Kow (the Kow value from the CSOIL data set) according toSabljić et al. The log Kow – log Koc relationships, based on QSAR modelling are developedfor 19 chemical domains (table 1). The selection of the most appropriate QSAR sorptionmodel should be according the guidelines of Sabljić et al. (1995).
Step 3In principle the final Koc value will be the geometric mean7 of:• all experimental (measured) Koc’s• one derived Koc according Sabljić.
RemarksErratic Koc values should be judged separately. If there is report of unsatisfactory quality ordeviant methods the Koc value should be eliminated from the data set.The applied Sabljić model can be disputable. If the derived Koc deviates from the set ofmeasured Koc’s it should be considered to remove this value from the data set.Note that a surplus value is assigned to the experimental Koc’s by combining ALLexperimental Koc’s with ONE derived Koc.
7 In case the Koc values are expressed as log, a normal average is calculated.

page 112 of 125 RIVM report 711701021
Table 1: Derived log Kow-log Koc relationships for 19 chemical domains (Sabljić et al.,1995).
No. Chemical domain Equation1 Predominantly hydrophobic log Koc = 0.10 + 0.81 log Kow2 Nonhydrophobic log Koc = 1.02 + 0.52 log Kow3 Phenols, anilines, benzonitriles, nitrobenzenes log Koc = 0.90 + 0.63 log Kow4 Acetanilines, carbamates, esters, phenylureas,
phophates, triazines, triazoles, uracilslog Koc = 1.09 + 0.47 log Kow
5 Alcohols, organic acids log Koc = 0.50 + 0.47 log Kow6 Acetanilides log Koc = 1.12 + 0.40 log Kow7 Alcohols log Koc = 0.50 + 0.39 log Kow8 Amides log Koc = 1.25 + 0.33 log Kow9 Anilines log Koc = 0.85 + 0.62 log Kow10 Carbamates log Koc = 1.14 + 0.365 log Kow11 Dinitroanilines log Koc = 1.92 + 0.38 log Kow12 Esters log Koc = 1.05 + 0.49 log Kow13 Nitrobenzenes log Koc = 0.55 + 0.77 log Kow14 Organic acids log Koc = 0.32 + 0.60 log Kow15 Phenols and benzonitriles log Koc = 1.08 + 0.57 log Kow16 Phenylureas log Koc = 1.05 + 0.49 log Kow17 Phosphates log Koc = 1.17 + 0.49 log Kow18 Triazines log Koc = 1.50 + 0.30 log Kow19 Triazoles log Koc = 1.405 + 0.47 log Kow
The selection of soil-water partition coefficients for dissociating organiccompounds
The use of fixed Koc values, as derived according the guideline is not valid for ionisingorganic compounds. Several of the organic compounds ionise in the soil environment existingin both neutral and ionised forms. The relative amounts of the ionised and neutral species area function of pH.To address this problem, the derivation of Koc values for ionising organic compounds ispartly different from the guideline.
The retrieval of Koc values can take place according the guideline. However, for thederivation of the generic Koc valid for the standard soil, only those values determined atknown soil pH will be considered. The derivation of a Koc normalised for known soil pH isdescribed in chapter 3.

RIVM report 711701021 page 113 of 125
Appendix 4: Crop specific data on metal accumulation.
Table 1. Overview of averages and ranges of BCF valuesCrop Range
(5 percentile-95percentile)
Median Geometricmean
Average oflog BCF
Standarderror oflog BCF
As allpotatoescarrotsspinach
0.001- 0.150.001- 0.0150.04- 0.210.01- 0.08
0.0250.0030.0660.024
0.0190.0030.0260.067
-1.73-2.48-1.59-1.17
0.650.400.320.30
Cd allpotatoesbeetrootcarrotsradishleektomatoescabbagecurly kalelettuceendivespinachbeans
0.09- 4.60.07- 0.930.10- 0.820.33- 6.60.50- 0.770.04- 0.270.15- 430.04- 250.08- 0.420.24- 2.00.17- 2.40.7- 70.07- 18
0.550.270.321.30.710.13100.190.230.730.632.20.24
0.550.280.311.30.660.123.00.290.220.740.682.270.42
-0.26-0.56-0.510.12-0.18-0.920.48-0.54-0.66-0.13-0.170.36-0.37
0.540.400.280.380.070.271.141.080.230.380.340.340.55
Cu allpotatoescarrotstomatoescabbagecauliflowerlettucebeans
0.09- 0.800.16- 0.560.14- 0.390.44- 0.800.07- 0.16-0.30- 0.480.16- 0.90
0.290.370.230.550.090.120.330.24
0.280.330.230.590.01-0.350.32
-0.56-0.48-0.64-0.23-1.00--0.46-0.50
0.290.240.170.110.13-0.090.26
Hg allpotatoescarrotsspinach
0.02- 30.01- 0.50.1- 1.40.08- 4
0.330.110.450.40
0.280.100.530.43
-0.55-0.99-0.28-0.37
0.620.590.640.34
Ni allpotatoescarrotstomatoescabbagecauliflowerlettucebeans
0.010- 0.150.009- 0.0240.013- 0.100.017- 0.080.009- 0.037-0.020- 0.0430.030- 0.34
0.0250.0150.0210.0290.0210.060.0350.19
0.0290.0150.0300.0330.019-0.0310.11
-1.54-1.84-1.53-1.48-1.72--1.50-0.96
0.380.170.390.280.25-0.150.57
Pb allpotatoesbeetrootcarrotsradishonionsleektomatoescabbagecurly kalelettuceendivespinachbeans
0.002- 0.080.002- 0.010.0011- 0.010.008- 0.080.01- 2.60.006- 0.0160.002- 0.0120.0010- 0.070.0024- 0.020.010- 0.060.005- 0.110.007- 0.040.013- 0.100.0015- 0.05
0.0150.0050.0030.0300.120.00950.00480.0150.0120.0300.0180.0180.0380.012
0.0150.0050.0040.0280.140.0090.0050.0100.0090.0270.0200.0160.370.009
-1.83-2.28-2.45-1.55-0.9-2.03-2.31-2.02-2.07-1.58-1.69-1.78-1.44-2.05
0.550.300.330.340.910.160.240.850.360.260.460.260.290.61
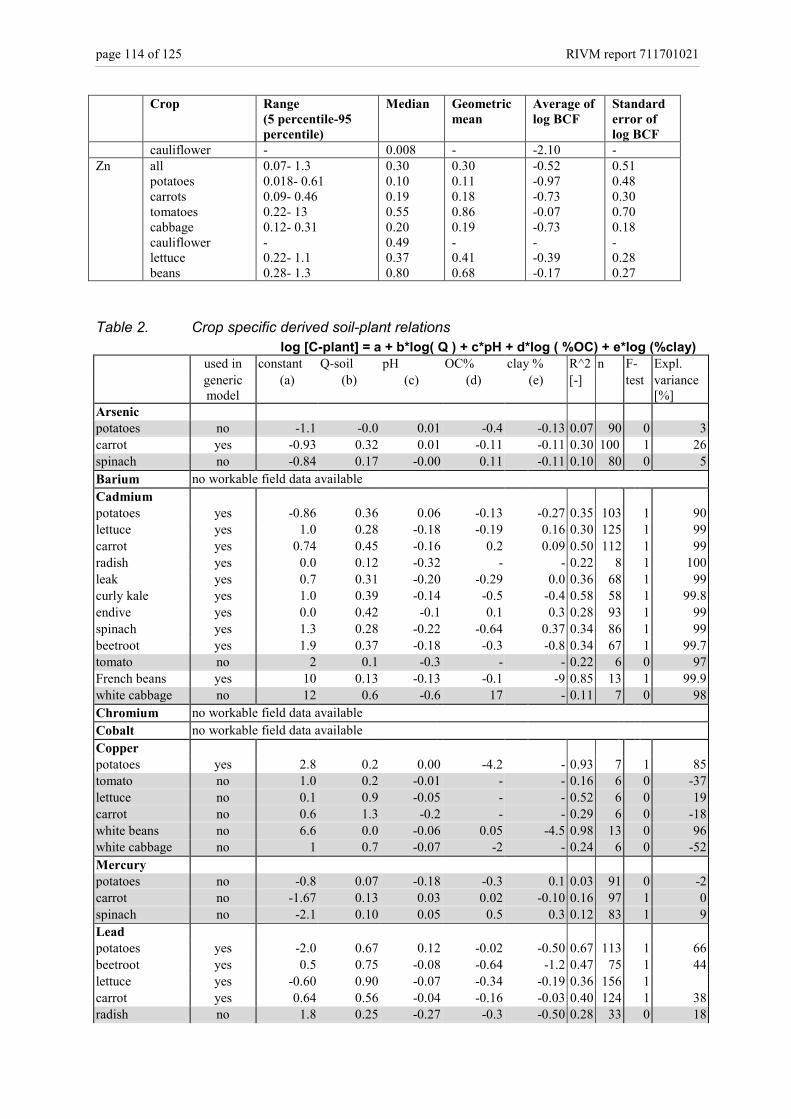
page 114 of 125 RIVM report 711701021
Crop Range(5 percentile-95percentile)
Median Geometricmean
Average oflog BCF
Standarderror oflog BCF
cauliflower - 0.008 - -2.10 -Zn all
potatoescarrotstomatoescabbagecauliflowerlettucebeans
0.07- 1.30.018- 0.610.09- 0.460.22- 130.12- 0.31-0.22- 1.10.28- 1.3
0.300.100.190.550.200.490.370.80
0.300.110.180.860.19-0.410.68
-0.52-0.97-0.73-0.07-0.73--0.39-0.17
0.510.480.300.700.18-0.280.27
Table 2. Crop specific derived soil-plant relationslog [C-plant] = a + b*log( Q ) + c*pH + d*log ( %OC) + e*log (%clay)
used in constant Q-soil pH OC% clay % R^2 n F- Expl.genericmodel
(a) (b) (c) (d) (e) [-] test variance[%]
Arsenicpotatoes no -1.1 -0.0 0.01 -0.4 -0.13 0.07 90 0 3carrot yes -0.93 0.32 0.01 -0.11 -0.11 0.30 100 1 26spinach no -0.84 0.17 -0.00 0.11 -0.11 0.10 80 0 5Barium no workable field data availableCadmiumpotatoes yes -0.86 0.36 0.06 -0.13 -0.27 0.35 103 1 90lettuce yes 1.0 0.28 -0.18 -0.19 0.16 0.30 125 1 99carrot yes 0.74 0.45 -0.16 0.2 0.09 0.50 112 1 99radish yes 0.0 0.12 -0.32 - - 0.22 8 1 100leak yes 0.7 0.31 -0.20 -0.29 0.0 0.36 68 1 99curly kale yes 1.0 0.39 -0.14 -0.5 -0.4 0.58 58 1 99.8endive yes 0.0 0.42 -0.1 0.1 0.3 0.28 93 1 99spinach yes 1.3 0.28 -0.22 -0.64 0.37 0.34 86 1 99beetroot yes 1.9 0.37 -0.18 -0.3 -0.8 0.34 67 1 99.7tomato no 2 0.1 -0.3 - - 0.22 6 0 97French beans yes 10 0.13 -0.13 -0.1 -9 0.85 13 1 99.9white cabbage no 12 0.6 -0.6 17 - 0.11 7 0 98Chromium no workable field data availableCobalt no workable field data availableCopperpotatoes yes 2.8 0.2 0.00 -4.2 - 0.93 7 1 85tomato no 1.0 0.2 -0.01 - - 0.16 6 0 -37lettuce no 0.1 0.9 -0.05 - - 0.52 6 0 19carrot no 0.6 1.3 -0.2 - - 0.29 6 0 -18white beans no 6.6 0.0 -0.06 0.05 -4.5 0.98 13 0 96white cabbage no 1 0.7 -0.07 -2 - 0.24 6 0 -52Mercurypotatoes no -0.8 0.07 -0.18 -0.3 0.1 0.03 91 0 -2carrot no -1.67 0.13 0.03 0.02 -0.10 0.16 97 1 0spinach no -2.1 0.10 0.05 0.5 0.3 0.12 83 1 9Leadpotatoes yes -2.0 0.67 0.12 -0.02 -0.50 0.67 113 1 66beetroot yes 0.5 0.75 -0.08 -0.64 -1.2 0.47 75 1 44lettuce yes -0.60 0.90 -0.07 -0.34 -0.19 0.36 156 1carrot yes 0.64 0.56 -0.04 -0.16 -0.03 0.40 124 1 38radish no 1.8 0.25 -0.27 -0.3 -0.50 0.28 33 0 18

RIVM report 711701021 page 115 of 125
used in constant Q-soil pH OC% clay % R^2 n F- Expl.genericmodel
(a) (b) (c) (d) (e) [-] test variance[%]
leak yes 0.8 0.5 -0.12 -0.61 0.57 0.41 68 1 37curly kale yes 2.0 0.29 -0.11 -0.62 -0.65 0.48 59 1 44endive yes 1.9 0.52 -0.17 -0.68 -0.8 0.42 89 1 39spinach yes -0.12 0.36 -0.03 0.25 -0.23 0.34 80 1 39onions no -1 0.4 0.1 - - 0.12 9 0 -16tomato no -2 -1.2 -0.4 - - 0.51 6 0 18white beans yes 3.2 -0.1 -0.2 -5.3 - 0.83 8 1 71white cabbage yes 7 0.6 -0.3 -3.1 -5 0.93 14 1 89Molybdenum no workable field data availableNickelpotatoes no -1.7 -0.0. - 2.9 - 0.38 7 0 7lettuce no -1.1 0.7 - - - 0.17 6 0 -4white beans no 6.1 -4.0 - - - 0.80 4 0 70white cabbage yes -2.7 3.3 - -5 - 0.81 7 1 71tomato no -2.5 1.7 - - - 0.26 6 0 8carrot yes -5.9 4.2 - - - 0.70 6 1 63Zincpotatoes yes 3.0 0.33 -0.04 0.5 -2.1 0.96 12 1 94white beans no 2.2 0.19 -0.13 0.3 - 0.10 13 0 29tomato no 3 5 1.2 - - 0.19 6 0 -36lettuce no 2.0 0.9 -0.3 - - 0.11 6 0 -48white cabbage no 1.1 0.1 0.02 0 - 0.29 7 0 -39carrot no 1.9 0.2 -0.1 - - 0.08 6 0 -54
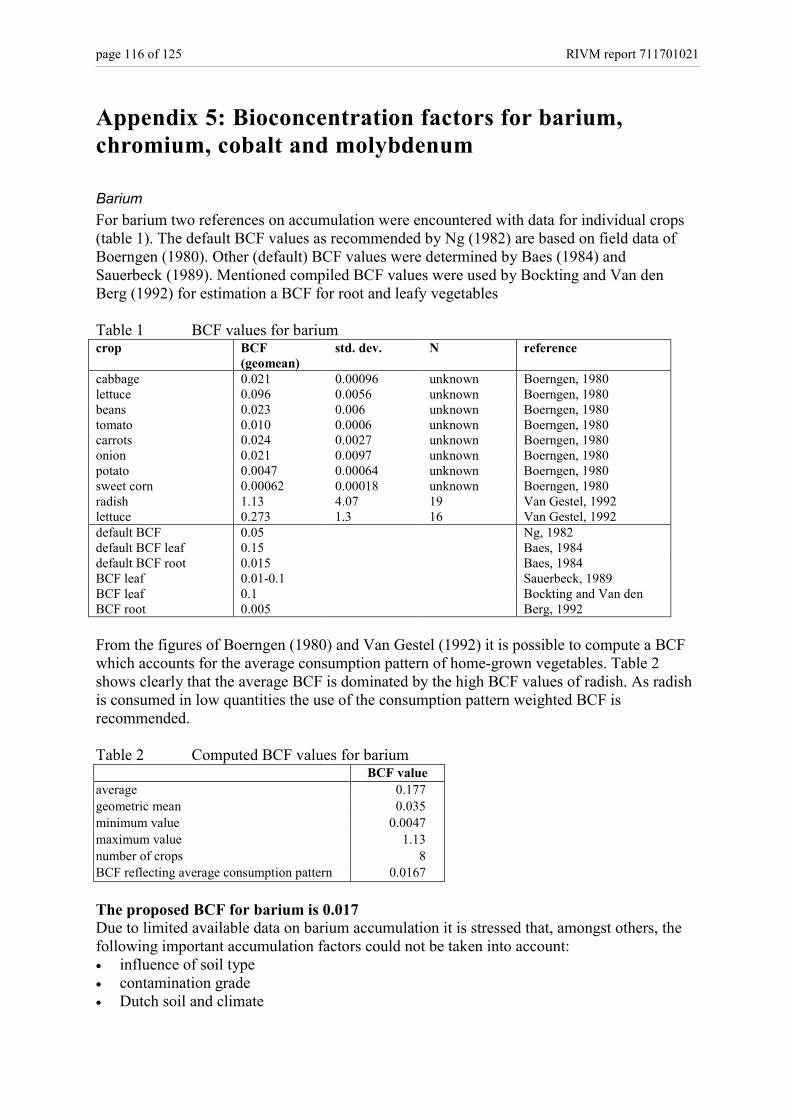
page 116 of 125 RIVM report 711701021
Appendix 5: Bioconcentration factors for barium,chromium, cobalt and molybdenum
BariumFor barium two references on accumulation were encountered with data for individual crops(table 1). The default BCF values as recommended by Ng (1982) are based on field data ofBoerngen (1980). Other (default) BCF values were determined by Baes (1984) andSauerbeck (1989). Mentioned compiled BCF values were used by Bockting and Van denBerg (1992) for estimation a BCF for root and leafy vegetables
Table 1 BCF values for bariumcrop BCF
(geomean)std. dev. N reference
cabbage 0.021 0.00096 unknown Boerngen, 1980lettuce 0.096 0.0056 unknown Boerngen, 1980beans 0.023 0.006 unknown Boerngen, 1980tomato 0.010 0.0006 unknown Boerngen, 1980carrots 0.024 0.0027 unknown Boerngen, 1980onion 0.021 0.0097 unknown Boerngen, 1980potato 0.0047 0.00064 unknown Boerngen, 1980sweet corn 0.00062 0.00018 unknown Boerngen, 1980radish 1.13 4.07 19 Van Gestel, 1992lettuce 0.273 1.3 16 Van Gestel, 1992default BCF 0.05 Ng, 1982default BCF leaf 0.15 Baes, 1984default BCF root 0.015 Baes, 1984BCF leaf 0.01-0.1 Sauerbeck, 1989BCF leafBCF root
0.10.005
Bockting and Van denBerg, 1992
From the figures of Boerngen (1980) and Van Gestel (1992) it is possible to compute a BCFwhich accounts for the average consumption pattern of home-grown vegetables. Table 2shows clearly that the average BCF is dominated by the high BCF values of radish. As radishis consumed in low quantities the use of the consumption pattern weighted BCF isrecommended.
Table 2 Computed BCF values for bariumBCF value
average 0.177geometric mean 0.035minimum value 0.0047maximum value 1.13number of crops 8BCF reflecting average consumption pattern 0.0167
The proposed BCF for barium is 0.017Due to limited available data on barium accumulation it is stressed that, amongst others, thefollowing important accumulation factors could not be taken into account:• influence of soil type• contamination grade• Dutch soil and climate

RIVM report 711701021 page 117 of 125
ChromiumBCF data for chromium was retrieved by Versluijs et al. (in prep.). Table 3 gives an overviewof the used references for the computation of a generic BCF values for potential riskassessment
Table 3 Overview of BCF values for chromiumcrop BCF
(geometric mean)Standarddeviation
reference(see Versluijs et al., in prep.)
radish 0.184 Van Gestel, 1992lettuce 0.308 1.058 Van Gestel, 1992pea 0.003 Sauerbeck, 1991carrot 0.006 Sauerbeck, 1991leak 0.007 Sauerbeck, 1991spinach 0.013 0.025 Sauerbeck, 1991sellery 0.014 Sauerbeck, 1991lettuce 0.018 Sauerbeck, 1991field lettuce 0.021 0.002 Sauerbeck, 1991radish 0.044 0.006 Sauerbeck, 1991spinach 0.0002 Smilde, 1981lettuce 0.010 0.069 Smilde, 1981
An average consumption weigthed BCF of 0.011 is proposed.The proposed BCF is comparable with other published BCF values for chromium.
CobaltTable 4 gives details of the computation of a BCF for potential risk assessment. Data wasretrieved from different sources by Versluijs et al. (in prep.). The table shows the differentpossibilities (selection criteria) for selection of an appropriate BCF.
Table 4 BCF values for cobaltselection criteria number of
data (N)BCF
(geomean)standard dev. Co soil content.
(mg/kg d.m.)1. non 128 0.062 7.21
2. field data only 105 0.055 7.95
3. home-grown cropsonly
26 0.58 15.3
4. contaminated sitesonly
74 0.026 0.063 min 91max 3865geomean 484
5. combination ofcriteria 2 and 3
18 0.77 17.9 **) min 0.1max 11.7geomean 0.9
6. individual crops• lettuce• potato• radish• carrot• tomato
73611
8.750.0660.2900.1800.070
24.20.0450.516
--
page 118 of 125 RIVM report 711701021
The selection on crops results in a dataset dominated by BCF data of Van Gestel for lettuce.The data of Van Gestel was obtained on non contaminated soil and the BCF for lettuce wasdetermined on 8.75. Compared with other crops this BCF seems high.To prevail domination of a single crop a consumption average weigthed BCF was computed.
It is proposed to use the average consumption pattern weighted BCF. This wasdetermined on 0.58 and equal to the geometric mean of data on home-grown crops only.
MolybdenumNo new suitable data on molybdenum accumulation was found. Thus only the referencesused by Bockting and Van den Berg (1992) were reviewed and evaluated.Bockting and Van den Berg (1992) based the BCF on data of Ng (1982) and Baes (1984).The given values of Ng (1982) and Baes (1984) were both based on data sources from(public) literature and (statistical) analysis and interpretation of the retrieved data. Baesstresses that acceptance or rejection of data on metal accumulation in plants was subjectivedepending on a variety of considerations.Given above considerations and the fact that no additional data on molybdenum accumulationwas found it is proposed to maintain the current CSOIL BCF values.
Integrating the current seperate BCF values for root (0.015) and leafy crops (0.3) to onegeneric BCF a value of 0.12 is determined.
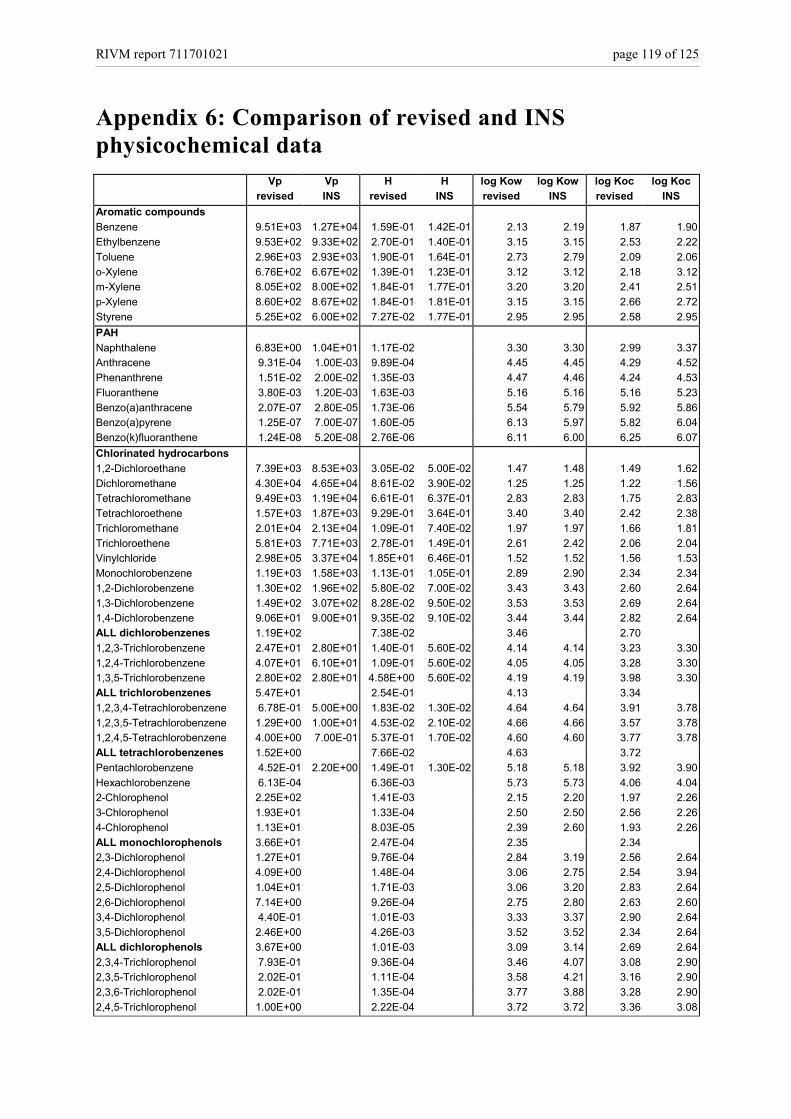
RIVM report 711701021 page 119 of 125
Appendix 6: Comparison of revised and INSphysicochemical data
Vp Vp H H log Kow log Kow log Koc log Kocrevised INS revised INS revised INS revised INS
Aromatic compoundsBenzene 9.51E+03 1.27E+04 1.59E-01 1.42E-01 2.13 2.19 1.87 1.90Ethylbenzene 9.53E+02 9.33E+02 2.70E-01 1.40E-01 3.15 3.15 2.53 2.22Toluene 2.96E+03 2.93E+03 1.90E-01 1.64E-01 2.73 2.79 2.09 2.06o-Xylene 6.76E+02 6.67E+02 1.39E-01 1.23E-01 3.12 3.12 2.18 3.12m-Xylene 8.05E+02 8.00E+02 1.84E-01 1.77E-01 3.20 3.20 2.41 2.51p-Xylene 8.60E+02 8.67E+02 1.84E-01 1.81E-01 3.15 3.15 2.66 2.72Styrene 5.25E+02 6.00E+02 7.27E-02 1.77E-01 2.95 2.95 2.58 2.95PAHNaphthalene 6.83E+00 1.04E+01 1.17E-02 3.30 3.30 2.99 3.37Anthracene 9.31E-04 1.00E-03 9.89E-04 4.45 4.45 4.29 4.52Phenanthrene 1.51E-02 2.00E-02 1.35E-03 4.47 4.46 4.24 4.53Fluoranthene 3.80E-03 1.20E-03 1.63E-03 5.16 5.16 5.16 5.23Benzo(a)anthracene 2.07E-07 2.80E-05 1.73E-06 5.54 5.79 5.92 5.86Benzo(a)pyrene 1.25E-07 7.00E-07 1.60E-05 6.13 5.97 5.82 6.04Benzo(k)fluoranthene 1.24E-08 5.20E-08 2.76E-06 6.11 6.00 6.25 6.07Chlorinated hydrocarbons1,2-Dichloroethane 7.39E+03 8.53E+03 3.05E-02 5.00E-02 1.47 1.48 1.49 1.62Dichloromethane 4.30E+04 4.65E+04 8.61E-02 3.90E-02 1.25 1.25 1.22 1.56Tetrachloromethane 9.49E+03 1.19E+04 6.61E-01 6.37E-01 2.83 2.83 1.75 2.83Tetrachloroethene 1.57E+03 1.87E+03 9.29E-01 3.64E-01 3.40 3.40 2.42 2.38Trichloromethane 2.01E+04 2.13E+04 1.09E-01 7.40E-02 1.97 1.97 1.66 1.81Trichloroethene 5.81E+03 7.71E+03 2.78E-01 1.49E-01 2.61 2.42 2.06 2.04Vinylchloride 2.98E+05 3.37E+04 1.85E+01 6.46E-01 1.52 1.52 1.56 1.53Monochlorobenzene 1.19E+03 1.58E+03 1.13E-01 1.05E-01 2.89 2.90 2.34 2.341,2-Dichlorobenzene 1.30E+02 1.96E+02 5.80E-02 7.00E-02 3.43 3.43 2.60 2.641,3-Dichlorobenzene 1.49E+02 3.07E+02 8.28E-02 9.50E-02 3.53 3.53 2.69 2.641,4-Dichlorobenzene 9.06E+01 9.00E+01 9.35E-02 9.10E-02 3.44 3.44 2.82 2.64ALL dichlorobenzenes 1.19E+02 7.38E-02 3.46 2.701,2,3-Trichlorobenzene 2.47E+01 2.80E+01 1.40E-01 5.60E-02 4.14 4.14 3.23 3.301,2,4-Trichlorobenzene 4.07E+01 6.10E+01 1.09E-01 5.60E-02 4.05 4.05 3.28 3.301,3,5-Trichlorobenzene 2.80E+02 2.80E+01 4.58E+00 5.60E-02 4.19 4.19 3.98 3.30ALL trichlorobenzenes 5.47E+01 2.54E-01 4.13 3.341,2,3,4-Tetrachlorobenzene 6.78E-01 5.00E+00 1.83E-02 1.30E-02 4.64 4.64 3.91 3.781,2,3,5-Tetrachlorobenzene 1.29E+00 1.00E+01 4.53E-02 2.10E-02 4.66 4.66 3.57 3.781,2,4,5-Tetrachlorobenzene 4.00E+00 7.00E-01 5.37E-01 1.70E-02 4.60 4.60 3.77 3.78ALL tetrachlorobenzenes 1.52E+00 7.66E-02 4.63 3.72Pentachlorobenzene 4.52E-01 2.20E+00 1.49E-01 1.30E-02 5.18 5.18 3.92 3.90Hexachlorobenzene 6.13E-04 6.36E-03 5.73 5.73 4.06 4.042-Chlorophenol 2.25E+02 1.41E-03 2.15 2.20 1.97 2.263-Chlorophenol 1.93E+01 1.33E-04 2.50 2.50 2.56 2.264-Chlorophenol 1.13E+01 8.03E-05 2.39 2.60 1.93 2.26ALL monochlorophenols 3.66E+01 2.47E-04 2.35 2.342,3-Dichlorophenol 1.27E+01 9.76E-04 2.84 3.19 2.56 2.642,4-Dichlorophenol 4.09E+00 1.48E-04 3.06 2.75 2.54 3.942,5-Dichlorophenol 1.04E+01 1.71E-03 3.06 3.20 2.83 2.642,6-Dichlorophenol 7.14E+00 9.26E-04 2.75 2.80 2.63 2.603,4-Dichlorophenol 4.40E-01 1.01E-03 3.33 3.37 2.90 2.643,5-Dichlorophenol 2.46E+00 4.26E-03 3.52 3.52 2.34 2.64ALL dichlorophenols 3.67E+00 1.01E-03 3.09 3.14 2.69 2.642,3,4-Trichlorophenol 7.93E-01 9.36E-04 3.46 4.07 3.08 2.902,3,5-Trichlorophenol 2.02E-01 1.11E-04 3.58 4.21 3.16 2.902,3,6-Trichlorophenol 2.02E-01 1.35E-04 3.77 3.88 3.28 2.902,4,5-Trichlorophenol 1.00E+00 2.22E-04 3.72 3.72 3.36 3.08
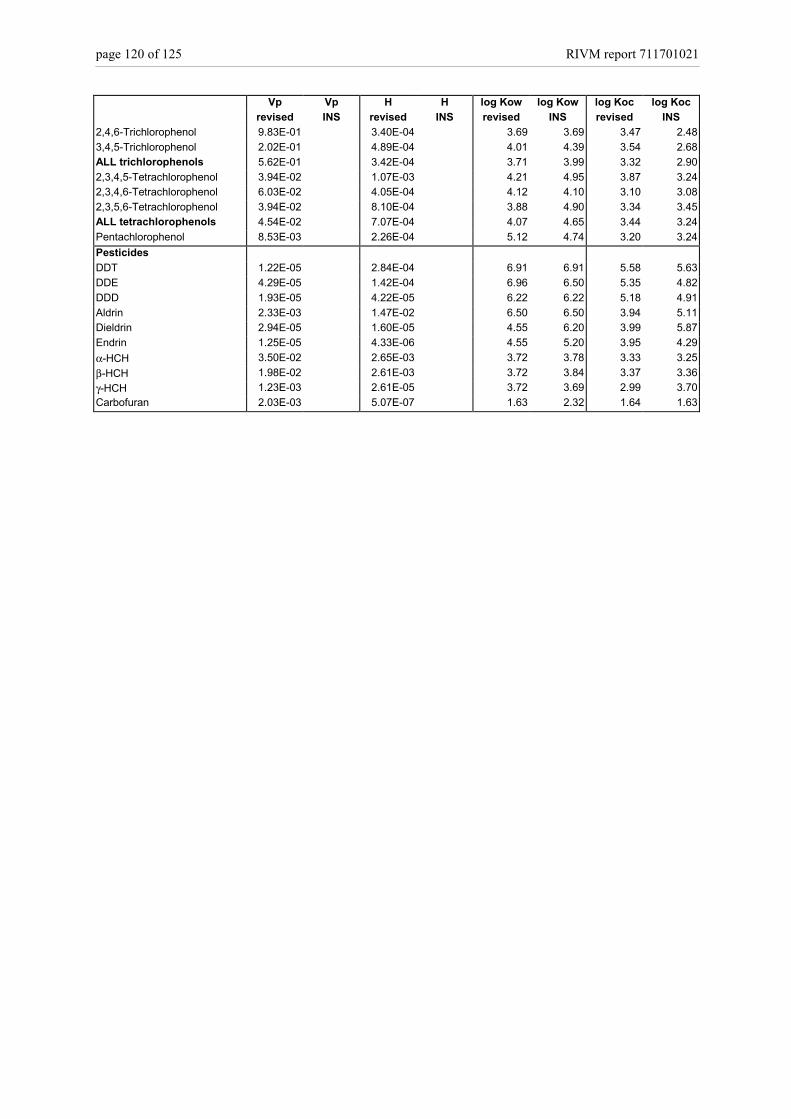
page 120 of 125 RIVM report 711701021
Vp Vp H H log Kow log Kow log Koc log Kocrevised INS revised INS revised INS revised INS
2,4,6-Trichlorophenol 9.83E-01 3.40E-04 3.69 3.69 3.47 2.483,4,5-Trichlorophenol 2.02E-01 4.89E-04 4.01 4.39 3.54 2.68ALL trichlorophenols 5.62E-01 3.42E-04 3.71 3.99 3.32 2.902,3,4,5-Tetrachlorophenol 3.94E-02 1.07E-03 4.21 4.95 3.87 3.242,3,4,6-Tetrachlorophenol 6.03E-02 4.05E-04 4.12 4.10 3.10 3.082,3,5,6-Tetrachlorophenol 3.94E-02 8.10E-04 3.88 4.90 3.34 3.45ALL tetrachlorophenols 4.54E-02 7.07E-04 4.07 4.65 3.44 3.24Pentachlorophenol 8.53E-03 2.26E-04 5.12 4.74 3.20 3.24PesticidesDDT 1.22E-05 2.84E-04 6.91 6.91 5.58 5.63DDE 4.29E-05 1.42E-04 6.96 6.50 5.35 4.82DDD 1.93E-05 4.22E-05 6.22 6.22 5.18 4.91Aldrin 2.33E-03 1.47E-02 6.50 6.50 3.94 5.11Dieldrin 2.94E-05 1.60E-05 4.55 6.20 3.99 5.87Endrin 1.25E-05 4.33E-06 4.55 5.20 3.95 4.29α-HCH 3.50E-02 2.65E-03 3.72 3.78 3.33 3.25β-HCH 1.98E-02 2.61E-03 3.72 3.84 3.37 3.36γ-HCH 1.23E-03 2.61E-05 3.72 3.69 2.99 3.70Carbofuran 2.03E-03 5.07E-07 1.63 2.32 1.64 1.63

RIVM report 711701021 page 121 of 125
Appendix 7: Revised CSOIL 2000 dataset
Physicochemical dataCASnr. M Kp BCF
[g/mol] [dm3/kg] [kg/kg]Metals and trace elementsarsenic 7440-38-2 74.9 1800 0.009barium 7440-39-3 137.3 2500 0.017cadmium 7440-43-9 112.4 2560 0.310chromium (III) 7440-47-3 52.0 4800 0.011chromium (VI) 18450-29-9 52.0 4800 0.011cobalt 7440-48-4 58.9 120 0.580copper 7440-50-8 63.5 2120 0.200mercury 7439-97-6 200.6 7500 0.150lead 7439-92-1 207.2 36000 0.017molybdenum 7439-98-7 95.9 40 0.120nickel 7440-02-0 58.7 2000 0.028zinc 7440-66-6 65.4 2600 0.180
CASnr. M S Vp log Kow log Koc pKa Dpe[g/mol] [mg/dm3] [Pa] [-] [dm3/kg] [-] [m2 per
day]Aromatic compoundsBenzene 71-43-2 78.1 1.99E+03 9.51E+03 2.13 1.87 1.40E-06Ethylbenzene 100-41-4 106.2 1.59E+02 9.53E+02 3.15 2.53 2.10E-06Phenol 108-95-2 94.1 6.56E+04 3.29E+01 1.47 1.52 10.00 8.40E-09o-Cresol 95-48-7 108.1 1.49E+04 2.35E+01 1.95 1.59 10.20 1.00E-06m-Cresol 108-39-4 108.1 6.32E+03 1.14E+01 1.96 1.72 10.00 1.00E-06p-Cresol 106-44-5 108.1 2.86E+04 1.88E+01 1.94 1.64 10.10 1.00E-06Toluene 108-88-3 92.1 6.11E+02 2.96E+03 2.73 2.09 1.20E-06o-Xylene 95-47-6 106.2 2.19E+02 6.76E+02 3.12 2.18 1.60E-06p-Xylene 106-42-3 106.2 2.11E+02 8.60E+02 3.15 2.66 1.60E-06m-Xylene 108-38-3 106.2 1.97E+02 8.05E+02 3.20 2.41 1.60E-06Catechol 120-80-9 110.1 1.24E+05 3.39E+00 0.88 1.85 10.60 1.00E-07Resorcinol 108-46-3 110.1 2.42E+05 8.03E-01 0.80 1.14 9.70 1.00E-07Hydroquinone 123-31-9 110.1 3.92E+04 3.86E-02 0.59 1.95 10.60 1.00E-07Styrene 100-42-5 104.1 3.20E+02 5.25E+02 2.95 2.58 2.00E-06Polyciclic aromatichydrocarbonsNaphthalene 91-20-3 128.2 3.18E+01 6.83E+00 3.30 2.98 5.00E-07Anthracene 120-12-7 178.2 7.13E-02 9.31E-04 4.45 4.30 5.00E-07Phenanthrene 85-01-8 178.2 8.50E-01 1.51E-02 4.47 4.23 5.00E-07Fluoranthene 206-44-0 202.4 2.01E-01 3.80E-03 5.16 5.18 2.00E-07Benzo(a)anthracene 56-55-3 228.3 1.16E-02 2.07E-07 5.54 5.79 2.00E-07Chrysene 218-01-9 228.3 1.79E-03 8.74E-08 5.81 5.72 2.00E-07Benzo(a)pyrene 50-32-8 252.3 8.42E-04 1.25E-07 6.13 5.82 2.00E-07Benzo(ghi)perylene 191-24-2 276.3 1.86E-04 5.04E-09 6.22 6.43 2.00E-07Benzo(k)fluoranthene 207-06-9 252.3 4.84E-04 1.24E-08 6.11 6.24 2.00E-07Indeno, 1,2,3-cd pyrene 193-39-5 276.3 2.65E-04 2.65E-09 6.87 6.02 2.00E-07Pyrene 129-00-0 202.3 1.06E-01 9.20E-05 4.99 4.83 2.00E-07Acenaphthene 83-32-9 154.2 2.57E+00 4.22E-01 3.92 3.53 5.00E-07Acenaphthylene 208-96-8 152.2 4.01E+00 1.79E-01 3.94 3.47 5.00E-07Benzo(b)fluoranthene 205-99-2 252.3 1.68E-02 1.82E-06 5.78 5.34 5.00E-07Benzo(j)fluoranthene 205-82-3 252.3 8.81E-03 1.82E-06 6.11 5.48 5.00E-07Dibenz(a,h)anthracene 53-70-3 278.4 8.28E-04 2.67E-07 7.11 6.14 5.00E-079H-Fluorene 86-73-7 166.2 1.32E+00 1.16E-01 4.18 3.77 5.00E-07

page 122 of 125 RIVM report 711701021
CASnr. M S Vp log Kow log Koc pKa Dpe[g/mol] [mg/dm3] [Pa] [-] [dm3/kg] [-] [m2 per
day]Chlorinated hydrocarbons1,2-Dichloroethane 107-06-2 99.0 1.02E+04 7.39E+03 1.47 1.49 3.00E-07Dichloromethane 75-09-2 84.9 1.80E+04 4.30E+04 1.25 1.22 5.00E-07Tetrachloromethane 56-23-5 153.7 9.38E+02 9.49E+03 2.83 1.75 8.00E-07Tetrachloroethene 127-18-4 165.8 1.19E+02 1.57E+03 3.40 2.42 8.00E-07Trichloromethane 67-66-3 119.4 9.39E+03 2.01E+04 1.97 1.66 1.00E-06Trichloroethene 79-01-6 131.4 1.16E+03 5.81E+03 2.61 2.06 1.60E-06Vinylchloride 75-01-4 62.5 4.28E+02 2.98E+05 1.52 1.56 1.00E-06ChlorobenzenesMonochlorobenzene 108-90-7 112.6 5.07E+02 1.19E+03 2.89 2.34 3.50E-061,2-Dichlorobenzene 95-50-1 147.0 1.40E+02 1.30E+02 3.43 2.60 2.00E-061,3-Dichlorobenzene 541-73-1 147.0 1.13E+02 1.49E+02 3.53 2.69 2.00E-061,4-Dichlorobenzene 106-46-7 147.0 6.05E+01 9.06E+01 3.44 2.82 2.00E-061,2,3-Trichlorobenzene 87-61-6 181.4 1.36E+01 2.47E+01 4.14 3.23 1.00E-061,2,4-Trichlorobenzene 120-82-1 181.4 2.88E+01 4.07E+01 4.05 3.28 1.00E-061,3,5-Trichlorobenzene 108-70-3 181.4 4.71E+00 2.80E+02 4.19 3.98 1.00E-061,2,3,4-Tetrachlorobenzene 634-66-2 215.9 3.40E+00 6.78E-01 4.64 3.91 1.00E-061,2,3,5-Tetrachlorobenzene 634-90-2 215.9 2.61E+00 1.29E+00 4.66 3.57 1.00E-061,2,4,5-Tetrachlorobenzene 95-94-3 215.9 6.82E-01 4.00E+00 4.60 3.77 1.00E-06Pentachlorobenzene 608-93-5 250.1 3.23E-01 4.52E-01 5.18 3.92 1.00E-06Hexachlorobenzene 118-74-1 284.8 1.17E-02 6.13E-04 5.73 4.06 1.00E-06Chlorophenols2-Chlorophenol 95-57-8 128.6 8.71E+03 2.25E+02 2.15 1.97 8.43 5.00E-093-Chlorophenol 108-43-0 128.6 7.97E+03 1.93E+01 2.50 2.56 9.06 5.00E-094-Chlorophenol 106-48-9 128.6 7.67E+03 1.13E+01 2.39 1.93 9.23 5.00E-092,3-Dichlorophenol 576-24-9 163.0 9.05E+02 1.27E+01 2.84 2.56 7.66 1.00E-072,4-Dichlorophenol 120-83-2 163.0 1.91E+03 4.09E+00 3.06 2.54 7.81 1.00E-072,5-Dichlorophenol 583-78-8 163.0 4.21E+02 1.04E+01 3.06 2.83 7.54 1.00E-072,6-Dichlorophenol 87-65-0 163.0 5.34E+02 7.14E+00 2.75 2.63 6.84 1.00E-073,4-Dichlorophenol 95-77-2 163.0 3.02E+01 4.40E-01 3.33 2.90 8.60 1.00E-073,5-Dichlorophenol 591-35-5 163.0 3.99E+01 2.46E+00 3.52 2.34 8.17 1.00E-072,3,4-Trichlorophenol 15950-66-0 197.5 7.11E+01 7.93E-01 3.46 3.08 7.01 5.00E-072,3,5-Trichlorophenol 933-78-8 197.5 1.26E+02 2.02E-01 3.58 3.16 5.00E-072,3,6-Trichlorophenol 933-75-5 197.4 1.26E+02 2.02E-01 3.77 3.28 5.95 5.00E-072,4,5-Trichlorophenol 95-95-4 197.5 3.80E+02 1.00E+00 3.72 3.36 7.07 5.00E-072,4,6-Trichlorophenol 88-06-2 197.5 2.43E+02 9.83E-01 3.69 3.47 6.22 5.00E-073,4,5-Trichlorophenol 609-19-8 197.5 3.46E+01 2.02E-01 4.01 3.54 7.46 5.00E-072,3,4,5-Tetrachlorophenol 4901-51-3 231.9 3.61E+00 3.94E-02 4.21 3.87 6.07 1.00E-062,3,4,6-Tetrachlorophenol 58-90-2 231.9 1.47E+01 6.03E-02 4.12 3.10 5.29 1.00E-062,3,5,6-Tetrachlorophenol 935-95-5 231.9 4.79E+00 3.94E-02 3.88 3.34 5.21 1.00E-06Pentachlorophenol 87-86-5 266.3 4.28E+00 8.53E-03 5.12 3.20 4.85 2.24E-06Chloronaphthalenes1-Chloronaphatalene 90-13-1 162.6 1.68E+01 4.25E+00 4.10 3.42 5.00E-072-Chloronaphatalene 91-58-7 162.6 9.71E+00 1.00E+00 4.14 3.42 5.00E-07PolychlorobiphenylsPCB 28 7012-37-5 257.5 1.21E-01 1.60E-02 5.62 4.61 2.00E-07PCB 52 35693-99-3 292.0 2.65E-02 6.07E-03 6.26 4.70 2.00E-07PCB101 37680-72-3 326.4 1.32E-02 9.27E-03 6.85 5.53 2.00E-07PCB118 31508-00-6 326.4 6.54E-03 2.96E-04 7.12 6.35 2.00E-07PCB138 35065-28-2 360.9 6.96E-04 4.30E-06 7.45 5.71 5.00E-07PCB153 35065-27-1 360.9 2.74E-03 1.75E-04 7.44 5.87 5.00E-07PCB180 35065-29-3 395.3 7.69E-04 4.96E-05 8.16 5.99 5.00E-07Dioxins (+PCDF and PCB)2,3,7,8-TCDD 1746-01-6 322.0 3.00E-04 1.40E-06 6.80 5.61 1.00E-07PCDD 36088-22-9 356.0 1.20E-04 8.88E-08 7.40 6.09 1.00E-07HxCDD 34465-46-8 391.0 4.40E-06 5.08E-08 7.80 6.42 1.00E-07HpCDD 37871-00-4 425.0 2.40E-06 7.51E-10 8.00 6.58 1.00E-07OCDD 3268-87-9 460.0 4.00E-07 5.93E-10 8.20 6.74 1.00E-07

RIVM report 711701021 page 123 of 125
CASnr. M S Vp log Kow log Koc pKa Dpe[g/mol] [mg/dm3] [Pa] [-] [dm3/kg] [-] [m2 per
day]PCB 77 32598-13-3 292.0 1.91E-03 5.09E-05 6.63 5.85 2.00E-07PCB 105 32598-14-4 326.4 7.15E-03 1.55E-04 6.98 6.13 2.00E-07PCB 126 57465-28-8 326.4 7.00E-03 1.55E-04 7.23 5.94 2.00E-07PCB 156 38380-08-4 360.9 1.22E-03 4.05E-05 7.70 6.34 5.00E-07PCB 157 69782-09-7 360.9 1.22E-03 4.05E-05 7.60 6.26 5.00E-07PCB 169 32774-16-6 360.9 5.58E-04 1.26E-06 7.41 6.01 5.00E-07TetraCDF 51207-31-9 306.0 4.13E-04 7.89E-06 6.53 5.39 1.00E-07PentaCDF - 340.4 2.36E-04 2.17E-05 6.85 5.65 1.00E-07HexaCDF - 374.9 8.25E-06 8.09E-06 7.81 6.42 1.00E-07HeptaCDF - 409.3 1.35E-06 1.55E-06 7.92 6.52 1.00E-07OctaCDF 39001-02-0 443.8 2.15E-07 2.91E-08 8.28 6.80 1.00E-07PesticidesDDT 50-29-3 354.5 6.48E-03 1.22E-05 6.91 5.58 5.00E-07DDE 72-55-9 318.0 4.09E-02 4.29E-05 6.96 5.35 5.00E-07DDD 72-54-8 320.0 6.23E-02 1.93E-05 6.22 5.18 5.00E-07Aldrin 309-00-2 365.1 2.46E-02 2.33E-03 6.50 3.94 5.00E-07Dieldrin 60-57-1 380.9 2.99E-01 2.94E-05 4.55 3.99 5.00E-07Endrin 72-20-8 380.9 4.66E-01 1.25E-05 4.55 3.95 5.00E-07α-HCH 319-84-6 290.8 1.63E+00 3.50E-02 3.72 3.33 5.00E-07β-HCH 319-85-7 290.8 9.38E-01 1.98E-02 3.72 3.37 5.00E-07γ-HCH 58-89-9 290.8 5.81E+00 1.23E-03 3.72 2.99 5.00E-07δ-HCH 319-86-8 290.8 1.01E+01 3.06E-02 3.72 3.14 5.00E-07Carbaryl 63-25-2 201.2 8.16E+01 1.43E-01 2.36 2.27 2.00E-07Carbofuran 1563-66-2 221.3 3.76E+02 2.03E-03 1.63 1.64 2.00E-07Maneb 12427-38-2 265.3 8.50E-05 2.08E-06 8.00 8.00 2.00E-07Atrazine 1912-24-9 215.7 3.81E+01 2.70E-05 2.61 2.20 2.00E-07Mineral oilaliphatic >EC5-EC6 - 81.0 2.80E+01 5.07E+04 3.52 2.90 4.00E-06aliphatic >EC6-EC8 - 100.0 4.20E+00 8.61E+03 3.60 3.60 4.00E-06aliphatic >EC8-EC10 - 130.0 3.25E-01 8.21E+02 3.69 4.50 4.00E-06aliphatic >EC10-EC12 - 160.0 2.61E-02 7.90E+01 3.76 5.40 4.00E-06aliphatic >EC12-EC16 - 200.0 5.90E-04 3.55E+00 3.85 6.70 4.00E-06aliphatic >EC16-EC21 - 270.0 9.99E-07 1.72E-01 3.97 9.00 4.00E-06aromatic >EC5-EC7 - 78.0 2.20E+02 1.11E+04 3.53 3.00 1.40E-06aromatic >EC7-EC8 - 92.0 1.30E+02 3.24E+03 3.54 3.10 1.40E-06aromatic >EC8-EC10 - 120.0 6.50E+01 8.21E+02 3.55 3.20 1.40E-06aromatic >EC10-EC12 - 130.0 2.48E+01 7.90E+01 3.58 3.40 1.40E-06aromatic >EC12-EC16 - 150.0 5.81E+00 3.55E+00 3.61 3.70 1.40E-06aromatic >EC16-EC21 - 190.0 5.43E-01 1.72E-01 3.66 4.20 1.40E-06aromatic >EC21-EC35 - 240.0 6.60E-03 8.00E-04 3.74 5.10 1.40E-06PhthalatesDimethyl phthalate (DMP) 131-11-3 194.2 2.01E+03 3.87E+00 1.56 2.25 2.00E-06Diethyl phthalate (DEP) 84-66-2 222.2 2.87E+02 6.68E-01 2.47 2.64 2.00E-06Diisobutylphthalate (DIBP) 84-69-5 278.4 9.60E+00 1.37E-02 4.46 3.24 2.00E-06Dibuthyl phthalate (DBP) 84-74-2 278.4 2.35E+00 3.40E-02 4.72 2.98 2.00E-06Butylbenzylphthalate (BBP) 85-68-7 312.4 4.22E+00 6.53E-04 4.91 3.91 2.00E-06Dihexyl phthalate (DHP) 84-75-3 334.5 1.15E-02 1.61E-03 6.85 4.65 2.00E-06Di(2-ethylhexyl)phthalate (DEHP) 117-81-7 390.6 4.57E-02 2.72E-04 7.45 5.37 2.00E-06OthersCyclohexanone 108-94-1 98.1 1.90E+04 4.90E+02 0.81 0.99 1.00E-07Pyridine 110-86-1 79.1 6.65E+05 2.02E+03 0.65 1.93 2.00E-06Tetrahydrofuran 109-99-9 72.1 4.06E+05 1.47E+04 0.47 0.47 2.00E-06Tetrahydrothiophene 110-01-0 88.2 1.29E+04 2.05E+03 1.61 1.40 2.00E-06

page 124 of 125 RIVM report 711701021
Soil, site and exposure parameters (‘residential with garden’)Values in ‘bold’ are revised.parameters code unit value (2000)
Soil parameterssoil temperature T [K] 283
volume fraction air Va [-] 0.2
volume fraction water Vw [-] 0.3volume fraction soil Vs [-] 0.5fraction organic carbon foc [-] 0.058*1
percentage clay L [%] 25*1
dry bulk density SD [kg/dm3] 1.2pH pH [-] 6*1
Constants and site parametersgas constant R [Pa.m3/mol.K] 8.3144
viscosity of air ETA [Pa.h) 5 E-09mean depth of contamination dp [m] 1.25
air permeability of soil KAPPA [m] 1 E-11air-exchange rate Vv [1/h] 1.1height of crawl space Bh [m] 0.5
depth of groundwater table dg [m] 1.75height of the capillary transition boundary z [m] 0.5air pressure difference crawl space and room DELTAPCS [Pa] 1contribution of the crawl space air to indoor air fbi [-] 0.1
diameter contaminated area Lp [m] 100
fraction dry matter root crops fdwr [-] 0.167fraction dry matter leafy crops fdws [-] 0.098deposition constant dpconst [-] 0.01fraction soil in dust inside frsi [-] 0.8
fraction soil in dust outside frso [-] 0.5
temperature bath water Tsh [K] 313
drinking water constant dwconst [-] 45.6
Exposure parametersfraction exposed skin showering fexp [-] 0.4
retention factor soil particles in lungs fr [-] 0.75
relative sorption factor Fa [-] 1
relative sorption factor soil ingestion Fag [-] 1 *2
matrix factor dermal uptake fm [-] 0.15
showering period tdc [h per day] 0.25
bathing period td [h] 0.5
fraction contaminated root crops Fvk [-] 0.1
fraction contaminated leafy crops Fvb [-] 0.1

RIVM report 711701021 page 125 of 125
continuedcode unit children adults
Exposure parameters value (2000) value (2000)
body weight BWc,a [kg] 15 70
daily intake soil AIDc,a [kg per day] 1.00E-04 5.00E-05
consumption of root crops Qk'c,a [kg fw per day] 0.0595 0.1220consumption of leafy crops Qb'c,a [kg fw per day] 0.0583 0.1390consumption of drinking water Qdw,c,a [dm3 per day] 1 2
dermal sorption coefficient DACc,a [kg per day] 6.43E-06 5.92E-06
inhalation of soil particles ITSPc,a [kg per day] 3.13E-07 8.33E-07
inhalation period indoors Tiic,a [h] 21.14 22.86
inhalation period outdoors Tioc,a [h] 2.86 1.14
air volume Avc,a [m3/h] 0.32 0.83
body surface Atotc,a [m2] 0.95 1.8
exposed surface skin indoors Aexpc,a i [m2] 0.05 0.09
exposed surface skin outdoors Aexpc,a o [m2] 0.28 0.17
degree of coverage skin indoors DAEc,a i [kg/m2] 5.6E-04 5.6E-04
degree of coverage outdoors DAEc,a o [kg/m2] 5.1E-03 3.8E-02
dermal absorption velocity DARc,a [1/h] 0.01 0.005
period exposure through contact soil indoors Tbci,a [h per day] 9.14 14.86
period exposure through contact soil outdoors Tbco,a [h per day] 2.86 1.14
dillution velocity Vfc,a [m/h] 161.3 324.6
*1 These values differ from the recommended values (see Lijzen et al., 2001).*2 Only for lead enough data are available to provisionally lower this Relative Absorption Factor to 0.6 (Lijzenet al., 2001)